total internal reflection/fluorescence photobleaching
TRANSCRIPT
TOTAL INTERNAL REFLECTION/FLUORESCENCE
PHOTOBLEACHING RECOVERY STUDY OF SERUM
ALBUMIN ADSORPTION DYNAMICS
THOMAS P. BURGHARDT AND DANIEL AXELROD, Biophysics Research Division, andDepartment ofPhysics, University ofMichigan, Ann Arbor, Michigan 48109U.S.A.
ABSTRACr The total internal reflection/fluorescence photobleaching recovery (TIR/FPR)technique (Thompson et al. 1981. Biophys. J. 33:435) is used to study adsorbed bovine serumalbumin dynamics at a quartz glass/aqueous buffer interface. Adsorbed fluorescent labeledprotein is bleached by a brief flash of the evanescent wave of a focused totally internallyreflected laser beam. The rates of adsorption/desorption and surface diffusion determine thesubsequent fluorescence recovery. The protein surface concentration is low enough to beproportional to the observed fluorescence and high enough to insure that the observed recoveryrates arise mainly from adsorbed rather than bulk protein dynamics. The photobleachingrecovery curves for rhodamine-labeled bovine serum albumin reveal both an irreversibly boundstate and a multiplicity of reversibly bound states. The relative amount of reversible toirreversible adsorption increases with increasing bulk protein concentration. Since theadsorbed protein concentration appears to be too high to pack into a homogeneous surfacemonolayer, the wide range of desorption rates possibly results from multiple layers of proteinon the surface. Comparison of the fluorescence recovery curves obtained with various focusedlaser beam widths suggests that some of the reversibly bound bovine serum albumin moleculescan surface diffuse. Aside from their relevance to the surface chemistry of blood, these resultsdemonstrate the feasibility of the TIR/FPR technique for measuring molecular dynamics onsolid surfaces.
INTRODUCTION
Protein adsorption at a liquid/solid interface has been studied by a variety of techniques for anumber of years (1-13). Interest in this subject is partially motivated by the evidence thatblood coagulation on a foreign surface is mediated by a serum protein layer adsorbed from theblood onto the surface immediately after first contact. Since some surfaces are morethrombogenic than others, the details of the interaction between the surface and serumproteins appear to be of great importance in initiating thrombus formation. As both a modelof this interaction and a first application of the technique of total internal reflection/fluorescence photobleaching recovery (TIR/FPR) introduced in the preceding paper (14), weexamined the dynamics of fluorescence-labeled bovine serum albumin (BSA) adsorption toquartz glass. TIR/FPR measures the adsorption/desorption kinetic rate coefficients andsurface diffusion coefficient of solute molecules in equilibrium with a solid surface. Knowl-edge of these parameters provides a detailed description of the two dimensional chemistry ofserum protein/surface interaction which, in whole blood, influences the formation of a clot.
BIOPHYS. J. © Biophysical Society * 0006-3495/81/03/455/13 $1.00 455Volume 33 March 1981 455-468
brought to you by COREView metadata, citation and similar papers at core.ac.uk
provided by Elsevier - Publisher Connector
The experimental results reveal that BSA binds to quartz with a multiplicity of desorptionrates which presumably reflect different classes of binding. One class is essentially irreversiblybound, and at least two other classes are reversibly bound. The ratio of reversible toirreversible binding increases with increasing bulk concentration of BSA. One interpretationis that the multiple binding classes represent multiple layers of adsorbed BSA as suggestedearlier (1, 2, 4-6). TIR/FPR also suggests that BSA molecules in the most rapidly reversibleclass are capable of moving laterally on the surface once they are adsorbed. This surfacediffusion can apparently transport adsorbed BSA molecules through a distance of at least 1,um with a diffusion coefficient of -5 x 10⁻⁹ cm2/s before desorption.
MATERIALS AND METHODS
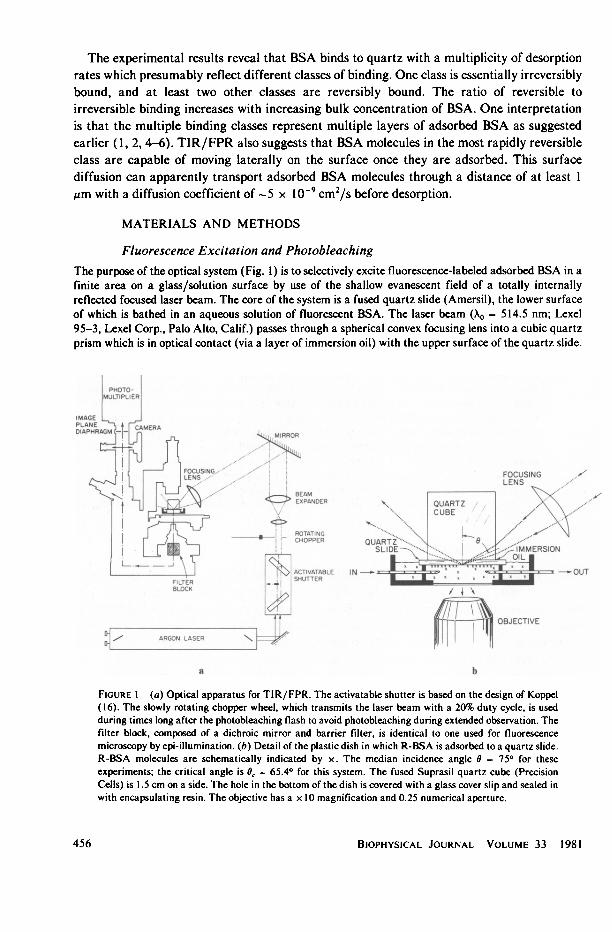
Fluorescence Excitation and PhotobleachingThe purpose of the optical system (Fig. 1) is to selectively excite fluorescence-labeled adsorbed BSA in afinite area on a glass/solution surface by use of the shallow evanescent field of a totally internallyreflected focused laser beam. The core of the system is a fused quartz slide (Amersil), the lower surfaceof which is bathed in an aqueous solution of fluorescent BSA. The laser beam (X< = 514.5 nm; Lexel95-3, Lexel Corp., Palo Alto, Calif.) passes through a spherical convex focusing lens into a cubic quartzprism which is in optical contact (via a layer of immersion oil) with the upper surface of the quartz slide.
PH- 0
Pt CUAMERA
LENS~~
., .# .; i - . .: .. .AN ;" .QUARTZ
X:4~~~~~~~~~~~~~~~~~~~~~~~~~~~~~~~~~~~~~~~~~~~~~~40... a
FIGURE I (a) Optical apparatus for TIR/FPR. The activatable shutter is based on the design of Koppel(16). The slowly rotating chopper wheel, which transmits the laser beam with a 20% duty cycle, is usedduring times long after the photobleaching flash to avoid photobleaching during extended observation. Thefilter block, composed of a dichroic mirror and barrier filter, is identical to one used for fluorescencemicroscopy by epi-illumination. (b) Detail of the plastic dish in which R-BSA is adsorbed to a quartz slide.R-BSA molecules are schematically indicated by x. The median incidence angle 0 = 750 for theseexperiments; the critical angle is 0, = 65.40 for this system. The fused Suprasil quartz cube (PrecisionCells) is 1.5 cm on a side. The hole in the bottom of the dish is covered with a glass cover slip and sealed inwith encapsulating resin. The objective has a x 10 magnification and 0.25 numerical aperture.
BIOPHYSICAL JOURNAL VOLUME 33 1981456

The focal point of the beam is at the glass/solution interface, where the beam totally internally reflects.The median angle of incidence at this interface is 750.
Fluorescence of adsorbed BSA excited by the evanescent wave is collected by the objective on aninverted microscope (Leitz Diavert, E. Leitz, Inc., Rockleigh, N.J.). In general, some nonadsorbed BSAmolecules in the bulk solution within the depth of the evanescent wave (-0.1 ,um) also may be excited.This contribution to the total fluorescence is usually negligible, as discussed in Appendix A.Fluorescence excited by stray light is minimized because it is out of focus and partially blocked by adiaphragm in an image plane of the microscope (part of the Leitz MPV-1 photometer). Fluorescencephotons passing through this diaphragm are detected by a thermoelectrically cooled photomultiplier(RCA C31034A, RCA Electro-Optics, Lancaster, Pa.).
In TIR/FPR, as in the more conventional FPR (15), the laser beam intensity is attenuated duringfluorescence observation by a shutter similar to that described by Koppel (16). A bright flash of theevanescent wave, produced when the shutter is activated, photobleaches some of the fluorescentmolecules in the selectively illuminated region. A subsequent recovery of fluorescence excited by areattenuated evanescent wave is observed as unbleached molecules replace bleached ones in theilluminated area because of adsorption/desorption and/or surface diffusion. The incident laser beampower is -200 mW during the -60 ms duration photobleaching flash; the power is reduced to -1 MWduring fluorescence observation.
Fluorescence intensity at the photomultiplier is monitored by a commercial photon counter system(Ortec Inc., E.G.&G., Inc., Oak Ridge, Tenn.) and converted to an analog signal. To protect thephotomultiplier, its high voltage power supply is automatically modulated by a control circuit during thebright photobleaching flash. Every recovery curve in the experiments reported here was slow enough tobe recorded directly onto a strip chart.
Focused Evanescent Wave ProfileThe shape of the recovery curve in TIR/FPR is dependent upon the shape of the intensity profile of theevanescent wave (see companion paper, Table 1). In a homogeneous medium, the focal plane of afocused Gaussian beam retains its circular Gaussian profile (17). But in our total internal reflectionsystem, two effects distort this profile: (a) refraction at the glass/air interface as the beam enters thecubic prism; and (b) the oblique angle formed by the optical axis of the incident beam with theglass/solution interface. A detailed derivation of the evanescent wave profile based on scalar diffractiontheory has been attempted for this geometry (T. Burghardt, unpublished result). The profile criticallydepends upon the ratio r of the laser beam radius at the focusing lens to the focal length of that lens. Inthe limit of small incident beam radius (r - 0.02), calculation shows the profile to be a broad ellipticalGaussian (Table 1 of companion paper). In the opposite limit of an expanded beam at the focusing lens(r 0.1), the calculation shows the smaller dimension of the profile to be a narrow Gaussian. For theother dimension, the calculation is much more complicated but experimentally has been observed to benearly constant over a length much larger than the width. Experimentally, r is adjusted by varying thebeam radius at the focusing lens with a beam expander (Fig. 1 a). As expected from the calculation, forr = 0.02 we observe an elliptical profile with minor axis e-2 half width of 12.5 ,m and an axial ratio of2.5 (the "wide beam"); for r = 0.1 we observe a long thin strip with e-2 half width of 2.5 Mm (the"narrow beam"). Actual photographs of these profiles are shown in Fig. 2.
Preparation of Tetramethylrhodamine-labeled BSA (R-BSA)Twenty-five mg of crystallized BSA (Sigma Chemical Co., St. Louis, Mo.; essentially fatty acid free)were dissolved in 2.5 ml of pH 9, 0.1 M sodium bicarbonate buffer. An excess of tetramethylrhodamineisothiocyanate powder (Research Organics, Inc., Cleveland, Ohio) was added and allowed to react withthe BSA for -1 min with continual stirring. The reaction mixture was then passed through a column ofSephadex G-50 made in pH 7.05 mM sodium phosphate plus 150 mM NaCl buffer (PBS) to separateexcess unreacted tetramethylrhodamine isothiocyanate from labeled protein. Typically, this procedureyielded 2-5 rhodamine groups/protein molecule. The labeled protein was dialyzed in distilled water for-24 h to remove any remaining rhodamine groups that may have nonspecifically attached to the BSA.
BURGHARDT AND AXELROD TIR/FPR Adsorption Dynamics Study 457

FIGURE 2 The intensity profile of the (a) "wide beam" and (b) "narrow beam." These are photographsof fluorescence excited by the evanescent wave at a quartz glass surface coated with 3,3'-dioctadecylindo-carbocyanine, a positively charged fluorescent dye which strongly adsorbs to glass. Bar, 25 Am.
After lyophilization, the R-BSA was stored at 40C until needed. For each experiment, the R-BSA wasredissolved in PBS buffer.
In most experiments, the protein used was a mixture of R-BSA and unlabeled BSA. In general,R-BSA constituted 100% of the total BSA for the lowest bulk concentration experiments, and as little as6% at the highest bulk concentration.
Surface PreparationBefore an experiment, a slide was washed with Alconox detergent (Alconox, Inc., New York), rinsed indistilled water, and submerged in chromic acid for at least 8 h. The slide was then rinsed in ethanol andstored under ethanol until needed. Just before an experiment, the slide was blown dry by a stream ofpure nitrogen gas. Both new slides and previously used slides received the same cleaning process. Weverified that the adsorbed R-BSA layer on used slides was thoroughly removed by this procedure byinspecting the slides under TIR fluorescence before each experiment. This surface preparationprocedure follows the one outlined by Watkins (2).
Experimental ProcedureAfter a clean slide was mounted in the dish of the TIR/FPR apparatus, pure buffer solution containingno BSA was injected into the dish via a peristaltic pump connected to an input hypodermic needle. Theoptics of the system were aligned and the background fluorescence was measured. Without altering theoptical alignment or the level of the solution, the buffer was withdrawn through an output hypodermic
BIOPHYSICAL JOURNAL VOLUME 33 1981458

needle by a peristaltic pump simultaneously with the injection of R-BSA solution through the input.After almost complete replacement of pure buffer solution by R-BSA solution, the pumps were shut offand the fluorescence vs. time was recorded. TIR/FPR experiments did not begin until the fluorescencehad become constant, indicating that the surface layer achieved equilibrium with the bulk solution.
CalibrationIt is desirable to relate the TIR fluorescence intensity detected by the photomultiplier to an actualsurface concentration of adsorbed fluorophore. To perform this calibration, we measured the TIRfluorescence of a quartz slide coated with a known concentration of tetramethylrhodamine groups. Thisspecial calibration slide was prepared with 12 other identical quartz slides. These slides were positionedin series in the light beam of a spectrophotometer inside a water-tight chamber. Two of these slidesserved as end windows of the chamber. The chamber was filled with R-BSA solution to allow R-BSAadsorption to the slides. The slides were then washed with many rinses of pure buffer to remove all butthe irreversibly adsorbed R-BSA.The optical density D through the chamber was measured at X = 550 nm. D is related to the surface
concentration C (in molecules/cm2) of rhodamine on each quartz slide through the relation C = D/nE,where E is the known extinction coefficient (E = 2.7 x 10-"' cm2/fluorophore group) of tetramethylrho-damine conjugated to BSA at X = 550 nm and n (n = 24) is the number of quartz surfaces coated withR-BSA in the chamber. (The light absorption due to one R-BSA coated surface was too small tomeasure in our spectrophotometer.)One of the chamber's end window slides (to which R-BSA was adsorbed on only one surface) was then
placed in the TIR/FPR apparatus and the fluorescence intensity was measured. Any measurement offluorescence on a sample of interest could than be converted to a surface concentration of rhodaminegroups. Given knowledge of the molar ratio of rhodamine to BSA in R-BSA, we then obtained theabsolute surface concentration of R-BSA.
This calibration procedure is valid only for those adsorbed fluorophore concentrations which do notappreciably perturb the evanescent field intensity. In this domain, observed fluorescence intensity isdirectly proportional to surface concentration. A theoretical calculation (Appendix B) considers theproblem of light absorption in the surface layer and shows that, for surface concentrations used in thecalibration or TIR/FPR experiments, we are always in the domain of direct proportionality betweenfluorescence and surface concentration.
RESULTS
Multiplicity ofAdsorption/Desorption Rates
The fluorescence recovery curves for R-BSA adsorption onto quartz (e.g., Fig. 3) typicallyexhibit features which can be recognized qualitatively upon inspection: a fast initial recovery,a slower recovery component manifested by a long gradual upward slope, and an incomplete-ness such that the recovery does not reach the prebleach level within the 30-120 min durationof the experiment. To characterize the recovery curves quantitatively, we approximate eachone as a sum of exponentials. (This form is suggested by the expected exponential form forTIR/FPR recoveries in the case of reaction limited kinetics and zero surface diffusion, see Eq.44 of the companion paper.)We express the fluorescence recovery curve F(t) in a normalized form g(t):
F(t) - F(0)(1g(t) 1I- - )F- F(0)
where F is the equilibrium prebleach fluorescence; F(O) is the fluorescence immediately afterphotobleaching at time t = 0; and F(t) is the subsequent fluorescence recovery. (Note that
BURGHARDT AND AXELROD TIR/FPR Adsorption Dynamics Study 459

1.0' 20mg/ {R-BSA ADSORBEDRTO QUARTZ
F'{
R0.8DOUIBLEEXPONENTIAL
0.6 EXPONENTIAL
BLEACH
.0-30 0 30 60 90 1000 2000 3000 4000TIME (s)
FIGURE 3 An actual TIR/FPR curve for R-BSA (20 mg/ml bulk BSA concentration) adsorption toquartz. Two types of computer-generated nonlinear least square fits are also shown. The dashed linerepresents the double exponential fit of the form of Eq. 2 adopted for all the analyses presented here. Thedotted line represents the best single exponential fit, obtained by setting g1 = 0 in Eq. 2. Although neitherform fits the data well at long times, the double exponential fit is much better than the single exponential.In all such fits, a weighting function must be chosen so that later time points do not completely dominatethe minimization of square deviations from the fit. The weighting function used here is proportional to thelocal slope of the recovery curve. This weighting forces the closest fit to occur at early times where theslope is the greatest. The fluctuations in the data are due to shot noise.
g(t) = G(t)/G(O) where G(t) is defined in Eq. 5 of the companion paper.) We then write g(t)as a sum of exponentials:
g(t) = go + gle-k2(I)t + g2e-k2(2)t (2)
where k2 (2) > k2(l) and go = 1 - (g, + g2). Parameters gl, g2, k2(1), and k2(2) aredetermined by a nonlinear least squares fitting program (18) for each experimental recoverycurve.We wish to relate these fitting parameters to identifiable physical processes. We show in
Appendix A that most of the fluorescence is due to R-BSA actually adsorbed to the surfacerather than dissolved in bulk solution within the finite depth of the evanescent wave near thesurface. We also show in Appendix C that all the recovery curves taken for bulk BSAconcentrations >1 mg/ml must be reaction limited; i.e., the rate of fluorescence recovery isdetermined by the rates of desorption rather than the rate of diffusion of BSA molecules awayfrom the surface in the bulk. Therefore, it is reasonable to identify the characteristic ratesk2(1) and k2(2) with the desorption rates for two classes of adsorbed BSA binding: a slowlyand more rapidly reversible class, respectively. (Consistent with the notation of the companionpaper, we therefore use the subscript "2" for these rates to denote desorption). Factors g, andg2 then represent the fraction of adsorbed R-BSA in the slowly and rapidly reversible binding
BIOPHYSICAL JOURNAL VOLUME 33 1981460

classes, respectively, and go represents the fraction of R-BSA which is irreversibly bound.("Irreversible" here is only a relative term indicating an incomplete recovery within theobservation time.)The separation of the recovery curves into components representing three parallel,
noninteracting classes is the simplest model reasonably consistent with the data. A modelmade up of many classes of binding that interact with each other is likely more realistic.However, the noisiness and variability of the recovery curves suggests that more than the fouradjustable parameters utilized in our chosen model would not add reliable information aboutthe adsorption process.
Total Adsorption and Immobile Class goThe total adsorption of R-BSA to quartz (Fig. 4) increases with bulk concentration withoutreaching a saturation plateau in the range of bulk concentrations employed (<20 mg/mlBSA). The immobile fraction go, obtained by computer fit to the recovery curves, decreaseswith increasing bulk concentration of R-BSA. If go at each bulk concentration is multiplied bythe total adsorption at that bulk concentration, the absolute amount of irreversibly adsorbed
a] 2.0 SURFACE CONCENTRATION VS. BULK CONCENTRATION
0
C E
1.0ZE0 ERSIBLo E.
o.ol o. o.os
0.01 0.1 10 1BULK CONCENTRATION OF BSA (mg/ml)
FIGURE 4 The irreversibly adsorbed BSA concentration (open circles), the sum of the irreversible andslowly reversible portions (closed triangles), and the total adsorbed BSA concentration (closed circles), asa function of bulk BSA concentration. The irreversibly adsorbed portion reaches a quasi-plateau at higherbulk concentrations whereas the total adsorption (reversible + irreversible) continues to rise. The pointsrepresenting total adsorption are averages of 5-1 1 fluorescence readings taken at different locations on asingle quartz slide, with standard error bars indicated. A smooth curve, drawn as a solid line, follows thetrend of these points, but is not deliberately fit to any theoretical model. The absolute scale of the verticalaxis was obtained by the calibration procedure outlined in Materials and Methods. The irreversible (----)and the irreversible plus slowly reversible ( * ) adsorption curves were obtained by multiplying thecomputer fitted parameters go (=1 - g1 g2) and I - g2, respectively, with the height of the totaladsorption curve at the corresponding bulk concentration. The parameters are the result of averaging overmany experiments on several different slides. The error bars are derived from the standard errors of go andg2 averaged over the number of runs indicated below each open bar. Absolute adsorption variedconsiderably (- + 30%) from slide to slide, but the qualitative trends were similar on all slides.
BURGHARDT AND AXELROD TIR/FPR Adsorption Dynamics Study 461

R-BSA can be obtained (Fig. 4). Irreversibly adsorbed R-BSA increases very slowly with bulkconcentrations of >1 mg/ml; the increase in total adsorption at these bulk concentrations isdue almost entirely to reversible adsorption.No significant effect of beam width on the irreversible fraction go was observed. The go
values used for the irreversible adsorption curve of Fig. 4 were averages of all measurementsof go regardless of beam width.The sorption behavior of the fluorescent proteins may be affected by the fluorophore which
is covalently attached to the protein. To investigate this possibility, we varied (by a factor oftwo) either the rhodamine:BSA molar ratio or the labeled BSA:unlabeled BSA bulk mixtureratio (while maintaining a fixed total concentration). For each ratio, we measured the TIRfluorescence of adsorbed BSA on different slides. Preliminary results indicate that changes inthe equilibrium adsorption of BSA resulting from changes in the rhodamine:BSA molar ratioor the labeled BSA:unlabeled BSA mixture ratio are less than the intrinsic variability of totaladsorption from one quartz glass surface to another at fixed ratios (± 30%). Althoughmoderate changes in the amount of rhodamine at the surface does not appear to affect a largechange in adsorption, we cannot rule out the possibility that R-BSA sorption behavior isdifferent from that of unlabeled BSA. Brynda et al. (19) have found moderate changes inadsorption of BSA after labeling by fluorescamine.
Slowly Reversible Class g,The fraction g, of slowly reversible adsorbed R-BSA increases with bulk concentration toreach a plateau around 0.30 ± 0.02 (error is SEM; the number of runs [n] is 86) at bulkconcentrations > 3 mg/ml. There is no significant dependence of g, upon beam width.The rate k2(1) for this class was highly variable from experiment to experiment, with no
clear dependence upon bulk concentration. Because of this high variability, no cleardependence of k2(1) upon beam width was apparent. For bulk concentrations >1 mg/ml,where the recovery is limited by reaction kinetics rather than bulk diffusion (see Appendix C),k2(l) = (4.6 ± 0.9) x 10-' S-s (SEM, n = 53) for the wide beam, and k2(1) = (5.0 ± 1.0) xO-3 s (SEM, n = 47) for the narrow beam.
Rapidly Reversible Class g2 and Surface DiffusionThe fraction g2 of rapidly reversible adsorbed R-BSA increases with bulk concentration toreach a plateau around 0.23 ± 0.01 (SEM, n = 86) for bulk concentrations >3 mg/ml. Therate k2(2) for this class has no clear dependence on bulk concentration. However, for bulkconcentrations > 1 mg/ml (where the recovery is limited by reaction kinetics rather than bulkdiffusion, see Appendix C), k2(2) appears to depend upon beam width. Rate k2(2) = 0.17 +0.01 s-' (SEM, n = 53) for the wide beam and k2(2) = 0.26 ± 0.02 s-' (SEM, n = 47) for thenarrow beam. This dependence of k2(2) on the beam width is consistent with the hypothesisthat surface diffusion of R-BSA increases the recovery rate as the beam width decreases.An approximate value for the surface diffusion coefficient DC can be obtained by making
use of the fitting program associated with Eq. 2. In a three noninteracting component modelwhere surface diffusion affects only the most rapidly reversible component, g(t) has the form(14):
g(t) = go + gle k2(1) + g2e- k2(2)t/(I + 4 Dct/s2)"2 (3)
BIOPHYSICAL JOURNAL VOLUME 33 1981462

where s is the characteristic width of the beam. Assuming the fluorescence recovery for thewide beam intensity is independent of surface diffusion,' the values for k2( 1) and k2(2)obtained from the computer fit of the wide beam recovery curves using Eq. 2 represent thetrue desorption rates for R-BSA. The values of g, and g2 are found from the computer fit ofcurves from both beam widths, as reported earlier, using Eq. 2. Given these values of k,(1),k2(2), g,, and g2, we generate, from Eq. 3, simulated narrow beam g(t) curves using varioustrial values of Dc. We analyze these simulated curves with the fitting program based on Eq. 2,adjusting DC until the program produces a k2(2) which matches the known narrow beamexperimental value (0.26 s-') as well as returns the correct experimental values of g,, g2, andk2(1). This particular Dc, the best estimate of the R-BSA surface diffusion coefficient, is(5 ± 1) x 10-9cm2/s in our experiments.We have conducted control experiments to see if the faster recovery rate observed in the
narrow beam experiments could be caused by systematic artifacts arising from intenseillumination. It has been suggested that illumination may (20, 21) or may not (22) cause aphotochemical alteration, especially by crosslinking. Crosslinking would presumably slowfluorescence recoveries by retarding the surface diffusion and/or desorption rates of reversiblyadsorbed components. In these experiments we varied the amount of photobleachingdetermined experimentally by the ratio of F(O)/F(-), i.e., the initial fluorescence immedi-ately after bleaching to the prebleach fluorescence, by changing the duration of the bleachingpulse and/or the intensity of the focused laser beam. Our findings, although noisy, indicate notendency of adsorbed R-BSA fluorescence recoveries to become slower as intensity isincreased over a factor of three through the range used for typical TIR/FPR experiments.Furthermore, the amount of photobleaching was very similar for both narrow and wide beamexperiments, typically F(O)/F(-) - 0.7.
DISCUSSION
Research on serum protein adsorption is motivated by its relevance to surface-triggered bloodcoagulation. Adsorption of plasma proteins, particularly serum albumin, is the first event inthe interaction of blood with a surface. Albumin has been specifically implicated in thecoagulation mechanism, since surfaces precoated with albumin appear less thrombogenic thanuncoated surfaces (4, 9). Furthermore, it has been shown that albumin is preferentiallyadsorbed, relative to other plasma proteins, to less thrombogenic surfaces (1 2). Theseproperties, as well as the high albumin concentration in the blood, stir considerable interest inthe basic surface physical chemistry of serum albumin.We have utilized a new technique combining total internal reflection fluorescence with
fluorescence photobleaching recovery to examine the kinetic behavior of rhodamine-labeledBSA adsorbed to quartz glass. The most significant results are: (a) Adsorbed R-BSA exhibits
'To justify this assumption, we will demonstrate the implausibility of its opposite. Assume, then, that the rapidcomponent of the wide beam recovery is strongly determined by surface diffusion. Since the width SN of the narrowbeam is approximately a factor of five smaller than the width sw of the wide beam, we would expect the rapidcomponent of the narrow beam recovery to be approximately a factor of 25 faster than that of the wide beamrecovery. But a factor of only - 1.5 is observed experimentally. Therefore, the wide beam recovery is quite far fromthe regime in which surface diffusion is significant.
BURGHARDT AND AXELROD TIR/FPR Adsorption Dynamics Study 463

at least three desorption rates k2: irreversible (k2 < 10- s -'); slowly reversible (k2 t 5 x 10-3.s-'); and rapidly reversible (k2 0.17 s-'). (b) Increasing bulk concentration increases theratio of the reversible to irreversible adsorption. (c) BSA molecules in the most rapidlyreversible class appear to diffuse laterally on the surface for distances >1 ,um beforedesorption, with a diffusion constant of -5 x 10⁻⁹ cm2/s.We speculate that the various classes of adsorption represent different bound layers. The
irreversible layer would form in direct contact with the glass surface. Reversible layers wouldnext form on top of the irreversible layer with the most reversibly adsorbed layer farthest fromthe glass surface. This multilayer hypothesis is supported by our data which suggest that theobserved surface concentration of R-BSA for bulk concentrations >0.1 mg/ml exceeds themaximum possible packing density for a monolayer of adsorbed BSA molecules which retaintheir native dimensions (23). The multilayer adsorption could be very heterogenous with someareas of the surface highly layered and others virtually bare, reflecting charge inhomogeneityin the quartz glass surface. The high observed surface concentration is still consistent withmonolayer formation if the actual surface is very irregular on a molecular scale or if theadsorbed BSA molecules squeeze into a more compact conformation than their native bulkstate.
Monolayer protein adsorption to glass has been inferred from previous work because theadsorption curve follows the Langmuir isotherm shape (1, 3). These studies report partialirreversibility in the adsorbed monolayer, which is attributed to heterogeneity in the surfacebinding sites. The adsorption of plasma proteins such as albumin, fibrinogen, and -y-globulinon surfaces other than glass has more recently been investigated with the same observation ofreversibility in the adsorption (1, 2, 4-6). In this literature, however, reversibility is attributedto a multiplicity of bound layers.Our results suggest the presence of surface diffusion of adsorbed BSA. This is a phenomena
of considerable interest which has not been directly explored previously for any adsorbedbiomolecule by any experimental technique. The possible presence of surface diffusion in themost rapidly reversible layer implies that the energy barriers to lateral motion are lower thanthe energy barrier to leaving the vicinity of the surface. Lateral collision based surfacechemistry, a process made possible by surface diffusion, may be of importance in themechanism of blood coagulation.
Aside from the information obtained about BSA adsorption to quartz glass, theseexperiments demonstrate the feasibility and utility of TIR/FPR as a technique. UsingTIR/FPR, we have measured desorption rates of R-BSA and detected surface diffusion on asystem in equilibrium without requiring any intrinsic spectroscopic changes between thebound and unbound states. Extension of this technique to other systems in which fluorescentligands in bulk solution interact with surface immobilized receptors appears promising.
APPENDIX A
Dominance ofSurface FluorescenceFor TIR/FPR results to characterize surface dynamics, it is essential that most of the fluorescencearises from surface adsorbed fluorophore rather than bulk dissolved fluorophore within the exponentiallydecaying finite depth of the evanescent intensity. The ratio R of bulk fluorescence to surfacefluorescence is Ad/C, where A is the bulk concentration of fluorophore, C the surface concentration, andd the e-' characteristic depth of the evanescent intensity. With our angle of incidence, d = XO/6 (14),
BIOPHYSICAL JOURNAL VOLUME 33 1981464

where Xo is the excitation light wavelength in vacuum. R increases with increasing bulk concentration.
For the largest bulk concentration observed here, R = 0.071. This implies that, at the minimum, 93% of
the observed fluorescence is due to surface adsorbed fluorophore in any experiment we have reported
here.
APPENDIX B
Proportionality ofFluorescence and Surface Concentration
We wish to determine the domain in which fluorescence emission is proportional to the surfaceconcentration of an adsorbed fluorophore, with particular application to the case of R-BSA in the
(a)QUARTZ I
n2 8 ABSORBING 8~ ~ ~ E
n3
IhI
WATER
(b)FLUORESCENCE
VS.SURFACE
CONCENTRATION
THEORY
0 20 40 60 80
SURFACE CONCENTRATION ORHODAMINE MOLECUL
FIGURE 5 (a) A schematic representation of the adsorbed R-BSA layer at a quartz/solution interface.
All of the electric field vectors E represent total fields inside the respective regions with refractive indices
n,, n2, and n3. The index of refraction inside the absorbing medium is complex as signified by the symbol -
in h2. (b) A plot of fluorescence versus surface concentration of tetramethylrhodamine for the systempictured in a. CMAX is the maximum surface concentration for which the deviation of the linear
approximation from the exact curve is <10%. The values for n2 and d are not precisely known but were
chosen from within reasonable ranges to give the smallest CMAX. For this graph, n, 1.467, n2 1.467,
n3 = 1.334, h 300 A.
BURGHARDT AND AXELROD TIR/FPR Adsorption Dynamics Study
n
z
n
4
ir
zwI(I)w0-JLL.
a
3
465

present experiments. In this domain, the evanescent field is negligibly perturbed by the adsorbedfluorophore. Since the observed fluorescence intensity is proportional to the light intensity Pb absorbedby the adsorbed layer, we calculate Pabs as a function of surface concentration.
Consider a medium of index of refraction n, (quartz) separated from a medium of index of refractionn3 (protein solution) by a light-absorbing layer of thickness d and complex index of refraction f2 =n2( 1 -iK) (see Fig. 5 a). Plane wave light of wavelength X0 is incident upon the layer from medium 1 sothat total internal reflection occurs at either the first or second interface. Noting that Iabs = jinc IIre,where JinC is the incident intensity and I/f is the reflected intensity, we write an expression (24) for thereflected electric field amplitude Ef relative to the incident field amplitude E'5C:
E_ref r, + r 2i5
EiInc 1 + r1r2e 2' (RI)
where 6 = (2r/Xo) h2d cos 02; and r, and r2 are the Fresnel coefficients given below:
n, cos01 - '2 cos 02 h2 cos 01 -n cos 02n1 cos 01 + n2 cos 02 n2 cos 01 + n1 cos 02
(B2)=i2 cos 02 - n3 COS03 n3 COS 02 -n2 COS 03h2 cos 02 + n3 COS 03 n3 COS02 + i2 COS 03
Superscripts i and || refer to electric field polarization perpendicular and parallel to the plane ofincidence, respectively. Eq. Bi is valid for either polarization with the appropriate set of Fresnelcoefficients. Eq. BI is also valid without modification for reflection occurring at either interface.
Combining Eqs. B1 and B2 and calculating intensity Iref = | ref 2, we obtain ref as a function of K.Utilizing K = CE-Qn 1 0/47rn2d, Iabs can be plotted as a function of surface concentration_C. In the case ofadsorbed tetramethylrhodamine (Fig. 5 b), the fluorescence is linearly proportional to Cup to CMAX 5Sx I 0'5 tetramethylrhodamine groups/cm2.
APPENDIX C
Reaction vs. Bulk Diffusion LimitThe theory of TIR/FPR (14) is simplest when the system is in the reaction limited state. In this state,when a typical bleached fluorophore desorbs from the surface, it rapidly diffuses away so that theprobability of it readsorbing to the surface during the course of the experiment is essentially zero. Thefluorescence recovery is then given in Table I of the companion paper for a monokinetic system.The system can be shown to be in the reaction limit if the characteristic time for recovery in a
TIR/FPR experiment is much larger than the calculated characteristic time l/RBND for bulk diffusionaway from the surface. 1 /RBND is given by (Eq. 40 of the companion paper):
I/RBND = ( I)2/DA, (CI)
where DA is the bulk diffusion coefficient; A, the bulk concentration, is a known experimental variable;and C, the surface concentration, is known from the calibration of the optical system. Our TIR/FPRcurves for adsorption for A > 1 mg/ml have recovery times at least 20 times larger than thecorresponding 1 /RBND calculated from Eq. Cl. This implies that for A > 1 mg/ml, the recovery is in thereaction limit.
We thank Ms. Shirley Mieras and Ms. Mae Gillespie for typing the manuscript. This work was supported by aResearch Corporation Cottrell Research Grant, American Chemical Society-Petroleum Research Fund grant
BIOPHYSICAL JOURNAL VOLUME 33 1981466

10590-G5,6, a University of Michigan Rackham Faculty Research Grant, and National Institutes of Health grants1R01-NS14565 and 1R01-HL24039.
Receivedfor publication O0 June 1980.
REFERENCES
1. BRASH, J. L., and D. J. LYMAN. 1971. Adsorption of proteins and lipids to nonbiological surfaces. In TheChemistry of Biosurfaces. M. Hair, editor. Marcel Dekker Inc., New York. 177.
2. WATKINS, R. W., and C. R. ROBERTSON. 1977. A total internal-reflection technique for the examination ofprotein adsorption. J. Biomed. Mater. Res. 11:915.
3. MACRITCHIE, F. 1978. Proteins at interfaces. Adv. Prot. Chem. 32:283.4. WALTON, A. G., H. GERSHMAN, and M. E. SODERQUIST. 1977. Model biological interfaces. Croatica Chemica
Acta. 50:197.5. BAGNALL, R. P., and J. A. D. ANNIS. 1978. A novel technique for studying the adsorption of plasma proteins on
hydrophobic surfaces. J. Biomed. Mater. Res. 12:653.6. GENDREAU, R. M., and R. J. JAKOBSEN. 1979. Blood-surface interactions: Fourier transform infrared studies of
protein surface adsorption from flowing blood plasma and serum. J. Biomed. Mater. Res. 13:893.7. KIM, S. W., and E. S. LEE. 1979. The role of adsorbed proteins in platelet adhesion onto polymer surfaces. J.
Polym. Sci. Polym. Symp. 66:429.8. VROMAN, L., and A. L. ADAMS. 1971. Peculiar behavior of blood at solid interfaces. J. Polym. Sci. Part C.
34:159.9. ADDONIZIO, V. P., E. J. MACARAK, K. C. NICOLAOU, L. H. EDMUNDS, and R. W. COLMAN. 1979. Effects of
prostacyclin and albumin on platelet loss during in vitro simulation of extracorporeal circulation. Blood.53:1033.
10. NEUMANN, A. W., M. A. MOSCARELLO, W. ZINGG, O. S. HUM, and S. K. CHANG. 1979. Platelet adhesion fromhuman blood to bare and protein-coated polymer surfaces. J. Polym. Sci. Polym. Symp. 66:391.
11. IHLENFELD, J. V., and S. L. COOPER. 1979. Transient in vivo protein adsorption onto polymeric biomaterials. J.Biomed. Mater. Res. 13:577.
12. CHIU, T. H., E. NYILAS, and L. R. TURCOTTE. 1978. Microcalorimetric and electrophoretic studies of proteinsorption from plasma. Trans. Am. Soc. Artif Intern. Organs. 24:389.
13. BRASH, J. L., and S. UNIYAL. 1979. Dependence of albumin-fibrinogen simple and competitive adsorption onsurface properties of biomaterials. J. Polym. Sci. Polym. Symp. 66:377.
14. THOMPSON, N. L., T. P. BURGHARDT, and D. AXELROD. 1981. Measuring surface dynamics of biomolecules bytotal internal reflection fluorescence with photobleaching recovery or correlation spectroscopy. Biophys. J.33:435-454.
15. AXELROD, D., D. E. KOPPEL, J. SCHLESSINGER, E. ELSON, and W. W. WEBB. 1976. Mobility measurement byanalysis of fluorescence photobleaching recovery kinetics. Biophys. J. 16:1055.
16. KOPPEL, D. E. 1979. Fluorescence redistribution after photobleaching. A new multipoint analysis of membranetranslational dynamics. Biophys. J. 28:281.
17. YOSHIDA, A., and T. ASAKURA. 1974. Electromagnetic field near the focus of gaussian beams. Optik. 41:281.18. BEVINGTON, P. R. 1969. Least squares fit of non linear parameters. In Data Reduction and Error Analysis for the
Physical Sciences. McGraw-Hill, New York.19. BRYNDA, E., J. DROBNIK, J. VACIK, and J. KALAL. 1978. Protein sorption on polymer surfaces measured by
fluorescence labels. J. Biomed. Mater. Res. 12:55.20. SHEETZ, M. P., and D. E. KOPPEL. 1979. Membrane damage caused by irradiation of fluorescent concanavalin
A. Proc. Natl. Acad. Sci. U.S.A. 76:3314.21. LEPOCK, J. R., S. D. CAMPBELL, M. GRUBER, and J. KRUUV. 1979. Photo induced cell killing and crosslinking of
fluorescene conjugated concanavalin A to cell surface proteins. Biochem. Biophys. Res. Commun. 91:1157.22. JACOBSON, K., Y. Hou, and J. WOJCIESZYN. 1978. Evidence for lack of damage during photobleaching
measurements of the lateral mobility of cell surface components. Exp. Cell Res. 116:179.23. PETERS, T., and R. G. REED. 1977. Serum albumin: conformation and active sites. In Albumin: Structure,
Biosynthesis, Function. T. Peters and I. Sjoholm, editors. Pergamon Press, New York. 14.24. HEAVENS, O. S. 1955. Thin film optics. In Optical Properties of Thin Solid Films. Academic Press, Inc., New
York. 46.
BURGHARDT AND AXELROD TIR/FPR Adsorption Dynamics Study 467