total portfolio activation for impact: a strategy to move ... · total portfolio activation for...
TRANSCRIPT

Total Portfolio Activation for Impact: A Strategy to Move Beyond ESG
A S A N T A C L A R A U N I V E R S I T Y C E N T E R O F D I S T I N C T I O N
SEPTEMBER 2016
Lala Faiz, Charly Kleissner, John Kohler, Nancy Y. Lin

2© Copyright 2016. GSBI is a registered trademark of Santa Clara University. All rights reserved.

3
The authors of this paper wish to express their gratitude to the following:

4
Foreword
Capital investments are crucial for social enterprises to scale their impact.
That’s why impact investing is an important aspect of our work at Santa Clara
University’s Miller Center for Social Entrepreneurship. Our efforts supporting
social enterprises to eradicate poverty, address the negative impacts of climate
change, and economically empower women require the mobilization of capital
specifically intended to generate positive social and environmental impact—in
other words, impact investing.
John Kohler, senior director of the Impact Capital team at Miller Center,
in conjunction with leaders at KL Felicitas Foundation, Toniic, and other
organizations, have pioneered strategies that enable impact investors to mobilize
capital to all asset classes—meaning their full portfolios—with the intention of
generating social and environmental returns. The Total Portfolio Activation for
Impact strategy outlined in this white paper lays out an investment approach for
investors committed to generating positive social or environmental impacts while
also maintaining competitive financial returns.
This strategy represents only a sliver of the spectrum of impact investing, but
this thin slice contains the vast majority of capital available through existing
investment vehicles. We hope that by sharing this work and putting it into the
public domain, our model approach will encourage more individuals, foundations,
and wealth managers to invest their entire portfolios for impact.
It is unrealistic, however, to expect that many social enterprises addressing
problems of poverty, climate change, and gender inequality will always generate
competitive financial returns in any asset class. Even as social enterprises employ
earned-income models to reduce the need for contributions, endeavors with
deep social and environmental impact are unlikely to sustain themselves on
earned-income alone. Thus, in addition to total portfolio activation, it is essential
to activate capital along the entire financial return spectrum, from “market-rate”
to pure philanthropy.
Miller Center innovates investment vehicles, such as structured exits, in which
the financial return can be tuned commensurate with the expected impact. An

5
example is the demand dividend, which can be tuned to yield competitive returns,
100% of capital (i.e., a “roundtrip”), or even a partial subsidy, such as 80% return of
capital. The demand dividend thus offers an advantage over philanthropy, where
donated money never returns.
As we set free the Total Portfolio Activation strategy summarized in this white
paper, Miller Center extends an invitation to those with a passion for social justice:
Join us as we experiment with new vehicles for impact investing. Together, we can
broaden impact investing into a much bigger movement, mobilizing more capital
in those regions of the spectrum that cannot generate market-rate financial return,
yet have the greatest potential for outsized impact.
PH
OTO
CR
ED
IT: IL
UM
ÉX
ICO
Iluméxico is a Miller Center GSBI Alumni that used the demand dividend structure exit for its funding.
Thane Kreiner, Ph.D., Executive Director Miller Center for Social Entrepreneurship

6
ContentsEXECUTIVE SUMMARY........................................................................................................ 8
PART ONE: CONCEPTUAL OVERVIEW1.0 FROM CONCEPT TO STRATEGY:
TOTAL PORTFOLIO ACTIVATION FOR IMPACT ..............................................................11
1.1 THE NEED FOR A NEW INVESTMENT APPROACH .....................................................12
1.2 THE TOTAL PORTFOLIO ACTIVATION FOR IMPACT STRATEGY—
KEY PRINCIPLES .........................................................................................................................12
1.3 INTENTIONALITY: GOING BEYOND NEGATIVE SCREENS ...................................... 14
1.4 A FRAMEWORK FOR BLENDING IMPACT INVESTMENT
CHOICES ACROSS ASSET CLASSES ..................................................................................15
1.5 GEOGRAPHIC DIVERSIFICATION ........................................................................................ 18
1.6 RELEVANT INVESTMENT THEMES ..................................................................................... 19
1.6.1 Sustainable Agriculture .......................................................................... 19
1.6.2 Water and Land (including Timberland) ..........................................21
1.6.3 Clean Energy ...............................................................................................23
1.6.4 Health Care ..................................................................................................25
1.6.5 Education......................................................................................................27
1.6.6 Financial Services .................................................................................... 28
2.0 WHAT IT MEANS TO HAVE IMPACT ..................................................................................30
2.1 DEFINING IMPACT .....................................................................................................................30
2.2 ASSESSING IMPACT BY INVESTMENT THEME ............................................................ 33

7
PART TWO: HOW TO IMPLEMENT THE STRATEGY3.0 THE TOTAL PORTFOLIO ACTIVATION FOR IMPACT STRATEGY
IN ACTION: A MODEL PORTFOLIO ................................................................................... 38
3.1 CONSIDERATIONS IN DEVELOPING A TOTAL PORTFOLIO
ACTIVATION FOR IMPACT STRATEGY ............................................................................. 38
3.2 ALLOCATING INVESTMENTS TO BALANCE IMPACT AND RETURNS .............. 39
3.3 MODEL PORTFOLIOS ..............................................................................................................40
3.3.1 Model Portfolio Example 1 ....................................................................40
3.3.2 Table of Annual Cash Flow and Yield ..............................................41
3.3.3 Draw-Down Schedule: A 3-Year Investment Period ..................41
3.3.4 Model Portfolio Example 2 ................................................................... 43
4.0 DUE DILIGENCE ..........................................................................................................................44
4.1 GENERAL METHODOLOGY ................................................................................................... 41
4.2 DUE DILIGENCE FOR FUNDS ...............................................................................................46
4.3 DUE DILIGENCE FOR DIRECT INVESTMENTS ...............................................................52
4.4 OTHER DUE DILIGENCE CONSIDERATIONS ..................................................................52
5.0 APPENDICES ................................................................................................................................ 54
5.1 SAMPLE FUND TERM SHEET................................................................................................ 54
5.2 DUE DILIGENCE TEMPLATES ................................................................................................ 61
5.2.1 Fund Due Diligence .................................................................................. 61
5.2.2 Direct Investment Due Diligence ....................................................... 65
5.3 MAPPING OF PIPELINE INVESTMENT FUNDS AND COMPANIES
BY IMPACT THEME AND GEOGRAPHY ........................................................................... 70
5.4 RESOURCES FOR TOTAL PORTFOLIO ACTIVATION FOR IMPACT
INVESTMENT OPPORTUNITIES ............................................................................................72
ENDNOTES .....................................................................................................................................74

8
Executive Summary
Occupying space on the continuum between pure-profit investment, which seeks
only to maximize financial returns, and philanthropy, where financial returns
are largely ignored, impact investing endeavors to balance financial return with
measurable social or environmental impact.
Impact-minded public market investors have traditionally used environmental,
social, and governance (ESG) factors to measure sustainability and the positive
contributions of the primarily public companies they invest in.
Today, many fund managers and asset owners want to move beyond ESG, but they
struggle with how to manage risk and produce competitive returns. They have to
thread their own way among the available investment options, putting together
portfolios that, for instance, mix traditional investments with philanthropy, or
that rely on researching and screening individual private companies for direct
investment opportunities. These private companies that intentionally pursue
positive social and environmental solutions operate in areas with the greatest
need, which could be thousands of miles distant from where the investors are
located, requiring an assumption of risk outside the comfort zone of the originating
investor.
The goal of the Total Portfolio Activation for Impact strategy described in
this paper is to provide concrete guidance to those interested in constructing
impact investment portfolios that yield competitive returns while simultaneously
achieving high levels of impact and managing risk. The work described herein
draws from earlier work, including several publications that introduced the
concept of establishing impact across asset classes, as well as recent publications
by pioneering investors and foundations providing ‘open source’ examples of
their investments with a variety of asset classes and associated returns. Those
publications are listed in the Appendix for further reading.
Enough peer-vetted investment choices now exist to allow fund managers
to begin modeling and implementing different portfolios based on themes, or
geographies, or minimum yields and risk management. This paper creates the next

9
evolutionary step in the process of impact investing, benefiting from the critical
mass of impact investments that have been shared by other impact investors or
curated by investor organizations such as Toniic.
The Total Portfolio Activation for Impact strategy itself arose at Santa Clara
University’s Miller Center for Social Entrepreneurship, driven by John Kohler, Miller
Center’s Director of Impact Capital, in collaboration with Lala Faiz, Miller Center’s
Director of Financial Innovation programs; Charly Kleissner, Co-Founder of Toniic,
Social-Impact International, and KL Felicitas Foundation; and Nancy Y. Lin, Miller
Center’s Program Director for Impact Capital.
Built upon four measurable key principles, this strategy provides a framework for
balancing impact investment choices across a range of asset classes. It factors in
geographic diversification and describes relevant investment themes—sustainable
agriculture; water and land; clean energy; health care; education; and financial
services—including rationales and examples for each theme. The paper concludes
with guidance for defining social and environmental impact, and for assessing
impact by theme.
This paper then provides practical advice for constructing a portfolio based on
the Total Portfolio Activation for Impact strategy. It presents model portfolios
along with the considerations used to develop them; describes how to allocate
investments to best balance impact and returns; and explains what cash flows
and yields can be expected from such model portfolios. The paper ends with a
thorough discussion of the due diligence required for constructing and managing
portfolios based on this strategy.
It is the intention of this paper to encourage more interested parties to engage in
impact investing as well as to make those efforts more financially satisfying and
successful.

10
PART ONE:Conceptual Overview
PH
OTO
CR
ED
IT: S
AN
TA
CL
AR
A U
NIV
ER
SIT
Y,
LA
UR
EN
FA
RW
EL
L

11
1.0 FROM CONCEPT TO STRATEGY:TOTAL PORTFOLIO ACTIVATION FOR IMPACT
Whether termed social, responsible, or impact investing, “A growing number of investors, institutions, and financial professionals are deploying and managing capital to build a more sustainable and equitable economy,” according to a report1
from USSIF, the Forum for Sustainable and Responsible Investment.
Most people investing for impact dedicate a portion of their money to impact investments, often through direct investments. However, a growing number of high-net-worth individuals, family offices, and private foundations are choosing to invest a greater proportion (and sometimes all) of their capital across several asset classes while maintaining the goal of driving positive and measurable social or environmental outcomes.
The following strategy attempts to balance what are often contradictory goals by demonstrating how to assemble an investment portfolio that produces returns competitive with the performance of traditional investments while also pursuing high levels of positive and measurable social and environmental impact. The goal is to prove that investment capital can also be ‘impact’ capital and play a critical role toward improving a world in which resources for growth and prosperity are increasingly limited. However, many forms of social and environmental impact are unlikely to generate competitive financial returns in any asset class; to eradicate poverty and address the impacts of climate change will require mobilization of impact investors who do not require competitive financial returns, along with philanthropists.
This strategy is a product of Santa Clara University’s Miller Center for Social Entrepreneurship. It is also informed by the work of Charly Kleissner and Sonen Capital, who together published the first publicly disclosed study on a seven-year effort to construct a total impact investment portfolio.2 This work also benefits from the rich discussion and experience of 100% impact portfolio members – or “100%-ers” – at Toniic, an impact investor community that both Mr. Kleissner and
PH
OTO
CR
ED
IT: M
EO
GIA

12
Miller Center’s John Kohler (along with others) co-founded six years ago. These experiences provide a unique starting point from which emerged the structure for a second-generation 100% impact investment portfolio: Total Portfolio Activation for Impact.
1.1 THE NEED FOR A NEW INVESTMENT APPROACH
The Total Portfolio Activation for Impact strategy is expected to be most attractive to asset owners, family foundations, mission-based institutions (e.g., Catholic institutions, international non-governmental organizations [INGOs]), universities, and corporations interested in achieving social good with their money but who also want reasonable returns on their investments. To date, these investors have allocated a portion of their investment activities to include social and environmental impact, but they have lacked sufficient number of entry points into a broader array of asset classes.
The strategy is also relevant to fund managers and investment advisors looking for a more sophisticated response to clients who desire access to a mission-based or diversified portfolio of both direct and indirect impact investment opportunities for at least a portion of their investable assets.
Previously, the majority of investment approaches forced interested capital to trade off between social impact and financial returns. Often, impact-interested investors rely on traditional investing for their financial returns and turn to philanthropy to fulfill their desires for social impact—creating separate, parallel pathways for their capital. But while philanthropy plays a critical role in providing social benefit—for example, in response to disasters and other emergencies or to de-risk investments—it alone is not sufficient to enable systemic and long-term social and environmental benefit.
The Total Portfolio Activation for Impact strategy provides an attractive alternative for those interested in fueling positive social and environmental change, building on recent work and demonstrating the existence of investment targets able to provide intentional impact within a broad set of asset classes. The strategy also helps manage the risk inherent in investing in concentrated positions by diversifying financial and impact risk across multiple asset classes.
1.2 THE TOTAL PORTFOLIO ACTIVATION FOR IMPACT STRATEGY—KEY PRINCIPLES
The notion of investing capital with the intent to generate both financial returns and positive social or environmental impact has captured the imagination of thoughtful investors across the globe.
13
The Total Portfolio Activation for Impact portfolio strategy is designed with the following tenets in mind:
Intentionality—The Global Impact Investing Network (GIIN)3 defines intentionality as the purposeful aim of the investor to generate social and/or environmental impact through investments. The asset allocation strategy should go beyond negative screens and focus on responsible, thematic, and/or impact-first investments. For example, investments might increase access to financial services, education, healthcare, affordable housing, or high-quality employment for underserved populations. Investments might also be focused on solutions aimed at mitigating the negative effects of climate change and environmental degradation. Investor activities can be focused in developed or emerging markets, or sometimes both. Investment themes that lend themselves to an attractive and measurable amount of impact are given in Section 1.6.
Investment with return expectations—Impact investments have the potential to deliver competitive, risk-adjusted financial performance with far-reaching social and environmental impact. Recently, the results of a few pioneering 100% impact portfolios have been made available and demonstrate that effective impact investments largely compare with the returns earned with traditional asset-class strategies. In particular, “Essentials of Impact Investing”4 and “Evolution of an Impact Portfolio: From Implementation to Results” are beneficial and informative resources.
Investment strategy applied across asset classes—Impact investing is a portfolio strategy that can be applied across multiple asset classes, which is a relatively new development in the impact investing sector (e.g., cash and cash equivalents, fixed income, real assets, public equities, private equity and debt, structured notes). For many years, the only option for new impact investors was to make direct equity investments into private startups. Section 3.2 provides a sample asset allocation framework.
Impact measurement—As recognized by GIIN, a hallmark of impact investing, is a commitment to measure and report the social and environmental performance and progress of underlying investments. Impact considerations must be taken into account during the:
a. Due diligence process to validate the potential impact of an investment
b. Term sheet development to make sure the managers are all in alignment around impact
c. Growth of the investments to monitor increased impact
d. Exit of an investment to quantify sustainable impact
See Section 2.0 for more details on defining and measuring impact.

14
1.3 INTENTIONALITY: GOING BEYOND NEGATIVE SCREENS
The following impact investing spectrum, enhanced recently by Sonen Capital (and developed earlier by sector thought leaders GIIN, WEF, G8, and several others), defines approaches of investment management based on the level of impact that exists in an impact portfolio. Five categories of impact are defined below, moving (left to right) from lower to higher impact.
Seeks financial returns regardless of Environmental, Social or Governance (ESG) factors
Investments are screened but based on ESG risk
Negative Screens:TobaccoAlcoholWeaponsGamblingPornographyNuclear Energy
Factors Considered:Carbon footprintResource useWaste reductionCompensationProduct safetyGender equality
Solutions For:Carbon footprintResource useWaste reductionCompensationProduct safetyGender equality
Sustainability factors and financial returns drive investment selection
Targeted themes and financial returns drive investment selection
Social and environmental considerations take precedence over financial returns
Financial returns disregarded in favor of social and environmental solutions
TraditionalInvesting
1. ResponsibleImpact Investing
2. SustainableImpact Investing
3. ThematicImpact Investing
4. Impact First Investing 5. Philanthropy
Support For:Innovation & Risk TakingProof of Concept/PilotsEnabling EnvironmentsCommercial Capital Leverage
CompetitiveReturns
ESG RiskManagement
ESG Opportunities Maximum-Impact Solutions
TABLE 1 - Credit: Sonen Capital
The five categories of impact investing are as follows:
1. Responsible Also known as Socially Responsible Investing (SRI), this approach involves the negative screening of investments due to conflicts or inconsistencies with personal or organizational values, non-conformity to global environmental standards, adherence to certain codes of practice, or other such binary impact performance criteria. The term ‘Responsible’ is also used to capture investment activity that might proactively contain a social or environmental component in its strategy.
2. Sustainable Sustainable investments move beyond a defensive screening posture, actively looking for investments that are positioned to benefit from market conditions by integrating environmental, social, and governance (ESG) factors into core investment decision-making processes.
3. Thematic Thematic or mission investments have a particular focus on one or more impact themes, such as clean water or preventing deforestation, and work to channel investment allocations in those particular directions. These are highly targeted investment opportunities, in which the social or environmental benefits are fully blended into the value proposition of a commercially positioned investment.

15
4. Impact First Impact-first investments have at the core of their value proposition the goal of intentionally seeking to optimize a desired social or environmental outcome, often in priority over financial return goals.
These categories, while useful, still leave too many uncertainties for impact-focused investors. For example, do responsible investments, which are based on the avoidance of certain investments rather than positive investment focus, qualify as part of a 100% impact investing portfolio? And because potential financial returns are not considered in any of these categories, how is an impact investor or portfolio manager supposed to set expectations for returns?
5. Philanthropy Philanthropy plays a critical role in the spectrum of capital available to impact-focused enterprises and programs. Philanthropy such as grants can often serve as ‘starter capital’ to catalyze new innovations before they are ready for investment capital.
When moving from grants (Philanthropy) to investment capital (Impact First category), many actors within the impact field accept a partial return of their mission-aligned capital and define it as a necessary and seamless piece of impact investing. These mission-aligned instruments, often in the form of program-related investments (PRIs), grants, or ‘first loss guarantees,’ are crucial in situations where layered or blended capital is used to manage-down inherent risk in the financing. A layered or blended investment structure allows the combination of capital with different return expectations to be applied in the same investment over time, or even within the same financing round.
That said, The Total Portfolio for Impact strategy does NOT focus on philanthropy. It demonstrates how to receive a financial return on investment that goes beyond negative screens and focuses EXCLUSIVELY on the sustainable, thematic, and impact-first categories, to ensure intentional impact.
1.4. A FRAMEWORK FOR BLENDING IMPACT INVESTMENT CHOICES ACROSS ASSET CLASSES
Although there are various ways to approach asset allocation,6 the following blend of asset classes provides an example of how to create a portfolio of direct and fund investments that
1) balance impact performance and financial risk;2) return a majority of invested capital within seven years; and3) yield a small amount of near-term income to investors.
The scope of this work did not include an assessment of public equity, as this asset class is primarily used in Environmental, Social and Governance (ESG) and socially responsible investment strategies. The focus of the Total Portfolio Activation for Impact strategy is to push beyond ESG.

16
The following Asset Class table provides more detail as to why each was chosen and the corresponding investment method. Cash can be deposited in checking, savings, or money-market funds, which provide full transparency regarding their deployment and impact. The focus on fixed-income investments lowers the overall financial risk of the portfolio while delivering best-in-class impact. Both direct and external fund investments in real assets ensure maximum impact and a reasonable financial return. Finally, direct investments using structured notes, private equity, and private debt allow managers and advisors to stay as close as possible to their investments and concentrate on intentional impact.
Asset Class Investment Method Portfolio Purpose
Cash and Equivalents
Checking, savings, or money- market funds that seek social/ environmental gain, e.g., via Community Development Finance Institutions (CDFIs)
Financial: Liquidity Risk: Low Impact: Moderate to High (local)
Fixed Income
External private and public debt funds issued by government, corporations, financial institutions, and fund managers that address environment or social issues
Financial: Stable cash yield
Risk: Low
Impact: Moderate to High (global)
Structured Notes (including Impact Bonds)7
Mostly direct investments in social enterprises using alternative exit structures (i.e., Variable Payment Obligations), or investments into external private funds that provide capital to social enterprises with tailored return or unconventional exit structure
Financial: Intermediate duration (5 years +) tailor- made cash flow and redemption/exit
Risk: Medium
Impact: Moderate to High (global)
Real Assets
Direct investments into real estate or real assets, or investments in external private funds that address social and/or environmental issues (e.g., urban green housing)
Financial: Moderate to High return
Risk: Lower correlated risk
Impact: Moderate to High (global)
Private Equityand Private Debt
Direct equity and/or debt investments in social enterprises, or investments into external PE/VC funds often by themes (e.g., financial inclusion, empowering women, clean tech)
Financial: High return
Risk: High risk
Impact: Moderate to High (global)
TABLE 2

17
Examples of investments in each asset class:
Cash
• Community Bank of the Bay• Self-Help Federal Credit Union• MicroVest Short Duration Fund• Southern Bancorp
Fixed Income
• Triodos Microfinance Debt/Equity Fund• Sonen U.S. Core Fixed Income• Root Capital Sustainable Trade Fund• PowerShares Build America Bond Fund
Structured Notes
• BAC Small Medium Enterprise VPO Loan Fund 1• Maya Mountain• Adobe Capital Structured Exits Fund• Iluméxico
Real Assets
• Ecosystem Investment Partners II• Sonen Capital Sustainable Resource Fund• EKO Green Carbon Fund• Lyme Forest Fund III
Private Equity andPrivate Debt
• Core Innovation Fund II• Elevar Equity Fund II• BioLite• FAIM
TABLE 3
The following diagram illustrates what level of impact (impact first, sustainable, thematic) can be obtained when investing in each of the asset classes listed above, showing a sample portfolio allocation by asset class and impact spectrum.
Real Assets Cash
Structured Notes
Structured Notes
Real Assets
Private EquityTHEMATIC
70%
IMPACT FIRST15%
RESPONSIBLE0%
SUSTAINABLE15%
Fixed Income
Fixed Income
DIAGRAM 1

18
1.5 GEOGRAPHIC DIVERSIFICATION
Opportunities in the impact sector have emerged in similar proportion to Chart 2 below. Within each region, some countries are better sources of investment opportunities than others due to various factors, such as a ripe entrepreneurial and investment environment or political stability. That said, investor interest, relevant experience, presence of deal flow partners/due diligence teams in country, the quality of investment targets, asset allocation, and the potential to realize competitive returns are far more important than adhering to specific geographic diversification.
NorthAmerica
11%
East Asia& Pacific
12%
South Asia13%
Middle East & North Africa3%
Sub-Saharan Africa22%
Latin America & the Caribbean
26%
Europe &Central Asia
13%
DIAGRAM 2 - Source: GIIN, Iris Data Brief (2013)
PH
OT
O C
RE
DIT
: N
O A
TT
RIB
UT
ION
RE
QU
IRE
D
19
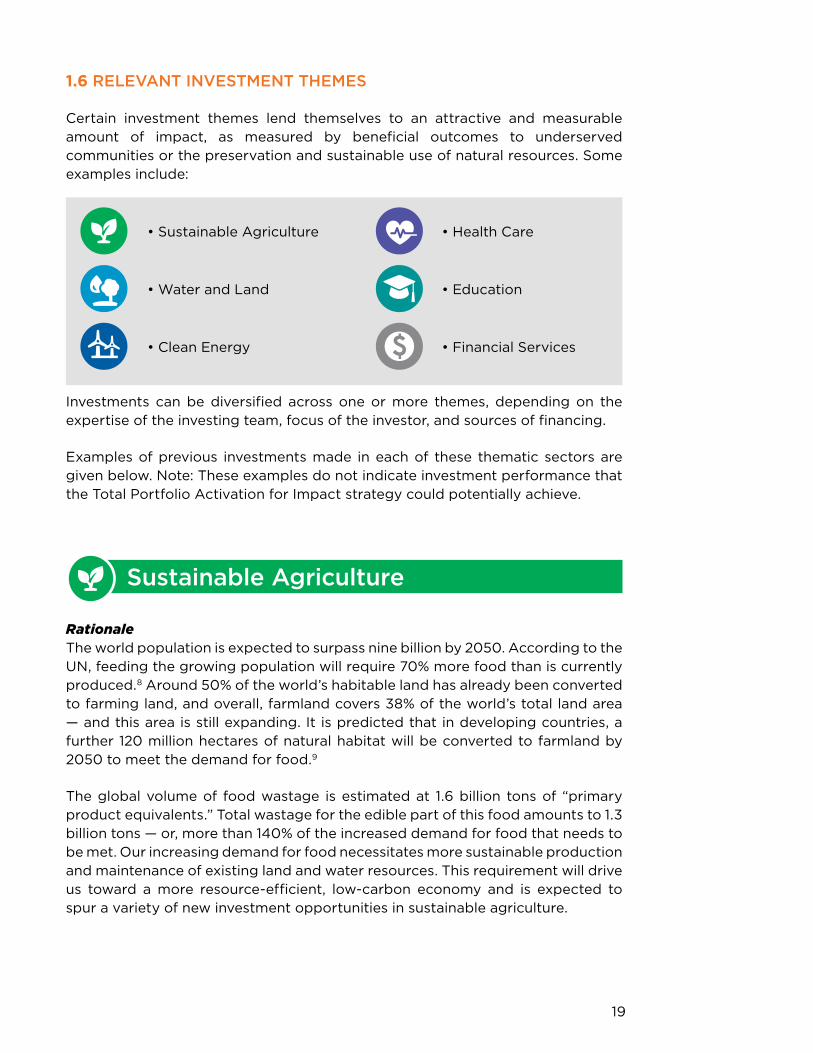
1.6 RELEVANT INVESTMENT THEMES
Certain investment themes lend themselves to an attractive and measurable amount of impact, as measured by beneficial outcomes to underserved communities or the preservation and sustainable use of natural resources. Some examples include:
• Sustainable Agriculture • Health Care
• Water and Land • Education
• Clean Energy • Financial Services
Investments can be diversified across one or more themes, depending on the expertise of the investing team, focus of the investor, and sources of financing.
Examples of previous investments made in each of these thematic sectors are given below. Note: These examples do not indicate investment performance that the Total Portfolio Activation for Impact strategy could potentially achieve.
Sustainable Agriculture
RationaleThe world population is expected to surpass nine billion by 2050. According to the UN, feeding the growing population will require 70% more food than is currently produced.8 Around 50% of the world’s habitable land has already been converted to farming land, and overall, farmland covers 38% of the world’s total land area — and this area is still expanding. It is predicted that in developing countries, a further 120 million hectares of natural habitat will be converted to farmland by 2050 to meet the demand for food.9
The global volume of food wastage is estimated at 1.6 billion tons of “primary product equivalents.” Total wastage for the edible part of this food amounts to 1.3 billion tons — or, more than 140% of the increased demand for food that needs to be met. Our increasing demand for food necessitates more sustainable production and maintenance of existing land and water resources. This requirement will drive us toward a more resource-efficient, low-carbon economy and is expected to spur a variety of new investment opportunities in sustainable agriculture.

20
Types of Investments Investments might be made in the following areas:
• Basic infrastructure that facilitates resource-efficient distribution of food and food products throughout the agricultural value chain and that can lead to reduced rates of food waste
• Products and technologies or processes that increase agriculture’s resilience to climate change, reduce agriculture’s relative contribution to climate change, and/or mitigate the sector’s vulnerabilities related to resource scarcity
• Companies that practice environmentally sound management techniques that reduce costs, improve yield quantity and/or quality, and provide access to premium markets
• Companies that practice socially sound management techniques that improve worker health and productivity
• Companies that improve food security and employment, particularly for vulnerable populations
Sample Capital AllocationExamples of direct investments include:
• Structured notes investment in the form of self-liquidating debt in Maya Mountain Cacao, a company working with cacao farmers in Belize and Guatemala to improve quality, increase production, and bring greater prosperity to the communities
• Private equity investment in FAIM, which provides disease- and virus-free seedlings to significantly boost yields of various crops in East Africa
Examples of indirect investments include:
• Fixed-income investment in Triodos Sustainable Trade Fund, which provides trade finance loans to agricultural co-operatives and private companies operating in sustainable organic and fair trade agricultural value chains

21
• Fixed-income investment in Impact Assets ‘Sustainable Agriculture Note,’ a five-year private debt security that invests in grower cooperatives and agricultural enterprises promoting sustainable agriculture practices that improve environmental performance and build food systems while benefiting small to mid-sized farmers
Water and Land (including Timberland)
RationaleSupply of water and land are likely to present the largest challenges to base-of-pyramid communities, given the rising global population. The McKinsey Global Institute estimates that “the annual pace at which [water and land] supply is added over the next 20 years... would have to increase by 140 percent and up to 250 percent, respectively, compared with the rate at which supply expanded over the past two decades.”10
Globally, forest cover stores 283 billion tons of carbon. Deforestation and forest destruction is the second leading cause of carbon pollution, causing 20% of global greenhouse gas (GHG) emissions.11
For impact investment considerations, any environmental asset should also be, at the very least, neutral on a social impact scale.
Types of InvestmentsInvestments might be made in the following areas:
• Increasing efficiency of water infrastructure by (a) targeting infrastructure investing that can demonstrably reduce waste, optimize distribution efficiency, and reflect local ecological concerns; and (b) investing in companies that are reducing water use and increasing water efficiency in operations
• Expanding innovations to increase water-use efficiency, reduce waste, and improve water quality by (a) investing in consumer- and industry-level tools that encourage efficiency, including meters and low-flow fixtures; (b) exploring market-based mechanisms of water rights and trading schemes that result in increased water conservation at scale; and (c) investing in treatment technologies that address a growing list of pollutants from industrial, agricultural, and human waste
• Increasing access to water and sanitation through urban and rural infrastructure by (a) providing financing to water infrastructure and distribution schemes that are located where incidence of water poverty are greatest, and (b) investing in technologies that provide low-cost solutions to purification and treatment and that can be widely adopted in poor, rural areas where water scarcity is acute
22
• Protecting and restoring land with high conservation value by (a) acquiring, protecting, and restoring lands, watersheds, and ecosystems with high conservation value, and (b) entitling land as mitigation banks:12 engaging in water quality trading, transferring of development rights, and carbon sequestration
• Managing and preserving freshwater bodies and systems by strengthening the natural function of land-based ecosystems through conservation and restoration that increase drought resiliency, provide flood protection, and mitigate risks stemming from water-related natural disasters
Sample Capital AllocationExamples of direct investments into enterprises include:
• Private equity investment in Water Health International, which develops and runs de-centralized WaterHealth Centers with water purification plants that provide safe and affordable drinking water to underserved populations in India, Africa, and the Philippines
• Real asset investment in Living Forest Communities, which invests in development of forestland into a conservation community of clustered home sites in Canada
Examples of indirect investments include:
• Real asset fund investment in Lyme Forest Fund, which focuses on the acqui-sition and sustainable management of lands with unique conservation values
• Real estate fund investment in Beartooth Capital, which invests in and manages ranch real estate to generate financial returns and positive conservation, agricultural, and community impact
• Natural resources fund investment in the EKO Green Carbon Fund, which develops innovative approaches to financing conservation and environmental sustainability with a focus on carbon, fisheries, green infrastructure, and water
• Natural resources fund investment in Ecosystem Investment Partners, which acquires, entitles, restores, and manages properties across the United States that generate credits for wetland, stream, and endangered species mitigation
• Private equity fund investment in Aqua-Spark (the Netherlands), which invests in sustainable aquaculture businesses that generate investment returns while creating positive social and environmental impact (Note: This fund has long-term investment horizons and thus carries a redemption option after five years.)
PH
OTO
CR
ED
IT:
LYM
E F
OR
ES
T F
UN
D

23
Clean Energy
RationaleGlobal energy demand is set to grow by 37% by 2040, according to forecasts by the International Energy Agency (IEA).13 Fast-rising energy demand will require some US$45 trillion in new infrastructure investment by 2030. This is an opportunity to build more efficient, less polluting, more flexible energy systems that are also less vulnerable to rising and volatile fossil fuel prices.14
The choices made in the next 15 years are also critical for the climate, as energy production and use already account for two-thirds of global GHG emissions. A large-scale shift to low-carbon energy supplies is crucial for avoiding levels of dangerous climate change.15
Over the past decade, distributed energy solutions such as biomass generators and photovoltaic sources for personal, home, and community-scale energy have become possible. In renewable energy technologies, efficiency and advanced energy technologies are helping to enable reductions in emissions.
Types of InvestmentsInvestments might be made in the following areas:
• Increasing access and affordability of energy supply globally by investing in (a) technologies, financing, or distribution schemes that reduce incidences of energy poverty and focus on low-carbon solutions for the provision of power, particularly for communities in which such services are not reliable or do not exist; and (b) energy infrastructure—centralized or distributed—with a focus on renewable systems and grid extension that enable better social outcomes (e.g., education, economic productivity) and basic welfare (e.g., refrigeration)
• Innovation by investing in (a) applications related to energy storage and smart grid technology, including mini-grids and off-grid solutions; and (b) the development and use of lower-carbon energy generation
Sample Capital AllocationExamples of direct investments include:
• Structured convertible debt investment in PBK Waste Management Solutions, which manufactures and sells household and small industrial composters in India

24
• Convertible debt investment in BioLite, which develops and manufactures advanced energy products that make cooking with wood as clean, safe, and easy as modern fuels, while also providing electricity to charge cell phones and off-grid LED lights
Examples of indirect investments include:
• Private equity fund investment in Zouk Capital, which invests in growth companies with proprietary, clean technologies that advance resource efficiency and generate renewable energy and environmental assets
PH
OTO
CR
ED
IT: B
IOL
ITE

25
Health Care
RationaleAt least 400 million people do not have access to one or more essential health services.16 The overwhelming majority of these people are in the developing world, where leading causes of death still include preventable and treatable diseases such as heart diseases, tuberculosis, and diabetes.
An increasing number of innovations are emerging to tackle this problem, which are resulting in dramatically more cost-effective ways to conduct diagnosis, testing, and service delivery for health care. These include new health technologies, repurposing of existing technologies and infrastructure, new healthcare education approaches, improved healthcare products targeted to the needs and ability to pay of the world’s poor, and innovations in the delivery of care. New approaches to healthcare financing (e.g., micro-insurance products and various risk-sharing arrangements) complement these innovations.
Naya Jeevan is a Miller Center GSBI Alumni offering health insurance for the working poor.
PH
OTO
CR
ED
IT: N
AY
A J
EE
VA
N

26
Types of InvestmentsInvestments might be made in the following areas:
• Advanced telemedicine, mobile technologies, electronic medical records, patient engagement platforms, and managed care platforms
• High-quality and affordable diagnostic tools and services
• Companies that practice socially sound management techniques that improve worker health and productivity
• Healthcare service delivery/distribution models (e.g., increased efficiency, door-to-door services), and communications (e.g., remote/telemedicine, integrated cell phone communications)
• Healthcare finance
• Healthcare insurance
• Healthcare education to service providers, health professionals, and patients
Sample Capital AllocationExamples of direct investments include:
• Equity investment in Salauno, which offers specialized eye-care (cataract surgeries) in Mexico.
• Private equity investment in Naya Jeevan, which offers 70 million working poor in Pakistan a way to gain affordable basic health insurance from private carriers
Examples of indirect investments include:
• Private equity fund investment in Better Ventures, which invests in technology startups building innovative solutions to solve big problems, in sectors ranging from work and education to health and sustainability

27
Education
RationaleThe role of education in promoting economic growth and social justice has long been recognized. For instance, one year of primary schooling boosts wages by 5% to 15%, while each year of secondary school increases wages by up to 25%.17 The education sector is undergoing dramatic changes for a variety of reasons, such as the advent of new technologies (e.g., low-cost tablets); improved internet connectivity; rapid, localized content development; and increased interest of mobile telecom operators and data providers to engage customers more creatively and provide interactive learning solutions through technological applications.
Types of InvestmentsInvestments might be made in the following areas:
• Increased access to education and educational content
• Improved educational materials, platforms, and content to instructors in underserved communities
• Technologies that lower the cost of vocational training, livelihood management, and economic resilience
• Platforms that dramatically enhance access to education for underserved populations
Sample Capital AllocationExamples of direct investments include:
• Private debt investment in ICT 4 Development, which is providing mobile training centers in Kenya to educate more than 20,000 students on critical computer skills
• Private debt investment in Formative, which recently introduced a classroom tool for individualized student instruction and progress monitoring
• Few indirect (fund) investment opportunities exist today in education technology. As a result, it might be more feasible to seek direct investments in education technologies that are extensible to underserved communities and co-investment opportunities with other fund managers

28
ICT for Development is a Miller Center GSBI Alumni in Kenya that has developed mobile training to reach underserved communities in East Africa.
PH
OTO
CR
ED
IT: S
AN
TA
CL
AR
A U
NIV
ER
SIT
Y,
ICT
FO
R D
EV
ELO
PM
EN
T, K
EN
YA
Financial Services
RationaleMore than half the world’s working-age population does not have access to high-quality, affordable financial services (Global Financial Inclusion, McKinsey). To better take advantage of life’s opportunities and shield themselves from economic shocks, these underserved people and their households must be able to save, borrow, insure against risk, and make payments knowledgeably, safely, and affordably.
Furthermore, widespread use of mobile phones in emerging markets and digital transaction platforms has enabled the large-scale expansion of mobile financial services to underserved people, which is an investment opportunity.
Types of InvestmentsInvestments might be made in the following areas:
• Mobile payment systems that serve the poor or unbanked
• Products and services that extend financial services throughout base-of-pyramid markets
• Microfinance funds that effectively promote livelihoods in underserved communities

29
• Financial services that create economic resilience and defense against adverse events (e.g., crop insurance)
• Application of investments that create economic and social services for women
• Technologies that extend financial tools to underserved populations
Sample Capital AllocationExamples of direct investments include:
• Direct convertible debt investment in MPOWER Financing, which works with investors and universities to lend to high-potential students who are not being served by traditional banks and other sources of student loans
• Direct equity investment in Kopo Kopo, which provides tools to facilitate mobile payments through existing platforms, focusing on merchant payments that enable small and medium-sized businesses to accept mobile money payments from their customers
Examples of indirect investments include:
• Cash equivalents and fixed-income fund investment in MicroVest, private-equity fund investment in BlueOrchard Finance, and fixed-income fund investment in DWM Microfinance Funds—microfinance funds that provide access to financial services for rising middle-class families and communities around the world
Miller Center GSBI Alumni Kopo Kopo provides a suite of apps for payments and lending.
PH
OTO
CR
ED
IT: K
OP
O K
OP
O

30
2.0 WHAT IT MEANS TO HAVE IMPACT
2.1 DEFINING IMPACT
The Total Portfolio Activation for Impact strategy calls for the use of internationally accepted standards and methodologies such as IRIS (Impact Reporting and Investment Standards) and GIIRS (Global Impact Investing Rating System) where such use is possible and feasible.
IRIS is a common language for measuring the social, environmental, and financial performance of investments. It is an initiative of the Global Impact Investing Network (GIIN). Usually investors expect that IRIS definitions will be used by social enterprises for all quantitative impact metrics, and (potential) portfolio companies should be encouraged to do the same.
GIIRS is a system for assessing the social and environmental impact of companies and funds with a rating and analytics approach analogous to Morningstar investment rankings and Capital IQ financial analytics. Advisors and managers can look at GIIRS ratings—where available—as input for evaluating impact. Potential portfolio companies can be encouraged to complete the GIIRS ratings process.
It’s also important to distinguish between outputs, outcomes, and impact.
PH
OTO
CR
ED
IT: Z
AT
LE
TIC

31
Outputs are quantifiable numbers of products and services that result from the activities undertaken by the investee. They can be measured with quantitative metrics. The strategy calls for the use of a very small set of core impact indicators across the portfolio. These core impact indicators should be complemented with sector-specific impact indicators for each investment theme. Some of the sector-specific metrics may need to be adjusted during the investment period.
Examples are:
• The number of low-income people treated at a health clinic• Liters of drinking water purified• Number of anti-malarial bed nets sold• Number of students graduating from school
Outcomes are the observed changes or effects of the outputs on the clients of the enterprise or fund, or on the environment. Outcomes can be measured with quantitative metrics, qualitative metrics, and impact case studies—though they can be more difficult than outputs to measure quantitatively. Sometimes the observed outcomes might not actually be due to activity that is attributable to a specific investment. The objective is not to scientifically prove the causality of outcomes to investment activities.
Qualitative metrics and case studies—while in many cases anecdotal—contribute to the understanding of outcomes. In-depth case studies about portfolio companies, developments, and trends that underlie the quantitative metrics tell a more holistic story about the impact of investments. Many of the examples given below illustrate impact areas that create deeper beneficial outcomes. Their measurement and evaluation can be costly and will likely reduce net financial returns. However, an increasing number of investors move beyond ESG to achieve precisely these kinds of outcomes.
Examples are:
• 80% of patients treated experience improved physical well being• 70% of clean water clients experience reduced incidence of diarrheal
disease• 50% of bed net clients experience fewer cases of malaria in the community• 80% of participants show improved literacy rate• 60% of rural population have 20% increased incomes• 75% of clients have established savings accounts with more than one
month’s wages in deposited capital
Impacts are the long-term changes or effects on society or the environment that result from outcomes having been achieved. The strategy calls for measurement of impact with qualitative metrics and impact case studies. Impacts are very difficult to measure quantitatively.

32
Examples are:
• A healthier society• Lower poverty rates• Increase in full-time jobs• Improved health of ecosystem and native species
The following sample outputs below can be measured for all of the investments in the Total Portfolio Activation strategy. The IRIS indicator codes are given in parentheses below, where applicable.
Type of Indicator Sample Indicator
Output Number of clients (either number of individual clients PI4060 or number of organization clients PI9652)
The number of individual consumers or organizations served by the enterprise/investee (This measures only the direct beneficiaries of the portfolio company’s prod-uct/service. While the number of indirect beneficiaries can be taken into consideration when assessing the attractiveness of investment opportunities, advisors/managers should not try to measure this, as the scope for interpretation by both the investor and the portfolio company is too wide and open for interpretation.)
Jobs maintained (PI5691): Number of full-time equiva-lent employees working for the enterprises financed
Number of permanent employees (OI8869)
Number of temporary employees (OI9028)
TABLE 3
The Total Portfolio Activation for Impact strategy does not call for comprehensive measurement of outcomes and impact across the portfolio, but rather anticipates that it will use quantitative and qualitative metrics where available. Additionally, outcomes and impact should be measured where possible, and reported upon anecdotally and with case studies if quantifiable data is not available. Establishing a direct link between key performance indicators (KPIs) and beneficial outcomes is encouraged.
Attempts should be made to minimize negative environmental and social outcomes and impact—but this can be very difficult to do comprehensively due to the dearth of reliable data and lack of transparency.
The strategy calls for a focus on catalytic investments: those that cause or accelerate impact beyond the investment itself. Catalytic investments might

33
inspire imitators, attract follow-on investments, lead to philanthropic and/or public support (where appropriate), or enable a geographical region, sector, or segment of the population that otherwise would not be enabled.
2.2 ASSESSING IMPACT BY INVESTMENT THEME
Illustrative outputs and outcomes that correspond with the investment themes outlined in Section 1.6 are given below. If the indicator has an associated IRIS ID, it is noted in parentheses next to the indicator. This illustrative set of indicators is intended to serve as a resource to advisors and managers and is applicable across a portfolio; it is not an exhaustive list.
Sustainable Agriculture
Type of Indicator Sample Indicator
Output Total sustainable cultivated area or land sustainably managed (OI6912)
Certifications (e.g., Sustainable Farm Certification International, USDA Organic Food Certification, Sustainable Agriculture Network principles, UTZ Certified Code of Conduct)
Value of revenue from sales of certified products: fair trade, organic, or sustainable (PI7321)
Producer price premium: units/volume purchased at price premium (PI2422)
Average agricultural yield per hectare of clients (who were farmers) of the organization during the reporting period (PI3468)
Water saving through sustainable operations or processes: water savings from products sold (PD5786)
Land protected or conserved (if applicable): total protected land area (PI4716)
Ecosystem services provided by the land, e.g., freshwater, climate regulation, habitat, nutrient cycling, water cycling (PD8494)
Outcome Increase in aggregate value of directly exported production
Increase in field-side or cooperative-level post-harvest production
Adoption of international standards of measurement and product purity
TABLE 4

34
Water and Land (including Timberland)
Type of Indicator Sample Indicator
Output — Clean Water
Number of unique client individuals who were served by the organization and provided access (PI2822)
Volume of potable water provided and delivered to off-taker(s) (users of the water) (PI8043)
Number of clients, individuals, or households who were served by the organization and provided access to products or services they were previously unable to access
Outcome and Impact — Clean Water
Percentage of clean-water clients experiencing reduced incidence of diarrheal disease
Percentage reduction in labor hours lost from water-borne disease
Output — Mixed Land Use/Timberland
Hectares of land reforested during the reporting period (PI4907)
Area of land with a protected land status (PI4716)
Area of land directly controlled by the organization and under sustainable cultivation or sustainable stewardship (OI6912)
Area of land on which trees were planted (PI4127)
Land reforested (PI4907)
Area of protected land that shares a boundary with the organization’s protected land (PI5750)
Amount of the product/service sold by the organization as certified (PI7289)
Value of the revenue from sales of the organization’s certified products (PI7321)
Outcome — Mixed Land Use/Timberland
Increase in farmers engaged in multi-season crop production
TABLE 5

35
Clean Energy
Type of Indicator Sample Indicator
Output Number of unique client individuals who were served by the organization and provided access (PI2822)
Number of new clients, individuals, or households, who were served by the organization and provided access to products or services they were previously unable to access
Amount of energy generated and sold to off-taker(s) (PI8706)
Reductions in greenhouse gas (GHG) emissions over the lifetime of products sold (PI5376)
Cumulative energy savings from products sold to end-users (PI7623)
Outcome Percentage increase in local use of clean energy sources
Territory or communities where clean energy products or sources become newly available
TABLE 6
Health Care
Type of Indicator Sample Indicator
Outcome Number of unique client individuals who were served by the organization and provided access (PI2822)
Number of healthcare facilities under management (PI1017)
Number of new clients, individuals, or households, who were served by the organization and provided access to products or services they were previously unable to access
Number of unique poor individuals who were clients of the organization (PI3193) or very poor (PI9835)
Health education and incentives for healthy living
Access to medicines for low-income patients
Outcome Decrease in disease rates
Increase in affordability of health care and medicines and fair pricing
Improved quality of care
Improved health statistics for a given segment of the population
TABLE 7

36
Education
Type of Indicator Sample Indicator
Output Total number of students enrolled (PI2389); female (PI1081); poor (PI7254); very poor (PI5583)
Number of schools
Number of teachers (OI5896)
School fees: average fee/student/month (PI2718)
Student transition rate: Number of students advancing from one level to the next, a measure of school efficacy (PI4924)
Outcome Percentage of students showing improved literacy rates
Percentage reduction in school grade/age disparity
Increase in access to educational programming
TABLE 8
Financial Services
Type of Indicator Sample Indicator
Output Number of unique individuals who are clients (PI4060)
Number of women clients (PI8330)
Type of financial institution, e.g., non-banking financial corporation, thrift bank, credit union, cooperative, etc. (OD9109)
Microfinance delivery methodology, e.g., individual lending, solidarity group lending, self-help group lending, etc. (PD7356)
The number of new businesses created as a result of investments (PI4583)
Effective interest rate for the most representative loan product (PI7467)
Social Responsibility to Clients: y/n policy (OI7783)
Outcome Percentage of rural clients that have realized a consistent increase in income
Percentage of clients that have established savings accounts with more than one month of living wages
Percentage increase in financial products by small and medium-size enterprises, measured in monetary value
TABLE 9

37
PART TWO:How to Implement the Strategy
PH
OTO
C
RE
DIT
: S
AN
TA
C
LA
RA
U
NIV
ER
SIT
Y,
AS
DE
NIC
, NIC
AR
AG
UA

38
3.1 CONSIDERATIONS IN DEVELOPING A TOTAL PORTFOLIO ACTIVATION FOR IMPACT STRATEGY
In addition to adhering to the principles presented in Section 1.2, below are major themes that should be considered when developing a model portfolio:
• The investor’s mission and values. Fund managers and investors must be clear about both their impact and their financial objectives prior to analyzing how the portfolio will be constructed and determining what investments to include.
• Risk tolerance. When calculating risk, the time horizon of an investment and the percentage of investment principal an investor is willing to lose in each investment must be taken into account. The portfolio asset allocation strategy needs to reflect the risk tolerance of the investor.
• Local knowledge, insight, and partners are critical for success—especially if the impact portfolio is assembled across cultures, economies, and jurisdictions. This consideration extends to fund managers and entrepreneurs that may be under consideration for investment. Many venture investors start their screening process with understanding the quality of the management team. Portfolio managers should, too.
• Exit strategy. How an investor will exit each investment is a consideration best addressed before funds are deployed. It has recently been a topic of high interest within the impact investing community. Often, the direct purchase of shares in a small company (equity investment) is not the best form of investment if there is only a faint prospect of a future public offering or acquisition. Instead, investment mechanisms using self-liquidating equity or ‘structured exit’ debt are being explored by direct investors, and fund managers are beginning to offer open-ended funds that allow investors to redeem their investment and gains after a defined holding period.
• Post-investment assessment. A further priority consideration in forming an investment policy and allocation is on post-investment support. This is especially true for investments seeking to create both financial value and positive impact. Investment opportunities break into low, medium, and high touch when considering the investor role post-investment:
o Cash, fixed income, impact bonds, and most real asset funds are seen as low-touch obligations after investment.
3.0 THE TOTAL PORTFOLIO ACTIVATION FOR IMPACT STRATEGY IN ACTION: A MODEL PORTFOLIO
PH
OTO
CR
ED
IT: S
AN
TA
C
LA
RA
UN
IVE
RS
ITY

39
o Private equity funds, direct real asset, and structured note funds can benefit from occasional investor participation and can be a source of follow-on direct investment opportunities. These assets are medium-touch investments.
o Direct investments—regardless of vehicle (debt, structured exit, or equity)—are high-touch, time-consuming portfolio components. Portfolio managers and fund managers are wise to consider the time and support requirements within the asset mix they map out. Syndication with other investors, especially those that are local to the investee, is often a good way to manage time commitment when making direct investments.
3.2 ALLOCATING INVESTMENTS TO BALANCE IMPACT AND RETURNS
The asset allocation within any portfolio will ultimately depend on the size of the portfolio, risk tolerance, and financial and impact requirements of the investor. For example, if the portfolio is under $25 million, it might not be possible to make a significant number of fund investments where Limited Partner minimums begin at $1-2 million. Also if the risk tolerance of the investor and the financial return requirements are high, the investor might choose to allocate a greater percent of capital to high-risk, high-return, direct private equity investments. If the investor is more risk-averse and prefers a more stable financial return, it might make sense to increase fixed-income investments. Please refer to Section 1.6 to see the risk and impact characteristics of various asset classes.
The model portfolios below were constructed to create a balanced portfolio with high impact and high single-digit returns, with the following considerations informing the asset allocations:
1. Initial capital—whether it is a pool of cash allocated by a portfolio manager who is responsible for assembling a portfolio, or cash that is called down by a fund manager to be invested on behalf of limited partners—will dominate the target allocation for short-duration vehicles within the allocation strategy until opportunities surface to invest more broadly. Consequently, the target allocation must take into account the time-weighted nature of funds that initially come into liquid holdings and are later re-invested in longer-term direct investments, private equity, or real asset funds.
2. Certain investment vehicles can increase predictability of return. Three of these are in ‘Structured Notes,’ which consist of impact bonds, structured exit debt or equity, and financing for some real assets.
3. An ‘allowable range’ is essential for portfolio managers because of the highly uncertain timing of investment opportunities, capital growth while in the investment, and opportunities to exit. An allowable range is a target and must allow managers flexibility to practice (time-weighted) allocation without being so strict that it forces an unwise investment.

40
3.3 MODEL PORTFOLIOS
3.3.1 MODEL PORTFOLIO EXAMPLE 1: $25 million portfolio funded over 3 years with a 3-year investment period
The following table (Table 10) depicts the blend of asset classes, the target percent of the portfolio allocated to each asset class, and the allowable/expected return range for each asset class. The table below also shows the dollar amount allocated to each asset class.
Asset Class Target Allocation
Allowable Range
Targeted Dollars
Cash & Equivalents 5% 2%-10% 1,250,000
Fixed Income 20% 15%-25% 5,000,000
Structured Notes (mostly direct investments)
35% 30%-35% 8,750,000
Real Assets: 25% 25%-30% 6,250,000
- Funds 5% 1,250,000
- Direct investments 20% 5,000,000
Private Equity: 15% 15%-20% 3,750,000
- Funds 10% 2,500,000
- Direct debt/ equity 5% 1,250,000
Total 100% 25,000,000
TABLE 10
The Total Portfolio Activation for Impact strategy is underpinned by a core holding in structured notes (35% of portfolio), mostly in the form of direct investments in enterprises. These investments are expected to yield high single-digit returns, but they often have a short investment cycle (typically three to five years) and can yield constant, stable quarterly or semi-annual cash returns.18 This is supplemented by leveraging higher-return private equity instruments (15% of portfolio), paired with shorter-duration fixed-income and cash products (25% of portfolio), and high-return real asset (25% of portfolio) instruments that are less correlated with other instruments.

41
3.3.2 TABLE OF ANNUAL CASH FLOW AND YIELD
The following table (Table 11) shows the annual cash flow modeled for a $25 million pool of investment capital that is funded over three years and requires an investment period of three years. This projection is somewhat more conservative than a scenario where investment capital is immediately available and largely deployed in the first 18 months. A three-year deployment is most likely when available investment capital is being shifted over from other allocations or where a fund for impact investing has been raised and has a call-down schedule over a three-year period.
An example of a faster deployment of capital is projected in the Model Portfolio Example 2 section below.
YearEnded
Net Annual Cash
Flow (in USD)
Annual Yield (cash
inflow/principal)2015 0 0
2016 39,429 0.7%
2017 265,737 2.4%
2018 886,726 3.5%
2019 1,708,726 6.8%
2020 2,584,643 10.3%
2021 4,128,188 16.5%
2022 3,363,386 13.5%
2023 3,155,577 12.6%
2024 6,156,334 24.6%
2025 36,331,834 145.3%
Total Net Cash Inflow 58,620,611
Total Invested Capital 25,000,000Total Gross Return Multiple of Cash Inflow 2.3x
Total Gross IRR over 10 years of Cash Inflow 8.9%
TABLE 11
3.3.3 DRAW-DOWN SCHEDULE: A 3-YEAR INVESTMENT PERIOD
The cash flow table above assumes a gradual capital draw-down schedule from investors: $3 million in 2Q16, $3 million in 4Q16, $5 million in 2Q17, $7 million in 1Q18, and $7 million in 4Q18. Assuming capital can be deployed toward investments almost as soon as it is drawn down, there will be a three-year (e.g., 2016-2018) investment period. When returning cash flows are received from investment interests or exits, they are temporarily parked in cash accounts, ready to be immediately distributed to the Limited Partners (as in a fund) or re-invested by the portfolio manager.

42
2016 2017 2018
1Q 2Q 3Q 4Q 1Q 2Q 3Q 4Q 1Q 2Q 3Q 4Q
Draw Down Capital - 3,000,000 3,000,000 5,000,000 7,000,000 7,000,000
Asset Allocation 3,000,000 3,000,000 5,000,000 7,000,000 7,000,000
Cash & equivalents 250,000 - 250,000 - 250,000 - - 250,000 - - 250,000
Fixed Income 2,500,000 - 2,500,000 - - - - - - - -
Public Equity -
Structured Notes 250,000 250,000 1,250,000 2,625,000 4,375,000
Real assets:
- Real assets funds 500,000 750,000 -
- Real assets direct investments
1,300,000 2,000,000 1,700,000
Private equity:
- Private equity funds
1,000,000 825,000 675,000
- Private equity direct debt/equity
- - - - 700,000 - - 550,000 - - -
TABLE 12
In the first year of the investment period (2016), all of the fixed-income investments are deployed (a total of $5 million), along with some structured note investments (first choices from an existing investment pipeline). In the second and third years of the investment period, when there is a solid pipeline for both fund and direct investments, investments in the structured notes, real assets, and private equity asset classes will ramp up. As noted earlier, some of the funds invested previously in cash, fixed-income, or structured notes might be re-invested in new, direct investment targets and funds to achieve portfolio allocation balance.
As shown in Section 3.2’s Table of Annual Cash Flow & Yield, the single-digit cash yield in the first three to four years of fund life reflects the return derived from the initial deployment of capital. As fixed-income and structured-note investments begin to yield steady cash flows, the cash yield increases to double digits in years five to nine of the fund. Finally, private equity and real asset funds are redeemed, yielding a triple-digit cash yield in the 10th year of the fund.
For fund managers, these considerations will have significant impact on initial versus average allocation, draw-downs, and ultimate performance of the fund. For portfolio managers, this indicates a back-end contribution by longer-term, higher-yield, higher-risk investments.

43
3.3.4 MODEL PORTFOLIO EXAMPLE 2: Reallocating $50 million of existing investment assets into an impact portfolio
Investment managers with responsibility over an existing portfolio can deploy capital much more swiftly, once a decision to adopt such a strategy has been taken. In this case, we modeled a series of investments, within the asset allocation ranges, that absorb up to $50 million. Beyond $50 million, a significantly different set of investment targets would need to be analyzed for investment risk and suitability.
Although reallocation of an existing pool of investment capital can happen more quickly, sufficient time to place the investments is still needed. The model anticipates an 18-month initial investment period. With faster deployment, rates of return improve to over 10.3% gross IRR. Some of the assets, such as fixed income, are unaffected by timing. Direct investments and some real asset investments benefit from an earlier start in the investment cycle.
Asset ClassTarget
Allocation Policy
Allowable Range
Targeted Dollars
Cash & equivalents 2% 2-10% 1,000,000
Fixed Income 21% 15%-25% 10,500,000
Structured Notes (all direct) 35% 30-35% 17,500,000
Real assets: 26% 25-30% 13,000,000
- Real Assets funds 5% 2,600,000
- Real assets direct investments
21% 10,400,000
Private equity: 16% 15-25% 8,000,000
- Private equity funds 11.2% 5,600,000
- Private equity direct debt/equity
4.8% 2,400,000
100% 50,000,000
TABLE 13

44
The goal of the investment process is to support the identification of high-quality opportunities, reduce risk, and create a diversified portfolio of impact investments. To achieve this, multiple screens must be used: Advisors/managers will need to filter for impact potential, financial attractiveness, and fit within the portfolio. Costs of developing investment opportunities and costs of diligence put upward pressure on management fees or staffing costs for investors. Sharing these costs are, in part, why investor ‘collectives’ such as Investors’ Circle, PYMWYMIC, and Toniic have formed.
As discussed, a variety of investment instruments can be used, including structured exits and social impact bonds. Each will carry its own imperative on the due diligence process. For example, priorities in conducting diligence on a fund manager will center on:
• Manager experience
• Track record
• Unique approach to the defined portfolio strategy
• Legal and regulatory investigation
4.0 DUE DILIGENCE
PH
OTO
CR
ED
IT: S
AN
TA
CL
AR
A U
NIV
ER
SIT
Y

45
In contrast, diligence priorities for a direct investment in an enterprise will center on:
• Management team business model
• Financial viability
• Execution risk
• Exit strategy
An investment committee, typically comprised of fund managers and key stakeholders, should approve the formation of an investment policy and the resulting broad asset allocation strategy—revisiting the asset allocation strategy along with direct and indirect investment ratio, annually.
INVESTMENT PROCESS ROADMAP
Third-Party Due Diligence Review
Portfolio Managers Review
Investment Team Review
Sourcing & developing pipeline of social enterprise
and impact fund
Initial due diligence:
Portfolio fit assessment
via proprietary risk-return-
impact methodology,
developed at Santa Clara
University’s Miller Center for
Social Entrepreneurship
Recommendation to
Investment Committee
Portfolio construction
Preliminary approval by Investment
Committee
Full Due Diligence: PMs engaged in
on-site assessment,
relationship
management
Working with
Investment Team to further portfolio construction
In-country due diligence by
consultants (e.g.,
Beyond Capital)
Periodic reporting of Social Impact & Financial Return to
Investment Team & PMs
DIAGRAM 4

46
4.1 GENERAL METHODOLOGY
The first step in the strategy’s diligence process is the establishment of a standardized assessment methodology. This methodology facilitates the comparison of funds and underlying managers, thus simplifying the investment decision process.
The following flow chart (Diagram 4) describes the major factors that were considered during the diligence process exercised in designing the Total Portfolio Activation for Impact strategy. It is provided as an example.
FINANCIAL ASSESSMENT
• Expected cash yield contribution to total portfolio• Return benchmarking conventional and/or impact-oriented peers in same asset class• Duration and timing of cash flow and fit with total portfolio
IMPACT ASSESSMENT
• Intentional and measurable impact, ability to map to IRIS or GIIRS categories• Impact themes and fit with total portfolio• Employing a business model that will scale its beneficial outcome
RISK ASSESSMENT
• Fund managers and/or team effectiveness• Risk management and operations function review• Macro and market factors
PORTFOLIO FIT
• Investment does not overweight the total portfolio• Investment is among the “best in class” for the asset group• Investment supports declared impact themes and return objectives of the total portfolio
DIAGRAM 5
When the strategy is implemented, the initial due diligence process would provide metrics for ongoing quarterly assessments for shorter-duration investments made, with assessments conducted at least semiannually for longer-term holdings.
It’s also important to note that the due diligence process differs significantly for funds compared to direct investments.
4.2 DUE DILIGENCE FOR FUNDS
Modern Portfolio Theory (MPT) describes an “efficient frontier” as the set of optimal portfolios that offers the highest return for a defined level of risk. From the efficient frontier concept, important modern theories of security valuation, asset allocation, and portfolio diversification have come into being. However, MPT assumes a two-dimensional framework of risk and return.
Impact investors have introduced a third variable, one of impact, to the traditional framework of risk and return. This is based on the notion that all investment

47
options have positive and negative impacts on society and the environment.19
Some practitioners and researchers have suggested that having a positive impact dilutes return. This line of thinking still corroborates MPT in that a two-dimensional framework of risk and return is maintained.
In the analysis conducted for the model portfolio, impact is a neutral factor. As more studies begin to show, impact may or may not have an effect on return. Public companies that adhere to Environment, Social, and Governance (ESG) standards, for instance, showed more evidence of positive financial performance than neutral-negative financial performance.20
Rather than debating the possible financial trade-off between the inclusion of impact and ultimate financial return,21 each potential investment evaluated for the model portfolio was assessed based on a trio methodology of risk, return, and impact. A score from zero to five was given for a variety of measures we chose to include. Every investor, portfolio manager, and/or fund manager will develop their own weighting and scoring system. Our criteria and tri-axis scoring system is provided only for purposes of illustration.
CRITERIA FOR FUND EVALUATION
The following criteria were considered when evaluating fund-level investments:
• Investment thesis (fund description, summary of opportunity, portfolio position)
• Investment theme
• Impact (quantitative or qualitative, with time horizon)
• Expected return and duration
• Key factors affecting return (macroeconomic, strategic, operational)
• Financial benchmarking
• Risks (quantitative, qualitative)
• Fund manager evaluation (including track record)
• Manager experience
• Previous track record
• Governance (protections, participation, reporting)
• Other participating investors
Not all criteria were equally relevant for all investments. For example, management track record and references were important considerations for an external fund investment, but quantifiable duration and credit risk were important considerations for short-term fixed income investments.

48
METHODOLOGY
The three-way fund assessment methodology used to construct this model builds on earlier research published by J.P. Morgan.22 In the assessment methodology, all investment options are depicted in a tri-axis space comprising its unique risk score, return score, and impact score.
The target allocation policy required a blended portfolio return of high-single-digit internal rate of return (IRR) that also generated moderate-to-high impact and low overall risk. This preferred combination forms a unique plane in the tri-axis space. Thus, any investment option was assessed against this plane of scores for portfolio fit and provided a form of objective comparison.
The following example depicts this methodology being used to compare two sustainable trade funds. The Total Portfolio Activation for Impact strategy team assigned the scores:
Fund A Sustainable Trade Fund Fund B Sustainable Trade Fund
Risk assessment score: 3.9 out of 5.0 Financial return score: 3.5 out of 5.0 Impact score: 4.8 out of 5.0
FUND RISK-RETURN-IMPACT PROFILE
Risk assessment score: 3.8 out of 5.0 Financial return score: 3.8 out of 5.0 Impact score: 4.3 out of 5.0
FUND RISK-RETURN-IMPACT PROFILE
DIAGRAM 6
RISK RISK
RETURN RETURNIMPACT IMPACT
543210
543210
PH
OTO
CR
ED
IT: S
IST
EM
A B
IOB
LO
SA

49
RISK ASSESSMENT
The risk assessment process evaluated factors such as fund or team effectiveness, fund or team risk management and operation functions, credibility of track record, execution risk, and other macro factors. Each factor was further assessed by several sub-factors and summed up with a weighted score.
The following is an example of a risk assessment on an impact fund:
Fund managers andteam effectiveness
RISK ASSESSMENT
Portfoliodiversification
Macro factors
Risk management & operations functions
Credible track record& likelihood of
financial success
Investment process &due diligence practice
5.0
4.0
3.0
2.0
1.0
0.0
DIAGRAM 7
In this particular example, the Miller Center analysts scored six different risk factors for an impact portfolio assembly. Although this particular fund management team had worked effectively together, they had no previous track record as fund managers. Scoring for ‘team effectiveness’ was high (4 out of 5) but scoring for ‘credible track record’ (1) and ‘risk management & operations’ (2) suffered. ‘Macro factors’ earned a high score (4) because of management’s unique access to attractive investment opportunities. ‘Investment process’ and ‘portfolio diversification’ relative to the overall portfolio construction earned meaningfully positive scores (3 and 3.5, respectively) from the analyst team.
We would emphasize that consistency in risk scoring elements and process is very important to achieving a fair comparative analysis across similar investment opportunities and will be a benefit to investment committee consideration.

50
FINANCIAL RETURN ASSESSMENT
Financial return was assessed in light of the asset class of the investment. It was then benchmarked to conventional investment products or to a comparable social impact index. For instance, Core Innovation Fund II, an impact private equity fund that invests in domestic financial institutions, was measured against the Cambridge Associates US Venture Capital Index with the same vintage (starting year). It was also measured against the newly compiled Cambridge Associates’ Impact Investing Benchmark, which is a benchmark comprising 51 private impact investment funds.23 Root Capital’s Sustainable Trade Fund, a private fixed-income fund that invests in sustainable, rural agricultural businesses, was measured against the BarCap Aggregate Global index over the same investment period.
The following is a list of benchmarks that the strategy used in each asset class:
Cash & equivalent U.S. 30-day T Bill
Fixed Income BarCap Global Aggregate Bond index
Structured NotesCambridge Associates US Venture Capital Index, or Cambridge Associates Impact Investing Benchmark
Private EquityCambridge Associates US Venture Capital Index, or Cambridge Associates Impact Investing Benchmark
Real AssetsNCRIEF indices (e.g., Timberland)
Dow Jones UBS Commodity index
TABLE 14
In assessing the prospect of an investment’s financial return, the overall return enhancement or “drag” to the model portfolio expected aggregate return was also taken into consideration. Financial returns that fell short of the target return received a lesser mark, but were not the only determinant.

51
IMPACT ASSESSMENT
In assessing the impact potential of a fund or enterprise, three key factors were taken into consideration:
• Fund or company impact thesis and strategy
• Clarity of impact indicators and measurability
• Impact monitoring and data management capabilities
Each of these factors might also have a subset of factors that sum up to give a weighted score. Each portfolio manager will have his or her own chart of sub-factors that can be easily added to this kind of impact assessment. It is up to the discretion of the asset manager to deem which factors are appropriate in their evaluation. Investment options were not considered that did not yield at least a moderately high impact score (at least 4.0 out of 5.0).
5.0
4.8
4.6
4.4
4.2
IMPACT ASSESSMENT
Fund impact thesis & strategy
Data management &impact monitoring
Clarity of impactindicators &
measurability
DIAGRAM 8

52
OBJECTIVE
• Geography• Sector• Ownership• Deal size• Deal structure
SUBJECTIVE
• Vision• Management• Growth trajectory• Competitive advantage• Exit potential
• Social mission
4.3 DUE DILIGENCE FOR DIRECT INVESTMENTS
When constructing the direct investment portfolio, preference was given to investment targets that were syndicated with other investors, and follow-on investments into established companies chosen from the portfolios of existing funds. The latter is also a way to source more mature direct investment opportunities and thus mitigate risk.
Each investment manager will have his or her own style for implementing process against direct investment targets. We would note that, especially in frontier markets, perfect information is not available.
The diligence done for investment targets used in this report met reasonable standards but was by no means exhaustive. Examples of diligence reports we generated are contained in the Appendices 5.0.
The graphic shown here depicts some initial focus areas, separated into subjective and objective considerations. Social mission (impact) is shown in both places as both a fact of company mission and subjectively valued by a prospective investor.
We would also note that a majority of direct enterprise investments modeled in the strategy utilize structure-exit financing. This has a profound effect on portfolio assembly in the direct investment portion of a broad asset allocation. It also has a significant effect on diligence. Unlike an equity-centered portfolio where the investment manager is assembling a basket of high-risk, high-return-potential investments, structured exit financing places a premium on cash flow and profitability, not on achieving high valuation multiples. Diligence processes must correspondingly reflect this
emphasis on financial performance. This ‘change of lens’ seems to suit a majority of enterprises found in the impact field, which are usually intentionally limited in their market reach and growth prospects.
4.4 OTHER DUE DILIGENCE CONSIDERATIONS
Asset managers are responsible for setting asset allocation targets and selecting portfolio holdings. Allocations displayed in this strategy paper are illustrative in nature. The managers are asked to recommend or approve all investments. Additionally, the managers need to anticipate that all investments are reviewed at least semiannually.

53
The investment committee is expected to review asset allocation periodically. The committee also reviews any single investment (individual security) that is greater than 5% of total fund capital commitments.
While the investment committee’s role in approving individual investments is limited, if the committee feels strongly about an issue (expressed with a unanimous vote), the managers are expected to seriously consider its views.
No single investment should exceed 10% of the fund’s capital commitments unless formally approved by the investment committee. In addition, the committee takes country risk into consideration, particularly where foreign exchange fluctuations occur and/or market risk is volatile.
The extent to which fund managers and internal staff can complete due diligence depends on how the fund portfolio is constructed (e.g., number of technical areas, geographic regions, and asset classes selected). If a small fund is being raised (under $50 million), limiting the scope of the fund simplifies the due diligence process and reduces staffing costs. However, depending on the technical expertise of the staff, managers can retain external advisors to perform due diligence. For example, while a given fund may have internal expertise in fixed-income investing, most social impact bonds have unique local characteristics. In that case, the fund might also rely on local experts for advice.
Direct investments in real assets are also expected to require some external diligence. And while direct private equity investments are expected to be undertaken as part of a syndicate, the managers can augment diligence with local expertise. Fund managers might also want to hire a fund advisor to advise them on portfolio construction, provide access to certain investments on its platform, and provide due diligence services such as investment research, verification, and legal review.
The managers are expected to compile an internal database of contacts. On the fixed-income end of the investment spectrum, these contacts are likely to be institutions: banks, funds, or investment houses offering certificates and notes. On the real asset/private equity end of the spectrum, these contacts are most likely to be accelerators, direct investment funds, or organized investment networks.
As the risk or complexity of an investment increases, the managers are expected to invest as part of a syndicate or fund, with the goal of improving deal flow and diligence quality while moderating risk.
If starting a new fund, asset managers can consider setting up a limited partnership in the LP/GP structure. Such a structure usually has both an advisory board made up of key participants of the limited partnership and a separate investment committee, drawn from key members of the impact investing community, traditional VC/PE community, other independent fund investors, and potentially staff from universities.

54
5.1 SAMPLE FUND TERM SHEET
Ideally, individual portfolio managers or advisors bringing relevant investment and impact sector experience would build close relationships with accomplished in-country fund managers, accelerators and other capacity-building intermediaries, local VC/PE associations, and key players in the impact investment community such as ANDE.
That said, deal flow partners for direct investments could include organizations such as Toniic (an impact investment syndication network), Investor’s Circle, Endeavor, Sonen Capital, and impact accelerators such as Miller Center’s Global Social Benefit Institute (GSBI®), Village Capital, and Hub International.
To include allocation to public securities, there are many sources of preconfigured socially responsible and ESG investments. These include the USSIF forum for sustainable and responsible investment.6
5.0 APPENDICES
PH
OTO
CR
ED
IT: S
AN
TA
CL
AR
A U
NIV
ER
SIT
Y,
RA
NG
SU
TR
A

55

56

57

58

59

60

61
5.2 DUE DILIGENCE TEMPLATES
DISCLAIMER: THE IGNITE FUND IS A PRO FORMA, CONCEPT FUND.

62DISCLAIMER: THE IGNITE FUND IS A PRO FORMA, CONCEPT FUND.

63DISCLAIMER: THE IGNITE FUND IS A PRO FORMA, CONCEPT FUND.

64DISCLAIMER: THE IGNITE FUND IS A PRO FORMA, CONCEPT FUND.

65

66

67

68

69

70
5.3 MAPPING OF PIPELINE INVESTMENT FUNDS AND COMPANIES BY IMPACT THEME AND GEOGRAPHY
To construct the model for $25 million and $50 million portfolios, the funds and companies that met the qualifications as outlined previously were assessed and mapped by impact theme, expected return per annum, and geography, as depicted in the table above (not all impact themes are listed here due to space constraints).
Geographic Distribution of
Investment Target
Cash & Equivalents (5%)
Bank Deposits*
- Self Help Federal Credit Union CDs
Thematic 1.05% Yes 100%
- Community Bank of the Bay
Thematic 0.75% Yes 100%
Social Money Market Funds (5%)
- MicroVest Short Duration Fund
Thematic 3.25% Yes 7% 32% 4% 57%
Fixed Income (20%)
PowerShares Build America Bond Fund (3%)
Sustainable4.7% (yield
alone)Yes Yes 100%
Bamboo Finance Hybrid Fund (5%)
Thematic6%-8%
yieldYes Yes Yes 20% 40% 40%
Root Capital Sustainable Trade Fund (3%)
Thematic2.25%-
2.75% yieldYes Yes Yes 60% 39% 1%
Triodos Microfinance Hybrid Fund (5%)
Thematic 5.5% Yes
Etc.
Sust
aina
ble
Ag
ricu
ltur
e
Wat
er &
Lan
d
Cle
an E
nerg
y
Hea
lth
Car
e
Ed
ucat
ion
Fin
anci
al S
ervi
ces
No
rth
Am
eric
a
Lati
n &
Cen
tral
A
mer
ica
Afr
ica
Cen
tral
& S
E A
sia
Eur
op
e
Ass
et C
lass
(% a
lloca
tio
n)
Imp
act
Cat
ego
ry
Net
exp
ecte
d re
turn
(p
.a.%
)
No
td
isclo
sed
MAPPING OF PIPELINE INVESTMENT FUNDS AND COMPANIES BY IMPACT THEME AND GEOGRAPHY

71
*Bank deposits: No specific investment is allocated to ‘bank investments’; rather, we park cash with CDFIs only in specific instances, such as the initial receipt of LP cash prior to investment deployment, the temporary storage of investment yields and exits waiting to be distributed to LPs, etc.**Maya Mountain Cacao’s 13% IRR is based on 2x return over 5.5 years. DajDaj Pelene’s 9% IRR is based on 1.4x return over 3.5 years. BAC VPO Fund I return is an estimated net yield of 8% to 11% to investors per year. Other VPO direct or fund deals are estimates, based on comparable terms and returns achieved by the likes of Maya Mountain Cacao and BAC VPO Fund I.
***BioLite is an Impact First investment, per KL Felicitas Foundation.
Geographic Distribution of
Investment Target
Structured Notes (35%)
Maya Mountain Cacao (1%)
Thematic 13%** Yes Yes Yes 100%
BAC VPO Fund I (5%) Sustainable8.0%-11% yield**
Yes 100%
DajDaj Pelene (1%)Impact
First9%** Yes 100%
Other VPO direct deals (10%)
Impact First/
Thematic
Target 8%-12%**
YesTBD, likely 100%
Other VPO Funds (i.e. Columbia) (18%)
SustainableTarget
8%-12%**Yes
TBD, likely 100%
Private Equity/VC (15%)
BioLite (1.5%)Impact First***
8% Yes
PBK Waste Management (2%)
Thematic 8% Yes 100%
Food Stand (1.5%) Thematic 6% Yes 100%
Core Innovation Fund II (10%)
Thematic15%-20% net IRR
Yes 100%
Real Assets (25%)
JP Morgan Urban Renaissance Fund (2%)
Thematic15% net
IRRYes Yes 100%
Lyme Northern Forest Fund (3%)
Thematic11.6% net
IRRYes 100%
Direct timber investment (TBD)
Thematic 14% yield YesTBD, likely 100%
Sust
aina
ble
Ag
ricu
ltur
e
Wat
er &
Lan
d
Cle
an E
nerg
y
Hea
lth
Car
e
Ed
ucat
ion
Fin
anci
al S
ervi
ces
No
rth
Am
eric
a
Lati
n &
Cen
tral
A
mer
ica
Afr
ica
Cen
tral
& S
E A
sia
Eur
op
e
No
td
isclo
sed
Ass
et C
lass
(% a
lloca
tio
n)
Imp
act
Cat
ego
ry
Net
exp
ecte
d re
turn
(p
.a.%
)

72
5.4 RESOURCES FOR TOTAL PORTFOLIO ACTIVATION FOR IMPACT INVESTMENT OPPORTUNITIES
GUIDE
Arabella Advisors, Exponent Philanthropy, & Mission Investors Exchange; Essentials for Impact Investing; September 2015
Yasemin Saltuk – JP Morgan; A Portfolio Approach to Impact Investing; October 20126
PUBLICATION
Julia Balandina Jaquier | Guide to Impact Investing – For Family Offices and High Net Worth Individuals | June 2016
REPORT
Dear, Helbitz, Khare, Lotan, Newman, Sims, & Zaroulis – Social Finance; Impact Bonds – The Early Years; July 2016
RS Group; Impact Report; May 2016
Miller – Heron Foundation; Building a Foundation for the 21st Century; January 2016
Drexler & Noble – World Economic Forum; Impact Investing: A Primer for Family Offices; December 2014
Update: Balbuena, Morgan, Newman, Pun, & Pomares – Sonen Capital; Evolution of an Impact Portfolio: From Implementation to Results; December 2015
Original Report: Lai, Morgan, Newman, & Pomares – Sonen Capital; Evolution of an Impact Portfolio: From Implementation to Results; October 2013
Palandjian - Bridges Ventures & Parthenon Group; Investing for Impact – Case Studies Across Asset Classes; January 2010
WHITE PAPER
Asset Allocation Working Group; Social Impact Investment Taskforce – UK G8 Presidency; Allocating for Impact; September 2014
Electris, Humphreys, & Solomon – Tellus Institute; Tides & Trillium Asset Management; Total Portfolio Activation – A Framework for Creating Social and Environmental Impact across Asset Classes; August 2012

73
In forming the model portfolios, the authors drew upon their work as impact investors with advice and experience from Beyond Capital, Impact Assets, Sonen Capital, Toniic, and Wilson Sonsini Goodrich & Rosati.
Acknowledgements
PH
OTO
CR
ED
IT: S
AN
TA
CL
AR
A U
NIV
ER
SIT
Y

74
1. Report on U.S. Sustainable, Responsible, and Impact Investing Trends 2014, 10th Edition; http://www.ussif.org/Files/Publications/SIF_Trends_14.F.ES.pdf
2. https://www.missioninvestors.org/system/files/tools/Essentials-of-Impact-Investing-A-Guide-For-Small-Staffed-Foundations-Arabella-Advisors-Exponent-Philanthropy-Mission-Investors-Exchange.pdf
3. The Global Impact Investing Network (GIIN) is a nonprofit organization dedicated to increasing the scale and effectiveness of impact investing. The GIIN’s programmatic agenda is rooted in the challenges faced by investors, and it serves as a forum for identifying and addressing the systemic barriers that hinder or impede the impact investing market.
3. http://www.fao.org/fileadmin/templates/wsfs/docs/expert_paper/How_to_Feed_the_World_in_2050.pdf
4. Arabella Advisors, Exponent Philanthropy, & Mission Investors Exchange; Essentials for Impact Investing; September 2015
5. Lai, Morgan, Newman, & Pomares – Sonen Capital; Evolution of an Impact Portfolio: From Implementation to Results; October 2013
6. Although public equities can potentially be included, they were not part of this asset allocation strategy.
7. ‘Structured Exit’ financing describes investment vehicles that have recently emerged to fund social and environmental impact. These investment vehicles are used where traditional debt does not carry enough risk premium, and equity does not present a plausible mechanism for investment return. While there are several versions of structured exit vehicles, the core concept is to agree with the investee on how investment capital and profit will be returned to investors as a share of revenue or earnings until a total return amount has been achieved. This approach has several advantages for the impact investing sector. It eliminates a need to define valuation; puts an emphasis on reliable cash flow and profit growth; does not require the entrepreneur to sell the enterprise; is flexible in its construction; and carries equity-like protective provisions.
Social Impact Bonds are tools to finance government pay-for-success contracts. Investors provide up-front funding for a program of prevention or early intervention services that are currently beyond the reach of limited government funding. If the program hits performance targets and saves the government money, government uses some of the savings to repay investors with interest. If the program fails, government owes the investors nothing. Many times philanthropic capital or interested corporate funds play a critical role in mitigating the risks of the investors. Intermediary organizations provide ongoing
Endnotes

75
performance management and project oversight throughout the life of the investment. We would note that non-government sponsors of Social Impact Bonds are also beginning to participate.
8. http://www.fao.org/fileadmin/templates/wsfs/docs/expert_paper/How_to_Feed_the_World_in_2050.pdf
9. http://wwf.panda.org/what_we_do/footprint/agriculture/impacts/habitat_loss/
10. http://www.mckinsey.com/business-functions/sustainability-and-resource-productivity/our-insights/resource-revolution
11. https://us.fsc.org/en-us/what-we-do/why-forests-matter
12. https://www.epa.gov/cwa-404/mitigation-banking-factsheet (Definition of mitigation banking from EPA)
A conservation or mitigation bank is privately or publicly owned land managed
for its natural resource values. In exchange for permanently protecting, managing, and monitoring the land, the bank sponsor is allowed to sell or transfer habitat credits to permit holders who need to satisfy legal requirements and compensate for the environmental impacts of developmental projects.
13. http://www.iea.org/publications/freepublications/publication/WEO_2014_ES_English_WEB.pdf
14. http://2014.newclimateeconomy.report/energy/
15. http://2014.newclimateeconomy.report/energy/
16. WHO/World Bank Group, “Tracking Universal Coverage” (2015)
17. Open Society Institute, 2010, “Innovative Financing for Education,” ESP Working Paper No. 5. London: Open Society Institute
18. Note: sometimes these returns start after an initial honeymoon period.
19. Total Portfolio Activation, Tides Foundation, 2012 https://www.tides.org/fileadmin/Publications/Total_Portfolio_Activation_01.pdf
20. The Performance of Socially Responsible Investment, AP7, 2011 http://www.gruenesgeld.at/downloads/The-Performance-of-SRI.pdf
Shedding Light on Responsible Investment: Approaches, Returns, and Impacts, Mercer, 2009
http://www.law.harvard.edu/programs/lwp/pensions/conferences/cm_europe12_09/Shedding_light_on_responsible_investment_free_version.pdf

76
21. Trade-off between financial return and impact: Earlier reports published by the impact investing community suggest there may be a trade-off between financial gains and impact, that is, for every incremental impact achieved, there is an incremental dilution to financial returns.
22. A Portfolio Approach to Impact Investment, J.P. Morgan, 2012 http://www.jpmorganchase.com/corporate/socialfinance/document/121001_A_
Portfolio_Approach_to_Impact_Investment.pdf
23. Introducing the Impact Investing Benchmark, Cambridge Associates, 2015 http://40926u2govf9kuqen1ndit018su.wpengine.netdna-cdn.com/wp-content/
uploads/2015/06/Introducing-the-Impact-Investing-Benchmark.pdf

77
Founded in 1997, Miller Center accelerates
global, innovation-based social entrepr-
eneurship in service to humanity. Its strategic
focus is on poverty eradication through
its three areas of work: The Global Social
Benefit Institute (GSBI®), Impact Capital, and
Education and Action Research.
To learn more about Miller Center and its
social entrepreneurship programs, please visit
www.scu.edu/MillerCenter.
© Copyright 2016. All rights reserved. GSBI is a registered trademark of Santa Clara University. The names of all other
companies, products and services, are the property of their respective owners.