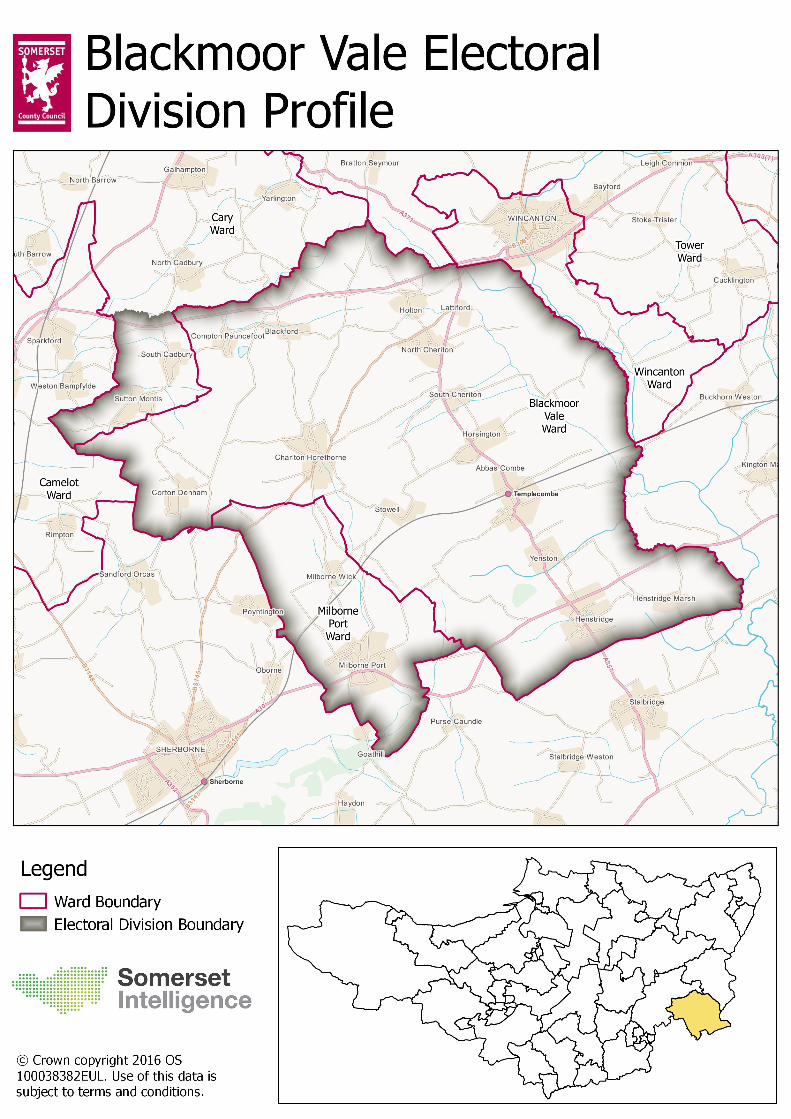
total usual population - somerset intelligence
TRANSCRIPT
For Somerset & District figures please go to www.somersetintelligence.org.uk/cp
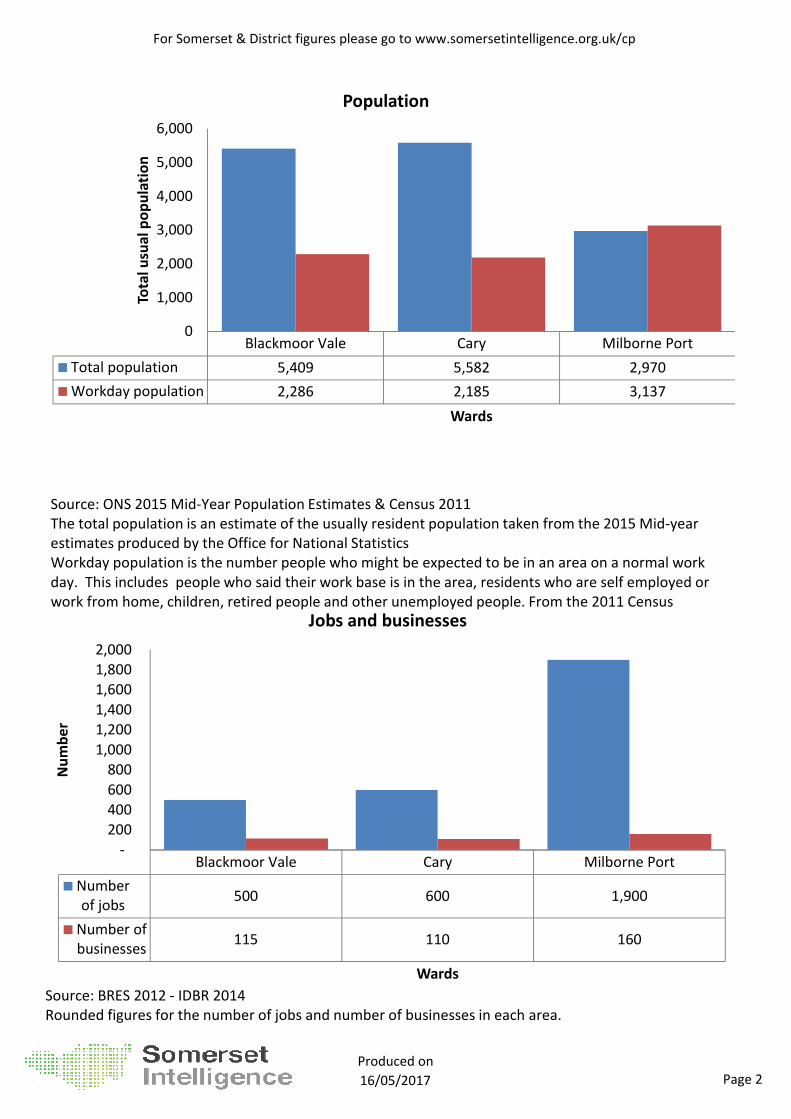
Blackmoor Vale Cary Milborne Port
Total population 5,409 5,582 2,970
Workday population 2,286 2,185 3,137
0
1,000
2,000
3,000
4,000
5,000
6,000To
tal
usu
al
po
pu
lati
on
Wards
Population
Blackmoor Vale Cary Milborne Port
Number
of jobs500 600 1,900
Number of
businesses115 110 160
-
200
400
600
800
1,000
1,200
1,400
1,600
1,800
2,000
Nu
mb
er
Wards
Jobs and businesses
Source: ONS 2015 Mid-Year Population Estimates & Census 2011
The total population is an estimate of the usually resident population taken from the 2015 Mid-year
estimates produced by the Office for National Statistics
Workday population is the number people who might be expected to be in an area on a normal work
day. This includes people who said their work base is in the area, residents who are self employed or
work from home, children, retired people and other unemployed people. From the 2011 Census
Source: BRES 2012 - IDBR 2014
Rounded figures for the number of jobs and number of businesses in each area.
Produced on
16/05/2017 Page 2
For Somerset & District figures please go to www.somersetintelligence.org.uk/cp
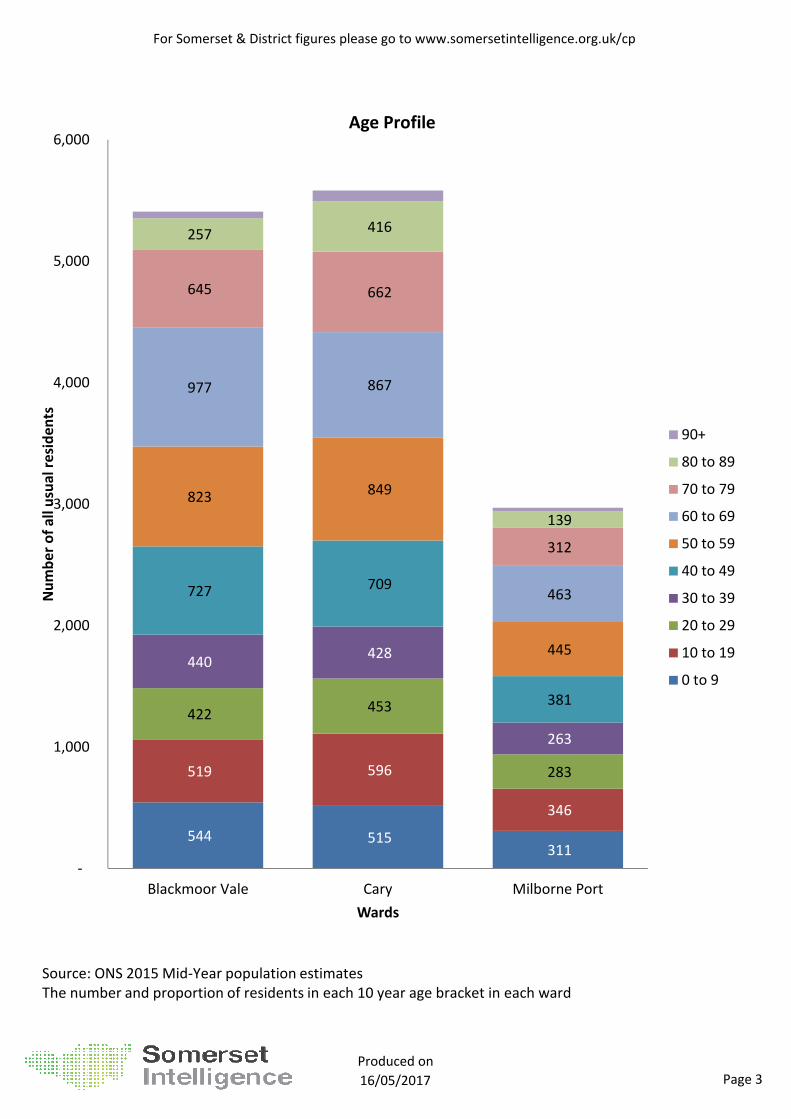
544 515 311
519 596
346
422 453
283
440 428
263
727 709
381
823 849
445
977 867
463
645 662
312
257 416
139
-
1,000
2,000
3,000
4,000
5,000
6,000
Blackmoor Vale Cary Milborne Port
Nu
mb
er
of
all
usu
al
resi
de
nts
Wards
Age Profile
90+
80 to 89
70 to 79
60 to 69
50 to 59
40 to 49
30 to 39
20 to 29
10 to 19
0 to 9
Source: ONS 2015 Mid-Year population estimates
The number and proportion of residents in each 10 year age bracket in each ward
Produced on
16/05/2017 Page 3

For Somerset & District figures please go to www.somersetintelligence.org.uk/cp
Blackmoor Vale Cary Milborne Port
Day-to-day
activities limited17.2% 13.3% 21.2%
Unpaid Carers 11.6% 11.1% 12.9%
0%
5%
10%
15%
20%
25%
Pe
rce
nta
ge
of
all
usu
al
resi
de
nts
Wards
Health & Care
Blackmoor Vale Cary Milborne Port
All Cause
Mortality for
people under 75
228 280 236
Mortality from
Coronary Heart
Disease
120 102 73
0
50
100
150
200
250
300
Dir
ect
ly S
tan
da
rdis
ed
Ra
te p
er
10
0,0
00
re
sid
en
ts
Wards
Mortality Rates
Source : 2011 Census
Percentage of people who said their day to day activities are limited in some way due to a long term
disability or illness and the percentage of people who say they provide some amount of unpaid care.
Source: NHS
Directly Standardised Mortality rates for different causes or age ranges. Per 100,000 people, 2010-2014.
The DSR for an area is the number of deaths, usually expressed per 100,000, that would occur in that area
if it had the same age structure as the standard population.
Produced on
16/05/2017 Page 4
For Somerset & District figures please go to www.somersetintelligence.org.uk/cp
Blackmoor Vale Cary Milborne Port
All Crime 3000 3057 4680
Burglary 366 416 543
Violence and
Sexual Offences787 923 1017
Criminal Damage 384 253 576
0
500
1000
1500
2000
2500
3000
3500
4000
4500
5000
Ra
te o
f re
po
rte
d c
rim
e
pe
r 1
00
,00
0 p
eo
ple
Wards
Crime Rates
Source: Police.uk web site - 2015-16
Rates of various types of reported crime per 100,000 population (2014 Mid-Year Estimates)
0.0% 0.2% 0.4% 0.6% 0.8% 1.0% 1.2% 1.4%
Blackmoor Vale
Cary
Milborne Port
Percentage of usual residents
Are
a
Main Language
All Other non-English Polish Portuguese All Chinese Tagalog/Filipino
Produced on
16/05/2017 Page 5

For Somerset & District figures please go to www.somersetintelligence.org.uk/cp
17.8%
15.8%
19.4%
10.3%
11.4%
13.2%
15.5%
17.9%
17.6%
3.9
%2
.5%
3.7
%
12.3%
12.0%
12.9%
36.7%
37.2%
29.1%
3.4
%3
.1%
4.1
%
0% 20% 40% 60% 80% 100%
Blackmoor Vale
Cary
Milborne Port
Percentage of residents aged 16+
Are
as
Highest level qualification held
No Qualifications Lvl1 Qualifications Lvl2 Qualifications
Apprenticeship Qualifications Lvl3 Qualifications Lvl4 Qualifications
Other Qualifications
Source: Census 2011
Highest qualification achieved by people aged 16 and over
No qualifications : No academic or professional qualifications.
Level 1 qualifications : ‘1-4 GCSEs or equivalent’ - 1-4 O Levels/CSE/GCSEs (any grades), Entry Level,
Foundation Diploma, NVQ level 1, Foundation GNVQ, Basic/Essential Skills.
Level 2 qualifications : ‘5+ GCSEs or equivalent’ - 5+ O Level (Passes)/CSEs (Grade 1)/GCSEs (Grades A*-C),
School Certificate, 1 A Level/ 2-3 AS Levels/VCEs, Intermediate/Higher Diploma, Welsh Baccalaureate
Intermediate Diploma, NVQ level 2, Intermediate GNVQ, City and Guilds Craft, BTEC First/General Diploma,
RSA Diploma.
Apprenticeship: Apprenticeship.
Level 3 qualifications : ‘2+ A-levels or equivalent’ - 2+ A Levels/VCEs, 4+ AS Levels,
Higher School Certificate, Progression/Advanced Diploma, Welsh Baccalaureate Advanced Diploma, NVQ
Level 3; Advanced GNVQ, City and Guilds Advanced Craft, ONC, OND, BTEC National, RSA Advanced
Diploma.
Level 4 qualifications and above : ‘Degree level or above’ - Degree (for example BA, BSc), Higher Degree
(for example MA, PhD, PGCE), NVQ Level 4-5, HNC, HND, RSA Higher Diploma, BTEC Higher level,
Foundation degree (NI), Professional qualifications (for example teaching, nursing, accountancy).
Other qualifications: Vocational/Work-related Qualifications, Foreign Qualifications/Qualifications gained
outside the UK (NI) (Not stated/level unknown).
Produced on
16/05/2017 Page 6
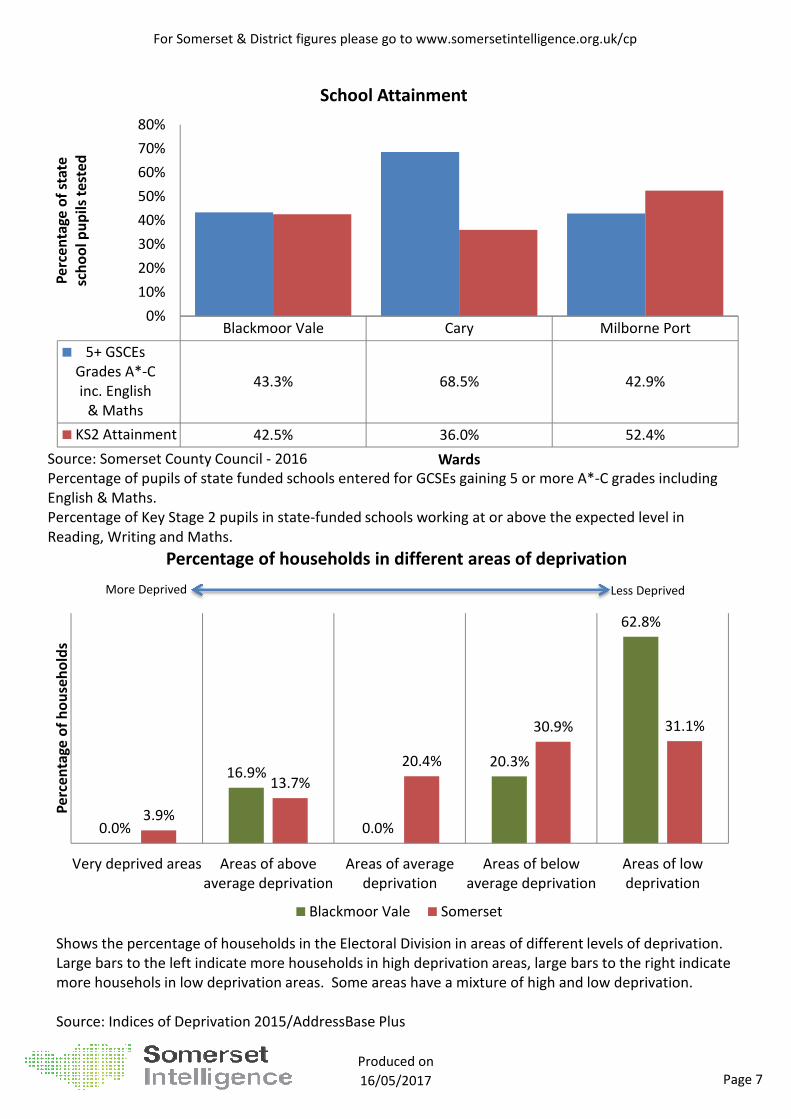
For Somerset & District figures please go to www.somersetintelligence.org.uk/cp
Blackmoor Vale Cary Milborne Port
5+ GSCEs
Grades A*-C
inc. English
& Maths
43.3% 68.5% 42.9%
KS2 Attainment 42.5% 36.0% 52.4%
0%
10%
20%
30%
40%
50%
60%
70%
80%
Pe
rce
nta
ge
of
sta
te
sch
oo
l p
up
ils
test
ed
Wards
School Attainment
Source: Somerset County Council - 2016
Percentage of pupils of state funded schools entered for GCSEs gaining 5 or more A*-C grades including
English & Maths.
Percentage of Key Stage 2 pupils in state-funded schools working at or above the expected level in
Reading, Writing and Maths.
0.0%
16.9%
0.0%
20.3%
62.8%
3.9%
13.7%
20.4%
30.9% 31.1%
Very deprived areas Areas of above
average deprivation
Areas of average
deprivation
Areas of below
average deprivation
Areas of low
deprivation
Pe
rce
nta
ge
of
ho
use
ho
lds
Percentage of households in different areas of deprivation
Blackmoor Vale Somerset
Shows the percentage of households in the Electoral Division in areas of different levels of deprivation.
Large bars to the left indicate more households in high deprivation areas, large bars to the right indicate
more househols in low deprivation areas. Some areas have a mixture of high and low deprivation.
Source: Indices of Deprivation 2015/AddressBase Plus
More Deprived Less Deprived
Produced on
16/05/2017 Page 7