totalview debugging tool presentation josip jakić [email protected]
TRANSCRIPT

• Introduction• Getting started with TotalView• Primary windows• Basic functions• Further functions• Debugging parallel programs• Topics not covered• References and more information
Agenda
18 Jan 2012 TotalView2
• TotalView is a sophisticated software debugger product from Rogue Wave Software, Inc.
• Used for debugging and analyzing both serial and parallel programs
• Designed for use with complex, multi-process and/or multi-threaded applications
• The most popular HPC debugger to date
Introduction [1/2]
18 Jan 20123
TotalView
• Supported on most HPC platforms• Provides both a GUI and command line
interface• Includes memory debugging features• Supported languages include the usual
HPC application languages:– C/C++– Fortran77/90– Assembler
Introduction [2/2]
18 Jan 2012 TotalView4
• -g flag enables generation of symbolic debug information for most compilers
• Programs compiled without the -g option are allowed to be debugged, however, only the assembler code can be viewed
• Programs should be compiled without optimization flags
• Parallel programs may require additional compiler flags
Getting started with TotalView [1/3]
18 Jan 2012 TotalView5

• A variety of ways to start the program– totalview (invokes New Program dialog box)
– totalview filename
– totalview filename corefile
– totalview filename -a args– totalview filename -remote hostname
[:portnumber]
Getting started with TotalView [2/3]
18 Jan 2012 TotalView6

• New Program dialog box
– Numerous options for various means of selecting a program
Getting started with TotalView [3/3]
18 Jan 2012 TotalView7

• Root Window
– Appears when the TotalView GUI is started– Overview of all processes and threads,
showing assigned ID, MPI rank, host, status and brief description/name for each
Primary Windows [1/7]
18 Jan 2012 TotalView8
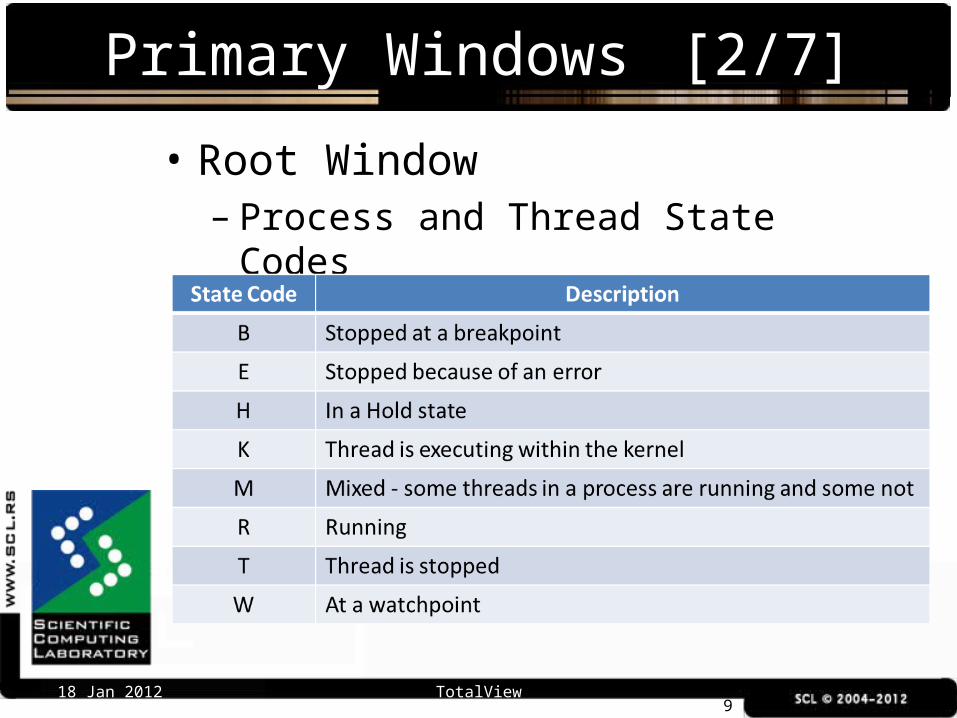
• Root Window– Process and Thread State Codes
Primary Windows [2/7]
18 Jan 2012 TotalView9
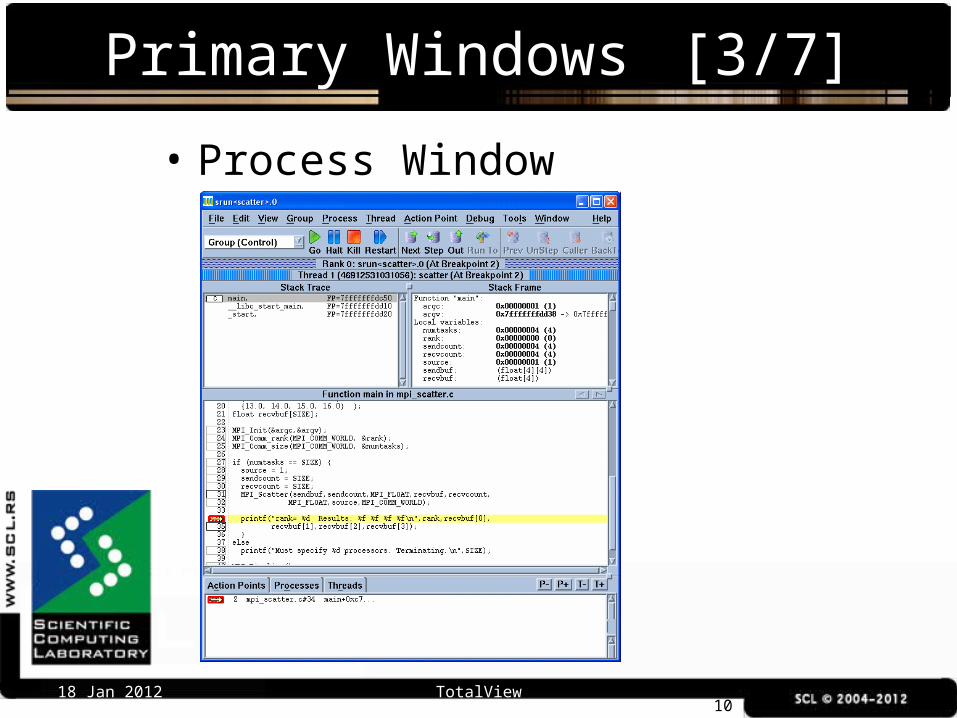
• Process Window
Primary Windows [3/7]
18 Jan 2012 TotalView10

• Process Window– For multi-process/multi-threaded programs,
every process and every thread may have its own Process Window if desired
– Comprised of:• Pull-down menus• Execution control buttons• Navigation control buttons• Process and thread status bars• 4 "Panes"
Primary Windows [4/7]
18 Jan 2012 TotalView11

• Process Window– Stack Trace Pane
• Shows the call stack of routines the current executable is running
– Stack Frame Pane• Displays the local variables, registers and
function parameters for the selected executable.
– Source Pane• Displays source for the currently selected
program or function with program counter, line numbers and any associated action points
Primary Windows [5/7]
18 Jan 2012 TotalView12

• Process Window– Action Points, Processes, Threads Pane• A multi-function pane. By default, it shows any
action points that have been set• May also select Processes to show attached
processes or Threads to show associated threads
Primary Windows [6/7]
18 Jan 2012 TotalView13

• Variable Window
– Displays detailed information about selected program variables
– Permits editing, diving, filtering and sorting of variable data
Primary Windows [7/7]
18 Jan 2012 TotalView14

Basic Functions [1/6]
18 Jan 2012 TotalView15
• Viewing Source Code– Source, Assembler or Both– To toggle between the different display
modes:• Process Window > View Menu > Source As
• Displaying Function / File Source Code– Finding and displaying the source code:• Process Window > View Menu > Lookup
Function

• Setting a Breakpoint– Most basic of TotalView’s action points
used to control a program’s execution– Halts execution at a desired line before
executing the line– ˝Boxed˝ lines are eligible for breakpoints
– Setting and viewing breakpoints
Basic Functions [2/6]
18 Jan 2012 TotalView16
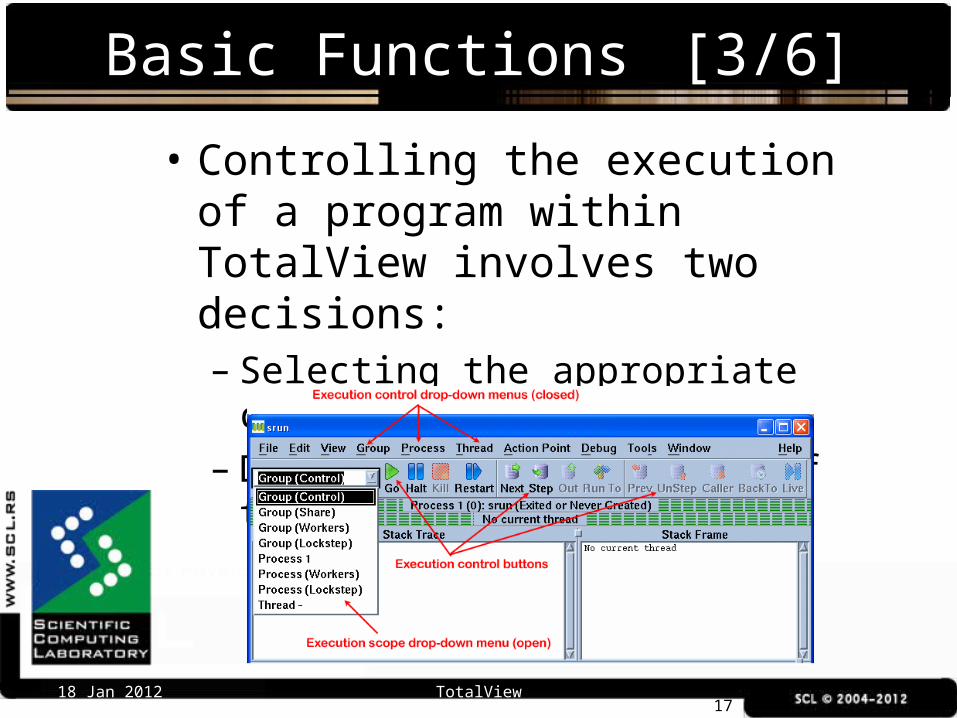
• Controlling the execution of a program within TotalView involves two decisions:– Selecting the appropriate command– Deciding upon the scope of the chosen
command
Basic Functions [3/6]
18 Jan 2012 TotalView17
• Group, Process, Thread Command Scopes– For serial programs, execution scope is not
an issue because there is only one execution stream
– For parallel programs, execution scope is critical - you need to know which processes and/or threads your execution command will effect• Additional details about Group, Process and
Thread Command Scopes are discussed later together with additional breakpoint options
Basic Functions [4/6]
18 Jan 2012 TotalView18
• Viewing and Modifying Data– TotalView allows you to view variables,
registers, areas of memory and machine instructions
– Leaving a Variable Window open allows you to perform runtime monitoring of variables (updated each time program is stopped)
– You can edit variables from within the Variable Window
– The modified variable has effect when the program resumes execution
Basic Functions [5/6]
18 Jan 2012 TotalView19
• Arrays– For array data, TotalView provides several
additional features:• Displaying array slices• Data filtering• Data Sorting• Array statistics
– Array Viewer• To view a multi-dimensional array in
"spreadsheet" format:– Variable Window > Tools Menu > Array Viewer
Basic Functions [6/6]
18 Jan 2012 TotalView20

• Demonstration on topics covered so far using simple serial code– Starting TotalView– Primary windows– Basic Functions
Examples
18 Jan 2012 TotalView21

• Viewing a Core File– TotalView can be used to examine the core
file from a crashed job and examining the state (variables, stack, etc.) of the program when it crashed• It is quite likely that your shell's core file size
setting may limit the size of a core file so that it is inadequate for debugging• Check your shell's limit settings, use either
the limit (csh/tcsh) or ulimit -a (sh/ksh/bash) command and override if neccessary
Further Functions [1/7]
18 Jan 2012 TotalView22
• Code fragments– Code fragments can include a mixture of:C,
Fortran or Assembler language – TotalView built-in variables ($tid, $pid,
$systid ... )– TotalView built-in statements ($stop, $hold,
$stopall ...)– Code fragments can be entered by two
methods:• Evaluate Window• Evaluation Point
Further Functions [2/7]
18 Jan 2012 TotalView23
• TotalView supports four different types of action points:– Breakpoint – Process Barrier Point
• holds each process when it reaches the barrier point until all processes have reached the barrier
– Evaluation Point • causes a code fragment to execute when reached
– Watchpoint• Monitors when the value stored in memory is
modified and either stop execution or evaluates
Further Functions [3/7]
18 Jan 2012 TotalView24

• Managing action points– Deleting Action Points• Delete All
– Disabling / Enabling Action Points• Suppress All
– Saving / Loading Action Points
Further Functions [4/7]
18 Jan 2012 TotalView25

• Attaching / Detaching Processes– In the New Program Dialog Box, select
the Attach to process button
Further Functions [5/7]
18 Jan 2012 TotalView26

• Displaying Program's Call Graph– Process Window > Tools Menu > Call Graph
Further Functions [6/7]
18 Jan 2012 TotalView27
• Some other functions and settings– Setting Executable Command Arguments– Setting Source Code Search Paths– Setting stdin, stdout, and stderr– Setting Preferences– Signal Handling– Debugging Memory Problems– Visualizing Array Data– Command Line Interpreter (CLI)
Further Functions [7/7]
18 Jan 2012 TotalView28
• Start TotalView with the core file and determine why the program crashed
• Setting Evaluation Points• Attach to a hung process• Debugg the hung process
Examples
18 Jan 2012 TotalView29

• Process/Thread Groups– Types of P/T Groups:
• Control Group:– Contains all processes and threads created by the
program across all processors
• Share Group:– Contains all of the processes and their threads, that are
running the same executable
• Workers Group:– Contains all threads that are executing user code
• Lockstep Group:– Includes all threads in a Share Group that are at the
same PC (program counter) address
Debugging Parallel Programs [1/11]
18 Jan 2012 TotalView30

• Debugging Threaded Codes– Finding Thread Information• Root Window• Process Window
– Selecting a Thread• Thread Navigation Buttons
– Execution Control for Threaded Programs• Three Scopes of Influence• Synchronous vs. Asynchronous• Thread-specific Breakpoints
Debugging Parallel Programs [2/11]
18 Jan 2012 TotalView31

• Viewing and Modifying Thread Data– Laminated Variables• In a parallel program, the same variable will
usualy have multiple instances across threads and/or processes• Laminating a variable means to display all
occurrences simultaneously in a Variable Window• Laminated variables can include scalars, arrays,
structures and pointers• Variable Window > View Menu > Show Across >
Thread
Debugging Parallel Programs [3/11]
18 Jan 2012 TotalView32
• Debugging OpenMP Codes– Thread-based– Setting the number of threads• Default: usually equal to the number of cpus on
the machine• OMP_NUM_THREADS environment variable at
run time• OMP_SET_NUM_THREADS routine within the
source code
– Code transformation– Master thread vs. Worker threads
Debugging Parallel Programs [4/11]
18 Jan 2012 TotalView33
• Debugging OpenMP Codes– Execution Control• You can not step into or out of a PARALLEL region• Set a breakpoint within the parallel region and
allow the process to run to it
– As with threaded codes, TotalView supports laminated variable displays for OpenMP
– Manager Threads
Debugging Parallel Programs [5/11]
18 Jan 2012 TotalView34

• Debugging MPI Codes– Multi-Process– MPI manager process• Typically, MPI programs run under a "manager"
process, such as poe, srun, prun, mpirun, dmpirun, etc.
– Automatic process acquisition
Debugging Parallel Programs [6/11]
18 Jan 2012 TotalView35
• MPI features similar to OpenMP– Selecting an MPI Process• Process Navigation Buttons
– Controlling MPI Process Execution• MPI task execution can be controlled at the
individual process level, or collectively as a "group"
• Starting and Stopping Processes• Holding and Releasing Processes
Debugging Parallel Programs [7/11]
18 Jan 2012 TotalView36

• Breakpoints and Barrier Points– Individual breakpoint and barrier point
behavior can be customized via the Action Point Properties Dialog Box
Debugging Parallel Programs [8/11]
18 Jan 2012 TotalView37

• Displaying Message Queue State– Process Window > Tools Menu > Message
Queue– The Message Queue Window– Types of Messages Displayed:• Pending receives - non-blocking and blocking.• Pending sends - non-blocking and blocking.• Unexpected messages - messages sent to this
process which do not yet have a matching receive operation.
Debugging Parallel Programs [9/11]
18 Jan 2012 TotalView38
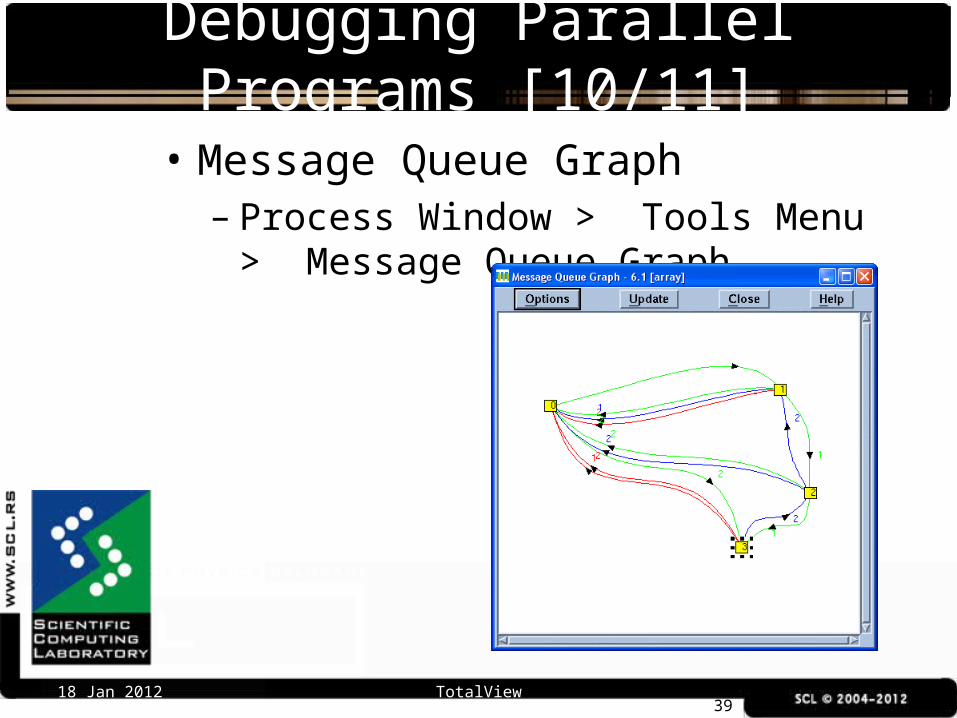
• Message Queue Graph– Process Window > Tools Menu > Message
Queue Graph
Debugging Parallel Programs [10/11]
18 Jan 2012 TotalView39

• Debugging Hybrid Codes– Hybrid codes are programs that use more
than one type of parallelism– Combines technics used in threaded,
OpenMP and MPI debugging
• Attaching to a Running Batch Job– If you have a batch job that is already
running, you can start TotalView on one of the cluster's login nodes and then attach to it
Debugging Parallel Programs [11/11]
18 Jan 2012 TotalView40

• OpenMP example– Specify number of threads– Set breakpoint inside parallel region– Display a variable's value across all threads
• MPI example– Start TotalView using mpirun and executable– Set a barrier point– Display variables across processes
Examples
18 Jan 2012 TotalView41

• CLI• Setting up remote debugging sessions• Memory debugging• Replay engine• and more...
Topics not covered
18 Jan 2012 TotalView42

• The most useful documentation and reference material is from TotalView's vendor site: http://www.roguewave.com/
• Online tutorial: /https://computing.llnl.gov/tutorials/totalview/
References and More Information
18 Jan 2012 TotalView43