touchcorp full year results 2016 - afterpay touch · pdf filethe market for secure transaction...
TRANSCRIPT

Touchcorp Full Year Results 2016
28 February 2017
Mike JefferiesExecutive Chairman
Nadine LennieChief Financial Officer
Disclaimer
This presentation has been prepared by Touchcorp Limited ARBN 603 731 184 (Touchcorp or the Company). The information contained in this presentation is current at the date of this presentation. The information is a summary overview of the current activities of the Company and does not
purport to be all inclusive or to contain all the information that a prospective investor may require in evaluating a possible investment. It is to be read in conjunction with the Company’s disclosures lodged with the Australian Securities Exchange, including the Company’s FY16 Annual Report lodged with the Australian Securities Exchange on 28 February 2017. The material contained in this presentation is not, and should not be considered as, financial product or investment advice. This presentation is not (and nothing in it should be construed as) an offer, invitation, solicitation or recommendation with respect to the subscription for, purchase or sale of any security in any jurisdiction.
This presentation is not intended to be relied upon as advice to investors or potential investors and does not take into account the investment objectives, financial situation or needs of any particular investor which need to be considered, with or without professional advice, when deciding whether or
not an investment is appropriate. This presentation contains information as to past performance of the Company for illustrative purposes only, and is not – and should not be relied upon as – an indication of future performance of the Company.
To the maximum extent permitted by law, Touchcorp makes no representation or warranty (express or implied) as to the accuracy, reliability or completeness of any information contained in this document. To the maximum extent permitted by law, Touchcorp will have no liability (including liability to any person by reason of negligence or negligent misrepresentation) for any statements, opinions or information (express or implied), arising out of, contained in or derived from, or for any omissions from this document.
Forward looking statements
This document contains certain “forward-looking statements”. The words “anticipate”, “believe”, “expect”, “project”, “forecast”, “estimate”, “outlook”, “upside”, “likely”, “intend”, “should”, “could”, “may”, “target”, “plan” and other similar expressions are intended to identify forward-looking statements. Indications of, and guidance on, future earnings and financial position and performance, including Touchcorp’s FY17 outlook, are also forward- looking statements, as are statements regarding Touchcorp’s plans and strategies and the development of the market. Such forward-looking statements are not guarantees of future performance and involve known and unknown risks, uncertainties and other factors, many of which are beyond the control of Touchcorp, which may cause actual results to differ materially from those expressed or implied in such statements. Touchcorp cannot give any assurance or guarantee that the assumptions upon which management based its forward-looking statements will prove to be correct or exhaustive, or that Touchcorp’s business and operations will not be affected by other factors not currently foreseeable by management or beyond its control. Such forward-looking statements only speak as at the date of this document and Touchcorp assumes no obligation to update such information.
Non-IFRS information
This presentation includes certain financial measures that are not recognised under Australian Accounting Standards (AAS) or International Financial Reporting Standards (IFRS). Such non-IFRS financial measures do not have a standardised meaning prescribed by AAS or IFRS and may not be comparable to similarly titled measures presented by other entities, and should not be construed as an alternative to other financial measures determined in accordance with AAS or IFRS. Recipients are cautioned not to place undue reliance on any non-IFRS financial measures included in this presentation. The non-IFRS information has not been subject to audit or review by Touchcorp’s external auditor.
All references to dollars are to Australian currency unless otherwise stated.

1Strategic Context
22016
Highlights
3Financial Results
4Outlook
Contents
3
Strategic Context
4

The market for secure
transaction processing
is growing rapidly
Retailers are
rapidly increasing their
on-line presence
Touch provides the payment solution
Strategic Context
5

Strategic Context
The ConsumerExperience
Who is Touchcorp?Touchcorp is an international
company that provides payment platform services
What are we about?
Why are we special?Our specialty is on-line fraud management and
payment protection
BusinessIntelligence
Strategic Context
Mobility andPayments
What are our business lines?
Health andGovernment
RetaileServices
Building Businesses and
Minimising Fraud
6

Strategic Context
21 3Our strategic priorities have been:
Partnering with our customers for
growth, driving future transaction volumes
Investing in our product suite and service capability
Developing internal
capability
7
8
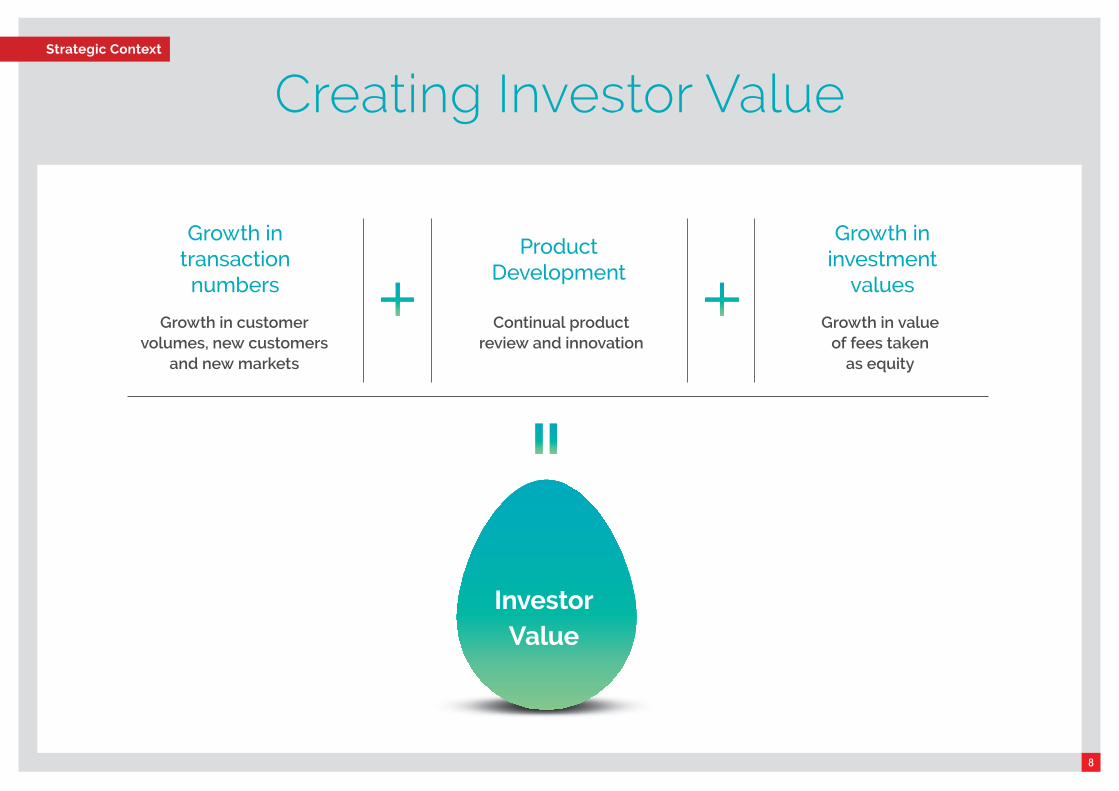
Creating Investor ValueStrategic Context
Growth in transaction
numbers
Growth in customer volumes, new customers
and new markets
Product Development
Continual product review and innovation
Growth in investment
values
Growth in value of fees taken
as equity
Investor Value

2016 Highlights
9
10
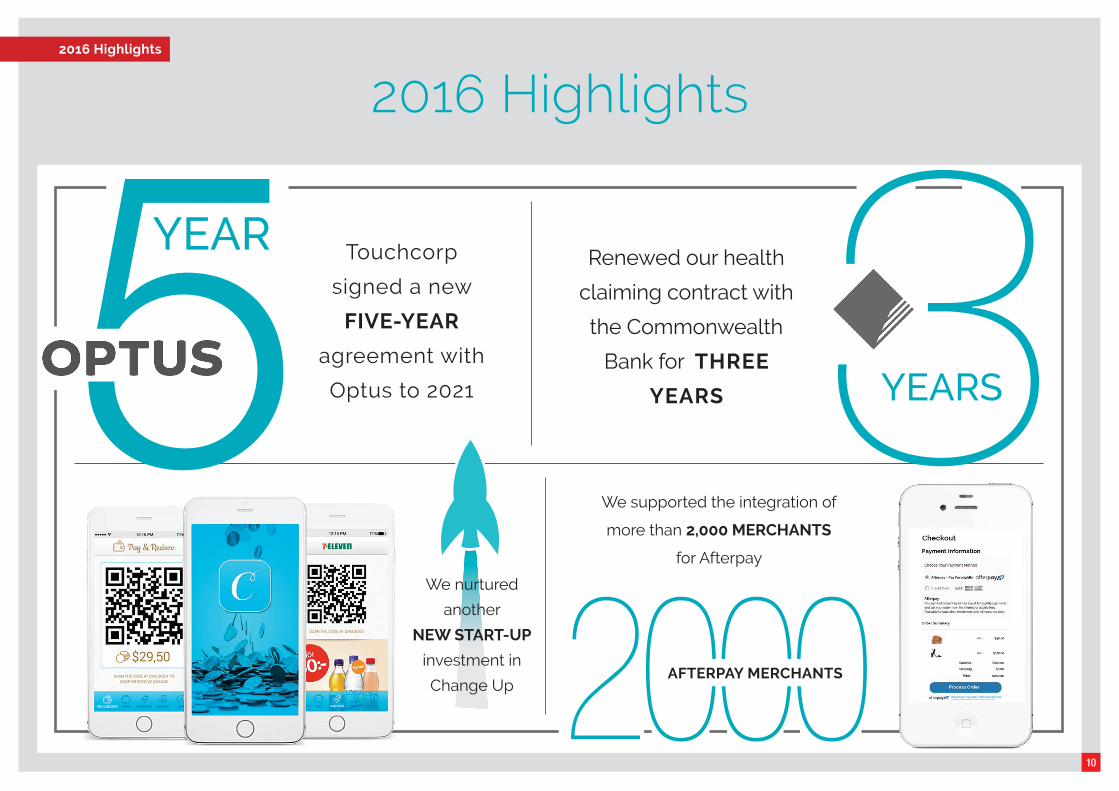
2016 Highlights2016 Highlights
We supported the integration of
more than 2,000 MERCHANTS
for Afterpay
Renewed our health
claiming contract with
the Commonwealth
Bank for THREE
YEARS
Touchcorp
signed a new
FIVE-YEAR
agreement with
Optus to 2021
We nurtured
another
NEW START-UP
investment in
Change Up
3YEARS5YEAR
2000AFTERPAY MERCHANTS
11
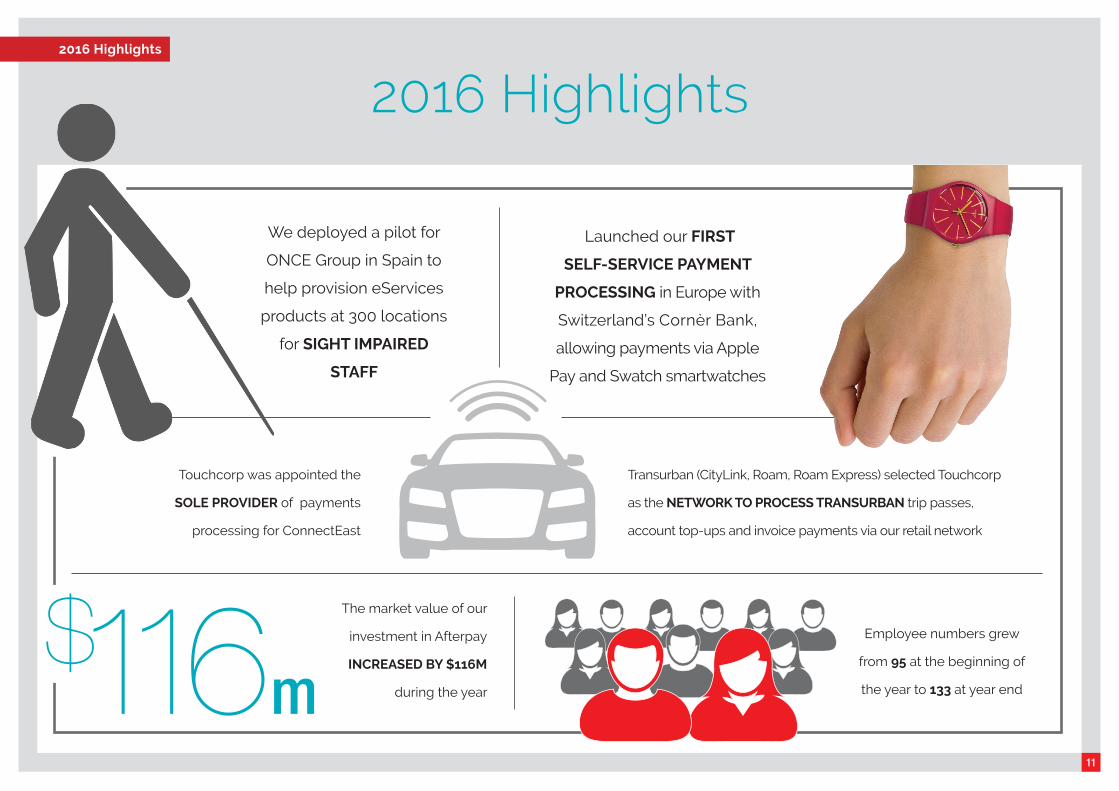
2016 Highlights2016 Highlights
Touchcorp was appointed the
SOLE PROVIDER of payments
processing for ConnectEast
The market value of our
investment in Afterpay
INCREASED BY $116M
during the year
We deployed a pilot for
ONCE Group in Spain to
help provision eServices
products at 300 locations
for SIGHT IMPAIRED
STAFF
Launched our FIRST
SELF-SERVICE PAYMENT
PROCESSING in Europe with
Switzerland’s Cornèr Bank,
allowing payments via Apple
Pay and Swatch smartwatches
Employee numbers grew
from 95 at the beginning of
the year to 133 at year end
Transurban (CityLink, Roam, Roam Express) selected Touchcorp
as the NETWORK TO PROCESS TRANSURBAN trip passes,
account top-ups and invoice payments via our retail network
$116m
12
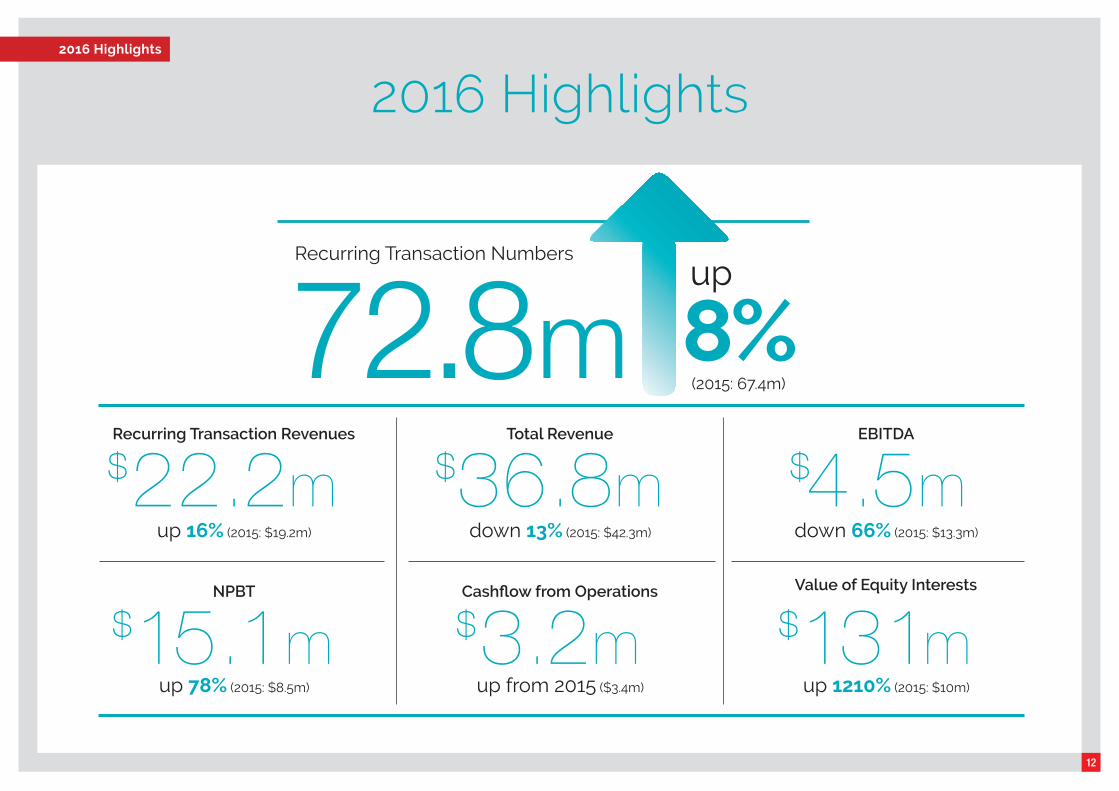
72.8mRecurring Transaction Numbers
up
8%(2015: 67.4m)
Recurring Transaction Revenues
22.2mup 16% (2015: $19.2m)
NPBT
15.1mup 78% (2015: $8.5m)
Total Revenue
36.8mdown 13% (2015: $42.3m)
Cashflow from Operations
3.2mup from 2015 ($3.4m)
EBITDA
4.5mdown 66% (2015: $13.3m)
Value of Equity Interests
131mup 1210% (2015: $10m)
2016 Highlights
$ $
$$ $
$
2016 Highlights
13
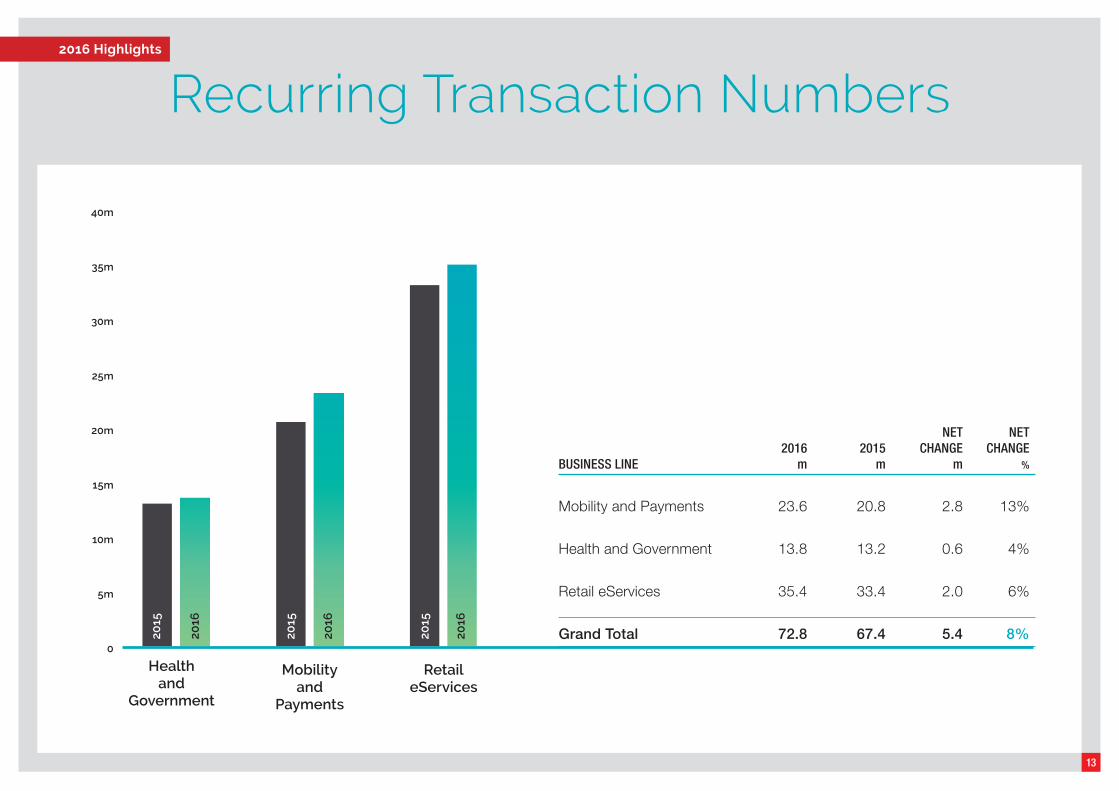
Recurring Transaction Numbers
NET NET 2016 2015 CHANGE CHANGE BUSINESS LINE m m m %
Mobility and Payments 23.6 20.8 2.8 13%
Health and Government 13.8 13.2 0.6 4%
Retail eServices 35.4 33.4 2.0 6%
Grand Total 72.8 67.4 5.4 8%
40m
35m
30m
25m
20m
15m
10m
5m
0
Health and
Government
Mobilityand
Payments
Retail eServices
2016 Highlights
2016
2015
2016
2016
2015
2015

Financial Results
14

15
Summary Income Statement
2016 2015 NET CHANGE
$m $m $m
Total Revenue 36.82 42.30 (5.5)
Cost of Sales (10.82) (6.99) (3.8)
Gross Profit 26.00 35.31 (9.3)
Other Income 0.46 0.16 0.3
Customer Development Expense (5.65) (5.65) -
Operating Expenses (16.30) (16.48) 0.2
EBITDA 4.51 13.34 (8.8)
Depreciation and Amortisation (3.85) (1.22) (2.6)
Interest Income 0.15 0.16 (0.0)
Share of gain (loss) from an associate 14.26 (3.77) 18.0
Income Tax (Expense) Benefit (3.50) 0.88 (4.4)
NPAT 11.57 9.39 2.2
Transactional revenue $2.2m
Integrations revenue $(7.7)m
Deemed disposal of
Afterpay $15.1m
Share of Afterpay
result $2.9m
Financial Results
Revenue mix and Optus
contract renewal
16
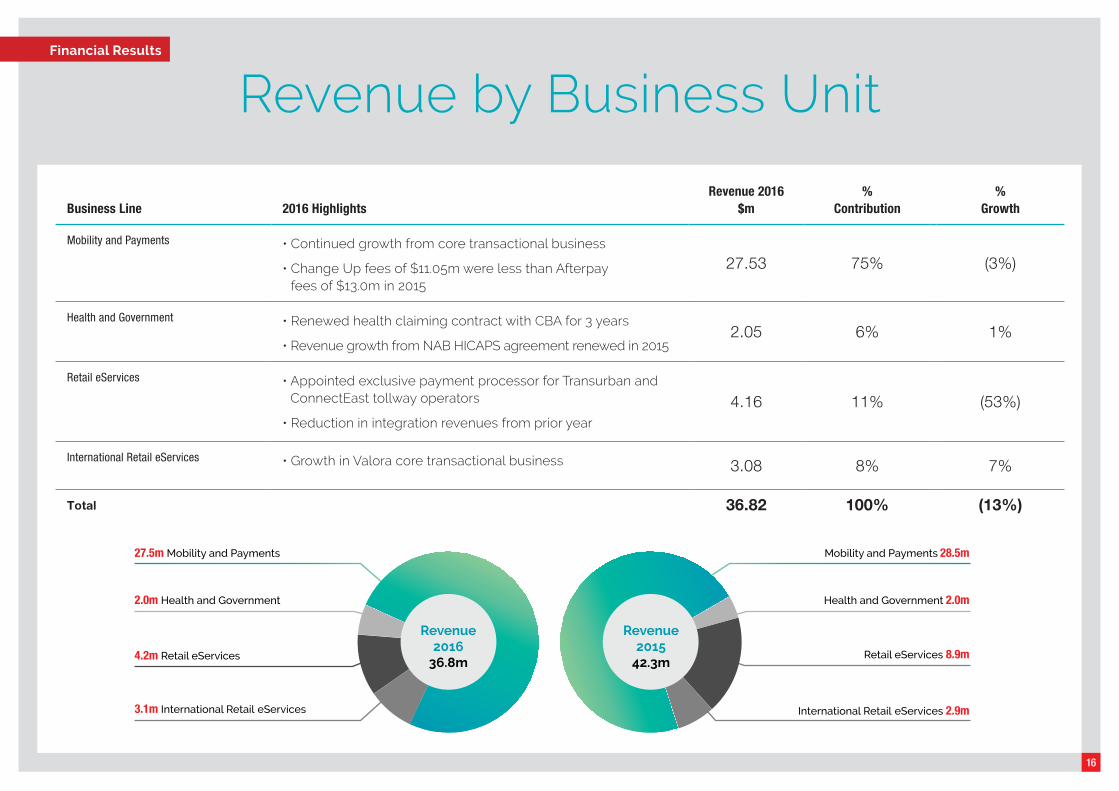
Revenue by Business Unit
Business Line 2016 HighlightsRevenue 2016
$m%
Contribution%
Growth
Mobility and Payments • Continued growth from core transactional business
• Change Up fees of $11.05m were less than Afterpay fees of $13.0m in 2015
27.53 75% (3%)
Health and Government • Renewed health claiming contract with CBA for 3 years
• Revenue growth from NAB HICAPS agreement renewed in 20152.05 6% 1%
Retail eServices • Appointed exclusive payment processor for Transurban and ConnectEast tollway operators
• Reduction in integration revenues from prior year
4.16 11% (53%)
International Retail eServices • Growth in Valora core transactional business 3.08 8% 7%
Total 36.82 100% (13%)
27.5m Mobility and Payments
2.0m Health and Government
4.2m Retail eServices
3.1m International Retail eServices
Mobility and Payments 28.5m
Recurring Transactions 19.2m
Integrations and Infrastructure 23.1m
22.2m Recurring Transactions
14.6m Integrations and Infrastructure
Health and Government 2.0m
International Retail eServices 2.9m
Retail eServices 8.9m
Revenue2016
36.8m
Revenue2016
36.8m
Revenue2015
42.3m
Revenue2015
42.3m
Financial Results
17
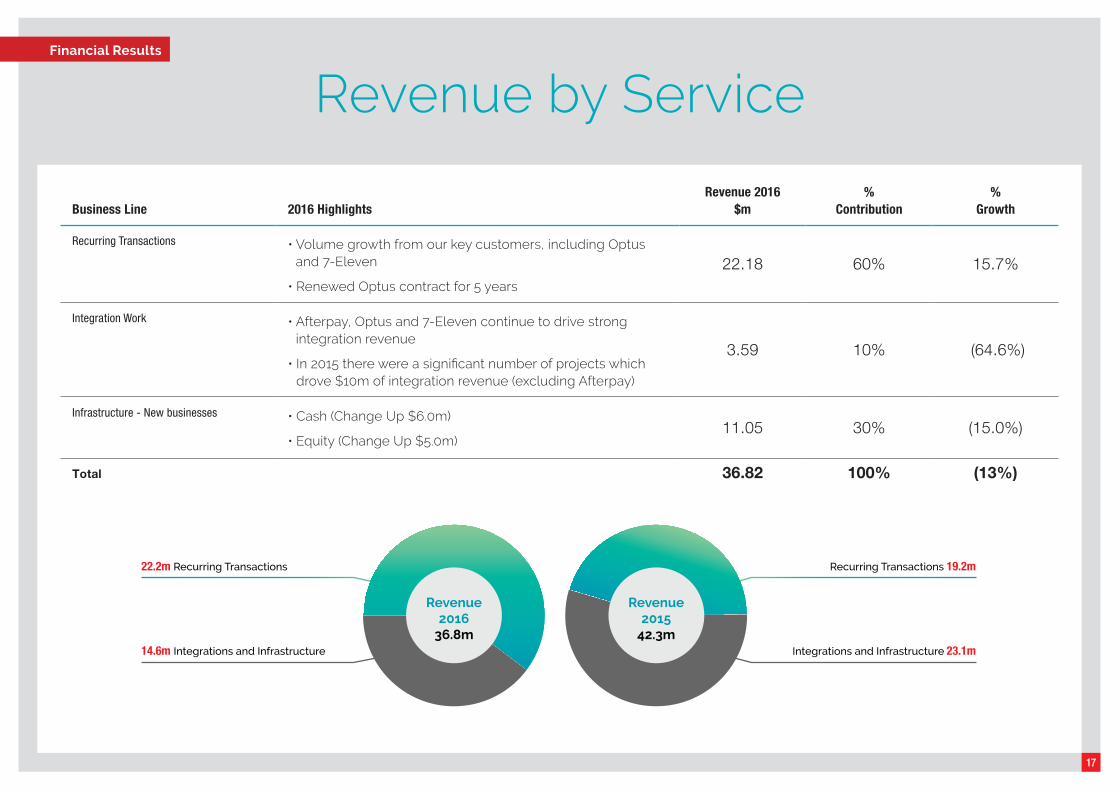
Revenue by Service
Business Line 2016 HighlightsRevenue 2016
$m%
Contribution%
Growth
Recurring Transactions • Volume growth from our key customers, including Optus and 7-Eleven
• Renewed Optus contract for 5 years
22.18 60% 15.7%
Integration Work • Afterpay, Optus and 7-Eleven continue to drive strong integration revenue
• In 2015 there were a significant number of projects which drove $10m of integration revenue (excluding Afterpay)
3.59 10% (64.6%)
Infrastructure - New businesses • Cash (Change Up $6.0m)
• Equity (Change Up $5.0m)11.05 30% (15.0%)
Total 36.82 100% (13%)
27.5m Mobility and Payments
2.0m Health and Government
4.2m Retail eServices
3.1m International Retail eServices
Mobility and Payments 28.5m
Recurring Transactions 19.2m
Integrations and Infrastructure 23.1m
22.2m Recurring Transactions
14.6m Integrations and Infrastructure
Health and Government 2.0m
International Retail eServices 2.9m
Retail eServices 8.9m
Revenue2016
36.8m
Revenue2016
36.8m
Revenue2015
42.3m
Revenue2015
42.3m
Financial Results

18
Revenue Growth
$50m
$40m
$30m
$20m
$10m
$0
Financial Results
DE
C-1
6
DE
C-1
5
DE
C-1
4
DE
C-1
3
DE
C-1
2
Inte
gra
tio
ns
Inte
gra
tio
ns
Inte
gra
tio
ns
Inte
gra
tio
ns
Infr
astr
uct
ure
–
Aft
erp
ay
Infr
astr
uct
ure
–
Ch
ang
e U
p
Infr
astr
uct
ure
Infr
astr
uct
ure
–
Aft
erp
ay
Re
curr
ing
Tran
sact
ion
s
Re
curr
ing
Tran
sact
ion
s
Re
curr
ing
Tran
sact
ion
s
Re
curr
ing
Tran
sact
ion
s
Tota
l
Tota
l
Tota
l
Tota
l
Revenue Detail 2015 Revenue Detail 2016Revenue 2012 - 2016
1H 2015 1H 20162H 2015 2H 2016
CAGR 20% pa
Growing
fundamentals

19
Operating Costs
$30m
$25m
$20m
$15m
$10m
$5m
$0
2015 2016Capital
Raising
Employee
Cost
Share
Based
Payments
General
and
Administration
Depreciation
and
Amortisation
Other
Increasing costs
Decreasing Costs
23.325.8
3.6
0.91.6
1.2
2.6 0.2
Financial Results

20
Balance Sheet
Up $38.1m
Issued capital and reserves $26.6m
Retained earnings $11.6m
Financial Results
Zero Debt
Up $19.0m
Change Up investment $5.0m
Change in Afterpay investment $14.3m
Up $18.2m
Operating cashflows $3.2m
Financing cashflow from share issue $24.9m
Long-term asset investment $9.8m
2016 2015 $m $m
Cash and cash equivalents 27.75 9.50
Trade and other receivables 11.87 13.10
Other current assets 9.47 9.57
Total Current Assets 49.09 32.17
Deferred tax asset 4.22 7.72
Long-term assets 19.03 12.90
Investments 25.49 6.23
Prepayments 1.63 -
Total Non-current Assets 50.37 26.85
TOTAL ASSETS 99.46 59.02
Trade and other payables 16.08 13.80
Employee provisions 1.15 1.14
Total current liabilities 17.23 14.94
Long service leave provision 0.10 0.07
Total Non-current Liabilities 0.10 0.07
TOTAL LIABILITIES 17.33 15.01
NET ASSETS 82.13 44.01
21
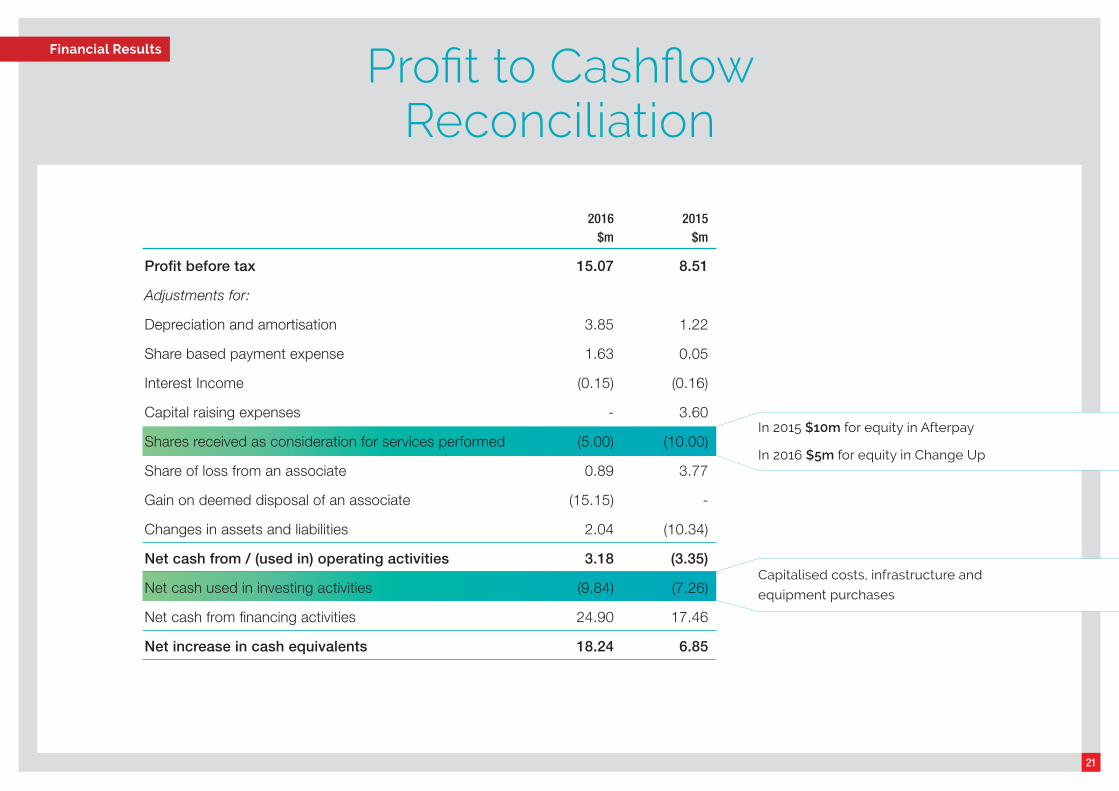
Profit to Cashflow Reconciliation
Financial Results
Capitalised costs, infrastructure and
equipment purchases
2016 2015 $m $m
Profit before tax 15.07 8.51
Adjustments for:
Depreciation and amortisation 3.85 1.22
Share based payment expense 1.63 0.05
Interest Income (0.15) (0.16)
Capital raising expenses - 3.60
Shares received as consideration for services performed (5.00) (10.00)
Share of loss from an associate 0.89 3.77
Gain on deemed disposal of an associate (15.15) -
Changes in assets and liabilities 2.04 (10.34)
Net cash from / (used in) operating activities 3.18 (3.35)
Net cash used in investing activities (9.84) (7.26)
Net cash from financing activities 24.90 17.46
Net increase in cash equivalents 18.24 6.85
In 2015 $10m for equity in Afterpay
In 2016 $5m for equity in Change Up

Outlook
22
23
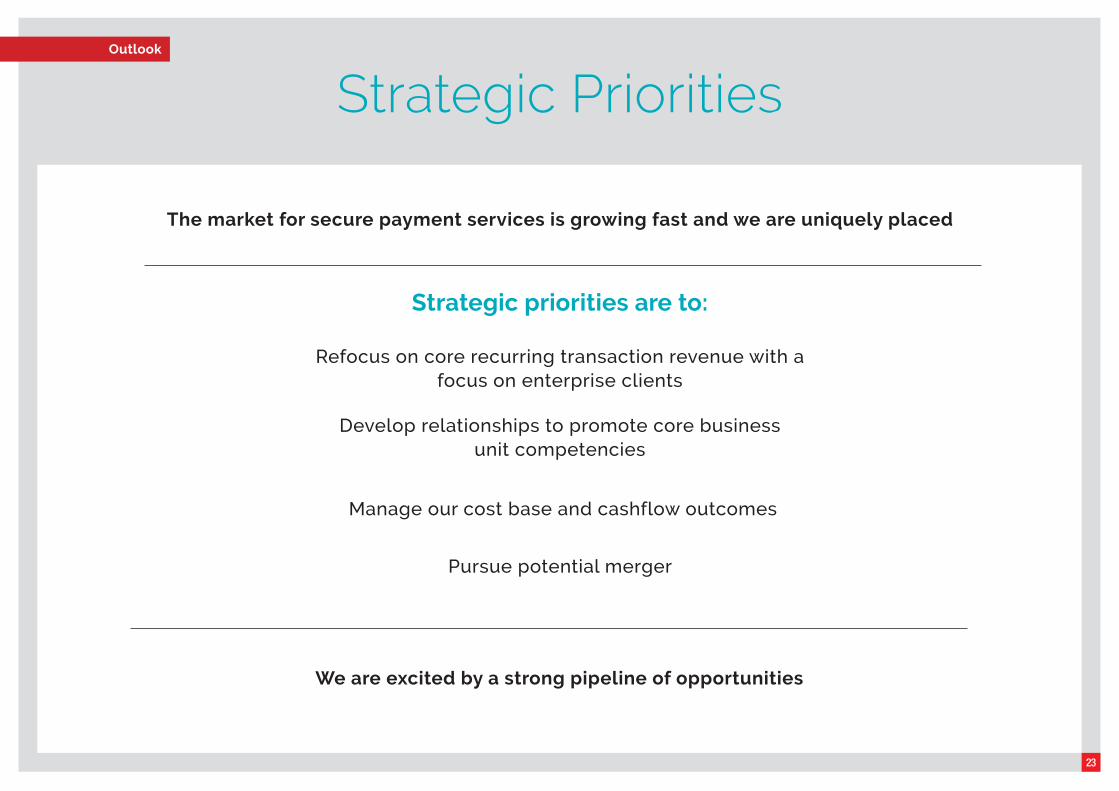
Strategic PrioritiesOutlook
We are excited by a strong pipeline of opportunities
Refocus on core recurring transaction revenue with a focus on enterprise clients
Develop relationships to promote core business unit competencies
Manage our cost base and cashflow outcomes
Pursue potential merger
The market for secure payment services is growing fast and we are uniquely placed
Strategic priorities are to:
24
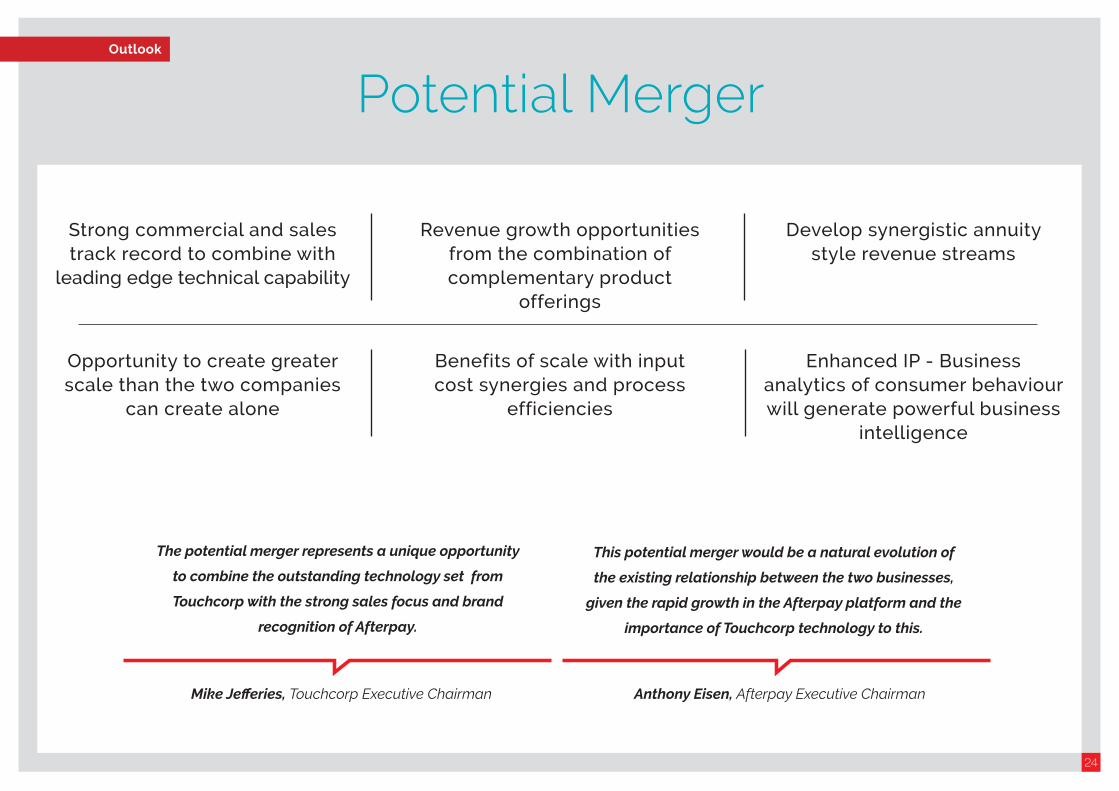
Potential MergerOutlook
Strong commercial and sales track record to combine with
leading edge technical capability
Revenue growth opportunities from the combination of complementary product
offerings
Develop synergistic annuity style revenue streams
Opportunity to create greater scale than the two companies
can create alone
This potential merger would be a natural evolution of
the existing relationship between the two businesses,
given the rapid growth in the Afterpay platform and the
importance of Touchcorp technology to this.
Anthony Eisen, Afterpay Executive Chairman
The potential merger represents a unique opportunity
to combine the outstanding technology set from
Touchcorp with the strong sales focus and brand
recognition of Afterpay.
Mike Jefferies, Touchcorp Executive Chairman
Benefits of scale with input cost synergies and process
efficiencies
Enhanced IP - Business analytics of consumer behaviour will generate powerful business
intelligence

Thank You
Outlook
25