tourism facts 2016 - failte ireland 1 | p a g e tourism facts 2016 august 2017 issued by: research...
TRANSCRIPT

1 | P a g e
TOURISM FACTS 2016
August 2017
Issued By:
Research & Evaluation Fáilte Ireland Amiens St
Dublin 1 Tel: 01-884 7700
Website: www.failteireland.ie Email: [email protected]
All estimates are based on information from the CSO's Country of Residence Survey (CRS), Passenger Card Inquiry (PCI) Survey and Household Travel Survey (HTS), NISRA’s Northern Ireland Passenger Survey (NIPS), NISRA’s Continuous Household Survey (CHS),
Fáilte Ireland's Survey of Overseas Travellers (SOT), Port Survey of Holidaymakers, Accommodation Occupancy Survey, Visitor Attractions Survey, Domestic Omnibus Survey, and Capita (Register of Accommodation).
Tourism Ireland is responsible for marketing the Island of Ireland overseas. Information on Tourism Ireland’s marketing activities and
the performance of overseas tourism to the island of Ireland is available on www.tourismireland.com/corporate/

2 | P a g e
TOURISM FACTS 2016
Expenditure by tourists visiting Ireland (including receipts paid to Irish carriers by foreign visitors) was estimated to be worth €6.6 billion in 2016, this represents growth of 9.5% on 2015. Combining spending by international tourists with the money spent by Irish residents taking trips here, total tourism expenditure in 2016 was estimated to be €8.3 billion.
Overseas tourist visits to Ireland in 2016 grew by 8.8% to 8.742 million. Short haul markets, Britain and Mainland Europe recorded respective growth of 8.5% and 7.7%. North America also performed very strongly, increasing by 14.2%. Britain remains our biggest source market for overseas tourists, representing 41.5% of all such visits. The next biggest source market is Mainland Europe, which accounts for 35.6% of international volume. Some 16.9% of overseas tourists come from North America. The balance, 6.1%, comes from other long haul markets.
Economic benefits In 2016, out-of-state tourist expenditure amounted to €5.1 billion. With a further €1.5 billion spent by overseas visitors on fares to Irish carriers, foreign exchange earnings were €6.6 billion. Domestic tourism expenditure amounted to €1.8 billion, making tourism a €8.4 billion industry. Government earned estimated revenue of €1.9 billion through taxation of tourism, of which €1.5 billion came from foreign tourism. In 2016 the tourism industry accounted for 4.0% of all tax revenue. In 2016 the value of exported goods and services was estimated at €317.2 billion of which €6.6 billion can be directly attributed to tourism, accounting for 2.1% of export earnings. Being largely service based, tourism goods have low import content in comparison to other exports. Total out-of-state and domestic tourism expenditure of €8.4 billion in 2016 represented 4.4% of modified GNI1 in revenue terms. Because tourism is characterised by the fact that consumption takes place where the service is available and tourism activity is frequently concentrated in areas which lack an intensive industry base, it is credited with having a significant regional distributive effect. Direct employment in the tourism and hospitality industry The Central Statistics Office’s official count of direct employment in ‘Accommodation and food service activities’, a category which includes hotels, restaurants, bars, canteens and catering, was 149,500 in 2016 (7.4% of total employment). This estimate of employment is based on the CSO Household Survey and the jobs identified are defined as ‘the respondent’s main job’ and include both full-time and part-time. Source: CSO Quarterly National Household Survey Drawing on an alternative approach, an estimate of all jobs in the tourism and hospitality industry based on past Fáilte Ireland surveys of businesses (full-time, part-time, seasonal/casual and not confined to ‘main’ job) indicates total employment in the sector at approximately 225,000. This estimate includes an additional category of tourism services and attractions which is not covered by the CSO.
1 Modified gross national income (or GNI*) is defined as GNI less the effects of the profits of re-domiciled companies and the depreciation of intellectual property products and aircraft leasing companies. GNI*is designed as a supplementary
indicator of the level of the Irish economy for use in ratio analysis as an alternative to GDP.
3 | P a g e
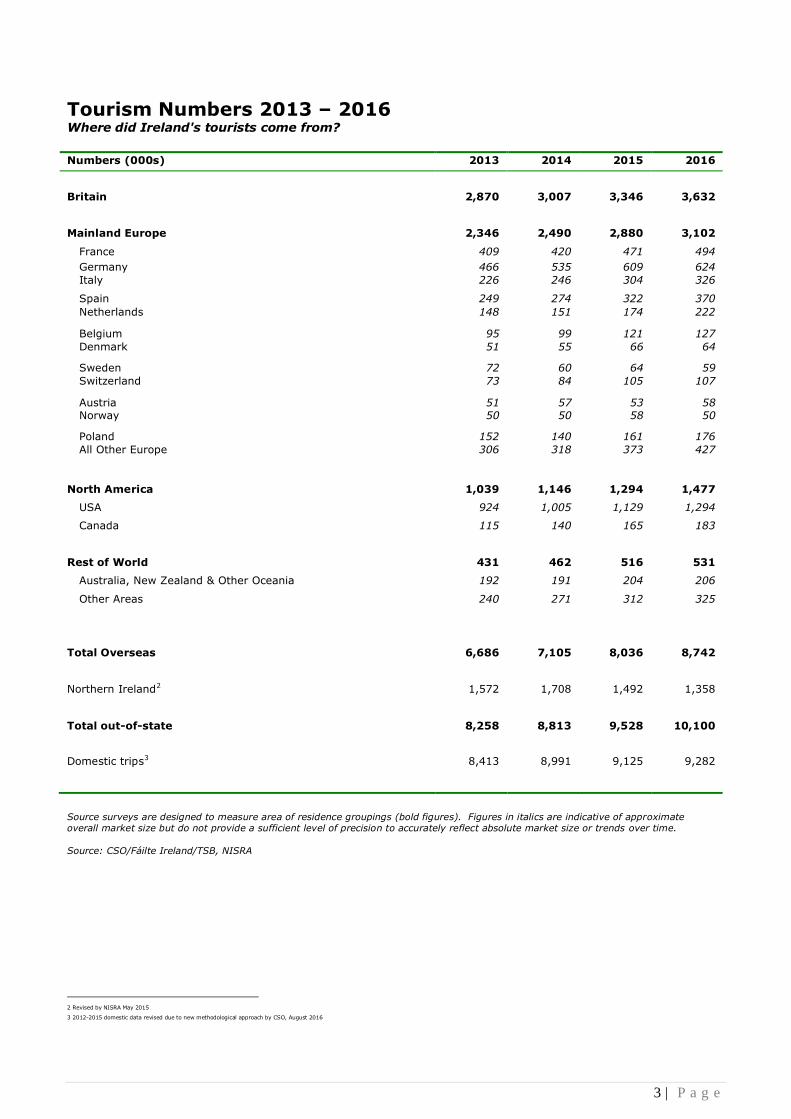
Tourism Numbers 2013 – 2016 Where did Ireland's tourists come from?
Numbers (000s) 2013 2014 2015 2016
Britain 2,870 3,007 3,346 3,632
Mainland Europe 2,346 2,490 2,880 3,102
France 409 420 471 494
Germany 466 535 609 624
Italy 226 246 304 326
Spain 249 274 322 370
Netherlands 148 151 174 222
Belgium 95 99 121 127
Denmark 51 55 66 64
Sweden 72 60 64 59
Switzerland 73 84 105 107
Austria 51 57 53 58 Norway 50 50 58 50
Poland 152 140 161 176
All Other Europe 306 318 373 427
North America 1,039 1,146 1,294 1,477
USA 924 1,005 1,129 1,294
Canada 115 140 165 183
Rest of World 431 462 516 531
Australia, New Zealand & Other Oceania 192 191 204 206
Other Areas 240 271
312 325
Total Overseas 6,686 7,105 8,036 8,742
Northern Ireland2 1,572 1,708 1,492 1,358
Total out-of-state 8,258 8,813 9,528 10,100
Domestic trips3 8,413 8,991 9,125 9,282
Source surveys are designed to measure area of residence groupings (bold figures). Figures in italics are indicative of approximate overall market size but do not provide a sufficient level of precision to accurately reflect absolute market size or trends over time.
Source: CSO/Fáilte Ireland/TSB, NISRA
2 Revised by NISRA May 2015
3 2012-2015 domestic data revised due to new methodological approach by CSO, August 2016
4 | P a g e
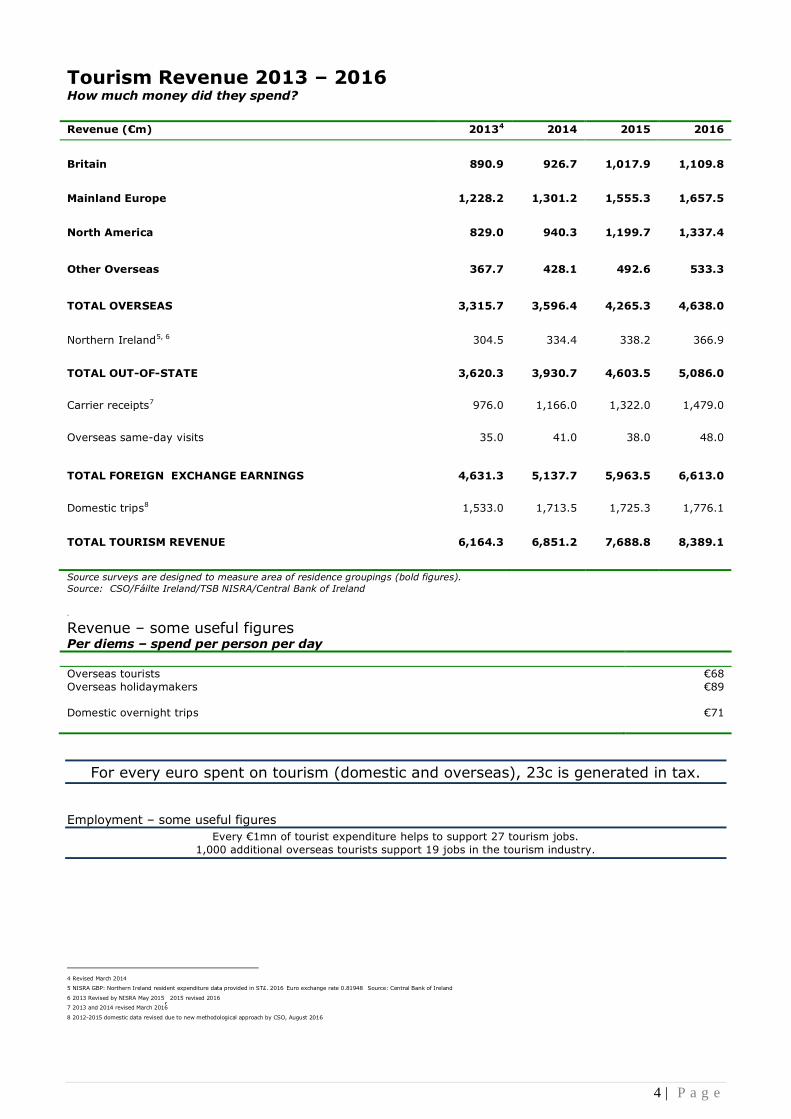
Tourism Revenue 2013 – 2016 How much money did they spend?
Revenue (€m) 20134 2014 2015 2016
Britain 890.9 926.7 1,017.9 1,109.8
Mainland Europe 1,228.2 1,301.2 1,555.3 1,657.5
North America 829.0 940.3 1,199.7 1,337.4
Other Overseas 367.7 428.1 492.6 533.3
TOTAL OVERSEAS 3,315.7 3,596.4 4,265.3 4,638.0
Northern Ireland5, 6 304.5 334.4 338.2 366.9
TOTAL OUT-OF-STATE 3,620.3 3,930.7 4,603.5 5,086.0
Carrier receipts7 976.0 1,166.0 1,322.0 1,479.0
Overseas same-day visits 35.0 41.0 38.0 48.0
TOTAL FOREIGN EXCHANGE EARNINGS 4,631.3 5,137.7 5,963.5 6,613.0
Domestic trips8 1,533.0 1,713.5 1,725.3 1,776.1
TOTAL TOURISM REVENUE 6,164.3 6,851.2 7,688.8 8,389.1
Source surveys are designed to measure area of residence groupings (bold figures).
Source: CSO/Fáilte Ireland/TSB NISRA/Central Bank of Ireland
.
Revenue – some useful figures Per diems – spend per person per day
Overseas tourists €68
Overseas holidaymakers €89
Domestic overnight trips €71
For every euro spent on tourism (domestic and overseas), 23c is generated in tax.
Employment – some useful figures
Every €1mn of tourist expenditure helps to support 27 tourism jobs.
1,000 additional overseas tourists support 19 jobs in the tourism industry.
4 Revised March 2014
5 NISRA GBP: Northern Ireland resident expenditure data provided in ST£. 2016 Euro exchange rate 0.81948 Source: Central Bank of Ireland
6 2013 Revised by NISRA May 2015, 2015 revised 2016
7 2013 and 2014 revised March 2016
8 2012-2015 domestic data revised due to new methodological approach by CSO, August 2016

5 | P a g e
Regional Performance 2016 Where did tourists go in 2016? (EUROSTAT NUTS 3 REGIONS, see pg 12)
Numbers (000s)
Revenue (€m) Britain
Mainland
Europe
North
America
Other
Areas
All
Overseas
Northern
Ireland
Domestic
Trips
Dublin 1,893 2,231 1,169 394 5,687 310 1,406
368 764 496 347 1,975 106 272
Mid East9 241 234 108 42 626 37 704
68 99 65 18 251 14 123
Midlands10 128 64 28 6 226 18 401
31 25 13 2 72 6 66
South East 358 290 227 71 946 67 1,355
112 73 56 32 273 25 233
South West 593 772 591 122 2,079 84 2,006
200 280 317 52 849 38 401
Mid West 377 401 357 80 1,215 9 817
102 133 120 36 390 2 170
West 350 733 479 114 1,675 155 1,591
110 191 210 33 543 54 329
Border 360 263 144 47 815 679 1,001
120 92 60 13 286 123 183
Source: CSO/Fáilte Ireland NISRA/Central Bank of Ireland
Overseas Tourists in 2016
How did overseas tourists spend their money in Ireland?
Breakdown of spend in Ireland (%) Total Britain Mainland
Europe
North
America
Rest of
World Bed & board 33 29 34 34 33
Other food & drink 34 40 33 32 32
Sightseeing/entertainment 6 5 7 6 7
Internal transport 12 12 12 13 11
Shopping 12 11 12 13 14
Miscellaneous 2 2 2 2 3
9 Caution – small sample sizes in individual market areas
10 Caution – small sample sizes in individual market areas
6 | P a g e
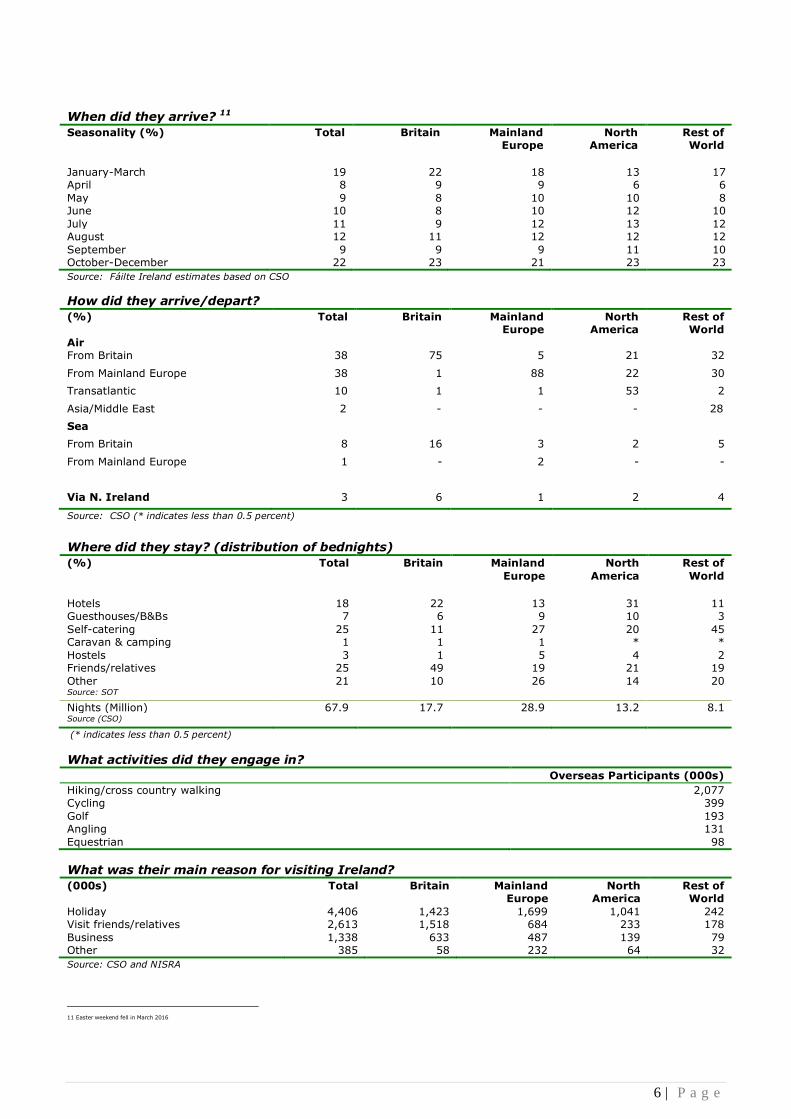
When did they arrive? 11
Seasonality (%) Total Britain Mainland Europe
North America
Rest of World
January-March 19 22 18 13 17 April 8 9 9 6 6
May 9 8 10 10 8 June 10 8 10 12 10
July 11 9 12 13 12 August 12 11 12 12 12
September 9 9 9 11 10 October-December 22 23 21 23 23
Source: Fáilte Ireland estimates based on CSO
How did they arrive/depart?
(%)
Total Britain Mainland Europe
North America
Rest of World
Air From Britain 38 75 5 21 32
From Mainland Europe 38 1 88 22 30
Transatlantic 10 1 1 53 2
Asia/Middle East 2 - - - 28
Sea
From Britain 8 16 3 2 5
From Mainland Europe 1 - 2 - -
Via N. Ireland 3 6 1 2 4
Source: CSO (* indicates less than 0.5 percent)
Where did they stay? (distribution of bednights)
(%)
Total Britain Mainland
Europe
North
America
Rest of
World
Hotels 18 22 13 31 11 Guesthouses/B&Bs 7 6 9 10 3
Self-catering 25 11 27 20 45 Caravan & camping 1 1 1 * *
Hostels 3 1 5 4 2 Friends/relatives 25 49 19 21 19
Other 21 10 26 14 20 Source: SOT
Nights (Million) 67.9 17.7 28.9 13.2 8.1 Source (CSO)
(* indicates less than 0.5 percent)
What activities did they engage in?
Overseas Participants (000s)
Hiking/cross country walking 2,077 Cycling 399
Golf 193 Angling 131
Equestrian 98
What was their main reason for visiting Ireland?
(000s)
Total Britain Mainland Europe
North America
Rest of World
Holiday 4,406 1,423 1,699 1,041 242 Visit friends/relatives 2,613 1,518 684 233 178
Business 1,338 633 487 139 79 Other 385 58 232 64 32
Source: CSO and NISRA
11 Easter weekend fell in March 2016

7 | P a g e
In 2016, just under on third (31%) of those coming to Ireland to visit friends/relatives were born in Ireland.
Overseas Holidaymakers 2016 Holidaymakers in this section are defined as tourists who stated that their primary purpose for visiting Ireland was a holiday.
What was the total number of holidaymakers in 2016?
Holidaymakers (000s) 2011 2012 2013 2014 2015 2016 Britain 961 941 979 1,057 1,254 1,423
Mainland Europe 1,041 1,120 1,227 1,314 1,612 1,699 North America 591 634 718 803 926 1,041
Rest of World 167 184 220 219 243 242 Total 2,760 2,879 3,144 3,393 4,036 4,406
Source: CSO and NISRA
Sources of information for choosing/planning a holiday in Ireland (%)
Source: Fáilte Ireland’s Port Survey of Holidaymakers 2016
How did they arrange their holiday?
(%) Total Britain Mainland Europe
North America
Rest of World
Package* 17 6 15 28 16 Independent 83 94 85 72 84
* Prepaid an inclusive price for fares to/from Ireland and at least one other element of the holiday.
Source: Fáilte Ireland’s Survey of Overseas Travellers
What were the characteristics of holidaymakers to Ireland (%)? Experience of Ireland Use of car Age Social class Party composition
First visit 64 Car brought 11 Under 25 years 22 Managerial/professional (AB) 30 Alone 19
Repeat 36 Car hired 31 25-34 years 24 White collar (C1) 57 Couple 42 Irish-born 1 Car not used 58 35-44 years 13 Skilled worker (C2) 10 Family 15
45+ years 40 Unskilled worker (DE) 3 Other adult group 23
Source: Fáilte Ireland’s Survey of Overseas Travellers
80
28
12
23
53
51
9
20
Internet
Friends/family
Travel agent
Guidebooks
Choosing Planning

8 | P a g e
Importance and rating of destination issues among overseas holidaymakers (%)
Source: Fáilte Ireland’s Port Survey of Overseas Holidaymakers 2016
92
88
91
85
72
85
82
80
50
99
97
95
95
93
91
90
89
83
Friendly, hospitable people
Safe and secure destination
Beautiful scenery
Interesting history and culture
Easy, relaxed pace of life
Good range of natural attractions
Natural unspoilt environment
Attractive cities and towns
Suitable for touring
Important Satisfied
9 | P a g e
Domestic Tourism in 201612 Domestic trips (000s) by purpose of travel
2013 2014 2015 2016
Holiday trips 4,073 4,436 4,658 4,830
- Long (4+ nights) 1,088 1,144 1,078 1,144
- Short (1-3 nights) 2,985 3,292 3,580 3,686
Visiting friends/relatives trips 2,988 2,918 2,921 3,032
Business trips 364 453 407 425
Other trips 988 1,184 1,138 994
Total trips 8,413 8,991 9,125 9,282
Source: CSO Household Travel Surveys 2013-2016
Domestic expenditure (€m) by purpose of travel
2013 2014 2015 2016
Holiday trips 947.2 992.8 1,070.4 1,123.9
- Long (4+ nights) 395.2 385.6 394.2 418.4
- Short (1-3 nights) 552.0 607.1 676.2 705.5
Visiting friends/relatives trips 284.8 327.0 296.5 294.5
Business trips 84.2 110.3 98.0 104.7
Other trips 216.8 283.4 260.4 253.0
Total expenditure 1,533 1,713.5 1,725.3 1,776.1
Source: CSO Household Travel Surveys 2013-2016
Accommodation bednights domestic holidaymakers (%)
2013 2014 2015 2016
Hotels 34 34 35 36
Guesthouse/B&Bs 3 4 4 4
Caravan/camping 15 14 7 13
Self-catering 22 23 22 20
Holiday home 15 12 19 13
Friends/relatives 10 13 10 13
Other 1 1 3 2
Source: CSO Household Travel Surveys 2013-2016
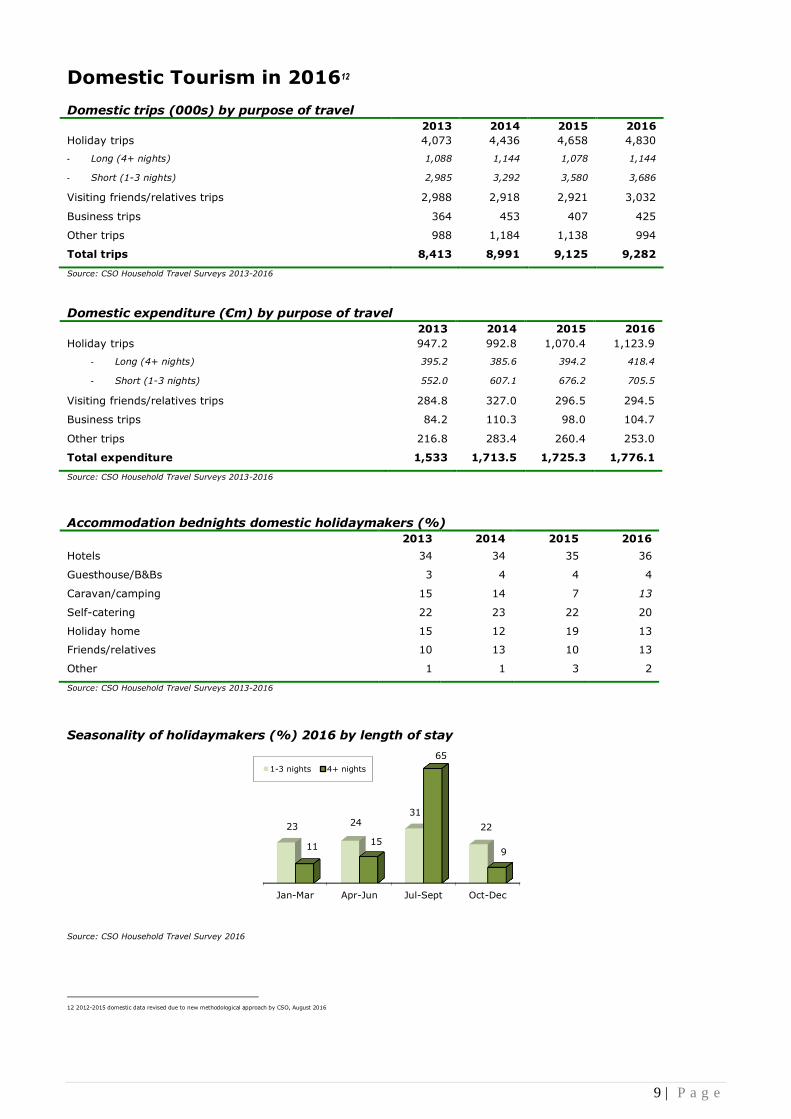
Seasonality of holidaymakers (%) 2016 by length of stay
Source: CSO Household Travel Survey 2016
12 2012-2015 domestic data revised due to new methodological approach by CSO, August 2016
Jan-Mar Apr-Jun Jul-Sept Oct-Dec
23 24 31
22
11 15
65
9
1-3 nights 4+ nights
10 | P a g e
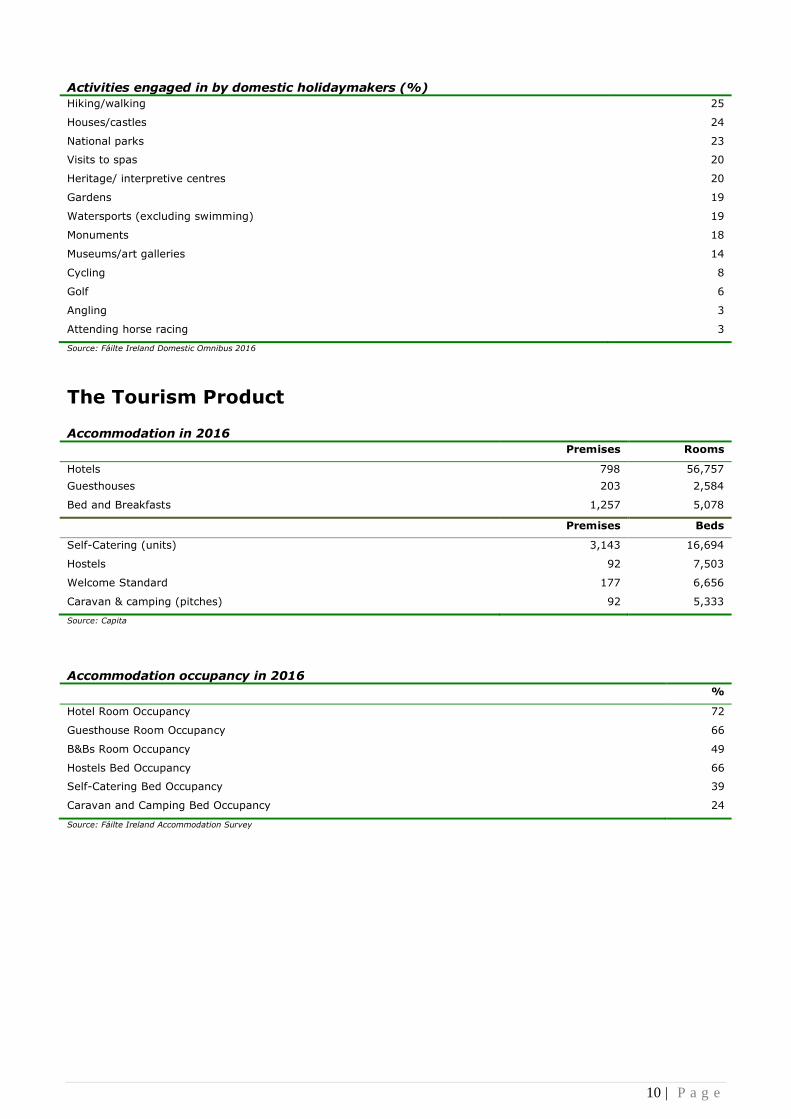
Activities engaged in by domestic holidaymakers (%)
Hiking/walking 25
Houses/castles 24
National parks 23
Visits to spas 20
Heritage/ interpretive centres 20
Gardens 19
Watersports (excluding swimming) 19
Monuments 18
Museums/art galleries 14
Cycling 8
Golf 6
Angling 3
Attending horse racing 3
Source: Fáilte Ireland Domestic Omnibus 2016
The Tourism Product Accommodation in 2016
Premises Rooms
Hotels 798 56,757
Guesthouses 203 2,584
Bed and Breakfasts 1,257 5,078
Premises Beds
Self-Catering (units) 3,143 16,694
Hostels 92 7,503
Welcome Standard 177 6,656
Caravan & camping (pitches) 92 5,333
Source: Capita
Accommodation occupancy in 2016
%
Hotel Room Occupancy 72
Guesthouse Room Occupancy 66
B&Bs Room Occupancy 49
Hostels Bed Occupancy 66
Self-Catering Bed Occupancy 39
Caravan and Camping Bed Occupancy 24
Source: Fáilte Ireland Accommodation Survey

11 | P a g e
Attendance at popular visitor attractions in Ireland 2016
Top Fee-Charging Attractions Top Free Attractions
Name of Attraction County 2016 Name of Attractions County 2016
Guinness Storehouse Dublin 1,647,408 The National Gallery of Ireland
Dublin 755,577
Cliffs of Moher Visitor Experience
Clare 1,427,166 Irish Museum of Modern Art
Dublin 584,856
Dublin Zoo Dublin 1,143,908 National Botanic Gardens Dublin 583,539
National Aquatic Centre Dublin 1,037,992 Doneraile Wildlife Park Cork 480,000
Book of Kells Dublin 890,781 National Museum of Ireland - Archaeology, Kildare St
Dublin 479,261
Tayto Park Meath 762,000 Science Gallery at Trinity College Dublin
Dublin 413,900
St Patrick's Cathedral Dublin 563,000 National Museum of Ireland - Decorative Arts & History, Collins Barracks
Dublin 411,391
Castletown House & Parklands
Kildare 547,324 Farmleigh Dublin 383,335
Powerscourt Gardens & Waterfall
Wicklow 467,507 Chester Beatty Library Dublin 371,211
Fota Wildlife Park Cork 465,281 Newbridge Silverware Museum of Style Icons
Kildare 350,000
Kylemore Abbey & Garden Galway 458,000 National Museum of Ireland - Natural History, Merrion St
Dublin 317,269
Blarney Castle Cork 420,000 Croagh Patrick Visitor Centre
Mayo 220,000
Kilmainham Gaol Dublin 390,970 Galway City Museum Galway 213,390
Kilkenny Castle Kilkenny 384,918 Connemara National Park Galway 210,812
Bunratty Castle & Folk Park Clare 352,286 Dublin City Gallery The Hugh Lane
Dublin 193,229
Rock of Cashel Tipperary 338,830 Crawford Art Gallery Cork 178,302
Emo Court House & Gardens
Laois 293,056 Sliabh Liag Cliffs Donegal 177,333
Old Jameson Distillery Dublin 269,000 Malin Head Viewing Point Donegal 162,468
Dublin Castle Dublin 253,786 Kilmacurragh Gardens Wicklow 156,045
Christ Church Cathedral Dublin 229,085 Nicholas Mosse Pottery Kilkenny 142,000
Phoenix Park Visitor Centre Dublin 206,326 National Museum of Ireland - Country Life, Turlough Park
Mayo 107,855
Source: Fáilte Ireland Visitor Attraction Survey 2016
12 | P a g e
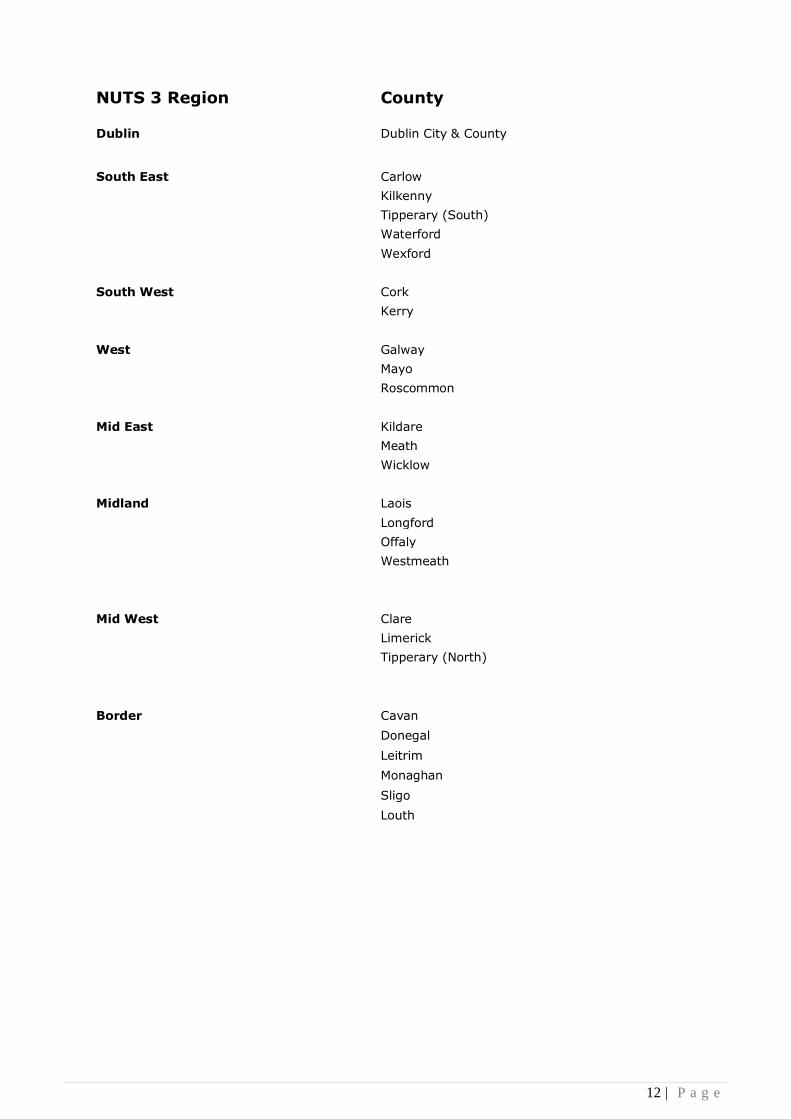
NUTS 3 Region County
Dublin Dublin City & County
South East Carlow
Kilkenny
Tipperary (South)
Waterford
Wexford
South West Cork
Kerry
West Galway
Mayo
Roscommon
Mid East Kildare
Meath
Wicklow
Midland Laois
Longford
Offaly
Westmeath
Mid West Clare
Limerick
Tipperary (North)
Border Cavan
Donegal
Leitrim
Monaghan
Sligo
Louth