tourism industries - employment statistics explainedfigure 4: share of persons employed, by economic...
TRANSCRIPT
Tourism industries -employment Statistics Explained
Source : Statistics Explained (https://ec.europa.eu/eurostat/statisticsexplained/) - 07/08/2019 1
Data extracted in December 2018.Planned article update: January 2022.
This article presents recent statistics on employment in the tourism industries in the European Union (EU).Tourism statistics focus on either the accommodation sector (data collected from hotels, campsites, etc.) or ontourism demand (data collected from households), and relate mainly to physical flows (arrivals or nights spentin tourist accommodation or trips made by a country’s residents). However, this analysis of employment intourism is based on data from other areas of official statistics, in particular structural business statistics (SBS),the labour force survey (LFS), the structure of earnings survey (SES) and the labour cost survey (LCS).
The creation of jobs and growth is a key priority of the Commission. This article analyses the tourism sectorwith a focus on its contribution to the labour market in the EU and its potential to create jobs for economicallyless advantaged socio-demographic groups or regions.
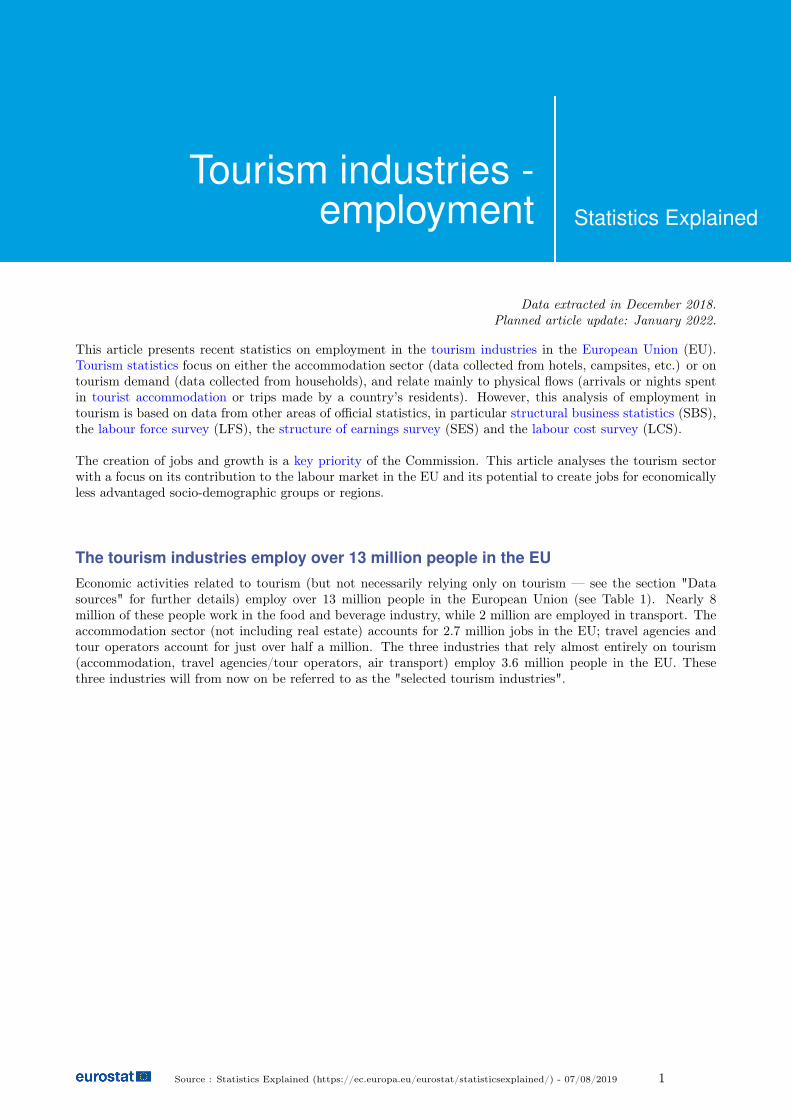
The tourism industries employ over 13 million people in the EUEconomic activities related to tourism (but not necessarily relying only on tourism — see the section "Datasources" for further details) employ over 13 million people in the European Union (see Table 1). Nearly 8million of these people work in the food and beverage industry, while 2 million are employed in transport. Theaccommodation sector (not including real estate) accounts for 2.7 million jobs in the EU; travel agencies andtour operators account for just over half a million. The three industries that rely almost entirely on tourism(accommodation, travel agencies/tour operators, air transport) employ 3.6 million people in the EU. Thesethree industries will from now on be referred to as the "selected tourism industries".
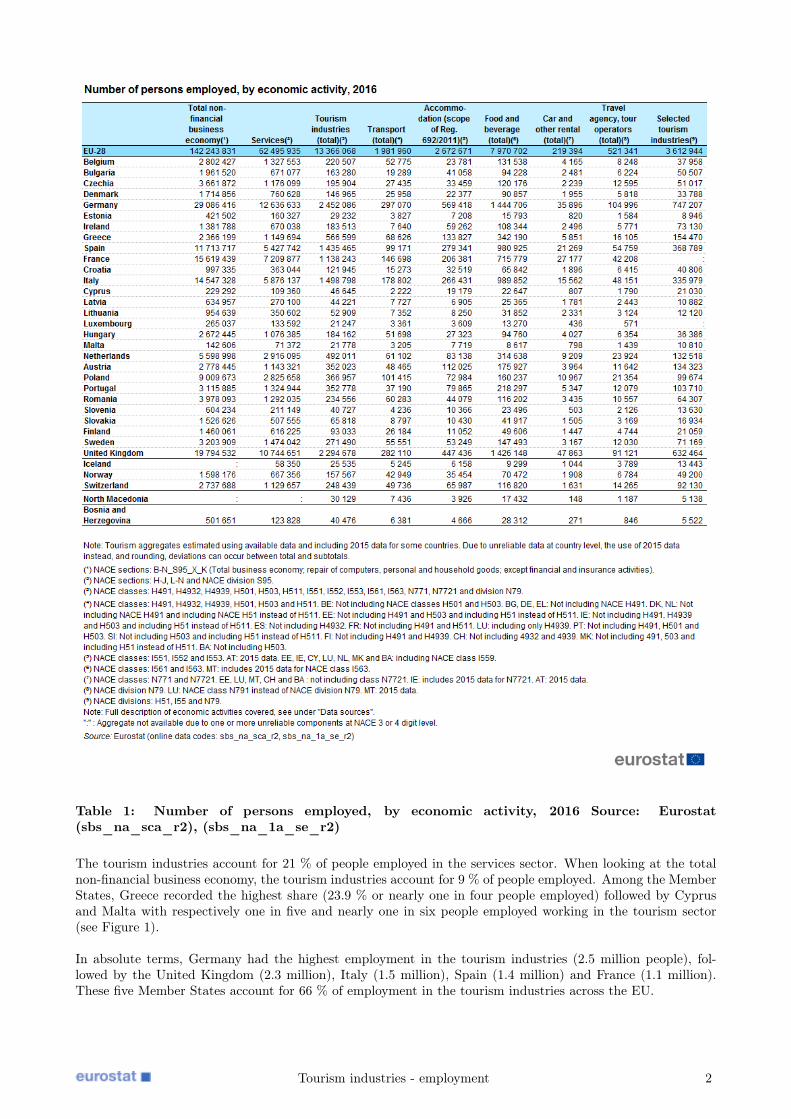
Table 1: Number of persons employed, by economic activity, 2016 Source: Eurostat(sbs_na_sca_r2), (sbs_na_1a_se_r2)
The tourism industries account for 21 % of people employed in the services sector. When looking at the totalnon-financial business economy, the tourism industries account for 9 % of people employed. Among the MemberStates, Greece recorded the highest share (23.9 % or nearly one in four people employed) followed by Cyprusand Malta with respectively one in five and nearly one in six people employed working in the tourism sector(see Figure 1).
In absolute terms, Germany had the highest employment in the tourism industries (2.5 million people), fol-lowed by the United Kingdom (2.3 million), Italy (1.5 million), Spain (1.4 million) and France (1.1 million).These five Member States account for 66 % of employment in the tourism industries across the EU.
Tourism industries - employment 2
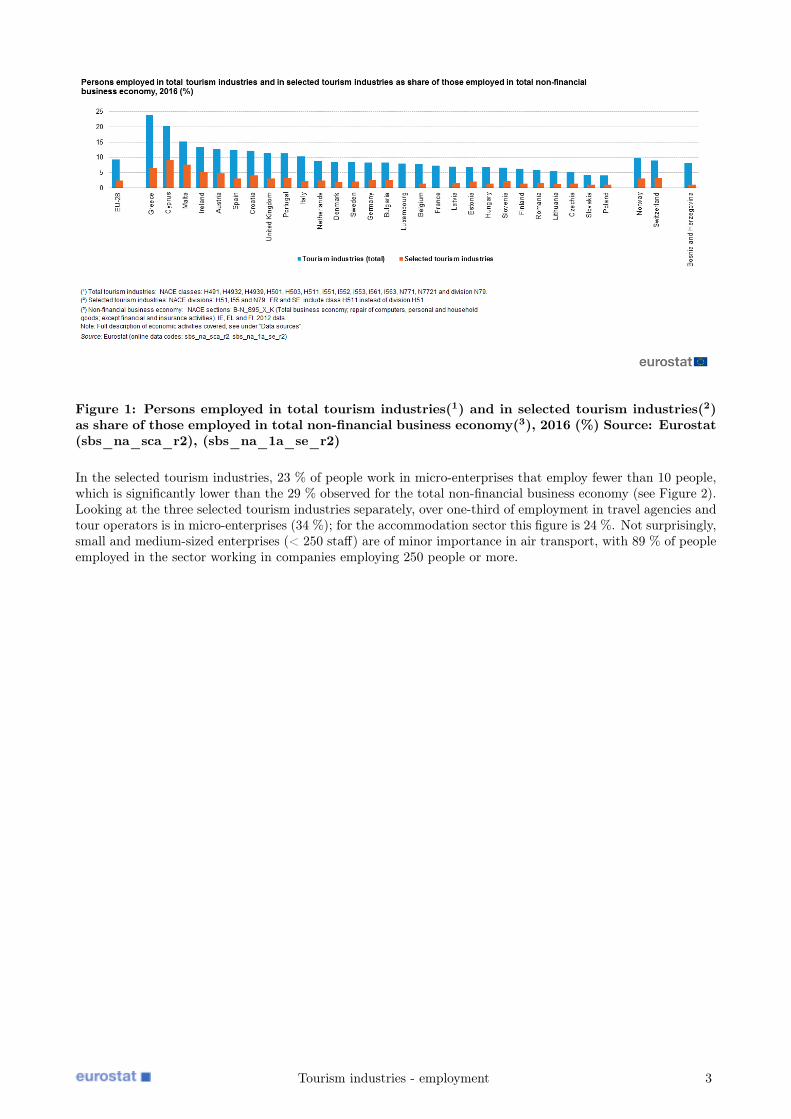
Figure 1: Persons employed in total tourism industries(1) and in selected tourism industries(2)as share of those employed in total non-financial business economy(3), 2016 (%) Source: Eurostat(sbs_na_sca_r2), (sbs_na_1a_se_r2)
In the selected tourism industries, 23 % of people work in micro-enterprises that employ fewer than 10 people,which is significantly lower than the 29 % observed for the total non-financial business economy (see Figure 2).Looking at the three selected tourism industries separately, over one-third of employment in travel agencies andtour operators is in micro-enterprises (34 %); for the accommodation sector this figure is 24 %. Not surprisingly,small and medium-sized enterprises (< 250 staff) are of minor importance in air transport, with 89 % of peopleemployed in the sector working in companies employing 250 people or more.
Tourism industries - employment 3
Figure 2: Share of persons employed by enterprise size class, by economic activity, EU-28, 2016(%) Source: Eurostat (sbs_na_sca_r2), (sbs_na_1a_se_r2)
The economic crisis led to a fall in total employment which started recovering in 2014 and reached the beforecrisis levels in 2016 (see Figure 3). However, this was not the case for the services sector, including the selectedcore tourism industries, which has had an average annual growth rate of +1.5 % since 2008. More specifically,the tourist accommodation sector registered an average annual growth of +1.9 % since 2008, resulting to a totalincrease of +18 % in 2017 compared with 2008. This shows the tourism industry’s potential as a growth sector,even in times of economic turmoil that significantly affect other sectors of the economy.
Tourism industries - employment 4
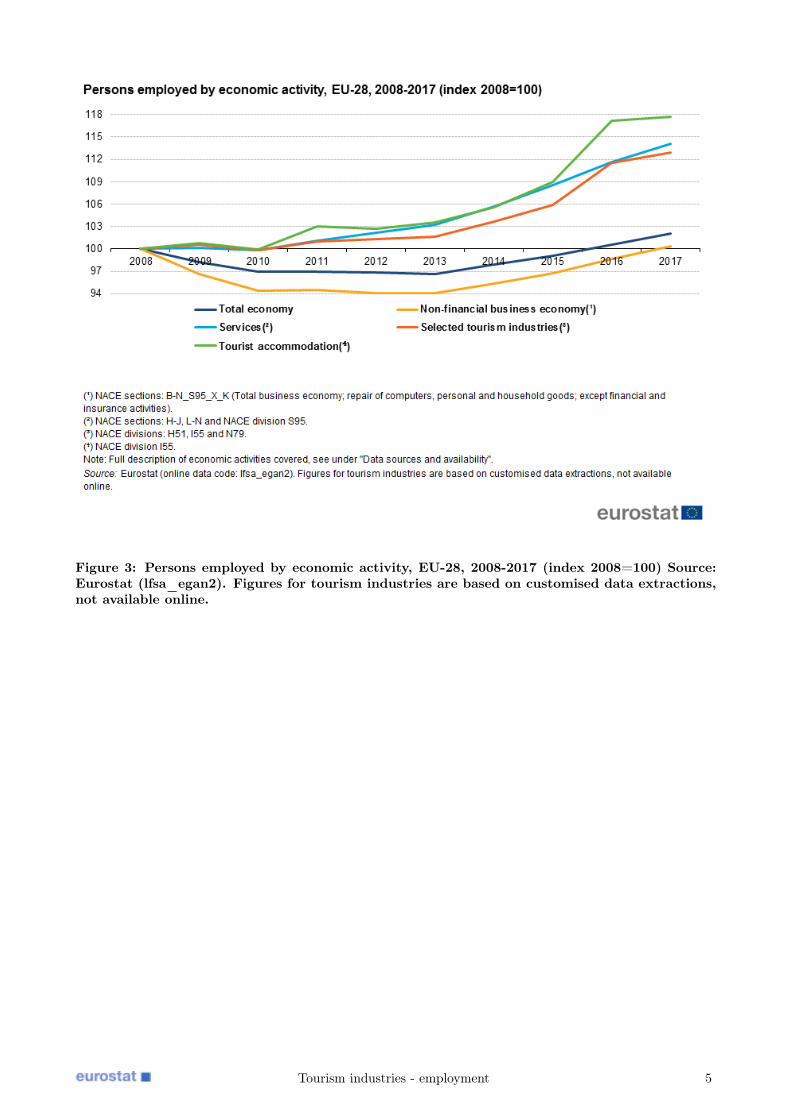
Figure 3: Persons employed by economic activity, EU-28, 2008-2017 (index 2008=100) Source:Eurostat (lfsa_egan2). Figures for tourism industries are based on customised data extractions,not available online.
Tourism industries - employment 5
Characteristics of jobs in tourism industries
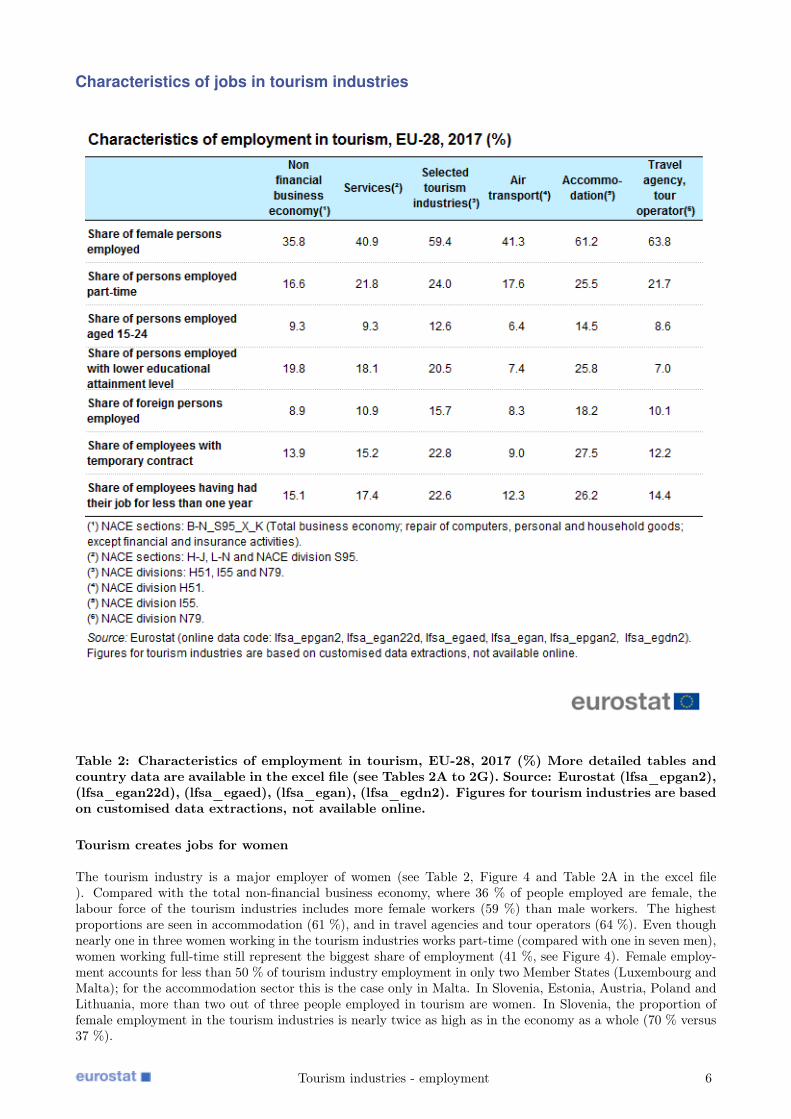
Table 2: Characteristics of employment in tourism, EU-28, 2017 (%) More detailed tables andcountry data are available in the excel file (see Tables 2A to 2G). Source: Eurostat (lfsa_epgan2),(lfsa_egan22d), (lfsa_egaed), (lfsa_egan), (lfsa_egdn2). Figures for tourism industries are basedon customised data extractions, not available online.
Tourism creates jobs for women
The tourism industry is a major employer of women (see Table 2, Figure 4 and Table 2A in the excel file). Compared with the total non-financial business economy, where 36 % of people employed are female, thelabour force of the tourism industries includes more female workers (59 %) than male workers. The highestproportions are seen in accommodation (61 %), and in travel agencies and tour operators (64 %). Even thoughnearly one in three women working in the tourism industries works part-time (compared with one in seven men),women working full-time still represent the biggest share of employment (41 %, see Figure 4). Female employ-ment accounts for less than 50 % of tourism industry employment in only two Member States (Luxembourg andMalta); for the accommodation sector this is the case only in Malta. In Slovenia, Estonia, Austria, Poland andLithuania, more than two out of three people employed in tourism are women. In Slovenia, the proportion offemale employment in the tourism industries is nearly twice as high as in the economy as a whole (70 % versus37 %).
Tourism industries - employment 6
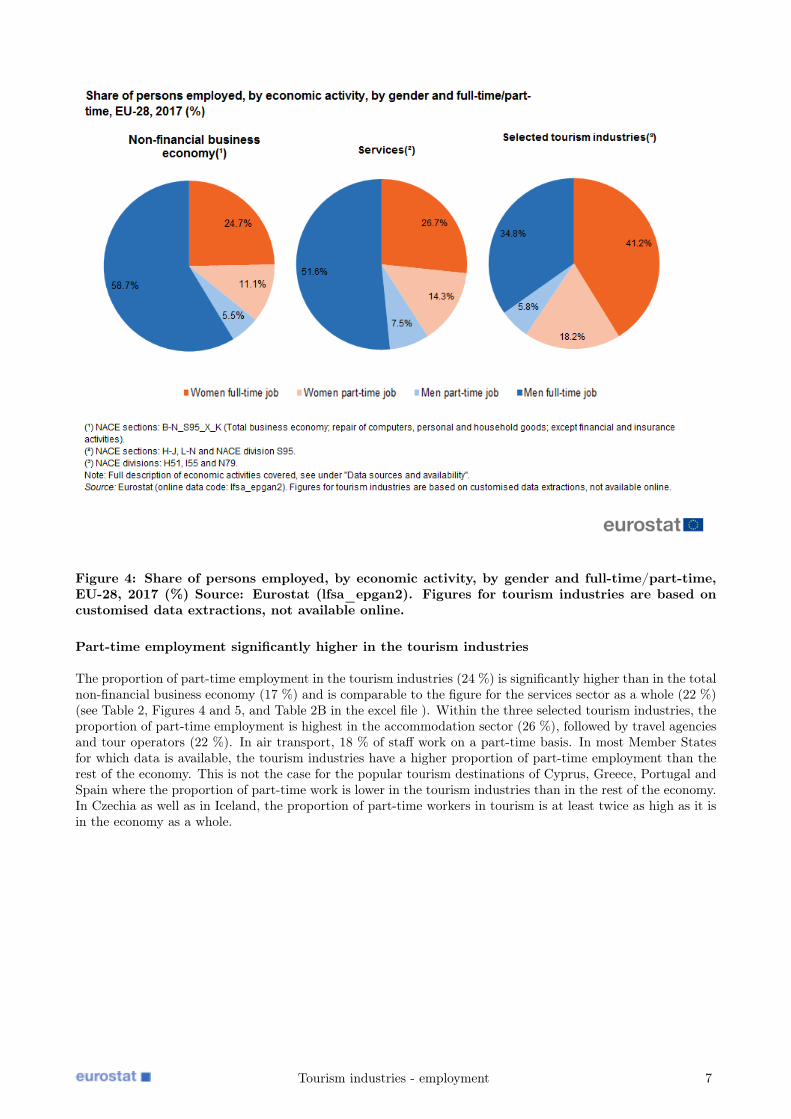
Figure 4: Share of persons employed, by economic activity, by gender and full-time/part-time,EU-28, 2017 (%) Source: Eurostat (lfsa_epgan2). Figures for tourism industries are based oncustomised data extractions, not available online.
Part-time employment significantly higher in the tourism industries
The proportion of part-time employment in the tourism industries (24 %) is significantly higher than in the totalnon-financial business economy (17 %) and is comparable to the figure for the services sector as a whole (22 %)(see Table 2, Figures 4 and 5, and Table 2B in the excel file ). Within the three selected tourism industries, theproportion of part-time employment is highest in the accommodation sector (26 %), followed by travel agenciesand tour operators (22 %). In air transport, 18 % of staff work on a part-time basis. In most Member Statesfor which data is available, the tourism industries have a higher proportion of part-time employment than therest of the economy. This is not the case for the popular tourism destinations of Cyprus, Greece, Portugal andSpain where the proportion of part-time work is lower in the tourism industries than in the rest of the economy.In Czechia as well as in Iceland, the proportion of part-time workers in tourism is at least twice as high as it isin the economy as a whole.
Tourism industries - employment 7
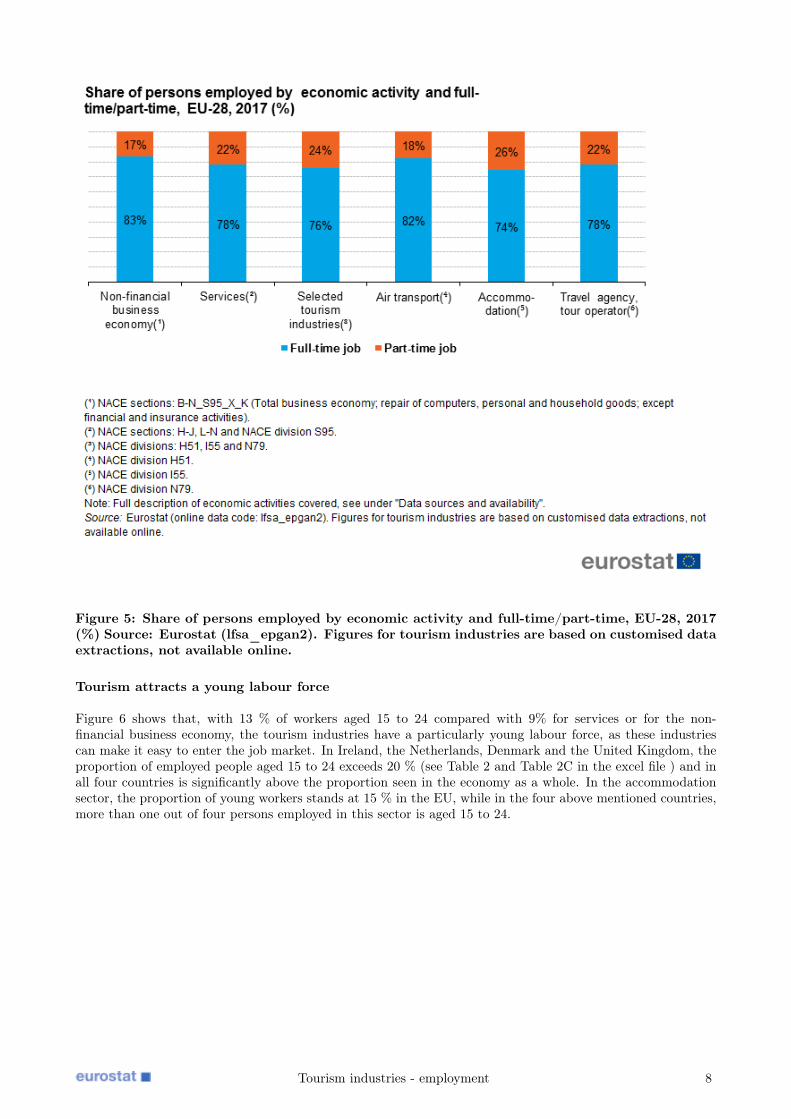
Figure 5: Share of persons employed by economic activity and full-time/part-time, EU-28, 2017(%) Source: Eurostat (lfsa_epgan2). Figures for tourism industries are based on customised dataextractions, not available online.
Tourism attracts a young labour force
Figure 6 shows that, with 13 % of workers aged 15 to 24 compared with 9% for services or for the non-financial business economy, the tourism industries have a particularly young labour force, as these industriescan make it easy to enter the job market. In Ireland, the Netherlands, Denmark and the United Kingdom, theproportion of employed people aged 15 to 24 exceeds 20 % (see Table 2 and Table 2C in the excel file ) and inall four countries is significantly above the proportion seen in the economy as a whole. In the accommodationsector, the proportion of young workers stands at 15 % in the EU, while in the four above mentioned countries,more than one out of four persons employed in this sector is aged 15 to 24.
Tourism industries - employment 8

Figure 6: Share of persons employed by economic activity and age group, EU-28, 2017 (%)Source: Eurostat (lfsa_egan22d). Figures for tourism industries are based on customised dataextractions, not available online.
The tourist accommodation sector gives more opportunities to lower educated workers
The previous sections showed that tourism employs more female workers and young workers. People witha lower educational level (those who have not finished upper secondary schooling) are equally represented onthe labour market as a whole and in the tourism sector (around 20 % for both) — see Table 2, Figure 7 andTable 2D in the excel file . However, in the subsector of accommodation, one in four people employed has a lowereducational level. In Malta, Spain and Portugal more than two out of five people employed in tourist accom-modation belong to this group. However in these three countries lower educated people are more representedin the whole labour force compared with the rest of EU countries.
Tourism industries - employment 9
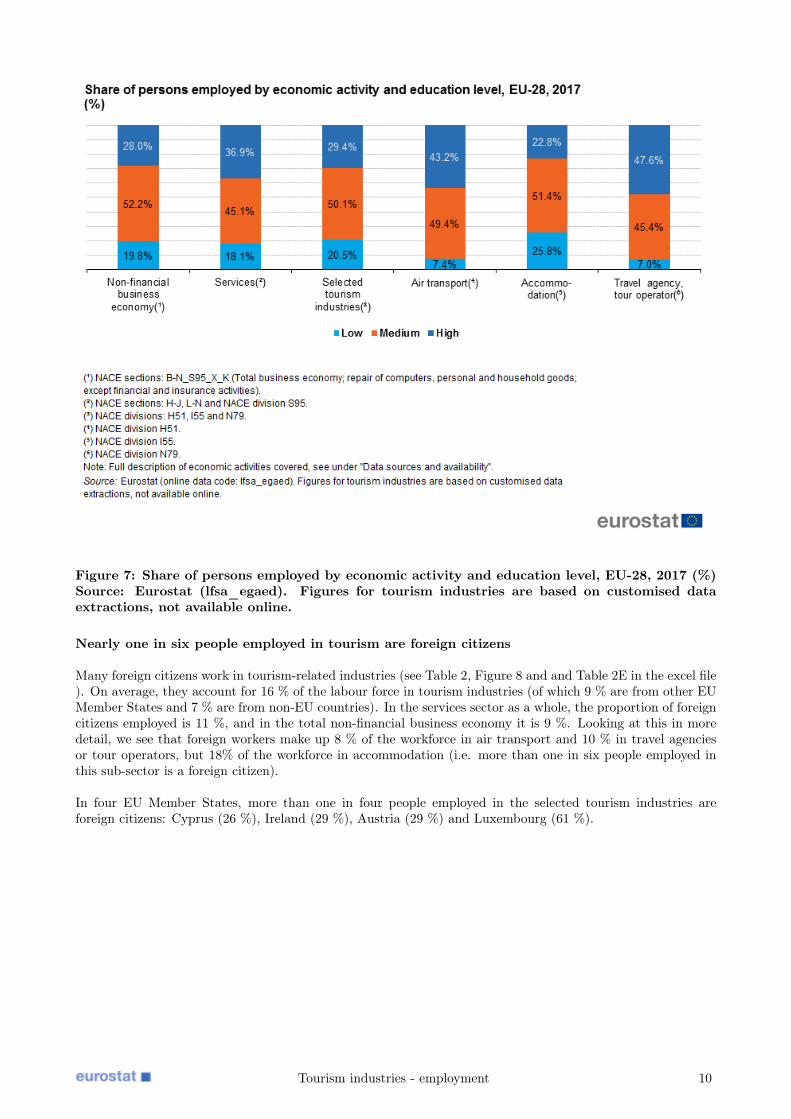
Figure 7: Share of persons employed by economic activity and education level, EU-28, 2017 (%)Source: Eurostat (lfsa_egaed). Figures for tourism industries are based on customised dataextractions, not available online.
Nearly one in six people employed in tourism are foreign citizens
Many foreign citizens work in tourism-related industries (see Table 2, Figure 8 and and Table 2E in the excel file). On average, they account for 16 % of the labour force in tourism industries (of which 9 % are from other EUMember States and 7 % are from non-EU countries). In the services sector as a whole, the proportion of foreigncitizens employed is 11 %, and in the total non-financial business economy it is 9 %. Looking at this in moredetail, we see that foreign workers make up 8 % of the workforce in air transport and 10 % in travel agenciesor tour operators, but 18% of the workforce in accommodation (i.e. more than one in six people employed inthis sub-sector is a foreign citizen).
In four EU Member States, more than one in four people employed in the selected tourism industries areforeign citizens: Cyprus (26 %), Ireland (29 %), Austria (29 %) and Luxembourg (61 %).
Tourism industries - employment 10
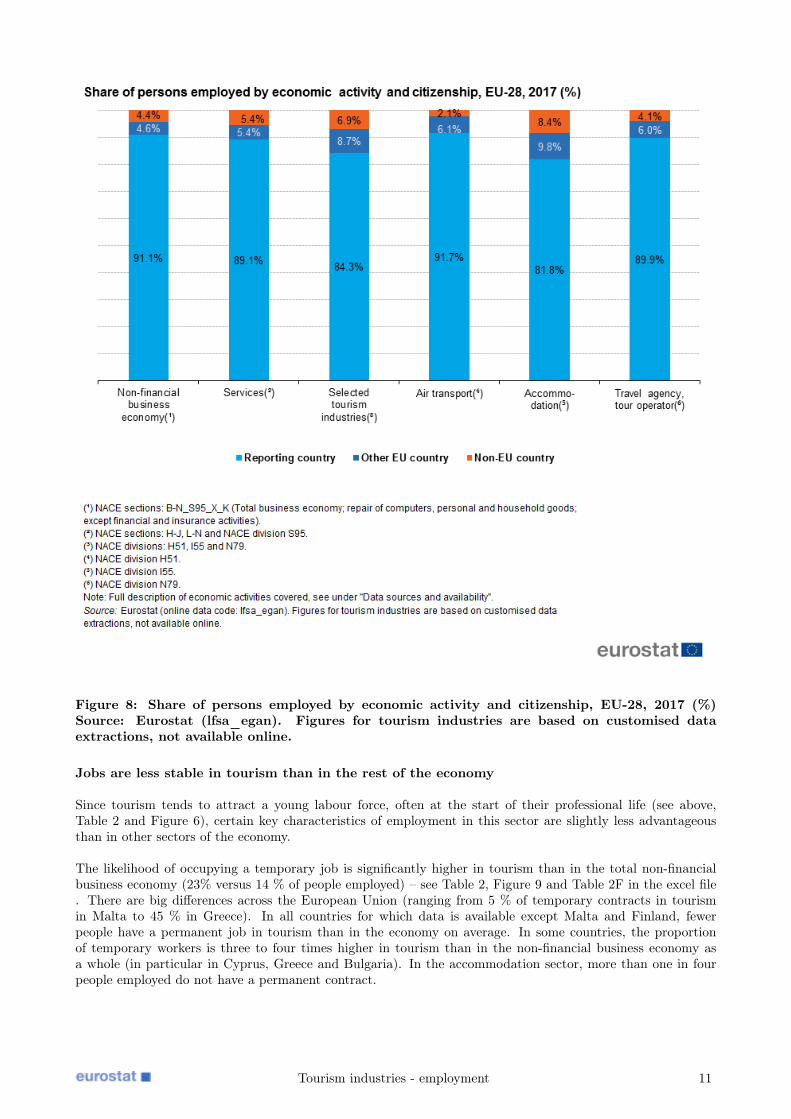
Figure 8: Share of persons employed by economic activity and citizenship, EU-28, 2017 (%)Source: Eurostat (lfsa_egan). Figures for tourism industries are based on customised dataextractions, not available online.
Jobs are less stable in tourism than in the rest of the economy
Since tourism tends to attract a young labour force, often at the start of their professional life (see above,Table 2 and Figure 6), certain key characteristics of employment in this sector are slightly less advantageousthan in other sectors of the economy.
The likelihood of occupying a temporary job is significantly higher in tourism than in the total non-financialbusiness economy (23% versus 14 % of people employed) – see Table 2, Figure 9 and Table 2F in the excel file. There are big differences across the European Union (ranging from 5 % of temporary contracts in tourismin Malta to 45 % in Greece). In all countries for which data is available except Malta and Finland, fewerpeople have a permanent job in tourism than in the economy on average. In some countries, the proportionof temporary workers is three to four times higher in tourism than in the non-financial business economy asa whole (in particular in Cyprus, Greece and Bulgaria). In the accommodation sector, more than one in fourpeople employed do not have a permanent contract.
Tourism industries - employment 11
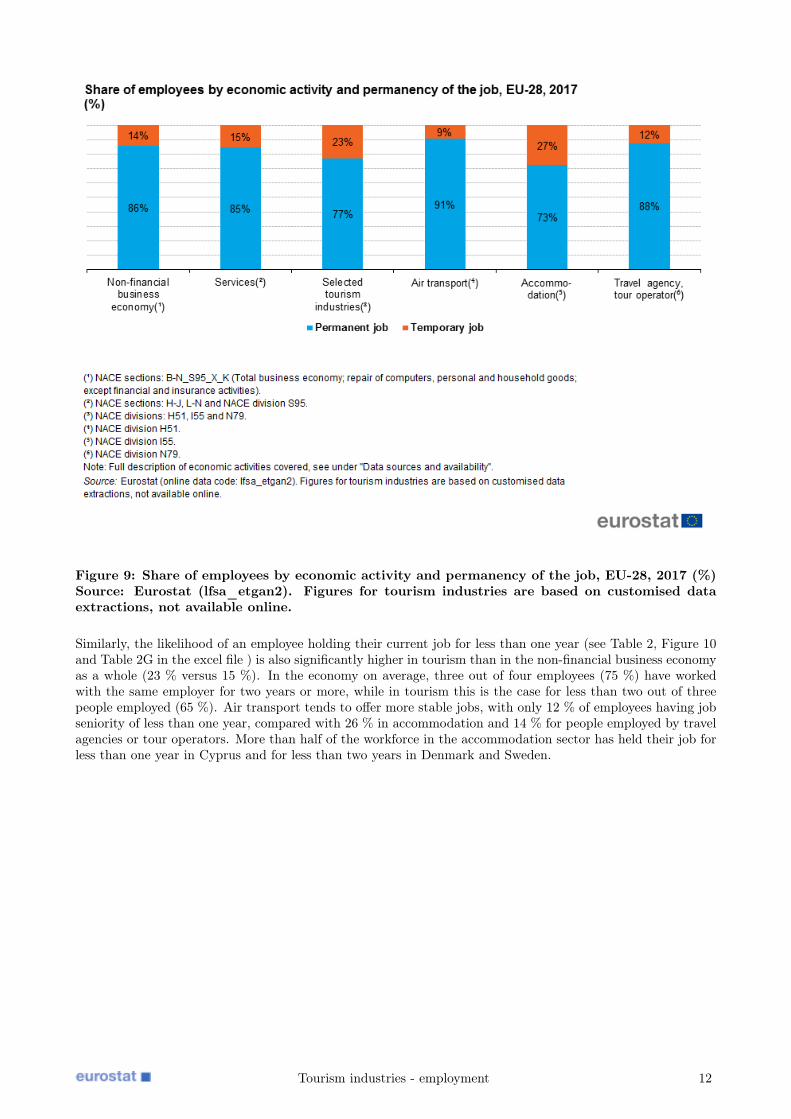
Figure 9: Share of employees by economic activity and permanency of the job, EU-28, 2017 (%)Source: Eurostat (lfsa_etgan2). Figures for tourism industries are based on customised dataextractions, not available online.
Similarly, the likelihood of an employee holding their current job for less than one year (see Table 2, Figure 10and Table 2G in the excel file ) is also significantly higher in tourism than in the non-financial business economyas a whole (23 % versus 15 %). In the economy on average, three out of four employees (75 %) have workedwith the same employer for two years or more, while in tourism this is the case for less than two out of threepeople employed (65 %). Air transport tends to offer more stable jobs, with only 12 % of employees having jobseniority of less than one year, compared with 26 % in accommodation and 14 % for people employed by travelagencies or tour operators. More than half of the workforce in the accommodation sector has held their job forless than one year in Cyprus and for less than two years in Denmark and Sweden.
Tourism industries - employment 12
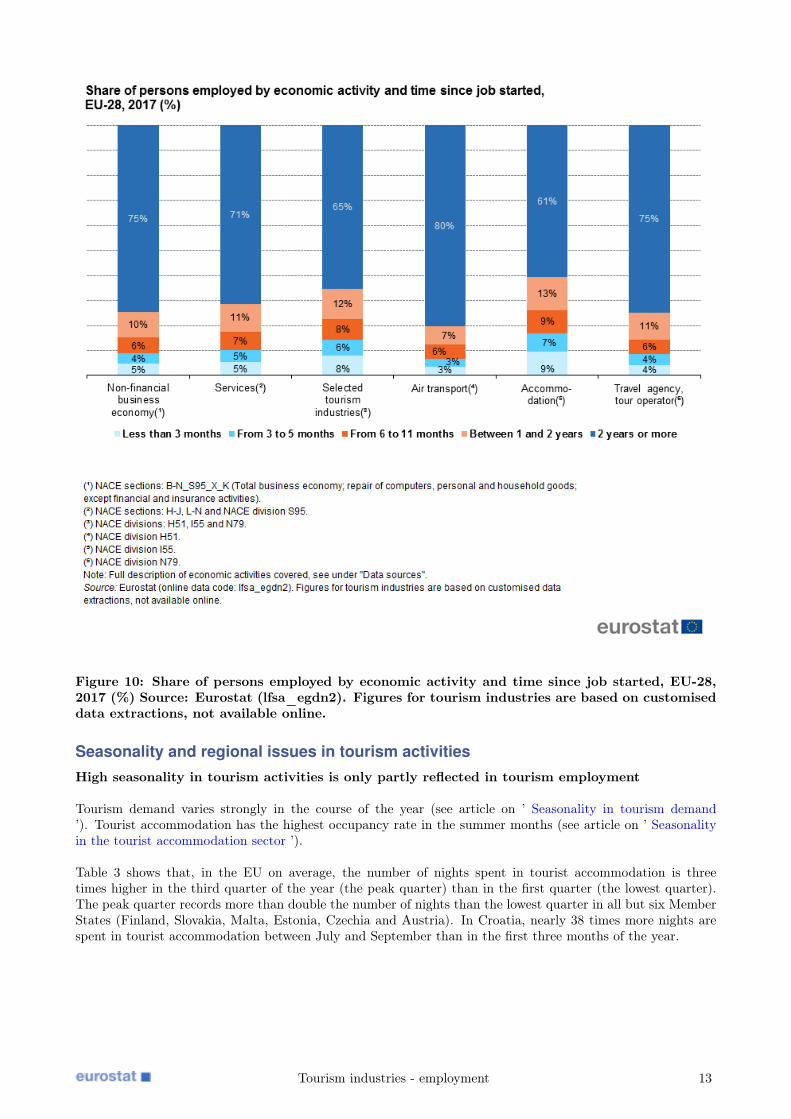
Figure 10: Share of persons employed by economic activity and time since job started, EU-28,2017 (%) Source: Eurostat (lfsa_egdn2). Figures for tourism industries are based on customiseddata extractions, not available online.
Seasonality and regional issues in tourism activitiesHigh seasonality in tourism activities is only partly reflected in tourism employment
Tourism demand varies strongly in the course of the year (see article on ’ Seasonality in tourism demand’). Tourist accommodation has the highest occupancy rate in the summer months (see article on ’ Seasonalityin the tourist accommodation sector ’).
Table 3 shows that, in the EU on average, the number of nights spent in tourist accommodation is threetimes higher in the third quarter of the year (the peak quarter) than in the first quarter (the lowest quarter).The peak quarter records more than double the number of nights than the lowest quarter in all but six MemberStates (Finland, Slovakia, Malta, Estonia, Czechia and Austria). In Croatia, nearly 38 times more nights arespent in tourist accommodation between July and September than in the first three months of the year.
Tourism industries - employment 13
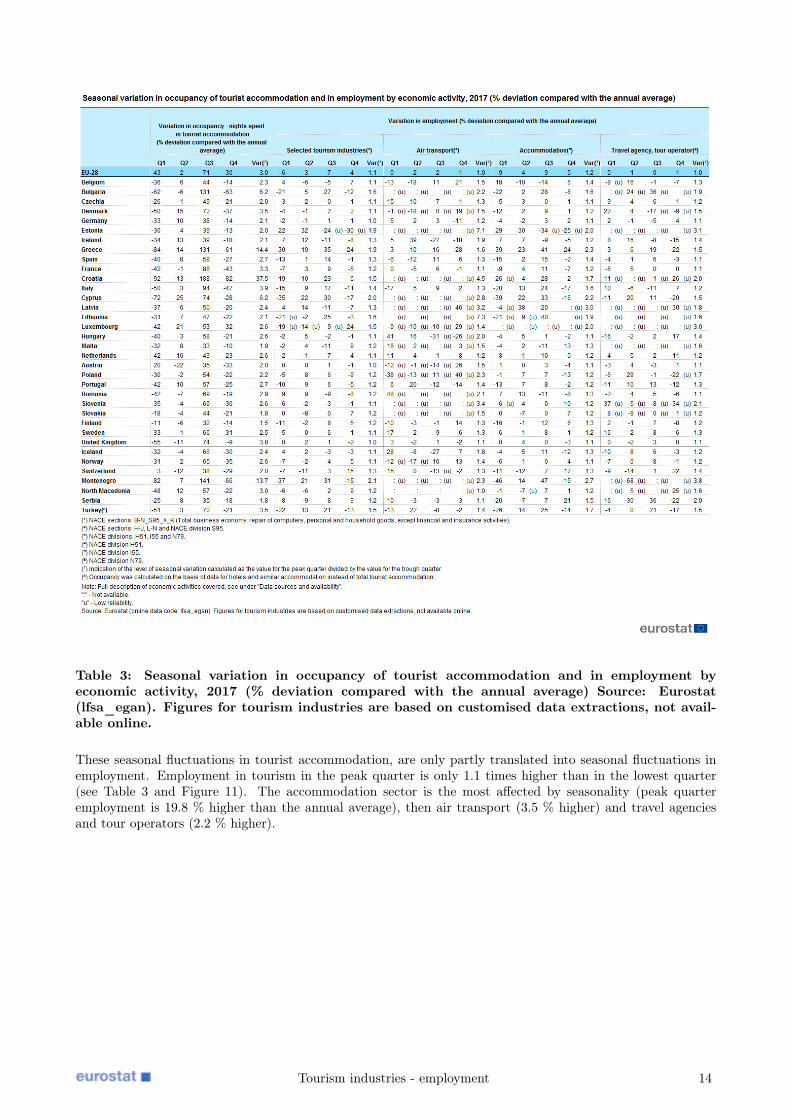
Table 3: Seasonal variation in occupancy of tourist accommodation and in employment byeconomic activity, 2017 (% deviation compared with the annual average) Source: Eurostat(lfsa_egan). Figures for tourism industries are based on customised data extractions, not avail-able online.
These seasonal fluctuations in tourist accommodation, are only partly translated into seasonal fluctuations inemployment. Employment in tourism in the peak quarter is only 1.1 times higher than in the lowest quarter(see Table 3 and Figure 11). The accommodation sector is the most affected by seasonality (peak quarteremployment is 19.8 % higher than the annual average), then air transport (3.5 % higher) and travel agenciesand tour operators (2.2 % higher).
Tourism industries - employment 14

Figure 11: Seasonal variation in nights spent in tourist accommodation and in employment byeconomic activity, EU-28, 2017 (% deviation compared with the annual average) Source: Eurostat(lfsq_egan22d). Figures for tourism industries are based on customised data extractions, notavailable online.
Figure 12 shows the different seasonal patterns for full-time and part-time jobs. The lowest season (the firstquarter of the year) seems to have a similar impact on both types of employment, while throughout the rest ofthe year the impact of seasonality is more important for full-time jobs.
Tourism industries - employment 15
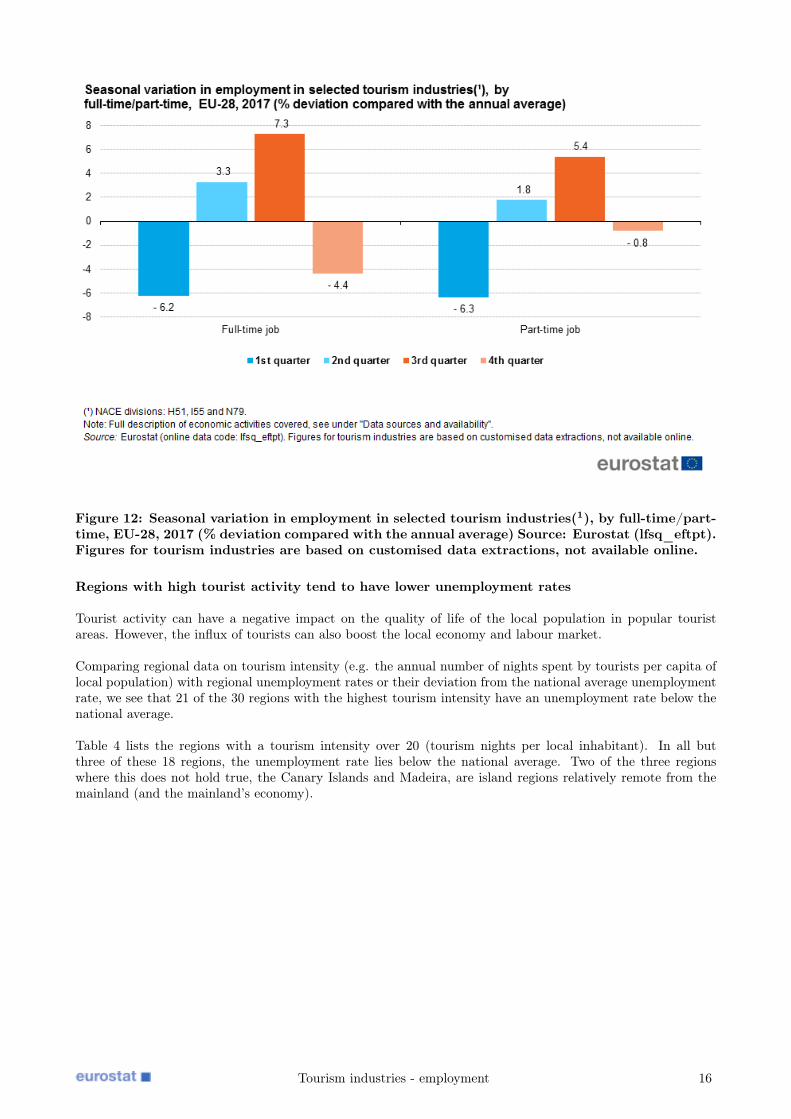
Figure 12: Seasonal variation in employment in selected tourism industries(1), by full-time/part-time, EU-28, 2017 (% deviation compared with the annual average) Source: Eurostat (lfsq_eftpt).Figures for tourism industries are based on customised data extractions, not available online.
Regions with high tourist activity tend to have lower unemployment rates
Tourist activity can have a negative impact on the quality of life of the local population in popular touristareas. However, the influx of tourists can also boost the local economy and labour market.
Comparing regional data on tourism intensity (e.g. the annual number of nights spent by tourists per capita oflocal population) with regional unemployment rates or their deviation from the national average unemploymentrate, we see that 21 of the 30 regions with the highest tourism intensity have an unemployment rate below thenational average.
Table 4 lists the regions with a tourism intensity over 20 (tourism nights per local inhabitant). In all butthree of these 18 regions, the unemployment rate lies below the national average. Two of the three regionswhere this does not hold true, the Canary Islands and Madeira, are island regions relatively remote from themainland (and the mainland’s economy).
Tourism industries - employment 16
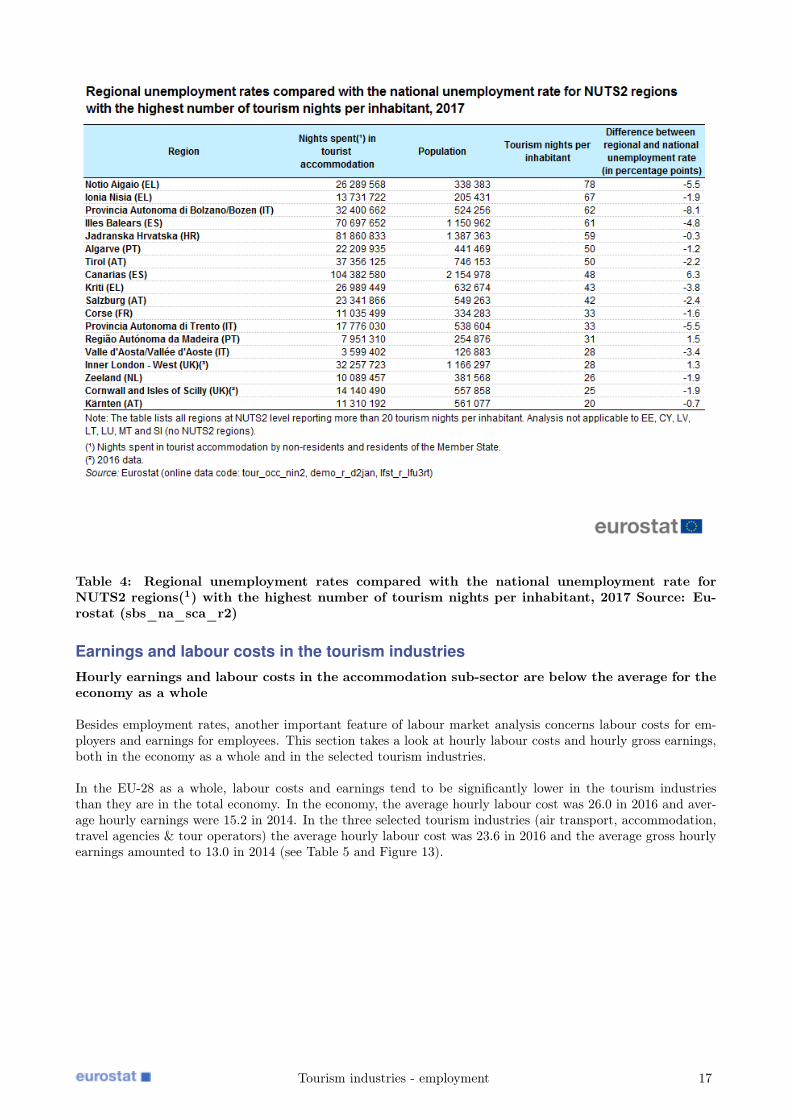
Table 4: Regional unemployment rates compared with the national unemployment rate forNUTS2 regions(1) with the highest number of tourism nights per inhabitant, 2017 Source: Eu-rostat (sbs_na_sca_r2)
Earnings and labour costs in the tourism industriesHourly earnings and labour costs in the accommodation sub-sector are below the average for theeconomy as a whole
Besides employment rates, another important feature of labour market analysis concerns labour costs for em-ployers and earnings for employees. This section takes a look at hourly labour costs and hourly gross earnings,both in the economy as a whole and in the selected tourism industries.
In the EU-28 as a whole, labour costs and earnings tend to be significantly lower in the tourism industriesthan they are in the total economy. In the economy, the average hourly labour cost was 26.0 in 2016 and aver-age hourly earnings were 15.2 in 2014. In the three selected tourism industries (air transport, accommodation,travel agencies & tour operators) the average hourly labour cost was 23.6 in 2016 and the average gross hourlyearnings amounted to 13.0 in 2014 (see Table 5 and Figure 13).
Tourism industries - employment 17
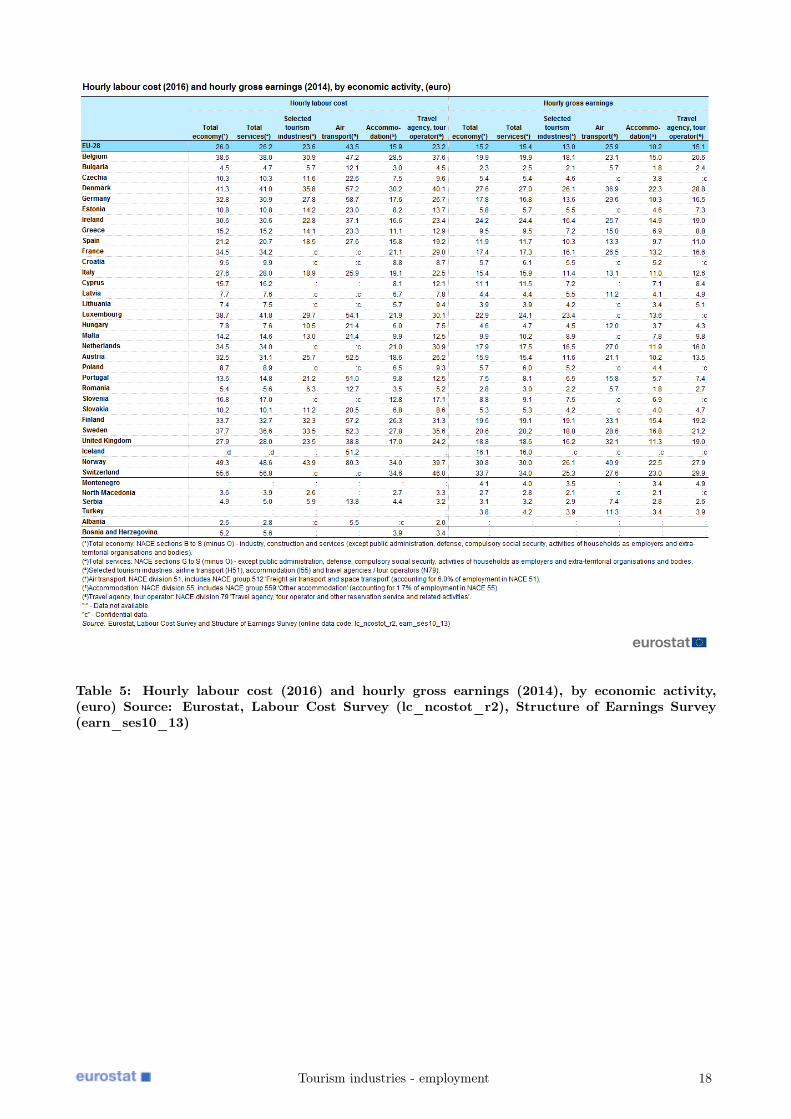
Table 5: Hourly labour cost (2016) and hourly gross earnings (2014), by economic activity,(euro) Source: Eurostat, Labour Cost Survey (lc_ncostot_r2), Structure of Earnings Survey(earn_ses10_13)
Tourism industries - employment 18
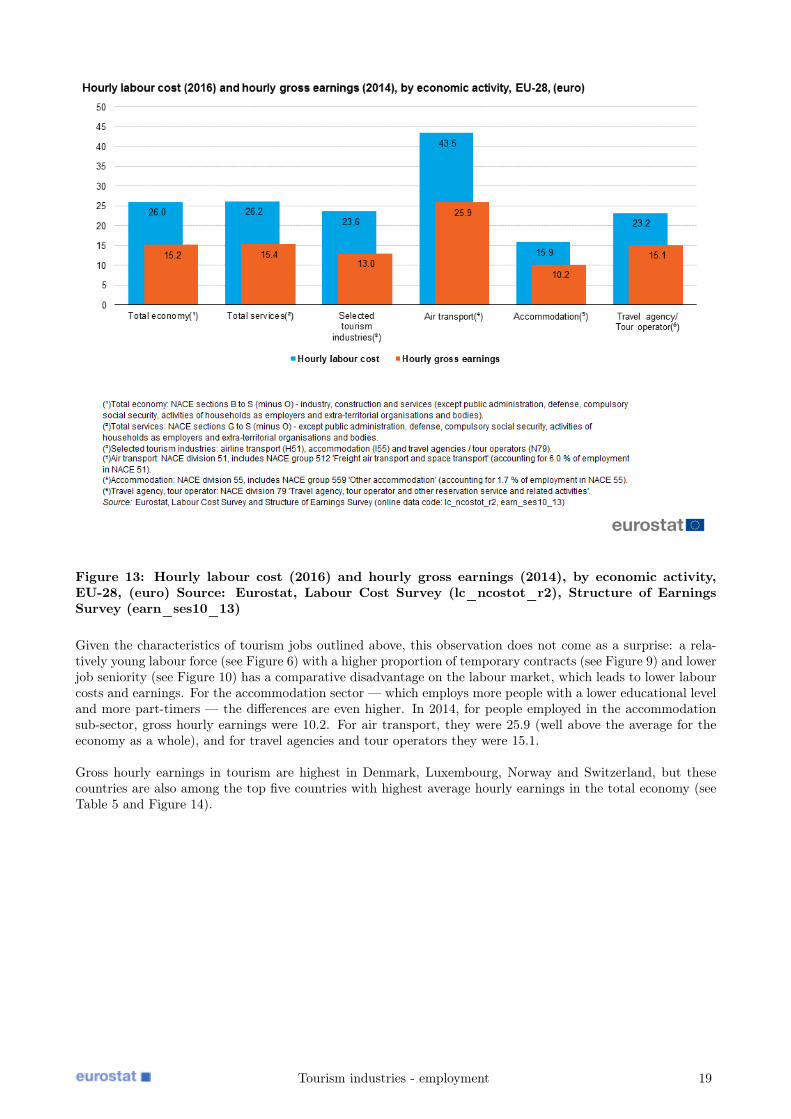
Figure 13: Hourly labour cost (2016) and hourly gross earnings (2014), by economic activity,EU-28, (euro) Source: Eurostat, Labour Cost Survey (lc_ncostot_r2), Structure of EarningsSurvey (earn_ses10_13)
Given the characteristics of tourism jobs outlined above, this observation does not come as a surprise: a rela-tively young labour force (see Figure 6) with a higher proportion of temporary contracts (see Figure 9) and lowerjob seniority (see Figure 10) has a comparative disadvantage on the labour market, which leads to lower labourcosts and earnings. For the accommodation sector — which employs more people with a lower educational leveland more part-timers — the differences are even higher. In 2014, for people employed in the accommodationsub-sector, gross hourly earnings were 10.2. For air transport, they were 25.9 (well above the average for theeconomy as a whole), and for travel agencies and tour operators they were 15.1.
Gross hourly earnings in tourism are highest in Denmark, Luxembourg, Norway and Switzerland, but thesecountries are also among the top five countries with highest average hourly earnings in the total economy (seeTable 5 and Figure 14).
Tourism industries - employment 19
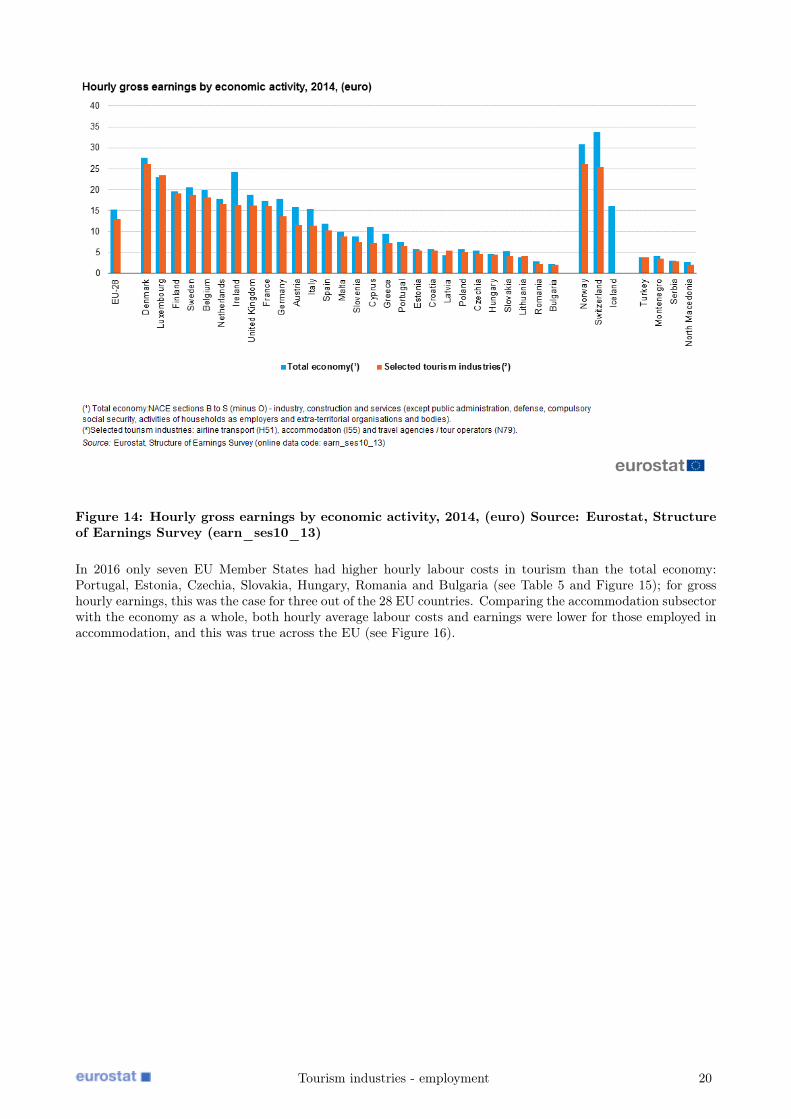
Figure 14: Hourly gross earnings by economic activity, 2014, (euro) Source: Eurostat, Structureof Earnings Survey (earn_ses10_13)
In 2016 only seven EU Member States had higher hourly labour costs in tourism than the total economy:Portugal, Estonia, Czechia, Slovakia, Hungary, Romania and Bulgaria (see Table 5 and Figure 15); for grosshourly earnings, this was the case for three out of the 28 EU countries. Comparing the accommodation subsectorwith the economy as a whole, both hourly average labour costs and earnings were lower for those employed inaccommodation, and this was true across the EU (see Figure 16).
Tourism industries - employment 20
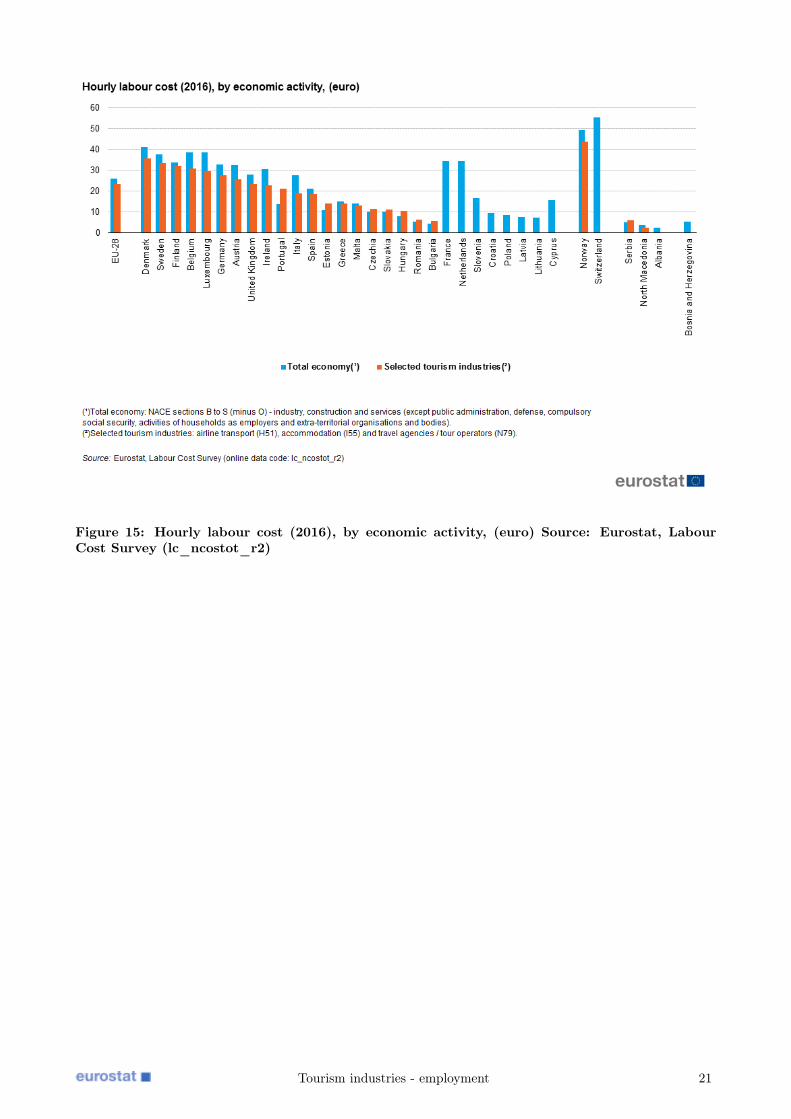
Figure 15: Hourly labour cost (2016), by economic activity, (euro) Source: Eurostat, LabourCost Survey (lc_ncostot_r2)
Tourism industries - employment 21
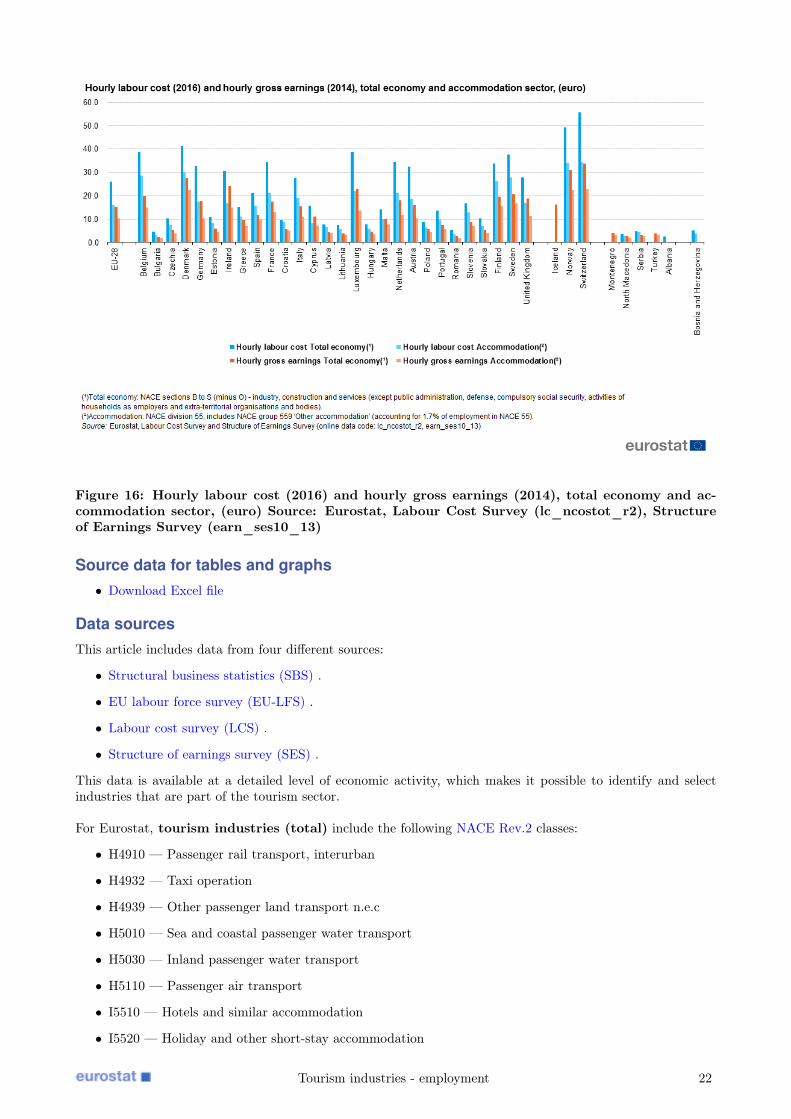
Figure 16: Hourly labour cost (2016) and hourly gross earnings (2014), total economy and ac-commodation sector, (euro) Source: Eurostat, Labour Cost Survey (lc_ncostot_r2), Structureof Earnings Survey (earn_ses10_13)
Source data for tables and graphs• Download Excel file
Data sourcesThis article includes data from four different sources:
• Structural business statistics (SBS) .
• EU labour force survey (EU-LFS) .
• Labour cost survey (LCS) .
• Structure of earnings survey (SES) .
This data is available at a detailed level of economic activity, which makes it possible to identify and selectindustries that are part of the tourism sector.
For Eurostat, tourism industries (total) include the following NACE Rev.2 classes:
• H4910 — Passenger rail transport, interurban
• H4932 — Taxi operation
• H4939 — Other passenger land transport n.e.c
• H5010 — Sea and coastal passenger water transport
• H5030 — Inland passenger water transport
• H5110 — Passenger air transport
• I5510 — Hotels and similar accommodation
• I5520 — Holiday and other short-stay accommodation
Tourism industries - employment 22
• I5530 — Camping grounds, recreational vehicle parks and trailer parks
• I5610 — Restaurants and mobile food service activities
• I5630 — Beverage serving activities
• N7710 — Renting and leasing of motor vehicles
• N7721 — Renting and leasing of recreational and sports goods
• NACE division N79 — Travel agency, tour operator reservation service and related activities.
However, many of these activities provide services to both tourists and non-tourists – typical examples includerestaurants catering to tourists but also to locals and rail transport being used by tourists as well as bycommuters. For this reason, this publication focuses on the following selected tourism industries which relyalmost entirely on tourism:
• H51 — Air transport (including H512 ’Freight air transport’ which accounts for 6.0 % of employment inH51).
• I55 — Accommodation (including I559 ’Other accommodation’ which accounts for 1.7 % of employmentin I55).
• N79 — Travel agency, tour operator reservation service and related activities (including N799 ’Otherreservation service and related activities’ which accounts for 12.9 % of employment in N79).
ContextAccording to a United Nations World Tourism Organisation (UNWTO) publication titled " Tourism highlights", the EU is a major tourist destination, with five of its Member States among the world’s top 10 destinationsin 2017.Tourism has the potential to contribute towards employment and economic growth, as well as to de-velopment in rural, peripheral or less-developed areas. These characteristics drive the demand for reliable andharmonised statistics within this field, as well as within the wider context of regional policy and sustainabledevelopment policy areas.
Tourism can play a significant role in the development of European regions. Infrastructure created for tourismpurposes contributes to local development, while jobs that are created or maintained can help counteract indus-trial or rural decline. Sustainable tourism involves the preservation and enhancement of cultural and naturalheritage, ranging from the arts to local gastronomy or the preservation of biodiversity .
In 2006, the European Commission adopted a Communication titled " A renewed EU tourism policy: towardsa stronger partnership for European tourism " (COM(2006) 134 final). It addressed a range of challenges thatwill shape tourism in the coming years, including Europe’s ageing population, growing external competition,consumer demand for more specialised tourism, and the need to develop more sustainable and environmentally-friendly tourism practices. It argued that more competitive tourism supply and sustainable destinations wouldhelp raise tourist satisfaction and secure Europe’s position as the world’s leading tourist destination. It wasfollowed in October 2007 by another Communication, titled " Agenda for a sustainable and competitive Euro-pean tourism " (COM(2007) 621 final), which proposed actions in relation to the sustainable management ofdestinations, the integration of sustainability concerns by businesses, and the awareness of sustainability issuesamong tourists.
The Lisbon Treaty acknowledged the importance of tourism — outlining a specific competence for the EUin this field and allowing for decisions to be taken by a qualified majority. An article within the Treaty specifiesthat the EU "shall complement the action of the Member States in the tourism sector, in particular by promot-ing the competitiveness of Union undertakings in that sector". " Europe, the world’s No 1 tourist destination —a new political framework for tourism in Europe " (COM(2010) 352 final) was adopted by the European Com-mission in June 2010. This Communication seeks to encourage a coordinated approach for initiatives linked totourism and defined a new framework for actions to increase the competitiveness of tourism and its capacity forsustainable growth. It proposed a number of European or multinational initiatives — including a consolidationof the socioeconomic knowledge base for tourism — aimed at achieving these objectives.
Tourism industries - employment 23
• All articles on tourism statistics
• Tourism industries - economic analysis
Tables• Employment and unemployment (Labour Force Survey) (t_employ) , see:
LFS series – Detailed annual survey results (t_lfsa)
Database• Employment and unemployment (Labour Force Survey) (employ) , see:
LFS series – Detailed annual survey results (lfsa)
LFS series – Detailed quarterly survey results (from 1998) (lfsq)
• Structural business statistics (sbs) , see:
Annual enterprise statistics for special aggregates of activities (NACE Rev. 2) (sbs_na_sca_r2)
Annual detailed enterprise statistics for services (NACE Rev. 2 H-N and S95) (sbs_na_1a_se_r2)
Dedicated section• Tourism
• Employment and unemployment (Labour force survey)
• Structural business statistics (SBS)
Publications• Recent Eurostat publications on tourism
Methodology• Employment and unemployment (Labour Force Survey) (ESMS metadata file — employ_esms)
• LFS series - Detailed annual survey results (ESMS metadata file — lfsa_esms)
• LFS series - Detailed quarterly survey results (from 1998) (ESMS metadata file — lfsq_esms)
Legislation• Commission Implementing Regulation (EU) No 1051/2011 of 20 October 2011 implementing Regulation
(EU) No 692/2011 concerning European statistics on tourism, as regards the structure of the qualityreports and the transmission of the data.
• Regulation (EU) No 692/2011 of the European Parliament and of the Council of 6 July 2011 concerningEuropean statistics on tourism and repealing Council Directive 95/57/EC.
Visualisations• Regional Statistics Illustrated - select statistical domainTourism ,Labour market .
External links• European Commission – Directorate-General for Internal Market, Industry, Entrepreneurship and SMEs:
Tourism
Tourism industries - employment 24