tourism new zealand 2015 /2016 · marketing new zealand as an international visitor destination....
TRANSCRIPT

Tourism New Zealand 2015/2016
G25
Annual Report
Miles Holden

550international media outlets
hosted by Tourism New Zealand in 286 visits
1,300pieces of news generated by one documentary featuring Chinese actor Shawn Dou
33.3 million
visits to newzealand.com
3.3 million
total visitor numbers
81%staff engaged as per
Employee Engagement Survey
2.8 millionreferrals to tourism
businesses from newzealand.com
2.28 millionfollowers on
100% ownership of
Qualmark
71 bids supported through the Conference Assistance
Programme (estimated value: $96.2 million)
Miles Holden
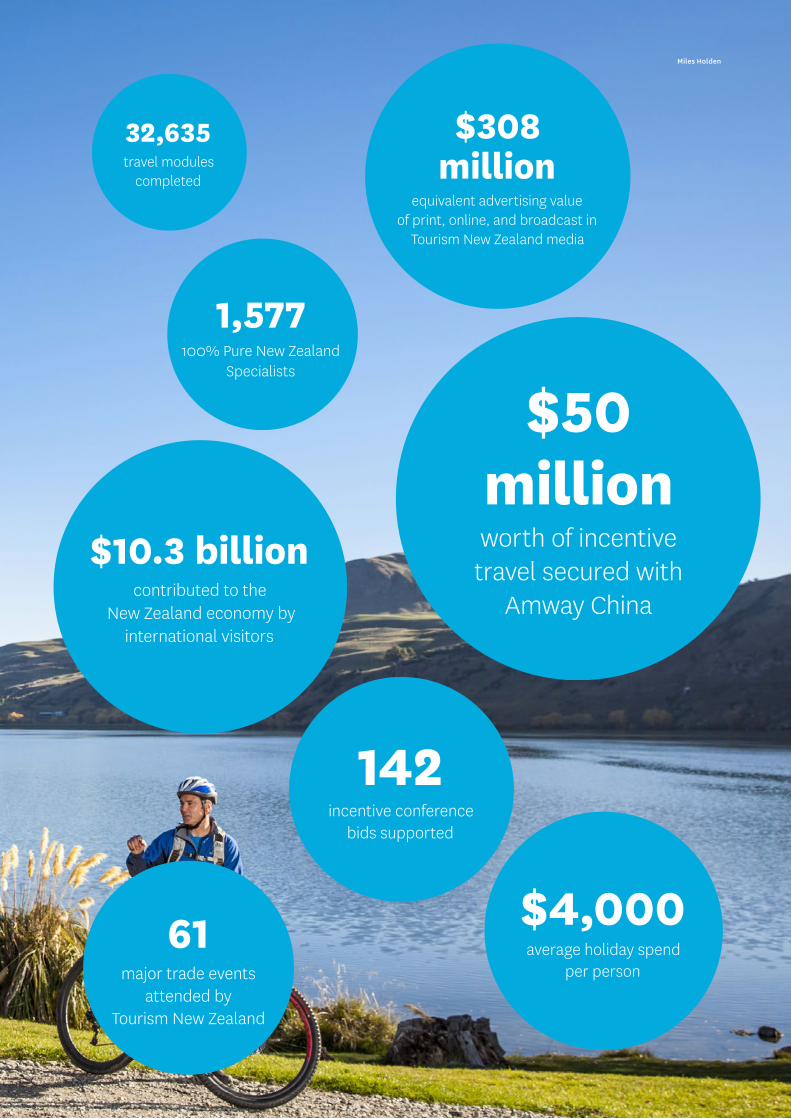
32,635travel modules
completed
$10.3 billioncontributed to the
New Zealand economy by international visitors
$50 millionworth of incentive travel secured with
Amway China
142incentive conference
bids supported
$308 million
equivalent advertising value of print, online, and broadcast in
Tourism New Zealand media
1,577100% Pure New Zealand
Specialists
$4,000average holiday spend
per person
61major trade events
attended by Tourism New Zealand
Miles Holden
32,635travel modules
completed
$10.3 billioncontributed to the
New Zealand economy by international visitors
$50 millionworth of incentive travel secured with
Amway China
142incentive conference
bids supported
$308 million
equivalent advertising value of print, online, and broadcast in
Tourism New Zealand media
1,577100% Pure New Zealand
Specialists
$4,000average holiday spend
per person
61major trade events
attended by Tourism New Zealand

Julian Apse

Contents
2. Tourism New Zealand — Who We Are
4. Chair and Chief Executive Report
10. Governance
12. Board Members
16. Core Leadership Team
18. Strategic Priorities and Outcomes
28. Statement of Performance
45. Equal Employment Opportunities
49. Financial Statements
54. Notes to the Financial Statements
80. Independent Auditor’s Report
1

Tourism New Zealand — Who We Are
London
Seoul
Guangzhou
Beijing
Mumbai
Jakarta
Sydney
Tokyo
Shanghai
Bangkok
Singapore
Tourism New Zealand is the organisation responsible for promoting New Zealand to the world and encouraging international visitors to this amazing country.
Tourism New Zealand was established in 1991 as a Crown Entity by the New Zealand Tourism Board Act, and since then its staff has worked tirelessly to create award winning campaigns marketing New Zealand as an international visitor destination.
Tourism has a major impact on New Zealand’s economy and Tourism New Zealand has an instrumental role in spurring its growth. It is the only government-funded organisation in New Zealand with the mandate and resources to develop and implement a strategy for tourism and promote ‘Destination New Zealand’ to potential visitors.
2

Tourism New Zealand launched the ‘100% Pure New Zealand’ campaign in 1999. Over the past 16 years it has adapted and evolved promotions to communicate the unique experiences, such as our Māori culture, diverse environment, and Kiwi cuisine (not to mention our international award winning coffee), available to people who visit New Zealand under this ‘umbrella campaign’.
A key part of Tourism New Zealand’s successful campaign strategy has been partnerships with influential travel sellers, airlines, high profile celebrities, and opinion leaders, engaging with New Zealand tourism operators, providing relevant and up-to-date information for visitors, and ensuring the quality of New Zealand’s tourism product and experience.
In addition to its day-to-day operations, Tourism New Zealand owns and operates the quality assurance organisation Qualmark New Zealand, and oversees 80 i-SITE visitor information centres around New Zealand.
Tourism New Zealand has 15 offices (two in New Zealand) and around 160 full-time staff members.
São Paulo
Los Angeles
Auckland
Wellington
Tourism New Zealand has 15 offices, two in
New Zealand, and around 160 full-time staff
3

On behalf of the Board and Leadership team, we are pleased to present Tourism New Zealand’s Annual Report for the past financial year ending June 2016 — and what a year it has been!
During 2015/16 Tourism New Zealand has broken records across the board for international inbound tourism to New Zealand including exceptional numbers of visitors, levels of expenditure, referrals to travel partners and industry, and visits to its digital media sites. The results squarely reflect achievement of the organisation’s over-arching mission ‘to increase the value of international tourism to New Zealand’.
For the year ended 30 June 2016 total international visitor arrivals rose 10.6% to 3.3 million while holiday arrivals increased by 16.1%. Overall visitor spend increased by a very pleasing 18% to $10.3 billion.
With these results achieved, the tourism industry is well on track to surpass the aspirational goal of $40.1 billion in total tourism revenue, set out in the industry’s Tourism 2025 growth framework.
Meanwhile, Tourism New Zealand’s customer-facing website newzealand.com attracted 33 million visits and generated 2.9 million referrals to travel partners and industry — a huge 35% improvement on 2014/15, while the number of social media followers rose to 2.28 million.
Tourism New Zealand continues to play a pivotal role in driving demand for international inbound travel to New Zealand. The organisation has successfully
expanded its geographic focus to new and emerging markets (India, Indonesia, and Brazil) and its segment focus to concentrate resources on high net worth visitors, special interest visitors, and business events delegates. This expansion of activity has been achieved as a result of additional funding provided over the course of the past three years.
The number of international visitors New Zealand attracts has grown rapidly, however arrival patterns remain highly seasonal with holiday arrivals in summer months being typically more than double the level of winter months. This peak period puts pressure on physical capacity, labour, publicly owned assets (ranging from toilet facilities to national parks) and suppresses the return on capital invested in the industry over the full year.
Accordingly, over the past year Tourism New Zealand has begun to shape the timing of demand to grow off-peak travel periods faster than the growth achieved in peak/summer months. Among other initiatives, Tourism New Zealand shifted the majority of its marketing effort to promote travel during the shoulder seasons, autumn and spring — to fantastic effect.
While international holiday arrivals remained strongest over summer 2015/16, combined spring months (September-November 2015) grew by 17.1% from the same period in 2015, and autumn months (March-May 2016) saw a further increase of 19.6% on the previous year. Year on year, combined shoulder period growth in holiday arrivals was 18.4%, compared to summer growth of 15.1% (December 2015-February 2016).
Chair and Chief Executive Report
Kerry Prendergast Tourism New Zealand Chair
Kevin Bowler Tourism New Zealand Chief Executive
4

These encouraging results have led to a decision to focus virtually all of Tourism New Zealand’s efforts on promoting off-peak travel periods in 2016/17. While land-based price and availability advantages will support further shoulder season growth, there will be challenges to achieving this goal given airlines continue offering additional summer capacity. Tourism New Zealand will be working with our airline partners throughout 2016/17 to find solutions around this issue.
100% Pure New Zealand
Tourism New Zealand continued to challenge itself to create new and exciting ways of promoting New Zealand to the world in 2015/16. The award winning 100% Middle-earth campaign gave New Zealand renewed exposure around the world and pushed visitor numbers to new records. In July 2015 Tourism New Zealand followed up this success with the launch of a new, refreshed 100% Pure New Zealand campaign using the theme ‘Every day a different journey’ and a new design system including a new typography called ‘Pure Pakati’ with an increased emphasis on our unique Māori culture.
The 2015/16 campaign specifically targeted the barriers to travel and brought to life the notion that ‘everything in New Zealand is close and that a diverse range of experiences are all within easy reach’. In-market research undertaken showed that ‘motivation to visit’ New Zealand as a result of seeing the campaign beat the benchmark in all markets and broke the previous record for motivation achieved by the 100% Middle-earth creative work.
Strategic commercial partnerships, including those with Facebook and Google, Air New Zealand, United and American Airlines, Auckland and Christchurch International Airports, and luxury travel agency consortia Virtuoso, to name but a few, have netted mutual benefits and extended the reach of the campaign around the world.
Tourism New Zealand has also continued its successful approach of partnering with influential celebrities to promote New Zealand to different audience groups. The organisation started the 2016/17 financial year with new advertising featuring Hollywood director and famed explorer James Cameron including a series of short videos, a number of still images, and spoken content that tells the story of his love of New Zealand and his encouragement for people to be curious and explore our country.
The collaboration with James Cameron completed a significant year of work with influencers: supermodel Megan Gale helped promote cycling holidays to the Australia market, and actors Huang Lei from China, Sidharth Malhotra in India and Joe Taslim from Indonesia all became valued ambassadors for New Zealand adding their skills and reach to the 100% Pure New Zealand campaign in respective markets.
Driving digital partnerships
Also in 2015/16 Tourism New Zealand unveiled a new approach to paid social media with video content made specifically for Facebook and in collaboration with Facebook’s creative team. The Kombi Diaries built on the ‘Everyday a different journey’ message through a series of five sequential films, followed the
Julian Apse
5

journey of two American tourists as they travelled around New Zealand, and was promoted across key markets through the Facebook and Instagram digital platforms.
This was a fresh, new marketing approach for all involved, and as Facebook Creative Shop’s Gavin Carver said at the time, “[it] paves the way for how we grow clients’ business, build story-driven content, and creatively inspire one another. Tourism New Zealand is redefining marketing for this category. They have married art and science to create content that is relevant and engaging for a global audience.”
Closer to home Tourism New Zealand continued to refine and evolve its core digital platform newzealand.com. The site delivered exceptionally strong performance during the 2015/16 financial year with over 33 million site visits. More importantly, these visits translated into more than 2.8 million referrals to industry and international travel sellers for conversion into bookings (an average 240,000 referrals per month).
International media and trade programme
It was a significant and successful 12 months for Tourism New Zealand’s international media programme. The programme hosted some 550 media outlets, achieving $311.7 million worth of media coverage (paid advertising equivalent value).
The Tourism New Zealand trade team hosted more than 890 international travel seller representatives over the year and there are now more than 1000 travel agents who have achieved 100% Pure New Zealand Specialist status.
In September 2015 around 375 Australian travel agents participated in Tourism New Zealand’s ‘All Stars Famil’; they visited 23 regions and followed customised
itineraries based on touring, cycling and ski themes. Initial results have shown that agents who participated in the famil have outsold agents from the same agency network who did not attend, which has represented a 6:1 estimated return on Tourism New Zealand investment.
Film tourism continued to play a big role in Tourism New Zealand’s promotional programme with international productions Pete’s Dragon and Ghost in the Shell being in production during 2015/16. It’s anticipated these films will assist Tourism New Zealand to create marketing opportunities around their respective launches in the 2016/17 financial year.
The Mood of the Nation
Over the past year Tourism New Zealand, in partnership with Tourism Industry Aotearoa, undertook research to measure New Zealanders’ perceptions of the tourism industry (The ‘Mood of the Nation’). The survey was conducted in December 2015 before the peak season and again in late March 2016.
The research found that New Zealanders remain positive about the number of international tourists visiting New Zealand, however the record summer of growth highlighted key pressure points to be addressed. This included a growing national conversation surrounding the safety of foreign drivers on New Zealand roads and to a lesser degree the presence of freedom campers.
Tourism New Zealand took practical steps with key partners to help inform international drivers of New Zealand’s unique road conditions and road rules and reduce the impact of visiting drivers on others. At the same time Tourism New Zealand maintained a focus on increasing the value of international tourism to New Zealand and enhancing New Zealand’s reputation as a safe and welcoming destination.
DunedinNZ
6

Subsidiary
This year also saw Tourism New Zealand take full ownership of Qualmark, the tourism industry’s official mark of quality. Tourism New Zealand will launch an evolved Qualmark brand demonstrating a clear commitment to industry quality, and one that assures our global consumers that New Zealand organisations are economically, socially, and environmentally sustainable in 2016/17.
Tier One Markets
Australia
Australia continued to be the country’s number one source of visitor arrivals with more than 1.3 million visitors – growth of 6.2% on the previous year. Total visitor value has now reached $2.5 billion. Activity in Australia covered the widest range of target consumer groups and sectors with work delivered to specifically target ski and cycling holidays, coach touring, and the continuation of the highly successful North and South Island touring campaigns run in partnership with New Zealand regional tourism organisations.
To round off the 2015/16 financial year Tourism New Zealand placed its largest ever out-of-home media investment in Sydney to bolster the number of ‘active considerers’ in the market. Buses, train stations, and motorway overpasses featured creative advertisements with Tourism New Zealand’s ‘Every day a different journey’ campaign imagery during June.
China
International visitor growth from China accelerated further with a 26.7% increase in visitor arrivals and 33% increase in total spend. Despite some concern over a slowing in the Chinese economy, there was no
sign of international travel ex-China slowing and the February 2016 Chinese New Year was the biggest yet in terms of visitor numbers. In particular, the growth in independent travellers was extremely welcomed.
Off the back of Tourism New Zealand’s 2015 success in leveraging reality show ‘Dad, where are we going?’ the organisation commissioned one of the show’s stars Huang Lei to join its tourism campaign. Huang Lei and his family visited the South Island with images and social media content used to form the basis of Tourism New Zealand’s Chinese campaign. Lei's visit alone generated more than 1,280 media articles and saw 710,000 social followers engage with his New Zealand content.
Tourism New Zealand’s proactive approach to visiting driver safety was also most prominent in the China market with both Huang Lei and fellow Chinese actor Shawn Dou working with the organisation to spread the word about safer driving to their fan followers. Lei and Dou both fronted separate videos that included messages around safe driving and generated more than 2.8 million views.
US
Over the past year the number of arrivals from the US increased by 10.4% while the expenditure increased by 12%.
Tourism New Zealand has spent the past year building on its existing airline partnership with Air New Zealand and creating new relationships with American Airlines and United Airlines to capitalise on the significant increase in air capacity being offered to the market during 2016/17.
Alongside campaigns to target cycling and youth visitors, Tourism New Zealand conducted significant trade marketing campaigns working alongside key agency consortia like Travel Leaders Group and
7

premium Virtuoso; conducting sales missions and roadshows while also stepping into partnership with online travel agents like Expedia and Orbitz.
Tourism New Zealand has secured additional funding for 2016/17 to increase New Zealand promotion and capitalise on new air connectivity.
Sectors
Corporate events are now big business for Tourism New Zealand following its dedicated promotion of New Zealand as a preferred location for meetings, incentives conferences and events. More than 70 conference bids were supported with a pleasing 72% success rate being achieved.
In the final quarter of 2016 Tourism New Zealand (and its partners Destination Queenstown, Air New Zealand and Immigration New Zealand) secured at least $50 million worth of incentive business with Amway China when the company confirmed it will send 10,000 of its elite sales people to Queenstown in 2018 for five days. The group will visit in multiple waves of 500 in autumn 2018.
Work has continued to develop global assets and itineraries for the promotion of golf, cycling and walking holidays in New Zealand. Tourism New Zealand’s support of major sporting events such as Crankworx, the Round Taupo Cycle Challenge and NZ Golf Open also provided significant international media opportunities with journalists from target markets invited to participate in the events and experience New Zealand.
Organisational capability and culture
Tourism New Zealand has continued to support the development of its people and culture through a number of initiatives.
The end result is that, as an organisation, Tourism New Zealand continued to be considered a great place to work. More than 94% of employees took part in the last employee engagement survey with 81% engagement achieved across Tourism New Zealand, up three percentage points on last year and surpassing the ‘Best Workplaces 2015 All Orgs Benchmark’.
Outlook and the challenges ahead
The 2016/17 financial year is set to be another record-breaker for international inbound tourism to New Zealand. The full year effects of new air capacity, continued improvement of economic prosperity in Asia, New Zealand’s relative safety, and continuous
improvement programmes across all Tourism New Zealand’s activities all contribute to this assertion.
Recent events such as the Brexit vote may flatten prospects from the UK, but the Lions tour is likely to overwhelm any immediate market softness.
With demand for travel continuing to be predicted as very strong over 2016/17 summer, Tourism New Zealand will step up its efforts to grow shoulder travel periods and encourage greater distribution of visitors to lesser visited and congested regions.
It is the final year of the organisation’s current four-year marketing strategy and a key deliverable for the year will be the new strategy to guide Tourism New Zealand’s priorities through until the end of FY21.
Thanks and acknowledgements
This year the Board of Tourism New Zealand welcomed the re-appointment of Deputy Chair Richard Leggat and Board members Jamie Tuuta and John Thorburn each for an addition three-year term. The Board also welcomed the appointment of Raewyn Idoine on an initial three-year term.
On behalf of the Board and Leadership team we would like to thank all of our people for their exceptional work over the past year and their ongoing commitment to our mission — increasing the value to New Zealand of international visitors.
Chair’s Note: As the FY16 Annual Report went into publication Chief Executive Kevin Bowler announced his departure from Tourism New Zealand after almost seven years in the role. During his tenure, Kevin reinvigorated the way the country is marketed, delivering significant value to the economy through the use of targeted digital media channels. He and his team have subsequently presided over some of the most extraordinary growth the industry has ever seen with visitor spend rising 18% to $10.3 billion in the past 12 months alone. On behalf of the Board we wish to thank Kevin for his work and commitment to success and wish him all the very best.
8

Miles Holden
9

The Board
The New Zealand Tourism Board (trading as Tourism New Zealand) is a Crown entity established under the New Zealand Tourism Board Act 1991 and is a Crown agency for the purposes of the Crown Entities Act 2004.
Tourism New Zealand is governed by a Board appointed by the Minister of Tourism. All decisions relating to the operation of Tourism New Zealand are made by, or under the authority of, the Board in accordance with the New Zealand Tourism Board Act 1991, and the Crown Entities Act 2004.
In accordance with the New Zealand Tourism Board Act 1991, the Board must have no fewer than five, and no more than nine, members.
The Minister’s formal line of accountability with Tourism New Zealand is through the Board’s Chair. Board appointments are generally for two or three years, with reappointment possible. The composition of the Board reflects a balance of tourism industry and commercial expertise.
The Board meets at least six times a year, including a two-day meeting to review the organisation’s ongoing strategic direction. This strategy meeting initiates the business planning process and informs the preparation of the annual Statement of Intent.
Delegation
The Board delegates day-to-day management of Tourism New Zealand to the Chief Executive who is directly accountable to the Board through the Chair. Tourism New Zealand’s Delegated Authorities Policy is set by the Board and reviewed annually.
Appropriate formal processes are in place for reporting back to the Board.
Induction and Development
Tourism New Zealand introduces each new Board member to the organisation through an induction process which includes time spent with senior executives and their teams. Members are also encouraged, where appropriate, to attend tourism-related events such as TRENZ and other industry events.
Conduct
Tourism New Zealand expects all its employees and board members to maintain the highest ethical standards. Tourism New Zealand has in place an
employee code of conduct, which all staff sign on joining the organisation. Tourism New Zealand also has a formal code of conduct for its board members, which is consistent with the code released by the State Services Commission.
Disclosure of Interests
The Board is conscious of its obligations to ensure that board members avoid any conflicts of interest in their decision-making process. The Board ensures that a proper process is followed and that members’ interests are formally recorded, with any changes or additions being disclosed at the start of each meeting. Members excuse themselves from any discussions in which their duty as a member could be compromised.
Risk Management
Tourism New Zealand manages its risks through a risk management framework; a process that requires it to identify legislative and business risks arising from its strategic direction and operating environment.
Tourism New Zealand’s Risk Management Policy is reviewed annually by the Audit Committee. The Chief Executive reports to the Board on the matter of new or escalated risks and the processes in place to manage these appropriately.
Tourism New Zealand conducts its own internal audits. Audits are agreed by the Audit Committee and programmes of work are developed with input by Tourism New Zealand’s external auditors. The results are reported back to the Audit Committee.
Board Committees
Committees of the Board are convened to deal with specific matters and include the Audit Committee and Remuneration Committee.
The Audit Committee meets at least three times a year. It reviews Tourism New Zealand’s internal control framework, external audit relationships and engagements, risk management, health and safety management, and financial reporting, including International Financial Reporting Standards (IFRS).
The Remuneration Committee meets on an ad-hoc basis. It reviews the performance and remuneration of the Chief Executive and senior management. The committee also approves proposed organisation-wide remuneration policies.
Governance
10

Subsidiary Companies
Tourism New Zealand has two subsidiary companies: Qualmark New Zealand (wholly owned), and the Visitor Information Network Incorporated, trading as i-SITE New Zealand. Legally Tourism New Zealand owns the Visitor Information Network, however, each of the 80 i-SITEs in New Zealand are individually owned and operated. (The relationship agreement between the owners and Tourism New Zealand meets the criteria determined in NZ IAS 27 for consolidating investments in subsidiaries.)
A member of Tourism New Zealand’s Executive Team chairs the i-SITE Board and the i-SITE executive comprises two Tourism New Zealand senior staff members.
The Tourism New Zealand Board is provided with financial information from each organisation at each meeting, as well as commentary on performance and significant issues.
Chris Sisarich
11

Board Members
Kerry Prendergast (CNZM), Chair
Tourism New Zealand’s Chair Kerry Prendergast has held the post since August 2011.
The former Mayor of Wellington and Vice-President of Local Government New Zealand holds an MBA from Victoria University of Wellington (where she is a Distinguished Alumnus), and was made a Companion of the New Zealand Order of Merit in 2011 for her services to local government.
In addition to her Tourism New Zealand role, Kerry is also Chair of the Environmental Protection Authority, the New Zealand
Richard Leggat, Deputy Chair
Richard has a varied background across business, marketing, and e-commerce. He is now a full-time director, and has been Deputy Chair of Tourism New Zealand since December 2013.
Richard is the Chair of NZ Cycle Trail Inc, the entity charged with ensuring the success and sustainability of the Government's national cycle trail
Raewyn Idoine
Raewyn is the founder of New Zealand’s largest private tourism education provider, the New Zealand School of Tourism (formerly the Sir George Seymour National College of Tourism), and has been instrumental in the success of a number of New Zealand business start-ups.
Raewyn has significant experience at a senior level in the education, tourism and health sectors, having been Independent Chair of the Local Government Industry Training Organisation, Stakeholder
Festival, the New Zealand Film Commission, the Wellington Jazz Music Festival Trust, and the Endangered Species Foundation. She is Deputy Chair of Wellington Free Ambulance and President of the Rotary Club of Wellington Inc.
Kerry is a director of Wellington Merchants (formerly Kirkcaldie & Stains), Worksafe NZ and Wellington Phoenix Football Club. She is also a patron and trustee of several New Zealand community organisations, and is an ambassador for Alzheimer's New Zealand.
On 18 August 2015 Kerry was reappointed for a second term ending on 17 August 2018.
initiative, and Panuku Development Auckland. He is also on the Boards of Cycling NZ, Snow Sports New Zealand, New Zealand Post, and Education New Zealand.
Richard, who was first appointed to the New Zealand Tourism Board on 1 February 2010, was reappointed for a third term that finishes on 10 April 2018.
Engagement Manager for the Tertiary Education Commission and a Board member of Learning State (the state sector industry training organisation). Raewyn now chairs the Southern Health and Disability Ethics Committee, is Advisor Marketing and Vocational Strategy for Lincoln University, and is a Director of the New Zealand Blood Service.
Raewyn was appointed to the Tourism New Zealand Board in August 2015 for a three-year term.
12

Board Members
Mike O’Donnell
A successful e-commerce manager and professional director, Mike is the Executive Director of G2G Know-How. This is a joint venture of Ministry of Foreign Affairs and Trade and New Zealand Trade and Enterprise that commercialises and sells New Zealand public sector intellectual property to governments around the world.
In addition to writing a weekly business column for Fairfax Media, Mike is a
Director of online global music company Serato, software company Raygun, and online booking company Timely. The former Chief Operating Officer of Trade Me previously chaired Positively Wellington Tourism and has managed several online travel businesses.
Mike was appointed to the New Zealand Tourism Board on 15 October 2013 for a three-year term.
Chris Parkin (CNZM)
Prominent arts patron and entrepreneur Chris Parkin owned the Museum Art Hotel in Wellington for 22 years, over which time it became the home of one of New Zealand’s finest collections of art. He was made a Companion of the New Zealand Order of Merit for services to the arts and business sector in 2011.
A former investment banker Chris was a Wellington City Councillor for nine years before retiring in 2004, and now owns several buildings and properties in the greater Wellington area.
Chris is a director of a number of New Zealand property companies, including Strada NZ Ltd (formerly Museum Hotel Ltd), Coalmyne Ltd, Form Apartments, Sloe Hand Ltd, Raglan Forestry Limited, and Gilmer Towers Ltd, and is Executive Director of G2G Know-How.
Chris was appointed to the New Zealand Tourism Board in December 2013, with his three-year term starting in April 2014.
Jacqui Spice
Jacqui Spice is the founder and CEO of Touch of Spice – a luxury travel and destination management company. Jacqui has more than two decades of experience working in the luxury market, both in New Zealand and offshore, catering to the most discerning clients in the world. The Touch of Spice head office is located in Queenstown and the team curates experiences, events, and itineraries throughout New Zealand.
It has amassed an extensive network of suppliers, products, transport and accommodation providers and customised a number of supremely unique experiences.
Jacqui was appointed to the New Zealand Tourism Board on 17 December 2013, with her three-year term starting on 27 January 2014.
13

Norm Thompson (ONZOM) (CFIntD)
Norm Thompson had a long career at Air New Zealand and held the role of Deputy Chief Executive prior to his retirement at the end of 2013.
He is the current Deputy Chair of Auckland Tourism, Events and Economic Development (ATEED), Director of Dot Kiwi Ltd, Queenstown Airport Corporation and Preno Limited, Trustee of the Young Enterprise Trust Board, and Committee Member of the 2016 New Zealand Golf Open.
Norm previously chaired the Tourism Industry Association of New Zealand, New Zealand Golf Strategy Group, Air New Zealand Environment Trust, and Altitude Engineering.
Norm was appointed to the New Zealand Tourism Board in December 2013, with his three-year term starting in April 2014.
John Thorburn
John is Chief Executive of InterCity Group, New Zealand’s largest bus and coach transport network.
He has held senior positions in a range of industries, including manufacturing, marketing and telecommunications, and was the former Chief Executive of Ngai Tahu Tourism. He has held board
positions with the New Zealand Tourism Industry Aotearoa and the New Zealand Conservation Authority.
John was initially appointed to the New Zealand Tourism Board on August 2012 for a three-year term, and was reappointed in August 2015 for a further three-year term (ending August 2018).
Jamie Tuuta
Jamie is the Chair of Te Ohu Kaimoana, the body set up to oversee Māori fisheries assets throughout New Zealand; and the Māori Trustee and Chief Executive of Te Tumu Paeroa, an organisation responsible for managing nearly 100,000 hectares of land and more than $100 million worth of assets and investments.
A former political reporter for Māori Television, Jamie has held a range of governance positions in iwi development, agribusiness, fishing, investment, health, Māori development, tourism and education. He is currently a director
of Aotearoa Fisheries Ltd, Wools of New Zealand and Taranaki Investment Management Ltd.
In 2015 Jamie received the Young Māori Business Leader Award at the Aotearoa NZ Māori Business Leaders Awards, and was awarded the Sir Peter Blake Emerging Leadership Award in 2010.
Jamie was first appointed to the New Zealand Tourism Board in March 2013 and was reappointed for a second term that ends in August 2018.
Board Members
14

Miles Holden
15

Core Leadership Team
Kevin Bowler, Chief Executive
Kevin Bowler joined Tourism New Zealand as Chief Executive in January 2010.
He is an alumnus of the Stanford Graduate School of Business in the United States and the University of Waikato Management School, and has marketing and business leadership experience spanning consumer packaged goods, telecommunications, and media brands in New Zealand and internationally.
Andrew Fraser, Director of Marketing
Andrew Fraser manages the most visible aspect of the 100% Pure New Zealand marketing campaign: consumer marketing and advertising activity. This includes overseeing the creative development, planning, researching and implementation of the campaign and advertising activity across Tourism New Zealand’s key markets.
Andrew is a seasoned senior marketing leader with more than 20 years’ experience.
Kevin is also a Board member of the Tourism Industry Association, Qualmark, The New Zealand Story, and is a member of the New Zealand Screen Production Grant Significant Economic Benefits Verification Panel, the Major Events Investment Panel, and the Tourism Growth Partnership Panel.
Prior to joining Tourism New Zealand, Andrew ran his own strategic consultancy business in Auckland. He has held senior marketing and executive roles with Cadbury/Kraft and Frucor Beverages/Danone, and developed and launched V Energy drink, which has become one of New Zealand’s most successful beverage and youth brands in recent years.
René de Monchy, Director of Trade, PR and Major Events
René manages Tourism New Zealand’s global trade and public relations (PR) activity including leading offshore trade teams, the business and premium sectors, and trade marketing, along with international PR, and major events.
René de Monchy joined Tourism New Zealand in August 2015. René brings 15 years’ global experience in consumer-led businesses including local and international marketing roles for Fonterra and Heineken and as Marketing Director at Asia Pacific Breweries in Singapore.
16

Deborah Gray, General Manager Corporate Affairs
Prior to joining Tourism New Zealand, Deborah spent many years working in the primary sector, including roles at the Ministry of Agriculture and Forestry, Scion, and Fonterra.
Deborah Gray joined Tourism New Zealand in October 2011 and oversees relationships with our key New Zealand stakeholders, including government ministers and NZ Inc, and manages Tourism New Zealand’s internal and external communications, information management, and industry relations.
Sue Parcell, General Manager Finance, IT and Strategy
strategic planning and reporting function, and is a Board member of Qualmark.
Sue has had considerable experience in the tourism industry, and has held senior finance and general management roles in New Zealand and overseas.
Sue Parcell joined Tourism New Zealand in August 2010 and is responsible for managing and leading the financial and accounting functions of Tourism New Zealand, while also managing our IT infrastructure. She also oversees the
Brighid Kelly, General Manager People
Brighid brings a breadth of experience in human resource management, organisation development, change leadership and project management which she has gained working across a number of industry sectors including information and communication technology, forestry, and banking.
Brighid Kelly is responsible for developing and implementing Tourism New Zealand's human resources management strategy. This includes recruitment, safety and wellness, capability development, performance management, remuneration and reward initiatives for employees based in New Zealand and Tourism New Zealand’s international offices.
Core Leadership Team
17

Strategic Priorities and OutcomesThis section describes Tourism New Zealand’s strategic priorities that contribute to the Government’s broader economic priorities and the performance of tourism outcomes that Tourism New Zealand contributes to. Tourism New Zealand’s outputs and activities are described in detail in the Statement of Performance starting on page 28 of this report.
Tourism New Zealand supports the objectives of the Business Growth Agenda (BGA) and plays an important role contributing to the ‘building export markets’ work stream, working closely with other NZ Inc agencies to help achieve the goal to increase the ratio of exports to gross domestic product to 40% by 2025.
Tourism New Zealand’s high level objective
Tourism New Zealand’s strategy and activities seek to contribute to the following high-level goal:
► To increase the value of international visitors to New Zealand
The activities delivered by Tourism New Zealand, as a key industry organisation, play a critical role in helping New Zealand reach its goal to maximise the value from international visitors and contribute to the aspirational Tourism 2025 growth target of 6% average value growth per annum through until 2025.
Tourism New Zealand strategic priorities
The overarching objective of improving the value derived from the international tourism sector is an industry wide goal. Tourism New Zealand contributes strongly to this objective through its five strategic priorities. All decisions on resource allocation (money, people and time), market and sector prioritisation, and activities and channels are made with the intention of delivering on these priorities.
Tourism New Zealand’s strategic priorities are summarised below.
▪ Strategic priority one: Grow a portfolio of markets that drives current opportunities and creates future market positions — Tourism New Zealand will deliver activity to grow the value of international visitors to New Zealand from a prioritised portfolio of visitor markets. A future-focused position will be adopted by investing in selected emerging markets to assist these countries to realise potential value in the medium- to long-term.
▪ Strategic priority two: Drive preference for visiting New Zealand — Tourism New Zealand will deliver strong, positive, emotive and inspiring messaging to drive greater preference for visiting New Zealand.
▪ Strategic priority three: Focus marketing activity on clearly defined higher value visitors — ensure campaign messages match the needs of the segments and sectors targeted to drive increasing value from visitors by encouraging them to stay longer and do more while in New Zealand.
▪ Strategic priority four: Partner widely to activate conversion and extend marketing reach — focus on commercial partnerships with aviation and overseas travel sellers and continue our partnership activity with Regional Tourism Organisations (RTOs) to drive preference and conversion-oriented activity. Tourism New Zealand will engage with the New Zealand tourism industry and overseas travel sellers to enhance their ability to market New Zealand and drive greater conversion.
▪ Strategic priority five: Optimise delivery capability — optimising the internal delivery capability of Tourism New Zealand through employing the appropriate staff and systems, and assisting with the capability of the industry in delivering a superior experience through Qualmark, i-SITE and Tourism New Zealand’s China Market Development Unit.
Tourism New Zealand key activity
The following activity groupings illustrate how Tourism New Zealand’s services are delivered to collectively achieve the strategic priorities.
▪ Activity one: Deliver key visitor messages through the 100% Pure New Zealand campaign activity.
▪ Activity two: Deliver key visitor messages through third parties such as media, opinion leaders, and broadcast production.
▪ Activity three: Partner with the travel industry to convert interest in New Zealand into travel and to extend marketing reach.
▪ Activity four: Inform and inspire global travel sellers to assist them to market New Zealand.
18
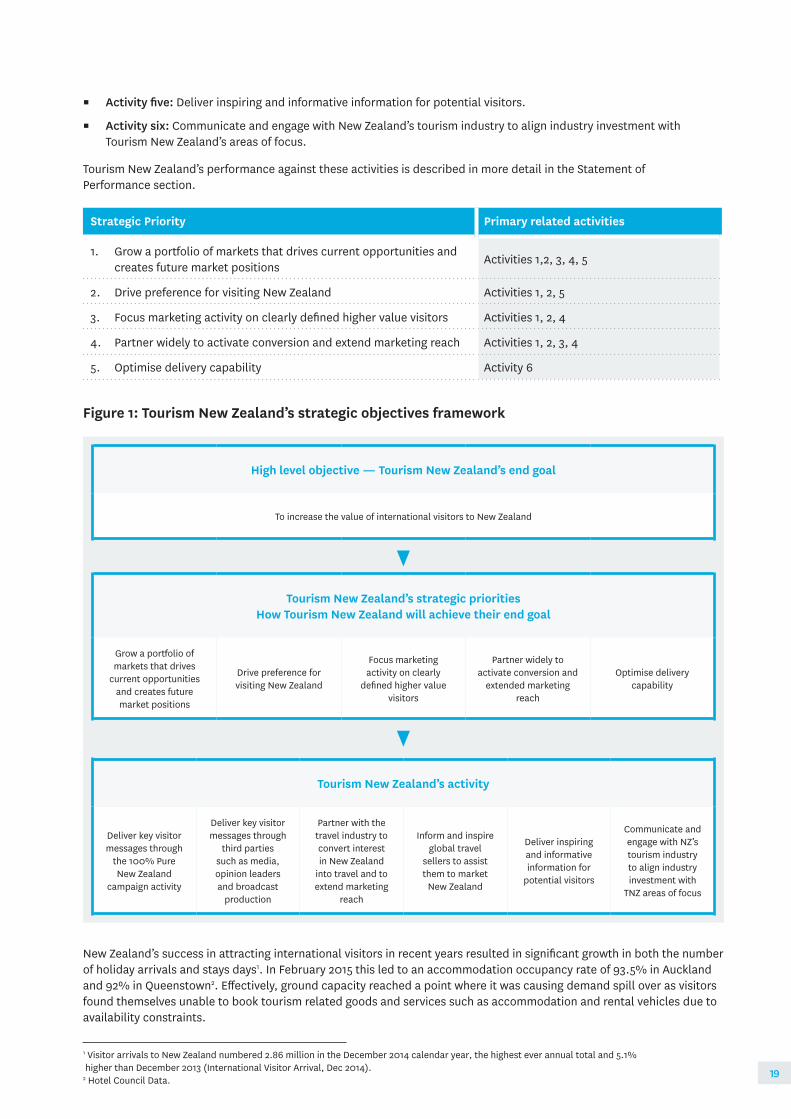
▪ Activity five: Deliver inspiring and informative information for potential visitors.
▪ Activity six: Communicate and engage with New Zealand’s tourism industry to align industry investment with Tourism New Zealand’s areas of focus.
Tourism New Zealand’s performance against these activities is described in more detail in the Statement of Performance section.
Strategic Priority Primary related activities
1. Grow a portfolio of markets that drives current opportunities and creates future market positions Activities 1,2, 3, 4, 5
2. Drive preference for visiting New Zealand Activities 1, 2, 5
3. Focus marketing activity on clearly defined higher value visitors Activities 1, 2, 4
4. Partner widely to activate conversion and extend marketing reach Activities 1, 2, 3, 4
5. Optimise delivery capability Activity 6
Figure 1: Tourism New Zealand’s strategic objectives framework
High level objective — Tourism New Zealand’s end goal
To increase the value of international visitors to New Zealand
▼Tourism New Zealand’s strategic priorities
How Tourism New Zealand will achieve their end goal
Grow a portfolio of markets that drives
current opportunities and creates future market positions
Drive preference for visiting New Zealand
Focus marketing activity on clearly
defined higher value visitors
Partner widely to activate conversion and
extended marketing reach
Optimise delivery capability
▼Tourism New Zealand’s activity
Deliver key visitor messages through
the 100% Pure New Zealand
campaign activity
Deliver key visitor messages through
third parties such as media, opinion leaders and broadcast
production
Partner with the travel industry to convert interest in New Zealand
into travel and to extend marketing
reach
Inform and inspire global travel
sellers to assist them to market
New Zealand
Deliver inspiring and informative information for
potential visitors
Communicate and engage with NZ’s tourism industry to align industry investment with
TNZ areas of focus
New Zealand’s success in attracting international visitors in recent years resulted in significant growth in both the number of holiday arrivals and stays days1. In February 2015 this led to an accommodation occupancy rate of 93.5% in Auckland and 92% in Queenstown2. Effectively, ground capacity reached a point where it was causing demand spill over as visitors found themselves unable to book tourism related goods and services such as accommodation and rental vehicles due to availability constraints.
1 Visitor arrivals to New Zealand numbered 2.86 million in the December 2014 calendar year, the highest ever annual total and 5.1% higher than December 2013 (International Visitor Arrival, Dec 2014). 2 Hotel Council Data. 19

The Tourism Satellite Account (TSA) contains high-level indicators describing the key economic contributions that international visitors made to the New Zealand. The following table details the most recent results available (for year ending March 2015) and shows key indicators moving in a positive direction.
Measure YE March 2015 YE March 2014 YE March 2013
International tourism expenditure in NZ $11,758m $10,040m $9,608m
Tourism direct contribution to GDP 4.90% 4.60% 4.70%
International tourism as a percentage of total exports 17.40% 15.00% 15.30%
Tourism full-time employees — direct 168,012 (6.9%) 159,618 (6.8%) 155,733(6.7%)
Tourism full-time employees — direct and indirect 295,908 (12.1%) 280,743 (11.9%) 273,993 (11.8)
Total tourism expenditure (incl. domestic) $29,838M $27,042M $25,996M
Tourism's contribution to GST earnings $2,485M $2,232M $2,135M
*Note YE March 2013 and 2014 results have been revised by Tourism Satellite
Strong growth in visitor arrivals and spend for the FY16 period (highlighted in the following sections) provide confidence that a positive result will be reflected in the next Tourism Satellite Account.
International tourism compared with New Zealand’s other key exports ($billion)
$b
$18
$16
$14
$12
$10
$8
$6
$4
$2
$0
YE March 2012 YE March 2013 YE March 2014 YE March 2015
International tourism Dairy products, including casein Meat and meat products Wood and wood products Crude Oil
In planning the activities for the 2015/16 financial year to support Tourism New Zealand’s goal of increasing the value of international visitors to New Zealand and contributing to the 2025 growth targets, the view was taken that, In the short to medium term, restrictions on ground capacity were unlikely to be alleviated.
As there is little opportunity to increase throughput during peak times, over the 2015/16 financial year, Tourism New Zealand redirected the focus of its activity to drive shoulder season demand (spring and autumn) in order to smooth out demand on ground services.
International tourism is New Zealand’s second largest export
International tourism is currently New Zealand’s second largest export, behind dairy. A comparison showing how international tourism compares with other major export sectors is shown below.
Data is sourced from the annual Tourism Satellite Account (TSA) published by Statistics New Zealand. The TSA for the year end March 2016 is due to be published by Statistics New Zealand on 26 October 2016.
20

Increasing the value of international visitors to New Zealand
Tourism New Zealand works closely with the wider New Zealand tourism industry to ensure strong economic outcomes for New Zealand. The outputs delivered by Tourism New Zealand contribute to this high level outcome; success is also influenced by variables that are outside both Tourism New Zealand’s and the wider tourism industry’s control.
The number of visitors to New Zealand and the amount they spend depends on a range of variables, these include:
▪ Tourism New Zealand’s marketing activities.
▪ The marketing activities of competing destinations and the efforts of other national tourism offices.
▪ The relative strength of the New Zealand brand.
▪ The impact of significant natural events both in New Zealand and in target markets.
▪ Exchange rates and the general economic conditions in countries of origin.
▪ Airline scheduling decisions, seat capacity on air routes and ticket pricing.
▪ Major events.
Strategic priority one: Grow a portfolio of markets that drives current opportunities and creates future market positions
To ensure that international visitors deliver the maximum possible value for New Zealand, Tourism New Zealand takes a market and segment portfolio approach that considers a number of global trends. As such, sustainably growing tourism over time means targeting both mature and emerging markets, and establishing new higher value segments within the traveller market.
Tourism New Zealand delivers activity to grow the value to New Zealand from a prioritised portfolio of visitor markets. A future-focused position is taken by investing in selected emerging markets to assist these countries to realise potential value in the medium- to long-term.
Tourism New Zealand’s market prioritisation is outlined below and reflects the value of current opportunities and, in the case of emerging markets, future opportunities. The portfolio approach seeks to maintain strong outcomes in the present while preparing a long-term position for New Zealand that reduces reliance on the largest markets by continuing to develop a balanced portfolio.
Priority One markets:Australia, China and the USA
Priority emerging markets:India, Indonesia,
Latin America
Priority Two markets:UK, Germany and Japan
Priority Three markets:Peninsular South East Asia, France, Rest of Europe, Korea, Canada
Visitor numbers from Australia are the single biggest contributor to peak season demand. Much greater focus was therefore applied to marketing travel in the shoulder seasons for activities. Other markets that lend themselves well to promotion of New Zealand shoulder season include India where numbers already peak in May, and Indonesia where visitors numbers peak in July/August.
21

Strong performance recorded in international visitor arrivals across Tourism New Zealand’s priority markets
Total international arrivals reached 3,310,390 for the year ending June 2016, an increase of 10.6% compared to the previous year. Growth was driven by holiday arrivals, which were up 16.1%. Importantly there was strong visitor arrival growth in Tourism New Zealand’s Priority One markets, particularly China, with 26.7% growth and the USA with 10.4% growth. In China a focus on the free independent traveller is not only increasing visitor numbers but also leading to a significant increase in Chinese visitor spend which reached $1.3 billion in the year to June 20163. Priority emerging markets also grew strongly at 11.9%, particularly India which grew visitor numbers by 13.3%, recognition that Tourism New Zealand's choice of Bollywood star, Sidharth Malhotra as tourism ambassador to India is a huge success, driving strong interest among Indians considering a New Zealand holiday.
Total international visitor arrivals from Tourism New Zealand’s priority markets are set out in the table below:
Total international visitor arrivals by market
Target market YE 30 June 2016 YE 30 June 2015 YE 30 June 2014 Change 2015/2016 (%)
Priority One markets
Australia 1,365,440 1,285,632 1,235,808 6.21%
China 396,928 313,376 240,496 26.66%
USA 257,536 233,344 211,712 10.37%
Priority Two markets
UK 213,808 198,080 194,384 7.94%
Germany 91,232 81,088 75,808 12.51%
Japan 94,208 84,432 75,520 11.58%
Priority emerging markets
LATAM* 35,168 26,096 25,008 34.76%
Indonesia 17,824 15,408 14,576 15.68%
India 48,368 42,672 33,904 13.35%
Priority Three markets
France 36,688 31,792 29,264 15.40%
Canada 55,472 50,512 48,432 9.82%
Singapore 53,456 47,280 44,704 13.06%
Malaysia 39,760 32,240 30,032 23.33%
Thailand 24,832 21,616 21,728 14.88%
Korea 75,088 60,608 53,072 23.89%
Rest of world 504,582 467,678 452,378 7.89%
Total — All markets 3,310,390 2,991,854 2,786,826 10.65%
* LATAM includes: Brazil, Mexico, Argentina and Chile
Holiday international visitor arrivals reached 1,695,696 for the year ending June 2016, an increase of 16.1%. This growth has been solid across all of Tourism New Zealand’s priority markets. There has been particularly strong growth in two of Tourism New Zealand’s core priority markets, with China increasing by 31% and the USA by 12.4%. North-East Asia has performed well with Japan increasing by 19.8% and Korea by 29.2%. Growth in the emerging markets portfolio has also been strong, with two of these markets achieving double-digit growth. India increased by 22.1%, and Indonesia by 15%.
3 International Visitor Survey, YE June 2016 Ministry of Business, Innovation and Employment (MBIE).22
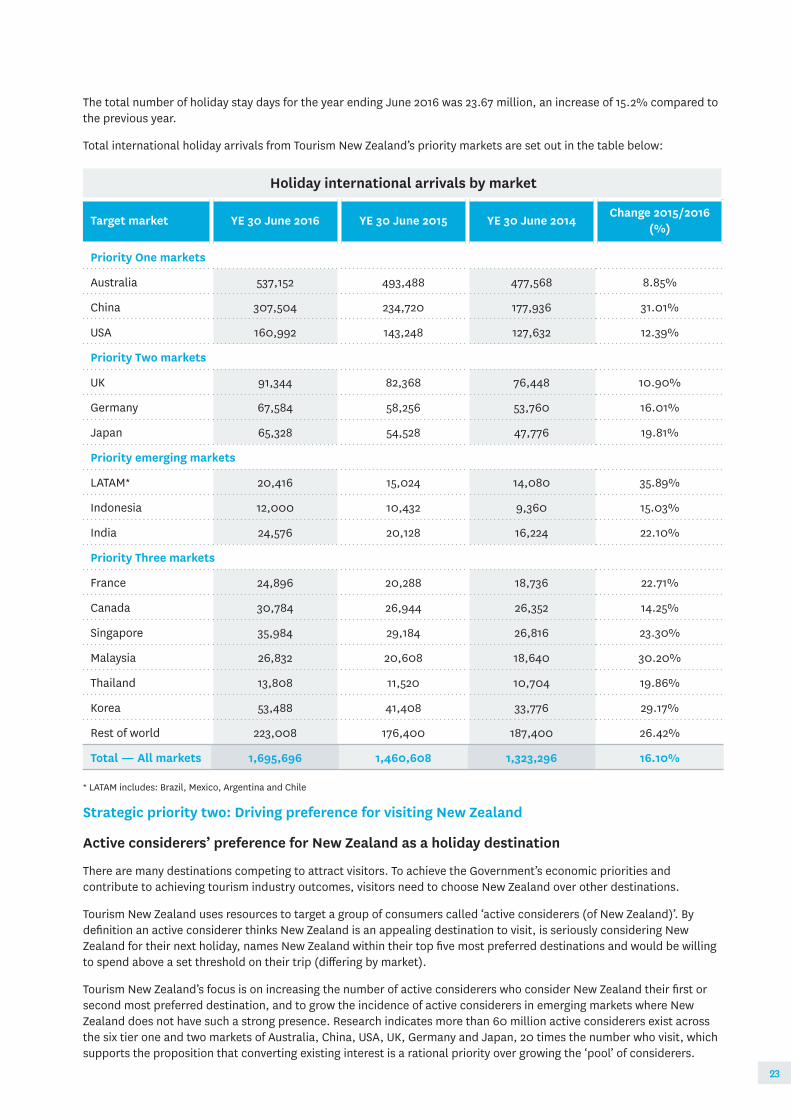
The total number of holiday stay days for the year ending June 2016 was 23.67 million, an increase of 15.2% compared to the previous year.
Total international holiday arrivals from Tourism New Zealand’s priority markets are set out in the table below:
Holiday international arrivals by market
Target market YE 30 June 2016 YE 30 June 2015 YE 30 June 2014 Change 2015/2016 (%)
Priority One markets
Australia 537,152 493,488 477,568 8.85%
China 307,504 234,720 177,936 31.01%
USA 160,992 143,248 127,632 12.39%
Priority Two markets
UK 91,344 82,368 76,448 10.90%
Germany 67,584 58,256 53,760 16.01%
Japan 65,328 54,528 47,776 19.81%
Priority emerging markets
LATAM* 20,416 15,024 14,080 35.89%
Indonesia 12,000 10,432 9,360 15.03%
India 24,576 20,128 16,224 22.10%
Priority Three markets
France 24,896 20,288 18,736 22.71%
Canada 30,784 26,944 26,352 14.25%
Singapore 35,984 29,184 26,816 23.30%
Malaysia 26,832 20,608 18,640 30.20%
Thailand 13,808 11,520 10,704 19.86%
Korea 53,488 41,408 33,776 29.17%
Rest of world 223,008 176,400 187,400 26.42%
Total — All markets 1,695,696 1,460,608 1,323,296 16.10%
* LATAM includes: Brazil, Mexico, Argentina and Chile
Strategic priority two: Driving preference for visiting New Zealand
Active considerers’ preference for New Zealand as a holiday destination
There are many destinations competing to attract visitors. To achieve the Government’s economic priorities and contribute to achieving tourism industry outcomes, visitors need to choose New Zealand over other destinations.
Tourism New Zealand uses resources to target a group of consumers called ‘active considerers (of New Zealand)’. By definition an active considerer thinks New Zealand is an appealing destination to visit, is seriously considering New Zealand for their next holiday, names New Zealand within their top five most preferred destinations and would be willing to spend above a set threshold on their trip (differing by market).
Tourism New Zealand’s focus is on increasing the number of active considerers who consider New Zealand their first or second most preferred destination, and to grow the incidence of active considerers in emerging markets where New Zealand does not have such a strong presence. Research indicates more than 60 million active considerers exist across the six tier one and two markets of Australia, China, USA, UK, Germany and Japan, 20 times the number who visit, which supports the proposition that converting existing interest is a rational priority over growing the ‘pool’ of considerers.
23

To help gauge the impact marketing spend is having on the level of preference active considerers have for New Zealand over other competing destinations, Tourism New Zealand undertakes regular campaign tracking within key and emerging markets and for certain special interest categories.
A summary of preference results for FY16 is provided in the tables below:
Proportion of active considerers in key markets who consider New Zealand their first or second preferred destination
Market FY16 actual FY16 target FY15 actual
Australia 62% 59% 58%
China 86% 86% 83%
USA 61% 68% 63%
UK 75% 65% 71%
Germany 69% 71% 70%
Japan 67% 62% 65%
Preference for New Zealand grew significantly across nearly all of Tourism New Zealand’s key markets except for the USA and Germany where levels remained stable. Record highs were achieved in Australia, China and the UK with other markets remaining flat. This strong performance is reflected in the positive visitor arrivals results from these markets.
Proportion of active considerers in emerging markets who consider New Zealand their first or second preferred destination
Market FY16 actual FY16 target FY15 actual
India 76% 67% 72%
Indonesia 79% 69% 83%
Latin America (Brazil) 67% 50% 47%
All emerging markets exceeded targets with performance enhanced by new travel routes to Latin America and Tourism New Zealand’s choice of Bollywood star, Sidharth Malhotra as tourism ambassador.
Digital channels remain important to driving preference for New Zealand as a destination
Digital channels including newzealand.com, digital brand campaigns and social media platforms all play important roles in driving preference for New Zealand amongst active considerers. Tourism New Zealand monitors the levels of connection with target audiences through a range of measures focused on engagement and interaction with active considerers.
Tourism New Zealand’s online channels continued to perform strongly in FY16, building on the previous year’s strong performance. Most targets were exceeded at both a global and local market level. Continued strong preference for New Zealand in priority markets has supported the effective acquisition of traffic to newzealand.com, both paid (search engine marketing, online display advertising etc.) and organic (natural or algorithm-driven results).
Result/measure FY16 actual FY16 target FY15 actual
Average number of total visits to newzealand.com per month
2,778,757 1,700,000 2,035,194
Average monthly ‘active visits’ to newzealand.com 1,142,645 793,000 839,792
24

Strategic priority three: Focus marketing activity on clearly defined high value visitors
Tourism New Zealand’s mandate is to increase value from international visitors for the economic benefit of New Zealand. It achieves this through strategies to specifically target high value visitors, and by ensuring campaign messages match the needs of the segments and sectors targeted by encouraging them to stay longer and do more while in New Zealand.
Visitor value can take several forms: for example, staying in New Zealand for a long time, travelling widely through New Zealand dispersing the economic benefit, spending strongly on a per night or per trip basis, travelling to New Zealand in low seasons, or returning to New Zealand in subsequent trips.
Research carried out by Tourism New Zealand has identified high value segments within New Zealand’s prioritised markets and these segments are the basis of Tourism New Zealand’s targeted strategies.
As well as focusing on valuable segments within key markets, higher value visitors are also targeted through the business events sector. Increasing market development, partnership and campaign activity has accelerated outcomes within this sector. The importance of this sector will continue to increase as New Zealand’s convention infrastructure improves with the New Zealand International Convention Centre in Auckland due to be completed in 2019, as well as additional facilities confirmed for Christchurch and Wellington, and proposed for Queenstown.
There has been a focus on targeting premium visitors as high value visitor spend injects significant revenue into the economy. Through dedicated resources and focus, high net worth individuals have been targeted in North America, Europe/UK, and Asia leveraging New Zealand’s best accommodation and attractions that appeal to this small but very valuable segment of the market. Data from 29 Luxury Lodges of New Zealand member properties shows that in the 2015/16 season $62 million was spent by overseas visitors in luxury accommodation. This figure shows an increase in luxury lodges revenue of 20.8% from the 2014/15 season4.
Research has also shown that promoting special interest travel can attract visitors who spend more and stay longer. Tourism New Zealand has identified special interests that present opportunities in priority markets including ski/snow, golf, hiking/walking and cycling.
The Chinese market is important in regards to value, and it has delivered exceptional arrivals growth to become New Zealand’s second most important market in terms of visitors and visitor expenditure. A key driver has been longer lengths of stay, in particular more Chinese tourists visiting New Zealand on exclusive (mono) rather than dual New Zealand and Australian itineraries.
Strong growth in international visitor spend and average spend per arrival
Our number one priority is to increase the value of international holiday visitors to New Zealand and these latest figures show we are making great progress. Total international visitor expenditure for the year ending June 2016 was $10.3 billion, an increase of 18% compared to the previous year5. Holiday expenditure was $6.3 billion, also an increase of 18% on the previous year. Total median spend per international visitor increased by 9% and by 4% for holiday international visitors, reflecting both a growth in volume and value improvement across the sector.
The figures released by the Ministry of Business, Innovation and Economic Development’s (MBIE) International Visitor Survey show the strongest growth in expenditure was driven from Asia, with China (up 33%), Japan (up 57%) and Korea (up 92%) reflecting strong expenditure growth from these markets throughout the year. Tourism New Zealand’s top three priority markets being Australia, USA and China, contributed over $5 billion in the total annual spend.
Total international visitor expenditure by market
Market YE June 2016 ($m) YE June 2015 ($m) YE June 2014 ($m) Change 2015/2016 (%)
Australia 2,486 2,295 2,096 8%
China 1,791 1,344 834 33%
UK 998 989 678 1%
USA 1,080 967 698 12%
Germany 565 482 364 17%
4 Aggregated LLNZ revenue data, provided to Tourism New Zealand and LLNZ members. 5 International Visitor Survey results April–June 2015, Ministry of Business, Innovation and Employment (MBIE). 25

Total international visitor expenditure by market
Market YE June 2016 ($m) YE June 2015 ($m) YE June 2014 ($m) Change 2015/2016 (%)
Japan 287 183 202 57%
Korea 293 153 139 92%
Canada 237 223 168 6%
Rest of Asia 1,026 804 564 28%
Rest of Europe 933 807 727 16%
Rest of Americas 131 146 70 -10%
Other 449 342 282 56%
Total 10,276 8,735 6,823 18%
Total international visitor expenditure summary
YE June 2016
Total (NZ$m) Median
Australia 2,486 1,500
China 1,791 3,300
UK 998 3,400
USA 1,080 3,300
Germany 565 4,900
Japan 287 2,000
Korea 293 2,200
Canada 237 3,300
Rest of Asia 1,026 3,000
Rest of Europe 933 4,200
Rest of Americas 131 1,500
Rest of Oceania 300 2,300
Africa and Middle East 149 3,000
Total 10,276 2,200
The number of targeted business events that specifically support the Government’s high priority sectors as defined by the Business Growth Agenda grew from 39 in FY15 to 42 in FY16. This was achieved through a focus on conference and incentive groups in the high priority sectors of marine, aviation, agri-business, health science, high value foods and earth science. Other sector bids supported included tourism, indigenous culture, creative and digital, biosecurity and conservation. Conference or incentive opportunities along with the New Zealand expertise in the sector combined to result in growth in the number of relevant business events supported.
A unique approach to hosting large incentive groups saw Tourism New Zealand and its partners secure incentive business from China worth at least $50 million dollars. Amway China will send 10,000 of its elite sales people to Queenstown in 2018 for five days, in a collaborative bidding approach led by Tourism New Zealand, supported by Destination Queenstown, Air New Zealand and Immigration New Zealand. The group will visit in multiple waves of 500 in autumn 2018.
Strategic priority four: Partner widely to activate conversion and marketing reach
Tourism New Zealand has continued to focus on commercial partnerships with aviation, overseas travel sellers, and with Regional Tourism Organisations (RTOs) to drive preference and conversion-oriented activity. This includes engaging with the New Zealand tourism industry and overseas travel sellers to enhance their ability to market New Zealand and drive greater conversion.
26
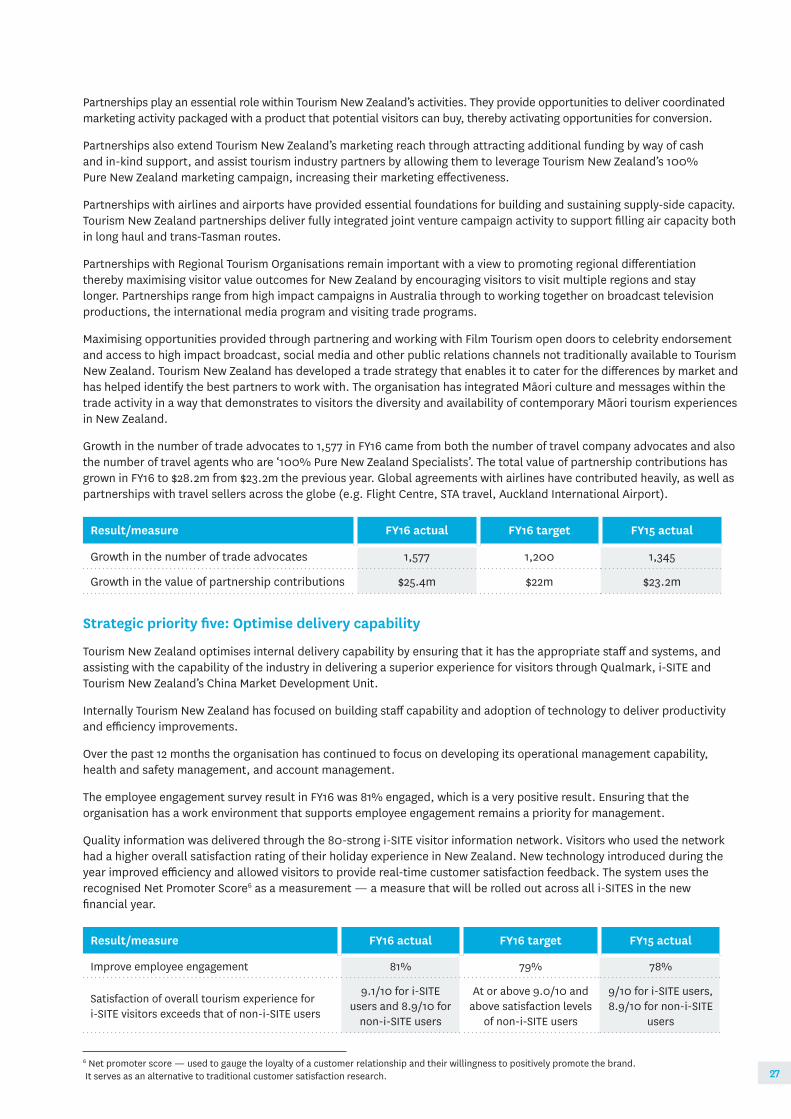
Partnerships play an essential role within Tourism New Zealand’s activities. They provide opportunities to deliver coordinated marketing activity packaged with a product that potential visitors can buy, thereby activating opportunities for conversion.
Partnerships also extend Tourism New Zealand’s marketing reach through attracting additional funding by way of cash and in-kind support, and assist tourism industry partners by allowing them to leverage Tourism New Zealand’s 100% Pure New Zealand marketing campaign, increasing their marketing effectiveness.
Partnerships with airlines and airports have provided essential foundations for building and sustaining supply-side capacity. Tourism New Zealand partnerships deliver fully integrated joint venture campaign activity to support filling air capacity both in long haul and trans-Tasman routes.
Partnerships with Regional Tourism Organisations remain important with a view to promoting regional differentiation thereby maximising visitor value outcomes for New Zealand by encouraging visitors to visit multiple regions and stay longer. Partnerships range from high impact campaigns in Australia through to working together on broadcast television productions, the international media program and visiting trade programs.
Maximising opportunities provided through partnering and working with Film Tourism open doors to celebrity endorsement and access to high impact broadcast, social media and other public relations channels not traditionally available to Tourism New Zealand. Tourism New Zealand has developed a trade strategy that enables it to cater for the differences by market and has helped identify the best partners to work with. The organisation has integrated Māori culture and messages within the trade activity in a way that demonstrates to visitors the diversity and availability of contemporary Māori tourism experiences in New Zealand.
Growth in the number of trade advocates to 1,577 in FY16 came from both the number of travel company advocates and also the number of travel agents who are ‘100% Pure New Zealand Specialists’. The total value of partnership contributions has grown in FY16 to $28.2m from $23.2m the previous year. Global agreements with airlines have contributed heavily, as well as partnerships with travel sellers across the globe (e.g. Flight Centre, STA travel, Auckland International Airport).
Result/measure FY16 actual FY16 target FY15 actual
Growth in the number of trade advocates 1,577 1,200 1,345
Growth in the value of partnership contributions $25.4m $22m $23.2m
Strategic priority five: Optimise delivery capability
Tourism New Zealand optimises internal delivery capability by ensuring that it has the appropriate staff and systems, and assisting with the capability of the industry in delivering a superior experience for visitors through Qualmark, i-SITE and Tourism New Zealand’s China Market Development Unit.
Internally Tourism New Zealand has focused on building staff capability and adoption of technology to deliver productivity and efficiency improvements.
Over the past 12 months the organisation has continued to focus on developing its operational management capability, health and safety management, and account management.
The employee engagement survey result in FY16 was 81% engaged, which is a very positive result. Ensuring that the organisation has a work environment that supports employee engagement remains a priority for management.
Quality information was delivered through the 80-strong i-SITE visitor information network. Visitors who used the network had a higher overall satisfaction rating of their holiday experience in New Zealand. New technology introduced during the year improved efficiency and allowed visitors to provide real-time customer satisfaction feedback. The system uses the recognised Net Promoter Score6 as a measurement — a measure that will be rolled out across all i-SITES in the new financial year.
Result/measure FY16 actual FY16 target FY15 actual
Improve employee engagement 81% 79% 78%
Satisfaction of overall tourism experience for i-SITE visitors exceeds that of non-i-SITE users
9.1/10 for i-SITE users and 8.9/10 for
non-i-SITE users
At or above 9.0/10 and above satisfaction levels
of non-i-SITE users
9/10 for i-SITE users, 8.9/10 for non-i-SITE
users
6 Net promoter score — used to gauge the loyalty of a customer relationship and their willingness to positively promote the brand. It serves as an alternative to traditional customer satisfaction research. 27

Statement of Performance Overview
This report covers the New Zealand Tourism Board’s (trading as Tourism New Zealand) performance for the year ending 30 June 2016 against the forecast statement of activities, performance measures and standards set out in Tourism New Zealand’s Statement of Performance Expectations FY16.
Tourism New Zealand’s resource allocation decisions were based on the extent to which each proposed activity would contribute towards the delivery of activities and outcomes described in the 2015-2018 Statement of Intent and Statement of Performance Expectations FY16.
In FY16, Tourism New Zealand’s activities were funded primarily from one appropriation from within Vote Business, Science and Innovation, into which Vote Tourism was merged in 2015.
Statement of Performance
FY16 Actual $000s FY16 Budget $000s FY15 Actual $000s
Appropriation One: Marketing of New Zealand as a visitor destination
Crown Revenue $115,850 $115,850 $113,350
Other Revenue7 $5,618 $4,690 $6,431
Total Expenses8 $121,713 $120,540 $120,214
Total Revenue $121,468 $120,540 $119,781
Total Expenses $121,713 $120,540 $120,214
Activity performanceIn FY16 Tourism New Zealand focused on the following six activities:
1. Deliver key visitor messages through the 100% Pure New Zealand campaign activity.
2. Deliver key visitor messages through third parties such as media, opinion leaders and broadcast production.
3. Partner with the travel industry to convert interest in New Zealand into travel and to extend marketing reach.
4. Inform and inspire global travel sellers to assist them to market New Zealand.
5. Deliver inspiring and informative information for potential visitors.
6. Communicate and engage with New Zealand’s tourism industry to align industry investment with Tourism New Zealand areas of focus.
7 Other revenue includes bank interest, partner revenue; it excludes foreign exchange gains. 8 Total expenses include offsets from foreign exchange reserves to protect the funding lines from adverse movements in foreign exchange during the year with offshore expenditure. Total expenses exclude other foreign exchange losses.28
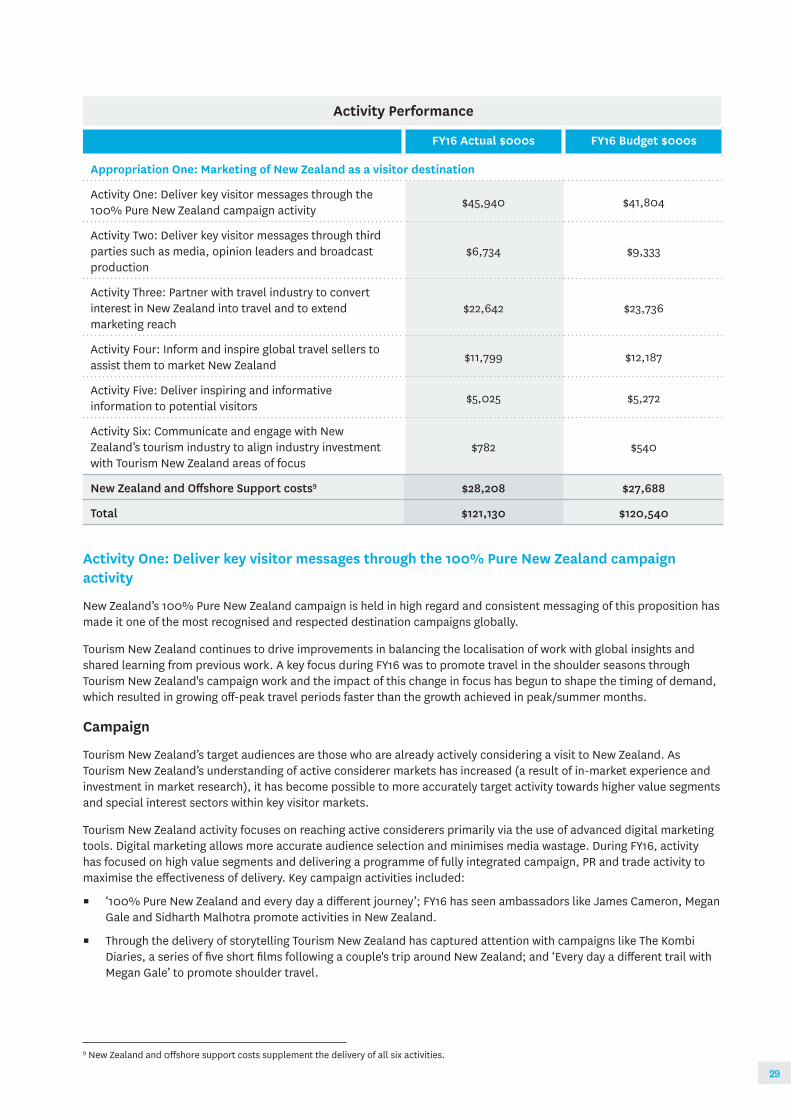
Activity Performance
FY16 Actual $000s FY16 Budget $000s
Appropriation One: Marketing of New Zealand as a visitor destination
Activity One: Deliver key visitor messages through the 100% Pure New Zealand campaign activity $45,940 $41,804
Activity Two: Deliver key visitor messages through third parties such as media, opinion leaders and broadcast production
$6,734 $9,333
Activity Three: Partner with travel industry to convert interest in New Zealand into travel and to extend marketing reach
$22,642 $23,736
Activity Four: Inform and inspire global travel sellers to assist them to market New Zealand $11,799 $12,187
Activity Five: Deliver inspiring and informative information to potential visitors $5,025 $5,272
Activity Six: Communicate and engage with New Zealand’s tourism industry to align industry investment with Tourism New Zealand areas of focus
$782 $540
New Zealand and Offshore Support costs9 $28,208 $27,688
Total $121,130 $120,540
Activity One: Deliver key visitor messages through the 100% Pure New Zealand campaign activity
New Zealand’s 100% Pure New Zealand campaign is held in high regard and consistent messaging of this proposition has made it one of the most recognised and respected destination campaigns globally.
Tourism New Zealand continues to drive improvements in balancing the localisation of work with global insights and shared learning from previous work. A key focus during FY16 was to promote travel in the shoulder seasons through Tourism New Zealand's campaign work and the impact of this change in focus has begun to shape the timing of demand, which resulted in growing off-peak travel periods faster than the growth achieved in peak/summer months.
Campaign
Tourism New Zealand’s target audiences are those who are already actively considering a visit to New Zealand. As Tourism New Zealand’s understanding of active considerer markets has increased (a result of in-market experience and investment in market research), it has become possible to more accurately target activity towards higher value segments and special interest sectors within key visitor markets.
Tourism New Zealand activity focuses on reaching active considerers primarily via the use of advanced digital marketing tools. Digital marketing allows more accurate audience selection and minimises media wastage. During FY16, activity has focused on high value segments and delivering a programme of fully integrated campaign, PR and trade activity to maximise the effectiveness of delivery. Key campaign activities included:
▪ ‘100% Pure New Zealand and every day a different journey’; FY16 has seen ambassadors like James Cameron, Megan Gale and Sidharth Malhotra promote activities in New Zealand.
▪ Through the delivery of storytelling Tourism New Zealand has captured attention with campaigns like The Kombi Diaries, a series of five short films following a couple's trip around New Zealand; and ‘Every day a different trail with Megan Gale’ to promote shoulder travel.
9 New Zealand and 0ffshore support costs supplement the delivery of all six activities.
29

▪ Digital marketing — highly targeted and measurable activity: ▫ Investing in paid search engine marketing, i.e. purchasing travel search terms utilised by active considerers to
draw them to newzealand.com. ▫ Investing in paid online digital display advertising, i.e. purchasing banner and rich media (video) advertisement
space on websites that reach active considerers. ▫ Search engine optimisation; optimising newzealand.com so that potential visitors are exposed to marketing
channels and content (and New Zealand content more generally) more often when they are researching travel online.
▪ Promoting New Zealand as a compelling business events destination through campaigns in Australia, China, South East Asia and North America, plus a global campaign targeting association decision makers.
▪ Specific sector campaign activity targeting special interest activities (walking/hiking, cycling, golf and fishing), backpacker and working holiday visitors, and China mono-destination/Free and Independent Travellers.
▪ Highly targeted premium segment campaign activity. ▪ Using new teams in emerging markets to build promotional activity to grow New Zealand’s profile and desirability as
a destination.
Campaign activity has close alignment with the industry’s shared framework for growth, Tourism 2025, in particular the themes of:
▪ Productivity for profit through driving demand for shoulder travel periods and regional dispersal. ▪ Growing sustainable air connectivity through joint venture partnership campaigns. ▪ Targeting higher value visitors through our investments in prioritised markets and segments.
Market insightsTourism New Zealand supports the drive for increasing the value of international visitors by carrying out market research to provide core intelligence and evaluation input into the development of marketing campaigns, providing insights on growth in visitor numbers and value, and exploring high value segments.
In line with the ‘insights’ theme of the Tourism 2025 industry framework — growing value together — a focus for Tourism New Zealand has been to share information and insights with the travel industry.
Key activity included: ▪ Increased industry stakeholder engagement/communication of insights through provision of market snapshots,
industry insight presentations and webinars. ▪ Active considerer research — regular surveying of target audiences across key and emerging markets to monitor
brand and campaign performance along with specific market issues. ▪ Bringing the active considerer segmentation to life through reviewing and updating active considerer segment
profiles. ▪ Analysis of core tourism datasets including international visitor arrivals and the International Visitor Survey for
market trends, intelligence and strategic insight. ▪ Digital analytics — active optimisation of newzealand.com and digital campaign through measurement and analysis
of digital activity around campaigns and newzealand.com.
Market insights activity is aligned with the Tourism 2025 framework, in particular the themes of: ▪ Develop market insight and formulating models for better industry access to information. ▪ Drive value through outstanding visitor experience through sharing market insight with industry. Link to Tourism
New Zealand’s strategic priorities.
Tourism New Zealand’s campaign and market insights activity is a key vehicle for delivering the brand message in its off-shore markets and delivers against four of the five strategic priorities from the three-year (later approved as a four-year) marketing strategy:
▪ Grow a portfolio of markets that drives current opportunities and creates future market positions. ▪ Drive preference for New Zealand. ▪ Focus marketing activity on clearly defined higher value visitors. ▪ Partner widely to activate conversion and extend marketing reach.
30

Activity One: Deliver key visitor messages through the 100% New Zealand campaign activity
Result/measure Performance Status
Quantity
Brand campaign activity delivered — key markets Australia Target: Three brand campaigns, SEM always on
Five brand campaigns, SEM always on Achieved
China Target: Two brand campaigns, SEM always on
Three brand campaigns, SEM always on Achieved
USA Target: Three brand campaigns, SEM always on
Three brand campaigns, SEM always on Achieved
UKTarget: One brand campaign, SEM always on
Four brand campaigns, SEM always on Achieved
Germany Target: Three brand campaigns, SEM always on
Five brand campaigns, SEM always on Achieved
JapanTarget: Two brand campaigns, SEM always on
Two brand campaigns, SEM always on Achieved
Business events campaign activity Target: Four brand campaigns, SEM always on
Five brand campaigns, SEM always on Achieved
Brand campaign activity delivered — emerging markets India Target: Two brand campaigns, SEM always on
Two brand campaigns, SEM always on Achieved
IndonesiaTarget: Two brand campaigns, SEM always on
Two brand campaigns, SEM always on Achieved
Latin America Target: Two brand campaigns, SEM always on
Two brand campaigns, SEM always on Achieved
31

Activity One: Deliver key visitor messages through the 100% New Zealand campaign activity
Result/measure Performance Status
Cost effectiveness
Cost per engagement from display10
Australia Target: $2.00-$2.50 $0.99 Achieved
China Target: $1.20-$1.80 $0.48 Achieved
USA Target: $1.20-$1.80 $0.04 Achieved
UK Target: $1.50-$2.20 $0.06 Achieved
Germany Target: $1.50-$2.20 $0.08 Achieved
Japan Target: $2.50 – $3.00 $0.28 Achieved
Cost per acquisition from search11
Australia:Target: $2.50-$3.00 $0.62 Achieved
China: Target: $1.50-$2.00 $0.78 Achieved
USA:Target: $3.00-$3.50 $2.43 Achieved
UK Target: $2.00-$2.50 $1.99 Achieved
Germany Target: $2.00-$2.50 $1.32 Achieved
Japan Target: $3.50-$4.00 $1.66 Achieved
10 Engagement: when an action is taken on an ad i.e. a click, a play of a TV commercial; some form of an interaction.
11 Acquisition: refers to someone who has been drawn to newzealand.com as a result of seeing and acting on advertising/search initiatives delivered by Tourism New Zealand.32

Activity Two: Deliver key messages through third parties such as media, opinion leaders and broadcast production
Public relations
Communication channels such as public relations deliver brand messages through third parties (e.g. opinion leaders, independent media), drive preference for visiting New Zealand and assist in strengthening conversion of potential visitors into actual visitors.
During FY16, activity focused on high value segments and sectors and delivered a programme of integrated campaign, public relations and trade activity to maximise effectiveness. Activity included:
▪ Public relations activity to build preference levels with target audiences and support conversion of visitors.
▫ Hosting of international media, bloggers and opinion leaders.
▫ Providing support to targeted broadcast production projects that enabled Tourism New Zealand to communicate its destination messages through existing broadcasters with good reach.
▫ Capitalising on the demand for high quality content and generated content to widen the range of assets available to publishers.
▪ Developing and implementing media programmes to leverage the media opportunities associated with movies filmed in New Zealand such as Ghost in the Shell and Pete's Dragon.
▪ Supporting and leveraging events both on and offshore that provided a vehicle to communicate Tourism New Zealand’s destination messages.
▪ Seeking out and creating opportunities through third party channels to deliver activity that supports the Christchurch recovery.
▪ Targeting, evaluating and securing key opinion leaders such as James Cameron, Megan Gale and Sidharth Malhotra for use in PR and campaign activity to deliver the 100% Pure New Zealand message and deliver marketing reach.
▪ Social media — growing engagement and reach with social media platforms (e.g. Facebook) that assist Tourism New Zealand to build, engage and inspire active considerers.
Public relations activity is aligned with the Tourism 2025 framework, in particular the themes of:
▪ Targeting for value through public relations work focused on growing preference for New Zealand amongst active considerers in key and emerging markets in particular, as well as special interest sectors.
▪ Productivity for profit through driving regional dispersal and shoulder season travel including through support for, and promotion of, events.
Link with Tourism New Zealand strategic priorities
Tourism New Zealand’s PR activity is primarily aimed at achieving:
▪ Driving preference for New Zealand.
Due to Tourism New Zealand’s desire to integrate messages across multiple platforms this output was frequently part of the following priorities as well:
▪ Focus marketing activity on clearly defined higher value visitors.
▪ Partner widely to activate conversion and extend marketing reach.
33
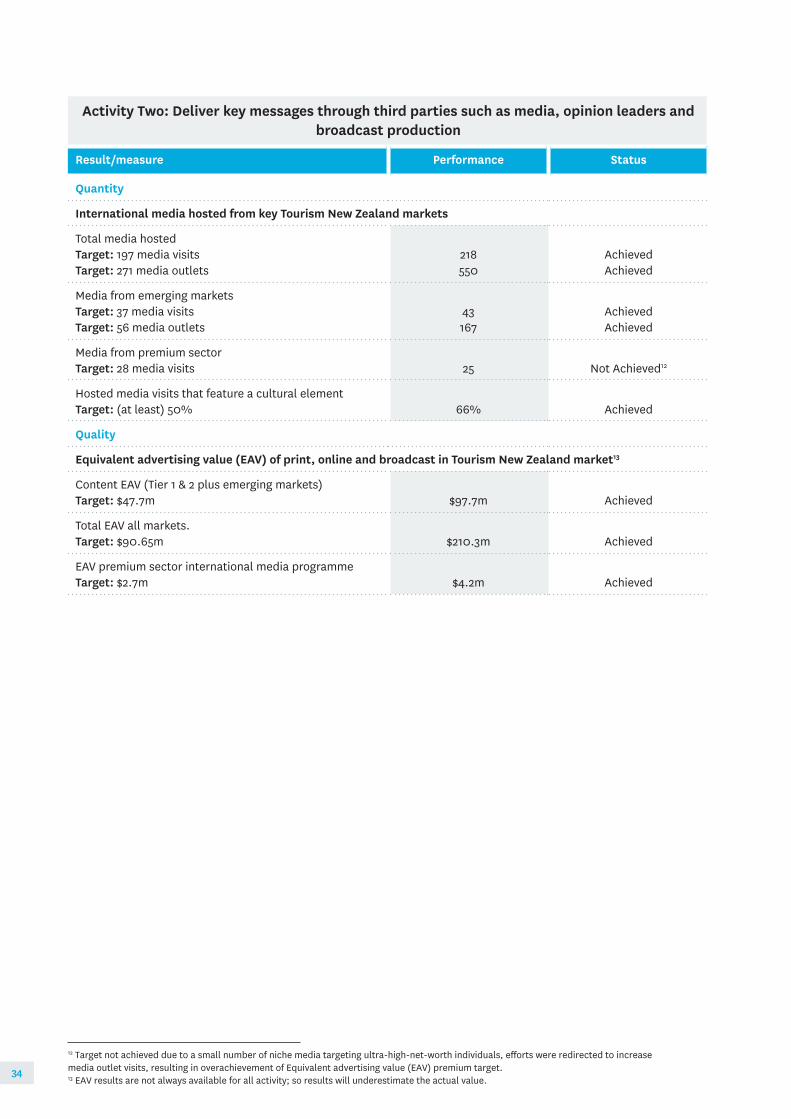
Activity Two: Deliver key messages through third parties such as media, opinion leaders and broadcast production
Result/measure Performance Status
Quantity
International media hosted from key Tourism New Zealand markets
Total media hostedTarget: 197 media visitsTarget: 271 media outlets
218550
AchievedAchieved
Media from emerging marketsTarget: 37 media visitsTarget: 56 media outlets
43167
AchievedAchieved
Media from premium sectorTarget: 28 media visits 25 Not Achieved12
Hosted media visits that feature a cultural elementTarget: (at least) 50% 66% Achieved
Quality
Equivalent advertising value (EAV) of print, online and broadcast in Tourism New Zealand market13
Content EAV (Tier 1 & 2 plus emerging markets)Target: $47.7m $97.7m Achieved
Total EAV all markets.Target: $90.65m $210.3m Achieved
EAV premium sector international media programmeTarget: $2.7m $4.2m Achieved
12 Target not achieved due to a small number of niche media targeting ultra-high-net-worth individuals, efforts were redirected to increase media outlet visits, resulting in overachievement of Equivalent advertising value (EAV) premium target. 13 EAV results are not always available for all activity; so results will underestimate the actual value.34

Activity three: Partner with the travel industry to convert interest in New Zealand into travel and to extend marketing reach
Joint venture activity
Joint venture partnerships play an essential role within Tourism New Zealand’s activities. They provide an opportunity to deliver Tourism New Zealand marketing activity coordinated with products that potential visitors can buy, thereby activating opportunities for conversion. Partnerships extend Tourism New Zealand’s marketing reach through attracting additional funding by way of cash and in-kind support as well as assisting tourism industry partners by allowing them to leverage off Tourism New Zealand’s 100% Pure New Zealand campaign, thereby increasing their effectiveness in market. Partnerships in FY16 included high impact campaigns in Australia, promoting New Zealand through significant television broadcast productions, and visiting media and trade programmes.
Key activities included:
▪ Partnered campaigns; partnering with public and private organisations to deliver campaigns that enabled Tourism New Zealand to pair advertising with a travel conversion partner’s offer.
Partnership activity with Regional Tourism Organisations
Partnerships with Regional Tourism Organisations (RTOs), predominantly in Australia for campaign work, remain important, focusing on building regional stories (e.g. North Island touring, and ski holidays) and delivering conversion activity to maximise visitor value outcomes for New Zealand.
Joint venture and partnership activity aligns with the Tourism 2025 strategy, in particular the themes of:
▪ Targeting for value through our partnership campaigns that drive conversion of higher value visitors across our markets and sectors.
▪ Productivity for profit through driving regional dispersal and shoulder and off-season (ski) travel.
Working with the aviation sector
Partnerships with airlines and airports provide essential foundations for building and sustaining supply-side capacity.
▪ Tourism New Zealand partnerships delivered fully integrated joint venture campaign activity to support filling capacity both in long haul and trans-Tasman routes.
▪ Tourism New Zealand continued to work closely with airlines to support and increase in-bound seat capacity to New Zealand.
Tourism New Zealand maintains agreements with aviation and airline partners, for example Air New Zealand, where they are aligned with Tourism New Zealand’s international aviation strategy. Under these agreements partnered marketing campaigns are carried out that support the aviation routes that are critical to developing tourism.
Working with the aviation sector activity aligns with the Tourism 2025 framework, in particular the theme of:
▪ Growing sustainable air connectivity through memorandums of understanding with Air New Zealand and other airlines, cooperation with airports and with connection to other parts of government and Ministers. Delivering fully integrated joint venture campaigns allows flexible timing of activity to build non-peak travel to assist with airline load factors with the long term aim of building sustainable airline connections to New Zealand.
Link with Tourism New Zealand strategic priorities
Tourism New Zealand’s joint venture and aviation activity is primarily aimed at achieving partnerships to activate conversion and extend marketing reach.
35

Activity Three: Partner with the travel industry to convert interest in New Zealand into travel and to extend marketing reach
Result/measure Performance Status
QuantityKey markets partnership campaign activity14
Australia Target: 13 partnered campaigns 24 Achieved
ChinaTarget: 4 partnered campaigns 4 Achieved
USATarget: 7 partnered campaigns 13 Achieved
UKTarget: 4 partnered campaigns 8 Achieved
GermanyTarget: 3 partnered campaigns 4 Achieved
JapanTarget: 2 partnered campaigns 4 Achieved
Emerging markets partnership campaign activityIndiaTarget: 2 partnered campaigns 6 Achieved
IndonesiaTarget: 2 partnered campaigns 4 Achieved
Latin AmericaTarget: 3 partnered campaigns 5 Achieved
QualityCampaign return on investment (ROI)15
AustraliaTarget 5:1 47:1 Achieved
ChinaTarget 5:1 33:1 Achieved
USATarget 5:1 17:1 Achieved
UKTarget 5:1 26:1 Achieved
GermanyTarget 5:1 49:1 Achieved
JapanTarget 5:1 32:1 Achieved
QualityValue of partnership contributions16
Target: $22.0m $25.4m Achieved
14 Partnered campaigns link Tourism New Zealand activity with an offer through a partner. Brand campaigns are not directly linked with a partner and typically drive activity to newzealand.com.15 ROI is calculated by: (passengers booked) x (average visitor spend in NZ for market)/campaign spend. This generates a ratio that shows for every dollar we spent we generated ‘x’ amount of visitor value. Note: ROI relates to campaign spend only and is not intended to represent a ROI for overall Tourism New Zealand activity. It also does not attempt to calculate substitution or to estimate the level of incremental value.16 The $25.4m of partnership contributions includes $8.46m of non-financial contributions from partners. These are contributions of a non-cash nature made by partners to joint activity with Tourism New Zealand such as discounted airfares, accommodation and activity admission fees for a trade or media familiarisation and inclusion of Tourism New Zealand provided content in partner distributed e-mail newsletters and on partner websites.The equivalent dollar value of these contributions is estimated by Tourism New Zealand and Regional Tourism Organisation staff using their experience and knowledge of the market, often with reference to external sources such as websites, pricelists published and communications with the partners themselves.36

Activity Four: Inform and inspire global travel sellers to assist them to market New Zealand
Working with the travel tradeThe overseas travel trade is an essential step for many people between considering a trip to New Zealand and deciding to make a booking. Active considerers use a multi-channel approach for researching and booking travel and the travel trade is active in many of these channels. Tourism New Zealand has delivered activity to educate, connect and familiarise global travel sellers to enable them to sell more high value New Zealand holidays. Activity was delivered to:
▪ Generate and convert consumer interest by fully integrating trade offers into partnered marketing campaigns.
▪ Educate trade to improve product knowledge and increase volume and value of conversions.
▪ Connect the New Zealand industry with the right trade partners.
▪ Lead product development (itineraries) in market and facilitate information flow with New Zealand industry.
Key activities included:
▪ Trade familiarisations, e.g. familiarisation visits to New Zealand for travel company product managers and decision makers.
▪ Online resources (primarily the 100% Pure New Zealand Specialist Programme) to increase the knowledge and sales of travel sellers, including through region and product specific online training modules and product updates.
▪ ‘Training the trade’ programmes including face-to-face training workshops and virtual channels such as webinars.
▪ Organising trade events and coordinating participation by the New Zealand tourism sector at international trade shows.
Working with the travel trade aligns with the Tourism 2025 framework, in particular the theme of:
▪ Targeting for value through activity focused on growing ability of trade offshore and in New Zealand to sell destination New Zealand.
Growing the business events sector
The business events sector is a high value market segment for New Zealand. In addition to delivering an incremental direct contribution through international delegates’ spend, holding international business events in New Zealand acts as an economic development tool by facilitating new business-to-business relationships, encouraging knowledge transfer to New Zealand and creating new investment opportunities. Business events are also an attractive way to bring visitors to New Zealand in the shoulder and low seasons and address the seasonality of visitor streams.
With significant new conference facilities being planned and expected to become available in 2017 to 2018, Tourism New Zealand is focused on promoting New Zealand as an international business events destination and growing the value of this important international visitor sector.
In the trade space this includes:
▪ Increasing Tourism New Zealand’s presence at global trade shows and events.
▪ Delivery of a business events familiarisation programme.
Business events activity aligns closely with the Tourism 2025 framework, in particular the themes of:
▪ Targeting for value: through a focus on growing the volume and value from a higher spending visitor sector.
▪ Productivity for profit: promoting regional dispersal and shoulder season travel though considering timing of events when deciding on support for and promotion of events.
Link with Tourism New Zealand strategic priorities
Tourism New Zealand’s activity in working with the travel trade area is primarily aimed at achieving priority four:
▪ Partner widely to activate conversion and extend marketing reach.
Tourism New Zealand’s activity in the business events space is primarily aimed at achieving priority three:
▪ Focus marketing activity on clearly defined higher value visitors.
37

Activity Four: Inform and inspire global travel sellersto assist them to market New Zealand
Result/measure Performance Status
Quantity
Successful travel module17 completions
Total all marketsTarget: 21,000 travel modules completed 32,635 Achieved
Emerging marketsTarget: 5,500 travel modules completed 6,870 Achieved
Trade on Tourism New Zealand-hosted familiarisations
Total all marketsTarget: 650 894 Achieved
Total emerging marketsTarget: 95 79 Not achieved18
Business eventsTarget: 80 101 Achieved
Premium sectorTarget: 65 57 Not achieved19
Trade familiarisation that feature a cultural elementTarget: at least 75% 88% Achieved
Major trade events attended by Tourism New Zealand
Total all MarketsTarget: Minimum of 30 61 Achieved
Business eventsTarget: 8 8 Achieved
Premium sector eventsTarget: 13 22 Achieved
Major trade events organised and facilitated by TNZTarget: Minimum of 10 13 Achieved
Quality
Number of travel company advocatesTarget: 185 227 Achieved
Maintain the number of travel agents who are ‘100% Pure New Zealand Specialists’
Total all MarketsTarget: 1,200 1,577 Achieved
Emerging marketsTarget: 150 178 Achieved
17 The online training platform for travel training on the 100% Pure New Zealand specialist programme.18 Emerging market ‘familiarisations’ target not achieved due to Brazil being four familiarisations short. This was due to a re-prioritisation of resources within the market to instead support the new air service with Air New Zealand from Buenos Aires through digital sales campaign and in market training (IMA Roadshow) activity.19 Overall premium familiarisation targets did not meet Key Performance Indicator level due to role vacancies in the Asian markets for up to six months, as the recruitment of the appropriate skills took longer than expected. All other premium markets performed as per expectation.38

20 The number of Incentive bids was not achieved due to a refocus on quality rather than quantity. The result of this approach achieved an incentive bids value of 92.8m, a significant over achievement from the 26m target.
Activity Four: Inform and inspire global travel sellersto assist them to market New Zealand
Result/measure Performance Status
Quantity
Bids supported through the Conference Assistance Programme (CAP) FundTarget: 60
71 Achieved
Quality
Success rate for bids supported through the Conference Assistance Programme fundTarget: 60%
72% Achieved
Estimated value of bids supported through Conference Assistance Programme fundTarget: $90m
$96.2m Achieved
Quantity
Incentive bids supported (Tourism New Zealand only tracks incentive bids for 50 people or higher or with an estimated value of more than $200,000 NZD (excl. air fare))
China, USA (North America), Peninsular South East AsiaTarget: 150 142 Not achieved20
Quality
Value of incentive bids convertedTarget: $26.0m $92.8m Achieved
39

Activity Five: Deliver inspiring and informative information for potential visitors
newzealand.com
Tourism New Zealand’s consumer website performs a dual role. One is as a marketing tool to convert active considerers’ preference for New Zealand into actual travel. The second is to enable visitors to engage with one another and with travel sellers to source information and advice.
Key activities included:
▪ Creation and delivery of an integrated content programme to ensure active considerers are reached and engaged.
▪ Delivery of features and experiences specifically designed for mobile consumers.
newzealand.com activity aligns with the Tourism 2025 framework, in particular the strategic theme:
▪ Driving value through outstanding visitor experience through providing high quality and timely information for international visitors to New Zealand.
i-SITE New Zealand
Tourism New Zealand also supports the provision of information to visitors through its role with the i-SITE network.
i-SITE New Zealand visitor centres (80 across New Zealand) provide information and a booking service for attractions, transport, accommodation and events to international and domestic visitors in New Zealand.
Tourism New Zealand has no ownership stake in any individual i-SITE centres. i-SITE New Zealand is a subsidiary of Tourism New Zealand, governed by a Board of Directors. The subsidiary is the owner of the i-SITE brand and livery. Tourism New Zealand provides staff, support services, business systems and marketing to raise the profile of the i-SITE network among visitors.
i-SITE New Zealand has established the membership standards that individual centres must achieve to use the i-SITE brand and become a part of the network of centres. These standards are enforced by site inspections of the centres by Qualmark assessors.
i-SITE New Zealand activity aligns with the Tourism 2025 framework, in particular the strategic theme:
▪ Drive value through outstanding visitor experience through providing high quality information and service for international visitors to New Zealand.
Link with Tourism New Zealand strategic priorities
Tourism New Zealand’s newzealand.com activity is primarily aimed at achieving priority two:
▪ Drive preference for visiting New Zealand.
Activity associated with i-SITE is primarily aimed at achieving priority five:
▪ Optimise delivery capability.
40

21 Active visits: A visit where the visitor interacts with the site’s content or functionality.22 Referrals: the number of people who, once drawn to newzealand.com from paid search or display digital activity, are then delivered to an operator or partner site where travel/experiences can be purchased. 23 i-SITE user satisfaction is relatively high although below the aspirational target of 9.0. The introduction of a Net Promoter Score to measure user advocacy in FY17 will provide new insights and specific verbatim user feedback.24 Tourism New Zealand does not measure the proportion of guest nights provided by Qualmark properties because of the significant cost of obtaining that measure. Instead Tourism New Zealand monitors the number of Qualmark accommodation license holders (slight decrease from the previous year) and the mix of the license holders to ensure its product offering remains relevant and valued by the industry and consumers.
Activity Five: Inspiring and informative information for potential visitors
Result/measure Performance Status
Quantity
Average number of total visits to newzealand.com per monthTarget: 1,700,000
2,778,757 Achieved
Average monthly ‘active visits’21 to newzealand.comTarget: 793,000 1,142,644 Achieved
Average monthly referrals to industry via newzealand.com22
Target: 236,000239,505 Achieved
Quality
Level of user satisfaction with i-SITE maintained or increasedTarget: at or above 9.0/10
8.4 Not achieved23
Increase the proportion of guest nights provided by Qualmark commercial accommodationTarget: Increase from base 55%
Not measured Not measured24
Tourism New Zealand’s consumer website, newzealand.com, achieved record volumes for a single year in FY16 as a result of increased digital marketing activity in Tourism New Zealand’s priority markets, strong organic search performance and targeted user experience improvements.
41

Activity Six: Communicate and engage with New Zealand’s tourism industry to align industry investment with Tourism New Zealand areas of focus
Industry communication, engagement and relationship building
It is important that Tourism New Zealand is completely connected with New Zealand’s tourism operators. This is achieved by informing, engaging with and listening to the New Zealand tourism industry. The main goal of this engagement has been to ensure alignment between market needs, Tourism New Zealand’s marketing programmes, and what is offered in New Zealand. Key activities include:
▪ Publications, including the regular delivery of e-bulletins and webinars.
▪ Tourism New Zealand’s corporate website (tourismnewzealand.com), which provides the industry with timely information on recent activity and information on events as well as providing access to research and market analysis.
▪ Speaking engagements, including industry presentations at conferences and seminars that update industry members on changes within the global industry and the specific consequences these will have within the New Zealand tourism market. These speaking engagements also allow Tourism New Zealand to hear from the industry including any challenges they are facing or opportunities they have identified.
▪ Working with other parts of government to streamline processes that facilitate travel for international visitors and identify opportunities to work together in areas where interests overlap, including working with Education New Zealand to identify and leverage international education opportunities.
In FY16, the tourism industry gained insight into changing market dynamics through a number of Tourism New Zealand forums including workshops, seminars and webinars, providing the industry with opportunities to identify new ways to improve the quality of the visitor experience.
Industry communication, engagement and relationship building activity aligns with the Tourism 2025 framework, in particular the themes:
▪ Drive value through outstanding visitor experience through working with government to improve visitor facilitation e.g. visa and border processes.
▪ Insight through providing channels to distribute and receive market insight with, and from, the wider industry.
Qualmark
Tourism New Zealand now owns 100% of Qualmark New Zealand Ltd after purchasing the remaining 40% shareholding from the Automobile Association of New Zealand in September 2015.
Qualmark currently issues approximately 2,000 quality licences annually, by offering a star grading system for accommodation facilities and an endorsement programme for activities, transport and services. To obtain a Qualmark quality licence, an assessment is undertaken by a trained assessor who measures the quality of operators’ facilities and business practices. This includes health and safety systems and service systems relating to guest care. Businesses can also be recognised for excellence in environmental business practices through Enviro accreditation.
Qualmark aligns with the Tourism 2025 framework through the theme:
▪ Drive value through outstanding visitor experience: through providing quality assurance for accommodation facilities and an endorsement programme for activities, transport and services for international visitors.
42

China Market Development Unit
China continues to grow rapidly and has become New Zealand’s second largest visitor market. However, the Chinese visitor market is subject to a number of constraints in terms of realising its potential value to New Zealand with particular quality issues that have required attention. Tourism New Zealand, largely through its China Market Development Unit, delivers the following activities to support Tourism New Zealand’s goal to grow the proportion of high quality visitors from China:
▪ Administering the Approved Destination Status (ADS) programme. This programme licenses New Zealand-based inbound tour operators and tour guides that cater for the Chinese market, and monitors their conduct, performance and quality standards. The unit also assesses new applicants, completes regular compliance monitoring and assessments, and handles complaints and feedback from Chinese group tour visitors.
▪ Administering the Premier Kiwi Partnership (PKP) programme, which aims to increase the proportion of quality visitors from the China market through providing product development and marketing promotion support to selected Chinese travel sellers and New Zealand inbound tour operators to reduce the barriers for a higher value exclusive (mono) New Zealand product.
▪ Producing Chinese language visitor information designed to increase China visitor knowledge, including the rights and protections they have if visiting on an Approved Destination Status tour.
▪ Engagement with relevant regulatory bodies.
The China Market Development Unit aligns with the Tourism 2025 framework, in particular through the themes of:
▪ Targeting for value through the Premier Kiwi Programme which is focused on growing the proportion of high value visitors from the China market.
▪ Drive value through outstanding visitor experience through ensuring minimum quality standards for visitors from the China market visiting on an Approved Destination Status tour.
Link with Tourism New Zealand strategic priorities
Tourism New Zealand’s activity in this area is primarily aimed at achieving priority five:
▪ Optimise delivery capability.
Due to Tourism New Zealand’s specific work in addressing the quality issues faced by the China market in the attempt to attract a higher value visitor, the activity also contributes to the achievement of priority three:
▪ Focus marketing activity on clearly defined higher value visitors.
43

Activity Six: Communicate and engage with New Zealand’s tourism industry to align industry investment with Tourism New Zealand areas of focus
Result/measure Performance Status
Quantity
Registrations for New Zealand tourism industry webinarsTarget: 720 people registered for at least one webinar 360 Not achieved25
Stakeholder engagement through presentations at both industry and Tourism New Zealand organised eventsTarget: Minimum of 30 presentations to New Zealand tourism industry26
40 Achieved
Quality
Tourism New Zealand communications (website/e- newsletter/webinars etc.) add value to Tourism industry stakeholders’ activitiesTarget: 85% of surveyed stakeholders rate Tourism communication as very good or excellent
85.72% Achieved
Tourism New Zealand performance as an National Tourism Organisation adds value to Tourism industry stakeholder activitiesTarget: 80% of surveyed stakeholders rate Tourism New Zealand's performance as very good or excellent
90.40% Achieved
Quantity
Number of Approved Destination Status ‘spot checks’ and assessments of ADS Inbound Tour Operators (ITOs)Target: 120 spot checks
246 Achieved
25 A unique registration method means that it only counts the first webinar a person attends, if they attend multiple webinars they are not counted. While the target was not reached, there continues to be stable attendance at webinars and feedback from the industry is that they value the webinar programme. Regional Tourism Organisations report they will attend as a group but only one person logs in.26 Includes roadshows delivered by the Chief Executive and/or Chair of Tourism New Zealand and presentations given by Core Leadership Team to New Zealand industry.44

Equal Employment OpportunitiesUnder Section 151 (1)(g) of the Crown Entities Act, Tourism New Zealand is required to provide information about compliance with obligations to be a good employer, including its Equal Employment Opportunities (EEO) Programme.
Set out below is a work place profile for Tourism New Zealand as at 30 June 2016.
Executive Management
Direct Reports to Executive Managers
or Staff with Responsibility for
Specific Output Areas
Other Managers with Staff Responsibility
(4th Tier)
Professional and Support Staff
% of Group % of Group % of Group % of Group
NZ EuropeanMale 30% 14% 12% 5%Female 50% 46% 18% 39%MāoriMale 4% 1%Female 2% 3%Pacific Peoples Male Female 2%Asian (inc. South Asian)Male 24% 6%Female 14% 28% 30%OtherMale 20% 4% 4%Female 14% 18% 12%% of Group of Total Organisation 6% 31% 10% 53%
Tourism New Zealand operates in 11 offshore markets and employs people of different nationalities, race and ethnicity. The organisation recognises the value of a diverse workforce and the importance of working together to deliver on outcomes. This is illustrated through its core organisational values namely; actions speak louder, global whānau and unwavering belief in New Zealand.
Women and people of Asian descent continue to be well represented at all levels of the organisation. Aged people, individuals with disabilities and people of Māori and Pacific descent are represented in the organisation. Tourism New Zealand continues to support the development and growth of all its people and in order to facilitate this, has undertaken the following:
▪ Provided tools and information on Māori culture and language via Kōhanga, the intranet, and as part of the induction workshop.
▪ The continuation of the global community initiative ‘Global Whānau’ which celebrates the diversity of the cultures represented at Tourism New Zealand and improves communication and connectedness between offices.
▪ Provided a forum for discussing cultural differences and expectations with the purpose of improving communication.
▪ Celebrated the achievements of its people through the Whētu (Star) recognition programme.
Culture and accountability
Tourism New Zealand remains committed to being a good employer and as such, to managing and leading all employees fairly and properly in all aspects of their employment. This includes people in-market, where there are different jurisdictional requirements and statutory minima in the areas of Equal Employment Opportunities (EEO). Tourism New Zealand has an Equal Employment Opportunity Policy.
Tourism New Zealand has a well-defined mission, vision, set of values and behaviour expectations that we call ‘actions’. Together this framework provides ‘our story’. In the past year our story has been integrated into our recruitment and selection, performance management and the reward and recognition programmes.
45

Tourism New Zealand has for the sixth year sought employee feedback and input through an annual engagement survey to assist in maintaining an environment where employees are motivated and supported. Development initiatives have been undertaken to ensure employees maintain their high level of engagement in the organisation.
The leadership team and broader management group are committed to demonstrating leadership and accountability in all areas of EEO and, from an EEO perspective, this means a commitment to, and activity in, the following areas.
1. Recruitment, selection and induction
Our recruitment and selection procedure has been developed to ensure that all prospective employees are given the opportunity to participate equally in the recruitment process. The selection process typically involves a structured competency and behaviourally-based interview, reference checking, a screening tool, and for senior positions, psychometric assessment, all of which are validated and support the principles of EEO. Tourism New Zealand also provides appropriate support for Māori and Pacific peoples and people with English as a second language during the recruitment and selection process.
2. Learning and development
Tourism New Zealand has an accelerated development programme which includes facilitated and online learning, mentoring, coaching, 360 development and on the job learning. Appreciation and management of diversity is integrated into the agenda for each programme to ensure participants further develop capability in this area.
A specific programme focused on one of our three values, ‘global whānau’ has been planned for delivery in the next financial year. This programme will further provide a framework and skills to ensure that we are working effectively together and in a manner that is aligned with our values and actions.
Tourism New Zealand measures leadership and management effectiveness as part of its annual engagement survey. These measures are integrated with the performance management framework and people managers are accountable for these two areas of capability.
The organisation also has a succession and progression management programme for the purpose of ensuring there is the required depth and breadth of capabilities in the organisation in order to deliver on organisational outcomes. Learning and development needs are identified through this and on an individual basis through the development planning process. Development needs are aligned with and agreed to, as part of the annual performance management process.
3. Flexibility and work design
Tourism New Zealand has an active organisational-wide programme of supporting flexible working arrangements and job design to assist employees to manage different aspects of work life balance. The organisation continues to:
▪ Support employees with disabilities or special requirements through work place assessments, design changes and accommodating individual needs in the work place.
▪ Support parents in their return to work by offering part-time and gradual return to full-time arrangements, and flexitime to accommodate child care needs.
▪ Support expectant parents by granting additional paid time away from work to attend appointments associated with the pregnancy.
▪ Support employees with responsibilities for child and eldercare by offering flexible working arrangements.
4. Remuneration, recognition and rewards
Tourism New Zealand differentiates remuneration based on performance and is committed to compensating employees competitively and equitably with attention to affordability and within the scope of available resources. The Tourism New Zealand remuneration practice is supported by use of independent job evaluation and market remuneration information to establish salary ranges.
Individuals identified as not meeting the requirements of their role are provided with support, learning and development where required to assist them to achieve role objectives.
5. Harassment and bullying prevention
Tourism New Zealand adheres to its policy and procedures for addressing work place harassment and bullying, which adhere to the WorkSafe New Zealand guidelines on preventing and responding to workplace bullying.
46

Mike Heydon
6. Safety and wellbeing
Tourism New Zealand is committed to maintaining a healthy and safe work environment for its employees and contractors in undertaking its activities. In 2015/16 we identified the need to have two Safety and Wellness Committees (rather than one), to improve employee participation in safety and wellness due to the constraints of timezones in the 12 countries which we operate.
The committees are progressively working to identify and address initiatives that support maintaining employee health, safety and wellness for their respective regions and across the whole organisation. We have continued to provide a great hosting and driver training programme to ensure that all staff who host and drive are skilled to do so safely and to a high standard. Measures indicate these programmes continue to be very successful and our employees feel increasingly that safety and wellness is well managed.
With a change to the safety legislation in New Zealand, a programme of work has been undertaken to ensure that all practicable steps are taken to maintain a safe working environment for our staff and others who work with us. We have identified operational activities where Tourism New Zealand acts in the capacity of a Person Conducting a Business Undertaking (PCBU) and we have established a process to ensure that together with other PCBUs we are taking all practicable measures to maintain the safety of staff, contractors and others.
Workplace assessments and the provision of special equipment continue to be undertaken and provided to ensure that employees are able to contribute effectively in all aspects of their working life.
47

Mike Heydon
48
In terms of the Crown Entities Act 2004, the Board is responsible for the preparation of the New Zealand Tourism Board’s financial statements and statement of service performance, and for the judgments made in them.
The Board of New Zealand Tourism Board has the responsibility for establishing, and has established, a system of internal control designed to provide reasonable assurance as to the integrity and reliability of financial reporting.
In the Board’s opinion, these financial statements and statement of service performance give a true and fair view of the financial position and operation of the New Zealand Tourism Board Group for the year ended 30 June 2016.
The Members of the New Zealand Tourism Board and Group authorised these financial statements for issue on 6 October 2016.
Signed on behalf of the Board:
K. PrendergastChairman6 October 2016
Financial Statements
R. LeggatDeputy Chair6 October 2016
49

Statement of Comprehensive Revenue And Expensefor the year ended 30 June 2016
Group Parent
Notes2016
Actual $000s
2016 Budget $000s
2015 Actual $000s
2016 Actual $000s
2016 Budget $000s
2015 Actual $000s
Revenue from non-exchange transactionsRevenue from Crown 2 115,850 115,850 113,350 115,850 115,850 113,350
Other revenue 3 1,239 - 1,102 1,239 - 1,102
Revenue from exchange transactionsInterest income 203 85 49 202 85 48
Other revenue 3 5,648 6,287 6,870 4,177 4,454 5,276
Total Revenue 122,940 122,222 121,371 121,468 120,389 119,776
ExpenditureOther expenses 4 122,075 121,307 120,778 120,621 119,489 119,114
Depreciation and amortisation 11,12 1,116 924 994 1,092 900 968
Total Expenditure 5 123,191 122,231 121,772 121,713 120,389 120,082
Net Operating Surplus/(Deficit) before Foreign Exchange and Taxation (251) (9) (401) (245) - (306)
Foreign ExchangeUnrealised Foreign exchange gains/(losses) on derivative financial instruments held at year end 10 (8,403) - 8,536 (8,403) - 8,536
Income tax expense 20 - - - - - -
Net Surplus/(Deficit) for the year (8,654) (9) 8,135 (8,648) - 8,230
Total comprehensive revenue/(expense) for the year (8,654) (9) 8,135 (8,648) - 8,230
Transfer from/(to) foreign exchange reserves 17 523 - (527) 523 - (527)
Net Operating Surplus/(Deficit) after Foreign Exchange transfer (8,131) (9) 7,608 (8,125) - 7,703
Net Surplus/(Deficit) for the year is attributable to:Non-controlling interest 7, 19 20 (9) (46) - - -
Owners of the parent (8,674) - 8,181 (8,648) - 8,230
(8,654) (9) 8,135 (8,648) - 8,230
Total comprehensive revenue/(expense) for the year is attributable to:Non-controlling interest 7, 19 20 (9) (46) - - -
Owners of the parent (8,674) - 8,181 (8,648) - 8,230
(8,654) (9) 8,135 (8,648) - 8,230
The notes and accounting policies on pages 54 to 79 form part of and are to be read in conjunction with these financial statements.
50

Statement of Changes In Equityfor the year ended 30 June 2016
Parent
NotesShareholders Equity $000s
Foreign Exchange Reserve $000s
Retained Earnings $000s Total $000s
Balance at 1 July 1,805 4,644 6,295 12,744Net surplus/(deficit) for the year - - (8,648) (8,648)Transfer from/(to) Retained Earnings to Foreign Exchange Reserve 17 - (523) 523 -
Total comprehensive revenue for the year - (523) (8,125) (8,648)Balance at 30 June 1,805 4,121 (1,830) 4,096
Group
NotesShareholders Equity $000s
Foreign Exchange
Reserve $000s
Retained Earnings
$000s
Non- Controlling
Interest $000s
Total $000s
Balance at 1 July 1,805 4,644 6,269 181 12,899 Net surplus/(deficit) for the year 19 - - (8,651) 37 (8,614)Transfer to Retained Earnings from Foreign Exchange Reserve 17 - (523) 523 - -
Total comprehensive revenue/(deficit) for the year - (523) (8,128) 37 (8,614)Balance at 30 June 1,805 4,121 (1,859) 218 4,285
Statement of Changes in Equityfor the year ended 30 June 2015
Parent
NotesShareholders Equity $000s
Foreign Exchange Reserve $000s
Retained Earnings $000s Total $000s
Balance at 1 July 1,805 4,117 (1,408) 4,514Net surplus/(deficit) for the year - - 8,230 8,230Transfer from/(to) Retained Earnings to Foreign Exchange Reserve 17 - 527 (527) -
Total comprehensive expense for the year - 527 7,703 8,230Balance at 30 June 1,805 4,644 6,295 12,744
Group
NotesShareholders Equity $000s
Foreign Exchange
Reserve $000s
Retained Earnings
$000s
Non- Controlling
Interest $000s
Total $000s
Balance at 1 July 1,805 4,117 (1,385) 227 4,764 Net surplus/(deficit) for the year - - 8,181 (46) 8,135 Transfer to Retained Earnings from Foreign Exchange Reserve 17 - 527 (527) - -
Total comprehensive revenue/(deficit) for the year - 527 7,654 (46) 8,135 Balance at 30 June 1,805 4,644 6,269 181 12,899
The notes and accounting policies on pages 54 to 79 form part of and are to be read in conjunction with these financial statements.
51

Statement of Financial Positionas at 30 June 2016
Group Parent
Notes2016
Actual $000s
2016 Budget $000s
2015 Actual $000s
2016 Actual $000s
2016 Budget $000s
2015 Actual $000s
Current Assets
Cash and cash equivalents 8 5,261 6,290 6,365 4,903 6,000 6,206
Receivables from non-exchange transactions 9 165 - 62 165 - 62
Receivables from exchange transactions 9 2,426 870 2,008 2,238 600 1,873
Prepayments and other current assets 1,402 1,105 1,547 1,402 1,100 1,545
Derivative financial instruments 10 - - 5,716 - - 5,716
9,254 8,265 15,698 8,708 7,700 15,402
Non-current Assets
Property, plant and equipment 11 1,480 890 1,706 1,477 885 1,699
Intangible assets 12 1,336 1,207 1,653 1,257 1,128 1,554
Accommodation bonds 13 350 350 280 350 350 280
Investment in subsidiary 6 - - - 60
Derivative financial instruments 10 - - 1,054 - - 1,054
3,166 2,447 4,693 3,144 2,363 4,587
Total Assets 12,420 10,712 20,391 11,852 10,063 19,989
Current Liabilities
Creditors and other payables 14 4,706 3,187 5,808 4,578 3,000 5,705
Employee entitlements 15 827 683 801 796 655 772
Invoiced in advance 703 152 617 483 20 502
Provisions 16 116 - 96 116 - 96
Derivative financial instruments 10 1,456 - - 1,456 -
7,808 4,022 7,322 7,429 3,675 7,075
Non-current Liabilities
Provisions 16 150 270 170 150 270 170
Derivative financial instruments 10 177 - - 177 - -
327 270 170 327 270 170
Total Liabilities 8,135 4,292 7,492 7,756 3,945 7,245
Net Assets 4,285 6,420 12,899 4,096 6,118 12,744
Equity
Equity attributable to equity holders of the parent
Shareholder's Equity 1,805 1,805 1,805 1,805 1,805 1,805
Retained Earnings (1,859) 401 6,269 (1,830) 196 6,295
Foreign Exchange Reserve 17 4,121 4,117 4,644 4,121 4,117 4,644
Parent interests 4,067 6,323 12,718 4,096 6,118 12,744
Non-controlling interests 7 218 97 181 - - -
Total Equity 4,285 6,420 12,899 4,096 6,118 12,744
The notes and accounting policies on pages 54 to 79 form part of and are to be read in conjunction with these financial statements.52

Statement of Cash Flowsfor the year ended 30 June 2016
Group Parent
Notes2016
Actual $000s
2016 Budget $000s
2015 Actual $000s
2016 Actual $000s
2016 Budget $000s
2015 Actual $000s
Cash flows from operating activities
Crown revenue 115,850 115,850 113,350 115,850 115,850 113,350
Interest received 203 85 49 202 85 48
Other revenue from non-exchange transactions 1,149 - 1,196 1,149 - 1,196
Other revenue from exchange transactions 5,427 6,322 6,818 3,860 4,489 5,211
Payments to suppliers and employees (122,850) (121,759) (119,169) (121,365) (119,974) (117,511)
Goods and services tax (net) 111 - 148 96 - 170
Net cash outflow from operating activities 18 (109) 498 2,392 (208) 450 2,464
Cash flows from investing activities
Repayment of accommodation bonds 42 - 32 42 - 32
Purchase of property, plant and equipment (559) (450) (444) (559) (450) (501)
Purchase of intangible assets (14) - (691) (14) - (622)
Payments for accommodation bonds (102) - (25) (102) - (25)
Net cash outflow from investing activities (633) (450) (1,128) (633) (450) (1,116)
Cash flows from financing activities
Capital contribution - - - (60) - -
Non controlling interest capital contribution 40 - - - - -
Net cash outflow from investing activities 40 - - (60) - -
Net decrease in cash held (702) 48 1,264 (901) - 1,348
Effect of exchange rates on foreign currency balances (402) - 888 (402) - 888
Opening cash brought forward 6,365 6,242 4,213 6,206 6,000 3,970
Cash at end of year 8 5,261 6,290 6,365 4,903 6,000 6,206
The notes and accounting policies on pages 54 to 79 form part of and are to be read in conjunction with these financial statements.
53

Notes to the Financial Statementsfor the year ended 30 June 2016
Note 1Statement of accounting policies for the year ended 30 June 2016
(a) Reporting EntityTourism New Zealand is a Crown entity as defined by the Crown Entities Act 2004 and is domiciled in New Zealand. Tourism New Zealand’s primary objective is to improve tourism’s contribution to economic growth by increasing the value of international visitors to New Zealand.
Tourism New Zealand does not operate to make a financial return.
For the purposes of financial reporting, Tourism New Zealand is classified as a Public Benefit Entity.
The financial statements for Tourism New Zealand are for the year ended 30 June 2016, and were approved by the Board on 6 September 2016.
(b) Basis of preparationThe financial statements have been prepared on a going concern basis, and the accounting policies have been applied consistently throughout the period.
Statement of compliance
The financial statements have been prepared in accordance with the requirements of the Crown Entities Act 2004, which includes the requirement to comply with generally accepted accounting practice in New Zealand (NZ GAAP). The financial statements have been prepared in accordance with Tier 1 PBE accounting standards.
Measurement base
The financial statements have been prepared on a historical cost basis modified by the revaluation of certain assets and liabilities as identified in this statement of accounting policies.
The financial statements are presented in New Zealand dollars and all values are rounded to the nearest thousand dollars ($000). The functional currency is New Zealand dollars.
(c) Accounting standards and interpretations issued but not yet effectiveIn 2015, the External Reporting Board issued Disclosure Initiative (Amendments to PBE IPSAS 1), 2015 Omnibus Amendments to PBE Standards, and Amendments to PBE Standards and Authoritative Notice as a Consequence of XRB A1 and Other Amendments. These amendments apply to PBEs with reporting periods beginning on or after 1 January 2016. Tourism New Zealand will apply these amendments in preparing its 30 June 2017 financial statements. Tourism New Zealand expects there will be no effect in applying these amendments.
(d) Basis of consolidationThe consolidated financial statements comprise the financial statements of New Zealand Tourism Board trading as Tourism New Zealand and its subsidiaries as at 30 June each year (the Group).
Subsidiaries are combined using the acquisition method of combination. The financial statements of subsidiaries are prepared for the same reporting period as the parent entity, using consistent accounting policies.
Adjustments are made to bring into line any dissimilar accounting policies that may exist.
All intercompany balances and transactions, including unrealised profits arising from intra-group transactions, have been eliminated in full.
Subsidiaries are consolidated from the date on which control is transferred to the Group and cease to be consolidated from the date on which control is transferred out of the Group.
Where there is loss of control of a subsidiary, the consolidated financial statements include the results for the part of the reporting period during which Tourism New Zealand has control.
(e) Investment in associate The Group’s investment in associate is accounted for under the equity method of accounting in the consolidated financial statements.
An associate is an entity in which the Group has significant influence and which is not a subsidiary nor a joint venture.
The annual financial statements of the associate are used by the Group to apply the equity method. The reporting dates of the associate and the Group are identical and both use consistent accounting policies.
The investment in the associate is carried in the balance sheet at cost plus post-acquisition changes in the Group’s share of net assets of the associate, less any impairment in value. The consolidated income statement reflects the Group’s share of the results of operations of the associate.
Where there has been a change recognised directly in the associate’s equity, the Group recognises its share of any changes and discloses this, when applicable in the consolidated statement of changes in equity.
(f) Foreign currency Transactions denominated in foreign currency are recorded in NZ Dollars by applying exchange rates that approximate rates prevailing at the date of the transaction.
54

Monetary assets and liabilities denominated in foreign currencies are translated at the rate of exchange ruling at the balance sheet date.
Exchange gains and losses are recognised in the Statement of comprehensive revenue and expense.
Non-monetary items that are measured in terms of historical cost in a foreign currency are translated using the exchange rate as at the date of the initial transaction.
(g) Property, plant and equipment Plant and equipment is stated at cost less accumulated depreciation and any impairment in value.
Depreciation is calculated on a straight-line basis over the estimated useful life of the asset as follows:
Office equipment 5 yearsMotor vehicles 4 – 5 yearsFurniture and fittings 5 – 8 yearsComputer equipment 3 yearsLeasehold improvements Up to term of the lease
Realised gains and losses arising from the disposal of property, plant and equipment are recognised in the Statement of comprehensive revenue and expense in the period in which the transaction occurs.
Impairment
The carrying values of plant and equipment are reviewed for impairment when events or changes in circumstances indicate the carrying value may not be recoverable.
If any such indication exists and where the carrying values exceed the estimated recoverable amount, the assets are written down to their recoverable amount. Losses resulting from impairment are reported in the Statement of comprehensive revenue and expense.
(h) Intangible assets Intangible assets are recorded at cost at acquisition. Where there is no active market for these assets, or they are determined to hold no future economic benefit, they are written off in the year of acquisition. Tourism New Zealand has no intangible assets with an infinite life.
The useful life of Intangible assets are estimated at between three and eight years.
Research costs are expensed as incurred.
(i) Inventories Inventories are valued at the lower of cost and net realisable value.
( j) Trade and other receivables Trade receivables are recognised and carried at original invoice amount less an allowance for any uncollectible amounts.
An estimate for doubtful debts is made when collection of the full amount is no longer probable. Bad debts are written off when identified.
(k) Cash and cash equivalents Cash and short-term deposits in the Statement of Financial Position comprise cash at bank and in hand and short-term deposits with an original maturity of three months or less.
For the purposes of the Statement of Cash Flows, cash and cash equivalents consist of cash and cash equivalents as defined above.
(l) Provisions Provisions are recognised when the Group has a present obligation (legal or constructive) as a result of a past event, and it is probable that an outflow of resources embodying economic benefits will be required to settle the obligation and a reliable estimate can be made of the amount of the obligation.
Where the Group expects some or all of a provision to be reimbursed, for example under an insurance contract, the reimbursement is recognised as a separate asset but only when the reimbursement is virtually certain. The expense relating to any provision is presented in the Statement of comprehensive revenue and expense net of any reimbursement.
If the effect of the time value of money is material, provisions are determined by discounting the expected future cash flows at a rate that reflects current market assessments of the time value of money and, where appropriate, the risks specific to the liability.
Where discounting is used, the increase in the provision due to the passage of time is recognised as a finance cost.
(m) LeasesThe determination of whether an arrangement is or contains a lease is based on the substance of the arrangement and requires an assessment of whether the fulfilment of the arrangement is dependent on the use of a specific asset or assets and the arrangement conveys a right to use the asset.
Leases where the lessor retains substantially all the risks and benefits of ownership of the asset are classified as operating leases. Operating lease payments are recognised as an expense in the Statement of comprehensive revenue and expense on a straight-line basis over the lease term.
The Group does not enter into finance leases.
(n) Revenue Revenue is recognised to the extent that it is probable that the economic benefits will flow to the Group and the revenue can be reliably measured. The specific recognition criteria described below must also be met before revenue is recognised.
Revenue from non-exchange transactions
Appropriation received from the Crown
Grants received from the Crown are recognised as revenue on receipt.
Sales and other revenue
Revenue includes fees received to attend offshore trade events and familiarisations in New Zealand, and fees received to become part of an Approved Destination Status programme. The revenue from such transactions does not approximately equal the value
55

▪ when the taxable temporary difference is associated with investments in subsidiaries, associates or interests in joint ventures, and the timing of the reversal of the temporary difference can be controlled and it is probable that the temporary difference will not reverse in the foreseeable future.
Deferred income tax assets are recognised for all deductible temporary differences, carry-forward of unused tax credits and unused tax losses, to the extent that it is probable that taxable profit will be available against which the deductible temporary differences and the carry-forward of unused tax credits and unused tax losses can be utilised, except:
▪ when the deferred income tax asset relating to the deductible temporary difference arises from the initial recognition of an asset or liability in a transaction that is not a business combination and, at the time of the transaction, affects neither the accounting profit or loss nor taxable profit or loss; or
▪ when the deductible temporary difference is associated with investments in subsidiaries, associates or interests in joint ventures, in which case a deferred tax asset is only recognised to the extent that it is probable that the temporary difference will reverse in the foreseeable future and taxable profit will be available against which the temporary difference can be utilised.
The carrying amount of deferred income tax assets is reviewed at each Statement of Financial Position date and reduced to the extent that it is no longer probable that sufficient taxable profit will be available to allow all or part of the deferred income tax asset to be utilised.
Unrecognised deferred income tax assets are reassessed at each Statement of Financial Position date and are recognised to the extent that it has become probable that future taxable profit will allow the deferred tax asset to be recovered.
Deferred income tax assets and liabilities are measured at the tax rates that are expected to apply to the year when the asset is realised or the liability is settled, based on tax rates (and tax laws) that have been enacted or substantively enacted at the Statement of Financial Position date.
Deferred tax assets and deferred tax liabilities are offset only if a legally enforceable right exists to set off current tax assets against current tax liabilities and the deferred tax assets and liabilities relate to the same taxable entity and the same taxation authority.
(p) Other taxesRevenues, expenses and assets are recognised net of the amount of GST except:
▪ where the GST incurred on a purchase of goods and services is not recoverable from the taxation authority, in which case the GST is recognised as part of the cost of acquisition of the asset or as part of the expense item as applicable; and
▪ receivables and payables are stated with the amount of GST included.
The net amount of GST recoverable from, or payable to, the taxation authority is included as part of receivables or payables in the Statement of Financial Position.
of goods provided by Tourism New Zealand and are therefore considered as non-exchange transactions.
Revenue is recognised at fair value of cash received or receivable when the risks and rewards of ownership are transferred to the buyer at the time of delivery of goods to the customer.
The services provided have a return obligation and therefore the revenue from supply of services is recognised on a straight line basis over the specified period for the service unless an alternative method better represents the stage of completion of the transaction.
Revenue from exchange transactions
Sales and partnership revenue
Revenue includes contributions from partners and recharges to customers to recover full cost of expenses incurred on their behalf. The revenue from the such supply of goods and services is recognised when the significant risks and rewards of ownership of the goods have passed to the buyer and can be measured reliably. Risks and rewards are considered passed to the buyer at the time of delivery of the goods to the customer.
Revenue from the supply of services is recognised on a straight line basis over the specified period for the service unless an alternative method better represents the stage of completion of the transaction.
Interest
Interest revenue is recognised as interest accrues using the effective interest method. This is a method of calculating the amortised cost of a financial asset and allocating the interest income over the relevant period using the effective interest rate, which is the rate that exactly discounts estimated future cash receipts through the expected life of the financial asset to the net carrying amount of the financial asset.
(o) Income tax Tourism New Zealand is exempt from income tax under the New Zealand Tourism Board Act 1991. Tourism New Zealand’s subsidiaries are subject to income tax.
Current tax assets and liabilities for the current and prior periods are measured at the amount expected to be recovered from or paid to the taxation authorities based on the current period’s taxable income. The tax rates and tax laws used to compute the amount are those that are enacted or substantively enacted by the Statement of Financial Position date.
Deferred income tax is provided on all temporary differences at the Statement of Financial Position date between the tax bases of assets and liabilities and their carrying amounts for financial reporting purposes.
Deferred income tax liabilities are recognised for all taxable temporary differences except:
▪ when the deferred income tax liability arises from the initial recognition of goodwill or of an asset or liability in a transaction that is not a business combination and that, at the time of the transaction, affects neither the accounting profit or loss nor taxable profit or loss; or
56

Cash flows are included in the Statement of Cash Flows on a gross basis and the GST component of cash flows arising from investing and financing activities, which is recoverable from, or payable to, the taxation authority are classified as operating cash flows.
Commitments and contingencies are disclosed net of the amount of GST recoverable from, or payable to, the taxation authority.
(q) Financial instrumentsTourism New Zealand uses derivative financial instruments such as foreign currency contracts to manage its exposure to foreign exchange risk arising from its operational activities. Tourism New Zealand does not hold or issue these financial instruments for trading purposes. Tourism New Zealand has not adopted hedge accounting.
Derivatives are initially recognised at fair value on the date a derivative contract is entered into and are subsequently re-measured to their fair value at each balance date. Movements in the fair value of derivative financial instruments are recognised in the Statement of comprehensive revenue and expense.
Foreign exchange gains and losses resulting from the settlement of derivative financial instruments and from the translation at year end exchange rates of monetary assets and liabilities denominated in foreign currencies are recognised in the Statement of comprehensive revenue and expense.
Cash and cash equivalents include cash on hand, cash in transit, bank accounts and deposits with a maturity of no more than three months from date of acquisition.
The fair value of forward exchange contracts is calculated by reference to current forward exchange rates for contracts with similar maturity profiles.
(r) Employee BenefitsOther Employee Entitlements: Employee entitlements for salaries and wages, annual leave, long service leave, retiring leave and other similar benefits are recognised in the Statement of comprehensive revenue and expense when they accrue to employees. Employee entitlements to be settled within 12 months are reported at the amount expected to be paid. The liability for long-term employee entitlements is reported as the present value of the estimated future cash flows.
Termination Benefits: Termination benefits are recognised in the Statement of comprehensive revenue and expense only where there is a demonstrable commitment to either terminate employment prior to normal retirement date or to provide such benefits as a result of an offer to encourage voluntary redundancy. Termination benefits settled within 12 months are reported at the amount expected to be paid, otherwise they are reported as the present value of the estimated future cash flows.
57

Note 2
Revenue from Crown Group Parent
2016 $000s
2015 $000s
2016 $000s
2015 $000s
Baseline Funding 118,457 115,900 118,457 115,900
During the year, additional funding was provided by the Crown for the following:
Additional Crown Funding - - - -
Total revenue received from the Crown 118,457 115,900 118,457 115,900
Less GST 2,607 2,550 2,607 2,550
Net revenue received from the Crown 115,850 113,350 115,850 113,350
Note 3
Other revenue Group Parent
2016 $000s
2015 $000s
2016 $000s
2015 $000s
Sales and Partnership revenue from exchange transactions 5,648 6,870 4,177 5,276
Sales and other revenue from non-exchange transactions 1,239 1,102 1,239 1,102
Total Other revenue 6,887 7,972 5,416 6,378
Note 4
Other expenses include: Group Parent
Personnel expenses 2016 2015 2016 2015
Number of permanent and fixed term staff 166 168 159 161
2016 $000s
2015 $000s
2016 $000s
2015 $000s
Salaries and wages 17,090 16,269 16,436 15,584
Employer superannuation contributions 769 674 752 656
Increase/(decrease) in employee entitlements (note 15) 27 118 25 117
Other personnel expenses 1,208 1,399 1,197 1,383
19,093 18,459 18,410 17,740
Personnel costs for New Zealand and offshore staff were:2016
$000s2015
$000s2016
$000s2015
$000s
New Zealand Personnel Expenses — Tourism New Zealand 10,576 10,413 10,576 10,413
New Zealand Personnel Expenses — Subsidiaries 684 719 - -
Offshore Personnel Expenses 7,834 7,327 7,834 7,327
19,094 18,459 18,410 17,740
2016 $000s
2015 $000s
2016 $000s
2015 $000s
Compensation or other benefits paid to ceased staff 21 31 15 25
2016 2015 2016 2015
Number of ceased staff 1 2 1 1
58

Other expenses include: Group Parent
Auditor's remuneration2016
$000s2015
$000s2016
$000s2015
$000s
Amounts received or due and receivable by Ernst & Young for:
The audit of the financial report 87 81 78 72
87 81 78 72
Amounts received or due and receivable by auditors other than Ernst & Young New Zealand for:
The audit of the financial report of subsidiary entities 11 8 - -
Other assurance services 18 18 17 17
116 107 95 89
Other expenses2016
$000s2015
$000s2016
$000s2015
$000s
Loss on disposal of property, plant and equipment - - - -
Lease expense 2,155 2,076 2,149 2,069
Remuneration of board members of Parent (See also note 30) 204 209 204 209
Note 5
Total expenditure of parent Parent
2016 $000s
2015 $000s
Total expenditure by geographic region: 19,810 18,078
Australia 16,796 14,517
North America 11,540 10,956
United Kingdom and Europe 11,477 13,027
Japan 4,918 5,131
Asia 14,370 12,673
Other markets 3,157 2,822
New Zealand (a) 39,645 42,878
Total Expenditure of Parent 121,713 120,082
(a) New Zealand expenditure includes costs that apply to all markets and across a number of campaigns including spend on the 100% Pure New Zealand Campaign, brand development and the continued development of the newzealand.com website.
Note 6
Subsidiary companies Interest Held Interest Held
2016 2015 2016 2015
Qualmark New Zealand Limited 100% 60% 100% 60%
Visitor Information Network Incorporated (trading as i-SITE NZ) 0% 0% 0% 0%
The financial year-end of both subsidiaries is 30 June.
Note 4 continued
59

Note 6 continued
Qualmark New Zealand Limited
In September 2015, Qualmark New Zealand Limited became a wholly owned subsidiary of the New Zealand Tourism Board when the New Zealand Tourism Board acquired the remaining 40% shareholding from the New Zealand Automobile Association Inc.
Qualmark New Zealand Limited is New Zealand tourism’s official quality agency. Qualmark licenses professional and trustworthy New Zealand tourism businesses to use the Qualmark® — tourism’s official quality mark — to help international and domestic travellers select places to stay, things to do and ways to get around.
Qualmark’s core activities are based around determining the eligibility of businesses to enter the licensing system. This is achieved by way of assessment, promoting and working with Qualmark® licensees and working closely with other organisations and sectors within the tourism industry. By doing so, quality standards are raised and New Zealand tourism businesses improved based on best-practice.
Visitor Information Network Incorporated (trading as i-SITE NZ)
Tourism New Zealand has control of Visitor Information Network Incorporated (VIN Inc), trading as i-SITE New Zealand, effective 21 August 2002.
Tourism New Zealand and i-SITE New Zealand have a relationship agreement that recognises the importance of having an effective and high quality network of visitor information centres, dedicated to delivering free, comprehensive and objective information. The terms and conditions of the relationship agreement mean that Tourism New Zealand meets the criteria determined in PBE IPSAS 6 for consolidating investments in subsidiaries.
The i-SITE brand creates a distinctive look, which distinguishes the official network from other information centres. The i-SITE Visitor Centres provide on-the-ground information to ensure the visitor experience is as enjoyable as possible.
Note 7
Associate company Group Parent
2016 $000s
2015 $000s
2016 $000s
2015 $000s
The New Zealand Way Limited - - - -
The financial year-end of The New Zealand Way Limited is 30 June.
Tourism New Zealand has a 50% shareholding in The New Zealand Way Limited. This Company is the operating entity of a joint venture between Tourism New Zealand and New Zealand Trade & Enterprise.
The New Zealand Way brand provides marketing opportunities to those companies that meet quality and environmental standards. The brand is promoted as a mark of outstanding quality, superior service and unique New Zealand characteristics.
There were no impairment losses relating to the investment in associate and no capital commitments or other commitments relating to the associate.
60

Note 7 continued
The following table illustrates summarised information of the investment in The New Zealand Way Limited:
Group Parent
2016 $000s
2015 $000s
2016 $000s
2015 $000s
Share of associate’s balance sheet:Current assets 1 1 - - Current liabilities 1 1 - - Net assets - - - -
Share of associate's revenue and (deficit)/surplus:Revenue - - - - Net (deficit)/surplus - - - -
Carrying amount at beginning of year - - - -
Carrying amount at end of year - - - -
Note 8
Cash and cash equivalents Group Parent
2016 $000s
2015 $000s
2016 $000s
2015 $000s
Cash Holdings:Cash at bank and in hand 2,403 1,892 2,137 1,869 Call accounts — foreign currencies 1,205 4,336 1,205 4,336 Call accounts — New Zealand dollar 1,653 138 1,562 2
5,261 6,366 4,903 6,207
Cash at bank and in hand generally earns interest at floating rates based on daily bank deposit rates.
Call account deposits are made depending on the immediate cash requirements of the Group, and earn interest at the respective money market call rates.
Group Parent
Cash Holdings by Currency:2016
$000s2015
$000s2016
$000s2015
$000sNew Zealand Dollar 2,443 423 2,085 264 United States Dollar 90 263 90 263 British Pound 206 300 206 300 Australian Dollar 140 102 140 102 European Euro 238 2,269 238 2,269 Japanese Yen 829 791 829 791 Singapore Dollar 134 624 134 624 Canadian Dollar 18 25 18 25 Indian Rupee 451 498 451 498 Other Asian Currencies 713 1,070 713 1,070
5,261 6,365 4,903 6,206 Cash Holdings by Bank:HSBC Bank 3,324 5,903 2,966 5,743 National Bank of New Zealand 1,884 319 1,884 319 ASB Bank 20 20 20 20 Bank of New Zealand 3 3 3 3 Tokyo Mitsubishi 31 121 31 121
5,261 6,365 4,903 6,206
61

The fair value of cash and cash equivalents is $5,261,000 (2015: $6,365,000).
Tourism New Zealand holds a stand-by Letter of Credit with HSBC bank for an amount of $360,000 to serve as security against any non-payment of payroll. This letter of credit has no expiry date. The bank also provides a financial guarentee to Datacom Business Services, Tourism New Zealand’s payroll processor for Australian payroll an amount of AUD 42,000. Further, a financial guarantee for an amount of AUD 77,512 is also provided by HSBC bank for Sydney office rent until 26 May 2019. A cheque encashment facility for $1000 also exists with the bank.
Qualmark holds a stand-by Letter of Credit with the bank for an amount of $26,000 to serve as security against any non-payment of payroll. This letter of credit has no expiry date.
Note 9
Receivables Group Parent
Receivables from non-exchange transactions2016
$000s2015
$000s2016
$000s2015
$000s
Receivables 165 62 165 62
Less: Provision for impairment - - - -
165 62 165 62
Receivables from non-exchange transactions are non-interest bearing and are generally on 30-day terms. The carrying value of receivables approximates their fair value. As at 30 June 2016 and 2015, all overdue receivables have been assessed for impairment and appropriate provisions applied, as detailed below:
Parent
2016 2015
Gross $000s
Impairment $000s
Net $000s
Gross $000s
Impairment $000s
Net $000sParent
Not past due 45 - 45 57 - 57
Past due 1 – 30 days 23 - 23 - - -
Past due 31 – 60 days 97 - 97 - - -
Past due 61 – 90 days - - - - - -
Past due > 91 days - - - 5 - 5
165 - 165 62 - 62
Group
2016 2015
Gross $000s
Impairment $000s
Net $000s
Gross $000s
Impairment $000s
Net $000sGroup
Not past due 45 - 45 57 - 57
Past due 1 – 30 days 23 - 23 - - -
Past due 31 – 60 days 97 - 97 - - -
Past due 61 – 90 days - - - - - -
Past due > 91 days - - - 5 - 5
165 - 165 62 - 62
Note 8 continued
62

The provision for impairment has been calculated based on expected losses determined by an analysis of losses in previous periods and a review of specific debtors.
Group Parent
Receivables from exchange transactions2016
$000s2015
$000s2016
$000s2015
$000s
Receivables 2,436 2,011 2,238 1,873
Less: Provision for impairment (10) (3) - -
2,426 2,008 2,238 1,873
Receivables from exchange transactions are non-interest bearing and are generally on 30-day terms. The carrying value of receivables approximates their fair value. As at 30 June 2016 and 2015, all overdue receivables have been assessed for impairment and appropriate provisions applied, as detailed below:
Parent
2016 2015
Gross $000s
Impairment $000s
Net $000s
Gross $000s
Impairment $000s
Net $000sParent
Not past due 2,187 - 2,187 1,835 - 1,835
Past due 1 – 30 days 41 - 41 38 - 38
Past due 31 – 60 days 10 - 10 - - -
Past due 61 – 90 days - - - - - -
Past due > 91 days - - - - - -
2,238 - 2,238 1,873 - 1,873
Group
2016 2015
Gross $000s
Impairment $000s
Net $000s
Gross $000s
Impairment $000s
Net $000sGroup
Not past due 2,357 - 2,357 1,883 - 1,883 Past due 1 – 30 days 50 (3) 47 113 - 113 Past due 31 – 60 days 14 (2) 12 9 (1) 8 Past due 61 – 90 days 2 (1) 1 - - - Past due > 91 days 13 (4) 9 6 (2) 4
2,436 (10) 2,426 2,011 (3) 2,008
The provision for impairment has been calculated based on expected losses determined by an analysis of losses in previous periods and a review of specific debtors.Receivables from exchange transactions for the Group include GST/VAT refunds comprising 50% (2015: 70%) of total receivables as follows:
Group Parent
2016 $000s
2015 $000s
2016 $000s
2015 $000s
GST Refund due from NZ Inland Revenue Department 412 781 412 781 GST Refund due from Australian Taxation Office 618 232 618 232
Consumption Tax Refund from Japan Tax Office 197 155 197 155
VAT Refund due from UK Revenue & Customs 70 275 70 275
1,297 1,443 1,297 1,443
Note 9 continued
63

Note 10
Derivative financial instrument
Tourism New Zealand uses foreign exchange instruments in order to manage its exposure to fluctuations in foreign currency exchange rates on normal operating activities. The instruments are matched with anticipated future cash flows in foreign currencies. Tourism New Zealand does not use financial instruments for speculative purposes. At balance date Tourism New Zealand had 80 (2015: 78) foreign exchange contracts maturing at various dates over the next 24 months. The contracts are financial assets at fair value through profit or loss and designated as held for trading financial instruments with fair value gains or losses recognised in the Statement of Comprehensive Revenue and Expense.
Foreign currency forward exchange contracts: Group Parent
2016 $000s
2015 $000s
2016 $000s
2015 $000s
Foreign exchange contracts at 30 June — Sell Value 76,590 70,470 76,590 70,470 Fair value Derivatives in Gain/(Loss) (1,633) 6,770 (1,633) 6,770
Foreign exchange contracts at 30 June — Buy Value 74,957 77,240 74,957 77,240
Foreign exchange contracts by currency:
United States Dollar 33,010 31,306 33,010 31,306
British Pound 5,208 4,680 5,208 4,680
Australian Dollar 26,620 33,441 26,620 33,441
European Euro 3,893 - 3,893 -
Japanese Yen 3,843 4,746 3,843 4,746
Thai Baht - 404 - 404
Singapore Dollar 2,383 2,664 2,383 2,664
Hong Kong Dollar - - - -
74,957 77,241 74,957 77,241
64

Note 11
Property, plant and equipment Group Parent
2016 $000s
2015 $000s
2016 $000s
2015 $000s
All property, plant and equipment
At cost 8,485 9,475 8,431 9,422
Accumulated depreciation (7,005) (7,769) (6,954) (7,723)
Net carrying amount 1,480 1,706 1,477 1,699
Property, plant and equipment for each class:
Furniture and fittings
At cost 1,277 1,266 1,243 1,233
Accumulated depreciation (1,173) (1,109) (1,142) (1,082)
Net carrying amount of furniture and fittings 104 157 101 151
Leasehold improvements
At cost 2,765 2,643 2,765 2,643
Accumulated depreciation (2,137) (1,943) (2,137) (1,943)
Net carrying amount of leasehold improvements 628 700 628 700
Office equipment
At cost 836 741 836 741
Accumulated depreciation (725) (704) (725) (704)
Net carrying amount of office equipment 111 37 111 37
Motor vehicles
At cost 61 61 61 61
Accumulated depreciation (61) (61) (61) (61)
Net carrying amount of motor vehicles - - - -
Computer equipment
At cost 3,546 4,764 3,526 4,744
Accumulated depreciation (2,909) (3,952) (2,889) (3,933)
Net carrying amount of computer equipment 637 812 637 811
Total property, plant and equipment 1,480 1,706 1,477 1,699
-
All property, plant and equipment reconciliation
At 1 July, net of accumulated depreciation 1,706 1,943 1,699 1,929
Additions 559 492 559 492
Disposals and write back of depreciation - - - -
Depreciation charge for the year (785) (729) (781) (722)
At 30 June, net of accumulated depreciation 1,480 1,706 1,477 1,699
Depreciation by asset class:
Furniture and fittings 64 108 60 104
Leasehold improvements 194 130 194 130
Office equipment 23 20 23 20
Computer equipment 504 471 504 468
Total Depreciation 785 729 781 722
65

Note 12
Intangible assets Group Parent
2016 $000s
2015 $000s
2016 $000s
2015 $000s
Intangible assetsAt cost 2,095 2,082 1,969 1,955
Accumulated amortisation (759) (429) (712) (401)
Net carrying amount 1,336 1,653 1,257 1,554
Intangible assets reconciliation
At 1 July, net of accumulated amortisation 1,653 1,371 1,554 1,264
Additions 14 546 14 535
Impairment of Intangible assets - - - -
Amortisation charge for the year (331) (264) (311) (245)
At 30 June, net of accumulated amortisation 1,336 1,653 1,257 1,554
Intangible assets include investment into redevelopment of Tourism New Zealand’s corporate website and intranet, Tourism New Zealand’s and Qualmark’s finance and HR system, and Visitor Information Network Incorporated’s Bookit software.
Note 13
Accommodation bonds
Accommodation bonds are refundable deposits or key money paid for the lease of office and housing premises.
Group Parent
2016 $000s
2015 $000s
2016 $000s
2015 $000s
Japan 137 146 137 146
North America 47 18 47 18
Asia 166 116 166 116
350 280 350 280
Note 14
Creditors and other payables
Payables are non-interest bearing and are normally settled on 30-day terms, therefore the carrying value of creditors and other payables approximates their fair value.
Group Parent
2016 $000s
2015 $000s
2016 $000s
2015 $000s
Creditors 1,137 1,387 1,088 1,358
Accrued expenses 3,569 4,421 3,490 4,347
4,706 5,808 4,578 5,705
66

Note 15
Employee entitlements Group Parent
2016 $000s
2015 $000s
2016 $000s
2015 $000s
Annual Leave 827 801 796 772
827 801 796 772
Note 16
Provisions
Tourism New Zealand has a number of potential future restoration costs relating to make good clauses on office rental leases. The provision recognises the present value of expected future payments for amounts in relation to make good. The provision relates to four Tourism New Zealand offices and is expected to be incurred over the next eight years.
Group Parent
2016 $000s
2015 $000s
2016 $000s
2015 $000s
Provisions are represented by:
Lease make-good 266 266 266 266
Total Provisions 266 266 266 266
Current provision 116 96 116 96
Non-current provision 150 170 150 170
266 266 266 266
Movements in provisions are as follows:
Balance at 1 July 266 266 266 266
Additional provisions made - - - -
Amounts used - - - -
Unused amounts reversed - - - -
Balance at 30 June 266 266 266 266
Note 17
Foreign Exchange Reserve
Tourism New Zealand funds its overseas offices and operations in the local currency of that office or operation. Some of the surplus/(deficit) arising from foreign currency movements are held in reserve to finance changes in the New Zealand dollar cost of maintaining a consistent level of funding to those overseas offices or operations. Only the realised gains or losses on foreign currency transactions during the year are transferred to reserves, and the unrealised gains or losses on mark to market revaluation of derivatives held at year end are not transferred to reserves.
Group Parent
2016 $000s
2015 $000s
2016 $000s
2015 $000s
Movements in reserve is as follows:
Balance at 1 July 4,644 4,117 4,644 4,117
Transfer to Retained Earnings from Foreign Exchange Reserve (523) 527 (523) 527
Balance at 30 June 4,121 4,644 4,121 4,644
67

Note 18
Reconciliation of surplus to net cash from operating activities Group Parent
2016 $000s
2015 $000s
2016 $000s
2015 $000s
Net surplus/(deficit) (8,654) 8,135 (8,648) 8,230
Add/(less) non-cash items
Depreciation and amortisation 1,116 995 1,092 968
Provisions - - - -
Share of associate's surplus - - - -
Net (gains)/losses on derivative financial instruments 8,403 (8,536) 8,403 (8,536)
Net foreign exchange (gains)/losses 401 (527) 401 (527)
Total non-cash items 9,920 (8,068) 9,896 (8,095)
Add/(less) items classified as investing or financing activities
Net Loss/(Gain) on disposal of assets - - - -
Movement in foreign currency accommodation bonds (10) (30) (10) (30)
Total items classified as investing or financing activities (10) (30) (10) (30)
Add/(less) movements in working capital items
Debtors and other receivables (521) 5 (468) (67)
Prepayments 145 (611) 143 (611)
Payables and accruals (1,101) 2,365 (1,126) 2,438
Invoiced in advance 86 478 (19) 482
Employee entitlements 26 118 24 117
Net movements in working capital items (1,365) 2,355 (1,446) 2,359
Net cash from operating activities (109) 2,392 (208) 2,464
Note 19
Contingencies
Tourism New Zealand has no contingent assets or liabilities as at 30 June 2016.
In 2014/2015, Tourism New Zealand had provided a written undertaking to the Board of Qualmark New Zealand to provide ongoing support sufficient to enable Qualmark to meet its obligations when they were due. Additionally, Tourism New Zealand’s shareholding in Qualmark was uncalled at the end of June 2015 and were subsequently fully called in July 2015 with Tourism New Zealand’s contribution being $60,000.
Note 20
Income tax
Tourism New Zealand is exempt from income tax under the New Zealand Tourism Board Act 1991. Tourism New Zealand’s subsidiaries are subject to income tax. The Group has tax losses unrecognised that can be used to offset future assessable income of $677,109 (2015: $471,226).
68

Note 21
Management of risk
Tourism New Zealand has developed a risk management framework and has undertaken a full risk assessment of its business. Management is required to sign off on a half yearly basis that no new exposures have arisen and that existing risks are being properly managed. Written policies and procedures exist covering those aspects of business which have the potential to generate risk for Tourism New Zealand. Adherence to these policies minimises potential risk to Tourism New Zealand. Employees are required as part of employment contracts to adhere to Tourism New Zealand policies and procedures.
Tourism New Zealand carries comprehensive insurance covering all normal business risks including Public Liability. Tourism New Zealand has purchased insurance to provide Board members and Officers Liability, Employers Liability and Professional Indemnity cover for Board members and employees. Tourism New Zealand also provides cover for its staff for offshore travel. Insured values are reviewed annually and adjusted to reflect changes in business operations.
Note 22
Significant accounting judgements, estimates and assumptions
The preparation of the financial statements requires management to make judgements, estimates and assumptions that affect the reported amounts in the financial statements. Management continually evaluates its judgements and estimates in relation to assets, liabilities, contingent liabilities, revenue and expenses. These judgements and estimates are based on historical experience and other factors that are reasonable under the circumstances and form the basis for the carrying values of assets and liabilities. Actual results may differ from these estimates under different assumptions and conditions.
Management has identified the following critical accounting policies for which significant judgements, estimates and assumptions have been made.
Make good provision
A provision has been made for a number of potential future restoration costs relating to make good clauses on four office rental leases. The calculation of this provision requires assumptions such as the extent, if any, that Landlords will enforce the make good clauses in the leases and building and demolition cost estimates. These uncertainties may result in future actual expenditure differing from the amounts currently provided. The provision recognised for each lease is periodically reviewed and updated based on the facts and circumstances available at the time. Changes to the estimated future costs for make good are recognised in the balance sheet by adjusting both the expense or asset and provision. The related carrying amounts are disclosed in note 16.
Note 23
Capital management
Tourism New Zealand’s capital is its equity, which comprises accumulated funds and other reserves. Equity is represented by net assets. Tourism New Zealand manages its equity as a by-product of prudently managing revenues, expenses, assets, liabilities, investments and general financial dealings to ensure that Tourism New Zealand effectively achieves its objectives and purpose, whilst remaining a going concern.
Tourism New Zealand is subject to the financial management and accountability provisions of the Crown Entities Act 2004, which impose restrictions in relation to borrowings, acquisition of securities, issuing guarantees and indemnities and the use of derivatives.
Tourism New Zealand purchases a variety of foreign currencies to fund promotional activity offshore. As this is funded in NZ Dollars, there is an exposure to foreign exchange risk through the movement of NZ Dollars against those foreign currencies. To manage this risk and improve operational flexibility, a foreign exchange reserve was set up in 2009/10 that comprised of the realised gains from that year to be used solely to offset future realised foreign exchange gains and losses.
69

Note 24
Categories of financial assets and liabilities
The carrying amounts of financial assets and liabilities in each of the PBE IPSAS 29 categories are as follows:
Group Parent
2016 $000s
2015 $000s
2016 $000s
2015 $000s
Financial assets:
Cash and cash equivalents 5,261 6,366 4,903 6,207
Receivables 1,294 627 1,106 492
Total loans and receivables 6,555 6,993 6,009 6,699
Fair value through profit and loss held for trading:
Derivative financial instrument assets/(liabilities) (1,633) 6,770 (1,633) 6,770
Other financial liabilities:
Creditors 1,137 1,387 1,088 1,358
Invoiced in advance 703 617 483 502
Total other financial liabilities 1,840 2,004 1,571 1,860
Note 25
Capital commitments
There is no capital expenditure contracted for at balance date but not provided for in the financial statements. (2015: Nil)
70

Note 26
Operating commitments
Operating commitments include non-cancellable lease payments for premises, motor vehicles and office equipment and non-cancellable contracts for services like equipment maintenance and public relations.
Group Parent
Operating commitments payable after balance date on: 2016 $000s
2015 $000s
2016 $000s
2015 $000s
Non-Cancellable Accommodation Leases:
Up to One Year 1,598 1,307 1,598 1,307
One to Two Years 2,341 1,060 2,341 1,060
Two to Five Years 1,156 1,632 1,156 1,632
Over Five Years - - - -
5,095 3,999 5,095 3,999
Non-Cancellable Motor Vehicle and Equipment Leases
Up to One Year 133 94 127 88
One to Two Years 87 77 86 76
Two to Five Years 128 49 128 49
Over Five Years - - - -
348 220 341 213
Non-Cancellable Contracts for Goods and Services
Up to One Year 2,750 774 2,750 774
One to Two Years 1,900 7 1,900 7
Two to Five Years 1,741 - 1,741 -
Over Five Years - - - -
6,391 781 6,391 781
Total operating commitments 11,834 5,000 11,827 4,993
Note 27
Related party transactions
Tourism New Zealand is a wholly owned entity of the Crown which has the ability to significantly influence its role. The Crown is Tourism New Zealand’s major source of revenue.
Tourism New Zealand enters into transactions with government departments, state-owned enterprises and other Crown entities. Those transactions that occur within a normal supplier or client relationship on terms and conditions no more or less favourable than those which it is reasonable to expect Tourism New Zealand would have adopted if dealing with that entity at arm’s length in the same circumstances have not been disclosed as related party transactions.
Tourism New Zealand also enters into transactions with its subsidiaries and associate. These transactions occur within a normal supplier or client relationship on terms and conditions no more or less favourable than those which it is reasonable to expect Tourism New Zealand would have adopted if dealing with that entity at arm’s length as well.
Tourism New Zealand also enters into transactions with board members and entities over which they have control or significant influence. These transactions occur within a normal supplier or client relationship on terms and conditions no more or less favourable than those which it is reasonable to expect Tourism New Zealand would have adopted if dealing with that entity at arm’s length. The following table provides the total amount of transactions that were entered into with these related parties.
71

Note 27 continued
Related Party and Transaction
Transaction value year ended 30 June
Balance outstanding year ended 30 June
2016 $000s
2015 $000s
2016 $000s
2015 $000s
Income has been received by Tourism New Zealand from:J Thorburn (Director): Intercity Group Limited — Income received by TNZ for tourism-related services. 6 8 - 2 N Thompson (Director): Auckland Tourism, Events & Economic Development — Income received by TNZ for tourism-related services. 468 888 - 249 J Spice (Director): Touch of Spice Ltd — Income received by TNZ for tourism-related services. 5 7 - - K Bowler (Director): Pacific Asia Travel Association — Provision of membership fees. 48 - - -
Payments have been made by Tourism New Zealand to:R Leggat (Director): New Zealand Post Limited and Nga Haerenga — The New Zealand Cycle Trail Inc for provision of postal services and tourism-related services respectively. 30 3 - - J Thorburn (Director): Intercity Group Limited — Provision of tourism-related services to TNZ. 16 6 - - J Spice (Director): Touch of Spice Ltd — Provision of tourism-related services to TNZ. 2 25 - - N Thompson (Director): Auckland Tourism, Events & Economic Development — Provision of tourism-related services to TNZ. 70 10 - - K Bowler (Director): Tourism Industry Association — Provision of tourism-related services to TNZ. 175 3 - - J Tuuta (Director): Venture Taranaki Trust — Provision of tourism-related services to TNZ. 12 - - - C Parkin (Director): Museum Hotel — Provision of tourism-related services to TNZ. - 29 - - K Pendergast (25% owner (with husband)): Quality Hotel and Comfort Hotel — Provision of services to TNZ. - 3 - -
Key management personnel compensation
Key management personnel includes all board members, the Chief Executive and 10 (2015: 10) members of the Executive Team.
Parent
2016 $000s
2015 $000s
Remuneration of the Board of Directors:
Salaries and other short-term benefits 204 209
Remuneration of the Executive Team:
Salaries and other short-term benefits 2,766 2,617
Total key management personnel compensation 2,970 2,826
72

Note 28
Financial instrument risksTourism New Zealand’s activities expose it to a variety of financial instrument risks, including market risk, credit risk and liquidity risk. Tourism New Zealand has a series of policies to manage the risks associated with financial instruments and seeks to minimise exposure from financial instruments. These policies do not allow any transactions that are speculative in nature.
Market Risk
Interest rate risk — Interest rate risk is the risk that the value of a financial instrument will fluctuate due to changes in interest rates. Tourism New Zealand is exposed to interest rate risk on its cash balances. Refer to note 8 for cash balances exposed to interest rate risk.
Interest rate risk sensitivity analysis — As at 30 June 2016, if interest rates on cash balances had increased/decreased by 0.5% (50 basis points) with all other variables held constant, the deficit/surplus and equity would have changed as follows:
Surplus/(deficit) higher/(lower) Equity higher/(lower)
2016 $000s
2015 $000s
2016 $000s
2015 $000s
Group
+ 0.5% (50 basis points) 8 3 8 3
- 0.5% (50 basis points) (8) (3) (8) (3)
Parent
+ 0.5% (50 basis points) 8 2 8 2
- 0.5% (50 basis points) (8) (2) (8) (2)
Currency risk — Currency risk is the risk that the fair value or future cash flows of a financial instrument will fluctuate due to changes in foreign exchange rates.
As a result of significant operations around the world, Tourism New Zealand is required to enter into transactions denominated in foreign currencies. As a result of these activities, Tourism New Zealand is exposed to foreign currency risk on its foreign denominated cash balances, receivables, creditors and other payables, and derivative instruments.
It is Tourism New Zealand’s policy to manage foreign currency risks arising from contractual commitments and liabilities by entering into foreign exchange forward contracts to significantly reduce the foreign currency exposure. These forward exchange contracts are entered into prior to the commencement of the financial year to cover the exposure on budgeted NZD spend in targeted markets based on the market’s economic outlook and other factors that might have an impact on their currency. Refer to derivative financial Instruments (note 10) for details on the forward currency contracts held. Further exposures to foreign exchange risk through the movement of NZ Dollars against those foreign currencies are also managed through the foreign exchange reserve as explained in note 17.
The basket of currencies that Tourism New Zealand holds also reduces the risk from any single currency as all currencies are not expected to move adversly against the NZD. Refer to the total expenditure of the Parent by geographic region (note 5) and cash and cash equivalents (note 8) for currency exposures.
73

Note 28 continued
Currency risk sensitivity analysis — Tourism New Zealand is subject to volatility in financial performance associated with foreign currency rates. As at 30 June 2016, if the NZ Dollar had increased/decreased by 5% against various foreign currencies used by Tourism New Zealand with all other variables held constant, the deficit/surplus and equity would have changed as follows:
Surplus/(deficit) higher/(lower) Equity higher/(lower)
2016 $000s
2015 $000s
2016 $000s
2015 $000s
Group
NZD to various currencies +5% 3,627 10,096 - -
NZD to various currencies -5% (22,620) (17,347) - -
Parent
NZD to basket of currencies +5% 3,627 10,096 - -
NZD to basket of currencies -5% (22,620) (17,347) - -
This movement is attributable to foreign exchange gains/losses on translation of forward foreign exchange contracts and other foreign currency denominated assets and liabilities.
Credit risk
Credit risk is the risk that a third party will default on its obligations to Tourism New Zealand, causing Tourism New Zealand to incur a loss.
Tourism New Zealand has no significant concentrations of credit risk, as it has a small number of credit customers and only places funds with registered banks. With respect to foreign exchange instruments, Tourism New Zealand reduces its risk by limiting the counter parties to major trading banks and does not expect to incur any significant losses as a result of non performance by these counter parties.
Tourism New Zealand’s maximum credit exposure for each class of financial instrument is represented by the total carrying amount of cash (note 8), net debtors (note 9) and derivative financial instruments (note 10). There is no collateral held as security against these financial instruments, including those instruments that are overdue or impaired.
Liquidity risk
Liquidity risk is the risk that Tourism New Zealand will encounter difficulty raising liquid funds to meet commitments as they fall due.
Tourism New Zealand has no significant concentrations of liquidity risk. Tourism New Zealand annually agrees a funding schedule with the Crown which matches the estimated timing of its commitments and close out of market positions.
The following liquidity risk disclosures reflect all contractually fixed pay-offs, repayments and interest resulting from recognised financial and derivative financial instrument liabilities as of 30 June 2016. The timing of cash flows for liabilities is based on the contractual terms of the underlying contract.
74

Note 28 continued
< 6months $000s
6-12 months $000s
> 1 year $000s
Total $000s
Group — Year end 30 June 2016Financial liabilitiesCreditors (1,137) - - (1,137)
Derivative financial instrument liabilities — gross settled Inflows 36,762 28,226 9,069 74,057 Outflows (37,564) (28,880) (9,246) (75,690)
(802) (654) (177) (1,633)
Net outflow (1,939) (654) (177) (2,770)
< 6months $000s
6-12 months $000s
> 1 year $000s
Total $000s
Parent — Year end 30 June 2016Financial liabilitiesCreditors (1,088) - - (1,088)
Derivative financial instrument liabilities — gross settled Inflows 36,762 28,226 9,069 74,057 Outflows (37,564) (28,880) (9,246) (75,690)
(802) (654) (177) (1,633)
Net outflow (1,890) (654) (177) (2,721)
< 6months $000s
6-12 months $000s
> 1 year $000s
Total $000s
Group — Year end 30 June 2015Financial liabilitiesCreditors (1,387) - - (1,387)
Derivative financial instrument liabilities — gross settled Inflows 35,165 25,304 15,395 75,864 Outflows (32,082) (22,671) (14,341) (69,094)
3,083 2,633 1,054 6,770
Net outflow 1,696 2,633 1,054 5,383
< 6months $000s
6-12 months $000s
> 1 year $000s
Total $000s
Parent — Year end 30 June 2015Financial liabilitiesCreditors (1,358) - - (1,358)
Derivative financial instrument liabilities — gross settled Inflows 35,165 25,304 15,395 75,864 Outflows (32,082) (22,671) (14,341) (69,094)
3,083 2,633 1,054 6,770
Net outflow 1,725 2,633 1,054 5,412
75

Note 28 continued
Fair value
The Group can apply various methods in estimating the fair value of a financial instrument. The methods comprise:
a) Level 1 — the fair value is calculated using quoted prices in active markets:
b) Level 2 — the fair value is estimated using inputs other than quoted prices included in Level 1 that are observable for the asset or liability, either directly (as prices) or indirectly (derived from prices); and
c) Level 3 — the fair value is estimated using inputs for the asset or liability that are not based on observable market data.
Derivative financial instruments are classified as Level 2 and are valued using mid values of the forward contracts as determined by the New Zealand Debt Management Office based on inputs that are observable.
There were no transfers between Level 1 and Level 2 during the year.
Note 29
Remuneration of employees
During 2015/2016 48 (2015: 55) employees received remuneration and benefits that exceeded $100,000 per annum as follows:
Parent
$ 2016 2015
100,000 - 109,999 5 11
110,000 - 119,999 5 7
120,000 - 129,999 5 9
130,000 - 139,999 9 5
140,000 - 149,999 4 3
150,000 - 159,999 3 2
160,000 - 169,999 1 4
170,000 - 179,999 2 1
180,000 - 189,999 2 2
190,000 - 199,999 1 2
200,000 - 209,999 2 1
210,000 - 219,999 2 2
220,000 - 229,999 - 1
230,000 - 239,999 2 -
240,000 - 249,999 1 -
250,000 - 259,999 - 1
260,000 - 269,999 1 -
270,000 - 279,999 - 2
310,000 - 319,999 1 1
380,000 - 389,999 1 -
470,000 - 479,999 - 1
480,000 - 489,999 1 -
48 55
The reduction in employee numbers who have earned $100,000 or more in FY16 compared to FY15 is due to higher employee turnover, vacancies during the year and greater numbers of fixed term employees engaged to backfill permanent roles.
76

Note 30
Remuneration of board members Parent
Board members earned the following fees during the year:2016
$000s2015
$000s
K Prendergast (Chair) 42 42
R Leggat (Deputy Chair) 25 25
John Thorburn 20 20
Jenn Bestwick 2 20
Jamie Tuuta 20 20
Michael O’Donnell 20 22
Jacqui Spice 20 20
Christopher Parkin 20 20
Norm Thompson 20 20
Raewyn Idoine 15 -
204 209
Change in board members:
John Thorburn was reappointed to the Board on 18 August 2015 and Raewyn Idoine was appointed to the Board the same day. Jenn Bestwick’s term came to an end on 30 July 2015.
Note 31
Events after the balance date
There were no significant events after the balance date.
Note 32
Explanations of major variance against budget
There are no major variations to budget other than those explained in the notes above.
77

Five Year Financial Summary for Parent
Statement of Financial Position2012 Actual
$000s2013 Actual
$000s2014 Actual
$000s2015 Actual
$000s2016 Actual
$000s
Current Assets
Cash 7,153 5,768 3,970 6,206 4,903
Receivables 1,098 1,439 1,868 1,935 2,403
Prepayments and other current assets 798 921 934 1,545 1,402
Derivative financial instruments - 143 - 5,716 -
9,049 8,271 6,772 15,402 8,708
Non-current Assets
Property, plant and equipment 2,311 2,020 1,929 1,699 1,477
Intangible Assets - 1,054 1,264 1,554 1,257
Accommodation bonds 320 292 257 280 350
Investment in subsidiary - - - - 60
Derivative financial instruments - - - 1,054 -
2,631 3,366 3,450 4,587 3,144
Total Assets 11,680 11,637 10,222 19,989 11,852
Current Liabilities
Creditors and other payables 3,872 3,171 3,001 5,705 4,578
Employee entitlements 439 534 655 772 796
Income in advance 122 159 20 502 483
Provisions 50 24 20 96 116
Derivative financial instruments 152 - 1,520 - 1,456
4,635 3,888 5,216 7,075 7,429
Non-current Liabilities
Provisions 223 249 246 170 150
Derivative financial instruments - - 246 - 177
223 249 492 170 327
Total Liabilities 4,858 4,137 5,708 7,245 7,756
Net Assets 6,822 7,500 4,514 12,744 4,096
Equity
Shareholder's equity 1,805 1,805 1,805 1,805 1,805
Retained earnings 404 688 (1,408) 6,295 (1,830)
Foreign Exchange Reserve 4,613 5,007 4,117 4,644 4,121
Total Equity 6,822 7,500 4,514 12,744 4,096
78

Five Year Financial Summary for Parent Continued
Statement of Comprehensive Income2012 Actual
$000s2013 Actual
$000s2014 Actual
$000s2015 Actual
$000s2016 Actual
$000s
IncomeRevenue from Crown 84,215 84,167 113,730 113,350 115,850 Interest 139 114 46 48 202 Other revenue 5,530 5,631 8,349 6,378 5,416
89,884 89,912 122,125 119,776 121,468 ExpenditureOther expenses 89,205 89,124 122,190 119,114 120,621 Depreciation, Amortisation and Impairment 782 799 1,012 968 1,092
89,987 89,923 123,202 120,082 121,713
Unrealised Foreign exchange gains/(losses) on derivative financial instruments held at year end 970 295 (1,909) 8,536 (8,403)
Total comprehensive income/(expense) 867 284 (2,986) 8,230 (8,648)
Transfer from/(to) Foreign exchange reserve - 394 890 (527) 523
Total comprehensive income/(expense) after foreign exchange transfer 867 678 (2,096) 7,703 (8,125)
79

Independent Auditor’s ReportTo the readers of New Zealand Tourism Board and group’s financial statements and performance information for the year ended 30 June 2016.
The Auditor-General is the auditor of the New Zealand Tourism Board (the Group). The Auditor-General has appointed me, Stuart Mutch, using the staff and resources of Ernst & Young, to carry out the audit of the financial statements and performance information of the Board and group on her behalf.
Opinion on the financial statements and performance information
We have audited:
▪ the financial statements of the Group on pages 50 to 77, that comprise the statement of financial position as at 30 June 2016, the statement of comprehensive revenue and expenses, statement of changes in equity and statement of cash flows for the year ended on that date and the notes to the financial statements that include accounting policies and other explanatory information; and
▪ the performance information of the Board and group on pages 18 to 44.
In our opinion:
▪ the financial statements of the Group:
▫ present fairly, in all material respects:
- its financial position as at 30 June 2016; and
- its financial performance and cash flows for the year ended; and
▫ comply with generally accepted accounting practice in New Zealand and have been prepared in accordance with Public Benefit Entity Reporting Standards.
▪ the performance information:
▫ present fairly, in all material respects, the Group’s performance for the year ended 30 June 2016, including for each class of reportable outputs:
- its standards of performance achieved as compared with forecasts included in the statement of performance expectations for the financial year; and
- its actual revenue and output expenses as compared with the forecasts included in the statement of performance expectations for the financial year.
▫ complies with generally accepted accounting practice in New Zealand.
Our audit was completed on 6 October 2016. This is the date at which our opinion is expressed.
The basis of our opinion is explained below. In addition, we outline the responsibilities of the Board members and our responsibilities, and we explain our independence.
Basis of opinion
We carried out our audit in accordance with the Auditor-General’s Auditing Standards, which incorporate the International Standards on Auditing (New Zealand). Those standards require that we comply with ethical requirements and plan and carry out our audit to obtain reasonable assurance about whether the financial statements and the performance information are free from material misstatement.
Material misstatements are differences or omissions of amounts and disclosures that, in our judgment, are likely to influence readers’ overall understanding of the financial statements and the performance information. If we had found material misstatements that were not corrected, we would have referred to them in our opinion.
An audit involves carrying out procedures to obtain audit evidence about the amounts and disclosures in the financial statements and the performance information. The procedures selected depend on our judgment, including our assessment of risks of material misstatement of the financial statements and the performance information, whether due to fraud or error. In making those risk assessments; we consider internal control relevant to the preparation of the Board ’s and group’s financial statements and performance information in order to design audit procedures that are appropriate in the circumstances, but not for the purpose of expressing an opinion on the effectiveness of the Board’s and group’s internal control.
An audit also involves evaluating:
▪ the appropriateness of accounting policies used and whether they have been consistently applied;
▪ the reasonableness of the significant accounting estimates and judgments made by the Board members;
▪ the appropriateness of the reported performance information within the New Zealand Tourism Board’s framework for reporting performance;
▪ the adequacy of all disclosures in the financial statements and the performance information; and
▪ the overall presentation of the financial statements and the performance information.
We did not examine every transaction, nor do we guarantee complete accuracy of the financial statements and the performance information. Also we did not evaluate the security and controls over the electronic publication of the financial statements and the performance information.
We believe we have obtained sufficient and appropriate audit evidence to provide a basis for our audit opinion.
80

Responsibilities of the Board members
The Board members are responsible for preparing financial statements and performance information that:
▪ comply with generally accepted accounting practice in New Zealand;
▪ present fairly the Group’s financial position, financial performance and cash flows; and
▪ present fairly the Group’s performance.
The Board member’s responsibilities arise from the Crown Entities Act 2004 and the New Zealand Tourism Board Act 1991.
The Board members are also responsible for such internal control as is determined is necessary to enable the preparation of financial statements and performance information that are free from material misstatement, whether due to fraud or error. The Board members are also responsible for the publication of the financial statements and the performance information, whether in printed or electronic form.
Responsibilities of the Auditor
We are responsible for expressing an independent opinion on the financial statements and the performance information and reporting that opinion to you based on our audit. Our responsibility arises from the Public Audit Act 2001.
Independence
When carrying out the audit, we followed the independence requirements of the Auditor-General, which incorporate the independence requirements of the External Reporting Board.
Other than the audit, we have no relationship with or interests in the Board or any of its subsidiaries.
Stuart Mutch Ernst & Young On behalf of the Auditor-General Wellington, New Zealand
Julian Apse
81

82

Julian ApseJulian Apse
83
