tow-yo and temperature data from trinity bay, may 2000bdeyoung/schillinger_trinitybay_2000-2.pdf ·...
TRANSCRIPT

Physics and Physical Oceanography Data Report 2000-2
Tow-Yo and Temperature Data from Trinity Bay, May 2000
Douglas J. Schillinger, Brad deYoung and Jack Foley
© 2000 Department of Physics and Physical Oeanography
Memorial University of Newfoundland St. John’s, Newfoundland
A1B 3X7

ii
Abstract
Trinity Bay is a large, northward facing embayment on the Avalon peninsula that regularly exhibits strong upwelling activity. Strong, summer winds from the southwest lead to an upwelling response that is most intense on the western side of the Bay. We report on an oceanographic study conducted in May 2000 in which a towed body was cycled through the Bay and three temperature moorings were deployed and recovered. The three moorings each held 6 Vemco temperature sensors. The moorings were deployed near the shore on the northwest side of the Bay from Random Island towards the mouth of the Bay. Two surveys were conducted with a Chelsea Nu-Shuttle towed body that collected CTD, fluorescence, and biomass data. We present the towed body data together with some of our quality control analysis of the data from the Chelsea Nu-Shuttle instrument.

iii
Acknowledgements
We thank the captain and crew of the Shamook for their assistance and Dr. P. Snelgrove for his help in this oceanographic study.

iv
Table of Contents
Abstract ............................................................................................................................... ii Acknowledgements............................................................................................................ iii Table of Contents............................................................................................................... iv Table of Figures .................................................................................................................. v List of Tables ..................................................................................................................... vi Introduction......................................................................................................................... 1 Station Information ............................................................................................................. 2 Data Processing................................................................................................................... 2 Data Interpretation .............................................................................................................. 3 Figures................................................................................................................................. 5

v
Table of Figures
Figure 1: The transects for defined by the ship’s path on 12 May 2000 (A), and 17 May 2000. The location of the Vemco temperature moorings on the northwest side of the bayare indicated by the asterisks. Three moorings were deployed, one just off Random Island (South) and two to the north (Mid and North)................................... 5
Figure 2: The time series temperature profile recorded by the Vemco Temperature sensors located North of Random Island (A), middle of Random Island (B), and South of Random Island (C). ...................................................................................... 6
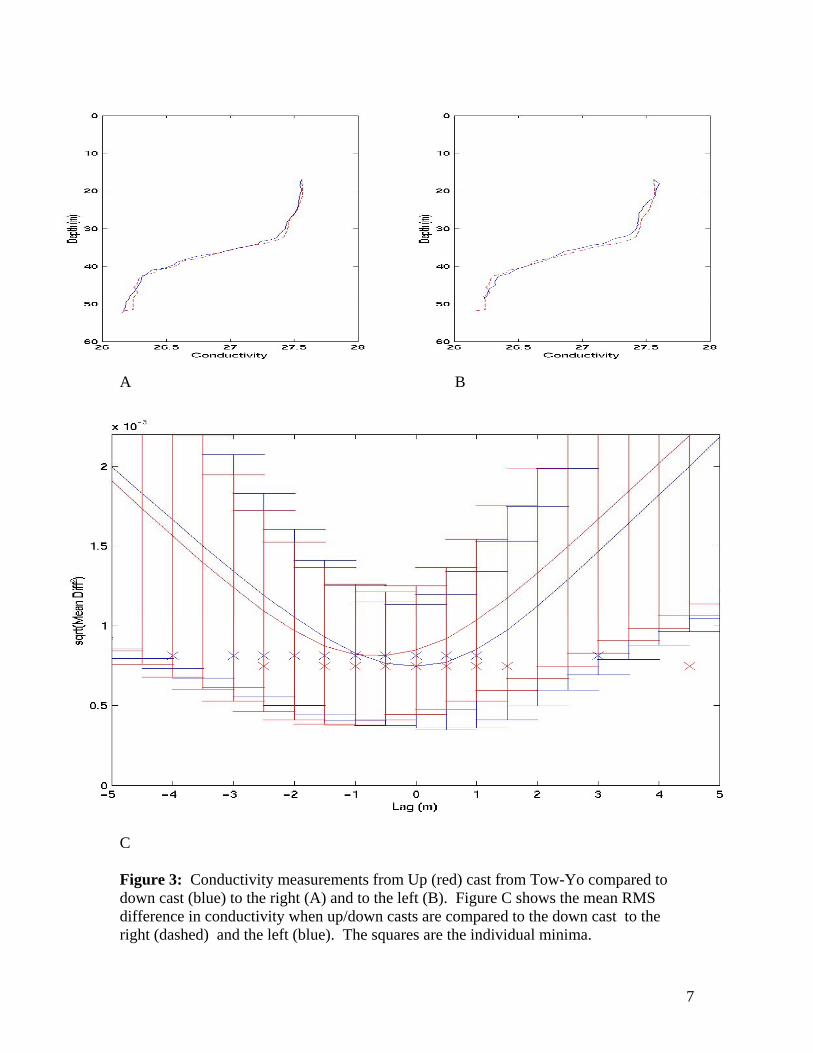
Figure 3: Conductivity measurements from Up (red) cast from Tow-Yo compared to down cast (blue) to the right (A) and to the left (B). Figure C shows the mean RMS difference in conductivity when up/down casts are compared to the down cast to the right (dashed) and the left (blue). The squares are the individual minima. .............. 7
Figure 4: Temperature measurements from Up (red) cast from Tow-Yo compared to down cast (blue) to the right (A) and to the left (B). Figure C shows the mean RMS difference in temperature when up/down casts are compared to the down cast to the right (dashed) and the left (blue). The squares are the individual minima. .............. 8
Figure 5: The transect profile for Temperature, Salinity, Density, Fluorescence, and Biomass. The arrow above the temperature profile indicates the tow direction. The location of the transect is shown in the inset figure.................................................... 9
Figure 6: The transect profile for Temperature, Salinity, Density, Fluorescence, and Biomass. The arrow above the temperature profile indicates the tow direction. The location of the transect is shown in the inset figure.................................................. 10
Figure 7: The transect profile for Temperature, Salinity, Density, Fluorescence, and Biomass. The arrow above the temperature profile indicates the tow direction. The location of the transect is shown in the inset figure.................................................. 11
Figure 8: The transect profile for Temperature, Salinity, Density, Fluorescence, and Biomass. The arrow above the temperature profile indicates the tow direction. The location of the transect is shown in the inset figure.................................................. 12
Figure 9: The transect profile for Temperature, Salinity, Density, Fluorescence, and Biomass. The arrow above the temperature profile indicates the tow direction. The location of the transect is shown in the inset figure.................................................. 13
Figure 10: The transect profile for Temperature, Salinity, Density, Fluorescence, and Biomass. The arrow above the temperature profile indicates the tow direction. The location of the transect is shown in the inset figure.................................................. 14
Figure 11: The transect profile for Temperature, Salinity, Density, Fluorescence, and Biomass. The arrow above the temperature profile indicates the tow direction. The location of the transect is shown in the inset figure.................................................. 15
Figure 12: The transect profile for Temperature, Salinity, Density, Fluorescence, and Biomass. The arrow above the temperature profile indicates the tow direction. The location of the transect is shown in the inset figure.................................................. 16
Figure 13: The transect profile for Temperature, Salinity, Density, Fluorescence, and Biomass. The arrow above the temperature profile indicates the tow direction. The location of the transect is shown in the inset figure.................................................. 17

vi
Figure 14: The transect profile for Temperature, Salinity, Density, Fluorescence, and Biomass. The arrow above the temperature profile indicates the tow direction. The location of the transect is shown in the inset figure.................................................. 18
Figure 15: The transect profile for Temperature, Salinity, Density, Fluorescence, and Biomass. The arrow above the temperature profile indicates the tow direction. The location of the transect is shown in the inset figure.................................................. 19
Figure 16: The transect profile for Temperature, Salinity, Density, Fluorescence, and Biomass. The arrow above the temperature profile indicates the tow direction. The location of the transect is shown in the inset figure.................................................. 20
Figure 17: The transect profile for Temperature, Salinity, Density, Fluorescence, and Biomass. The arrow above the temperature profile indicates the tow direction. The location of the transect is shown in the inset figure.................................................. 21
Figure 18: The transect profile for Temperature, Salinity, Density, Fluorescence, and Biomass. The arrow above the temperature profile indicates the tow direction. The location of the transect is shown in the inset figure.................................................. 22
Figure 19: The transect profile for Temperature, Salinity, Density, Fluorescence, and Biomass. The arrow above the temperature profile indicates the tow direction. The location of the transect is shown in the inset figure.................................................. 23
Figure 20: The transect profile for Temperature, Salinity, Density, Fluorescence, and Biomass. The arrow above the temperature profile indicates the tow direction. The location of the transect is shown in the inset figure.................................................. 24
Figure 21: The transect profile for Temperature, Salinity, Density, Fluorescence, and Biomass. The arrow above the temperature profile indicates the tow direction. The location of the transect is shown in the inset figure.................................................. 25
Figure 22: The transect profile for Temperature, Salinity, Density, Fluorescence, and Biomass. The arrow above the temperature profile indicates the tow direction. The location of the transect is shown in the inset figure.................................................. 26
Figure 23: The transect profile for Temperature, Salinity, Density, Fluorescence, and Biomass. The arrow above the temperature profile indicates the tow direction. The location of the transect is shown in the inset figure.................................................. 27
Figure 24: The transect profile for Temperature, Salinity, Density, Fluorescence, and Biomass. The arrow above the temperature profile indicates the tow direction. The location of the transect is shown in the inset figure.................................................. 28
Figure 25: The transect profile for Temperature, Salinity, Density, Fluorescence, and Biomass. The arrow above the temperature profile indicates the tow direction. The location of the transect is shown in the inset figure.................................................. 29
List of Tables
Table 1: Mooring Locations............................................................................................... 2

1
Introduction
The Nu-Shuttle, manufactured by Chelsea, provides an ideal means to gather CTD data in a fast and effective manner. By continuously oscillating up and down to and from specific depths while being towed, the Tow-yo (as the Nu-Shuttle is called from here on) gathers physical data profiles along any transect. Two sets of transect data, collected on 11-12 May, and 17-18 May provide temperature, salinity, density and fluorescence profiles within Trinity Bay. We towed the instrument at 7-8 knots. Although we tried to get the towed body to cycle between 10 and 80 m, we found that we could not obtain a cycle range greater than 40-50m. We were able to tow at slower speeds after attaching a four-bladed propellor. It is suspected that the 125m of ribbon fairing attached to the bottom of the cable is actually limiting the depth that can be reached by the towed body. As the body descends, it appears likely that the ribbon fairing, rather than reducing drag, is actually generating lift and/or increasing drag. Some experimentation with adjusting the tow speed did not substantially improve the range situation. In principle, the Tow-yo can be towed at speeds between 6 and 12 knots. An Optical Plankton Counter (OPC) was attached to the Tow-yo providing a measure of biomass in the bay. There we some problems with the data obtained from the Tow-yo. Some of the problems discovered are common to all oceanographic instruments, others are unique to towed bodies and yet others are probably unique to the Nu-Shuttle system. We found that there was some salinity spiking in the CTD data, a phenomenon that results from a mismatch in the time response of the temperature and conductivity sensors. Appropriate averaging of the data minimizes this problem, although later we may want to look at lagging one channel with respect to the other to correct for the sensor mismatch. The biggest problem that we had with the data was an observed difference between neighbouring up- and down-casts. On the horizontal spatial scales on which these measurements are made, the distance between up- and down-casts is less than a kilometer, we would expect to see much less difference than we do in fact observe. The differences were not limited to the CTD sensors but also included the OPC. On down-casts, the OPC appeared to under-report, relative to the up-casts, a result that we believe may be due to the difference in the angle of attack between the up and down tows. A section detailing the data processing required to overcome these problems is included in this report.
In addition to the tow-yo data, three sets of Vemco temperature sensors were deployed at three locations (Figure 1) along the northwest coast of the Bay. Nothing unusual was discovered in the processing of these data, although there is clear evidence of spatial structure in the temperature field along the northwest coast of Trinity Bay (Figure 2).

2
Station Information
The locations of the three temperature moorings are listed in Table 1. Each mooring consisted of six Vemco temperature sensors, with one sensor at 10, 20, 30, 40, 50 and 60 m below the surface. The blue asterisks in Figure 1 show the location of the moorings. The tow-yo transects are shown by the solid blue line. The ship’s path was from the mouth of the bay to the head during 11-12 May, and from the head of the bay to the mouth of the bay during 17-18 May. Table 1: Mooring Locations Mooring Latitude (o N) Longitude (oW) South 48 04.87 53 27.96 Mid 48 11.86 53 24.34 North 48 16.89 53 21.97
Data Processing
The CTD and OPC data were averaged into bins 100m in the horizontal, and 0.5 m in the vertical. Using these bin averaged data, the profiles of adjacent up and down tows were compared. Two examples of visual comparison of an up tow compared to a down tow (A) and a down tow to an up tow (B) are shown for Temperature (Figure 3) and Conductivity (Figure 4). By calculating the lagged, difference squared between adjacent up and down tows, we can determine the lag in the temperature measurements can be calculated (Figure 4c). In both Figures 3c and 4c the solid line compares up tows to the down tow to the left, while the dashed line compares up tows to the down tow to the left. The minimum in these curves determines the distance vertical location for the up tow measurements need to be adjusted by. For the majority of the transects, the conductivity did not need to be adjusted in this manner, although there is some indication that for transects I and J of 12 May (Figures 13 and 14) should have been adjusted in a similar fashion. We are not sure why there is such a strong lag in temperature but not in conductivity. The answer may lie in the response characteristics of the different sensors or perhaps the position of the sensors on the towed body. The sensors are located back from the nose of the towed body, on the top and on the left hand side of the Tow-yo. It appears that the different orientation of the body, i.e. the angle of attack, influences the response characteristics of the sensors. It may be that the differential response is a result of the tow speed and cable configuration of the Nu-Shuttle deployment. A maximum shift distance of 10 m was chosen by trial and error. In addition, only the temperature data measured between 20 and 40 m were adjusted in this manner. These depths were determined by visual inspection of the data.
A similar problem was noted with the OPC data. For the down tows, it appears
that there was no flow through the OPC aperture. We could not find a lag adjustment that would correct for the differences between the up- and down-tows. As such, the down tows were discarded.

3
After bin averaging and depth correction were performed, the data were then
interpolated in two dimensions using an inverse linear distance squared weighting algorithm. This algorithm was limited to bins within 4 km in the horizontal and 5 m in the vertical. Paired bins were assigned equal value. For the OPC data, this weighting was doubled to account for the reduction in resolution resulting from discarding the down tow data.
Data Interpretation
The temperature time series shows that there is some spatial structure to the time dependent thermal structure with the upwelling response clearly depending upon position along the coast. We tried to produce spatial, horizontal contours of the tow-yo data but there was insufficient spatial data. The section plots from the tow-yo show that there is substantial across bay structure and one can infer along-bay structure. The wave-like features in the temperature along transect A (Figure 5) are matched in the fluorescence which shows a maximum that is roughly associated with the 0 oC isotherm. There does not appear to a lot of structure in the OPC biomass signal although some of the transect lines do exhibit a clear subsurface maximum which exhibits spatial structure (e.g. transect F, Figure 10).
Near the head, across the Bay, the base of the thermocline shifts from 20 to 40 m depth from the coast to the center of the Bay (Figure 14). Comparison from one transect line to another, e.g. Figures 13 and 14, show that the observed cross-bay structure is coherent from one transect to another and is not an artifact of sampling. Some of the apparent spatial structure in the data may in fact be a residual artifact of the tow-yo sampling. Figures 13 and 14, from transect I and J, show wave-like features in the salinity and density, that is likely a result of a difference in the conductivity in the up- and down-casts. Only some of transects exhibit this banding and it is not known why some do but most do not.
Of the bio-sensors, the fluorescence data shows the clearest structure. The peak in observed fluorescence is generally associated with the thermocline, and the base of the mixed layer, as we expect. There is generally less fluorescence above 30m depth, but there is not always a clearly discernible maximum in fluorescence below that depth.
Comparison of the transects running parallel to the East coast of Random Island
(transect D), and along the inlet to the south of Random Island (transect E) taken during 11-12 May (Figures 9 and 10) and 17-18 May (Figures 19 and 20) show significant changes in temperature. The relatively warm (2-3 oC) water present during 11-12 May at the South-Eastern end of Random Island are not present in the transect taken during 17-18 May. Transect D from 11-12 May (Figure 9) shows a pool of warm (2-3 oC) starting at 11 km and descending to 25 m by the end of the transect (at the Southern end of Random Island). The salinity profile shows salinity spiking occurring along the pycnocline. The fluorescence follows the depth of the pycnocline, with a maximum descending to below 40 m from 12 km to the end of the transect. Transect E from 11-12 May (Figure 10) shows the same water mass extending to 7 km. All along the

4
pycnocline, there are examples of salinity spiking. Again the depth of the fluorescence maximum follows the pycnocline. This pool of warm water is absent in these transects taken during 17-18 May (Figures 19 and 20). Instead, the temperature is close to 1 oC for depths from 25 to 50 m . Again the florescence patchiness follows the temperature profile.

5
Figures
A
B
Figure 1: The transects for defined by the ship’s path on 12 May 2000 (A), and 17 May 2000. The location of the Vemco temperature moorings on the northwest side of the bayare indicated by the asterisks. Three moorings were deployed, one just off Random Island (South) and two to the north (Mid and North).

6
A Northern Mooring
B Middle Mooring
C Southern Mooring Figure 2: The time series temperature profile recorded by the Vemco Temperature sensors located North of Random Island (A), middle of Random Island (B), and South of Random Island (C).
7
A B
C Figure 3: Conductivity measurements from Up (red) cast from Tow-Yo compared to down cast (blue) to the right (A) and to the left (B). Figure C shows the mean RMS difference in conductivity when up/down casts are compared to the down cast to the right (dashed) and the left (blue). The squares are the individual minima.

8
A B
C Figure 4: Temperature measurements from Up (red) cast from Tow-Yo compared to down cast (blue) to the right (A) and to the left (B). Figure C shows the mean RMS difference in temperature when up/down casts are compared to the down cast to the right (dashed) and the left (blue). The squares are the individual minima.

9
Figure 5: The transect profile for Temperature, Salinity, Density, Fluorescence, and Biomass. The arrow above the temperature profile indicates the tow direction. The location of the transect is shown in the inset figure.

10
Figure 6: The transect profile for Temperature, Salinity, Density, Fluorescence, and Biomass. The arrow above the temperature profile indicates the tow direction. The location of the transect is shown in the inset figure.

11
Figure 7: The transect profile for Temperature, Salinity, Density, Fluorescence, and Biomass. The arrow above the temperature profile indicates the tow direction. The location of the transect is shown in the inset figure.

12
Figure 8: The transect profile for Temperature, Salinity, Density, Fluorescence, and Biomass. The arrow above the temperature profile indicates the tow direction. The location of the transect is shown in the inset figure.

13
Figure 9: The transect profile for Temperature, Salinity, Density, Fluorescence, and Biomass. The arrow above the temperature profile indicates the tow direction. The location of the transect is shown in the inset figure.

14
Figure 10: The transect profile for Temperature, Salinity, Density, Fluorescence, and Biomass. The arrow above the temperature profile indicates the tow direction. The location of the transect is shown in the inset figure.

15
Figure 11: The transect profile for Temperature, Salinity, Density, Fluorescence, and Biomass. The arrow above the temperature profile indicates the tow direction. The location of the transect is shown in the inset figure.

16
Figure 12: The transect profile for Temperature, Salinity, Density, Fluorescence, and Biomass. The arrow above the temperature profile indicates the tow direction. The location of the transect is shown in the inset figure.

17
Figure 13: The transect profile for Temperature, Salinity, Density, Fluorescence, and Biomass. The arrow above the temperature profile indicates the tow direction. The location of the transect is shown in the inset figure.

18
Figure 14: The transect profile for Temperature, Salinity, Density, Fluorescence, and Biomass. The arrow above the temperature profile indicates the tow direction. The location of the transect is shown in the inset figure.

19
Figure 15: The transect profile for Temperature, Salinity, Density, Fluorescence, and Biomass. The arrow above the temperature profile indicates the tow direction. The location of the transect is shown in the inset figure.

20
Figure 16: The transect profile for Temperature, Salinity, Density, Fluorescence, and Biomass. The arrow above the temperature profile indicates the tow direction. The location of the transect is shown in the inset figure.

21
Figure 17: The transect profile for Temperature, Salinity, Density, Fluorescence, and Biomass. The arrow above the temperature profile indicates the tow direction. The location of the transect is shown in the inset figure.

22
Figure 18: The transect profile for Temperature, Salinity, Density, Fluorescence, and Biomass. The arrow above the temperature profile indicates the tow direction. The location of the transect is shown in the inset figure.

23
Figure 19: The transect profile for Temperature, Salinity, Density, Fluorescence, and Biomass. The arrow above the temperature profile indicates the tow direction. The location of the transect is shown in the inset figure.

24
Figure 20: The transect profile for Temperature, Salinity, Density, Fluorescence, and Biomass. The arrow above the temperature profile indicates the tow direction. The location of the transect is shown in the inset figure.

25
Figure 21: The transect profile for Temperature, Salinity, Density, Fluorescence, and Biomass. The arrow above the temperature profile indicates the tow direction. The location of the transect is shown in the inset figure.

26
Figure 22: The transect profile for Temperature, Salinity, Density, Fluorescence, and Biomass. The arrow above the temperature profile indicates the tow direction. The location of the transect is shown in the inset figure.

27
Figure 23: The transect profile for Temperature, Salinity, Density, Fluorescence, and Biomass. The arrow above the temperature profile indicates the tow direction. The location of the transect is shown in the inset figure.

28
Figure 24: The transect profile for Temperature, Salinity, Density, Fluorescence, and Biomass. The arrow above the temperature profile indicates the tow direction. The location of the transect is shown in the inset figure.

29
Figure 25: The transect profile for Temperature, Salinity, Density, Fluorescence, and Biomass. The arrow above the temperature profile indicates the tow direction. The location of the transect is shown in the inset figure.