toward an assessment of the global inventory of present
TRANSCRIPT

Int. J. Environ. Res. Public Health 2017, 14, x; www.mdpi.com/journal/ijerph
Article
Toward an Assessment of the Global Inventory of Present-Day Mercury Releases to Freshwater Environments
David Kocman 1,*, Simon J. Wilson 2, Helen M. Amos 3,4, Kevin H. Telmer 5,6, Frits Steenhuisen 7,
Elsie M. Sunderland 3,4, Robert P. Mason 8, Peter Outridge 9 and Milena Horvat 1
1 Department of Environmental Sciences, Jožef Stefan Institute, Ljubljana 1000, Slovenia; [email protected] 2 Arctic Monitoring and Assessment Programme (AMAP) Secretariat, Oslo N-0349, Norway;
[email protected] 3 Department of Environmental Health, Harvard School of Public Health, Boston, MA 02215, USA;
[email protected] (H.M.A.); [email protected] (E.M.S.) 4 Harvard School of Engineering and Applied Sciences, Cambridge, MA 02138, USA 5 Artisanal Gold Council, Victoria, BC V8W 1B9, Canada; [email protected] 6 School of Earth and Ocean Sciences, University of Victoria, Victoria, BC V8P 5C2, Canada 7 Arctic Centre, University of Groningen, Groningen 9718CW , The Netherlands; [email protected] 8 Department of Marine Sciences, University of Connecticut, CT 06340, USA; [email protected] 9 Geological Survey of Canada, Natural Resources Canada, Ottawa, ON K1A 0E8, Canada;
* Correspondence: [email protected]; Tel.: +386-1-5885-218
Academic Editors: Timothy Dvonch and Nicola Pirrone
Received: 23 November 2016; Accepted: 24 January 2017; Published: date
Abstract: Aquatic ecosystems are an essential component of the biogeochemical cycle of mercury
(Hg), as inorganic Hg can be converted to toxic methylmercury (MeHg) in these environments and
reemissions of elemental Hg rival anthropogenic Hg releases on a global scale. Quantification of
effluent Hg releases to aquatic systems globally has focused on discharges to the global oceans,
rather than contributions to freshwater systems that affect local exposures and risks associated with
MeHg. Here we produce a first-estimate of sector-specific, spatially resolved global aquatic Hg
discharges to freshwater systems. We compare our release estimates to atmospheric sources that
have been quantified elsewhere. By analyzing available quantitative and qualitative information,
we estimate that present-day global Hg releases to freshwater environments (rivers and lakes)
associated with anthropogenic activities have a lower bound of ~1000 Mg·a−1. Artisanal and
small-scale gold mining (ASGM) represents the single largest source, followed by disposal of
mercury-containing products and domestic waste water, metal production, and releases from
industrial installations such as chlor-alkali plants and oil refineries. In addition to these direct
anthropogenic inputs, diffuse inputs from land management activities and remobilization of Hg
previously accumulated in terrestrial ecosystems are likely comparable in magnitude. Aquatic
discharges of Hg are greatly understudied and further constraining associated data gaps is crucial
for reducing the uncertainties in the global biogeochemical Hg budget.
Keywords: mercury, freshwater systems, releases, inventory, global cycling
1. Introduction
Mercury (Hg) is a pollutant of global concern that cycles between the atmosphere, terrestrial and
aquatic systems and has been strongly impacted by human activity [1,2]. Understanding Hg inputs
to various environmental compartments and their magnitude is an important step in assessing risks
for humans and wildlife, and for characterizing the global biogeochemical cycle. Releases of Hg to
aquatic systems are especially important, as it is within these environments that toxic methylmercury

Int. J. Environ. Res. Public Health 2017, 14, x 2 of 16
(MeHg) that bioaccumulates in aquatic food webs is formed [3]. Compared to global atmospheric
emission inventories of Hg [4–6], direct releases to aquatic systems have been understudied.
Horowitz et al. [7] quantified global time-dependent historical releases of commercial Hg to different
environmental reservoirs including water but did not develop a resolved spatial inventory of present-
day releases to freshwater environments. Other work has focused on the riverine flux of Hg to the
oceans [8–10] and Hg releases from contaminated systems [11]. Here we present a
spatially-distributed, sector-specific inventory of Hg releases to freshwater environments on a global
scale to extend understanding of the global distribution of these inputs.
Mercury is released to freshwater systems from a variety of sources and subjected to complex
transport pathways [12]. Mercury can enter rivers and lakes directly via atmospheric deposition.
Rivers and lakes further receive Hg as a result of releases from industrial sources within their
drainage area, as well as indirectly from terrestrial environments via surface runoff, and through soil
leaching and erosion. Depending on the soil characteristics, part of this Hg reservoir can be leached
to groundwater [13]. Riverine loads are enhanced by river bank erosion as well as remobilization of
previously deposited Hg with bed sediments during high water flow, especially in contaminated
systems [14,15]. On the other hand, transport of Hg from rivers to coastal environments is diminished
by its sedimentation behind various impoundments during transport to the ocean.
Riverine Hg loads from terrestrial systems to the coastal zone as estimated in various
studies [8–10] vary by a factor of five. These include a higher end estimate of 5500 ± 2700 Mg·a−1 by
Amos et al. [10], derived using a global gridded inventory based on a review of published Hg
measurements taken near river mouths. This estimate is a factor of two or larger than previously
estimated values by Cossa et al. [8] (~1000 Mg·a−1) and Sunderland and Mason [9] (2040, range 1320
to 2760 Mg·a−1), due to the incorporation of recently published data from major Asian rivers.
However, recent estimate by Liu et al. [16] suggests lower inputs from rivers in China. On the other
hand, terrestrial systems receive Hg through wet and dry deposition that are estimated to be
approximately 3000 Mg·a−1 [17].
Our inventory accounts for Hg released from anthropogenic sources, as well as remobilized
from natural and anthropogenic Hg previously accumulated in the terrestrial environment. We focus
on Hg releases from these sources to adjacent freshwater systems, excluding groundwater due to the
lack of quantitative information. In order to avoid double counting, we distinguish between direct
Hg releases to freshwaters (i.e., Hg discharged directly into water bodies) and inputs to water bodies
from terrestrial environments via runoff, soil erosion and leaching. Our work builds on the inventory
prepared by the United National Environment Programme (UNEP) and the Arctic Monitoring and
Assessment Program (AMAP) that was part of the UNEP global mercury assessment [18]. The
underlying assumptions for estimating Hg releases from diffuse sources are based on general long-
term hydro-meteorological conditions, while releases from point sources refer to the 2010 inventory.
We qualitatively discuss land management practices such as silviculture and agriculture, and the use
and consequent release of Hg in artisanal and small-scale gold mining (ASGM). Quantitative
information on Hg releases to surrounding freshwaters from these sources is largely lacking. We
compare the relative contributions from individual source categories with those from atmospheric
deposition and riverine transport of Hg to oceans. We distribute the inventory geospatially according
to the major drainage basins of the world (Figure 1).

Int. J. Environ. Res. Public Health 2017, 14, x 3 of 16
Figure 1. Drainage basins of the principal oceans and seas of the world. Description in blue is used
for oceans, and black color is used to denote the 15 drainage basins considered in our inventory. Maps
used: World Major Rivers (source: ESRI® , Redlands, CA, USA), Drainage Basins (source: compiled by
William Rankin (personal communication) based on USGS Hydro1k database (Garretson, SD, USA)).
2. Methods
We distinguish among three types of Hg sources to freshwater environments: (1) primary
anthropogenic, (2) soil erosion and runoff not impacted by direct anthropogenic releases
(background), and (3) remobilization of Hg from contaminated sites and areas impacted by land
management practices. Given the data availability for individual Hg sources, different approaches
and assumptions were used to derive releases. Methods used are documented in the following
paragraphs, with more details provided in the Supplementary Materials Figure S1, Tables S1 and S2.
To the extent possible we compare our results with independent release estimates and recognize that
there is substantial uncertainty in some of these initial estimates. Inventory results are summarized
for 15 drainage basins of the principal oceans and seas of the world (Figure 1). We compare these
numbers with estimates of more general Hg inputs to ocean margins via rivers and atmospheric
deposition in order to provide context for the discussion. While we acknowledge that the fate of
aquatic Hg depends greatly on its chemical form and partitioning between dissolved and particulate
phases, insufficient data are available to quantify speciated releases, such as the inputs of MeHg.
2.1. Primary Anthropogenic Release Estimates
Primary anthropogenic Hg sources consist of Hg released with the effluents leaving production
sites where Hg is intentionally or unintentionally used and/or present in products and processes. For
sectors covered by the UNEP Toolkit [19,20] (chlor-alkali industry, oil refining, large scale Au and
non-ferrous metal production, disposal of Hg-containing products) the UNEP Toolkit provides
“distribution factors” that proportionally “distribute” total Hg releases between emissions to air and
releases to water and land. We used these factors together with the most recent Global Mercury
Assessment (GMA) atmospheric Hg emission inventory [18] to calculate the corresponding
magnitudes of releases to water (see Supplementary Material Table S1 for details). Similarly, the
methods used to geospatially distribute air emissions [21] were then applied to the aquatic release
estimates to achieve the geospatial-distribution of the aquatic releases. The combined approach is
described further in the Figure S1.
In addition to industrial effluents, we consider Hg releases associated with domestic water use,
a sector recently recognized as important also by Liu et al. [22]. We derive our wastewater estimates
from reported Hg concentrations in wastewater effluents and global distribution of domestic water
use using gridded dataset developed for the Millennium Ecosystem Assessment Series [23]. For each
basin we select a ratio of treated to untreated wastewater reaching water bodies based on information
presented by UNEP [24] and Sato et al. [25]; 90:10 for Baltic and NE Atlantic, 80:20 for NW Atlantic,

Int. J. Environ. Res. Public Health 2017, 14, x 4 of 16
E Indian and SW Pacific (part draining Australia and New Zealand), 70:30 for NE Pacific, Caribbean
(part draining North America) and W Arctic, 60:40 for Mediterranean, 50:50 for E Arctic and
Endorheic regions, 30:70 for N Indian, SE Pacific, SW Atlantic, W Pacific and Caribbean (part draining
Central America), 20:80 for SE Atlantic and W Indian. We use a wastewater Hg concentration in
100–500 ng L−1 range for untreated waste-water and a Hg concentration range of 5–20 ng L−1 for water
treated in waste-water treatment plants (WWTPs) [26–28].
We discuss releases from ASGM based on the global inventory prepared by AMAP/UNEP [18],
which is based on the improved methodology of Telmer and Veiga [29] and the continuous updates
delivered to a publically available (http://mercurywatch.org) database. The methodology combines
understanding of ASGM activities, especially knowledge about practices used in individual
countries, with field evidence and variety of secondary information sources [18]. Exact locations
where ASGM activities are taking place are not always known. Moreover, as these sites are
distributed globally in zones with highly variable hydro-meteorological conditions, it is reasonable
to expect that inputs to local aquatic systems will significantly differ from site to site. In the absence
of detailed information, we use a semi-quantitative approach to estimate potential release of Hg to
aquatic systems for individual country based on their susceptibility to erosion. We classify countries
into three groups based on the amount of surface runoff [30]: countries with a very dry climate
(<100 mm·a−1) where remobilization of Hg to aquatic systems can be considered negligible, countries
with a very humid climate (>1000 mm·a−1) where such inputs can be important, and others that fall
in-between these two classes.
2.2. Background Releases from Terrestrial Systems
Background releases are comprised of soil erosion and runoff of Hg both naturally present and
atmospherically deposited. Background releases, as defined here, do not represent the pre-industrial
flux. We estimate these releases based on range of Hg loads (0.1–4 μg·m−2·a−1) reported in remote and
pristine environments [31–33]. We scale up the estimate globally by multiplying various ranges of
Hg loads by the size of individual drainage basin. We normalize Hg loads based on basin specific
average total suspended solid (TSS) loads obtained from Ludwig et al. [34]. We use the natural breaks
(Jenks) classification method to group drainage basins into four sediment yield classes (<30, 30–80,
80–130 and >130 Mg TSS·km−2) for which we apply the following Hg load ranges: 0.1–1, 1–2, 2–3 and
3–4 µg·Hg·m−2.
2.3. Remobilization from Terrestrial Systems
Our remobilization source category consists of Hg previously deposited to or accumulated in
various environmental compartments as a result of natural processes augmented by anthropogenic
activities. Within this source category we consider remobilization from contaminated surfaces via
soil erosion and leaching and enhanced Hg releases and accumulation as a result of land and water
management practices (agriculture and silviculture).
We define contaminated surfaces as sites with elevated Hg content surrounding locations where
Hg was used or was/is present as a result of mining activities and industrial processes. We account
for the following major sources: primary Hg mining, large-scale gold mining, non-ferrous metal
processing (NFMP) of Pb, Zn and Cu, and various other polluted industrial sites where Hg is or was
used as a catalyst (chlor-alkali, acetaldehyde, vinyl acetate and PVC plants). We distribute releases
associated with mining activities along the locations of Hg mines obtained from mineral resources
data system (MRDS) [35] and gold deposits [36], similar to the approach used by Selin et al. [37] for
distribution of geogenic Hg emissions. A 10 km buffer zone surrounding Hg and Au mines was used
to delineate the contributing area, based on reported extent of pollution in various studies [38–41].
Different ranges of Hg releases were then considered depending on the climatic position of the site:
10–100, 100–1000 and 1000–3000 g·Hg·km−2·a−1 in case of primary Hg mining [41,42] for arid,
temperate and humid climate zone [30], respectively, while order of magnitude lower loads were
considered for Au mining sites. For large Hg mining areas in China [43] and Slovenia missing in the
MRDS the upper range of releases was used. For sites surrounding point sources (ore processing

Int. J. Environ. Res. Public Health 2017, 14, x 5 of 16
locations were adopted from USGS [35] and industrial installations intentionally using Hg as a
catalyst either currently or in the past were compiled from various sources [11,44–46]), site-specific
sediment yields were extracted from the GIS map of sediment flux [47] and combined with the extent
of pollution as reported for various case studies. A uniform value of 3 km radius was used for
selecting the size of the contributing area for each of these point sources, while soil Hg content in
0.1–0.3 µg g−1 and 0.2–0.5 µg g−1 range was selected for ore processing and sites with Hg used as
catalysts, respectively [48–50]. For all of the contaminated systems considered here we assume the
“background” contribution negligible.
We discuss potential Hg releases associated with land (agriculture and silviculture)
management practices lacking detailed quantitative information based on the scarce information
available and by using surrogate parameters (e.g., water consumption, hydro-meteorological
conditions, land use).
3. Results and Discussion
3.1. Releases of Hg to Aquatic Systems
3.1.1. Primary Releases of Anthropogenic Hg
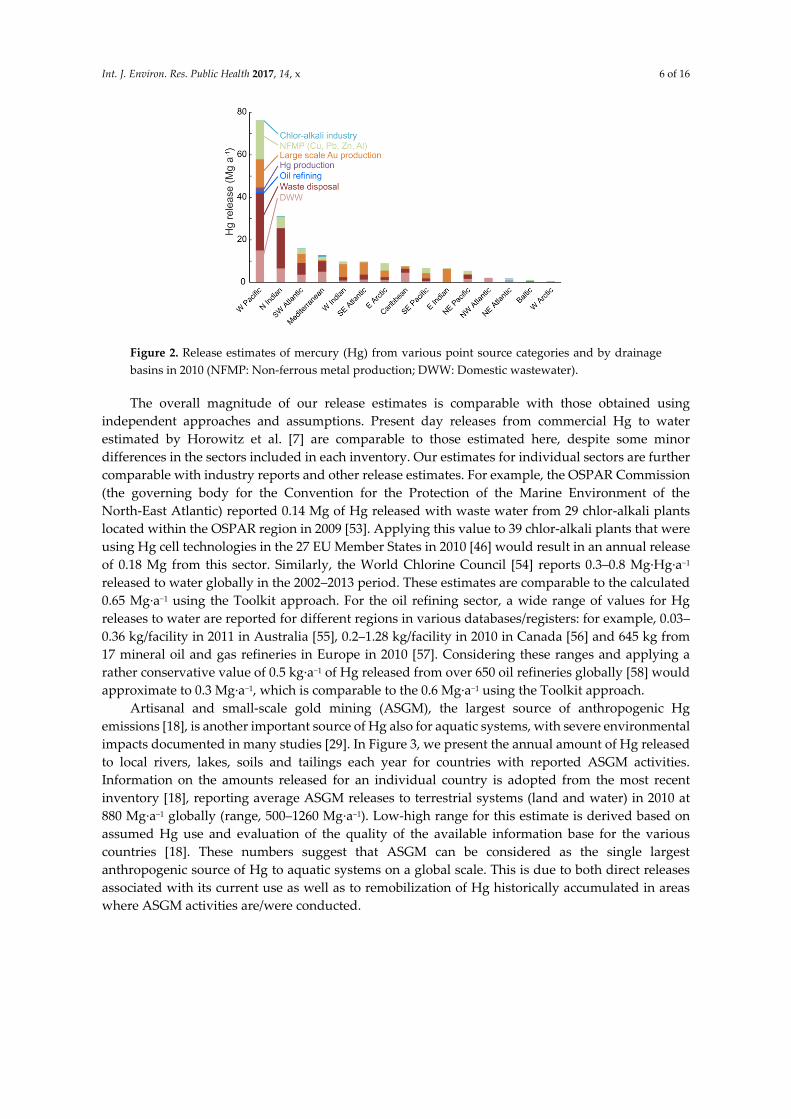
In Figure 2, we show releases of Hg to aquatic systems by drainage basins and sector. Using the
UNEP Toolkit approach, we estimate direct Hg discharges associated with industrial water effluents
and disposal of Hg-containing products as 168 Mg·a−1 globally (range, 36–521 Mg·a−1). The majority
(43%) is associated with Hg-containing products disposal, the rest being distributed among
non-ferrous metal production facilities, including large scale gold mining, with only two percent of
the releases from oil refining and chlor-alkali production. The majority (51%) of global Hg releases
from these sources are from industrial installations and Hg-containing waste located in China and
India, and draining to the West Pacific and North Indian Oceans (Figure 2). The wide range in the
estimates reflects uncertainties related to those for atmospheric emission used to derive releases to
water: activity data used, emission factors and assumptions made regarding applied technologies, as
discussed in detail in AMAP/UNEP [18].
In addition to industrial sectors, domestic wastewater (DWW) is another important point source
of Hg. We estimate the global amount of Hg entering aquatic systems from this source at 48 Mg·a−1
(range, 16–81 Mg·a−1). The low-high range reflects the range of wastewater Hg concentrations used
to derive the estimate. Technology presently exists for Hg removal during treatment with efficiencies
exceeding 98% [26,27]. However, even if treated, substantial amounts of Hg can be released from
wastewater treatment plants (WWTPs) to local water bodies due to the large volumes of water
processed (e.g., [22,51,52]). Due to the lack of treatment and high water consumption, almost half
(45%) of estimated global releases associated with domestic wastewater are from densely populated
regions draining to the North Indian and West Pacific oceans (Figure 2). The magnitude of Hg
discharged from WWTPs is related to the type and the amount of Hg containing products in the
waste stream. The phase out of many Hg containing products under the Minamata Convention could
thus substantially decrease WWTP-associated aquatic Hg releases in the future. Constantly improved
wastewater treatment practices are also expected to result in gradual decrease from this source, as
already seen in North America [52] and China [22].
Int. J. Environ. Res. Public Health 2017, 14, x 6 of 16
Figure 2. Release estimates of mercury (Hg) from various point source categories and by drainage
basins in 2010 (NFMP: Non-ferrous metal production; DWW: Domestic wastewater).
The overall magnitude of our release estimates is comparable with those obtained using
independent approaches and assumptions. Present day releases from commercial Hg to water
estimated by Horowitz et al. [7] are comparable to those estimated here, despite some minor
differences in the sectors included in each inventory. Our estimates for individual sectors are further
comparable with industry reports and other release estimates. For example, the OSPAR Commission
(the governing body for the Convention for the Protection of the Marine Environment of the
North-East Atlantic) reported 0.14 Mg of Hg released with waste water from 29 chlor-alkali plants
located within the OSPAR region in 2009 [53]. Applying this value to 39 chlor-alkali plants that were
using Hg cell technologies in the 27 EU Member States in 2010 [46] would result in an annual release
of 0.18 Mg from this sector. Similarly, the World Chlorine Council [54] reports 0.3–0.8 Mg·Hg·a−1
released to water globally in the 2002–2013 period. These estimates are comparable to the calculated
0.65 Mg·a−1 using the Toolkit approach. For the oil refining sector, a wide range of values for Hg
releases to water are reported for different regions in various databases/registers: for example, 0.03–
0.36 kg/facility in 2011 in Australia [55], 0.2–1.28 kg/facility in 2010 in Canada [56] and 645 kg from
17 mineral oil and gas refineries in Europe in 2010 [57]. Considering these ranges and applying a
rather conservative value of 0.5 kg·a−1 of Hg released from over 650 oil refineries globally [58] would
approximate to 0.3 Mg·a−1, which is comparable to the 0.6 Mg·a−1 using the Toolkit approach.
Artisanal and small-scale gold mining (ASGM), the largest source of anthropogenic Hg
emissions [18], is another important source of Hg also for aquatic systems, with severe environmental
impacts documented in many studies [29]. In Figure 3, we present the annual amount of Hg released
to local rivers, lakes, soils and tailings each year for countries with reported ASGM activities.
Information on the amounts released for an individual country is adopted from the most recent
inventory [18], reporting average ASGM releases to terrestrial systems (land and water) in 2010 at
880 Mg·a−1 globally (range, 500–1260 Mg·a−1). Low-high range for this estimate is derived based on
assumed Hg use and evaluation of the quality of the available information base for the various
countries [18]. These numbers suggest that ASGM can be considered as the single largest
anthropogenic source of Hg to aquatic systems on a global scale. This is due to both direct releases
associated with its current use as well as to remobilization of Hg historically accumulated in areas
where ASGM activities are/were conducted.

Int. J. Environ. Res. Public Health 2017, 14, x 7 of 16
Figure 3. Estimated releases of Hg from artisanal and small-scale gold mining (ASGM) to terrestrial
systems (land and water) and surface runoff class [30] for countries with known ASGM activities.
The proportion of Hg directly released to local aquatic systems and the amount later remobilized
from terrestrial ecosystems remains unknown. The latter depends on the hydrology of the mining
region. Studies investigating environmental fate of Hg used in historical gold mining
operations [59,60] suggest that a large proportion of the Hg has been remobilized over many years.
The actual hydrologic Hg load away from ASGM operation sites might be dominated by the
disturbance and mobilization of Hg rich sediment and floodplain soil during mining operations [61].
By classifying countries with ASGM activities according to climate zone, we find that many countries
with the highest ASGM activity and Hg releases are located in regions susceptible to soil erosion
(Figure 3). This includes Colombia, Indonesia, Philippines, Brazil, Guyana, Vietnam, Papua New
Guinea, French Guiana, Suriname and Malaysia. Together these countries contribute more than 36%
(~320 Mg·a−1) of global annual releases to terrestrial compartments from ASGM [18]. In some
countries such as Democratic Republic of Congo, Uganda, Rwanda, Tanzania, Kenya, Burundi, and
most other countries in the African Great Lakes Region, contaminated tailings are discharged directly
into waterways. Following Horowitz et al. [7], for subsequent calculations and comparisons we
assume 50% of total ASGM releases to terrestrial systems are released directly to water.
3.1.2. Background Terrestrial Releases
We estimate global present-day river discharge of 170 to 300 Mg·Hg·a−1 as a result of erosion and
runoff of Hg naturally present in soils or accumulated through atmospheric deposition. Low-high
ranges reflect uncertainty in Hg loads used to derive this estimate. Using a mean all-time enrichment
factor of two for terrestrial reservoirs [1], we estimate 50% of this is natural Hg. This natural
contribution is even smaller in some compartments of the terrestrial environment such are labile
organic soils [62]. Recent findings suggest an order of magnitude lower crustal abundance of Hg than
previously estimated [63]. However, using uniform basin-scale Hg yields we do not capture elevated
inputs in areas more prone to erosion or areas naturally enriched in Hg such as Hg mineral belts and
tectonically active areas. These local/regional inputs are not expected to have a substantial affect
globally. Our global estimate is lower than previous estimates that used different assumptions [10,18]
but similar to Mason [64], who used crustal material and river water relationships between Hg and
other elements (Na, Si) that have not been strongly impacted by anthropogenic activities to estimate
the prehistorical Hg river flux at 260 Mg·a−1. The AMAP/UNEP [18] study based their estimate
(320–960 Mg·a−1) on a range of background Hg concentrations in sediment (40 ± 20 ng·g−1) combined
with modeled sediment yield [34]. Amos et al. [10] estimated background releases (760 Mg·a−1) using
Hg measurements from Arctic rivers. While there is still considerable uncertainty in the estimate of
“background” terrestrial release, the independent estimates converge to suggest that this
“background” contribution is small relative to total present-day discharges of Hg from rivers
(2000–5500 Mg·a−1) [9,10].

Int. J. Environ. Res. Public Health 2017, 14, x 8 of 16
3.1.3. Remobilization of Hg from Contaminated Terrestrial Systems
We estimate the contribution of Hg to nearby aquatic systems from all contaminated sites at
44 Mg·a−1 (range, 13–76 Mg·a−1). The estimated range is based on the reported range of Hg loads from
areas where mining activities were conducted, and the magnitude and the spatial extent of
contamination surrounding industrial installations. Using this approach, the vast majority (97%) of
present-day releases is attributed to present and past Hg and Au mining, and only a minor share
originates from ore processing and other industrial sites. Contamination associated with current
industrial use of Hg is increasingly prevalent in Asia [18], while the majority of mining related
releases are associated with historic Hg and precious metals (Au and Ag) mining areas in both
Americas. Our Hg loads are adjusted to be representative for site-specific conditions using climate
zone [30] and modeled sediment yields [47], respectively. Consequently, the magnitude of calculated
loads depends mainly on local hydro-meteorological conditions and can vary from site to site by
several orders of magnitude. For example, estimated annual Hg releases vary from 5 g to over 10 kg
for NFMP sites and from less than 10 g to over 40 kg for locations using Hg as a catalyst, respectively.
This is supported by observations in contaminated catchments [41,42,65]. At all these sites Hg is
dispersed over large areas for which exact spatial distribution is unknown. The choice of the extent
of contamination used in our estimates is 10 km radius for mining and 3 km for other sites. A ± 50%
change in selected contamination extent would extend the bounds of the estimate to be between
3 and 150 Mg·a−1. While some of the contaminated systems discussed here might already be
remediated, there might be other sources and activities resulting in potential contamination of
surrounding environments. These are not considered here because of a lack of substantive
information about their distribution and magnitude.
3.1.4. Releases Associated with Land Management Practices
Land management practices can be responsible for enhanced mobility and release of Hg to water
from various diffuse sources. For example, practices used in forestry are known to cause increased
erosion and changed hydrological pathways and yield through the catchment soils, resulting in
increased transport of Hg [66–69]. These processes are even more pronounced when forest is
converted to agricultural land use, exposing the mineral soil horizon thus enhancing and accelerating
Hg leaching [70]. Soil Hg loss occurs rapidly after deforestation [71], and data suggest that
subsequent loss of the organic soil horizon is expected to mobilize 200–4600 μg·Hg·m−2 to Amazonian
rivers [72]. Accelerated erosion caused by deforestation may cause both a sudden elevated episodic
release of Hg associated with loss of organic soils, and enhanced erosion for many years [73]. These
processes are important in the Amazonian ecosystems where high levels of Hg are accumulated in
soils [38]. Studies have estimated these soils may release up to 3000 µg Hg m−2 per cm of soil
eroded [72]. Consistent with this assumption, Lacerda et al. [74] concluded that the remobilization of
Hg naturally present in forest soils during conversion of forest to other land uses, and not historic
ASGM mining, was responsible for relatively high Hg levels in these rivers. Globally, deforestation
is enhanced across the pan-tropical regions, where 9.5 million km2 of tropical forest was converted to
agricultural land [75]. If we adopt mobilization of 2000 μg·Hg·m−2 due to the loss of the organic
horizon as an average value globally [72] and considering the reported area deforested globally
(13 million ha·a−1 in the 2000s) [76], this would yield in 260 Mg·Hg·a−1 entering local freshwaters.
However, systematic catchment-scale studies in these areas are needed for reliable global
quantification of associated Hg releases.
Quantitatively assessing Hg releases from agricultural activities globally is not possible due to
data limitations. Intensively cultivated river basins are known to export more Hg than basins where
other land uses dominate (see [77,78]). Historically, Hg has been widely used in world agriculture
with application rates as high as 10–10000 g·Hg·ha−1 [79]. Although the use of mercurial compounds
is now banned in most countries, some use was reported to have occurred in some parts of the world
even over the past decade [80]. Use of sewage sludge as agricultural fertilizer can also spread large
amounts of Hg on agricultural lands [81]. For example, such applications were estimated to release
4.4 Mg·Hg·a−1 in the European Union [82]. Mercury can be leached from sewage sludge even more

Int. J. Environ. Res. Public Health 2017, 14, x 9 of 16
than a decade after its application [83]. Agricultural activities might be of particular concern because
in addition to natural runoff, leaching and transport of Hg to aquatic ecosystems is enhanced due to
large amounts of water used for irrigation purposes. Globally over 2500 km3·a−1 of water is used for
irrigation at over 200 × 106 ha with most of the irrigation areas located in India, China and in the
United States [84].
3.2. Freshwater Releases in the Context of Global Hg Cycle
In Table 1, we summarize global aquatic Hg release estimates for all the sources discussed above.
Global anthropogenic Hg discharges from primary anthropogenic sources and contaminated systems
sums to ~300–1300 Mg·Hg·a−1 (assuming 50% of total ASGM releases are released directly to water).
This suggests anthropogenic sources are at least comparable, if not several fold higher, to the global
flux of Hg into freshwater ecosystems from atmospheric deposition (300–600 Mg·a−1). The latter is
estimated from global atmospheric deposition to terrestrial surfaces (3000 Mg·a−1) [17] and by
assuming 10%–20% of total terrestrial deposition is typically released from catchments into rivers
[31,77,85].
Table 1. Summary of release estimates from various Hg sources to freshwater aquatic
environments globally.
Source Average (Range) Mg·a−1
Background terrestrial 230 (170–300)
Primary anthropogenic
- Point sources 220 (50–600)
- ASGM * 880 (500–1260)
Remobilization from contaminated
systems 40 (10–80)
* To both land and water; for comparisons with other inputs we assume 50% is released directly to water.
Compared to atmospheric Hg inputs, terrestrial sources discussed here are unevenly distributed
within catchments and can have more significant local impact. On a basin-wide scale, there are
substantial differences in magnitude and relative importance of individual sources. In Figure 4 and
Table S3, we compare average releases associated with background Hg and anthropogenic activities
(point sources, remobilization from contaminated systems and ASGM). Background Hg releases are
highest in areas where natural conditions favor soil erosion and sediment delivery. The most
important transporters are rivers draining Southeast Asia and high-standing islands of Oceania,
which also deliver 70% of the sediment discharge to the global ocean [86]. The most significant
present-day releases relative to background releases are in areas with the largest number of both
historic and present-day anthropogenic sources draining South and Southeast Asia and both
Americas. Some of these areas coincide with areas of high freshwater and sediment discharge. This
results in the predominant discharge of Hg from these regions to oceans globally, as established in
previous studies [8–10].

Int. J. Environ. Res. Public Health 2017, 14, x 10 of 16
Figure 4. Sum of release estimates associated with anthropogenic activities (point sources,
remobilization from contaminated systems and artisanal and small-scale gold mining ASGM) and
background Hg release estimates for individual drainage basin. In the case of the sum of
anthropogenic sources, we consider proportion of Hg released to land versus water in ASGM
operations to be 50%. All units are in Mg·a−1. For illustrative purpose we use log(x + 1) transformation
to draw the bars.
Once released to an aquatic system, the downstream fate of Hg remains largely unknown.
Important processes include sedimentation and remobilization of Hg previously deposited within
river systems. Retention behind various artificial impoundments can also play a significant role in
preventing Hg associated with river sediments from reaching coastal waters. For example, according
to Milliman and Farnsworth [86], the estimated reduction in sediment load due to reservoir
construction in the Mediterranean region is ~80%, and to a similar extent in Asia (~70% reduction for
China’s major rivers), and as Hg is mostly transported as particulate these changes will have
markedly impacted Hg dynamics in coastal and shelf regions [87]. Due to substantial Hg transport
by Asian rivers [10,16], the majority of Hg retention by impoundments is expected to occur in basins
draining to northern Indian and western Pacific seas.
Accumulation of Hg carried by rivers can also be important in endorheic regions, which cover
10% of the surface of continents [88]. A known example is Lake Ontario within the Laurentian Great
Lakes, where Hg contamination is a result of historical loadings from industrial activities in the
drainage area in combination with enhanced atmospheric deposition [89,90]. Our estimates suggest
~20 Mg·a−1 of Hg from anthropogenic point sources (ASGM not included) is released to such closed
basins globally. On the other hand, some industries located near the coast and discharging Hg
directly to coastal waters can also be important locally (e.g. [91,92]).
We further compare our estimated Hg releases to freshwaters with the amount of Hg reaching
coastal margins. Summing all Hg discharges discussed in this work (Table 1; total ~500–1600 Mg·a−1,
assuming 50% of total ASGM releases are released directly to water) with Hg supplied as a result of
runoff from atmospheric deposition (300–600 Mg·Hg·a−1), results in total of ~800–2200 Mg·Hg·a−1
entering freshwater systems. This input is lower than the amount of Hg entering global coastal
margins estimated from a review of measured concentrations in river waters by Amos et al. [10]
(5500 ± 2700 Mg·a−1). This difference cannot be explained by submarine groundwater discharge (SGD)
only, which were estimated previously to be <800 Mg·a−1 [93]. Earlier estimates of inputs to coastal
margins are more comparable (1000–2700 Mg·a−1) [8,9]. We postulate that differences among
estimates reflect temporal lags in Hg releases through watersheds and that much of load presently
discharged to ocean margins is legacy Hg. Although the estimates are not directly comparable, a large
gap between the estimates outside the full uncertainty range of each indicates (i) the need for future
research to identify the potential missing sources of Hg to rivers currently not quantified/accounted
for in this analysis (e.g., urban runoff [94], coal mining and washing, water use in coal-fired power
plants [22], various land management activities etc.), (ii) the need to further account for the

Int. J. Environ. Res. Public Health 2017, 14, x 11 of 16
complexity of Hg distribution within both terrestrial and freshwater systems (including
deposition/remobilization patterns) all the way from its source to its ultimate discharge to coastal
margins, and (iii) to additional monitoring data with better spatial coverage on present-day Hg
discharges from rivers to ocean margins.
4. Conclusions
We present here an important first step towards the assessment of global Hg releases to
freshwater aquatic environments. Quantitative inventories are a prerequisite for discussion of the
fate and transport of Hg and amounts converted into the bioaccumulative species, methylmercury.
Although freshwaters addressed here represent only a minor share of the global water budget, the
contributions of Hg to these environments is of great importance because of their relevance for
human and ecological exposures. This knowledge is important for investigation of ecosystem
responses to changes in Hg loads [95], particularly in ecosystems susceptible to Hg methylation and
bioaccumulation [96–98]. However, insufficient data and unquantifiable sources drive large
uncertainty in the estimates in our inventory. In the case of current primary anthropogenic Hg
sources, the UNEP Toolkit approach used here has the potential to underestimate the releases to
water. These unaccounted-for releases might be associated with activities where air emissions are
insignificant and thus there are no corresponding emissions included in the air emissions inventory.
Moreover, there are significant uncertainties related to the validity and utility of the Toolkit
distribution factors. In the case of remobilization of Hg from contaminated systems, releases from
this category might be underestimated, as there are numerous areas globally where Hg is/was used
in various products and processes (e.g., pulp and paper mills, paint, lamps, batteries and explosive
production, etc.) and for which locations and the extent of contamination are unknown. Similarly,
important sectors like Hg releases associated with land management practices and other diffuse
sources are presently understudied. In order to improve the estimates presented here, a systematic
and harmonized monitoring as well as reporting of Hg releases is needed. This is especially critical
for diffuse releases associated with legacy Hg, as these releases are much harder to predict. Therefore,
we suggest expanding current observing systems that are global in nature (e.g., Global Mercury
Observation System [99]) to focus on freshwater inputs in addition to their current focus on
atmospheric sources.
Supplementary Materials: The following are available online at www.mdpi.com/link, Figure S1: Schematic
approach for calculation and distribution of aquatic Hg release estimates from the atmospheric Hg emission
inventory, Table S1: Values used to derive aquatic Hg release estimates from the atmospheric Hg emission
inventory, Table S2: Summary of data used to derive estimates discussed in the manuscript, Table S3: Release
estimates (Mg·a−1) from various Hg sources to individual drainage basin.
Acknowledgments: Financial support from the state budget by the Slovenian Research Agency (P1-0143 and
L2-6778), UNEP Mercury Programme and EU FP7 project GMOS is acknowledged. We thank William Rankin
for providing global drainage basins map.
Author Contributions: David Kocman, Simon J. Wilson, Peter Outridge and Milena Horvat conceived and
designed the approach. Kevin H. Telmer compiled ASGM data and relevant literature. David Kocman and
Frits Steenhuisen performed spatial analyses. Helen M. Amos, Elsie M. Sunderland and Robert P. Mason
contributed to the discussion of approaches used and interpretation of findings. All authors contributed to the
writing of the paper.
Conflicts of Interest: The authors declare no conflict of interest.
References
1. Amos, H.M.; Jacob, D.J.; Streets, D.G.; Sunderland, E.M. Legacy impacts of all-time anthropogenic
emissions on the global mercury cycle. Glob. Biogeochem. Cycles 2013, 27, 410–421.
2. Amos, H.M.; Sonke, J.E.; Obrist D.; Robins, N.; Hagan, N.; Horowitz, H.M.; Mason, R.P.; Witt, M.;
Hedgecock, I.M., Corbit, E.S.; et al. Observational and Modeling Constraints on Global Anthropogenic
Enrichment of Mercury. Environ. Sci. Technol. 2015, 49, 4036–4047.

Int. J. Environ. Res. Public Health 2017, 14, x 12 of 16
3. Hsu-Kim, H.; Kucharzyk, K.H.; Zhang, T.; Deshusses, M.A. Mechanisms Regulating Mercury
Bioavailability for Methylating Microorganisms in the Aquatic Environment: A Critical Review. Environ.
Sci. Technol. 2013, 47, 2441–2456.
4. Pacyna, E.G.; Pacyna, J.M.; Sundseth, K.; Munthe, J.; Kindbom, K.; Wilson, S.; Steenhuisen, F.; Maxson, P.
Global emission of mercury to the atmosphere from anthropogenic sources in 2005 and projections to 2020.
Atmos. Environ. 2010, 44, 2487–2499.
5. Pirrone, N.; Cinnirella, S.; Feng, X.; Finkelman, R.B.; Friedli, H.T.; Leaner, J.; Mason, R.; Mukherjee, A.B.;.
Stracher, G.B.; Streets, D.G.; et al. Global mercury emissions to the atmosphere from anthropogenic and
natural sources. Atmos. Chem. Phys. 2010, 10, 5951–5964.
6. Streets, D.G.; Devane, M.K.; Lu, Z.F.; Bond, T.C.; Sunderland, E.M.; Jacob, D.J. All-time releases of mercury
to the atmosphere from human activities. Environ. Sci. Technol. 2011, 45, 10485–10491.
7. Horowitz, H.M.; Jacob, D.J.; Amos, H.M.; Streets, D.G.; Sunderland, E.M. Historical Mercury Releases from
Commercial Products: Global Environmental Implications. Environ. Sci. Technol. 2014, 48, 10242–10250.
8. Cossa, D.; Coquery, M.; Gobeil, C.; Martin, J.M. Mercury Fluxes at the Ocean Margins. In Global and Regional
Mercury Cycles: Sources, Fluxes and Mass Balances; Baeyens, W., Ebinghaus, R., Vasiliev, O., Eds.; Springer:
Dordrecht, The Netherlands, 1996; pp. 229–247.
9. Sunderland, E.M.; Mason, R. Human impacts on open ocean mercury concentrations. Glob. Biogeochem.
Cycles 2007, 21, doi:10.1029/2006GB002876.
10. Amos, H.M.; Jacob, D.J.; Kocman, D.; Horowitz, H.M.; Zhang, Y.; Dutkiewicz, S.; Horvat, M.; Corbitt, E.S.;
Krabbenhoft, D.P.; Sunderland. E.M. Global Biogeochemical Implications of Mercury Discharges from
Rivers and Sediment Burial. Environ. Sci. Technol. 2014, 48, 9514–9522.
11. Kocman, D.; Horvat, M.; Pirrone, N.; Cinnirella, S. Contribution of contaminated sites to the global mercury
budget. Environ. Res. 2013, 125, 160–170.
12. Driscoll, C.T.; Mason, R.P.; Chan, H.M.; Jacob, D.J.; Pirrone, N. Mercury as a Global Pollutant: Sources,
Pathways, and Effects. Environ. Sci. Technol. 2013, 47, 4967–4983.
13. Barringer, J.L.; Szabo, Z.; Reilly, P.M. Occurrence and Mobility of Mercury in Groundwater. In Current
Perspectives in Contaminant Hydrology and Water Resources Sustainability; InTech: Rijeka, Croatia, 2013;
pp. 117–149.
14. Horvat, M.; Covelli, S.; Faganeli, J.; Logar, M.; Mandič, V.; Rajar, R.; Širca, A.; Žagar, D. Mercury in
contaminated coastal environments, a case study: The Gulf of Trieste. Sci. Total Environ. 1999, 238, 43–56.
15. Carroll, R.W.H.; Warwick, J.J.; James, A.I.; Miller, J.R. Modeling erosion and overbank deposition during
extreme flood conditions on the Carson River, Nevada. J. Hydrol. 2004, 297, 1–21.
16. Liu, M.; Chen, L.; Wang, X.; Zhang, W.; Tong, Y.; Ou, L.; Xie, H.; Shen, H.; Ye, X.; Deng, C.; et al. Mercury
Export from Mainland China to Adjacent Seas and Its Influence on the Marine Mercury Balance. Environ.
Sci. Technol. 2016, 50, 6224−6232.
17. Holmes, C.D.; Jacob, D.J.; Corbitt, E.S.; Mao, J.; Yang, X.; Talbot, R.; Slemr, F. Global atmospheric model for
mercury including oxidation by bromine atoms. Atmos. Chem. Phys. 2010, 10, 12037–12057.
18. AMAP/UNEP. Technical Background Report for the Global Mercury Assessment 2013; Arctic Monitoring and
Assessment Program: Oslo, Norway; UNEP Chemicals Branch: Geneva, Switzerland, 2013.
19. UNEP. Toolkit for Identification and Quantification of Mercury Sources, Guideline for Inventory Level 1, version
1.2; UNEP Chemicals Branch: Geneva, Switzerland, 2013.
20. UNEP. Toolkit for Identification and Quantification of Mercury Sources, Reference Report and Guideline for
Inventory Level 2, version 1.2; UNEP Chemicals Branch: Geneva, Switzerland, 2013; 328p.
21. Steenhuisen, F.; Wilson, S. Identifying and characterizing major emission point sources as a basis for
geospatial distribution of mercury emissions inventories. Atmos. Environ. 2015, 112, 167–177.
22. Liu, M.; Zhang, W.; Wang, X.; Chen, L.; Wang, H.; Luo, Y.; Zhang, H.; Shen, H.; Tong, Y.; Ou, L.; et al.
Mercury Release to Aquatic Environments from Anthropogenic Sources in China from 2001 to 2012.
Environ. Sci. Technol. 2016, 50, 8169–8177.
23. GWSP. Digital Water Atlas, Map 46: Domestic Water Use (V1.0). Available online: http://atlas.gwsp.org
(accessed on 30 January 2017).
24. UNEP. The State of the Marine Environment—Trends and Processes; United Nations Environment Programme
and the Global Programme of Action for the Protection of the Marine Environment from Land-based
Activities (GPA) of the United Nations Environment Programme (UNEP); UNEP/GPA Coordination
Office: The Hague, Netherlands, 2006.

Int. J. Environ. Res. Public Health 2017, 14, x 13 of 16
25. Sato, T.; Qadir, M.; Yamamoto, S.; Endo, T.; Zahoor, A. Global, regional, and country level need for data on
wastewater generation, treatment, and use. Agric. Water Manag. 2013, 130, 1–13.
26. Mugan, T.J. Quantification of total mercury discharges from publicly owned treatment works to Wisconsin
surface waters. Water Environ. Res. 1996, 68, 229–234.
27. Balogh, S.J.; Nollet, Y.H. Mercury mass balance at a wastewater treatment plant employing sludge
incineration with offgas mercury control. Sci. Total Environ. 2008, 389, 125–131.
28. Dean, J.D.; Mason, R. Estimation of Mercury Bioaccumulation Potential from Wastewater Treatment Plants in
Receiving Waters: Phase 1; WERF Report 05-WEM-1CO; IWA Publishing: London, UK, 2009.
29. Telmer, K.H.; Veiga, M.M. World emissions of mercury from artisanal and small scale gold mining. In
Mercury Fate and Transport in the Global Atmosphere: Emissions, Measurements and Models; Mason, R., Pirrone,
N., Eds.; Springer: New York, NY, USA, 2009; pp. 131–172.
30. Fekete, B.M.; Vörösmarty, C.J.; Grabs, W. Global Composite Runoff Fields Based on Observed River Discharge
and Simulated Water Balances; UNH/GRDC Composite Runoff Fields v1.0; Complex Systems Research
Center, University of New Hampshire: Durham, NH, USA, 2000.
31. Grigal, D.F. Inputs and outputs of mercury from terrestrial watersheds: A review. Environ. Rev. 2002, 10, 1–39.
32. Brigham, M.E.; Wentz, D.A; Aiken, G.R.; Krabbenhoft, D.P. Mercury Cycling in Stream Ecosystems. 1.
Water Column Chemistry and Transport. Environ. Sci. Technol. 2009, 43, 2720–2725.
33. Schuster, P.F.; Striegl, R.G.; Aiken, G.R.; Krabbenhoft, D.P.; Dewild, J.F.; Butler, K.; Kamark, B.; Dornblaser,
M. Mercury Export from the Yukon River Basin and Potential Response to a Changing Climate. Environ.
Sci. Technol. 2011, 45, 9262–9267.
34. Ludwig, W.; Amiotte-Suchet, P.; Probst, J.L. ISLSCP Initiative II Collection. Data Set. In ISLSCP II Global
River Fluxes of Carbon and Sediments to the Ocean; Hall, F.G., Collatz, G., Meeson, B., Los, S., Brown de
Colstoun, E., Landis, D., Eds.; Oak Ridge National Laboratory Distributed Active Archive Center: Oak
Ridge, TN, USA, 2011.
35. USGS. Mineral Resources Data System; US Geological Survey: Reston, VA, USA, 2005. Available online:
http://mrdata.usgs.gov/mrds (accessed on 30 January 2017).
36. Gosselin, P; Dube, B. Gold Deposits of the World: Distribution, Geological Parameters and Gold Content; Open
File 4895; Geological Survey of Canada: Quebec City, QC, Canada, 2005.
37. Selin, N.E.; Jacob, D.J.; Yantosca, R.M.; Strode, S.; Jaeglé, L.; Sunderland, E.M. Global 3-D land-ocean-
atmosphere model for mercury: Present-day versus preindustrial cycles and anthropogenic enrichment
factors for deposition. Glob. Biogeochem. Cycles 2008, 22, doi:10.1029/2008GB003282.
38. Lacerda, L.D.; de Souza, M.; Ribeiro, M.G. The effects of land use change on mercury distribution in soils
of Alta Floresta, Southern Amazon. Environ. Pollut. 2004, 129, 247–255.
39. Millán, R.; Gamarra, R.; Schmid, T.; Sierra, M.J.; Quejido, A.J.; Sánchez, D.M.; Cardona, A.I.; Fernández, M.;
Vera, R. Mercury content in vegetation and soils of the Almadén mining area (Spain). Sci. Total Environ.
2006, 368, 79–87.
40. Tomiyasu, T.; Matsuyama, A.; Imura, R.; Kodamatani, H.; Miyamoto, J.; Kono, Y.; Kocman, D.; Kotnik, J.;
Fajon, V.; Horvat, M. The distribution of total and methylmercury concentrations in soils near the Idrija
mercury mine, Slovenia, and the dependence of the mercury concentrations on the chemical composition
and organic carbon levels of the soil. Environ. Earth Sci. 2012, 65, 1309–1322.
41. Dai, Z.H.; Feng, X.B.; Zhang, C.; Shang, L.H.; Qiu, G.L. Assessment of mercury erosion by surface water in
Wanshan mercury mining area. Environ. Res. 2013, 125, 2–11.
42. Tetra Tech. Guadalupe River Watershed Mercury TMDL Project; Final Conceptual Model; Prepared for San
Francisco Bay Regional Water Quality Control Board: Lafayette, CA, USA, 2005.
43. Feng, X.; Qiu, G. Mercury pollution in Guizhou, Southwestern China—An overview. Sci. Total Environ.
2008, 400, 227–237.
44. Trip, L.; Thorleifson, M. The Canadian Mercury Cell Chlor-alkali Industry: Mercury Emissions and Status of
Facilities 1935–1996; Report to Transboundary Air Issues Branch; Environment Canada: Hull, QC, Canada, 1998.
45. Mahan, S.; Savitz, J. Cleaning up: Taking Mercury-Free Chlorine Production to the Bank; Oceana: Washington,
DC, USA, 2007.
46. UNEP. Global Estimate of Global Mercury Cell Chlorine Capacity for 2010. Available online:
http://web.unep.org/chemicalsandwaste/global-mercury-partnership/mercury-reduction-chlor-alkali-
sector/reports-and-publications (accessed on 30 January 2017).

Int. J. Environ. Res. Public Health 2017, 14, x 14 of 16
47. Ludwig, W.; Amiotte-Suchet, P.; Probst, J.L. ISLSCP Initiative II Collection. Data set. In ISLSCP II
Atmospheric Carbon Dioxide Consumption by Continental Erosion; Hall, F.G., Collatz, G., Meeson, B., Los, S.,
Brown de Colstoun, E., Landis, D., Eds.; Oak Ridge National Laboratory Distributed Active Archive Center:
Oak Ridge, TN, USA, 2011.
48. Biester, H.; Muller, G.; Scholer, H.F. Estimating distribution and retention of mercury in three different
soils contaminated by emissions from chlor-alkali plants: Part I. Sci. Total Environ. 2002, 284, 177–189.
49. Sterckeman, T.; Douay, F.; Proix, N.; Fourrier, H.; Perdrix, E. Assessment of the contamination of cultivated
soils by eighteen trace elements around smelters in the North of France. Water Air Soil Pollut. 2002, 135,
173–194.
50. Li, G.H.; Feng, X.B.; Qiu, G.L.; Bi, X.Y.; Li, Z.G.; Zhang, C.; Wang, D.Y.; Shang, L.H.; Guo, Y.N.
Environmental mercury contamination of an artisanal zinc smelting area in Weining County, Guizhou,
China. Environ. Pollut. 2008, 154, 21–31.
51. Crawford, D.W.; Bonnevie, N.L.; Wenning R.J. Sources of Pollution and Sediment Contamination in
Newark Bay, New-Jersey. Ecotoxicol. Environ. Saf. 1995, 30, 85–100.
52. Sunderland, E.M.; Amirbahman, A.; Burgess, N.M.; Dalziel, J.; Harding, G.; Jones, S.H.; Kamai, E.; Karagas,
M.R., Shi, X.; Chen, C.Y. Mercury sources and fate in the Gulf of Maine. Environ. Res. 2012, 119, 27–41.
53. OSPAR. Mercury Losses from the Chlor-alkali Industry in 2009, Including an Assessment of 2008 and 2009 Data
and Trends; OSPAR Commission: London, UK, 2011.
54. WCC. World Chlorine Council Report to UNEP on Chlor-Alkali Partnership—Data 2013. Available online:
http://web.unep.org/chemicalsandwaste/global-mercury-partnership/mercury-reduction-chlor-alkali-
sector/reports-and-publications (accessed on 30 January 2017).
55. ANPI. Australian National Pollution Inventory. Available online: www.npi.gov.au (accessed on 30 January
2017).
56. NPRI. National Pollution Release Inventory. Available online: www.ec.gc.ca/inrp-npri (accessed on 30
January 2017).
57. E-PRTR. European Pollutant Release and Transfer Register. Available online: http://prtr.ec.europa.eu
(accessed on 30 January 2017).
58. OGJ. Oil & Gas Journal 2006 Worldwide Refining Survey. Available online:
http://bbs.keyhole.com/ubb/showthreaded.php/Cat/0/Number/1197575/page (accessed on 30 January
2017).
59. Winch, S.; Fortin, D.; Lean; D.R.S.; Parsons, M. Factors affecting methylmercury levels in surficial tailings
from historical Nova Scotia gold mines. Geomicrobiol. J. 2008, 25, 112–129.
60. Parsons, M.B.; Hall, G.E.M.; Dalziel, J.; Tordon, R.; Winch, S.; Doe, K.G.; Mroz, M.; Palace, V.P.
Environmental impacts of historical mercury amalgamation at gold mines in Halifax, Nova Scotia, Canada.
In Proceedings of the 10th International Conference on Mercury as a Pollutant, Halifax, NS, Canada, 25
July 2011.
61. Telmer, K.; Costa, M.; Simões Angélica, R.; Araujo, E.S.; Maurice, Y. The source and fate of sediment and
mercury in the Tapajós River, Pará, Brazilian Amazon: Ground- and space-based evidence. J. Environ.
Manag. 2006, 81, 101–113.
62. Smith-Downey, N.V.; Sunderland, E.M.; Jacob, D.J. Anthropogenic impacts on global storage and
emissions of mercury from terrestrial soils: Insights from a new global model. J. Geophys. Res. Atmos. 2010,
115, G03008.
63. Canil, D.; Crockford, P.W.; Rossin, R.; Telmer, K. Mercury in some arc crustal rocks and mantle peridotites
and relevance to the moderately volatile element budget of the Earth. Chem. Geol. 2015, 396, 134–142.
64. Mason, R. Mercury and Lead. In Still Only One Earth; Harrison, R., Hester, R., Eds.; Issues in Environmental
Science and Technology; Royal Society of Chemistry: London, UK, 2015; Volume 40, pp. 107–149.
65. Hissler, C.; Probst, J.L. Chlor-alkali industrial contamination and riverine transport of mercury:
Distribution and partitioning of mercury between water, suspended matter, and bottom sediment of the
Thur River, France. Appl. Geochem. 2006, 21, 1837–1854.
66. Bishop, K.; Allan, C.; Bringmark, L.; Garcia, E.; Hellsten, S.; Hogbom, L.; Johansson, K.; Lomander, A.;
Meili, M.; Munthe, J.; et al. The Effects of Forestry on Hg Bioaccumulation in Nemoral/Boreal Waters and
Recommendations for Good Silvicultural Practice. Ambio 2009, 38, 373–380.
Int. J. Environ. Res. Public Health 2017, 14, x 15 of 16
67. Sorensen, R.; Meili, M.; Lambertsson, L.; von Bromssen, C.; Bishop, K. The Effects of Forest Harvest
Operations on Mercury and Methylmercury in Two Boreal Streams: Relatively Small Changes in the First
Two Years prior to Site Preparation. Ambio 2009, 38, 364–372.
68. Shanley, J.B.; Bishop, K. Mercury cycling in terrestrial watersheds. In Mercury in the Environment: Pattern
and Process; Bank, M.B., Ed.; University of California Press: Berkeley, CA, USA, 2012; pp. 119–142.
69. Eklof, K.; Schelker, J.; Sorensen, R.; Meili, M.; Laudon, H.; von Bromssen, C.; Bishop, K. Impact of Forestry
on Total and Methyl-Mercury in Surface Waters: Distinguishing Effects of Logging and Site Preparation.
Environ. Sci. Technol. 2014, 48, 4690–4698.
70. Mainville, N.; Webb, J.; Lucotte, M.; Davidson, R.; Betancourt, O.; Cueva, E.; Mergler, D. Decrease of soil
fertility and release of mercury following deforestation in the Andean Amazon, Napo River Valley,
Ecuador. Sci. Total Environ. 2006, 368, 88–98.
71. Beliveau, A.; Lucotte, M.; Davidson, R.; Lopes, L.O.D.; Paquet, S. Early Hg mobility in cultivated tropical
soils one year after slash-and-burn of the primary forest, in the Brazilian Amazon. Sci. Total Environ. 2009,
407, 4480–4489.
72. Roulet, M.; Lucotte, M.; Farella, N.; Serique, G.; Coelho, H.; Passos, C.J.S.; da Silva, E.D.; de Andrade, P.S.;
Mergler, D.; Guimaraes, J.R.D.; et al. Effects of recent human colonization on the presence of mercury in
Amazonian ecosystems. Water Air Soil Pollut. 1999, 112, 297–313.
73. Shaoshan, A.Z.; Zhang, F.; Van Pelt, S.; Hamer, U.; Makeschin, F. Soil quality degradation processes along
a deforestation chronosequence in the Ziwuling area, China. Catena 2008, 75, 248–256.
74. Lacerda, L.D.; Bastos, W.R.; Almeida, M.D. The impacts of land use changes in the mercury flux in the
Madeira River, Western Amazon. An. Acad. Bras. Cienc. 2012, 84, 69–78.
75. GWSP. Digital Water Atlas, Map 52: Change in Discharge due to Deforestation (V1.0). Available online:
http://atlas.gwsp.org (accessed on 30 January 2017).
76. FAO. Global Forest Resources Assessment 2010; Food and Agriculture Organisation of the United Nations:
Rome, Italy, 2010; p. 340.
77. Balogh, S.J.; Meyer, M.; Land, D.; Johnson, K. Transport of mercury in three contrasting river basins.
Environ. Sci. Technol. 1998, 32, 456–462.
78. Balogh, S.; Meyer, M.; Johnson, K. Diffuse and point source mercury inputs to the Mississippi, Minnesota,
and St. Croix Rivers. Sci. Total Environ. 1998, 231, 109–113.
79. Smart, N.A. Use and residues of mercury compounds in agriculture. In Residue Reviews/Rückstands-Berichte;
Gunther, F., Eds.; Springer, New York, NY, USA, 1968; Volume 23, pp. 1–36.
80. WHO. Children’s Exposure to Mercury Compounds; WHO Document Production Services: Geneva,
Switzerland, 2010; p. 104.
81. Milieu. Environmental, Economic and Social Impacts of the Use of Sewage Sludge on Land. Part I: Overview Report;
Report prepared for the European Commission under Study Contract DG ENV.G.4/ETU/2008/0076r;
Milieu: Brussels, Belgium, 2010; p. 16.
82. BIO Intelligence Service. Study on the Potential for Reducing Mercury Pollution from Dental Amalgam and
Batteries; Final Report Prepared for the European Commission–DG ENV; BIO Intelligence Service: Paris,
France, 2012; p. 245.
83. McBride, M.B.; Richards, B.K., Steenhuis, T.; Spiers, G. Long-term leaching of trace elements in a heavily
sludge-amended silty clay loam soil. Soil Sci. 1999, 164, 613–623.
84. Siebert, S.; Döll, P. Irrigation water use—A global perspective. In Global Change: Enough Water for all?
Lozán, J.L., Graßl, H., Hupfer, P., Menzel, L., Schönwiese, C.D., Eds.; Universität Hamburg: Hamburg,
Germany, 2007; pp. 104–107.
85. Lawson, N.M.; Mason, R.P. Concentration of mercury, methylmercury, cadmium, lead, arsenic, and
selenium in the rain and stream water of two contrasting watersheds in Western Maryland. Water Res. 2001,
35, 4039–4052.
86. Milliman, J.D.; Farnsworth, K.L. River Discharge to the Coastal Ocean: A Global Synthesis; Cambridge
University Press: Cambridge, UK, 2011; p. 384.
87. Zhang, Y.; Jacob, D.J.; Dutkiewicz, S.; Amos, H.M.; Long, M.S.; Sunderland, E.M. Biogeochemical drivers
of the fate of riverine mercury discharged to the global and Arctic oceans. Glob. Biogeochem. Cycles 2015, 29,
854–864.
88. Feller, M.C. Deforestation and nutrient loading to fresh waters. In River Ecosystem Ecology: A Global
Perspective; Likens, G.E., Ed.; Academic Press: New York, NY, USA, 2010; pp. 221–291.
Int. J. Environ. Res. Public Health 2017, 14, x 16 of 16
89. Marvin, C.; Painter, S.; Rossmann, R. Spatial and temporal patterns in mercury contamination in sediments
of the Laurentian Great Lakes. Environ. Res. 2004, 95, 351–362.
90. Wiener, J.G.; Evers, D.C.; Gay, D.A.; Morrison, H.A.; Williams, K.A. Mercury contamination in the
Laurentian Great Lakes region: Introduction and overview. Environ. Pollut. 2012, 161, 243–251.
91. Bloom, N.S.; Gill, G.A.; Cappellino, S.; Dobbs, C.; McShea, L.; Driscoll, C.; Mason, R.; Rudd, J. Speciation
and cycling of mercury in Lavaca Bay, Texas, sediments. Environ. Sci. Technol. 1999, 33, 7–13.
92. Tomiyasu, T.; Matsuyama, A.; Eguchi, T.; Fuchigami, Y.; Oki, K.; Horvat, M.; Rajar, R.; Akagi, H. Spatial
variations of mercury in sediment of Minamata Bay, Japan. Sci. Total Environ. 2006, 368, 283–290.
93. Mason, R.P.; Choi, A.L.; Fitzgerald, W.F.; Hammerschmidt, C.R.; Lamborg, C.H.; Soerensen, A.L.; Sunderland,
E.M. Mercury biogeochemical cycling in the ocean and policy implications. Environ. Res. 2012, 119, 101–117.
94. Eckley, C.S.; Branfireun, B. Mercury mobilization in urban stormwater runoff. Sci. Total Environ. 2008, 403,
164–177.
95. Knightes, S.D.; Sunderland, E.M.; Craig Barber, M.; Johnston, J.M.; Ambrose, R.B. Application of
ecosystem-scale fate and bioaccumulation models to predict fish mercury response times to changes in
atmospheric deposition. Environ. Toxicol. Chem. 2009, 28, 881–893.
96. Driscoll, C.T.; Han, Y.J.; Chen, C.Y.; Evers, D.C.; Lambert, K.F.; Holsen, T.M.; Kamman, N.C.; Munson, R.K.
Mercury contamination in forest and freshwater ecosystems in the Northeastern United States. Bioscience
2007, 57, 17–28.
97. Harris, R.; Krabbenhoft, D.P.; Mason, R.; Murray, M.W.; Reash, R.; Saltman, T. Ecosystem Responses to
Mercury Contamination: Indicators of Change; CRC Press: Boca Raton, FL, USA, 2007.
98. Munthe, J.; Bodaly, R.A.; Branfireun, B.A.; Driscoll, C.T.; Gilmour, C.C.; Harris, R.; Horvat, M.; Lucotte, M.;
Malm, O. Recovery of mercury-contaminated fisheries. Ambio 2007, 36, 33–44.
99. GMOS. Global Mercury Observation System. Available online: www.gmos.eu (accessed on 30 January
2017).
© 2017 by the authors. Submitted for possible open access publication under the
terms and conditions of the Creative Commons Attribution (CC-BY) license
(http://creativecommons.org/licenses/by/4.0/).