toward an effective interaction potential model for … report number 2008-1 venkata suresh...
TRANSCRIPT
AEM Report Number 2008-1
Venkata Suresh Guthikonda · Ryan S. Elliott
Toward an Effective Interaction Potential Model forthe Shape Memory Alloy AuCd
April 2, 2008
Abstract The unusual properties of Shape Memory Alloys (SMAs) result from a lattice level Marten-sitic Transformation (MT) corresponding to an instability of the SMAs crystal structure. Currently,there exists a shortage of material models that can capture the details of lattice level MTs occurringin SMAs and that can be used for efficient computational investigations of the interaction betweenMTs and larger-scale features found in typical materials. These larger-scale features could includeprecipitates, dislocation networks, voids, and even cracks. In this paper, one such model is developedfor the SMA AuCd. The model is based on Effective Interaction Potentials (EIPs). That is, atomicinteraction potentials that are explicit functions of temperature. In particular, the Morse pair potentialis used and its adjustable coefficients are taken to be temperature dependent. A fitting procedure isdeveloped for the EIPs that matches, at a suitable reference temperature, the lattice parameters, in-stantaneous bulk moduli, thermal expansion coefficients, and heat capacities of FCC Au, HCP Cd, andthe B2 cubic austenite phase of the Au-47.5at%Cd alloy. The resulting model is explored using branch-following and bifurcation techniques. A hysteretic temperature-induced MT between the B2 cubic andB19 orthorhombic crystal structures is predicted. The predicted MT is found to have characteristicsthat compare quite well with the experimentally observed behavior of AuCd SMAs. Unfortunately, themodel exhibits an unphysical negative thermal expansion at high temperatures.
Keywords Shape Memory Alloys · Martensitic Transformations · Morse Potential · Materialstability · Effective Interaction Potentials · AuCd
PACS 81.30.Kf · 81.30.Hd · 64.60.Cn · 64.70.Kd
1 Introduction
Shape memory alloys (SMAs) are special alloys that exhibit the shape memory effect and pseudo-elasticity. These peculiar properties are the result of solid-to-solid diffusionless phase transformationsthat occur in the material. These transformations are called martensitic transformations (MTs) andinvolve the coordinated motion of atoms in the crystal as the material’s structure transitions fromone lattice type to another. MTs can be temperature- or stress-induced. The high temperature phaseis usually of high symmetry and is called austenite and the low temperature phase is usually of lowsymmetry and is called martensite.
The first SMA discovered was AuCd. Olander (1932) used electrochemical techniques to identifythe B2 cubic (austenite) phase and the B19 orthorhombic (martensite) phase of AuCd. Further, he wasthe first to recognize its peculiar (i.e., SMA) behavior. Later, Bystrom and Almin (1947) performed an
Venkata Suresh Guthikonda · Ryan S. ElliottDepartment of Aerospace Engineering and Mechanics, The University of Minnesota,Minneapolis, MN 55455, USAE-mail: [email protected]
2 Venkata Suresh Guthikonda, Ryan S. Elliott
X-ray investigation and found the different phases of the AuCd alloy for different compositions. TheSMA properties of Au-47.5at%Cd were identified by Chang and Read (1951) using an X-ray analysisof the orientation relationships, electrical resistivity measurements, and motion picture studies of themovement of boundaries between the two phases during phase transformation. From the observationsof this experiment, it was concluded that Au-47.5at%Cd undergoes a diffusionless transformation froma high symmetry B2 cubic structure to a low symmetry B19 orthorhombic structure when it is cooledto about 60 ◦C. The reverse transformation occurs from the B19 structure to the B2 structure at 80 ◦Cas the alloy is heated (Chang and Read , 1951). The same researchers found the lattice parameters ofAu-47.5at%Cd to be: a = 3.3165 A for the B2 cubic structure and a = 3.1476 A, b = 4.7549 A, andc = 4.8546 A for the B19 orthorhombic structure.
Various models have been presented in the literature to simulate the behavior of SMAs. Thesemodels can be broadly categorized as continuum mechanics based models, quantum mechanics basedDensity Functional Theory (DFT) models, and phenomenological atomistic models.
Continuum mechanics based models can be divided into phenomenological and micromechanicaltype models. Phenomenological models usually consist of a mechanical law to govern the stress-strainbehavior and a kinetic law to govern the crystallographic transformation (Tanaka and Nagaki , 1982;Liang and Rogers , 1990; Brinson, 1993; Ivshin and Pence, 1994). The mechanical part of the modelplays a less significant role and the particular kinetic law distinguishes these models (Brinson andHuang, 1996). Micromechanics based models take account of varying amounts of the crystallographicsymmetry of SMAs and use the laws of thermodynamics to describe the transformation behavior(Patoor et al., 1988, 1993; Sun and Hwang , 1993a,b; Goo and Lexcellent , 1997; Lu and Weng, 1997;Huang and Brinson, 1998; Vivet and Lexcellent , 1998; Shaw , 2002; Guthikonda et al., 2008). Thesemodels use the geometric properties of martensitic variants that make up a transforming inclusionand apply micromechanics calculations to obtain the interaction energy of phase transformation in thematerial. Stresses and strains are obtained as averages over a volume in which many inclusions mayexist. The major shortcoming of these continuum models are that a priori knowledge of the martensitestructure must be known. Most of the models rely on the availability of experimentally obtained phasediagrams and other physical properties for both the austenite and martensite phases. In other words,these models can not be used if the nature of the material’s MTs are not known. Thus, they are nothelpful in the search for new shape memory materials.
Quantum mechanics based first-principles DFT methods are valuable for investigating the energydifferences between many phases of a material, and for studying the stability (phonon criterion) of thesephases all at 0 K (Ye et al., 1997; Huang et al., 2002; Parlinski and Parlinska-Wojtan, 2002; Huanget al., 2003; Parlinski et al., 2003). These methods are capable of calculating atomic-level informationregarding energies, forces, and stresses independent of any empirical fitting. DFT calculations suchas those of Huang et al. (2002, 2003) performed at 0 K show that the B2 cubic austenite crystalstructure of NiTi is mechanically unstable. This indicates that temperature effects are responsible forthe existence of a stable austenite phase in NiTi at high temperature. However, direct DFT basedstudies of temperature effects on the microstructural behavior of MTs in NiTi and other SMAs areprohibitive due to the computationally intensive nature of DFT calculations.
In contrast, atomistic models based on Molecular Dynamics (MD) or Monte Carlo (MC) simulationsare capable of capturing temperature effects and are invaluable for studying the behavior of homo-geneous MTs. In particular, MD simulations based on different phenomenological atomic interactionpotentials have been useful for exploring the dependence of a MT on properties such as temperature,composition, concentration of defects, etc. (Rubini and Ballone, 1995; Grujicic and Dang, 1995; Shaoet al., 1996; Meyer and Entel , 1998; Entel et al., 1999, 2000; Ozgen and Adiguzel , 2003; Wang et al.,2006; Ishida and Hiwatari , 2007). However, the extension of MD and MC simulations to larger length-and time-scales in order to study the formation and evolution of microstructures in SMAs is imprac-tical except on the largest of currently available parallel-computing systems. Even on these systems,the size of the simulations of interest would require considerable computation time. Thus, alternativemethods need to be developed.
The recent studies of Elliott et al. (2006a,b) and Guthikonda and Elliott (2008) provide a firststep in this direction. In these studies, Effective Interaction Potentials (EIPs) are used to model thebehavior of SMAs. That is, atomic interactions are modeled with empirical atomic potentials that areexplicit functions of temperature. The EIPs are computationally efficient and capable of capturinga wide range of material behavior. Thus, the EIP methodology appears to be a promising tool for
Toward an Effective Interaction Potential Model for the Shape Memory Alloy AuCd 3
capturing the real atomic-scale behavior of materials that exhibit MTs while also allowing for theefficient simulation of large-scale phenomena, for example, the formation of complex microstructures.In Guthikonda and Elliott (2008) it is observed that an EIP model based on the Morse pair potential isappropriate for capturing a transformation between the B2 cubic structure and the B19 orthorhombicstructure. Thus, in this work two EIP models are developed to study the B2 to B19 transformationobserved in Au-47.5at%Cd.
The remainder of this paper is organized as follows. Section 2 introduces the EIP model, Cauchy-Born kinematics, the free energy density, equilibrium equations, and the stability criterion that willbe used in this work. Thermo-elastic crystal properties of interest are defined in Section 3. Section 4gives a general description of the approach used to fit the EIP model parameters to experimental datafor a binary alloy. In Section 5 a simple model with temperature-dependent pair equilibrium spacing isused to capture the behavior of AuCd. Section 6 discusses the behavior of the model developed in theprevious section. It is found that this model does not capture all the desired properties of AuCd. Thus,Section 7 introduces a second EIP model which has temperature-dependent bond-stiffness and pairequilibrium-spacing parameters. Section 8 discusses the behavior of this model, and finally, Section 9summarizes the results of this work.
2 Effective Interaction Potential model
In this section a model of a perfect, infinite, bi-atomic crystal is presented. First, Section 2.1 discussesthe use of an effective pair potential to model the atomic interactions. Second, the kinematics used todescribe crystalline deformation are presented in Section 2.2. The focus of this work is to develop amodel for the SMA AuCd. This will involve fitting effective interaction potentials to experimentallyobtained values for not only the B2 cubic AuCd crystal, but also for pure face-centered cubic (FCC)Au and pure hexagonal-close packed (HCP) Cd crystals. Thus, details of the kinematics for each ofthese crystal structures are presented. Finally, Section 2.3 defines the crystal’s free energy density, itsequilibrium equations, and the appropriate stability criteria.
2.1 Effective pair potentials
All materials are made up of atoms. These atoms are attracted to each other by inter-atomic forces.Within the EIP model (Elliott et al., 2006b; Elliott , 2008; Guthikonda and Elliott , 2008), these forcesare derived from empirical potentials. Here, a pair potential φ(r; θ) is used, where φ is the free energyassociated with an interaction between two atoms, r is the distance between two atoms, and θ = T
Tref
is
the non-dimensional temperature with T the absolute temperature and Tref a suitable (but arbitrary)reference temperature. To model a particular material, first a functional form for the pair potentialis chosen, such as the well known Lennard-Jones or Morse potential. Next, the interactions betweenatoms are made temperature-dependent by letting the parameters of the potential be functions oftemperature. Finally, any adjustable potential parameters are determined by a fitting procedure inorder to match the experimental values of a material’s properties.
Multiple types of atoms in a material give rise to multiple types of atomic interactions. For example,a binary alloy such as AuCd is made up of two types of atoms denoted here by “a” (Au) and “b” (Cd)which results in the need for three types of atomic pair interactions a − a, b − b, and a − b. In thiscase, each of these interactions is modeled with a separate free energy potential denoted by φaa(r; θ),φbb(r; θ), and φab(r; θ) respectively.
2.2 Cauchy-Born kinematics
In order to describe a perfect infinite crystalline material, a representative translational unit cell ischosen and its associated lattice vectors, G1,G2, and G3 are identified. The chosen unit cell willcontain some number of atoms, N , and the crystal structure is constructed by using the lattice vectorsto generate the infinite number of translationally periodic images of the representative unit cell. Thisis called a “multilattice” description of the crystal structure (Pitteri and Zanzotto, 2002).
4 Venkata Suresh Guthikonda, Ryan S. Elliott
Deformations of the crystal are described using Cauchy-Born (CB) kinematics (Huang and Born,1962; Elliott et al., 2006a,b). Each unit cell in the crystal is labeled by a set of three integers ℓ =(ℓ1, ℓ2, ℓ3) and each atom in a given unit cell is labeled by an integer α. Thus, the reference positionof atom α in unit cell ℓ is given by
X[
ℓα
]
= X[ℓ] + P[α],
X[ℓ] = ℓ1G1 + ℓ2G2 + ℓ3G3,(1)
where X[ℓ] is the position vector locating unit cell ℓ in space and P[α] is the relative position vectorlocating atom α within this unit cell.
As described in Elliott et al. (2006b), CB kinematics describe the crystal’s deformation in termsof “internal atomic shift vectors” S[α] and a uniform deformation characterized by a 3× 3 symmetricright-stretch tensor U. Thus, the current position of atom α in unit cell ℓ is1
x[
ℓα
]
= U · (X[
ℓα
]
+ S[α]). (2)
To eliminate rigid-body translations, S[0] is set to zero. Rigid-body rotations have already been elim-inated by the use of the symmetric right-stretch tensor U, instead of the general 3 × 3 deformationgradient tensor F.
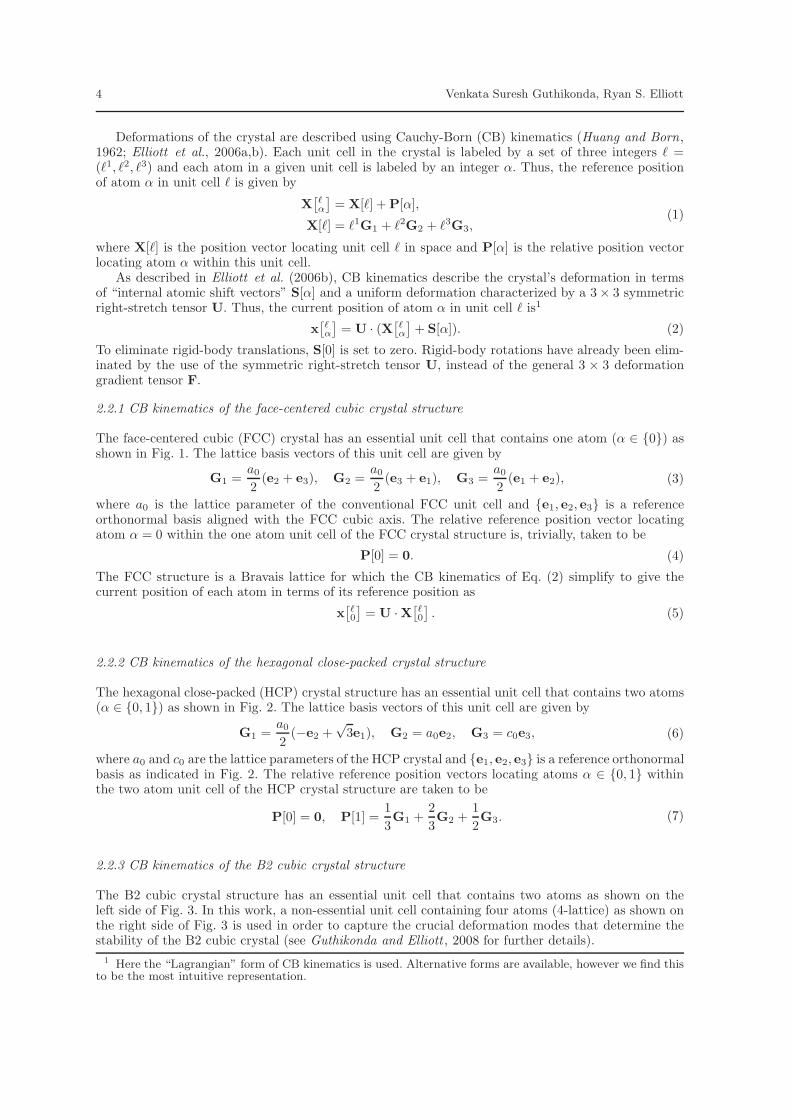
2.2.1 CB kinematics of the face-centered cubic crystal structure
The face-centered cubic (FCC) crystal has an essential unit cell that contains one atom (α ∈ {0}) asshown in Fig. 1. The lattice basis vectors of this unit cell are given by
G1 =a0
2(e2 + e3), G2 =
a0
2(e3 + e1), G3 =
a0
2(e1 + e2), (3)
where a0 is the lattice parameter of the conventional FCC unit cell and {e1, e2, e3} is a referenceorthonormal basis aligned with the FCC cubic axis. The relative reference position vector locatingatom α = 0 within the one atom unit cell of the FCC crystal structure is, trivially, taken to be
P[0] = 0. (4)
The FCC structure is a Bravais lattice for which the CB kinematics of Eq. (2) simplify to give thecurrent position of each atom in terms of its reference position as
x[
ℓ0
]
= U ·X[
ℓ0
]
. (5)
2.2.2 CB kinematics of the hexagonal close-packed crystal structure
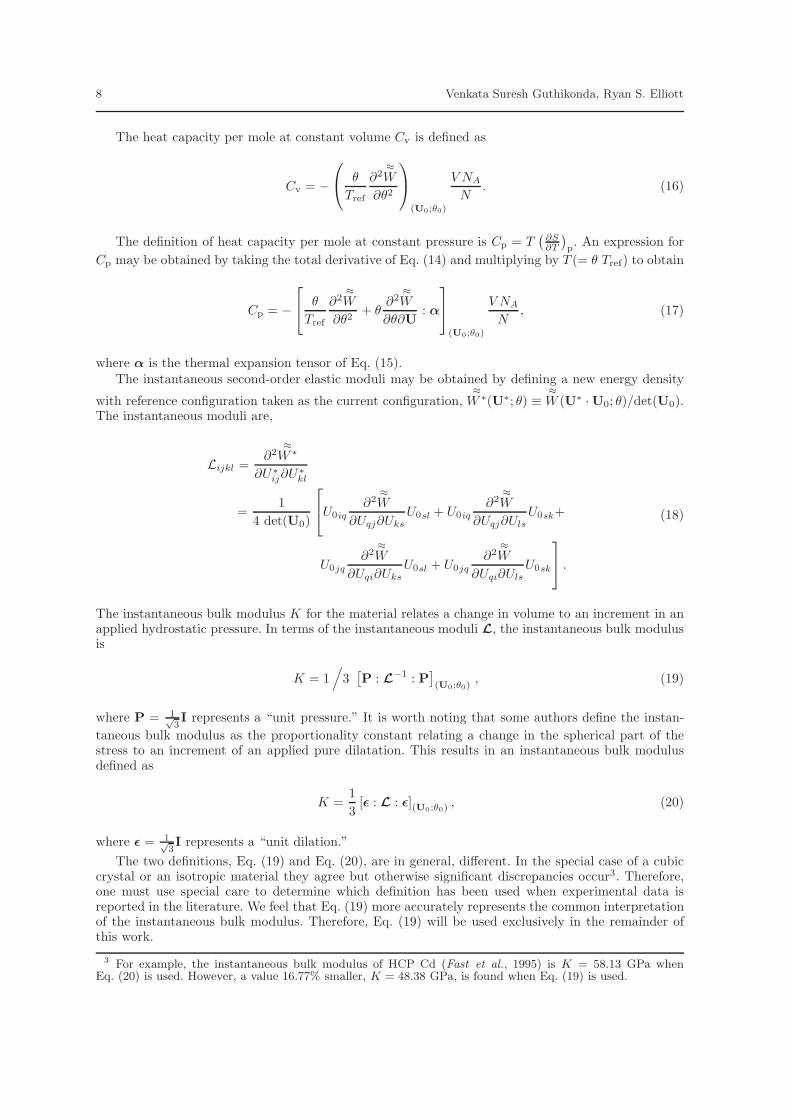
The hexagonal close-packed (HCP) crystal structure has an essential unit cell that contains two atoms(α ∈ {0, 1}) as shown in Fig. 2. The lattice basis vectors of this unit cell are given by
G1 =a0
2(−e2 +
√3e1), G2 = a0e2, G3 = c0e3, (6)
where a0 and c0 are the lattice parameters of the HCP crystal and {e1, e2, e3} is a reference orthonormalbasis as indicated in Fig. 2. The relative reference position vectors locating atoms α ∈ {0, 1} withinthe two atom unit cell of the HCP crystal structure are taken to be
P[0] = 0, P[1] =1
3G1 +
2
3G2 +
1
2G3. (7)
2.2.3 CB kinematics of the B2 cubic crystal structure
The B2 cubic crystal structure has an essential unit cell that contains two atoms as shown on theleft side of Fig. 3. In this work, a non-essential unit cell containing four atoms (4-lattice) as shown onthe right side of Fig. 3 is used in order to capture the crucial deformation modes that determine thestability of the B2 cubic crystal (see Guthikonda and Elliott , 2008 for further details).
1 Here the “Lagrangian” form of CB kinematics is used. Alternative forms are available, however we find thisto be the most intuitive representation.
Toward an Effective Interaction Potential Model for the Shape Memory Alloy AuCd 5
1
2
3
a0
a0
a0
G3
G2
G1
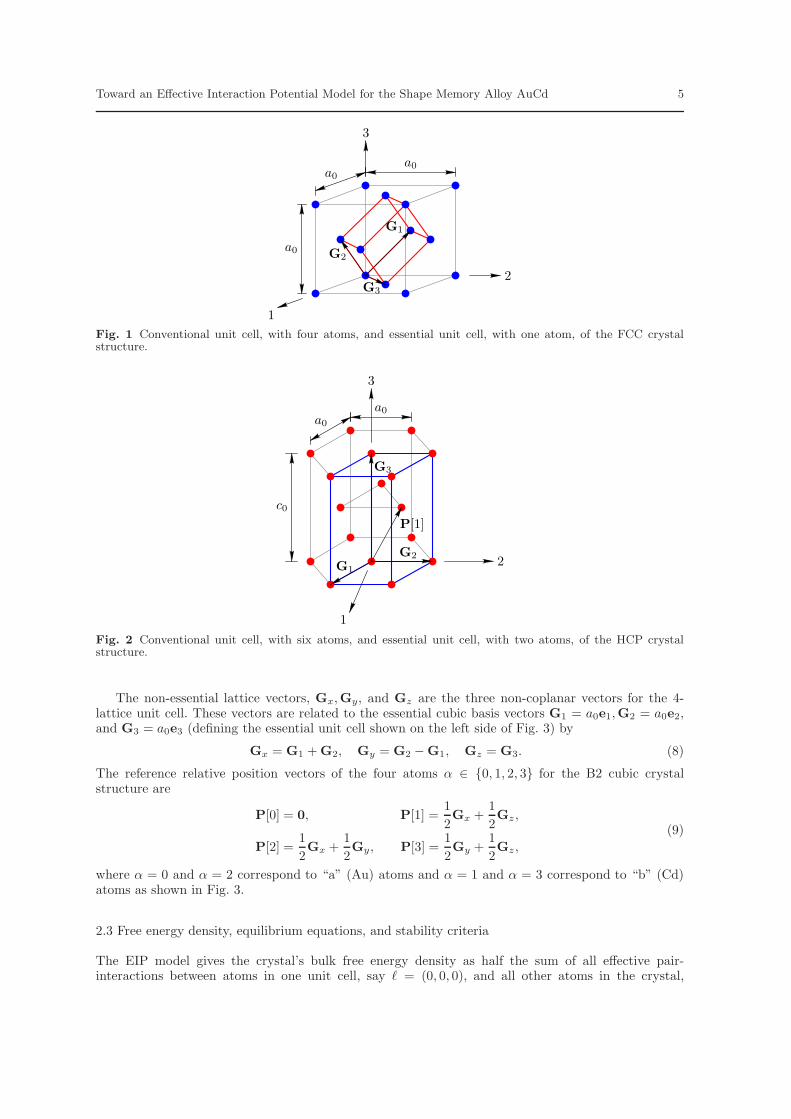
Fig. 1 Conventional unit cell, with four atoms, and essential unit cell, with one atom, of the FCC crystalstructure.
2
3
1
c0
a0
a0
G1
G2
G3
P[1]
Fig. 2 Conventional unit cell, with six atoms, and essential unit cell, with two atoms, of the HCP crystalstructure.
The non-essential lattice vectors, Gx,Gy, and Gz are the three non-coplanar vectors for the 4-lattice unit cell. These vectors are related to the essential cubic basis vectors G1 = a0e1,G2 = a0e2,and G3 = a0e3 (defining the essential unit cell shown on the left side of Fig. 3) by
Gx = G1 + G2, Gy = G2 − G1, Gz = G3. (8)
The reference relative position vectors of the four atoms α ∈ {0, 1, 2, 3} for the B2 cubic crystalstructure are
P[0] = 0, P[1] =1
2Gx +
1
2Gz ,
P[2] =1
2Gx +
1
2Gy, P[3] =
1
2Gy +
1
2Gz ,
(9)
where α = 0 and α = 2 correspond to “a” (Au) atoms and α = 1 and α = 3 correspond to “b” (Cd)atoms as shown in Fig. 3.
2.3 Free energy density, equilibrium equations, and stability criteria
The EIP model gives the crystal’s bulk free energy density as half the sum of all effective pair-interactions between atoms in one unit cell, say ℓ = (0, 0, 0), and all other atoms in the crystal,

6 Venkata Suresh Guthikonda, Ryan S. Elliott
B2
1
2
3
Cubic
1
2
x
y
3, z
S[1]
S[2]S[3]
S[0]S[0] = 0
z
x
y
Fig. 3 Essential unit cell (left), with two atoms, and the 4-lattice unit cell used in this work (right), with fouratoms, of the B2 cubic crystal structure.
normalized by the reference unit cell volume. Thus, the free energy density per unit reference volumeof a crystal is given by
∼W (u; θ) =
1
2V
∑
α
∑
h
ℓ′
α′
i
φη(α)η(α′
)(
r[
0 ℓ′
α α′
]
; θ)
, (10)
where u = (U;S[α]) represents the chosen set of independent degrees of freedom (DOFs) that describethe deformation of the crystal, θ is the non-dimensional temperature, V is the reference unit cell
volume, η(α) represents the type of atom α (“a”, “b”, “c”, etc.), and r[
0 ℓ′
α α′
]
≡ ||x[
ℓ′
α′
]
− x[
0α
]
|| is
the current distance between atom α′
in unit cell ℓ′
and atom α in the unit cell located at the origin.The factor of 1/2 in Eq. (10) arises from the fact that the summation involves each interaction twice.
Technically, the summation over[
ℓ′
α′
]
in Eq. (10) extends to all atoms in the infinite crystal, but
such a summation is computationally impossible. Due to the rapid decay of most commonly used pairpotentials, it is acceptable to employ a cutoff distance rcut. Here rcut is taken as seven atomic distanceunits, which is found to be sufficient to ensure that the lattice sum in Eq. (10) is converged. Thus, thesummation in Eq. (10) extends to all atoms in the Eulerian sphere of influence, that is, all atoms such
that r[
0 ℓ′
α α′
]
≤ rcut.
The equilibrium equations for the infinite perfect multilattice crystal with zero-stress conditions at
infinity are given by the derivatives of∼W ,
∂∼W
∂u= 0
∂∼
W∂U
= 0,
∂∼
W∂S[α] = 0, α = 1, 2, ..., N − 1.
(11)
As shown in Elliott et al. (2006a) the translational periodicity of the crystal structure and the useof multilattice CB kinematics ensures that solutions of Eqs. (11) also correspond to true equilibriumconfigurations for the crystal. That is, if Eqs. (11) are satisfied, then the sum of forces acting on eachatom in the crystal is zero.
Due to the “microscopic” nature of the CB shift DOFs, their direct control is difficult if notimpossible. Therefore, most available experimental data corresponds to a state of the material in whichthe shifts are in equilibrium. That is, they satisfy Eq. (11)2 for any given value of the deformationU. Thus, the form of the material’s free energy density that is most appropriate for comparison tomacroscopic experimental data is the “Homogenized Continuum (HC) free energy density” (Elliottet al., 2006a). To obtain the HC free energy density, Eq. (11)2 is used to implicitly define the shiftsS[α] as functions of the uniform deformation U and temperature θ, i.e., S[α] = S[α](U; θ). The HCfree energy density is then defined by
≈W (U; θ) ≡
∼W (U;S[α](U; θ); θ). (12)

Toward an Effective Interaction Potential Model for the Shape Memory Alloy AuCd 7
It is especially important to use the HC free energy density when calculating properties associatedwith non-centrosymmetric crystals, such as the HCP Bravais lattice and the αIrV and B19 orthorhom-bic structures encountered in Sections 6 and 8. This is because for these crystals the shifts coupledirectly to the uniform deformation of the crystal and ignoring this coupling will result in significanterrors in the computation of many thermo-elastic material properties. It should be noted that the HCfree energy as defined here may not be single valued. That is, for any given deformation U there maybe multiple solutions to Eq. (11)2. These will lead to a multi valued HC free energy. Which of these
multiple values≈W (U; θ) takes on at any given time will then depend on the deformation history.
The stability of an equilibrium configuration, i.e., a solution to Eqs. (11), is defined in terms ofthe “material stability” criterion of Elliott et al. (2006b). This requires the crystal to satisfy boththe “Cauchy-Born (CB) stability criterion” and the “phonon stability criterion.” The CB stabilitycriterion evaluates stability with respect to perturbations of the CB kinematics. The phonon stabilitycriterion evaluates stability with respect to all other bounded perturbations of the equilibrium crystalstructure. Together these criteria provide a robust measure of the crystal’s stability under soft loadingconditions. It is important to note that this stability criterion provides a measure of the crystal’sstability that is independent of the particular CB kinematics used to describe the equilibrium crystalstructure. Complete definitions and detailed discussions of the CB and phonon stability criteria aregiven in Elliott et al. (2006a) and Elliott (2008).
3 Thermo-elastic properties of crystals
In this section, the thermal and elastic material properties that are used in this work for fitting to andcomparison with available experimental data are presented.
The cohesive energy Ec is the energy (per atom) released by the formation of the crystal from aset of dissociated atoms that are initially infinitely far apart and is given by
Ec = −(
≈W (U0; θ0)
)
V
N, (13)
where≈W (U0; θ0) is the HC free energy density, U0 is the CB deformation corresponding to the stress-
free configuration at the non-dimensional temperature θ0, V is the reference unit cell volume, andN is the number of atoms in the unit cell. The minus sign is required to obtain the energy releasedduring the crystal’s formation, due to the choice of energy datum corresponding to the dissociated setof atoms.
The entropy per mole S is given by
S = − 1
Tref
∂≈W
∂θ
∣
∣
∣
∣
(U0;θ0)
V NA
N, (14)
where NA is Avogadro’s constant (6.023 × 10²³).The thermal expansion tensor α is obtained by taking a total temperature derivative of the stress-
free equilibrium equation ∂≈
W∂U
= 0, setting ∂U
∂θ≡ αTref , and solving for α, which results in2
α = − 1
Tref
∂2≈W
∂U2
−1
:
∂2≈W
∂U∂θ
(U0;θ0)
. (15)
For cubic crystals (or isotropic materials), α is an isotropic second-order tensor and one may speak ofthe “linear thermal expansion coefficient.” However, for non-cubic (non-isotropic) materials, the direc-tional dependence of thermal expansion must be specified and, therefore, one speaks of the “thermalexpansion tensor.”
2 The double tensor contraction A : B is defined in Cartesian tensor component form by AijBijkl.
8 Venkata Suresh Guthikonda, Ryan S. Elliott
The heat capacity per mole at constant volume Cv is defined as
Cv = −
θ
Tref
∂2≈W
∂θ2
(U0;θ0)
V NA
N. (16)
The definition of heat capacity per mole at constant pressure is Cp = T(
∂S∂T
)
p. An expression for
Cp may be obtained by taking the total derivative of Eq. (14) and multiplying by T (= θ Tref) to obtain
Cp = −
θ
Tref
∂2≈W
∂θ2+ θ
∂2≈W
∂θ∂U: α
(U0;θ0)
V NA
N, (17)
where α is the thermal expansion tensor of Eq. (15).The instantaneous second-order elastic moduli may be obtained by defining a new energy density
with reference configuration taken as the current configuration,≈
W ∗(U∗; θ) ≡≈W (U∗ ·U0; θ)/det(U0).
The instantaneous moduli are,
Lijkl =∂2
≈W ∗
∂U∗ij∂U∗
kl
=1
4 det(U0)
U0iq
∂2≈W
∂Uqj∂Uks
U0sl + U0iq
∂2≈W
∂Uqj∂Uls
U0sk+
U0jq
∂2≈W
∂Uqi∂Uks
U0sl + U0jq
∂2≈W
∂Uqi∂Uls
U0sk
.
(18)
The instantaneous bulk modulus K for the material relates a change in volume to an increment in anapplied hydrostatic pressure. In terms of the instantaneous moduli L, the instantaneous bulk modulusis
K = 1/
3[
P : L−1 : P
]
(U0;θ0), (19)
where P = 1√3I represents a “unit pressure.” It is worth noting that some authors define the instan-
taneous bulk modulus as the proportionality constant relating a change in the spherical part of thestress to an increment of an applied pure dilatation. This results in an instantaneous bulk modulusdefined as
K =1
3[ǫ : L : ǫ](U0;θ0)
, (20)
where ǫ = 1√3I represents a “unit dilation.”
The two definitions, Eq. (19) and Eq. (20), are in general, different. In the special case of a cubiccrystal or an isotropic material they agree but otherwise significant discrepancies occur3. Therefore,one must use special care to determine which definition has been used when experimental data isreported in the literature. We feel that Eq. (19) more accurately represents the common interpretationof the instantaneous bulk modulus. Therefore, Eq. (19) will be used exclusively in the remainder ofthis work.
3 For example, the instantaneous bulk modulus of HCP Cd (Fast et al., 1995) is K = 58.13 GPa whenEq. (20) is used. However, a value 16.77% smaller, K = 48.38 GPa, is found when Eq. (19) is used.
Toward an Effective Interaction Potential Model for the Shape Memory Alloy AuCd 9
4 General approach to fitting model parameters
Once a specific EIP model has been adopted (as discussed in Section 2.1), the adjustable potentialparameters of the model must be determined in order to implement the model, as described in Sec-tions 2.2 and 2.3, and to study the material’s SMA properties. The approach used in this work todetermine these parameters starts by choosing a reference temperature for which significant experi-mental data is available for the alloy of interest. Next, the properties of the individual bond typesare fit to their corresponding elemental material properties. For example, the properties of Au at thereference temperature are used in order to determine the adjustable potential parameters associatedwith interactions of two Au atoms. Finally, the unlike bond parameters are fit so that the B2 austenitestructure’s properties match the experimental data for the SMA at the reference temperature.
In this way, all of the model’s behavior is determined in terms of the pure elemental propertiesand the properties of the alloy at high temperature in the austenite phase. Note that this proceduredoes not use any information about the martensite phase of the material. Thus, the properties of,and even the existence of, the martensite phase are determined by the physics of the particular EIPmodel under consideration. In particular, the relative properties of the like bonds, which are fit toindependent experimental data, provide a realistic setting that will either favor or disfavor the existenceof a transformation. Thus, the success of any particular model will be evaluated based on the model’sprediction of the correct MT and its associated properties. This includes the model’s ability to capturethe correct martensite crystal structure, the structure’s lattice parameters, and quantities like thelatent heat of transformation.
Many alternative fitting procedures are possible. For instance, one could fit all of the model’s pa-rameters (for both like and unlike bonds) to an extensive set of experimental data for the alloy. Thiswould, undoubtedly, provide a model that matches the alloy’s observed mechanical and thermal be-havior more closely than the ones developed in this work. Here, however, we prefer the above describedprocedure because of its ability to explore the relationship between the constituent element’s behaviorand the alloy’s MT behavior.
5 Model 1: Morse EIPs with temperature-dependent pair equilibrium spacing
The EIP model of Elliott et al. (2006b) is adapted to study the binary alloy Au-47.5at%Cd. Thismodel uses temperature-dependent Morse pair potentials. The pair equilibrium spacing r(θ) of thepotential is taken to be a linear function of temperature and all other parameters are independent oftemperature. Thus, the three Morse potentials which account for the three types of interactions presentin the binary alloy take the general form
φ(r; θ) = A
{
exp
[
−2B
(
r
r(θ)− 1
)]
− 2 exp
[
−B
(
r
r(θ)− 1
)]}
,
r(θ) = rref + rθ(θ − 1).
(21)
The parameters rref and rθ are constants that describe the linear variation of r with θ. Thus, the modelhas 12 parameters, four per bond type, that will be fit to the experimental data for pure Au, pure Cd,and B2 AuCd. A reference temperature of Tref = 323 K is used. This is an arbitrary, but convenientchoice corresponding to the experimentally observed transformation temperature of Au-47.5at%Cd(Zirinsky, 1956).
In Guthikonda (2007), an attempt to determine the potential parameters was made by fittingexperimental values of the lattice parameters and two elastic moduli for Au, Cd, and AuCd at thereference temperature. For this temperature (θ = 1) the three parameters A, B, and rref must bedetermined for each bond type. Note that the parameter rθ becomes insignificant at θ = 1. Latticeparameters and elastic moduli were chosen for fitting due to their significant role in MTs. Fittingthe experimental values of lattice parameters is important due to the crucial role that geometriccompatibility is known to play in the formation of microstructure during MT (Bhattacharya, 2003).Additionally, since MTs result from lattice instabilities it seemed sensible to regard the material’selastic moduli, which are the indicators of stability, as important quantities to match as well.
Unfortunately, it was determined that a fitting procedure for the effective Morse pair potentialsthat matches the lattice parameters and two elastic moduli of the material of interest is not possible.

10 Venkata Suresh Guthikonda, Ryan S. Elliott
See Guthikonda (2007) for a detailed discussion. Thus, a more generalized procedure is adapted todetermine the adjustable parameters by fitting the experimental values of lattice parameter, instanta-neous bulk modulus, and cohesive energy. This procedure follows that of Girifalco and Weizer (1959)who fit the Morse potential for a number of cubic pure elements. They did not, however, consideralloys or temperature-dependent potentials as considered here. The fitting procedure first determinesthe like-interaction potential parameters from the properties of the corresponding pure materials andfinally determines the unlike-interaction potential parameters from the properties of B2 AuCd at thereference temperature.
5.1 Fitting of potential parameters for Au-Au interactions
The pure Au bond parameters Aaa, Baa, raaref , and raa
θ are determined by fitting the stress-free equilib-rium FCC lattice spacing a, instantaneous bulk modulus K, cohesive energy Ec, and linear thermalexpansion coefficient α at the reference temperature. A simple trial and error approach was used tomatch these parameters to the experimental values of FCC Au given in Table 1.
FCC Au at T=323 K
Property Value
Lattice parameter (a) 4.0812 ABulk modulus (K) 172.2 GPa
Cohesive energy (Ec) 3.81 eVatom
Linear thermal expansion coefficient (α) 14.24 × 10⁻⁶ K−1
Table 1 Experimental values of lattice parameter a, instantaneous bulk modulus K, cohesive energy Ec, andlinear thermal expansion coefficient α for FCC Au at 323 K (Villars et al., 1985; Neighbours and Alers, 1958;Kittel , 2005).
The fitted parameters for the effective Morse potential for pure Au, φaa(r; θ), are given in Table 2.Figure 4 shows the variation of lattice parameter and instantaneous bulk modulus of FCC Au with
Parameter Value
Aaa 0.4754131760 eVBaa 4.7788992600
raaref 3.0284951200 A
raaθ 0.0139252220 A
Table 2 Fitted parameters for the effective Morse potential for pure Au, φaa(r; θ).
respect to θ for the resulting potential. It is recognized that negative values of θ are not physical,but the full diagrams are presented for consistency with the figures of Section 6 and so that themodel’s complete range of behavior is illustrated. The plus sign in each plot shows the correspondingexperimental value given in Table 1. At the reference temperature, the cohesive energy of the fittedpotential is equal to the experimental value given in Table 1. As θ varies, Ec changes negligibly due toa weak dependence on temperature resulting from the small value of raa
θ . Finally, it can be shown that,for the potential of Eq. (21), the linear thermal expansion coefficient of a Bravais lattice is constant. Forthe potential defined by the parameters in Table 2, the linear thermal expansion coefficient matchesthat of FCC Au given in Table 1.
Toward an Effective Interaction Potential Model for the Shape Memory Alloy AuCd 11
θ
a(A)
−80 −40 0 40
2
3
4
5
+
θ
K(GPa)
−80 −40 0 40
700
500
300
100
+
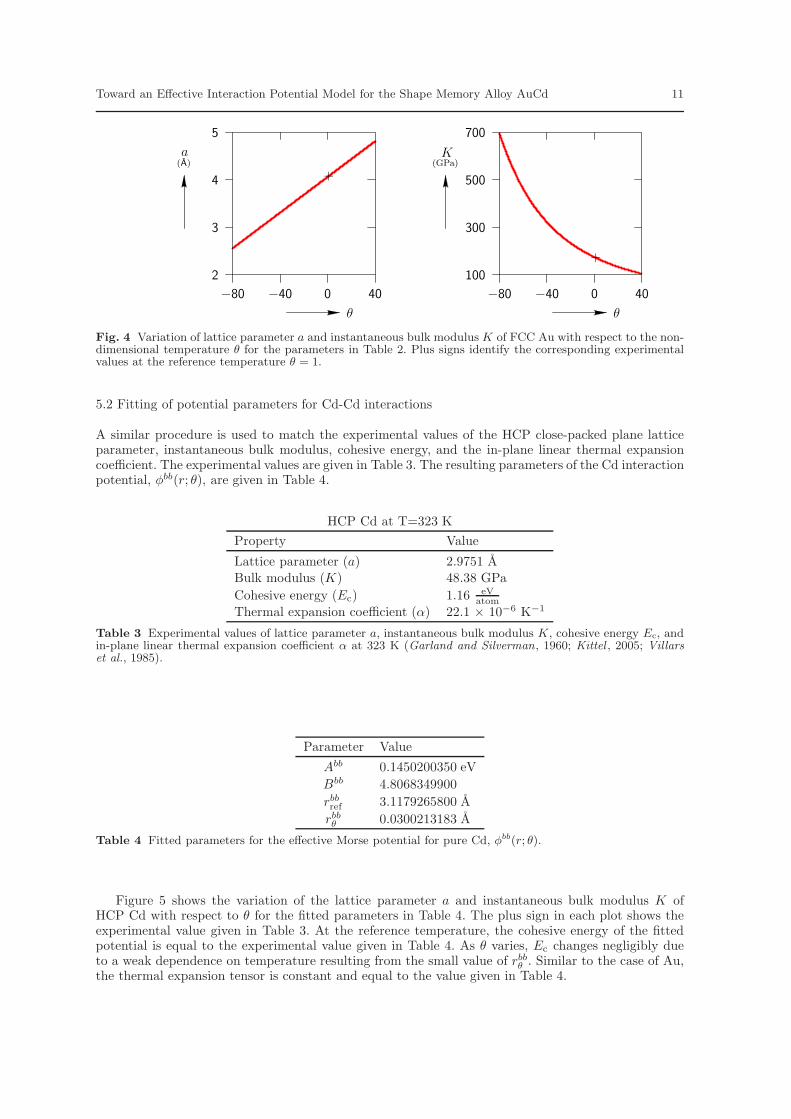
Fig. 4 Variation of lattice parameter a and instantaneous bulk modulus K of FCC Au with respect to the non-dimensional temperature θ for the parameters in Table 2. Plus signs identify the corresponding experimentalvalues at the reference temperature θ = 1.
5.2 Fitting of potential parameters for Cd-Cd interactions
A similar procedure is used to match the experimental values of the HCP close-packed plane latticeparameter, instantaneous bulk modulus, cohesive energy, and the in-plane linear thermal expansioncoefficient. The experimental values are given in Table 3. The resulting parameters of the Cd interactionpotential, φbb(r; θ), are given in Table 4.
HCP Cd at T=323 K
Property Value
Lattice parameter (a) 2.9751 ABulk modulus (K) 48.38 GPa
Cohesive energy (Ec) 1.16 eVatom
Thermal expansion coefficient (α) 22.1 × 10⁻⁶ K−1
Table 3 Experimental values of lattice parameter a, instantaneous bulk modulus K, cohesive energy Ec, andin-plane linear thermal expansion coefficient α at 323 K (Garland and Silverman, 1960; Kittel , 2005; Villarset al., 1985).
Parameter Value
Abb 0.1450200350 eV
Bbb 4.8068349900
rbbref 3.1179265800 A
rbbθ 0.0300213183 A
Table 4 Fitted parameters for the effective Morse potential for pure Cd, φbb(r; θ).
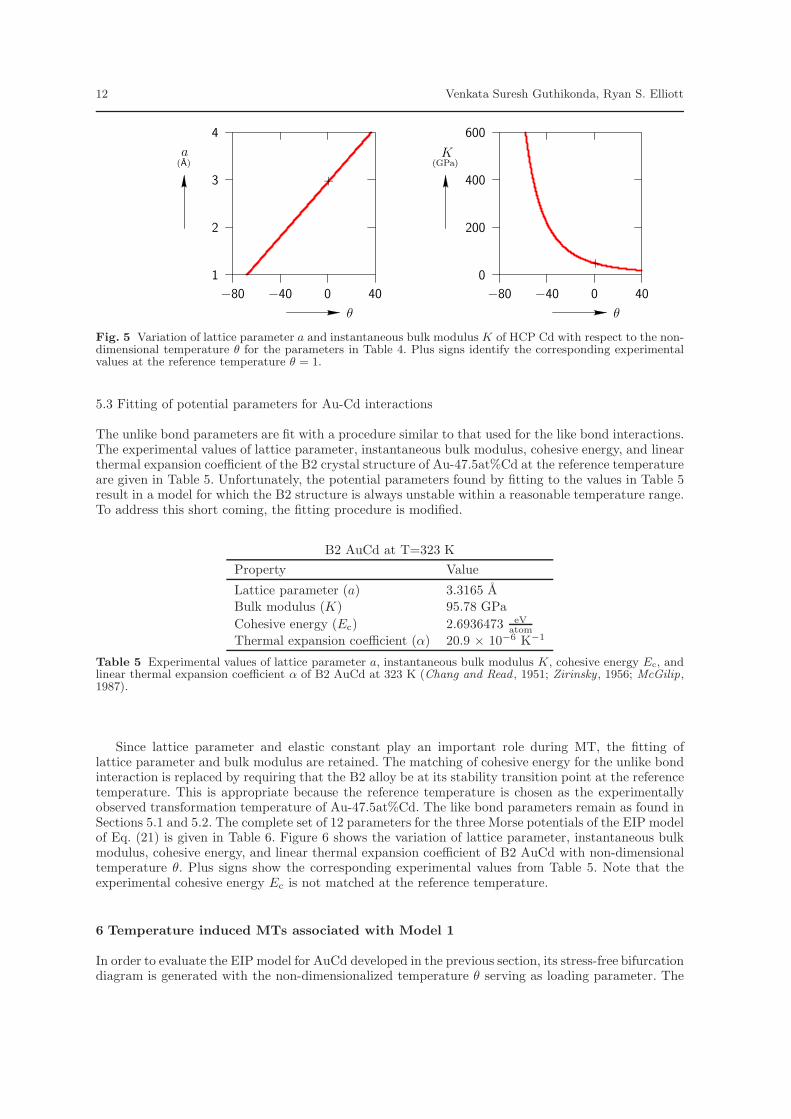
Figure 5 shows the variation of the lattice parameter a and instantaneous bulk modulus K ofHCP Cd with respect to θ for the fitted parameters in Table 4. The plus sign in each plot shows theexperimental value given in Table 3. At the reference temperature, the cohesive energy of the fittedpotential is equal to the experimental value given in Table 4. As θ varies, Ec changes negligibly dueto a weak dependence on temperature resulting from the small value of rbb
θ . Similar to the case of Au,the thermal expansion tensor is constant and equal to the value given in Table 4.
12 Venkata Suresh Guthikonda, Ryan S. Elliott
θ
a(A)
−80 −40 0 40
1
2
3
4
+
θ
K(GPa)
−80 −40 0 40
600
400
200
0+
Fig. 5 Variation of lattice parameter a and instantaneous bulk modulus K of HCP Cd with respect to the non-dimensional temperature θ for the parameters in Table 4. Plus signs identify the corresponding experimentalvalues at the reference temperature θ = 1.
5.3 Fitting of potential parameters for Au-Cd interactions
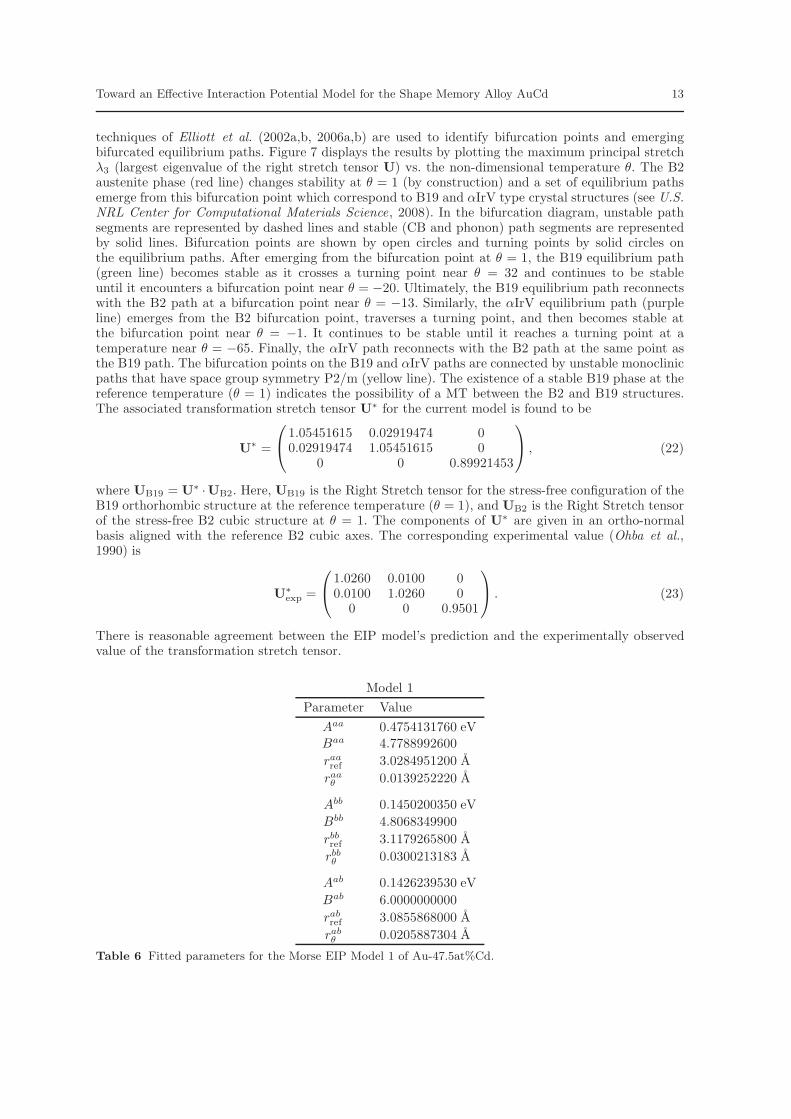
The unlike bond parameters are fit with a procedure similar to that used for the like bond interactions.The experimental values of lattice parameter, instantaneous bulk modulus, cohesive energy, and linearthermal expansion coefficient of the B2 crystal structure of Au-47.5at%Cd at the reference temperatureare given in Table 5. Unfortunately, the potential parameters found by fitting to the values in Table 5result in a model for which the B2 structure is always unstable within a reasonable temperature range.To address this short coming, the fitting procedure is modified.
B2 AuCd at T=323 K
Property Value
Lattice parameter (a) 3.3165 ABulk modulus (K) 95.78 GPa
Cohesive energy (Ec) 2.6936473 eVatom
Thermal expansion coefficient (α) 20.9 × 10⁻⁶ K−1
Table 5 Experimental values of lattice parameter a, instantaneous bulk modulus K, cohesive energy Ec, andlinear thermal expansion coefficient α of B2 AuCd at 323 K (Chang and Read , 1951; Zirinsky , 1956; McGilip,1987).
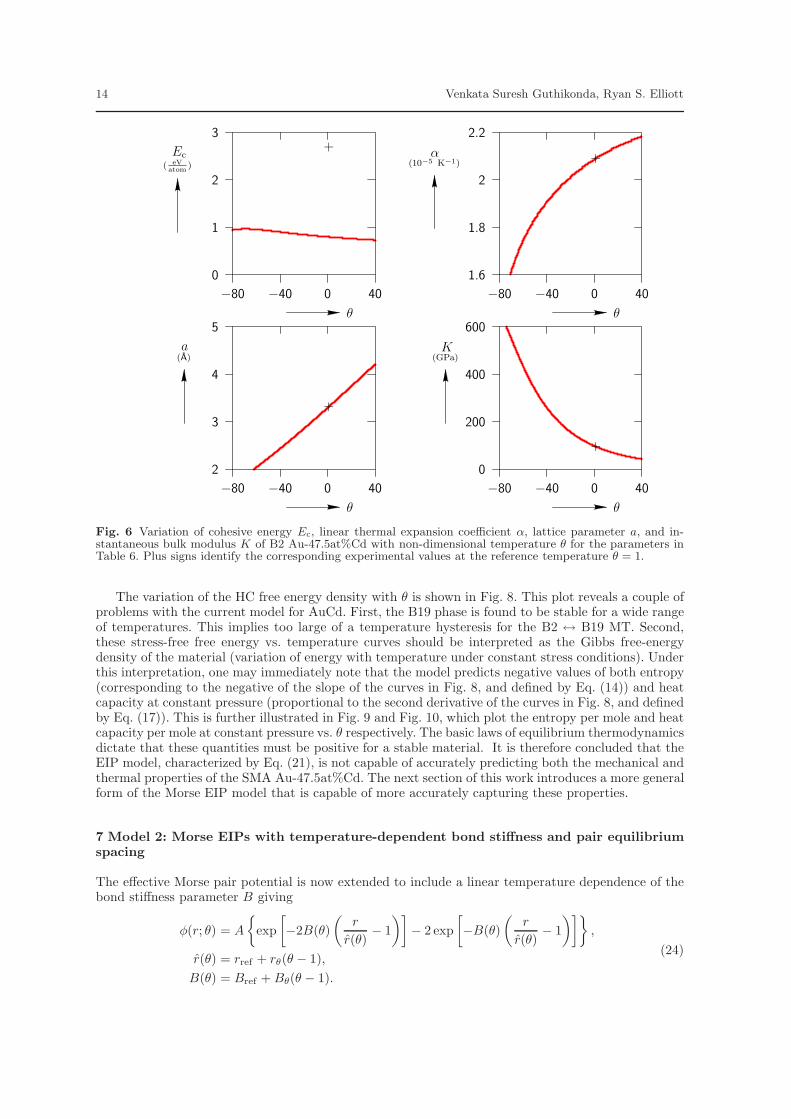
Since lattice parameter and elastic constant play an important role during MT, the fitting oflattice parameter and bulk modulus are retained. The matching of cohesive energy for the unlike bondinteraction is replaced by requiring that the B2 alloy be at its stability transition point at the referencetemperature. This is appropriate because the reference temperature is chosen as the experimentallyobserved transformation temperature of Au-47.5at%Cd. The like bond parameters remain as found inSections 5.1 and 5.2. The complete set of 12 parameters for the three Morse potentials of the EIP modelof Eq. (21) is given in Table 6. Figure 6 shows the variation of lattice parameter, instantaneous bulkmodulus, cohesive energy, and linear thermal expansion coefficient of B2 AuCd with non-dimensionaltemperature θ. Plus signs show the corresponding experimental values from Table 5. Note that theexperimental cohesive energy Ec is not matched at the reference temperature.
6 Temperature induced MTs associated with Model 1
In order to evaluate the EIP model for AuCd developed in the previous section, its stress-free bifurcationdiagram is generated with the non-dimensionalized temperature θ serving as loading parameter. The
Toward an Effective Interaction Potential Model for the Shape Memory Alloy AuCd 13
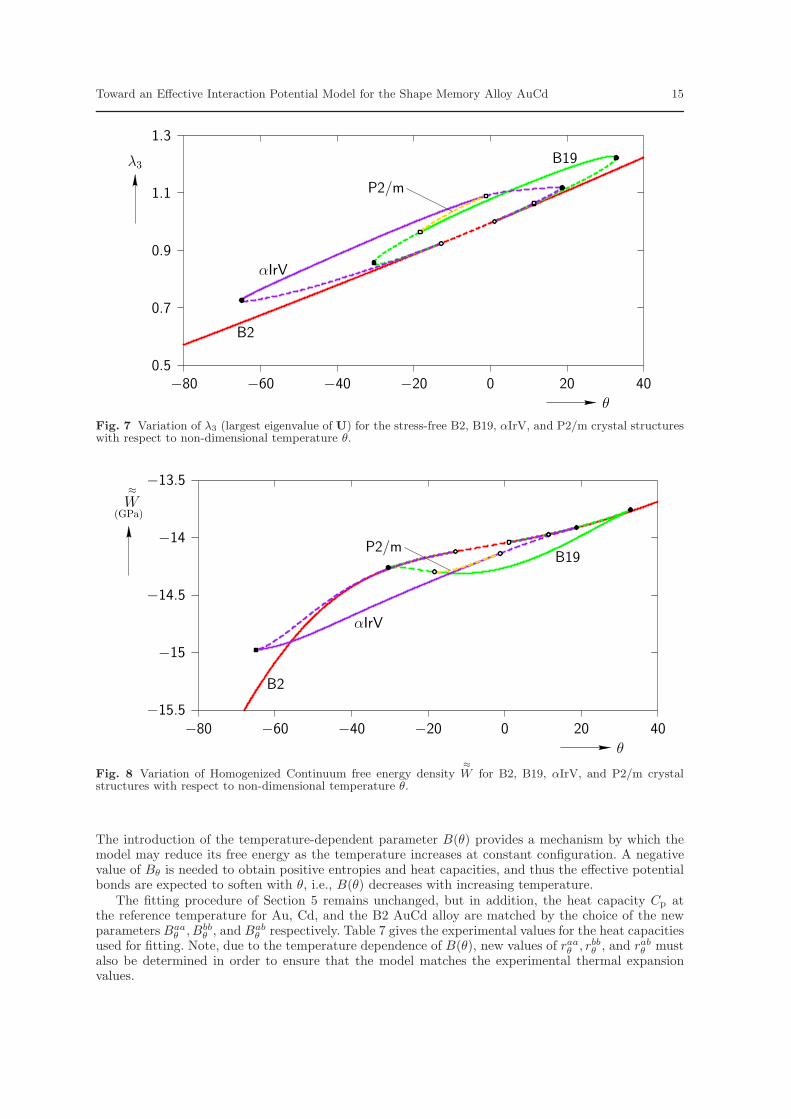
techniques of Elliott et al. (2002a,b, 2006a,b) are used to identify bifurcation points and emergingbifurcated equilibrium paths. Figure 7 displays the results by plotting the maximum principal stretchλ3 (largest eigenvalue of the right stretch tensor U) vs. the non-dimensional temperature θ. The B2austenite phase (red line) changes stability at θ = 1 (by construction) and a set of equilibrium pathsemerge from this bifurcation point which correspond to B19 and αIrV type crystal structures (see U.S.NRL Center for Computational Materials Science, 2008). In the bifurcation diagram, unstable pathsegments are represented by dashed lines and stable (CB and phonon) path segments are representedby solid lines. Bifurcation points are shown by open circles and turning points by solid circles onthe equilibrium paths. After emerging from the bifurcation point at θ = 1, the B19 equilibrium path(green line) becomes stable as it crosses a turning point near θ = 32 and continues to be stableuntil it encounters a bifurcation point near θ = −20. Ultimately, the B19 equilibrium path reconnectswith the B2 path at a bifurcation point near θ = −13. Similarly, the αIrV equilibrium path (purpleline) emerges from the B2 bifurcation point, traverses a turning point, and then becomes stable atthe bifurcation point near θ = −1. It continues to be stable until it reaches a turning point at atemperature near θ = −65. Finally, the αIrV path reconnects with the B2 path at the same point asthe B19 path. The bifurcation points on the B19 and αIrV paths are connected by unstable monoclinicpaths that have space group symmetry P2/m (yellow line). The existence of a stable B19 phase at thereference temperature (θ = 1) indicates the possibility of a MT between the B2 and B19 structures.The associated transformation stretch tensor U∗ for the current model is found to be
U∗ =
1.05451615 0.02919474 00.02919474 1.05451615 0
0 0 0.89921453
, (22)
where UB19 = U∗ ·UB2. Here, UB19 is the Right Stretch tensor for the stress-free configuration of theB19 orthorhombic structure at the reference temperature (θ = 1), and UB2 is the Right Stretch tensorof the stress-free B2 cubic structure at θ = 1. The components of U∗ are given in an ortho-normalbasis aligned with the reference B2 cubic axes. The corresponding experimental value (Ohba et al.,1990) is
U∗exp =
1.0260 0.0100 00.0100 1.0260 0
0 0 0.9501
. (23)
There is reasonable agreement between the EIP model’s prediction and the experimentally observedvalue of the transformation stretch tensor.
Model 1
Parameter Value
Aaa 0.4754131760 eVBaa 4.7788992600
raaref 3.0284951200 A
raaθ 0.0139252220 A
Abb 0.1450200350 eV
Bbb 4.8068349900
rbbref 3.1179265800 A
rbbθ 0.0300213183 A
Aab 0.1426239530 eV
Bab 6.0000000000
rabref 3.0855868000 A
rabθ 0.0205887304 A
Table 6 Fitted parameters for the Morse EIP Model 1 of Au-47.5at%Cd.
14 Venkata Suresh Guthikonda, Ryan S. Elliott
θ
Ec( eVatom
)
−80 −40 0 40
0
1
2
3+
θ
α(10−5 K−1)
−80 −40 0 40
1.6
1.8
2
2.2
+
θ
a(A)
−80 −40 0 40
2
3
4
5
+
θ
K(GPa)
−80 −40 0 40
0
200
400
600
+
Fig. 6 Variation of cohesive energy Ec, linear thermal expansion coefficient α, lattice parameter a, and in-stantaneous bulk modulus K of B2 Au-47.5at%Cd with non-dimensional temperature θ for the parameters inTable 6. Plus signs identify the corresponding experimental values at the reference temperature θ = 1.
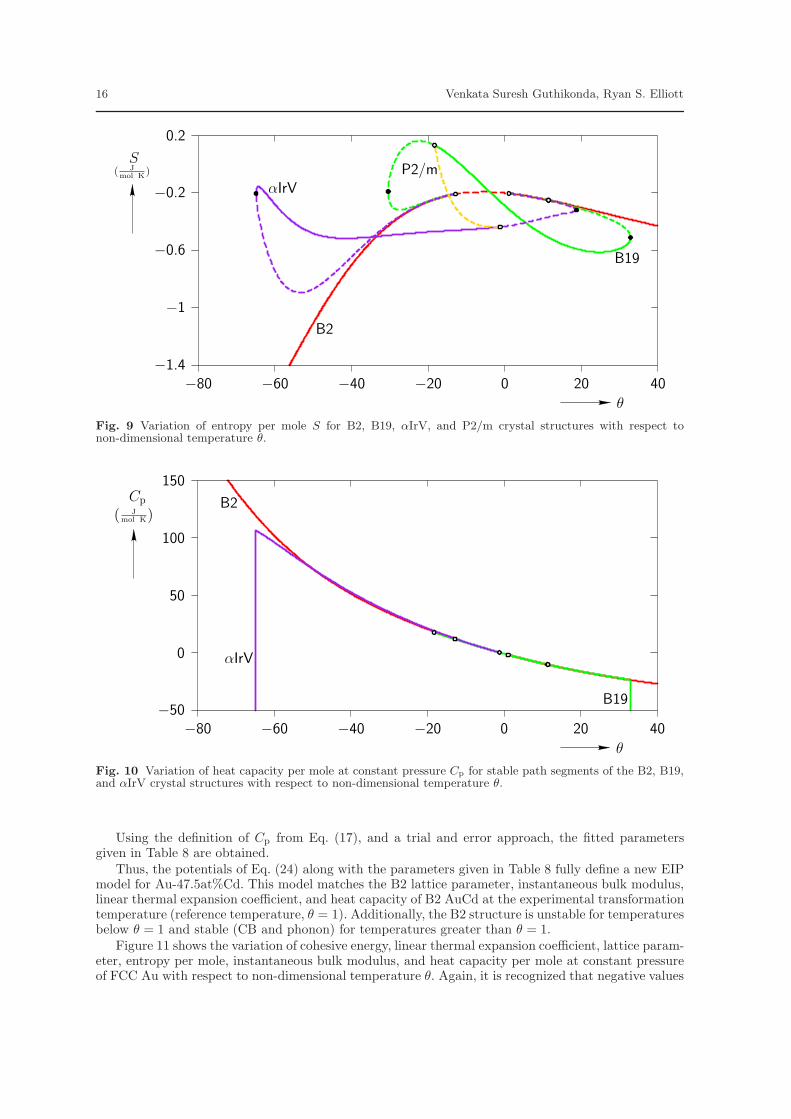
The variation of the HC free energy density with θ is shown in Fig. 8. This plot reveals a couple ofproblems with the current model for AuCd. First, the B19 phase is found to be stable for a wide rangeof temperatures. This implies too large of a temperature hysteresis for the B2 ↔ B19 MT. Second,these stress-free free energy vs. temperature curves should be interpreted as the Gibbs free-energydensity of the material (variation of energy with temperature under constant stress conditions). Underthis interpretation, one may immediately note that the model predicts negative values of both entropy(corresponding to the negative of the slope of the curves in Fig. 8, and defined by Eq. (14)) and heatcapacity at constant pressure (proportional to the second derivative of the curves in Fig. 8, and definedby Eq. (17)). This is further illustrated in Fig. 9 and Fig. 10, which plot the entropy per mole and heatcapacity per mole at constant pressure vs. θ respectively. The basic laws of equilibrium thermodynamicsdictate that these quantities must be positive for a stable material. It is therefore concluded that theEIP model, characterized by Eq. (21), is not capable of accurately predicting both the mechanical andthermal properties of the SMA Au-47.5at%Cd. The next section of this work introduces a more generalform of the Morse EIP model that is capable of more accurately capturing these properties.
7 Model 2: Morse EIPs with temperature-dependent bond stiffness and pair equilibrium
spacing
The effective Morse pair potential is now extended to include a linear temperature dependence of thebond stiffness parameter B giving
φ(r; θ) = A
{
exp
[
−2B(θ)
(
r
r(θ)− 1
)]
− 2 exp
[
−B(θ)
(
r
r(θ)− 1
)]}
,
r(θ) = rref + rθ(θ − 1),
B(θ) = Bref + Bθ(θ − 1).
(24)
Toward an Effective Interaction Potential Model for the Shape Memory Alloy AuCd 15
θ
λ3
−80 −60 −40 −20 0 20 400.5
0.7
0.9
1.1
1.3
B2
αIrV
P2/m
B19
Fig. 7 Variation of λ3 (largest eigenvalue of U) for the stress-free B2, B19, αIrV, and P2/m crystal structureswith respect to non-dimensional temperature θ.
θ
≈W
(GPa)
−80 −60 −40 −20 0 20 40−15.5
−15
−14.5
−14
−13.5
B2
αIrV
P2/mB19
Fig. 8 Variation of Homogenized Continuum free energy density≈
W for B2, B19, αIrV, and P2/m crystalstructures with respect to non-dimensional temperature θ.
The introduction of the temperature-dependent parameter B(θ) provides a mechanism by which themodel may reduce its free energy as the temperature increases at constant configuration. A negativevalue of Bθ is needed to obtain positive entropies and heat capacities, and thus the effective potentialbonds are expected to soften with θ, i.e., B(θ) decreases with increasing temperature.
The fitting procedure of Section 5 remains unchanged, but in addition, the heat capacity Cp atthe reference temperature for Au, Cd, and the B2 AuCd alloy are matched by the choice of the newparameters Baa
θ , Bbbθ , and Bab
θ respectively. Table 7 gives the experimental values for the heat capacitiesused for fitting. Note, due to the temperature dependence of B(θ), new values of raa
θ , rbbθ , and rab
θ mustalso be determined in order to ensure that the model matches the experimental thermal expansionvalues.
16 Venkata Suresh Guthikonda, Ryan S. Elliott
θ
S( Jmol K )
−80 −60 −40 −20 0 20 40−1.4
−1
−0.6
−0.2
0.2
B2
αIrVP2/m
B19
Fig. 9 Variation of entropy per mole S for B2, B19, αIrV, and P2/m crystal structures with respect tonon-dimensional temperature θ.
θ
Cp
( Jmol K)
−80 −60 −40 −20 0 20 40−50
0
50
100
150
B2
αIrV
B19
Fig. 10 Variation of heat capacity per mole at constant pressure Cp for stable path segments of the B2, B19,and αIrV crystal structures with respect to non-dimensional temperature θ.
Using the definition of Cp from Eq. (17), and a trial and error approach, the fitted parametersgiven in Table 8 are obtained.
Thus, the potentials of Eq. (24) along with the parameters given in Table 8 fully define a new EIPmodel for Au-47.5at%Cd. This model matches the B2 lattice parameter, instantaneous bulk modulus,linear thermal expansion coefficient, and heat capacity of B2 AuCd at the experimental transformationtemperature (reference temperature, θ = 1). Additionally, the B2 structure is unstable for temperaturesbelow θ = 1 and stable (CB and phonon) for temperatures greater than θ = 1.
Figure 11 shows the variation of cohesive energy, linear thermal expansion coefficient, lattice param-eter, entropy per mole, instantaneous bulk modulus, and heat capacity per mole at constant pressureof FCC Au with respect to non-dimensional temperature θ. Again, it is recognized that negative values
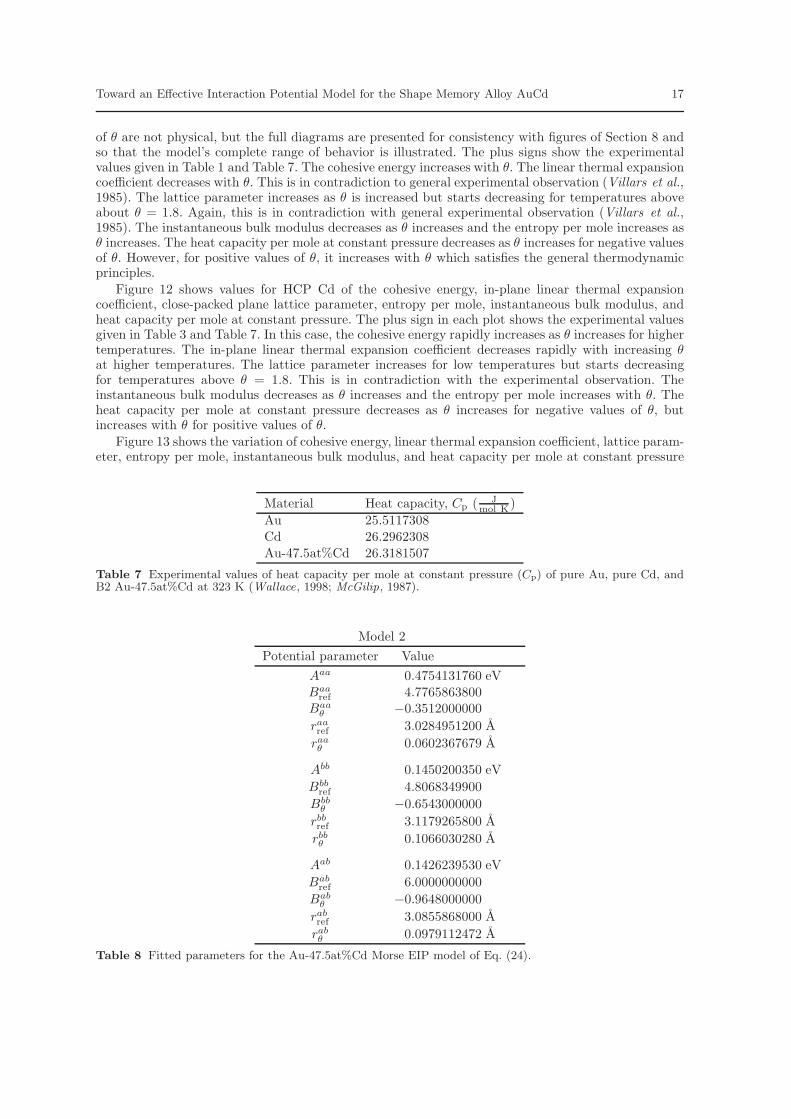
Toward an Effective Interaction Potential Model for the Shape Memory Alloy AuCd 17
of θ are not physical, but the full diagrams are presented for consistency with figures of Section 8 andso that the model’s complete range of behavior is illustrated. The plus signs show the experimentalvalues given in Table 1 and Table 7. The cohesive energy increases with θ. The linear thermal expansioncoefficient decreases with θ. This is in contradiction to general experimental observation (Villars et al.,1985). The lattice parameter increases as θ is increased but starts decreasing for temperatures aboveabout θ = 1.8. Again, this is in contradiction with general experimental observation (Villars et al.,1985). The instantaneous bulk modulus decreases as θ increases and the entropy per mole increases asθ increases. The heat capacity per mole at constant pressure decreases as θ increases for negative valuesof θ. However, for positive values of θ, it increases with θ which satisfies the general thermodynamicprinciples.
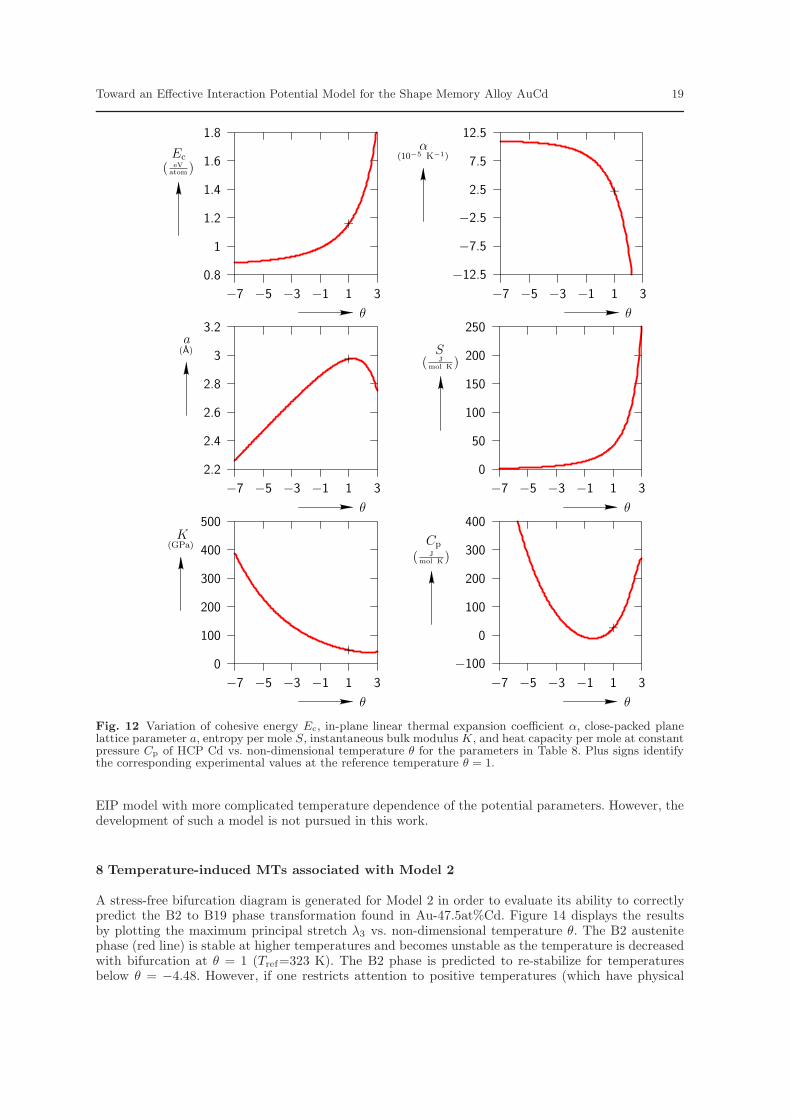
Figure 12 shows values for HCP Cd of the cohesive energy, in-plane linear thermal expansioncoefficient, close-packed plane lattice parameter, entropy per mole, instantaneous bulk modulus, andheat capacity per mole at constant pressure. The plus sign in each plot shows the experimental valuesgiven in Table 3 and Table 7. In this case, the cohesive energy rapidly increases as θ increases for highertemperatures. The in-plane linear thermal expansion coefficient decreases rapidly with increasing θat higher temperatures. The lattice parameter increases for low temperatures but starts decreasingfor temperatures above θ = 1.8. This is in contradiction with the experimental observation. Theinstantaneous bulk modulus decreases as θ increases and the entropy per mole increases with θ. Theheat capacity per mole at constant pressure decreases as θ increases for negative values of θ, butincreases with θ for positive values of θ.
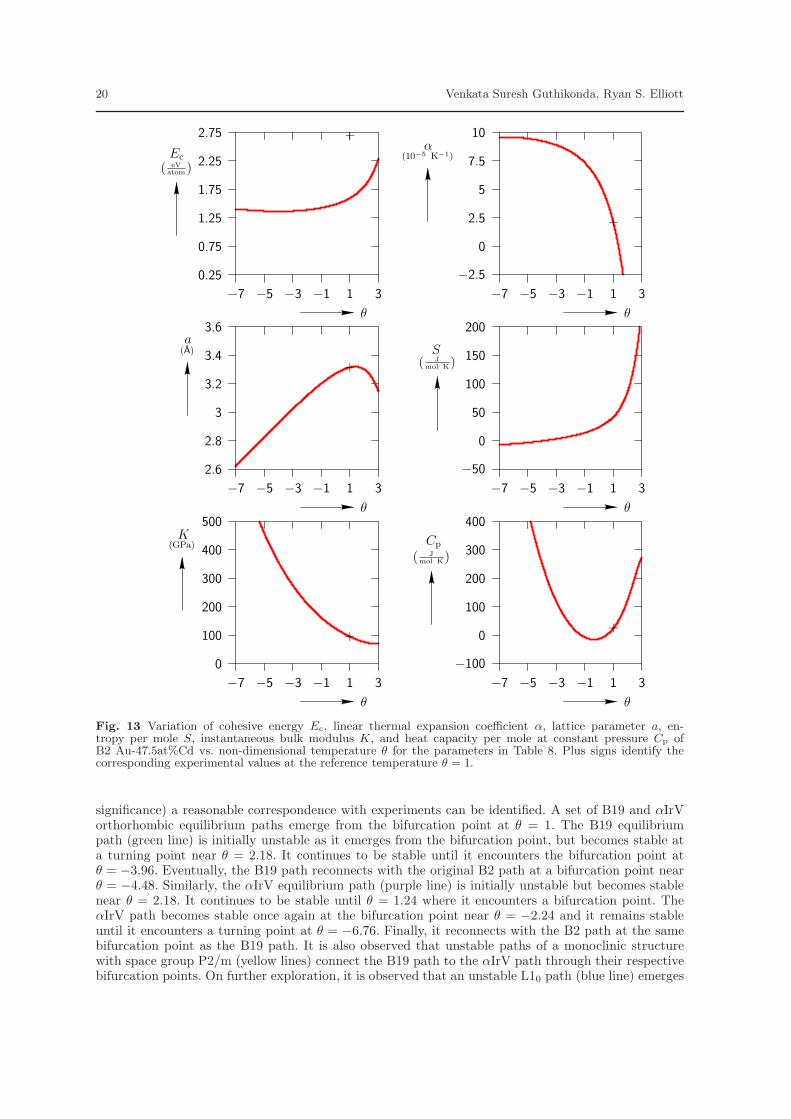
Figure 13 shows the variation of cohesive energy, linear thermal expansion coefficient, lattice param-eter, entropy per mole, instantaneous bulk modulus, and heat capacity per mole at constant pressure
Material Heat capacity, Cp ( Jmol K )
Au 25.5117308Cd 26.2962308Au-47.5at%Cd 26.3181507
Table 7 Experimental values of heat capacity per mole at constant pressure (Cp) of pure Au, pure Cd, andB2 Au-47.5at%Cd at 323 K (Wallace, 1998; McGilip, 1987).
Model 2
Potential parameter Value
Aaa 0.4754131760 eVBaa
ref 4.7765863800Baa
θ −0.3512000000
raaref 3.0284951200 A
raaθ 0.0602367679 A
Abb 0.1450200350 eV
Bbbref 4.8068349900
Bbbθ −0.6543000000
rbbref 3.1179265800 A
rbbθ 0.1066030280 A
Aab 0.1426239530 eV
Babref 6.0000000000
Babθ −0.9648000000
rabref 3.0855868000 A
rabθ 0.0979112472 A
Table 8 Fitted parameters for the Au-47.5at%Cd Morse EIP model of Eq. (24).

18 Venkata Suresh Guthikonda, Ryan S. Elliott
θ
Ec
( eVatom)
−7 −5 −3 −1 1 3
3
3.2
3.4
3.6
3.8
4
+
θ
α(10−5 K−1)
−7 −5 −3 −1 1 3
−4
−2
0
2
4
6
+
θ
a(A)
−7 −5 −3 −1 1 3
3.4
3.6
3.8
4
4.2
4.4
+
θ
S
( Jmol K)
−7 −5 −3 −1 1 3
0
25
50
75
100
125
θ
K(GPa)
−7 −5 −3 −1 1 3
100
200
300
400
500
600
+
θ
Cp
( Jmol K)
−7 −5 −3 −1 1 3
−100
0
100
200
300
400
+
Fig. 11 Variation of cohesive energy Ec, linear thermal expansion coefficient α, lattice parameter a, entropyper mole S, instantaneous bulk modulus K, and heat capacity per mole at constant pressure Cp of FCCAu vs. non-dimensional temperature θ for the parameters in Table 8. Plus signs identify the correspondingexperimental values at the reference temperature θ = 1.
of B2 AuCd. The plus sign in each plot shows the corresponding experimental value given in Table 5or Table 7. Note that it was not possible to match the experimental cohesive energy Ec at the refer-ence temperature. The cohesive energy increases with θ for positive θ. The linear thermal expansioncoefficient decreases as θ increases which is in contradiction with experimental results. For low valuesof θ, the lattice parameter increases with θ, but around θ = 1.8 it starts decreasing. This is also incontradiction with experimental observations. The instantaneous bulk modulus decreases as θ increasesand entropy per mole increases as θ increases. The heat capacity per mole at constant pressure de-creases as θ increases for negative values of θ but increases for positive values of θ, in agreement withthermodynamic principles.
The unphysical negative thermal expansion coefficient found for this model is certainly undesirable.We believe that this aspect of the model’s behavior could be rectified by the use of a more general
Toward an Effective Interaction Potential Model for the Shape Memory Alloy AuCd 19
θ
Ec
( eVatom)
−7 −5 −3 −1 1 3
0.8
1
1.2
1.4
1.6
1.8
+
θ
α(10−5 K−1)
−7 −5 −3 −1 1 3
−12.5
−7.5
−2.5
2.5
7.5
12.5
+
θ
a(A)
−7 −5 −3 −1 1 3
2.2
2.4
2.6
2.8
3
3.2
+
θ
S
( Jmol K)
−7 −5 −3 −1 1 3
0
50
100
150
200
250
θ
K(GPa)
−7 −5 −3 −1 1 3
0
100
200
300
400
500
+
θ
Cp
( Jmol K)
−7 −5 −3 −1 1 3
−100
0
100
200
300
400
+
Fig. 12 Variation of cohesive energy Ec, in-plane linear thermal expansion coefficient α, close-packed planelattice parameter a, entropy per mole S, instantaneous bulk modulus K, and heat capacity per mole at constantpressure Cp of HCP Cd vs. non-dimensional temperature θ for the parameters in Table 8. Plus signs identifythe corresponding experimental values at the reference temperature θ = 1.
EIP model with more complicated temperature dependence of the potential parameters. However, thedevelopment of such a model is not pursued in this work.
8 Temperature-induced MTs associated with Model 2
A stress-free bifurcation diagram is generated for Model 2 in order to evaluate its ability to correctlypredict the B2 to B19 phase transformation found in Au-47.5at%Cd. Figure 14 displays the resultsby plotting the maximum principal stretch λ3 vs. non-dimensional temperature θ. The B2 austenitephase (red line) is stable at higher temperatures and becomes unstable as the temperature is decreasedwith bifurcation at θ = 1 (Tref=323 K). The B2 phase is predicted to re-stabilize for temperaturesbelow θ = −4.48. However, if one restricts attention to positive temperatures (which have physical
20 Venkata Suresh Guthikonda, Ryan S. Elliott
θ
Ec
( eVatom)
−7 −5 −3 −1 1 3
0.25
0.75
1.25
1.75
2.25
2.75 +
θ
α(10−5 K−1)
−7 −5 −3 −1 1 3
−2.5
0
2.5
5
7.5
10
+
θ
a(A)
−7 −5 −3 −1 1 3
2.6
2.8
3
3.2
3.4
3.6
+
θ
S
( Jmol K)
−7 −5 −3 −1 1 3
−50
0
50
100
150
200
θ
K(GPa)
−7 −5 −3 −1 1 3
0
100
200
300
400
500
+
θ
Cp
( Jmol K)
−7 −5 −3 −1 1 3
−100
0
100
200
300
400
+
Fig. 13 Variation of cohesive energy Ec, linear thermal expansion coefficient α, lattice parameter a, en-tropy per mole S, instantaneous bulk modulus K, and heat capacity per mole at constant pressure Cp ofB2 Au-47.5at%Cd vs. non-dimensional temperature θ for the parameters in Table 8. Plus signs identify thecorresponding experimental values at the reference temperature θ = 1.
significance) a reasonable correspondence with experiments can be identified. A set of B19 and αIrVorthorhombic equilibrium paths emerge from the bifurcation point at θ = 1. The B19 equilibriumpath (green line) is initially unstable as it emerges from the bifurcation point, but becomes stable ata turning point near θ = 2.18. It continues to be stable until it encounters the bifurcation point atθ = −3.96. Eventually, the B19 path reconnects with the original B2 path at a bifurcation point nearθ = −4.48. Similarly, the αIrV equilibrium path (purple line) is initially unstable but becomes stablenear θ = 2.18. It continues to be stable until θ = 1.24 where it encounters a bifurcation point. TheαIrV path becomes stable once again at the bifurcation point near θ = −2.24 and it remains stableuntil it encounters a turning point at θ = −6.76. Finally, it reconnects with the B2 path at the samebifurcation point as the B19 path. It is also observed that unstable paths of a monoclinic structurewith space group P2/m (yellow lines) connect the B19 path to the αIrV path through their respectivebifurcation points. On further exploration, it is observed that an unstable L10 path (blue line) emerges
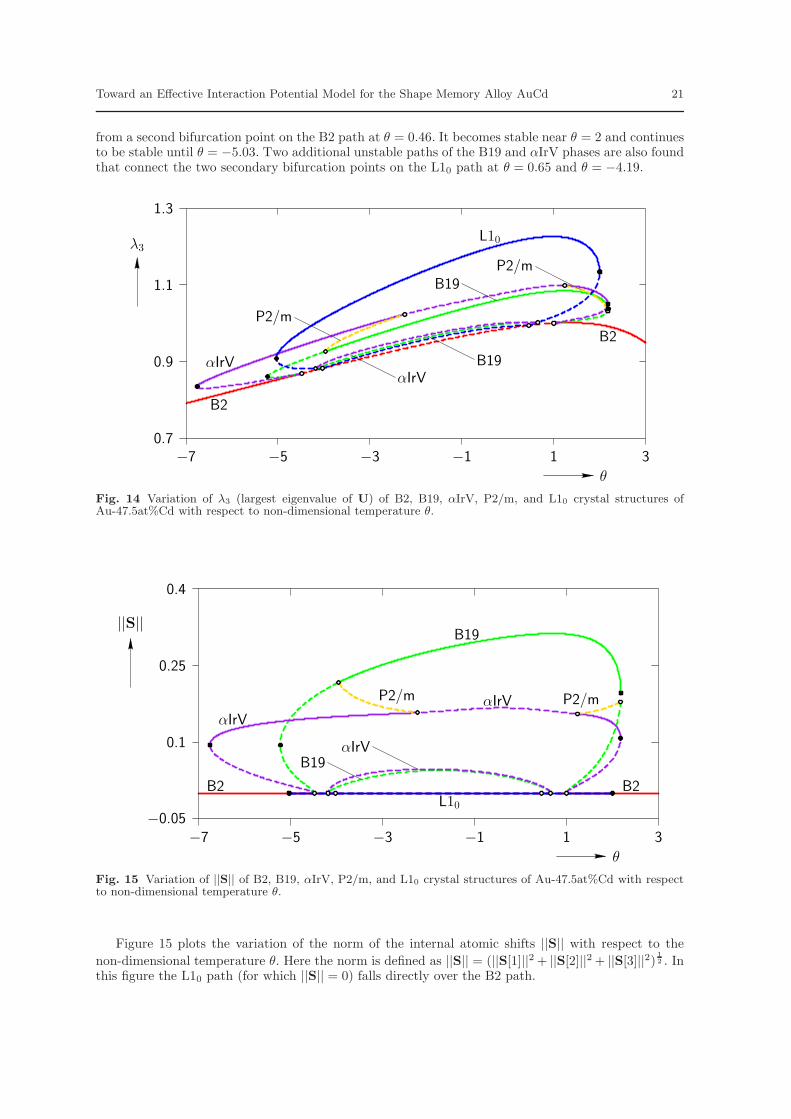
Toward an Effective Interaction Potential Model for the Shape Memory Alloy AuCd 21
from a second bifurcation point on the B2 path at θ = 0.46. It becomes stable near θ = 2 and continuesto be stable until θ = −5.03. Two additional unstable paths of the B19 and αIrV phases are also foundthat connect the two secondary bifurcation points on the L10 path at θ = 0.65 and θ = −4.19.
θ
λ3
−7 −5 −3 −1 1 30.7
0.9
1.1
1.3
B2
B2
αIrV
P2/m
P2/m
B19
L10
B19αIrV
Fig. 14 Variation of λ3 (largest eigenvalue of U) of B2, B19, αIrV, P2/m, and L10 crystal structures ofAu-47.5at%Cd with respect to non-dimensional temperature θ.
θ
||S||
−7 −5 −3 −1 1 3−0.05
0.1
0.25
0.4
B2 B2
αIrVαIrV P2/mP2/m
B19
L10
B19αIrV
Fig. 15 Variation of ||S|| of B2, B19, αIrV, P2/m, and L10 crystal structures of Au-47.5at%Cd with respectto non-dimensional temperature θ.
Figure 15 plots the variation of the norm of the internal atomic shifts ||S|| with respect to the
non-dimensional temperature θ. Here the norm is defined as ||S|| = (||S[1]||2 + ||S[2]||2 + ||S[3]||2) 1
2 . Inthis figure the L10 path (for which ||S|| = 0) falls directly over the B2 path.
22 Venkata Suresh Guthikonda, Ryan S. Elliott
θ
≈W
(GPa)
−7 −5 −3 −1 1 3−17
−15
−13
−11
B2
αIrV
P2/m
P2/m
B19
L10 B19αIrV
Fig. 16 Variation of free energy density≈
W of B2, B19, αIrV, P2/m, and L10 crystal structures of Au-47.5at%Cd with respect to non-dimensional temperature θ.
θ
≈W
(GPa)
0.5 1 1.5 2 2.5−17
−16
−15
−14
B2
αIrVB19
L10
2.068 2.07 2.072−16.07
−16.065
−16.06
Fig. 17 Variation of free energy density≈
W of stable path segments for the B2, B19, αIrV, P2/m, and L10
crystal structures of Au-47.5at%Cd with respect to non-dimensional temperature θ.
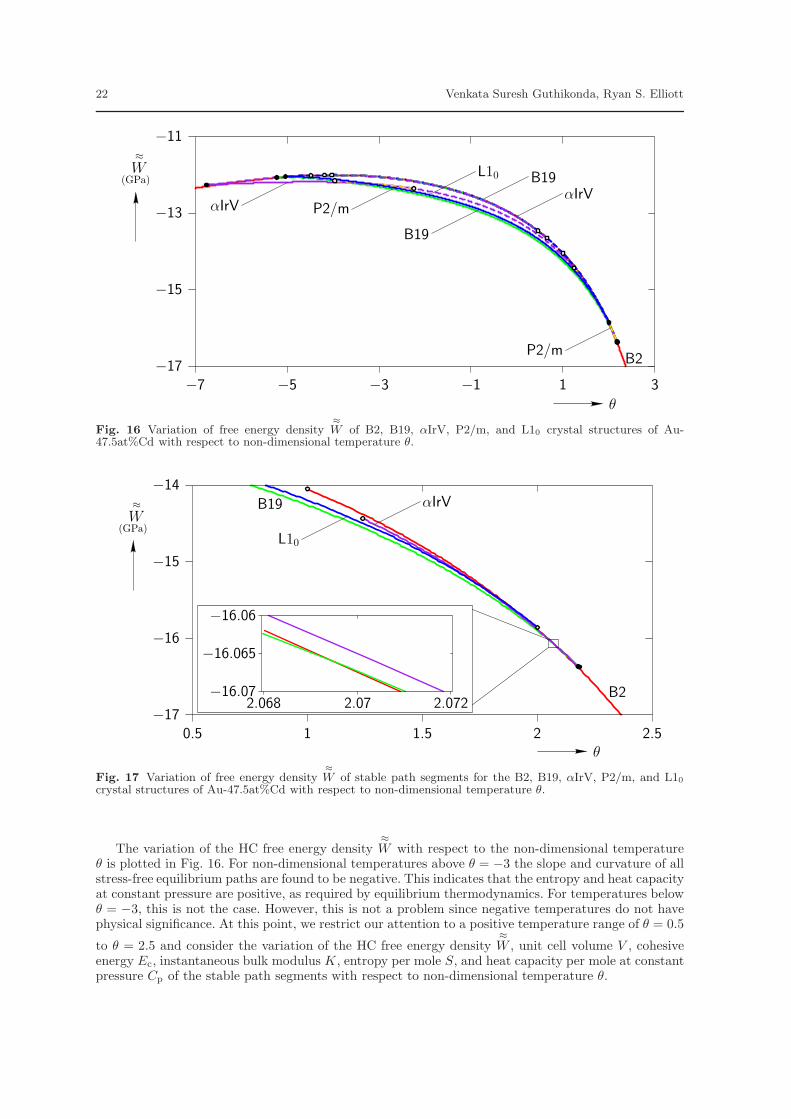
The variation of the HC free energy density≈W with respect to the non-dimensional temperature
θ is plotted in Fig. 16. For non-dimensional temperatures above θ = −3 the slope and curvature of allstress-free equilibrium paths are found to be negative. This indicates that the entropy and heat capacityat constant pressure are positive, as required by equilibrium thermodynamics. For temperatures belowθ = −3, this is not the case. However, this is not a problem since negative temperatures do not havephysical significance. At this point, we restrict our attention to a positive temperature range of θ = 0.5
to θ = 2.5 and consider the variation of the HC free energy density≈W , unit cell volume V , cohesive
energy Ec, instantaneous bulk modulus K, entropy per mole S, and heat capacity per mole at constantpressure Cp of the stable path segments with respect to non-dimensional temperature θ.
Toward an Effective Interaction Potential Model for the Shape Memory Alloy AuCd 23
θ
V(A
3)
0.5 1 1.5 2 2.568
70
72
74
B2
αIrV
B19
L10
Fig. 18 Variation of unit cell volume of the B2, B19, αIrV, and L10 crystal structures for Au-47.5at%Cd withrespect to non-dimensional temperature θ.
θ
Ec
( eVatom)
0.5 1 1.5 2 2.51.5
1.7
1.9
2.1
B2
αIrVB19
L10
Fig. 19 Variation of cohesive energy Ec of the B2, B19, αIrV, and L10 crystal structures for Au-47.5at%Cdwith respect to non-dimensional temperature θ.
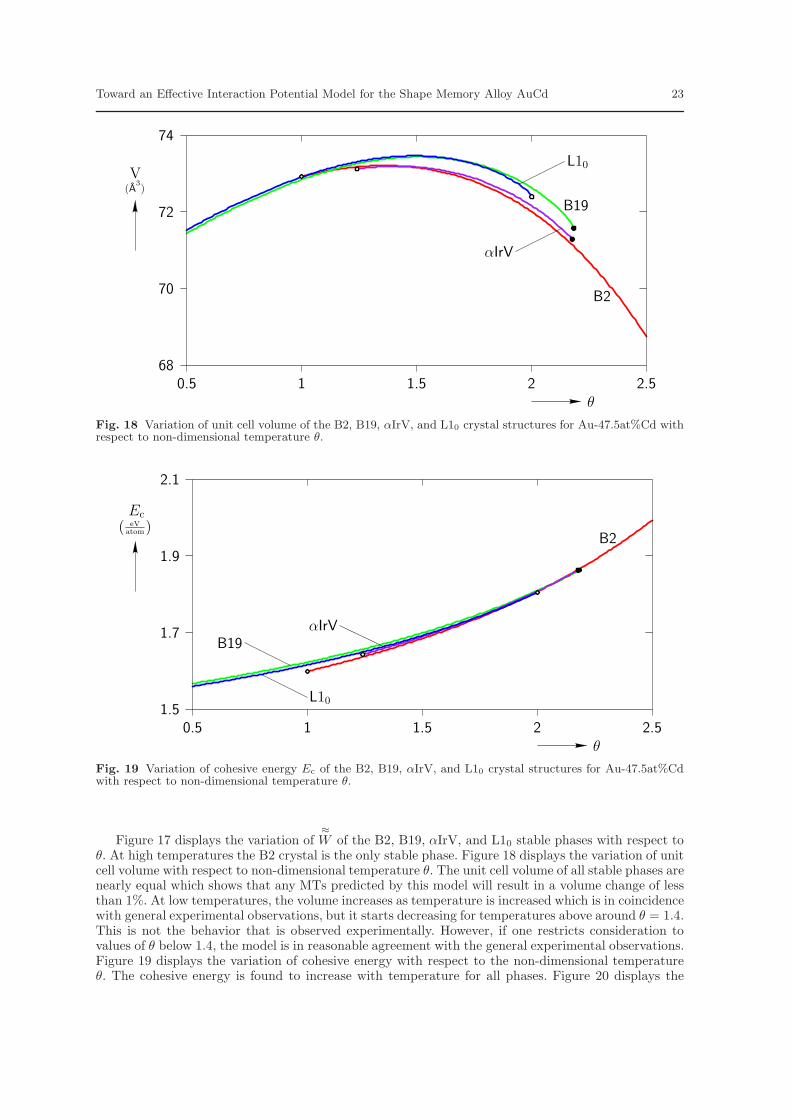
Figure 17 displays the variation of≈W of the B2, B19, αIrV, and L10 stable phases with respect to
θ. At high temperatures the B2 crystal is the only stable phase. Figure 18 displays the variation of unitcell volume with respect to non-dimensional temperature θ. The unit cell volume of all stable phases arenearly equal which shows that any MTs predicted by this model will result in a volume change of lessthan 1%. At low temperatures, the volume increases as temperature is increased which is in coincidencewith general experimental observations, but it starts decreasing for temperatures above around θ = 1.4.This is not the behavior that is observed experimentally. However, if one restricts consideration tovalues of θ below 1.4, the model is in reasonable agreement with the general experimental observations.Figure 19 displays the variation of cohesive energy with respect to the non-dimensional temperatureθ. The cohesive energy is found to increase with temperature for all phases. Figure 20 displays the
24 Venkata Suresh Guthikonda, Ryan S. Elliott
θ
K(GPa)
0.5 1 1.5 2 2.50
35
70
105
B2
αIrV
B19
L10
Fig. 20 Variation of instantaneous bulk modulus K of the B2, B19, αIrV, and L10 crystal structures forAu-47.5at%Cd with respect to non-dimensional temperature θ.
θ
S
( Jmol K)
0.5 1 1.5 2 2.530
60
90
120B2
αIrV
B19
L10
Fig. 21 Variation of entropy S of the B2, B19, αIrV, and L10 crystal structures for Au-47.5at%Cd withrespect to non-dimensional temperature θ.
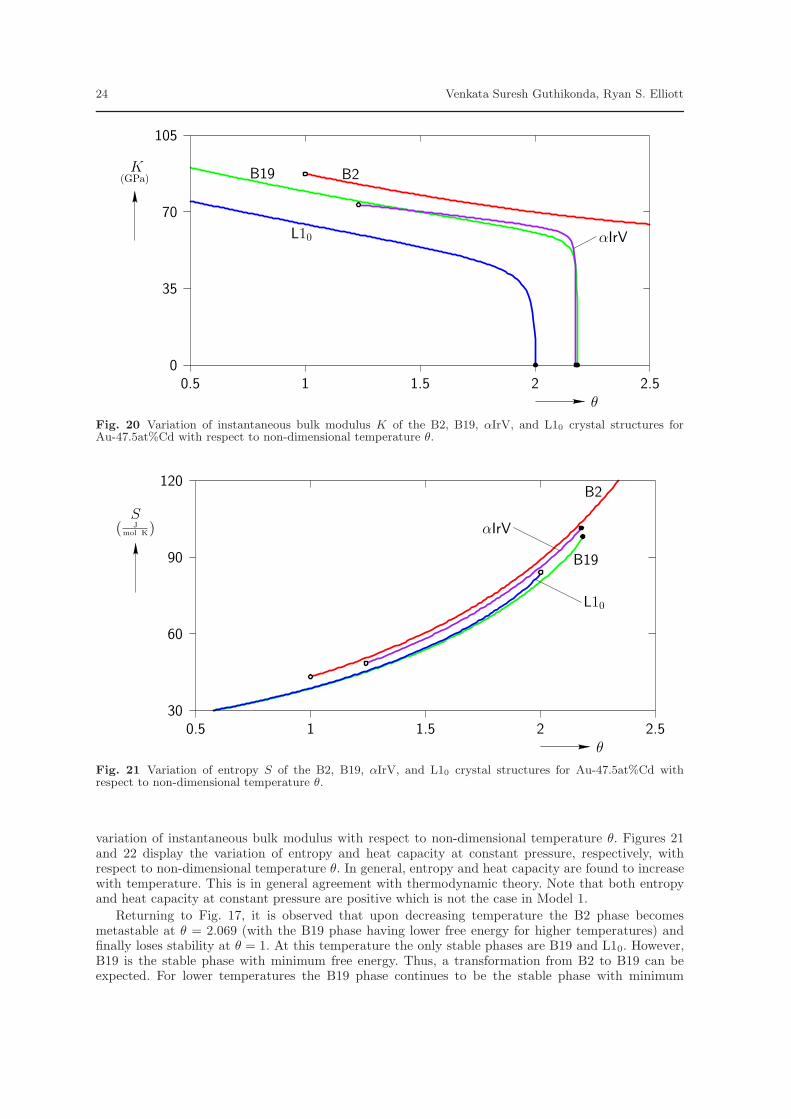
variation of instantaneous bulk modulus with respect to non-dimensional temperature θ. Figures 21and 22 display the variation of entropy and heat capacity at constant pressure, respectively, withrespect to non-dimensional temperature θ. In general, entropy and heat capacity are found to increasewith temperature. This is in general agreement with thermodynamic theory. Note that both entropyand heat capacity at constant pressure are positive which is not the case in Model 1.
Returning to Fig. 17, it is observed that upon decreasing temperature the B2 phase becomesmetastable at θ = 2.069 (with the B19 phase having lower free energy for higher temperatures) andfinally loses stability at θ = 1. At this temperature the only stable phases are B19 and L10. However,B19 is the stable phase with minimum free energy. Thus, a transformation from B2 to B19 can beexpected. For lower temperatures the B19 phase continues to be the stable phase with minimum
Toward an Effective Interaction Potential Model for the Shape Memory Alloy AuCd 25
θ
Cp
( Jmol K)
0.5 1 1.5 2 2.50
50
100
150B2
αIrV
B19
L10
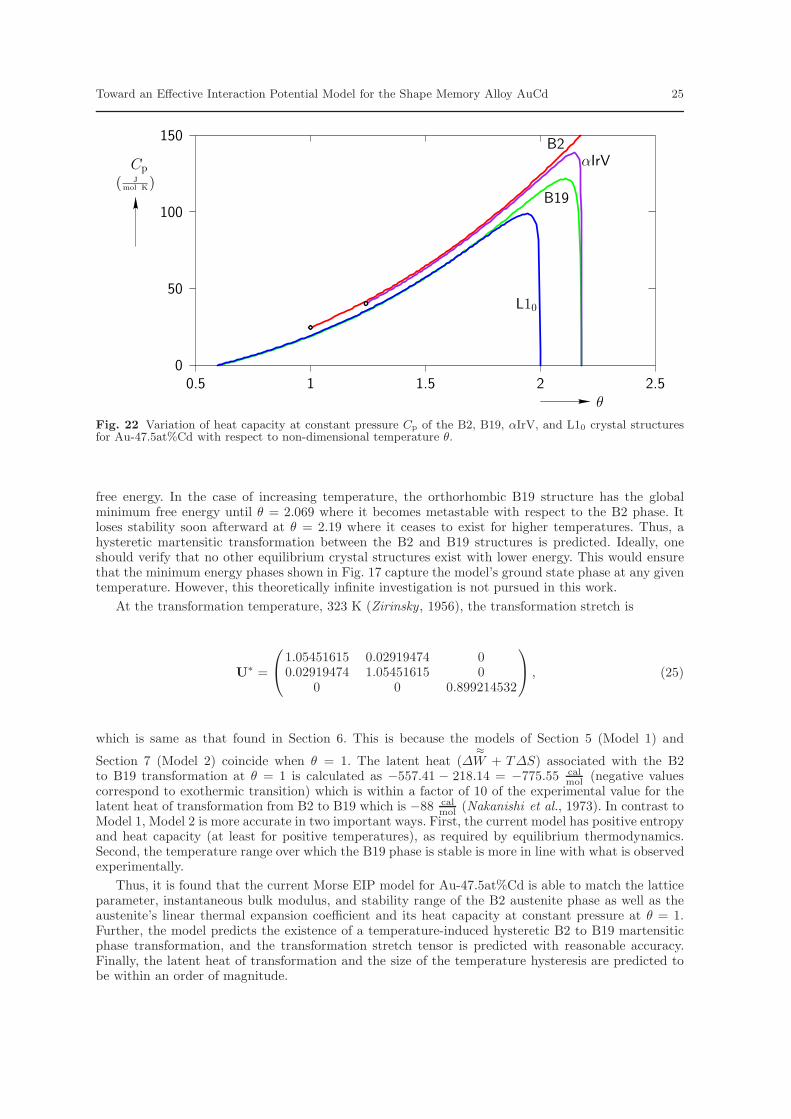
Fig. 22 Variation of heat capacity at constant pressure Cp of the B2, B19, αIrV, and L10 crystal structuresfor Au-47.5at%Cd with respect to non-dimensional temperature θ.
free energy. In the case of increasing temperature, the orthorhombic B19 structure has the globalminimum free energy until θ = 2.069 where it becomes metastable with respect to the B2 phase. Itloses stability soon afterward at θ = 2.19 where it ceases to exist for higher temperatures. Thus, ahysteretic martensitic transformation between the B2 and B19 structures is predicted. Ideally, oneshould verify that no other equilibrium crystal structures exist with lower energy. This would ensurethat the minimum energy phases shown in Fig. 17 capture the model’s ground state phase at any giventemperature. However, this theoretically infinite investigation is not pursued in this work.
At the transformation temperature, 323 K (Zirinsky, 1956), the transformation stretch is
U∗ =
1.05451615 0.02919474 00.02919474 1.05451615 0
0 0 0.899214532
, (25)
which is same as that found in Section 6. This is because the models of Section 5 (Model 1) and
Section 7 (Model 2) coincide when θ = 1. The latent heat (∆≈W + T∆S) associated with the B2
to B19 transformation at θ = 1 is calculated as −557.41 − 218.14 = −775.55 calmol (negative values
correspond to exothermic transition) which is within a factor of 10 of the experimental value for thelatent heat of transformation from B2 to B19 which is −88 cal
mol (Nakanishi et al., 1973). In contrast toModel 1, Model 2 is more accurate in two important ways. First, the current model has positive entropyand heat capacity (at least for positive temperatures), as required by equilibrium thermodynamics.Second, the temperature range over which the B19 phase is stable is more in line with what is observedexperimentally.
Thus, it is found that the current Morse EIP model for Au-47.5at%Cd is able to match the latticeparameter, instantaneous bulk modulus, and stability range of the B2 austenite phase as well as theaustenite’s linear thermal expansion coefficient and its heat capacity at constant pressure at θ = 1.Further, the model predicts the existence of a temperature-induced hysteretic B2 to B19 martensiticphase transformation, and the transformation stretch tensor is predicted with reasonable accuracy.Finally, the latent heat of transformation and the size of the temperature hysteresis are predicted tobe within an order of magnitude.
26 Venkata Suresh Guthikonda, Ryan S. Elliott
9 Discussion
An Effective Interaction Potential (EIP) model is developed to study the properties of crystallinematerials. In this model, effective pair potentials are used for the material’s atomic interactions andthe deformations of the crystal are described by Cauchy-Born (CB) kinematics. The crystal’s freeenergy density and equilibrium equations are formulated and stability criteria (both CB and phonon)are used to evaluate the material’s stability at any equilibrium configuration. This general model isthen applied to study the properties of the Shape Memory Alloy (SMA) Au-47.5at%Cd.
A first model uses temperature-dependent Morse pair potentials with the pair equilibrium spacingtaken as a linear function of temperature and all other parameters independent of temperature. Theadjustable parameters in each potential are fit by matching the Au-47.5at%Cd experimental values oflattice parameter, instantaneous bulk modulus, cohesive energy, and linear thermal expansion coeffi-cient at the transformation temperature. The model is evaluated by calculating its stress-free equilib-rium bifurcation diagram. This diagram identifies the existence of stable B2 cubic, B19 orthorhombic,and αIrV orthorhombic phases. From the plot of maximum principal stretch vs. non-dimensional tem-perature it is observed that the B19 phase is the only stable phase that exists below the transformationtemperature (θ = 1) where the B2 phase become unstable. This indicates the possibility of a Marten-sitic Transformation (MT) between the B2 and B19 structures. The associated transformation stretchtensor is calculated and found to be in reasonable agreement with the corresponding experimentalvalue. However, a plot of the stress-free Homogenized Continuum (HC) free energy density with re-spect to temperature reveals a couple of problems with this model. First, the B19 phase is found tobe stable for a wide range of temperatures which implies too large of a temperature hysteresis forthe B2 ↔ B19 MT. Second, the model predicts negative values of both entropy and heat capacity atconstant pressure which violate the basic laws of equilibrium thermodynamics for a stable material.
Therefore, a second model is developed using a more general form of the Morse EIP model thatis capable of addressing these short comings. In this model the temperature dependence is extendedto include a linear temperature dependence of the bond stiffness parameter. The fitting procedure ofthe first model is used again, and in addition, the heat capacity at constant pressure of Au, Cd, andB2 AuCd are matched at the reference temperature. A stress-free bifurcation diagram is generatedto evaluate the new model’s ability to correctly predict the MT between the B2 and B19 structures.From the plot of the maximum principal stretch vs. non-dimensional temperature it is observed that aB2 ↔ B19 MT occurs with a reasonable temperature hysteresis. The transformation stretch is foundto be in reasonable agreement with the experimental value. Further, it is found that the current modelis able to capture the (approximately) volume preserving nature of the martensitic transformation inAuCd. However, the model predicts a decrease in unit cell volume as temperature increases which is incontradiction to experimental observations. It is also found that the model predicts the latent heat oftransformation and size of temperature hysteresis to within an order of magnitude. We believe that amore general EIP model would be capable of correcting the negative thermal expansion and improvingthe prediction of latent heat and thermal hysteresis. However, the development of this model is left tofuture work.
Thus, the final Morse EIP model (Model 2) is capable of matching lattice parameter, instantaneousbulk modulus, cohesive energy, linear thermal expansion coefficient, and heat capacity at the referencetemperature. Further, the model predicts the existence of a B2 to B19 martensitic phase transformationwith properties that are in agreement with experimental observations. It should be noted that thefitting procedure used in the model’s development did not include any data associated with the B19martensite phase of the material.
Based on the above positive results, it is believed that EIP models have the potential for accuratelycapturing the entire range of SMA behavior. These EIP models are computationally inexpensive whencompared to Molecular Dynamics, Monte Carlo, and Density Functional Theory models. Thus, EIPmodels are an appealing accurate and computationally efficient alternative to more traditional simula-tion methodologies when one is interested in performing large scale simulations (such as the formationof complicated microstructures, or the interaction of a crack tip with the phase transformation) formaterials that exhibit MTs including SMAs.
Toward an Effective Interaction Potential Model for the Shape Memory Alloy AuCd 27
AcknowledgementsThe authors would like to thank Ellad B. Tadmor and Traian Dumitrica for helpful comments and suggestions.
This work has been supported by the National Science Foundation CAREER Grant CMMI-0746628 (Dr.Shih-Chi Liu, Program Director); by The University of Minnesota Grant-In-Aid of Research, Artistry andScholarship Program (GIA); and by The University of Minnesota Supercomputing Institute.
References
K. Bhattacharya. Microstructure of Martensite: Why It Forms and How It Gives Rise to the Shape-Memory Effect. Oxford University Press, 2003.
L. C. Brinson. One dimensional constitutive behavior of shape memory alloys: thermomechanicalderivation with non-constant material functions. Journal of Intelligent Material Systems and Struc-tures, 4(2):229–242, 1993.
L. C. Brinson and M. S. Huang. Simplifications and comparisons of shape memory alloy constitutivemodels. Journal of Intelligent Material Systems and Structures, 7:108–114, 1996.
A. Bystrom and K. E. Almin. X-ray investigation of AuCd alloys rich in Au. Acta Chemica Scandi-navica, 1(1):76–89, 1947.
L. C. Chang and T. A. Read. Plastic deformation and diffusionless phase changes in metals - the AuCdβ-phase. Transactions of the American Institute of Mining and Metallurgical Engineers, 191(1):47–52, 1951.
R. S. Elliott. Multiscale bifurcation and stability of multilattices. Journal of Computer-aided MaterialsDesign, 2008. doi:10.1007/s10820-007-9075-8.
R. S. Elliott, J. A. Shaw, and N. Triantafyllidis. Stability of pressure-dependent, thermally-induceddisplacive transformations in bi-atomic crystals. International Journal of Solids and Structures,39(13-14):3845–3856, 2002a.
R. S. Elliott, J. A. Shaw, and N. Triantafyllidis. Stability of thermally-induced martensitic transfor-mations in bi-atomic crystals. Journal of the Mechanics and Physics of Solids, 50(11):2463–2493,2002b.
R. S. Elliott, N. Triantafyllidis, and J. A. Shaw. Stability of crystalline solids–I: Continuum andatomic-lattice considerations. Journal of the Mechanics and Physics of Solids, 54(1):161–192, 2006a.
R. S. Elliott, N. Triantafyllidis, and J. A. Shaw. Stability of crystalline solids–II: Application totemperature-induced martensitic phase transformations in a bi-atomic crystal. Journal of the Me-chanics and Physics of Solids, 54(1):193–232, 2006b.
P. Entel, K. Kadau, R. Meyer, H. C. Herper, M. Schroter, and E. Hoffmann. Large-scale molecular-dynamics simulations of martensitic nucleation and shape-memory effects in transition metal alloys.Phase Transitions, 65:79–108, 1999.
P. Entel, R. Meyer, and K. Kadau. Molecular dynamics simulations of martensitic transitions. Philo-sophical Magazine B-Physics of Condensed Matter Statistical Mechanics Electronic Optical and Mag-netic Properties, 80(2):183–194, 2000.
L. Fast, J. M. Wills, B. Johansson, and O. Eriksson. Elastic-constants of hexagonal transition-metals- theory. Physics Review B, 51(24):17431–17438, 1995.
C. W. Garland and J. Silverman. Elastic constants of Cadmium from 4.2 K to 300 K. Physical Review,119(4):1218–1222, 1960.
L. A. Girifalco and V. G. Weizer. Application of the Morse potential function to cubic metals. PhysicalReview, 114(3):687–690, 1959.
B. C. Goo and C. Lexcellent. Micromechanics based modeling of two-way memory effect of a singlecrystalline shape memory alloy. Acta Metallurgica, 45:727–737, 1997.
M. Grujicic and P. Dang. Computer simulation of martensitic transformation in Fe-Ni face-centeredcubic alloys. Materials Science & Engineering A, 201:194–204, 1995.
V. S. Guthikonda. Effective Morse interaction potentials for modeling lattice-level instabilities in shapememory alloys. MS thesis, Univeristy of Minnesota, Minneapolis, MN 55455, 2007.
V. S. Guthikonda and R. S. Elliott. Stability and elastic properties of the stress-free B2 (CsCl-type)crystal for the Morse pair potential model. Journal of Elasticity, 2008. In press.
28 Venkata Suresh Guthikonda, Ryan S. Elliott
V. S. R. Guthikonda, M. K. Kiran, S. M. Sivakumar, and A. R. Srinivasa. On smeared and microme-chanical approaches to modeling martensitic transformations in SMA. Nonlinear Analysis: RealWorld Applications, 9:990–1011, 2008.
K. Huang and M. Born. Dynamical Theory of Crystal Lattices. Oxford University Press, 1962.M. S. Huang and L. C. Brinson. A multivariant model for single crystal shape memory alloys. Journal
of the Mechanics and Physics of Solids, 46:1379–1409, 1998.X. Huang, C. Bungarao, V. Godlevsky, and K. M. Rabe. Lattice instabilities of cubic NiTi from first
principles. Physical Review B-Condensed Matter, 65(1):1–5, 2002.X. Huang, K. M. Rabe, and G. J. Ackland. Crystal structures and shape-memory behavior of NiTi.
Nature Materials, 2(5):307–311, 2003.H. Ishida and Y. Hiwatari. MD simulation of martensitc transformations in TiNi alloys with MEAM.
Molecular Simulation, 33:459–461, 2007.Y. Ivshin and T. J. Pence. A constitutive model for hysteretic phase transition behavior. International
Journal of Engineering Science, 32:681–704, 1994.C. Kittel. Introduction to Solid State Physics. Wiley, 2005.C. Liang and A. Rogers. One-dimensional thermomechanical constitutive relations for shape memory
materials. Journal of Intelligent Material Systems and Structures, 1(2):207–234, 1990.Z. K. Lu and G. J. Weng. Martensitic transformations and stress-strain relations of shape-memory
alloys. Journal of the Mechanics of Physics of Solids, 45:1905–1928, 1997.J. F. McGilip. Alloying and entropy effects in predicting metal/compound-semiconductor interface
reactivity. J. Mater. Res., 2(4):516–523, 1987.R. Meyer and P. Entel. Martensite-austenite transition and phonon dispersion curves of Fe1−xNix
studied by molecular-dynamics simulations. Physical Review B, 57(9):5140–5147, 1998.N. Nakanishi, T. Mori, S. Miura, Y. Murakami, and S. Kachi. Pseudoelasticity in Au-Cd thermoelastic
martensite. Philosophical Magazine, 28:277–292, 1973.J. R. Neighbours and G. A. Alers. Elastic constants of Silver and Gold. Physical Review, 111(3):707–
712, 1958.T. Ohba, Y. Emura, S. Miyazaki, and K. Otsuka. Crystal structure of γ
′
2 martensite in Au-47.5%Cdalloy. Materials Transactions JIM, 31(1):12–17, 1990.
A. Olander. The crystal structure of AuCd. Zeitschrift Fur Kristallographie, 83(1/2):145–148, 1932.S. Ozgen and O. Adiguzel. Molecular dynamics simulations of diffusionless phase transformation in
quenched NiAl alloy model. Journal of Physics and Chemistry of Solids, 64(3):459–464, 2003.K. Parlinski, M. Parlinska, and R. Gotthardt. Phonons in austenite and martensite NiTi crystals.
Journal De Physique IV, 112:635–638, 2003.K. Parlinski and M. Parlinska-Wojtan. Lattice dynamics of NiTi austenite, martensite, and R phase.
Physical Review B, 67(064307):1–8, 2002.E. Patoor, A. Eberhardt, and M. Berveiller. Thermomechanical behavior of shape memory alloys.
Archives of Mechanics, 40(5-6):775–794, 1988.E. Patoor, A. Eberhardt, and M. Berveiller. Micromechanical modelling of the shape memory alloys.
Pitman Research Notes in Mathematics Series, 296:38–54, 1993.M. Pitteri and G. Zanzotto. Continuum Models for Phase Transitions and Twinning in Crystals,
volume 19 of Applied Mathematics. CRC Press, 2002.S. Rubini and P. Ballone. Martensitic transformations and phonon localization in Ni-Al alloys by
atomistic simulations. Meccanica, 30:439–448, 1995.Y. Shao, P. C. Clapp, and J. A. Rifkin. Molecular dynamics simulation of martensitic transformations
in NiAl. Metallurgical and Materials Transactions A, 27A:1477–1489, 1996.J. A. Shaw. A thermomechanical model for a 1-D shape memory alloy wire with propagating instabil-
ities. International Journal of Solids and Structures, 39(5):1275–1305, 2002.Q. P. Sun and K. C. Hwang. Micromechanics modelling for the constitutive behavior of polycrystalline
shape memory alloys–I. Derivation of general relations. Journal of the Mechanics and Physics ofSolids, 41(1):1–17, 1993a.
Q. P. Sun and K. C. Hwang. Micromechanics modelling for the constitutive behavior of polycrystallineshape memory alloys–II. Study of the individual phenomena. Journal of the Mechanics and Physicsof Solids, 41(1):19–33, 1993b.
K. Tanaka and S. Nagaki. A thermomechanical description of materials with internal variables in theprocess of phase-transitions. Ingenieur Archiv, 51(5):287–299, 1982.
Toward an Effective Interaction Potential Model for the Shape Memory Alloy AuCd 29
U.S. NRL Center for Computational Materials Science. Crystal lattice structures web page. http://cst-www.nrl.navy.mil/lattice/, 2008.
P. Villars, L. D. Calvert, and W. B. Pearson. Pearson’s handbook of crystallographic data for inter-metallic phases. Metals Park, 1985.
A. Vivet and C. Lexcellent. Micromechanical modelling for tension-compression pseudoelastic behaviorof AuCd single crystals. The European Journal Applied Physics, 4(2):125–132, 1998.
D. C. Wallace. Thermodynamics of Crystals. Courier Dover Publications, 1998.J. Wang, Y. Wang, R. Schaublin, C. Abromeit, and R. Gotthardt. The effect of point defects on
the martensitic phase transformation. Material Science and Engineering A - Structural MaterialProperties Microstructure and Processing, 438:102–108, 2006.
Y. Y. Ye, C. T. Chan, and K. M. Ho. Structural and electronic properties of the martensitic alloysTiNi, TiPd, and TiPt. Physical Review B, 56(7):3678–3689, 1997.
S. Zirinsky. The temperature dependence of the elastic constants of Gold-Cadmium alloys. ActaMetallurgica, 4(2):164–171, 1956.