toward sustainable groundwater in agriculture overviewag-groundwater.org/files/56496.pdf ·...
TRANSCRIPT
Toward Sustainable Groundwater inToward Sustainable Groundwater in Agriculture Overview
Introduction to Climate change and groundwater recharge
Methodology Methodology Climate change scenarios Case Study
Results and discussion Temporal impact Spatial impactSpatial impact Groundwater level changes
Conclusions
2
References
Climate Change and Groundwater RechargeIncrease of CO2 concentration and other greenhouse gases will have significant effect on global climate. Cli h ff i i i d h d l Climate change affects precipitation and hydrology, which in turn influences recharge to groundwater. Recharge to GW is an important source which has the Recharge to GW is an important source, which has the main role in GW resources availability.
To trace these changes to recharges and its consequent To trace these changes to recharges and its consequent effect on GW state, a combined modeling of climate change and GW is necessary.
3
Climate Change and Groundwater Recharge“Climate change affects: groundwater recharge rates andd th f d t t bldepth of groundwater tableHowever, there ispoor knowledge of the impactsp g pvery little research on the future impact of climate changeon GW, or GW–SW interactions. ” (IPCC 2008, p. 38)
Intergovernmental Panel on Climate Change (IPCC)emphasize a continuing need to assess the potential effectsf l d l f h
4
of CO2‐altered climates on aquifer recharge.
Climate Change and Groundwater RechargeGroundwater aquifers are recharged mainly:Precipitation, and/ori i i h f b diinteraction with surface water bodies,Hence,direct influence of climate change on precipitation anddirect influence of climate change on precipitation andsurface water ultimately affect groundwater systems.
5
Climate Change and Groundwater RechargeClimate change affects surface water resourcesthrough changes in the major climate variables
hsuch as:air temperature,precipitationprecipitation,evapotranspiration
therefore,Precise estimation of groundwater recharge due to changesin these variables is necessary to quantify the impact ofclimate change on groundwater resources
6
climate change on groundwater resources.
Climate Change and Groundwater RechargeGW recharge is affected by many complex parameters, including: climatic factor such as amount and intensity of rainfall climatic factor such as amount and intensity of rainfalland evaporation
characteristics of the recharge beds such as: topography; in particular the slope of the land surface, type,topography; in particular the slope of the land surface, type, amount of vegetation cover and types of land use, residual soil moisture stored in the soil profile fromprevious rainfall eventsp
aquifer hydraulic properties to capture and transmit water
7
Climate Change and Groundwater RechargeFinally, recharge rates can be extensively impacted by human activities such as:increasing residential development (increased impervious cover), and
high water usage coupled with:high water usage coupled with: low recharge during the summer months; percolation from water distribution systems, sewers, and septic tanks; and
over‐irrigation of parks and lawns.
8
Climate Change and Groundwater RechargeThe removal of deep rooted perennials in favor of crops, or plantation establishment in former pasture country can have an impact on the volume of water entering groundwater p g gsystems.
The significance of each of the factors controlling recharge will vary from site to site and may vary over time as land will vary from site to site and may vary over time as land use and vegetation cover changes.
It can be important to manage land use to protect both the p g pquality and volume of water entering aquifer systems.
9
MethodologyIn this study, the impact of climate change on GW on two plain of Karkheh‐river basin (Iran) were
dassessed;Using two downscaled scenarios of CGCM2 and two large‐scale scenarios from CGCM3 to predict changes in large‐scale scenarios from CGCM3 to predict changes in future.
The physically based hydrologic model HELP3 (Schroeder et al., 1994) in conjunction with GIS forced to simulate temporal and spatial recharge in three future periods: 2010‐2039, 2040‐2069, and 2070‐2099.
10
periods: 2010 2039, 2040 2069, and 2070 2099.
Methodology
The method applies hydrologic HELP3 model incorporated
with a geographic information system (GIS).with a geographic information system (GIS).
Two downscaled scenarios of CGCM2(A2 & B2) and two
l l i (A B & B ) f CGCM dlarge‐scale scenarios (A1B & B1) from CGCM3 were used to
predict change in future.
In addition to temporal changes, spatial future changes in
groundwater recharge are presented using physically based
11
g g p g p y y
methodology similar to Jyrkama et al. (2007).
MethodologyThe approach (based on the method by Jyrkama et al. ,2007,
Scibek and Allen, 2006), uses:Scibek and Allen, 2006), uses:
daily precipitation,
temperature and solar radiation records temperature and solar radiation records
land use/land cover and soils data.
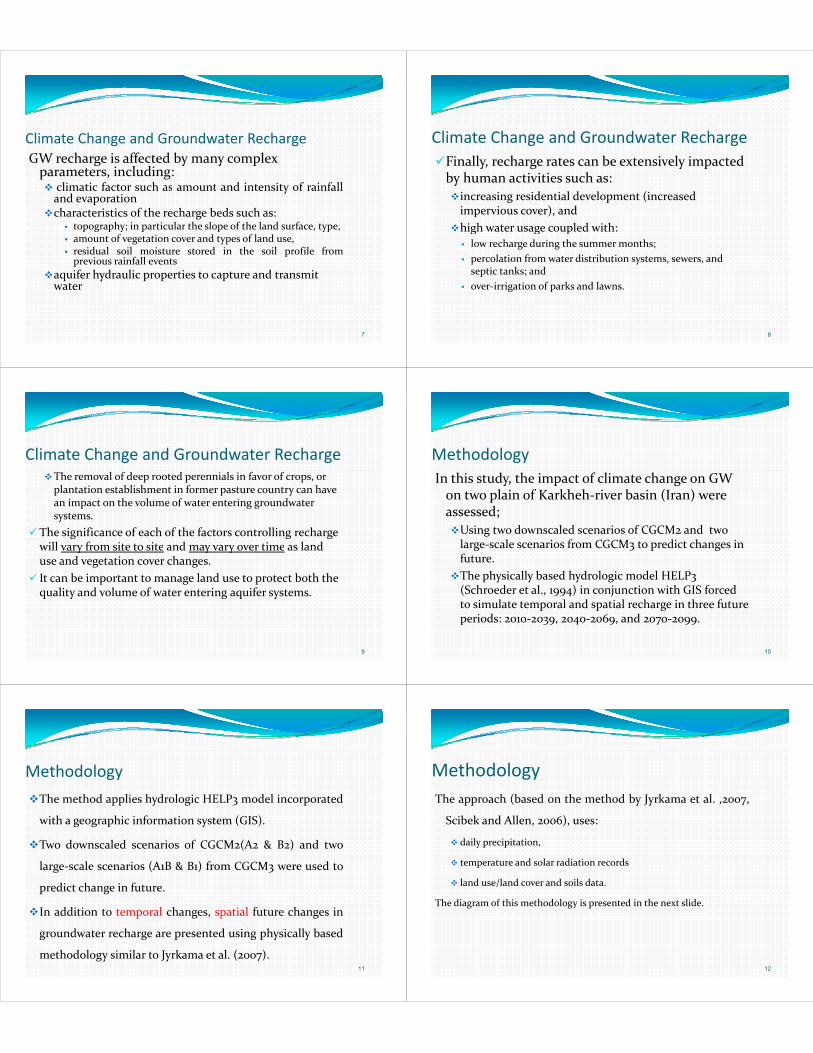
Th di f thi th d l i t d i th t lidThe diagram of this methodology is presented in the next slide.
12
13
MethodologyClimate change scenarios:All GCM data used in this study were obtained from IPCC data distribution center and Canadian Center for Climate Modeling and Analysis data center. The emissions scenarios used in this study A2 and B2 The emissions scenarios used in this study, A2 and B2 from CGCM2, B1 and A1B from CGCM3, are described in detail by Nakicenovic et al. (2000). Each scenario y ( )produces different atmospheric concentrations of future greenhouse gases.
14
MethodologyA2, B2 represent the highest and lowest CO2 emissions scenario for which used to run CGCM2, B h h hi h i i CO f SRES i B1 has the highest emission CO2 of SRES scenarios, A1B has CO2 emission lower than A2 and higher than others (IPCC 2001) others (IPCC, 2001), A1B assumes a world of very rapid economic growth, a global population that peaks in mid‐century and rapid g p p p y pintroduction of new and more efficient technologies.
15
MethodologyA1B describe balance across all sources fossil intensive and
non‐fossil energy resources. B1 describes a convergent world with the same global population B1 describes a convergent world, with the same global population
as A1, but with more rapid changes in economic structures toward a service and information economy.
B d ib ld ith i t di t l ti d i B2 describes a world with intermediate population and economic growth, emphasizing local solutions to economic, social, and environmental sustainability. A2 describes a very heterogeneous
ld i h hi h l i h l i d l world with high population growth, slow economic development and slow technological change. No likelihood has been attached to any of the SRES scenarios (IPCC, 2001).
16
MethodologyThe water‐budget model called the Hydrological Evaluation of Landfill Performance
(HELP) model version 3.07 (Schroeder et al., 1994). (HELP) model version 3.07 (Schroeder et al., 1994). HELP is a quasi‐two‐dimensional deterministic, water routing
model which simulate all of the important surface and subsurface hydrologic processes for estimating daily movement subsurface hydrologic processes for estimating daily movement of water into the ground, including: snow accumulation; snowmelt; surface runoff; surface runoff; evapotranspiration; vegetation growth and decay; soil freeze/ thaw from air temperature, and vertical unsaturated drainage for each discrete layered soil column
17
vertical unsaturated drainage for each discrete layered soil column.
MethodologyDaily infiltration into each layer is determined indirectly from a surface‐water balance. E h d i fil i i d l h f Each day, infiltration is assumed to equal the sum of rainfall and snowmelt, minus the sum of runoff, surface storage surface evaporation and plant surface storage, surface evaporation and plant transpiration. Vertical percolation through the base of the deepest p g pmodel layer, which is set equal to the water table depth, is considered as GW recharge.
18

MethodologyHELP has been used in many GW recharge studies (e.g., Gogolev, 2002; Allen et al., 2004; Jyrkama and Sykes 2005 2007; Scibek and Allen 2006a b; Allen Sykes, 2005, 2007; Scibek and Allen, 2006a, b; Allen and Toews, 2009).The HELP model was chosen mainly because it is a The HELP model was chosen mainly because it is a well‐documented, readily available, user friendly and furthermore because of the availability of its required input data.
19
Case StudyIn this study impact of climate change on GW recharge in two different climatic plains of Karkheh river basin in Khuzestan Iran has been investigated using a in Khuzestan, Iran, has been investigated using a physically‐based methodology that can be used for predicting both temporal and spatial varying p g p p y ggroundwater recharge. Recharge was estimated using the Hydrological
( )Evaluation of Landfill Performance (HELP3) water budget model.
20
Case StudyKarkheh River Basin is, most notably, the eastern flank of the "cradle of civilization" (ancient Mesopotamia).
Has an area of 50764 km2 has a population of around 4 million of as a a ea o 50764 as a popu at o o a ou d 4 o owhich 67% are living in rural areas.
The mean annual precipitation varies from 150 mm in the south to 750 mm in the north and the climate is mainly semi‐arid.
This major river basin of western Iran has unique agricultural and hydrological aspects; but also much in common with other catchments in developing countries around the world:
l t rural poverty land degradation, low water and agricultural productivity, and growing upstream‐downstream competition and conflict for water
21
growing upstream downstream competition and conflict for water.
Case StudyThe future of the Karkheh River Basin and its people’s livelihoods clearly depends on more holistic, basin‐wide management and monitoring of natural basin wide management and monitoring of natural resources—water, soil, vegetation and livestock. As water is the most limiting natural resource in this b i i i d i i ill l basin, any increase in water productivity will almost certainly benefit rural livelihoods. To ensure the sustainability of the improvements in To ensure the sustainability of the improvements in water productivity, assessment of the possible impacts of climate change on hydrology and water resources in the basin is necessary
22
the basin is necessary.
Case StudyAs a result of population growth and economic development,
water demand and urbanization is increasing in the basin. Both the climatic and non‐climatic changes are dynamic These Both the climatic and non climatic changes are dynamic. These
changes complicate water resources management (i.e. water supply, flood management, drought management).
U d t di th i t f li t h h d l d Understanding the impacts of climate change on hydrology and water resources of the basin will help decision‐makers to cope with these changes and manage water resources adaptively in the f future.
Understanding recharge is also necessary to properly assess aquifer vulnerability to contamination, since the transport of
23
most groundwater contaminants.
Case StudyThere has been a significant increase in the extraction of GW resources in Iran in the last 3 decades. Thi h l d i d f h i This has led to increased awareness of the importance of managing such resources to ensure their long term sustainability sustainability. This awareness has been sharpened by more severe drought over much of Karkheh River basin and is greflected in the attention to GW in the government water policy statements.
24
Case StudyGW is a major component of the dry Karkheh‐river basin environment. I i h i f GW d d It supports a rich variety of GW dependent ecosystems, provides base flows to river systems, and supports much of Iran’s economic cultural and social supports much of Irans economic, cultural, and social development, especially in the arid zone that covers most of Iran. An important aspect critical to GW management issues is ultimately based on understanding of how the resource is being replenished or recharged
25
resource is being replenished or recharged.
Case Study
3%
Groundwater Usage in Kuhdasht Plain
%
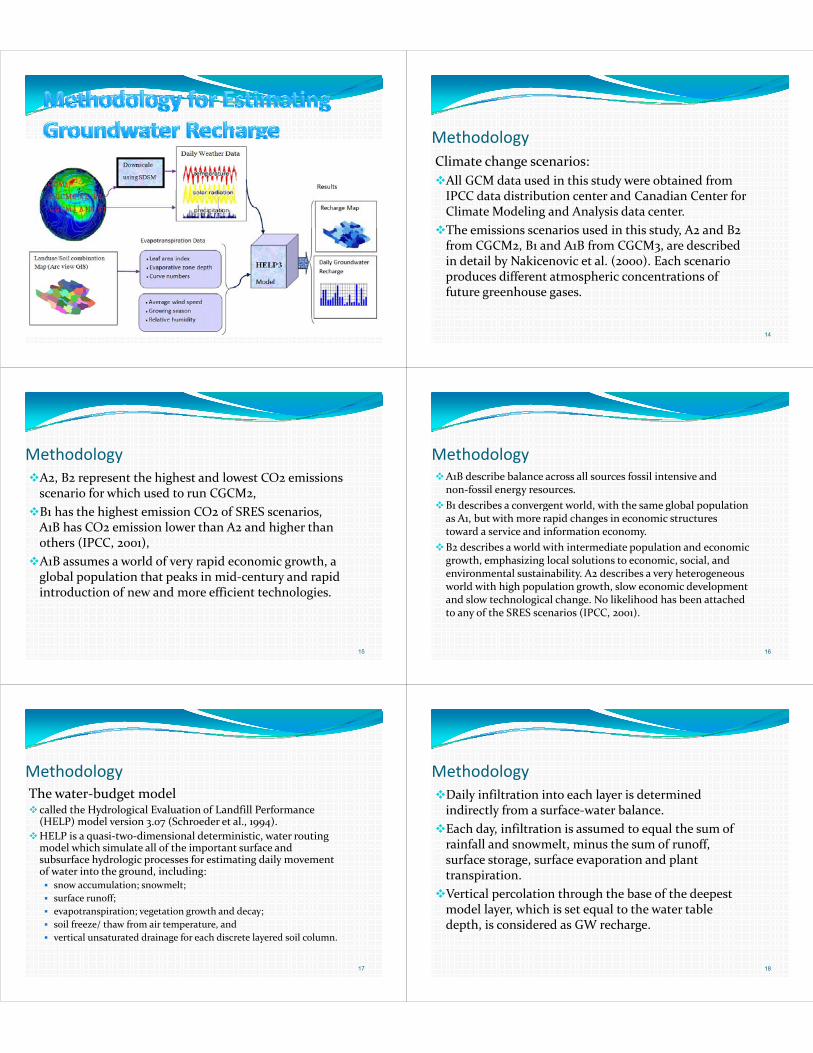
Groundwater Usage in Karkheh‐Noor Plain
13%
8%
Agricultural
7%5%
Agricultural3 gIndustrial HouseholdReceational
23%
gIndustrial HouseholdReceational
76%
Receational65% Receational
26
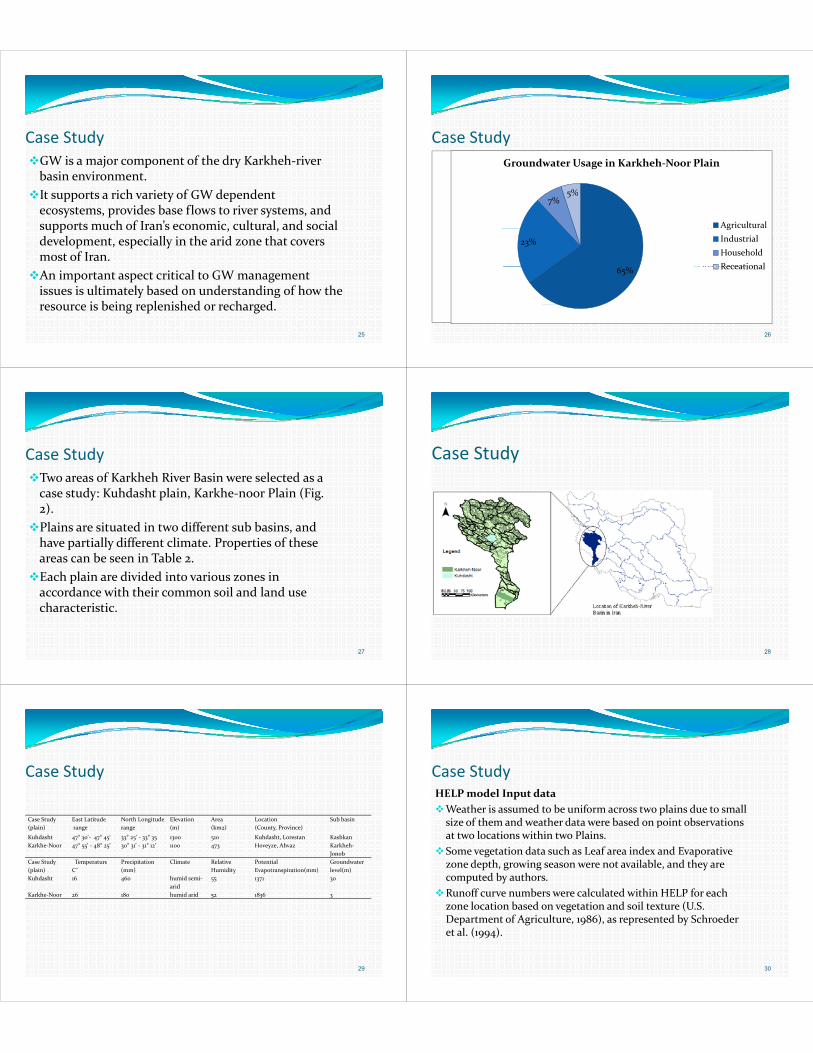
Case StudyTwo areas of Karkheh River Basin were selected as a case study: Kuhdasht plain, Karkhe‐noor Plain (Fig. 2) 2). Plains are situated in two different sub basins, and have partially different climate Properties of these have partially different climate. Properties of these areas can be seen in Table 2. Each plain are divided into various zones in paccordance with their common soil and land use characteristic.
27
Case Study
28
Case Study
Case Study East Latitude North Longitude Elevation Area Location Sub basin(plain) range range (m) (km2) (County, Province)
Kuhdasht 47° 30'‐ 47° 45' 33° 25' ‐ 33° 35 1300 510 Kuhdasht, Lorestan KashkanKarkhe‐Noor 47° 55' ‐ 48° 25' 30° 31' ‐ 31° 12' 1100 473 Hoveyze, Ahvaz Karkheh‐
JonobCase Study Temperature Precipitation Climate Relative Potential Groundwater Case Study(plain)
TemperatureC˚
Precipitation(mm)
Climate Relative Humidity
Potential Evapotranspiration(mm)
Groundwater level(m)
Kuhdasht 16 460 humid semi‐arid
55 1371 30
Karkhe‐Noor 26 180 humid arid 52 1836 3
29
Case StudyHELP model Input dataWeather is assumed to be uniform across two plains due to small
size of them and weather data were based on point observations size of them and weather data were based on point observations at two locations within two Plains.
Some vegetation data such as Leaf area index and Evaporative d th i t il bl d th zone depth, growing season were not available, and they are
computed by authors. Runoff curve numbers were calculated within HELP for each
zone location based on vegetation and soil texture (U.S. Department of Agriculture, 1986), as represented by Schroeder et al. (1994).
30
Results and DiscussionThe impact of climate change was modeled using two downscaled scenarios (A2, B2) due to CGCM2 and two large scale scenarios (AB1 B1) due to CGCM3 model large scale scenarios (AB1, B1) due to CGCM3 model results. These data were derived for three periods: 2010‐2039, 2040‐2069, and 2070‐2099. 39, 4 9, 7 99
31
Results and Discussion Figure 2 illustrates the position of Karkheh River Basin and the
20‐cell grid‐mesh that we have considered (in a previous study) on the basin in order to make downscaled data in 0.5 x 0.5 degree 5 5 gscale and run VIC model.
Figure 2. Karkheh River Basin and 20‐cell grid‐mesh
32
Results and Discussion
Case study Predicted change in mean annual climate parameters (2010‐2099)Scenarios Precipitation Temperature Solar Scenarios Precipitation
(mm/year, total percent)
Temperature(°C/year, total
percent)
Solar Radiation(total
percent)K hd h Pl i B ( %) ( 6% ) % Kuhdasht Plain B2
A2A1BB1
+1.4 (40%)٭٭٭
+0.030(16% )+0.066(37% )+0.025(14% )+0.025(14% )
+3.2% +8.8% +4.6% +0.5% 5( 4 ) 5
Karkheh‐Noor Plain
B2A2A1BB
+1.1(31%)+0.51(23%)
٭٭
+0.034(11% )+0.061(23% )+0.028(13% )
(8% )
+5.2% +7.2% +3.2%
%
33
B1 ٭ +0.022(8% ) +1.1% + Increasing trend−Decreasing trend ٭ No trend
Results and Discussion
Figure 3: Cumulative Recharge, Evapotranspiration, Runoff and Precipitation under A2. B2, A1B, B1 scenarios in Kuhdasht plain
34
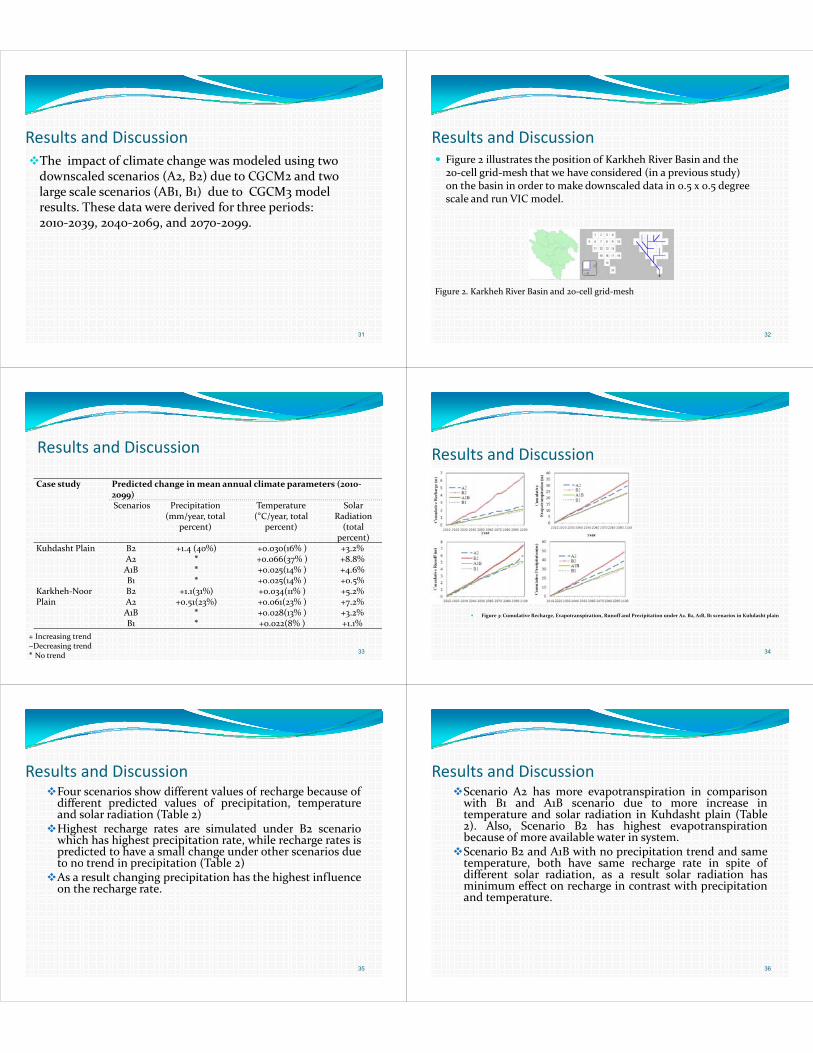
Results and DiscussionFour scenarios show different values of recharge because ofdifferent predicted values of precipitation, temperatureand solar radiation (Table 2)
h h l d dHighest recharge rates are simulated under B2 scenariowhich has highest precipitation rate, while recharge rates ispredicted to have a small change under other scenarios dueto no trend in precipitation (Table 2)to no trend in precipitation (Table 2)
As a result changing precipitation has the highest influenceon the recharge rate.
35
Results and DiscussionScenario A2 has more evapotranspiration in comparisonwith B1 and A1B scenario due to more increase intemperature and solar radiation in Kuhdasht plain (Table2) Also Scenario B2 has highest e apotranspiration2). Also, Scenario B2 has highest evapotranspirationbecause of more available water in system.
Scenario B2 and A1B with no precipitation trend and sametemperature both have same recharge rate in spite oftemperature, both have same recharge rate in spite ofdifferent solar radiation, as a result solar radiation hasminimum effect on recharge in contrast with precipitationand temperature.and temperature.
36
Results and Discussion (annual)Fi 4 R h E t i ti R ff d P i it ti d A2 B2 A1B B1Fig. 4: Recharge, Evapotranspiration, Runoff and Precipitation under A2. B2, A1B, B1
scenarios in Kuhdasht plain
500
600
A1BA2
300
400
nual
(mm
) Historical (1989-2009)B2B1
200
300
Mea
n A
nn
0
100
37
Precipitation Runoff Evapotranspiration Recharge
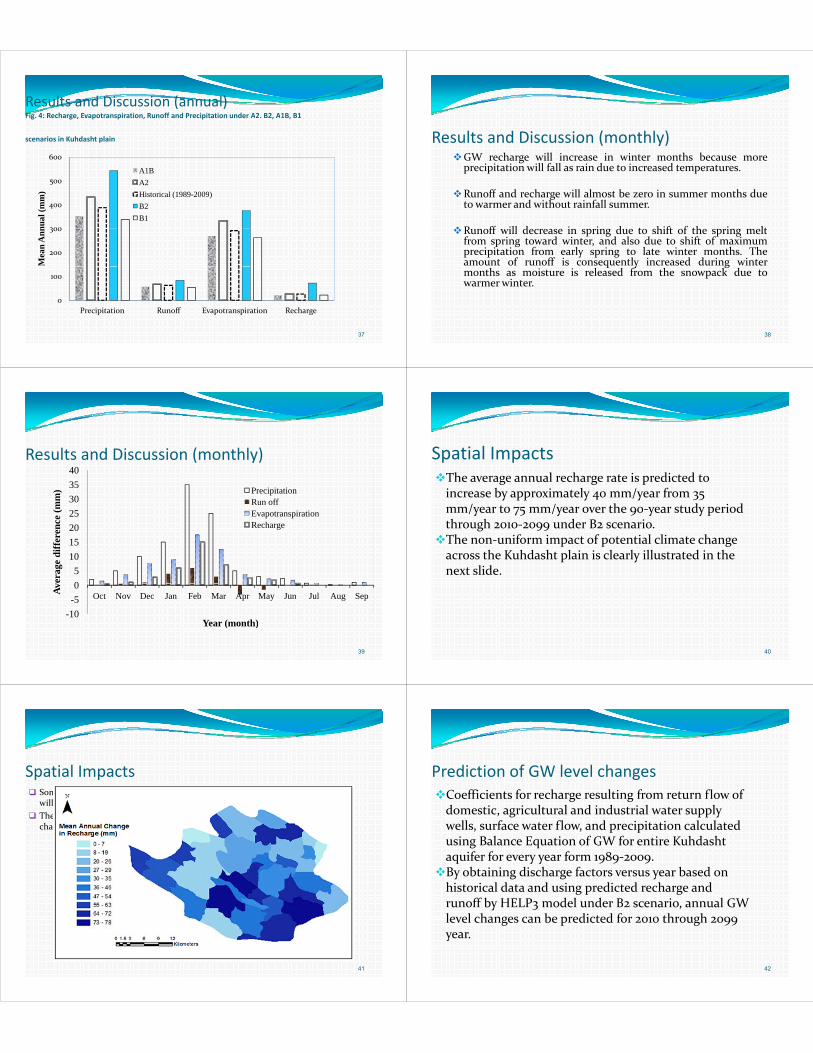
Results and Discussion (monthly)GW recharge will increase in winter months because more
precipitation will fall as rain due to increased temperatures.
R ff d h ill l b i h dRunoff and recharge will almost be zero in summer months dueto warmer and without rainfall summer.
R ff ill d i i d t hift f th i ltRunoff will decrease in spring due to shift of the spring meltfrom spring toward winter, and also due to shift of maximumprecipitation from early spring to late winter months. Theamount of runoff is consequently increased during winterq y gmonths as moisture is released from the snowpack due towarmerwinter.
38
40Results and Discussion (monthly)
303540
mm
) PrecipitationRun off
152025
ffer
ence
(m EvapotranspirationRecharge
05
1015
vera
ge d
iff
-10-50
Oct Nov Dec Jan Feb Mar Apr May Jun Jul Aug SepAv
Year (month)
39
Year (month)
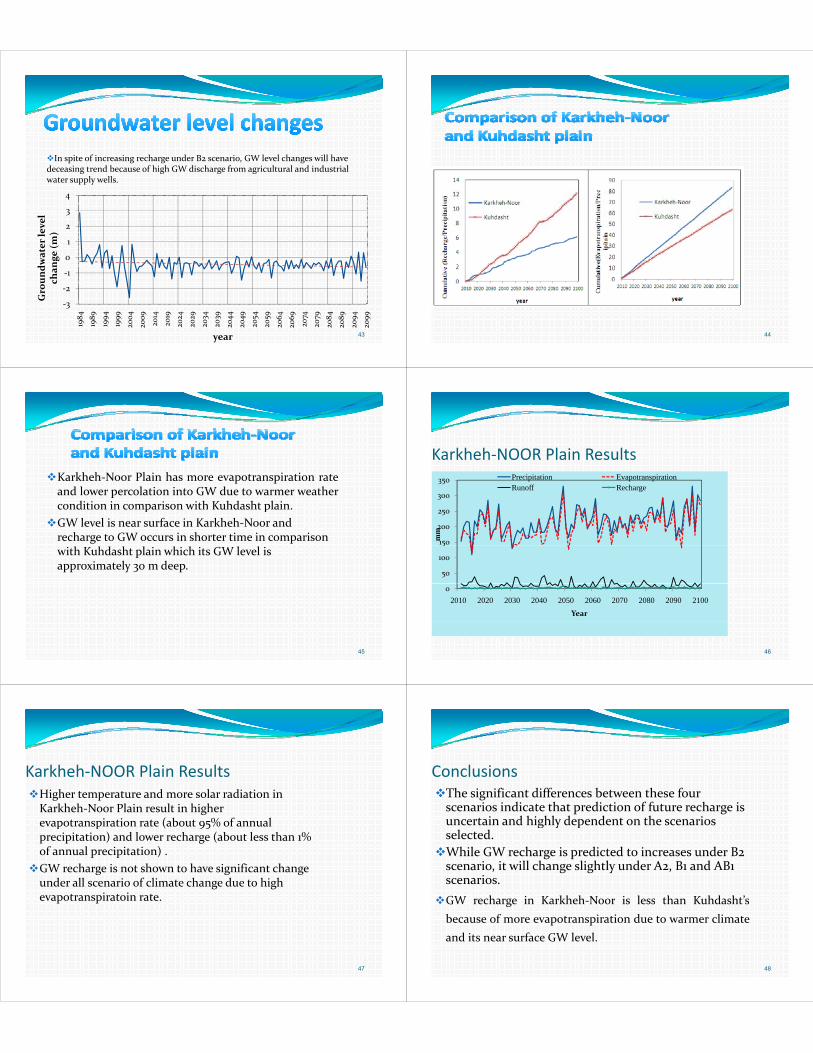
Spatial ImpactsThe average annual recharge rate is predicted to increase by approximately 40 mm/year from 35 mm/year to 75 mm/year over the 90 year study period mm/year to 75 mm/year over the 90‐year study period through 2010‐2099 under B2 scenario. The non‐uniform impact of potential climate change p p gacross the Kuhdasht plain is clearly illustrated in the next slide.
40
Spatial Impacts Some areas will be subjected to greater changes in recharge rates, while others
will experience lesser change. The measure of impact is directly depended on groundwater levels,
h i i f h d f d h f h d l i ilcharacteristics of the ground surface, and the nature of the underlying soils.
41
Prediction of GW level changesCoefficients for recharge resulting from return flow of domestic, agricultural and industrial water supply wells surface water flow and precipitation calculated wells, surface water flow, and precipitation calculated using Balance Equation of GW for entire Kuhdasht aquifer for every year form 1989‐2009. q y y 9 9 9By obtaining discharge factors versus year based on historical data and using predicted recharge and
ff b HELP d l d B i l GW runoff by HELP3 model under B2 scenario, annual GW level changes can be predicted for 2010 through 2099 year.
42
y
In spite of increasing recharge under B2 scenario, GW level changes will have deceasing trend because of high GW discharge from agricultural and industrial water supply wells.
2
3
4
vel
0
1
2
dwater le
vng
e (m
)
‐3
‐2
‐1
Gro
und
chan
43
3
1984
1989
1994
1999
2004
2009
2014
2019
2024
2029
2034
2039
2044
2049
2054
2059
2064
2069
2074
2079
2084
2089
2094
2099
year 44
Karkheh‐Noor Plain has more evapotranspiration rateand lower percolation into GW due to warmer weathercondition in comparison with Kuhdasht plaincondition in comparison with Kuhdasht plain.
GW level is near surface in Karkheh‐Noor and recharge to GW occurs in shorter time in comparison with Kuhdasht plain which its GW level is approximately 30 m deep.
45
Karkheh‐NOOR Plain Results
300
350 Precipitation EvapotranspirationRunoff Recharge
150
200
250
mm
50
100
5
02010 2020 2030 2040 2050 2060 2070 2080 2090 2100
Year
46
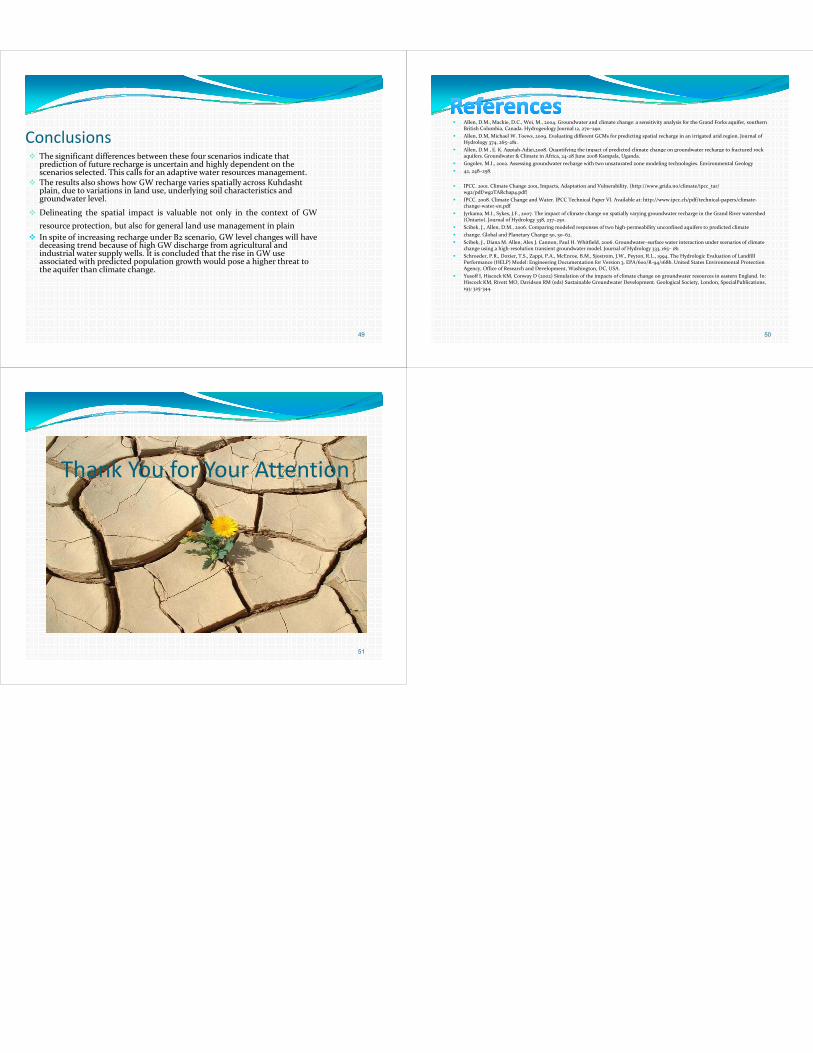
Karkheh‐NOOR Plain ResultsHigher temperature and more solar radiation in Karkheh‐Noor Plain result in higher evapotranspiration rate (about 95% of annual evapotranspiration rate (about 95% of annual precipitation) and lower recharge (about less than 1% of annual precipitation) .
GW recharge is not shown to have significant change under all scenario of climate change due to high evapotranspiratoin rate.evapotranspiratoin rate.
47
ConclusionsThe significant differences between these four scenarios indicate that prediction of future recharge is uncertain and highly dependent on the scenarios uncertain and highly dependent on the scenarios selected. While GW recharge is predicted to increases under B2
i i ill h li h l d A B d AB scenario, it will change slightly under A2, B1 and AB1 scenarios.
GW recharge in Karkheh Noor is less than Kuhdasht’sGW recharge in Karkheh‐Noor is less than Kuhdasht sbecause of more evapotranspiration due to warmer climateand its near surface GW level
48
and its near surface GW level.
Conclusions The significant differences between these four scenarios indicate that
prediction of future recharge is uncertain and highly dependent on the scenarios selected. This calls for an adaptive water resources management.
The results also shows how GW recharge varies spatially across Kuhdasht plain due to variations in land use underlying soil characteristics and plain, due to variations in land use, underlying soil characteristics and groundwater level.
Delineating the spatial impact is valuable not only in the context of GWresource protection, but also for general land use management in plainresource protection, but also for general land use management in plain
In spite of increasing recharge under B2 scenario, GW level changes will have deceasing trend because of high GW discharge from agricultural and industrial water supply wells. It is concluded that the rise in GW use associated with predicted population growth would pose a higher threat to h if h li hthe aquifer than climate change.
49
Allen, D.M., Mackie, D.C., Wei, M., 2004. Groundwater and climate change: a sensitivity analysis for the Grand Forks aquifer, southern British Columbia, Canada. Hydrogeology Journal 12, 270–290.
Allen, D.M, Michael W. Toews, 2009. Evaluating different GCMs for predicting spatial recharge in an irrigated arid region. Journal of Hydrology 374, 265–281.
Allen, D.M , E. K. Appiah‐Adjei,2008. Quantifying the impact of predicted climate change on groundwater recharge to fractured rock , , pp j , Q y g p p g g gaquifers. Groundwater & Climate in Africa, 24‐28 June 2008 Kampala, Uganda.
Gogolev, M.I., 2002. Assessing groundwater recharge with two unsaturated zone modeling technologies. Environmental Geology 42, 248–258.
IPCC. 2001. Climate Change 2001, Impacts, Adaptation and Vulnerability. (http://www.grida.no/climate/ipcc_tar/ df h df)wg2/pdf/wg2TARchap4.pdf)
IPCC. 2008. Climate Change and Water. IPCC Technical Paper VI. Available at: http://www.ipcc.ch/pdf/technical‐papers/climate‐change‐water‐en.pdf
Jyrkama, M.I., Sykes, J.F., 2007. The impact of climate change on spatially varying groundwater recharge in the Grand River watershed (Ontario). Journal of Hydrology 338, 237–250.
Scibek, J , Allen, D M , 2006 Comparing modeled responses of two high‐permeability unconfined aquifers to predicted climateScibek, J., Allen, D.M., 2006. Comparing modeled responses of two high permeability unconfined aquifers to predicted climate change. Global and Planetary Change 50, 50–62. Scibek, J., Diana M. Allen, Alex J. Cannon, Paul H. Whitfield, 2006. Groundwater–surface water interaction under scenarios of climate
change using a high‐resolution transient groundwater model. Journal of Hydrology 333, 165– 181 Schroeder, P.R., Dozier, T.S., Zappi, P.A., McEnroe, B.M., Sjostrom, J.W., Peyton, R.L., 1994. The Hydrologic Evaluation of Landfill
Performance (HELP) Model: Engineering Documentation for Version 3. EPA/600/R‐94/168b. United States Environmental Protection A Offi f R h d D l W hi DC USAAgency, Office of Research and Development, Washington, DC, USA.
Yusoff I, Hiscock KM, Conway D (2002) Simulation of the impacts of climate change on groundwater resources in eastern England. In: Hiscock KM, Rivett MO, Davidson RM (eds) Sustainable Groundwater Development. Geological Society, London, SpecialPublications, 193: 325‐344.
50
Thank You for Your AttentionThank You for Your Attention
51