towards a flexible and scalable fleet management service · · 2014-01-02towards a flexible and...
TRANSCRIPT
Towards a Flexible and Scalable Fleet Management Service
Alexandros EfentakisResearch Center “Athena”
Artemidos 6 Marousi 15125, [email protected]
Sotiris BrakatsoulasResearch Center “Athena”
Artemidos 6 Marousi 15125, [email protected]
Nikos GrivasResearch Center “Athena”
Artemidos 6 Marousi 15125, [email protected]
Giorgos LamprianidisResearch Center “Athena”
Artemidos 6 Marousi 15125, [email protected]
Kostas PatroumpasSchool of Electrical and Computer
EngineeringNational Technical University of
Athens, [email protected]
Dieter Pfoser∗
Department of Geography andGeoInformation Science
George Mason University4400 University Drive, MS 6C3
Fairfax VA [email protected]
ABSTRACTGPS positioning devices are becoming a commodity sensor plat-form with the emergence and popularity of smartphones. Thisabundance of GPS trajectories has fueled significant research aroundmap-matching and related applications such as traffic assessmentand prediction. Unfortunately, this research has only been used incostly and complex fleet management solutions. Our latest researchendeavor addresses this issue by presenting cost-effective solutionsfor adapting state-of-the-art research around map-matching and livetraffic assessment in the context of fleet management applications.This paper showcases various research results wrapped in a singleextensible fleet management platform.
Categories and Subject DescriptorsH.2.8 [Database Management]: Database Applications—Spatialdatabases and GIS; H.3.5 [Information Storage and Retrieval]:Online Information Services—Web-based services
General TermsDesign
KeywordsShortest-Path, Map-matching, Isochrones, FCD, Fleet Management
1. INTRODUCTIONGPS positioning devices are becoming a commodity sensor plat-
form with the emergence and popularity of smartphones and portabletablets. This abundance of usually low-sampling-rate (e.g., onepoint every 1-5 minutes) GPS trajectories have lead to significantincrease in research activities around map-matching, the process of
∗On leave from Research Center “Athena”, Greece.Permission to make digital or hard copies of all or part of this work for per-sonal or classroom use is granted without fee provided that copies are notmade or distributed for profit or commercial advantage and that copies bearthis notice and the full citation on the first page. Copyrights for componentsof this work owned by others than the author(s) must be honored. Abstract-ing with credit is permitted. To copy otherwise, or republish, to post onservers or to redistribute to lists, requires prior specific permission and/or afee. Request permissions from [email protected] ’13, November 05-08 2013, Orlando, FL, USACopyright is held by the owner/author(s). Publication rights licensed toACM. ACM 978-1-4503-2527-1/13/11 $15.00http://dx.doi.org/10.1145/2533828.2533835 .
aligning a sequence of observed user traces to the underlying roadnetwork graph. Still at this moment, practical uses of this researchhave only been considered in costly and complex fleet managementapplications. On a quite similar note, novel shortest-path (SP) algo-rithms (by relying in extensive preprocessing of the road networkgraph) may answer SP queries in continental networks in few µs.Unfortunately, those algorithms are not efficiently tuned for han-dling live traffic updates, such as those produced by the aforemen-tioned map-matching algorithms.
Our latest effort in [16] tries to address these shortcomings bycreating an efficient infrastructure for low-cost fleet managementsolutions. The core components of our system (referred hereafteras the SimpleFleet service) include (i) a collection mechanism forvehicle tracking data, i.e., Floating Car Data, (ii) a map-matchingalgorithm that relates the vehicle trajectories to an underlying roadnetwork and allows us to derive travel times in relation to the roadnetwork, (iii) an efficient data aggregation mechanism to derivespeed profiles for the road network, (iv) a shortest-path algorithmthat takes live traffic conditions and, hence, actual travel times intoaccount and (v) a visualization platform to interact with the systemand visualize traffic conditions based on traffic maps and isochrones.
The outline of this work is as follows. Specific scientific innova-tions and a description of available system services is presented inSection 2. Section 3 describes the SimpleFleet service architectureand implementation. Section 4 presents the Web interface used toaccess (a subset) of the implemented fleet management functionali-ties. Section 5 presents some performance numbers and discussingpossible system loads. Finally, Section 6 gives conclusions and di-rections for future work.
2. SERVICESImplementing a fleet management infrastructure requires a cer-
tain number of services, i.e., data collection and management meth-ods as well as map-matching and shortest-path algorithms. Whatfollows is a description of these services and the respective innova-tions that were needed for their efficient implementation.
2.1 Data CollectionEssentially, we are dealing with two data sources. One is the ac-
tual road network (graph), which in the our case is based on Open-StreetMap data. Since in our system we are dealing with specificgeographic areas, we converted OSM data to a routable road net-work graph, of which we finally used its largest strongly connectedcomponent. Strong connectivity is a necessary requirement for the
map-matching and routing algorithms used in the following. Thesecond dataset we have to collect is the actual vehicle tracking data.Here, we created an efficient mechanism for collecting and storingconsiderable amounts of Floating Car Data (FCD) from fleet vehi-cles. For each urban area covered by our system, we are typicallydealing with 2,000-5,000 vehicles producing a data point (GPS po-sition sample) every 60 -180s.
2.2 Travel Time DerivationAligning the collected GPS traces to the road network graph
requires state-of-the-art map-matching (MM) algorithms. In ourframework we use the Fréchet-distance-based curve matching al-gorithm of [2, 17] and the [11] implementation of the ST-matchingalgorithm [12]. Still, we had to significantly enhance both imple-mentations to handle FCD streams. In our approach we divide theincoming FCD stream to five minutes intervals, in order to createsmall trajectories and then performed map-matching on those smallsubsequences to obtain partial paths and travel time information.
Then we had to aggregate map-matching results per edge for thesame interval (5min) to provide live traffic assessment information.Map-matching results were also aggregated on a monthly basis peredge, weekday, hour and quarter-of-an-hour to build historic speedprofiles for providing traffic information for areas where no livetraffic data is available.
2.3 Shortest-Path ComputationThe combination of live traffic and speed profiles is used to pro-
vide dynamic shortest-path (SP) computation. We developed an op-timized version of the unidirectional “Eager Dynamic” [3] variantof the ALT (A∗ + Landmarks + Triangle equality) [9] algorithm.We significantly improved the preprocessing time and SP queryperformance of the specific algorithm and make it thus suitable fora dynamic navigation scenario, i.e., considering live traffic updatesin shortest-path results. We focused our attention on the ALT algo-rithm, since (i) it is very robust with respect to the metric used [9],(ii) it requires no path unpacking (producing the actual road net-work path of the shortest route), and (iii) its storage requirementsand auxiliary data structure size depend solely on the number oflandmarks (and not on the utilized metric). We avoided using hier-archical approaches, such as Contraction Hierarchies [8], becausethe required shortcut edges need to be re-computed at every batchededge-weight update. Hence creating and dropping shortcuts everyfive minutes was an additional overhead we needed to avoid. More-over, the use of shortcuts makes path-unpacking slower, since in ourcase the full path needs to be returned to the user.
By proposing a novel and efficient landmark selection strategyand expanding several optimization strategies of [6], [7], we man-aged to lower the preprocessing time of the ALT algorithm fromseveral minutes [3] to a few seconds. Moreover, we have also im-proved its query phase and tripled its unidirectional performancewhile also improving bidirectional performance by 44%. Althoughwe did not alter the actual algorithm, our engineering efforts sig-nificantly broadened ALT’s entire scope, since (i) its preprocessingis now fast enough for supporting dynamic road networks with fre-quent traffic updates and (ii) the algorithm is now fast enough tosupport real-time SP queries for global scale mapping services. Formore details on our optimizations for ALT refer to [5].
Although there were some previous shortest-path research works[13] also using OpenStreetMap data for creating the road networkgraph, they did not have access to live traffic information, as ourwork does. This is a huge advantage of our approach, since sim-ilar to major services like Google and Bing Maps, we are able tosuggest the best route according to current live traffic conditions.
2.4 Isochrone ComputationAnother important focus of our work was to provide novel and
innovative ways to visualize and represent traffic situation in urbanareas. A crucial tool for this effort is the concept of isochrones.Isochrones are defined in [1] as the “set of all points from whicha specific point of interest is reachable within a given time span”.Although our service is mainly aimed towards fleet management,isochrones are equally important within other contexts, such as ge-omarketing (e.g. where a new franchise store should be opened) orurban planning (e.g. where a hospital should be built to accommo-date uncovered city areas). Another paper relative to our work was[14], since it was the first to claim that the whole spatial area cov-ered by an isochrone is important and introduced the “Edges’ Hull”algorithm which creates a single area composed of the outermostedges of the isochrone network. This approach offers increased ac-curacy in comparison to previous, typical convex hull approaches.
Although isochrones have been used before in public transportand walking combinations [1], to the best of our knowledge we arethe first to combine the state-of-the-art isochrone computation of[14] with live traffic data, in addition to providing this real-timesystem showcasing our results.
Moreover, in our recent work of [4] we have already combinedthe acquired live traffic isochrone computation with demographicdata to demonstrate the impact of traffic fluctuations in a geomar-keting context. There, one can see in a quantitative way that theinfluence of live traffic information is considerably important, espe-cially in heavy traffic conditions. Hence, the live traffic isochronesintroduced for the first time here, may be extremely useful formany, seemingly unrelated, scientific areas.
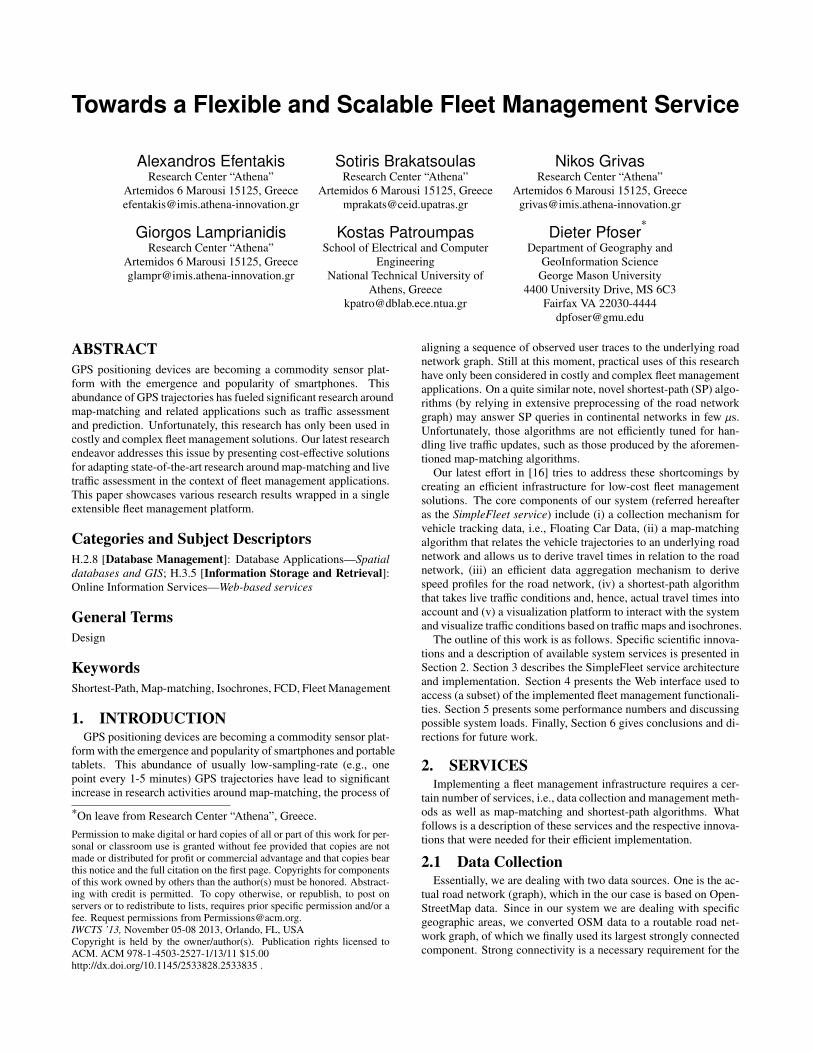
3. SYSTEM IMPLEMENTATIONThe product of the aforementioned processes/innovations is the
SimpleFleet service which consists of several components - virtualmachines (VMs) that interconnect and cooperate (Fig. 1). Thevarious components are described in the following.
Figure 1: The SimpleFleet service
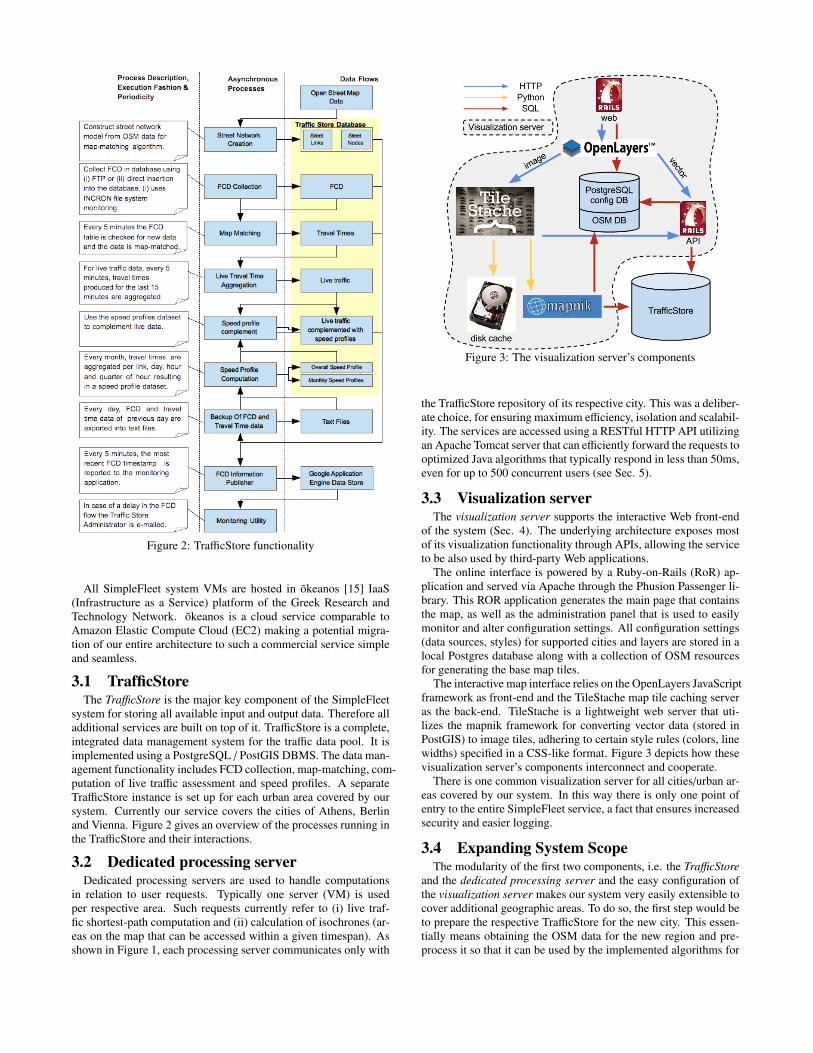
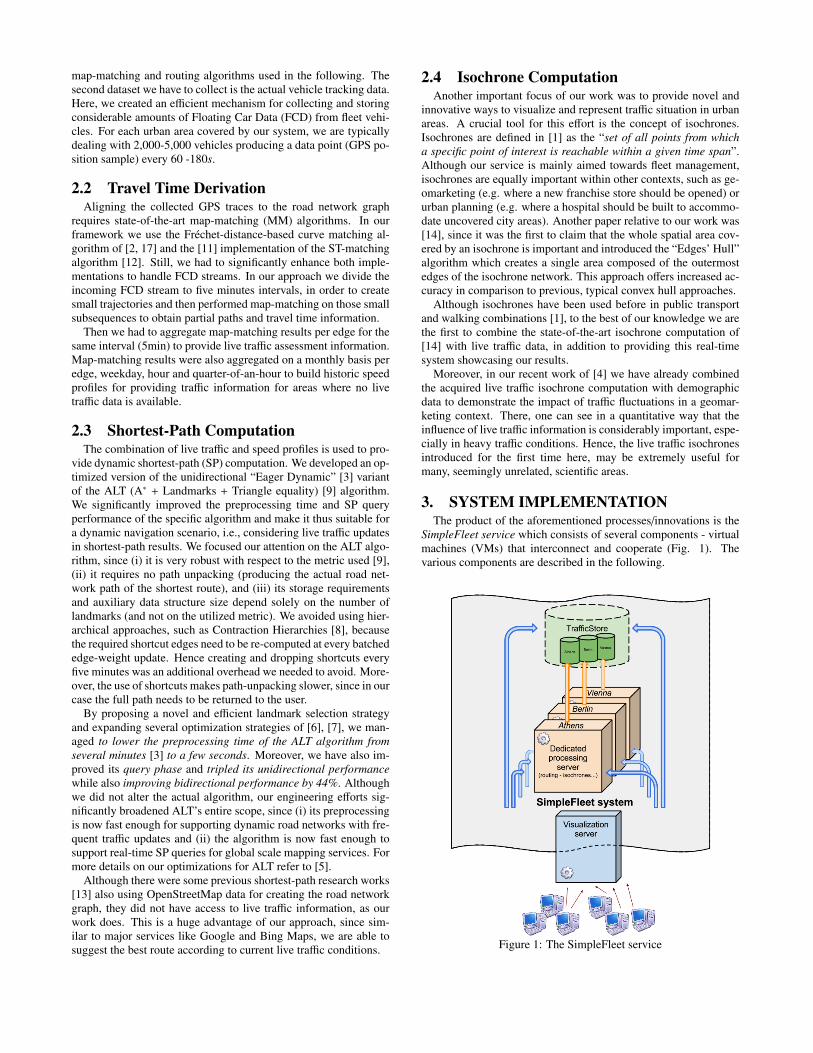
Figure 2: TrafficStore functionality
All SimpleFleet system VMs are hosted in õkeanos [15] IaaS(Infrastructure as a Service) platform of the Greek Research andTechnology Network. õkeanos is a cloud service comparable toAmazon Elastic Compute Cloud (EC2) making a potential migra-tion of our entire architecture to such a commercial service simpleand seamless.
3.1 TrafficStoreThe TrafficStore is the major key component of the SimpleFleet
system for storing all available input and output data. Therefore alladditional services are built on top of it. TrafficStore is a complete,integrated data management system for the traffic data pool. It isimplemented using a PostgreSQL / PostGIS DBMS. The data man-agement functionality includes FCD collection, map-matching, com-putation of live traffic assessment and speed profiles. A separateTrafficStore instance is set up for each urban area covered by oursystem. Currently our service covers the cities of Athens, Berlinand Vienna. Figure 2 gives an overview of the processes running inthe TrafficStore and their interactions.
3.2 Dedicated processing serverDedicated processing servers are used to handle computations
in relation to user requests. Typically one server (VM) is usedper respective area. Such requests currently refer to (i) live traf-fic shortest-path computation and (ii) calculation of isochrones (ar-eas on the map that can be accessed within a given timespan). Asshown in Figure 1, each processing server communicates only with
Figure 3: The visualization server’s components
the TrafficStore repository of its respective city. This was a deliber-ate choice, for ensuring maximum efficiency, isolation and scalabil-ity. The services are accessed using a RESTful HTTP API utilizingan Apache Tomcat server that can efficiently forward the requests tooptimized Java algorithms that typically respond in less than 50ms,even for up to 500 concurrent users (see Sec. 5).
3.3 Visualization serverThe visualization server supports the interactive Web front-end
of the system (Sec. 4). The underlying architecture exposes mostof its visualization functionality through APIs, allowing the serviceto be also used by third-party Web applications.
The online interface is powered by a Ruby-on-Rails (RoR) ap-plication and served via Apache through the Phusion Passenger li-brary. This ROR application generates the main page that containsthe map, as well as the administration panel that is used to easilymonitor and alter configuration settings. All configuration settings(data sources, styles) for supported cities and layers are stored in alocal Postgres database along with a collection of OSM resourcesfor generating the base map tiles.
The interactive map interface relies on the OpenLayers JavaScriptframework as front-end and the TileStache map tile caching serveras the back-end. TileStache is a lightweight web server that uti-lizes the mapnik framework for converting vector data (stored inPostGIS) to image tiles, adhering to certain style rules (colors, linewidths) specified in a CSS-like format. Figure 3 depicts how thesevisualization server’s components interconnect and cooperate.
There is one common visualization server for all cities/urban ar-eas covered by our system. In this way there is only one point ofentry to the entire SimpleFleet service, a fact that ensures increasedsecurity and easier logging.
3.4 Expanding System ScopeThe modularity of the first two components, i.e. the TrafficStore
and the dedicated processing server and the easy configuration ofthe visualization server makes our system very easily extensible tocover additional geographic areas. To do so, the first step would beto prepare the respective TrafficStore for the new city. This essen-tially means obtaining the OSM data for the new region and pre-process it so that it can be used by the implemented algorithms for

Figure 4: The basic interface of the online demo
map-matching, shortest-path and isochrone computation. The sec-ond step, involves cloning a dedicated processing server and con-figure it to access data from the new TrafficStore. The third andfinal step is to add the new area to the visualization server’s con-figuration. This involves two major tasks: Initially we have to pre-render the map tiles for the new region, a task similar to the setupof the TrafficStore, in the sense that OSM data is being converted tomap tile images and then stored in a cache for faster access. Thenthe new region may be added to the configuration via the availableadministration panel; the basic set-up involves setting the URL ofthe respective dedicated processing server and then choosing whichlayers would be available for the newly added area.
4. WEB APPLICATIONThe Web front-end of our SimpleFleet service features an in-
teractive “slippy map” interface that allows switching between theavailable geographic areas covered by the system. For each areathe following data/services are available.
• Live-traffic map - visualization of traffic conditions, updatedevery 5min• Speed profiles - visualization of traffic trends to complement
live traffic assessment• Traffic message channel alerts (TMCs available only for Berlin)• Isochrones - based on live traffic• Shortest-path routing - based on live traffic
In terms of data, the first two layers, i.e., live traffic and speedprofiles are available as map tiles (png images), while informationabout the last three vector layers is available as JSON. From a ser-vice point of view, the first three layers are directly accessible fromthe TrafficStore, whereas isochrones and routing features are avail-able from the respective dedicated processing servers (Sec. 3.2).
The three TrafficStore layers (live traffic, speed profiles, TMCs)and the background road-map layer (the choices here are (i) the de-fault black & white theme, Google Maps layer, and OSM layer)may be independently activated by using the Layer drawer controllocated at the right of the map interface. The remaining two vec-tor layers (routing directions and isochrones) may be activated byright-clicking anywhere on the map and selecting the appropriateaction from the displayed context menu.
To minimize network time, all vector data from either isochroneor routing responses is returned in Google’s encoded polyline for-mat [10] that achieves 90% compression. GZIP compression is also
Figure 5: Computing Isochrones
Figure 6: A sample route between an Origin and a Destination pass-ing via a specified Waypoint
enabled, both on the the visualization and the processing servers, tofurther reduce network latency.
4.1 IsochronesThe Web interface facilitates isochrone computation “from” (and
also “to”) any location on the map (context menu). The user mayeither change the total traveled time (up to 30min) or the numberof isochrone areas returned (up to six). For visualization purposes,each isochrone area has a different opacity with the smaller one be-ing more opaque and the larger one being more transparent. Oncethe isochrones have been drawn on the map, the starting (or end-ing) marker may be dragged and dropped to a different location torequest new isochrones to be drawn.
In our default setting, six isochrones are returned and the overallmaximum travel time is set to 30 minutes. This means that eachisochrone’s maximum travel time is uniformly distributed in thisduration, i.e., the first one covers the area reachable in 5min, thesecond one in 10min, etc. Figure 5 shows a tweaked example wherethe user has requested 4 isochrones and the maximum travel timefor the largest one is set to 10min.

Figure 7: The administration panel
Figure 8: Flow diagram of a request for a map tile.
4.2 RoutingSimilar to isochrone computation, routing requests may be com-
puted between any two locations selected on the map (context menu).The server responds with a Google’s encoded polyline representa-tion of the calculated path, along with the travel time computed forthis route and the total distance traversed. The travel info appearsas a balloon tip on top of the map, while the actual route is drawn.Similar to massive online mapping services, the user may drag theOrigin and Destination markers or add/delete intermediate points toa route. The origin marker (labeled A) and the destination marker(labeled B) are both draggable and thus dragging them automati-cally recomputes the path to match the altered location(s).
4.3 Traffic MessagesThe TMC layer shows Traffic Message Channel (TMC) alerts
and is only available for Berlin. TMC alerts are short informativemessages which appear in the electronic road signs above majorroads. The user may click on the TMC icons and retrieve the cor-responding message.
4.4 AdministrationTo help administer the service, i.e., add new cities and map lay-
ers, an online administration panel (available only to super usersvia password authentication) was built (see Figure 7). The maintwo data components available in this panel are areas and layers.Each area corresponds to a separate city/region. Layers are usedfor storing configuration parameters for the different type of datawe want to display in the map area of the online interface. Theconfigurations settings are stored in the local PostgreSQL databaseof the visualization server.
The admin panel allows the super user to add new spatial areasor hide/remove existing areas from the list of available ones via the“Areas” section. An administrator may easily specify the URL of
the dedicated processing server that corresponds to each area, sothat all requests for that respective area will be accordingly routedto the proper server. Similarly, one may also specify which layerswill be available for each area via the “Layers” configuration page.This page allows a user to add or remove new layers, to enable ordisable existing layers or change a layer’s behavior such as enablingor disabling caching for it. For image-based layers, the user has theability to specify the data-source (a specific TrafficStore instance)along with the exact SQL query that will be used to fetch the results,as well as the specific styling rules that will be used for displayingthe layer on the map. For example, for a traffic layer an examplequery would be to fetch all the road segments that are currentlycongested, i.e., have a travel time that indicates that vehicles aremoving on it at 25% or less of the normal road speed.
Dynamic Configurations. The main advantage of having all thelayer settings configurable via the admin panel is the ability to up-date the layer settings on demand with minimum effort. In a classicsetup all the layer configuration such as the data-source to connectto, the exact query to fetch the data and the list of styling rules toapply when drawing the map tiles of that layer are saved in a staticXML file on the disk. If a setting changes, one would typicallyhave to log in to the server, edit and save the file, then restart thetile server (TileStache). In our setup we use the “Dynamic Layer”module provided by our tile server in order to read each layer’s con-figuration from the visualization server the first time that a specificlayer is requested. Once a “never-seen-before” layer is requested,an extra request is made to the visualization server to look up itsconfiguration and export it to the tile server using a HTTP request.Figure 8 demonstrates the aforementioned scenario. The layer’sconfiguration is then cached to boost performance. Since a typicalsingle page request contains (on average) around 30 image tiles,it would be very inefficient to ask for the same configuration overand over again. A small patch has been applied to this “DynamicLayer” module in order to allow this configuration to be updatedon demand, i.e. expire the cache.
Overall, the user may change any setting of any layer and thenuse the link provided in the Dashboard section of the admin panelto seed this new configuration to the tile server, forcing it to expireany previously cached configuration and read the new settings fromthe visualization server. This approach is especially helpful whenfine-tuning and testing new settings, e.g., trying out new map stylesor queries.
Snapshots. For image-based layers (live traffic and historic speedprofiles), the administration panel offers a “snapshot” functional-ity which may be configured to run automatically at predefined in-tervals or requested to run on demand. The “auto-snapshot” pro-cess, which runs every 15 minutes, creates a zoom 11 snapshot ofthe entire bounding box of the layer. The Snapshot screen listsall the available stored snapshots, tagged with the time they weretaken. The user has the ability to filter the displayed snapshots bylayer and within a specified time range. The resulting snapshotsmay additionally be viewed as a slide-show (movie) by clickingthe “Slideshow” button on the upper right corner (Fig. 9) creatingvisualizations of traffic patterns.
5. PERFORMANCEIn order to test the SimpleFleet service’s performance, we used
the popular regression-test tool Apache JMeter. Apache JMeteris an open-source Java desktop application designed to stress-testfunctional behavior and simulate server load to analyze overall per-formance under different load types.
In our test scenario we experimented with 500 concurrent users,executing 60 mixed (for all cities) routing requests with a delay

Figure 9: Slideshow functionality of the administration panel
of 10s between requests to emulate realistic usage of the service,i.e., each user sends a request and waits for the response beforeproceeding to another request. Results showed that each of those30,000 requests is answered in average time of 45ms. This clearlyshows that the minimal setting of our prototype architecture canefficiently handle a significant number of concurrent users. Keep inmind that those recorded times are dominated by network latency,i.e., the time required for the actual response to be sent to the user.The actual time required for calculating a shortest-path is typicallyless than 5ms. After all, we aim at providing an infrastructure toservice a limited number of fleet management companies and noton competing with well established global mapping services, suchas Google or Bing Maps.
6. CONCLUSIONThis work describes a unified fleet management system in terms
of its available services, their implementation and an existing Webinterface. The latter is used to access certain functionality andshowcases example services such as traffic maps, shortest path andisochrone computation based on collected Floating Car Data. OurSimpleFleet system binds several web and server technologies to-gether in order to provide a powerful and integrated platform thatprovides extensibility and scalability. We have also described itsbasic usage scenario, its administration panel, as well as its basicperformance for a significant number of concurrent users.
Despite its, we believe, strong characteristics, this prototype ap-plication is still a work in progress. New services are being addedto our infrastructure and the modularity of its architecture allowsfor the simple (comparatively) addition of new and probably moreimpressive features. Therefore we believe that it will play a crucialrole in demonstrating SimpleFleet system’s huge potential.
AcknowledgmentsThe research leading to these results has received funding from theEuropean Union Seventh Framework Programme “SimpleFleet”(http://www.simplefleet.eu, grant agreement No. FP7-ICT-2011-SME-DCL-296423).
7. REFERENCES[1] V. Bauer, J. Gamper, R. Loperfido, S. Profanter, S. Putzer,
and I. Timko. Computing isochrones in multi-modal,schedule-based transport networks. In Proc. 16th ACMSIGSPATIAL GIS conf., GIS ’08, pages 78:1–78:2, NewYork, NY, USA, 2008. ACM.
[2] S. Brakatsoulas, D. Pfoser, R. Salas, and C. Wenk. Onmap-matching vehicle tracking data. In Proc. 31st VLDBConference, pages 853–864, 2005.
[3] D. Delling and D. Wagner. Landmark-based routing indynamic graphs. In Proc. 6th Experimental algorithms conf.,WEA’07, pages 52–65, Berlin, Heidelberg, 2007.Springer-Verlag.
[4] A. Efentakis, N. Grivas, G. Lamprianidis, G. Magenschab,and D. Pfoser. Isochrones, Traffic and DEMOgraphics. InProc. 21st ACM SIGSPATIAL GIS conf., 2013. To appear.
[5] A. Efentakis and D. Pfoser. Optimizing Landmark-BasedRouting and Preprocessing. In Proc. 6th ACM SIGSPATIALComputational Transportation Science Workshop, 2013. Toappear.
[6] A. Efentakis, D. Pfoser, and A. Voisard. Efficient datamanagement in support of shortest-path computation. InProc. 4th ACM SIGSPATIAL Computational TransportationScience Workshop, CTS ’11, pages 28–33. ACM, 2011.
[7] A. Efentakis, D. Theodorakis, and D. Pfoser. Crowdsourcingcomputing resources for shortest-path computation. InProceedings of the 20th International Conference onAdvances in Geographic Information Systems, SIGSPATIAL’12, pages 434–437, New York, NY, USA, 2012. ACM.
[8] R. Geisberger, P. Sanders, D. Schultes, and D. Delling.Contraction hierarchies: faster and simpler hierarchicalrouting in road networks. In Proc. 7th ExperimentalAlgorithms conf., WEA’08, pages 319–333, Berlin,Heidelberg, 2008. Springer-Verlag.
[9] A. V. Goldberg and C. Harrelson. Computing the shortestpath: A* search meets graph theory. In 16th ACM-SIAMSymposium on Discrete Algorithms, pages 156–165, 2004.
[10] Google. Encoded Polyline Algorithm Format [Online].https://developers.google.com/maps/documentation/utilities/polylinealgorithm, 2013.
[11] L. Kabrt. Travel Time Analysis. http://code.google.com/p/traveltimeanalysis/source/browse, 2010.
[12] Y. Lou, C. Zhang, Y. Zheng, X. Xie, W. Wang, and Y. Huang.Map-matching for low-sampling-rate gps trajectories. InProc. 17th ACM SIGSPATIAL GIS conf., GIS ’09, pages352–361, New York, NY, USA, 2009. ACM.
[13] D. Luxen and C. Vetter. Real-time routing withopenstreetmap data. In Proc. 19th ACM SIGSPATIAL GISconf., GIS ’11, pages 513–516, New York, NY, USA, 2011.ACM.
[14] S. Marciuska and J. Gamper. Determining objects withinisochrones in spatial network databases. In Proc. 14th ADBISconf., ADBIS’10, pages 392–405, Berlin, Heidelberg, 2010.Springer-Verlag.
[15] Okeanos. õkeanos IaaS [Online].https://okeanos.grnet.gr/home/, 2013.
[16] SimpleFleet. Democratizing fleet management [online].http://www.simplefleet.eu, 2013.
[17] C. Wenk, R. Salas, and D. Pfoser. Addressing the need formap-matching speed: Localizing global curve-matchingalgorithms. In Proc. 18th SSDBM conf., pages 379–388,2006.