towards a more equal city: framing the challenges and ... · framing the challenges and...
TRANSCRIPT
Towards a More Equal City: Framing the Challenges and Opportunities
Victoria A. Beard, Anjali Mahendra, Michael I. Westphal
WORLDRESOURCESINSTITUTE
WRI ROSS CENTER FOR
SUSTAINABLECITIES
Towards a More Equal City:Framing the Challenges
and Opportunities
CONTENTSExecutive Summary ....................................................1
I. Framing the World Resources Report ....................5
II. A New Categorization of Cities Focused on Economic Productivity ...........................8
III. Four Challenges for Sustainable Cities............. 11
IV. The Urgency and Lock-in Dilemma and Priority Areas for Action ............................................17
V. The Way Cities are Growing Undermines the Quality of Life for All Residents .........................17
VI. Linking the Urban Service Gap to the Economy and Environment ..................................... 23
VII. Scaling from Core Service Sectors to Transformative Urban Change ................................ 25
VIII. Lessons Learned .............................................. 30
IX. Making More Equal Cities a Reality .................. 33
Appendix: A Partial List of Forthcoming WRR Research Papers ............................................ 34
References ............................................................... 36
Endnotes .................................................................. 42
Acknowledgements ..................................................47
Working Papers contain preliminary research, analysis, findings, and recommendations. They are circulated to stimulate timely discussion and critical feedback and to influence ongoing debate on emerging issues. Most working papers are eventually published in another form and their content may be revised.
Suggested Citation: Beard, V.A., A. Mahendra, and M.I. Westphal. 2016. “Towards a More Equal City: Framing the Challenges and Opportunities.” Working Paper. Washington, DC: World Resources Institute. Available online at: www.citiesforall.org.
EXECUTIVE SUMMARYWith the world’s urban population expected to increase by about
60 percent by 2050, we have an opportunity to build cities where
everyone can live, move, and thrive.1 There is an emerging global
consensus that we must work towards cities that provide a high
quality of life for all. Achieving this outcome is not guaranteed. It
requires a new vision of how to build and manage cities. The decisions
cities make today are crucial because they could lock us into a cycle
of low productivity, poverty, and environmental degradation for the
rest of the century and beyond.
The next generation of cities will be very different from those of the
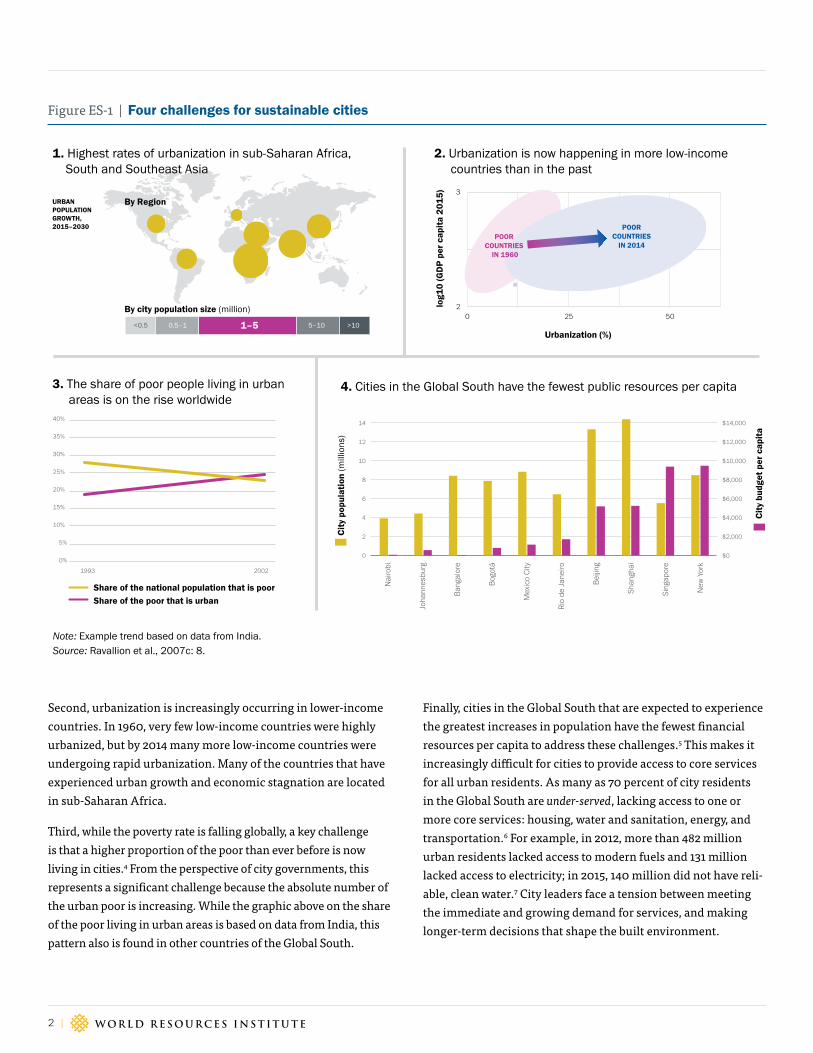
past. As Figure ES-1 shows, the patterns of urbanization we are seeing
today create four significant challenges for cities. This demands a
reexamination of our conventional responses to urbanization.
First, imagine the entire population of China and India moving into
the world’s cities by 2050. The urban population is rising at an
unprecedented rate: about 2.5 billion more people are expected to be
living in cities within just over three decades, and more than 90 percent
of that increase will occur in Asia and Africa.2 By mid-century, estimates
show that 52 percent of the world’s total urban population will be living in
Asia and 21 percent in Africa.3 About 40 percent of this urban growth will
happen in cities that currently have populations between 1 and 5 million.
2 |
2. Urbanization is now happening in more low-income countries than in the past
3. The share of poor people living in urban areas is on the rise worldwide
4. Cities in the Global South have the fewest public resources per capita
URBANPOPULATION GROWTH, 2015–2030
By Region
By city population size (million)
0
2
4
6
8
10
12
14
$0
$2,000
$4,000
$6,000
$8,000
$10,000
$12,000
$14,000
New
Yor
k
Sing
apor
e
Shan
ghai
Beiji
ng
Rio
de J
anei
ro
Mex
ico
City
Bogo
tá
Bang
alor
e
Joha
nnes
burg
Nai
robi
<0.5 0.5–1 1–5 >10 5–10
Cit
y bu
dget
per
cap
ita
Cit
y po
pula
tion
(mill
ions
)
2
3
0 25 50
Urbanization (%)
log1
0 (G
DP
per
cap
ita
2015
)
POOR COUNTRIES
IN 1960
POORCOUNTRIES
IN 2014
1. Highest rates of urbanization in sub-Saharan Africa, South and Southeast Asia
0%
5%
10%
15%
20%
25%
30%
35%
40%
1993 2002
Share of the poor that is urbanShare of the national population that is poor
Figure ES-1 | Four challenges for sustainable cities
Second, urbanization is increasingly occurring in lower-income countries. In 1960, very few low-income countries were highly urbanized, but by 2014 many more low-income countries were undergoing rapid urbanization. Many of the countries that have experienced urban growth and economic stagnation are located in sub-Saharan Africa.
Third, while the poverty rate is falling globally, a key challenge is that a higher proportion of the poor than ever before is now living in cities.4 From the perspective of city governments, this represents a significant challenge because the absolute number of the urban poor is increasing. While the graphic above on the share of the poor living in urban areas is based on data from India, this pattern also is found in other countries of the Global South.
Finally, cities in the Global South that are expected to experience the greatest increases in population have the fewest financial resources per capita to address these challenges.5 This makes it increasingly difficult for cities to provide access to core services for all urban residents. As many as 70 percent of city residents in the Global South are under-served, lacking access to one or more core services: housing, water and sanitation, energy, and transportation.6 For example, in 2012, more than 482 million urban residents lacked access to modern fuels and 131 million lacked access to electricity; in 2015, 140 million did not have reli-able, clean water.7 City leaders face a tension between meeting the immediate and growing demand for services, and making longer-term decisions that shape the built environment.
Note: Example trend based on data from India. Source: Ravallion et al., 2007c: 8.

WORLD RESOURCES REPORT | October 2016 | 3
Towards a More Equal City: Framing the Challenges and Opportunities
When large segments of the urban population suffer from inadequate access to core services, there are economic and environmental consequences. Inadequate service provision undermines people’s ability to be economically productive, and challenges them to fend for themselves in inefficient and costly ways that risk harming the environment. This issue is universal, affecting much of the population in cities in the Global South. It presents a challenge, but also offers the opportunity to develop new approaches to providing services that are more affordable, reach more people, and are less environmentally damaging than traditional solutions developed in the Global North.
Given this reality, and with appreciation for the diversity among cities, we have developed a new framework that divides cities into four categories based on their economic productivity and projected population growth between 2015 and 2030: struggling, emerging, thriving, and stabilizing cities. Both struggling and emerging cities have relatively lower GDP per capita today compared to thriving and stabilizing cities. Struggling cities are likely to experience more rapid population growth than economic growth. Emerging cities are projected to experience economic growth that is greater than population growth. The World Resources Report: Towards a More Equal City focuses on struggling and emerging cities because the expected scale of infrastructure and services needed in these cities creates an important opportunity to alter their development trajectory.
The report examines whether providing equitable access to core services leads to a more economically productive and environmentally sustainable city. The report explores actionable approaches to providing core services like housing, water and sanitation, energy, and transportation. Through a series of research papers, the World Resources Report examines sector-specific approaches that have worked in cities across the world, and explores how these practices can help other cities make better choices.
More specifically, the report includes research on how cities can provide growing numbers of residents with secure and affordable shelter located near economic opportunities and urban amenities. It explores the long-term effectiveness of policy approaches such as upgrading informal settlements, support for rental markets in central areas of the city, and more creative use of underutilized land. It examines how cities can meet growing energy needs through improved access to modern fuels, clean and efficient cook stoves, and distributed renewable energy. And in terms of
transportation, the World Resources Report analyzes how cities can avoid car-centric decisions and support walking, biking, and public transportation for all. Our research examines whether approaches that prioritize the urban under-served will bring eco-nomic and environmental benefits to everyone in the city.
Sector-specific approaches are a start, but they are not enough. To build thriving cities, we need policies that transcend isolated sectoral thinking and piecemeal solutions. Through a preliminary analysis of two case studies, Medellín and Surat, we observed that urban transformation encompasses some common features—a strong coalition of urban change agents with a shared vision, who successfully address a seminal problem and unleash a cycle of positive change; the availability of financial resources to implement ambitious reforms; and a long-term political commitment. Despite these common features there is no single path for every city. Through a series of more in-depth, city-level case studies we will ask the question: Is it possible to learn from cases of successful transformation and use this knowledge to help other cities usher in their own transformation?
Medellín, Colombia transformed itself from the murder cap-ital of the world into a thriving city. It first improved services to under-served communities through imaginative projects that included the construction of a cable car system to connect isolated hillside communities to the city center. The success of this and other urban development projects helped the city government build a coalition with political leaders and the private sector. That, in turn, built momentum for more changes citywide, such as new schools, new parks, and a museum, as well as changes to housing policy that legalized informal homes. No single factor explains the transformation in Medellín; rather, it was a mutually reinforcing set of factors.
Our research examines whether approaches that prioritize the urban under-served will bring economic and environmental
benefits to everyone in the city.
4 |
In Surat, India, an outbreak of plague prompted a change in the health care system and provided the trigger for urban transfor-mation. The city government initiated vigorous cleanup efforts, changes to the waste management and water systems, and new public health monitoring. These reforms were accompanied by changes to the governance and budget processes, and further buoyed by strong municipal leadership and coalition-building with the private sector and civil society groups. The result was transformation in still other areas, such as flood risk manage-ment and building climate resilience.
We envision that the outcome of transformative change will be a more equal city. As work on the World Resources Report unfolds over the next year, we aspire to create a social and political move-ment of urban change agents working towards this outcome. We invite thought leaders, government actors, the private sector,
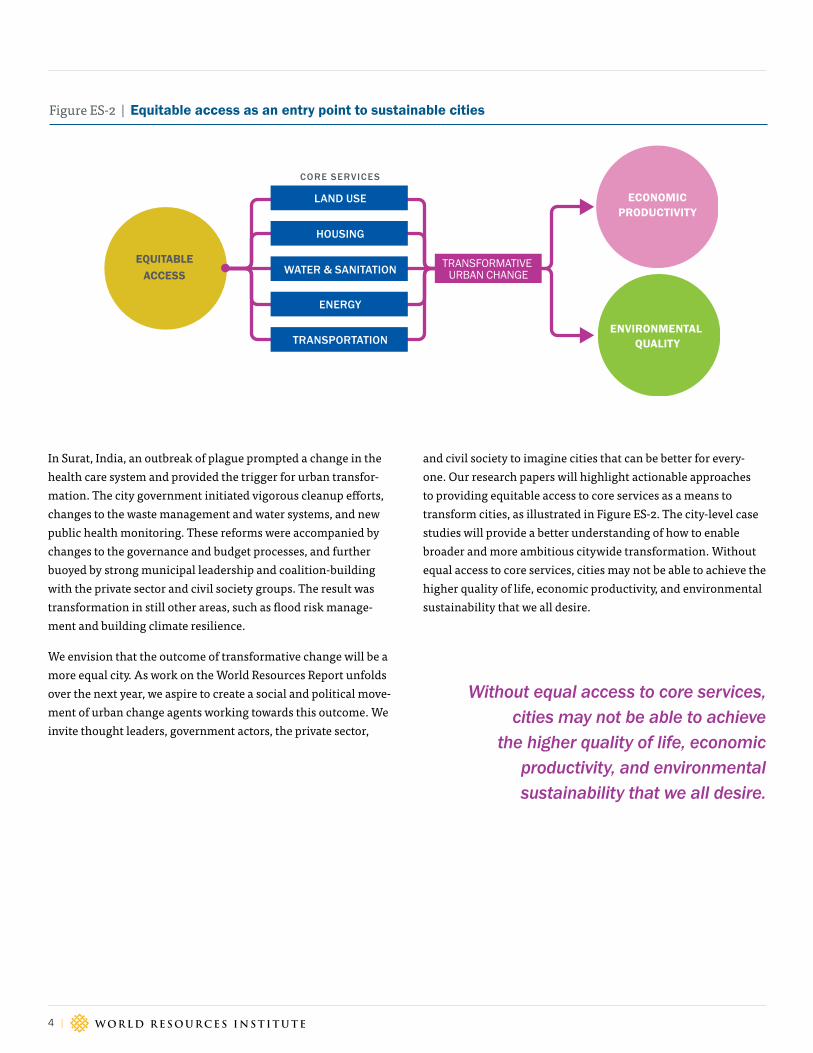
Figure ES-2 | Equitable access as an entry point to sustainable cities
EQUITABLEACCESS
HOUSING
LAND USE
TRANSFORMATIVE URBAN CHANGE
CORE SERVICES
WATER & SANITATION
ENERGY
TRANSPORTATION
ECONOMICPRODUCTIVITY
ENVIRONMENTAL QUALITY
Without equal access to core services, cities may not be able to achieve
the higher quality of life, economic productivity, and environmental sustainability that we all desire.
and civil society to imagine cities that can be better for every-one. Our research papers will highlight actionable approaches to providing equitable access to core services as a means to transform cities, as illustrated in Figure ES-2. The city-level case studies will provide a better understanding of how to enable broader and more ambitious citywide transformation. Without equal access to core services, cities may not be able to achieve the higher quality of life, economic productivity, and environmental sustainability that we all desire.

WORLD RESOURCES REPORT | October 2016 | 5
Towards a More Equal City: Framing the Challenges and Opportunities
I. FRAMING THE WORLD RESOURCES REPORT
Since the earliest urban agglomerations, cities have been centers of creativity, productivity, and innovation. The rise of cities has resulted in economic specialization and economies of scale. The resulting concentration of wealth has freed many people from a singular focus on meeting their basic subsistence needs. The wealth, sociocultural diversity, and exchange of ideas that flourish in cities have created the conditions that support major artistic, intellectual, political, and social movements. This promise of economic prosperity and cultural vibrancy continues to spur rural to urban migration today. There are many interna-tional examples of well-planned and managed cities where the quality of life is high for the vast majority of residents. Examples include Copenhagen, New York, Singapore, Sydney, Vancouver, and Yokohama. There are also many examples of cities, such as Bangkok, Bogotá, Mumbai, and Nairobi that are less planned, more chaotic, but nonetheless equally vibrant.
Cities and their political leaders have never received more international attention than they do today, as it is now widely acknowledged that cities have a central role to play in the global economy, climate action, and our common future.8 The 193 member states of the United Nations adopted the historic Sustainable Development Goals (SDGs) in September 2015, with a standalone urban goal (SDG 11) that focuses on sustainable cities and communities.9 The Habitat III conference on cities promotes “a new model of urban development that is able to integrate all facets of sustainable development to promote equity, welfare, and shared prosperity.”10 The text from Habitat III—the New Urban Agenda—lays out a vision for cities for the next 20 years.11 Simultaneously, achieving the New Urban Agenda and SDGs requires that cities are empowered with knowledge that supports decisive action on the ground. The World Resources Report seeks to provide that knowledge.
Recent research and progress on global agendas indicate that there is an emerging consensus on several key issues govern-ing how cities ought to develop.12 The New Climate Economy establishes that it is possible to grow the economy while meeting climate goals only if we build and manage cities differently.13 The New Urban Agenda highlights the central role of managing urban expansion, affordable housing, and access to services as “levers for change.”14 Prioritizing the delivery of services and infrastructure is a key component of a long-term urban strategy that considers economic and social development along with environmental protection.15
The number of people living in the world’s cities is expected to increase by 2.5 billion by 2050, with more than 90 percent of that increase occurring in Asia and Africa.16 In many of these cities, urban population growth will outpace economic growth. This trend is combined with the “urbanization of poverty,” which means that a larger share of the world’s poor now reside in urban areas.17 And, many of these cities have some of the lowest munic-ipal budgets per capita today. In response, the World Resources Report provides cities with practical and actionable strategies to approach these challenges. Now is the time when these cities have an opportunity to make decisions that avoid locking them in to unsustainable urban development patterns.
The quality of life for urban residents, and the extent to which they have opportunities to thrive and be productive, depends on their level of access to affordable, reliable, and safe core urban services such as land use, housing, water and sanitation, energy, and transportation. Large segments of the urban population in some of the most rapidly urbanizing regions of the world, such as South Asia and sub-Saharan Africa, are currently under-served in these areas. Gaps in the provision of these urban services leads to illegal, informal, or unregulated self-provision-ing by residents across income groups, imposing high individual and societal costs resulting in inefficiencies, environmental degradation, and poor health. Many cities in the Global South face resource and capacity constraints, which means that this gap in urban services is likely to worsen with the rapid increase in urban population expected in coming decades.
The World Resources Report views sustainable cities through the lens of the three interlocking spheres of economy, environ-ment, and equity (Box 1).18 Our analysis starts by taking equitable access to urban services as the entry point for urban sustain-ability.19 We have chosen this entry point for three reasons. First, there is a limited understanding of how to achieve urban sustainability and equity simultaneously.20 Second, there is evidence that if rapidly growing cities do not address equity, eco-nomic growth will likely occur in ways that are not “pro-poor” or supportive of the growing and persistent informal economies in many of these cities.21 The pattern of urbanization in Latin America over the past 30 years illustrates this point. Third, the rise in urban inequality globally and its associated negative political repercussions makes equity a particularly robust entry point for city leaders and national governments seeking to stay in power.
6 |
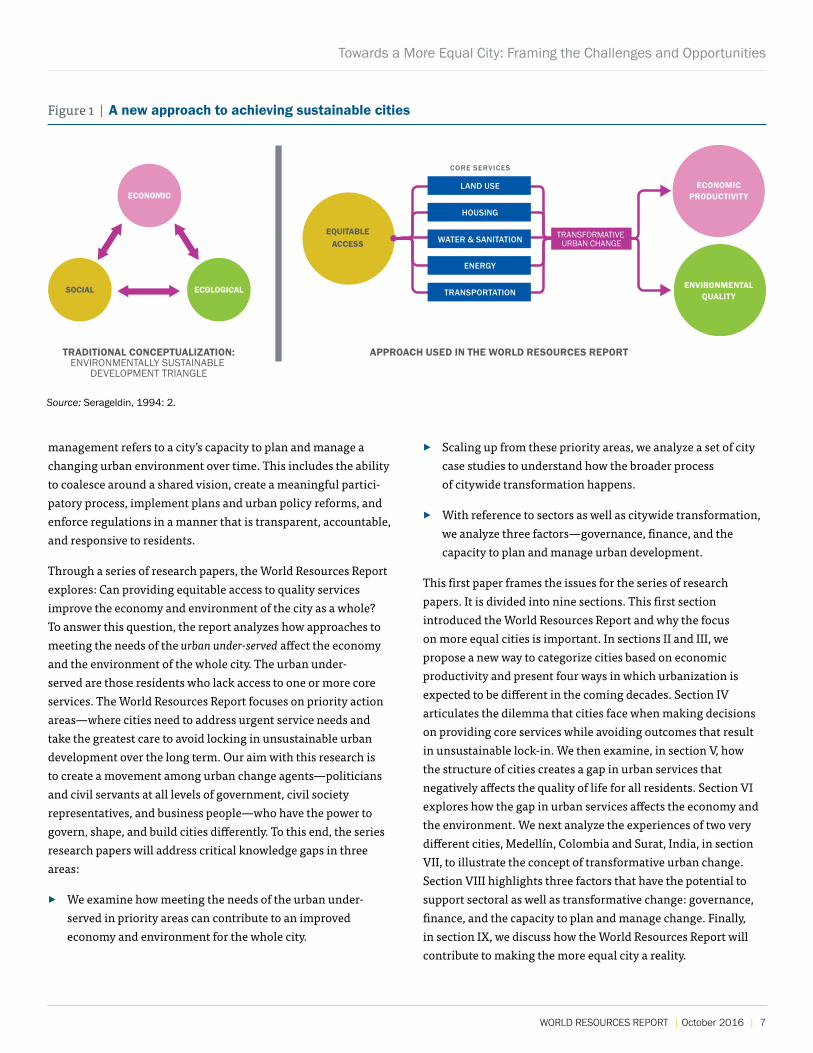
With equity as our entry point, the World Resources Report focuses on how cities provide access to core urban services. Through a series of research papers (listed in the Appendix), we explore: How can cities manage urban expansion? How can they help provide secure and affordable shelter to growing numbers of residents while ensuring access to economic opportunities? How can cities protect their watersheds and provide reliable and affordable potable water and sanitation to households? How can they keep pace with rising energy demand while increasing access to clean, affordable, and reliable energy sources? And how can they address the challenges of congestion and urban transport? Figure 1 illustrates our conceptualization of equity as an entry point for urban sustainability.
If cities are to make significant progress on the SDGs, the UNFCCC Paris Agreement on climate change, and the New Urban Agenda they will need to transform in significant ways that transcends change in a single sector. To better understand how urban transformation happens, the World Resources Report examines a series of citywide case studies. Highlights from two preliminary cases are presented in this paper.25 We define transformative urban change as a fundamental shift in how cities are developing. Urban transformation is a citywide movement: it changes power dynamics, political leadership,
and institutions that affect how the city functions. It requires a broad process of cross-sectoral, sustained, positive change that improves the economy and the environment for the whole city. The preliminary examples presented in this paper, as well as the more in-depth case studies, are not “best practices.” We start from an assumption that every case of transformative urban change will have progressive and regressive elements and every city is likely to experience difficulties, setbacks, and false starts. The case studies seek to discern whether there is a pattern to how transformative change starts, unfolds, and is ultimately institutionalized.
Based on an analysis of our preliminary examples of urban trans-formation and a broader review of the literature three factors emerge as key: governance, finance, and urban planning and management. Governance is important because it encompasses the urban decision-making structure and government policies from the local to the national level, the role of civil society orga-nizations, and the extent of public participation. Finance and funding refers to the financial resources the city needs to make change happen. It includes a city’s access to capital, financial transfers from higher levels of government, engagement with the private sector, and municipal revenues (e.g., budgetary contributions, taxes, fees, user charges). Urban planning and
The significance of these spheres was
underscored by the adoption of the
United Nations Sustainable Development
Goals and the United Nations Framework
Convention on Climate Change (UNFCCC)
Paris Agreement on climate change.
Because of the interdependent nature of
these three areas, cities cannot achieve
and sustain progress in any one of them
without simultaneously addressing the
other two. Achieving progress in all three
areas remains challenging for even the
most well-resourced and capable cities.
In those parts of the world that are rapidly
urbanizing, city leaders are grappling with
a growing population and an increased
number of poor people residing in
urban areas.22 Looking for examples of
environmentally sustainable solutions
among cities that urbanized first has
limitations because these cities followed
a path of resource-intensive development.
They consume energy and water and
produce greenhouse gas emissions at rates
many times greater than their counterparts
in the rapidly urbanizing areas of today.
It is true that cities in the Global North
have achieved unprecedented levels of
service delivery, but at what cost? Many
of these cities made land-use decisions
and infrastructure investments that locked
them into unsustainable patterns of
resource consumption and costly future
urban development trajectories.23 Examples
include: zoning that locates residential
land use far from markets and employment
opportunities; investments in infrastructure
that favor private automobile ownership
over public transportation systems; and
water-based sewerage systems. With regard
to equitable urban development, economic
growth is not a simple solution. The benefits
of growth are often not shared equally, and
inequality has the potential to undermine
these gains and threaten political stability.24
How cities grow and how cities respond to
inequality will be integral to defining their
future. For a sustainable future, cities need
to provide opportunities and a high quality
of life for all segments of society.
Box 1 | The Interlocking Spheres of Economy, Environment, and Equity in Sustainable Cities
WORLD RESOURCES REPORT | October 2016 | 7
Towards a More Equal City: Framing the Challenges and Opportunities
Figure 1 | A new approach to achieving sustainable cities
SOCIAL
ECONOMIC
ECOLOGICAL
TRADITIONAL CONCEPTUALIZATION:ENVIRONMENTALLY SUSTAINABLE
DEVELOPMENT TRIANGLE
APPROACH USED IN THE WORLD RESOURCES REPORT
EQUITABLEACCESS
HOUSING
LAND USE
TRANSFORMATIVE URBAN CHANGEWATER & SANITATION
ENERGY
TRANSPORTATION
ECONOMICPRODUCTIVITY
ENVIRONMENTALQUALITY
CORE SERVICES
Source: Serageldin, 1994: 2.
management refers to a city’s capacity to plan and manage a changing urban environment over time. This includes the ability to coalesce around a shared vision, create a meaningful partici-patory process, implement plans and urban policy reforms, and enforce regulations in a manner that is transparent, accountable, and responsive to residents.
Through a series of research papers, the World Resources Report explores: Can providing equitable access to quality services improve the economy and environment of the city as a whole? To answer this question, the report analyzes how approaches to meeting the needs of the urban under-served affect the economy and the environment of the whole city. The urban under-served are those residents who lack access to one or more core services. The World Resources Report focuses on priority action areas—where cities need to address urgent service needs and take the greatest care to avoid locking in unsustainable urban development over the long term. Our aim with this research is to create a movement among urban change agents—politicians and civil servants at all levels of government, civil society representatives, and business people—who have the power to govern, shape, and build cities differently. To this end, the series research papers will address critical knowledge gaps in three areas:
▸ We examine how meeting the needs of the urban under-served in priority areas can contribute to an improved economy and environment for the whole city.
▸ Scaling up from these priority areas, we analyze a set of city case studies to understand how the broader process of citywide transformation happens.
▸ With reference to sectors as well as citywide transformation, we analyze three factors—governance, finance, and the capacity to plan and manage urban development.
This first paper frames the issues for the series of research papers. It is divided into nine sections. This first section introduced the World Resources Report and why the focus on more equal cities is important. In sections II and III, we propose a new way to categorize cities based on economic productivity and present four ways in which urbanization is expected to be different in the coming decades. Section IV articulates the dilemma that cities face when making decisions on providing core services while avoiding outcomes that result in unsustainable lock-in. We then examine, in section V, how the structure of cities creates a gap in urban services that negatively affects the quality of life for all residents. Section VI explores how the gap in urban services affects the economy and the environment. We next analyze the experiences of two very different cities, Medellín, Colombia and Surat, India, in section VII, to illustrate the concept of transformative urban change. Section VIII highlights three factors that have the potential to support sectoral as well as transformative change: governance, finance, and the capacity to plan and manage change. Finally, in section IX, we discuss how the World Resources Report will contribute to making the more equal city a reality.
8 |
II. A NEW CATEGORIZATION OF CITIES FOCUSED ON ECONOMIC PRODUCTIVITY
We first propose a new way to categorize cities that recognizes the heterogeneity among cities around the world and helps us to better understand the challenges that cities will face in the years ahead. We believe that urbanization in the future will diverge from the patterns of the past and, in the next section, we will highlight four ways in which urbanization is likely to change.
Before we begin to analyze patterns of urbanization, it is important to note that there is no universally accepted definition of what constitutes an urban area. A city typically refers to a geographic area that conforms to a political, jurisdictional, or administrative boundary. Many contiguous urban areas or urban agglomerations, however, extend well beyond a city’s jurisdictional boundaries. Most countries define urban areas by a single population or density threshold. Many countries use a low threshold to identify urban areas. For example, the United States defines an urban cluster as an area containing at least 2,500 inhabitants.26 Using low thresholds creates thousands of small urban centers that lack the attributes typically associated with cities.
Our analyses are based primarily on three data sources: the United Nations World Urbanization Prospects (United Nations, 2014), the World Bank’s World Development Indicators (World Bank, 2016), and Oxford Economics databases (Oxford Economics, 2016). The overall population threshold used in the Oxford Economics database is about 400,000 inhabitants.27 The database covers the United Nations list of urban agglomerations with at least 750,000 inhabitants and some other “strategically” important cities such as country capitals.28
There are important caveats regarding the comparative urban analyses presented below. First, much of the data we analyze are derived from national censuses, and several countries have not conducted a census in more than a decade.29 Second, all projections are based on historical patterns; factors such as conflicts, pandemics, migration, climate change, economic recessions, and natural disasters, among others, can all influence future urbanization, but are not accounted for in the projections. Third, when cities are grouped into broad categories for the sake of comparison and generalizations, diversity is muted and nuance is lost.30 For example, we know that within many countries tremendous diversity exists between a primary city and secondary cities. With these caveats in mind, we proceed to categorize cities with caution.
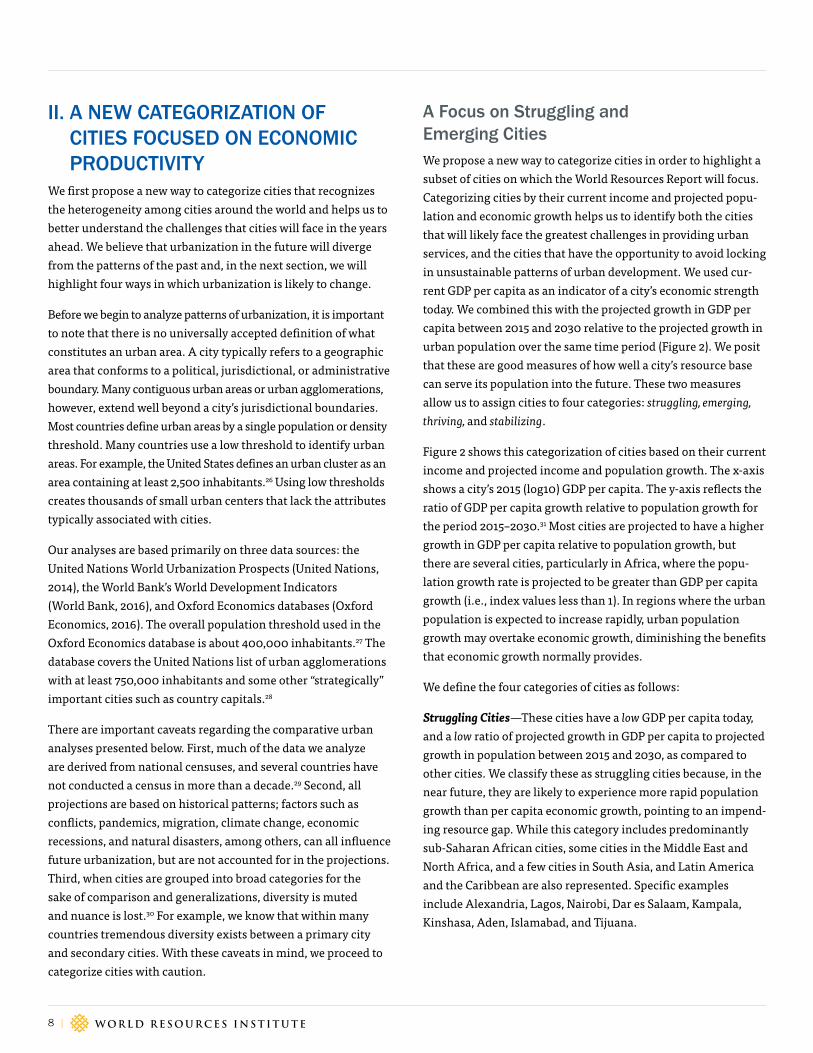
A Focus on Struggling and Emerging CitiesWe propose a new way to categorize cities in order to highlight a subset of cities on which the World Resources Report will focus. Categorizing cities by their current income and projected popu-lation and economic growth helps us to identify both the cities that will likely face the greatest challenges in providing urban services, and the cities that have the opportunity to avoid locking in unsustainable patterns of urban development. We used cur-rent GDP per capita as an indicator of a city’s economic strength today. We combined this with the projected growth in GDP per capita between 2015 and 2030 relative to the projected growth in urban population over the same time period (Figure 2). We posit that these are good measures of how well a city’s resource base can serve its population into the future. These two measures allow us to assign cities to four categories: struggling, emerging, thriving, and stabilizing.
Figure 2 shows this categorization of cities based on their current income and projected income and population growth. The x-axis shows a city’s 2015 (log10) GDP per capita. The y-axis reflects the ratio of GDP per capita growth relative to population growth for the period 2015–2030.31 Most cities are projected to have a higher growth in GDP per capita relative to population growth, but there are several cities, particularly in Africa, where the popu-lation growth rate is projected to be greater than GDP per capita growth (i.e., index values less than 1). In regions where the urban population is expected to increase rapidly, urban population growth may overtake economic growth, diminishing the benefits that economic growth normally provides.
We define the four categories of cities as follows:
Struggling Cities—These cities have a low GDP per capita today, and a low ratio of projected growth in GDP per capita to projected growth in population between 2015 and 2030, as compared to other cities. We classify these as struggling cities because, in the near future, they are likely to experience more rapid population growth than per capita economic growth, pointing to an impend-ing resource gap. While this category includes predominantly sub-Saharan African cities, some cities in the Middle East and North Africa, and a few cities in South Asia, and Latin America and the Caribbean are also represented. Specific examples include Alexandria, Lagos, Nairobi, Dar es Salaam, Kampala, Kinshasa, Aden, Islamabad, and Tijuana.

WORLD RESOURCES REPORT | October 2016 | 9
Towards a More Equal City: Framing the Challenges and Opportunities
Figure 2 | We categorize cities based on current and projected economic productivity
Note: n = 769. The y-axis value is: (GDP per capita2030/GDP per capita2015) / (Population2030/Population2015). The vertical line indicates median value of GDP per capita and the horizontal line indicates an index value of 1. Sources: Oxford Economics, 2016; World Bank country classification.
1
2
3 4 5
log10 (GDP per capita 2015)
Rat
io o
f GD
P p
er c
apit
a gr
owth
to
popu
lati
on g
row
th (2
015–
2030
)
East Asia and Pacific
Low Income TodayHigh Income Growth Relative toPopulation Growth, 2015–2030
EMERGING CITIES
High Income TodayHigh Income Growth Relative toPopulation Growth, 2015–2030
THRIVING CITIES
High Income TodayLow Income Growth Relative toPopulation Growth, 2015–2030
STABILIZING CITIES
Low Income TodayLow Income Growth Relative toPopulation Growth, 2015–2030
STRUGGLING CITIES
Europe and Central Asia Latin America and the Caribbean Middle East and North Africa
North America South Asia sub−Saharan Africa
Brasília Dubai VancouverAden
LagosNairobi
Islamabad
Surabaya
Ho Chi Minh City
Mumbai
MedellínDhaka
Chengdu
Mexico City TaipeiCopenhagen

10 |
Emerging Cities—These cities have a low GDP per capita today, and a high ratio of projected growth in GDP per capita to projected growth in population between 2015 and 2030, as compared to other cities. We classify these as emerging cities because, while their economic strength is low today, their projected economic growth is greater than their projected population growth, indicating projected increases in economic productivity. These cities are more likely to have the capacity to overcome current resource constraints and strengthen their position globally. Most of the cities in this category are in East Asia and the Pacific and South Asia, with some in Europe and Central Asia, and Latin America and the Caribbean as well. Specific examples include Surabaya, Cebu City, Phnom Penh, Ho Chi Minh City, Hengshui, Fuyang, Belgrade, Tbilisi, Mumbai, Jaipur, Dhaka, Lima, Quito, and Medellín.
Thriving Cities—These cities have a high GDP per capita today, and a high ratio of projected growth in GDP per capita to projected growth in population between 2015 and 2030, as compared to other cities. We classify these as thriving cities because, not only are they economically strong today, their economic growth is projected to outpace their urban population growth in coming years. These cities are growing and thriving. Cities from East Asia, Europe and Central Asia, North America, and Latin America and the Caribbean fall within this category. Specific examples include Beijing, Chengdu, Taipei, Bangkok, Berlin, Copenhagen, London, Boston, Denver, Montreal, Belo Horizonte, Buenos Aires, Bogotá, Guadalajara, and Mexico City.
Stabilizing Cities—These cities have a high GDP per capita today, and a low ratio of projected growth in GDP per capita to projected growth in population between 2015 and 2030, as compared to other cities. We classify these cities as stabilizing cities because they are economically strong today, but their economic growth is expected to be lower relative to their population growth when compared to emerging or thriving cities. In that sense, these cities are starting to stabilize and in some cases, their economies are starting to shrink. It is primarily cities from North America, Latin America, and the Middle East that fall within this category. Specific examples include Toronto, Vancouver, Austin, Brasília, Curitiba, Ciudad Guayana, Dubai, and Kuwait City.
Of the total number of cities included in the Oxford Economic database, we categorize 4.8 percent as struggling and 45.9 percent as emerging. So, just over half the cities included in the database fall into these two categories. The World Resources Report will focus on the subset of cities that are struggling and emerging because these cities have an opportunity to meet growing infrastructure and service demands in ways that are different from those in cities that are thriving and stabilizing.
Figure 3 shows the geographic distribution of the different categories of cities. The majority of struggling and emerging cities are located in Africa, Asia, and Latin America.
Struggling
Emerging
Thriving
Stabilizing
Figure 3 | Struggling, emerging, thriving, and stabilizing cities are regionally clustered
Note: n = 769 cities.Source: Oxford Economics, 2016.
WORLD RESOURCES REPORT | October 2016 | 11
Towards a More Equal City: Framing the Challenges and Opportunities
III. FOUR CHALLENGES FOR SUSTAINABLE CITIES
The Highest Rates of Urbanization will be in sub-Saharan Africa and South Asia Patterns of urban growth are changing, with the highest rates of urbanization shifting from the Global North to the Global South. The world’s high-income countries have been highly urbanized for several decades and are now about 80 percent urban on average.32 Since 1950, upper middle-income countries have urbanized the fastest and are now, on average, about 63 percent urban.33 Lower middle-income countries have urbanized more slowly and are now about 39 percent urban on average, but they are expected to experience the fastest urbanization rates in the future.34
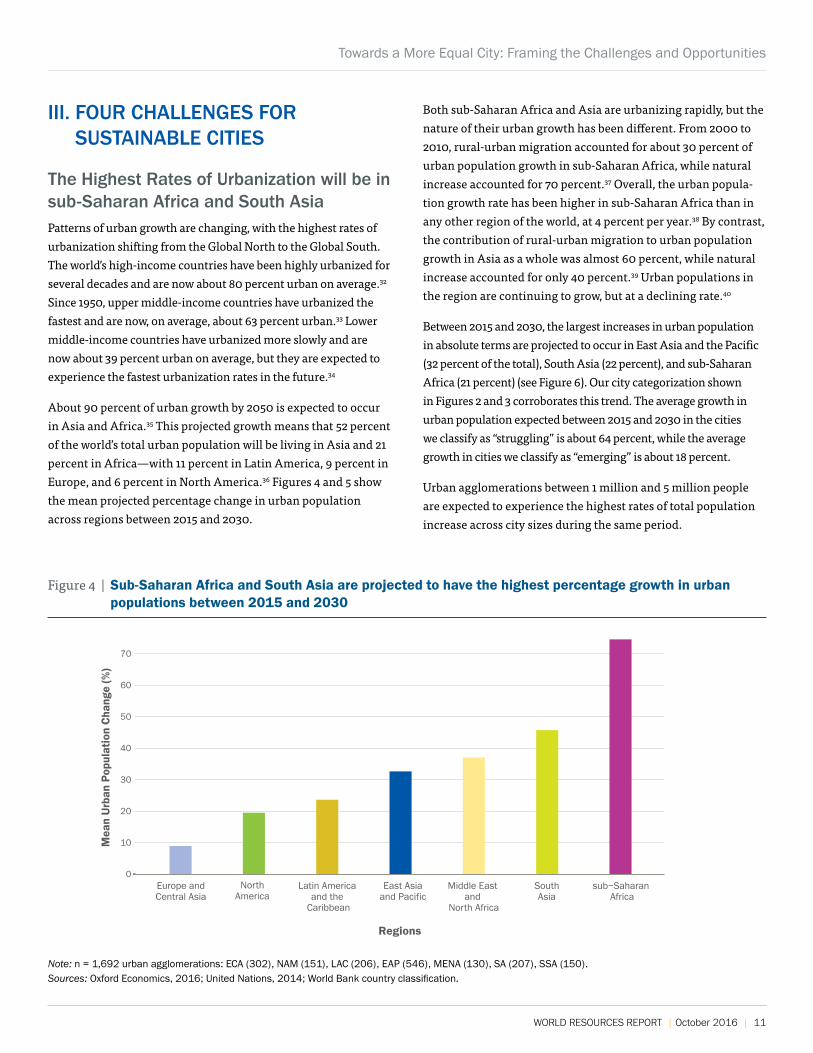
About 90 percent of urban growth by 2050 is expected to occur in Asia and Africa.35 This projected growth means that 52 percent of the world’s total urban population will be living in Asia and 21 percent in Africa—with 11 percent in Latin America, 9 percent in Europe, and 6 percent in North America.36 Figures 4 and 5 show the mean projected percentage change in urban population across regions between 2015 and 2030.
Both sub-Saharan Africa and Asia are urbanizing rapidly, but the nature of their urban growth has been different. From 2000 to 2010, rural-urban migration accounted for about 30 percent of urban population growth in sub-Saharan Africa, while natural increase accounted for 70 percent.37 Overall, the urban popula-tion growth rate has been higher in sub-Saharan Africa than in any other region of the world, at 4 percent per year.38 By contrast, the contribution of rural-urban migration to urban population growth in Asia as a whole was almost 60 percent, while natural increase accounted for only 40 percent.39 Urban populations in the region are continuing to grow, but at a declining rate.40
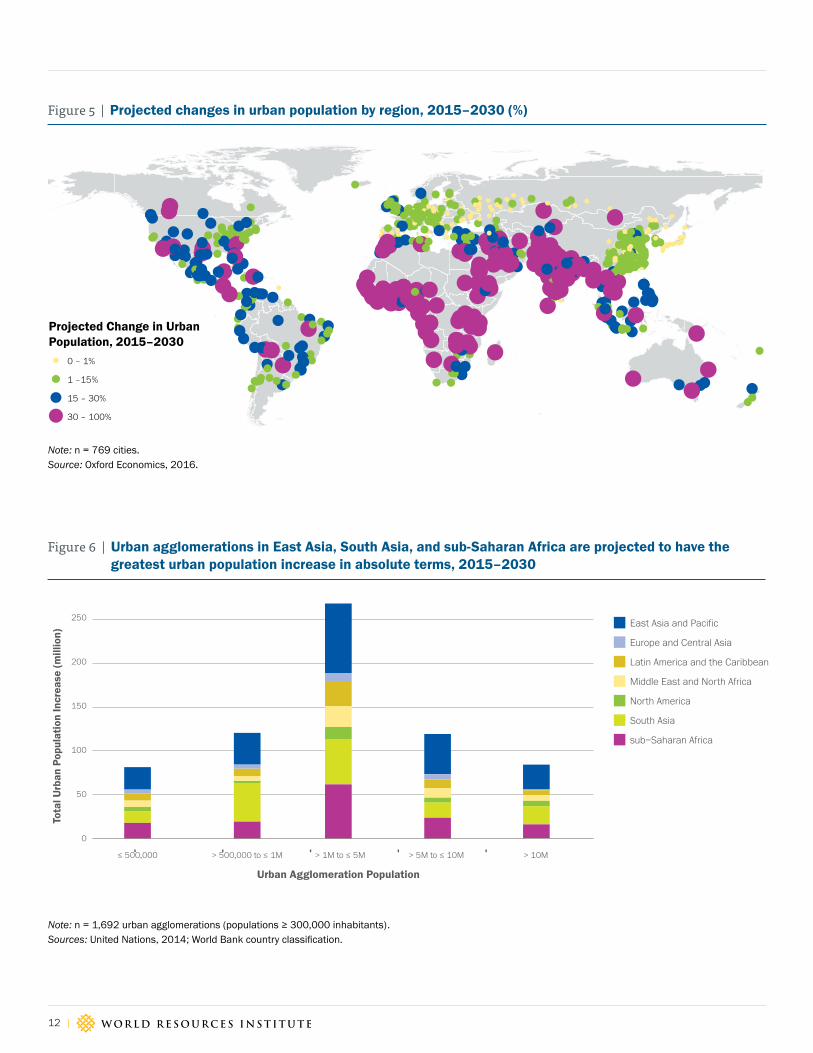
Between 2015 and 2030, the largest increases in urban population in absolute terms are projected to occur in East Asia and the Pacific (32 percent of the total), South Asia (22 percent), and sub-Saharan Africa (21 percent) (see Figure 6). Our city categorization shown in Figures 2 and 3 corroborates this trend. The average growth in urban population expected between 2015 and 2030 in the cities we classify as “struggling” is about 64 percent, while the average growth in cities we classify as “emerging” is about 18 percent.
Urban agglomerations between 1 million and 5 million people are expected to experience the highest rates of total population increase across city sizes during the same period.
Figure 4 | Sub-Saharan Africa and South Asia are projected to have the highest percentage growth in urban populations between 2015 and 2030
Note: n = 1,692 urban agglomerations: ECA (302), NAM (151), LAC (206), EAP (546), MENA (130), SA (207), SSA (150).Sources: Oxford Economics, 2016; United Nations, 2014; World Bank country classification.
0
20
40
60
50
30
10
70
Mea
n U
rban
Pop
ulat
ion
Cha
nge
(%)
Regions
sub−Saharan Africa
SouthAsia
NorthAmerica
Middle East and
North Africa
Latin America and the
Caribbean
Europe andCentral Asia
East Asiaand Pacific
12 |
0
100
200
150
50
250
Urban Agglomeration Population
Tota
l Urb
an P
opul
atio
n In
crea
se (m
illio
n)
East Asia and Pacific
Europe and Central Asia
Latin America and the Caribbean
Middle East and North Africa
North America
South Asia
sub−Saharan Africa
≤ 500,000 > 500,000 to ≤ 1M > 1M to ≤ 5M > 5M to ≤ 10M > 10M
Figure 6 | Urban agglomerations in East Asia, South Asia, and sub-Saharan Africa are projected to have the greatest urban population increase in absolute terms, 2015–2030
Note: n = 1,692 urban agglomerations (populations ≥ 300,000 inhabitants). Sources: United Nations, 2014; World Bank country classification.
Figure 5 | Projected changes in urban population by region, 2015–2030 (%)
Note: n = 769 cities.Source: Oxford Economics, 2016.
0 – 1%
1 –15%
15 – 30%
30 – 100%
Projected Change in UrbanPopulation, 2015–2030
WORLD RESOURCES REPORT | October 2016 | 13
Towards a More Equal City: Framing the Challenges and Opportunities
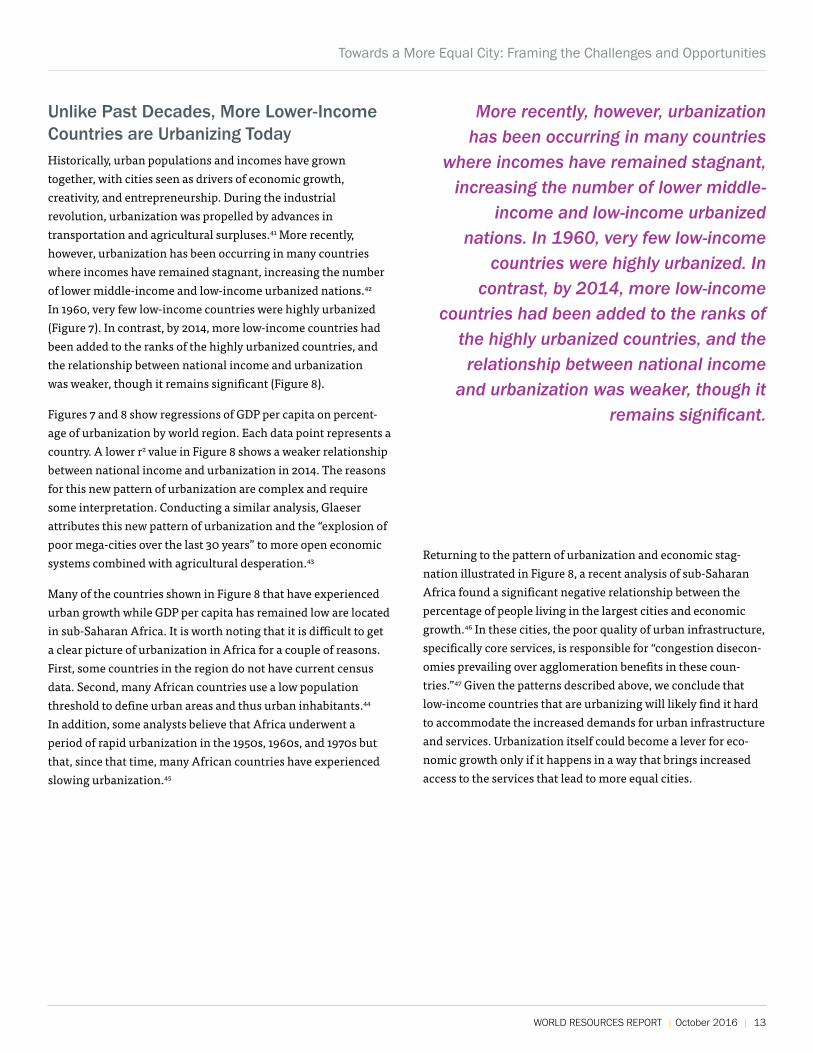
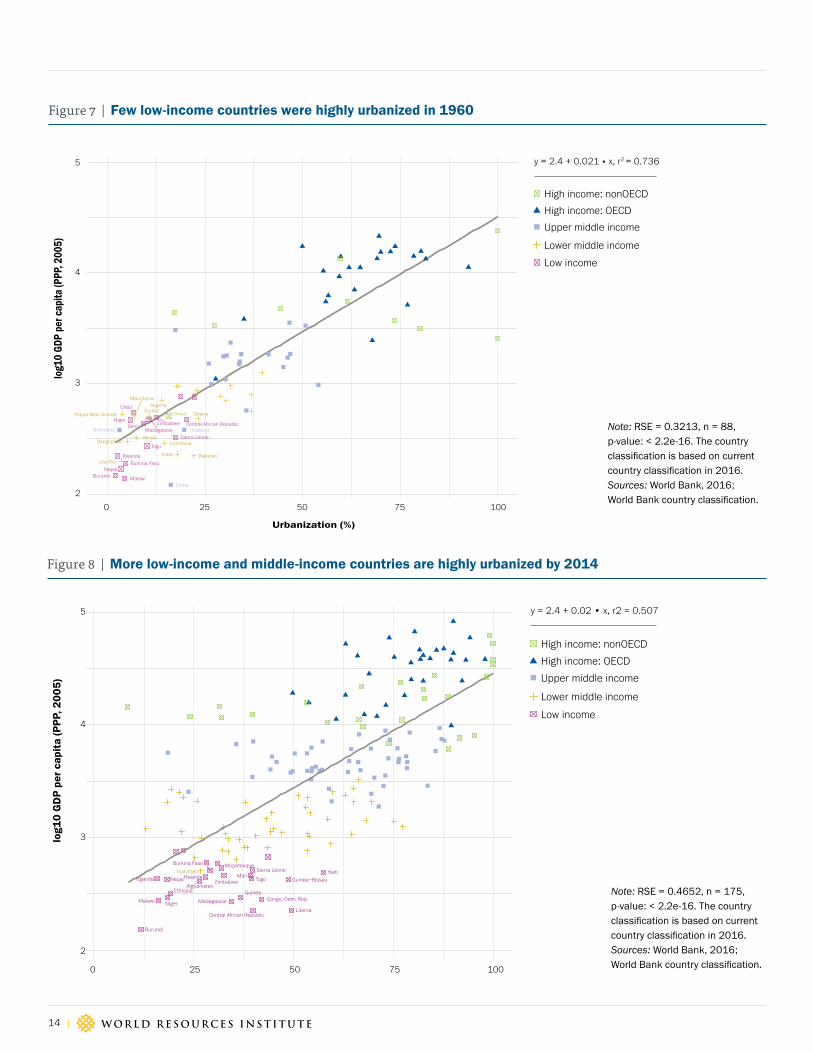
Unlike Past Decades, More Lower-Income Countries are Urbanizing Today Historically, urban populations and incomes have grown together, with cities seen as drivers of economic growth, creativity, and entrepreneurship. During the industrial revolution, urbanization was propelled by advances in transportation and agricultural surpluses.41 More recently, however, urbanization has been occurring in many countries where incomes have remained stagnant, increasing the number of lower middle-income and low-income urbanized nations.42 In 1960, very few low-income countries were highly urbanized (Figure 7). In contrast, by 2014, more low-income countries had been added to the ranks of the highly urbanized countries, and the relationship between national income and urbanization was weaker, though it remains significant (Figure 8).
Figures 7 and 8 show regressions of GDP per capita on percent-age of urbanization by world region. Each data point represents a country. A lower r2 value in Figure 8 shows a weaker relationship between national income and urbanization in 2014. The reasons for this new pattern of urbanization are complex and require some interpretation. Conducting a similar analysis, Glaeser attributes this new pattern of urbanization and the “explosion of poor mega-cities over the last 30 years” to more open economic systems combined with agricultural desperation.43
Many of the countries shown in Figure 8 that have experienced urban growth while GDP per capita has remained low are located in sub-Saharan Africa. It is worth noting that it is difficult to get a clear picture of urbanization in Africa for a couple of reasons. First, some countries in the region do not have current census data. Second, many African countries use a low population threshold to define urban areas and thus urban inhabitants.44 In addition, some analysts believe that Africa underwent a period of rapid urbanization in the 1950s, 1960s, and 1970s but that, since that time, many African countries have experienced slowing urbanization.45
Returning to the pattern of urbanization and economic stag-nation illustrated in Figure 8, a recent analysis of sub-Saharan Africa found a significant negative relationship between the percentage of people living in the largest cities and economic growth.46 In these cities, the poor quality of urban infrastructure, specifically core services, is responsible for “congestion disecon-omies prevailing over agglomeration benefits in these coun-tries.”47 Given the patterns described above, we conclude that low-income countries that are urbanizing will likely find it hard to accommodate the increased demands for urban infrastructure and services. Urbanization itself could become a lever for eco-nomic growth only if it happens in a way that brings increased access to the services that lead to more equal cities.
More recently, however, urbanization has been occurring in many countries
where incomes have remained stagnant, increasing the number of lower middle-
income and low-income urbanized nations. In 1960, very few low-income
countries were highly urbanized. In contrast, by 2014, more low-income
countries had been added to the ranks of the highly urbanized countries, and the relationship between national income
and urbanization was weaker, though it remains significant.
14 |
Figure 8 | More low-income and middle-income countries are highly urbanized by 2014
Urbanization (%)
log1
0 G
DP
per
cap
ita
(PPP
, 200
5)
High income: nonOECD
High income: OECD
Upper middle income
Lower middle income
Low income
y = 2.4 + 0.02 • x, r2 = 0.507
Afghanistan
Burundi
Burkina Faso
Central African Republic
Ethiopia Guinea
Guinea−BissauHaiti
Liberia
Madagascar
Mali
Mozambique
Malawi Niger
NepalRwandaSierra Leone
TogoTajikistan
Congo, Dem. Rep.
ZimbabweUganda
3
2
4
5
250 50 75 100
Figure 7 | Few low-income countries were highly urbanized in 1960
Burundi
Benin
Burkina Faso
Central African Republic
Ghana
Indonesia
India
Kenya
Lesotho
Madagascar
Mauritania
Malawi
Niger
Nigeria
Nepal
Oman
Pakistan
Papua New Guinea
Rwanda
Sudan
Sierra Leone
Chad
Togo
Zimbabwe
Bangladesh
2
3
4
5
0 25 50 75 100
Urbanization (%)
log1
0 GD
P pe
r cap
ita (P
PP, 2
005)
Botswana
China
Thailand
High income: nonOECD
High income: OECD
Upper middle income
Lower middle income
Low income
y = 2.4 + 0.021 • x, r2 = 0.736
Note: RSE = 0.3213, n = 88, p-value: < 2.2e-16. The country classification is based on current country classification in 2016.Sources: World Bank, 2016; World Bank country classification.
Note: RSE = 0.4652, n = 175, p-value: < 2.2e-16. The country classification is based on current country classification in 2016.Sources: World Bank, 2016; World Bank country classification.
WORLD RESOURCES REPORT | October 2016 | 15
Towards a More Equal City: Framing the Challenges and Opportunities
Table 1. Urban and Rural “$1 a Day” Poverty Measures for 1993 and 2002
NUMBER OF POOR (MILLIONS) SHARE BELOW POVERTY LINE (PERCENT) URBAN SHARE OF THE POOR (PERCENT)YEAR URBAN RURAL TOTAL URBAN RURAL TOTAL
1993 242 1,038 1,280 13.8 36.6 28.0 18.9
2002 291 890 1,181 13.2 29.7 22.7 24.6
Note: Data from India.Source: Ravallion et al., 2007c: 8.
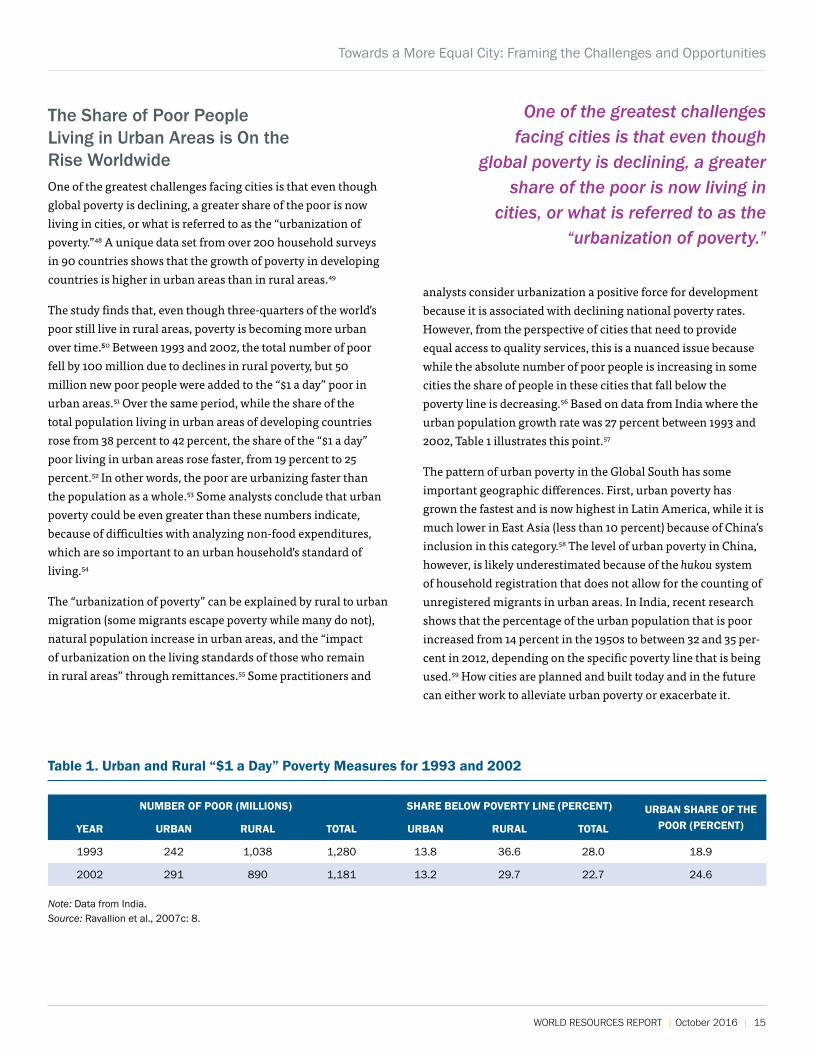
The Share of Poor People Living in Urban Areas is On the Rise Worldwide One of the greatest challenges facing cities is that even though global poverty is declining, a greater share of the poor is now living in cities, or what is referred to as the “urbanization of poverty.”48 A unique data set from over 200 household surveys in 90 countries shows that the growth of poverty in developing countries is higher in urban areas than in rural areas.49
The study finds that, even though three-quarters of the world’s poor still live in rural areas, poverty is becoming more urban over time.50 Between 1993 and 2002, the total number of poor fell by 100 million due to declines in rural poverty, but 50 million new poor people were added to the “$1 a day” poor in urban areas.51 Over the same period, while the share of the total population living in urban areas of developing countries rose from 38 percent to 42 percent, the share of the “$1 a day” poor living in urban areas rose faster, from 19 percent to 25 percent.52 In other words, the poor are urbanizing faster than the population as a whole.53 Some analysts conclude that urban poverty could be even greater than these numbers indicate, because of difficulties with analyzing non-food expenditures, which are so important to an urban household’s standard of living.54
The “urbanization of poverty” can be explained by rural to urban migration (some migrants escape poverty while many do not), natural population increase in urban areas, and the “impact of urbanization on the living standards of those who remain in rural areas” through remittances.55 Some practitioners and
analysts consider urbanization a positive force for development because it is associated with declining national poverty rates. However, from the perspective of cities that need to provide equal access to quality services, this is a nuanced issue because while the absolute number of poor people is increasing in some cities the share of people in these cities that fall below the poverty line is decreasing.56 Based on data from India where the urban population growth rate was 27 percent between 1993 and 2002, Table 1 illustrates this point.57
The pattern of urban poverty in the Global South has some important geographic differences. First, urban poverty has grown the fastest and is now highest in Latin America, while it is much lower in East Asia (less than 10 percent) because of China’s inclusion in this category.58 The level of urban poverty in China, however, is likely underestimated because of the hukou system of household registration that does not allow for the counting of unregistered migrants in urban areas. In India, recent research shows that the percentage of the urban population that is poor increased from 14 percent in the 1950s to between 32 and 35 per-cent in 2012, depending on the specific poverty line that is being used.59 How cities are planned and built today and in the future can either work to alleviate urban poverty or exacerbate it.
One of the greatest challenges facing cities is that even though
global poverty is declining, a greater share of the poor is now living in
cities, or what is referred to as the “urbanization of poverty.”
16 |
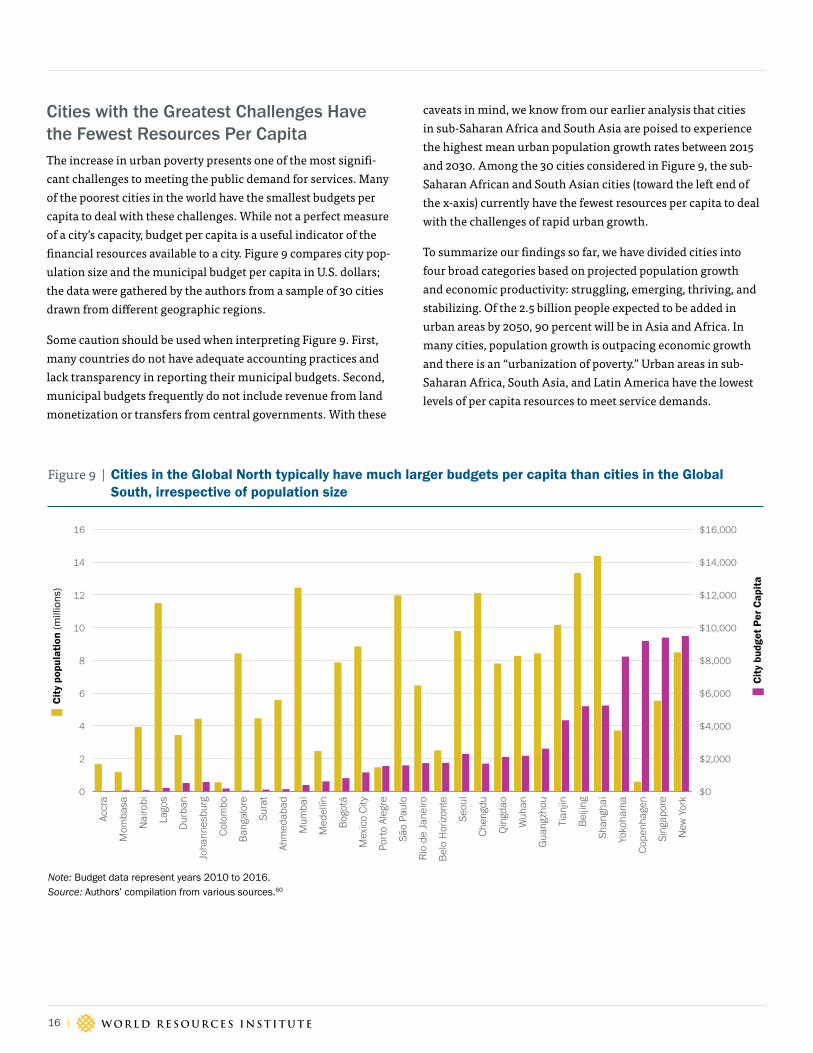
Cities with the Greatest Challenges Have the Fewest Resources Per Capita The increase in urban poverty presents one of the most signifi-cant challenges to meeting the public demand for services. Many of the poorest cities in the world have the smallest budgets per capita to deal with these challenges. While not a perfect measure of a city’s capacity, budget per capita is a useful indicator of the financial resources available to a city. Figure 9 compares city pop-ulation size and the municipal budget per capita in U.S. dollars; the data were gathered by the authors from a sample of 30 cities drawn from different geographic regions.
Some caution should be used when interpreting Figure 9. First, many countries do not have adequate accounting practices and lack transparency in reporting their municipal budgets. Second, municipal budgets frequently do not include revenue from land monetization or transfers from central governments. With these
caveats in mind, we know from our earlier analysis that cities in sub-Saharan Africa and South Asia are poised to experience the highest mean urban population growth rates between 2015 and 2030. Among the 30 cities considered in Figure 9, the sub-Saharan African and South Asian cities (toward the left end of the x-axis) currently have the fewest resources per capita to deal with the challenges of rapid urban growth.
To summarize our findings so far, we have divided cities into four broad categories based on projected population growth and economic productivity: struggling, emerging, thriving, and stabilizing. Of the 2.5 billion people expected to be added in urban areas by 2050, 90 percent will be in Asia and Africa. In many cities, population growth is outpacing economic growth and there is an “urbanization of poverty.” Urban areas in sub-Saharan Africa, South Asia, and Latin America have the lowest levels of per capita resources to meet service demands.
Figure 9 | Cities in the Global North typically have much larger budgets per capita than cities in the Global South, irrespective of population size
Note: Budget data represent years 2010 to 2016. Source: Authors’ compilation from various sources.60
0
2
4
6
8
10
12
14
16
$0
$2,000
$4,000
$6,000
$8,000
$10,000
$12,000
$14,000
$16,000
New
Yor
k
Sing
apor
e
Cope
nhag
en
Yoko
ham
a
Shan
ghai
Beiji
ng
Tian
jin
Gua
ngzh
ou
Wuh
an
Qin
gdao
Chen
gdu
Seou
l
Belo
Hor
izont
e
Rio
de J
anei
ro
São
Paul
o
Port
o Al
egre
Mex
ico
City
Bogo
tá
Med
ellín
Mum
bai
Ahm
edab
ad
Sura
t
Bang
alor
e
Colo
mbo
Joha
nnes
burg
Dur
ban
Lago
s
Nai
robi
Mom
basa
Accr
a
Cit
y bu
dget
Per
Cap
ita
Cit
y po
pula
tion
(mill
ions
)
WORLD RESOURCES REPORT | October 2016 | 17
Towards a More Equal City: Framing the Challenges and Opportunities
IV. THE URGENCY AND LOCK-IN DILEMMA AND PRIORITY AREAS FOR ACTION
Many struggling and emerging cities are grappling with ways to meet the urgent needs of residents without locking cities into patterns of development that will have negative long-term con-sequences. For example, a number of Latin American govern-ments (e.g., Mexico and Brazil) have addressed the gap in afford-able housing through subsidized housing development. To make these projects financially viable, developers have built housing on less expensive land on the city’s periphery. While seemingly a positive approach to affordable housing, these programs have created a number of unintended negative consequences.
The location on the periphery locks residents into time-consuming and expensive commutes to the city’s center. Long commutes also negatively affect everyone’s air quality. Finally, building affordable housing on the periphery locks the city into the cost of extended trunk infrastructure and services. In some parts of Mexico City, these housing schemes have been abandoned by residents. This example highlights the kind of dilemma in which cities can find themselves when trying to meet urgent needs without simultaneously considering the long-term lock-in effects.
Urgent needs are those that must be met in the short term to ensure people’s wellbeing and cities provide in the form of core services. If not adequately addressed, households will employ informal and unregulated means to meet their needs (self-provisioning). Self-provisioning has negative environmental, health, and, sometimes, political consequences. For example, unmet needs can result in mass protests or other forms of political instability; examples include the recent protests in Rio de Janeiro (2013 to 2016), Cochabamba (1999 to 2000), and Addis Ababa (2016 being the worst year in the past 25 years).61
“Lock-in” refers to decisions that affect land use, infrastructure, and the built environment in a city. Because these decisions shape the built environment they have long-term consequences that are difficult and costly to reverse. Decisions that affect the physical environment in turn influence where people live and work, and, thus how the city grows and expands. Because of the close relationships between land use, the built environment, energy consumption, and emissions, many of these decisions also have implications for climate outcomes.
Decision-makers in struggling and emerging cities are under tremendous pressure to identify a few priority areas for action that can achieve the maximum benefit for all segments of the population. While keeping the tension between urgency and lock-in in mind, we suggest that cities concentrate their limited resources on providing core services that will make the city more equal. The World Resources Report will focus on how cities can provide more equitable access to priority core services (for example, land use, housing, water and sanitation, energy, and transportation).
V. THE WAY CITIES ARE GROWING UNDERMINES THE QUALITY OF LIFE FOR ALL RESIDENTS
Many significant improvements in urban service delivery were achieved in the 20 years between 1990 and 2010, providing access to water, sanitation, and durable housing for around 200 million urban residents globally. These advances, however, need to be viewed with a critical eye.62 First, there are no reliable national statistics on the percentage of urban populations living in informal settlements and “slums.” Residents of informal set-tlements and slumdwellers are likely to have some of the largest unmet service needs, which means that current data on access to services could grossly underestimate the number of people experiencing severe service gaps. Second, researchers tend to measure access to services using very broad definitions and low thresholds. For example, in the case of access to improved water, the World Health Organization (WHO) and United Nations International Children’s Emergency Fund (UNICEF) defines “improved” drinking water as “piped water on premises… public taps or standpipes, tube wells or boreholes, protected wells, protected springs and rainwater catchment—with no reference to actual water quality.”63 With these caveats in mind, we analyze the magnitude, as well as the economic and environmental costs, of the gap that exists in the core services of many cities.
18 |
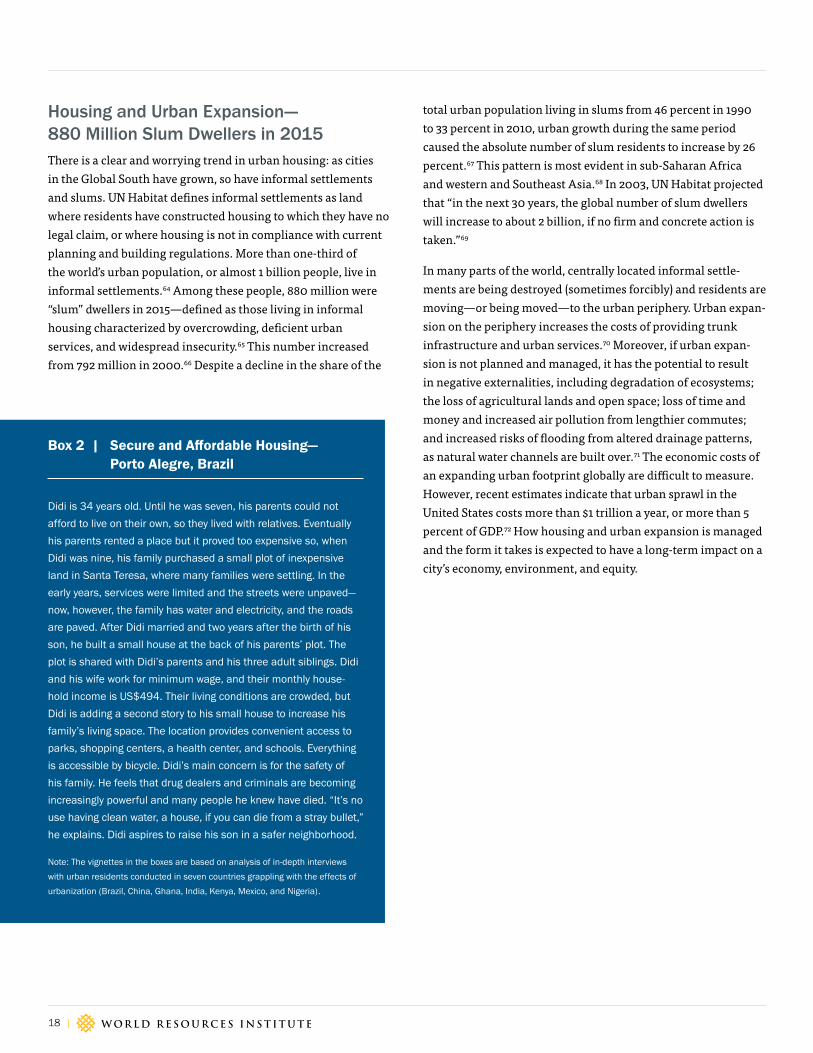
Didi is 34 years old. Until he was seven, his parents could not
afford to live on their own, so they lived with relatives. Eventually
his parents rented a place but it proved too expensive so, when
Didi was nine, his family purchased a small plot of inexpensive
land in Santa Teresa, where many families were settling. In the
early years, services were limited and the streets were unpaved—
now, however, the family has water and electricity, and the roads
are paved. After Didi married and two years after the birth of his
son, he built a small house at the back of his parents’ plot. The
plot is shared with Didi’s parents and his three adult siblings. Didi
and his wife work for minimum wage, and their monthly house-
hold income is US$494. Their living conditions are crowded, but
Didi is adding a second story to his small house to increase his
family’s living space. The location provides convenient access to
parks, shopping centers, a health center, and schools. Everything
is accessible by bicycle. Didi’s main concern is for the safety of
his family. He feels that drug dealers and criminals are becoming
increasingly powerful and many people he knew have died. “It’s no
use having clean water, a house, if you can die from a stray bullet,”
he explains. Didi aspires to raise his son in a safer neighborhood.
Note: The vignettes in the boxes are based on analysis of in-depth interviews
with urban residents conducted in seven countries grappling with the effects of
urbanization (Brazil, China, Ghana, India, Kenya, Mexico, and Nigeria).
Box 2 | Secure and Affordable Housing— Porto Alegre, Brazil
Housing and Urban Expansion— 880 Million Slum Dwellers in 2015 There is a clear and worrying trend in urban housing: as cities in the Global South have grown, so have informal settlements and slums. UN Habitat defines informal settlements as land where residents have constructed housing to which they have no legal claim, or where housing is not in compliance with current planning and building regulations. More than one-third of the world’s urban population, or almost 1 billion people, live in informal settlements.64 Among these people, 880 million were “slum” dwellers in 2015—defined as those living in informal housing characterized by overcrowding, deficient urban services, and widespread insecurity.65 This number increased from 792 million in 2000.66 Despite a decline in the share of the
total urban population living in slums from 46 percent in 1990 to 33 percent in 2010, urban growth during the same period caused the absolute number of slum residents to increase by 26 percent.67 This pattern is most evident in sub-Saharan Africa and western and Southeast Asia.68 In 2003, UN Habitat projected that “in the next 30 years, the global number of slum dwellers will increase to about 2 billion, if no firm and concrete action is taken.”69
In many parts of the world, centrally located informal settle-ments are being destroyed (sometimes forcibly) and residents are moving—or being moved—to the urban periphery. Urban expan-sion on the periphery increases the costs of providing trunk infrastructure and urban services.70 Moreover, if urban expan-sion is not planned and managed, it has the potential to result in negative externalities, including degradation of ecosystems; the loss of agricultural lands and open space; loss of time and money and increased air pollution from lengthier commutes; and increased risks of flooding from altered drainage patterns, as natural water channels are built over.71 The economic costs of an expanding urban footprint globally are difficult to measure. However, recent estimates indicate that urban sprawl in the United States costs more than $1 trillion a year, or more than 5 percent of GDP.72 How housing and urban expansion is managed and the form it takes is expected to have a long-term impact on a city’s economy, environment, and equity.
WORLD RESOURCES REPORT | October 2016 | 19
Towards a More Equal City: Framing the Challenges and Opportunities
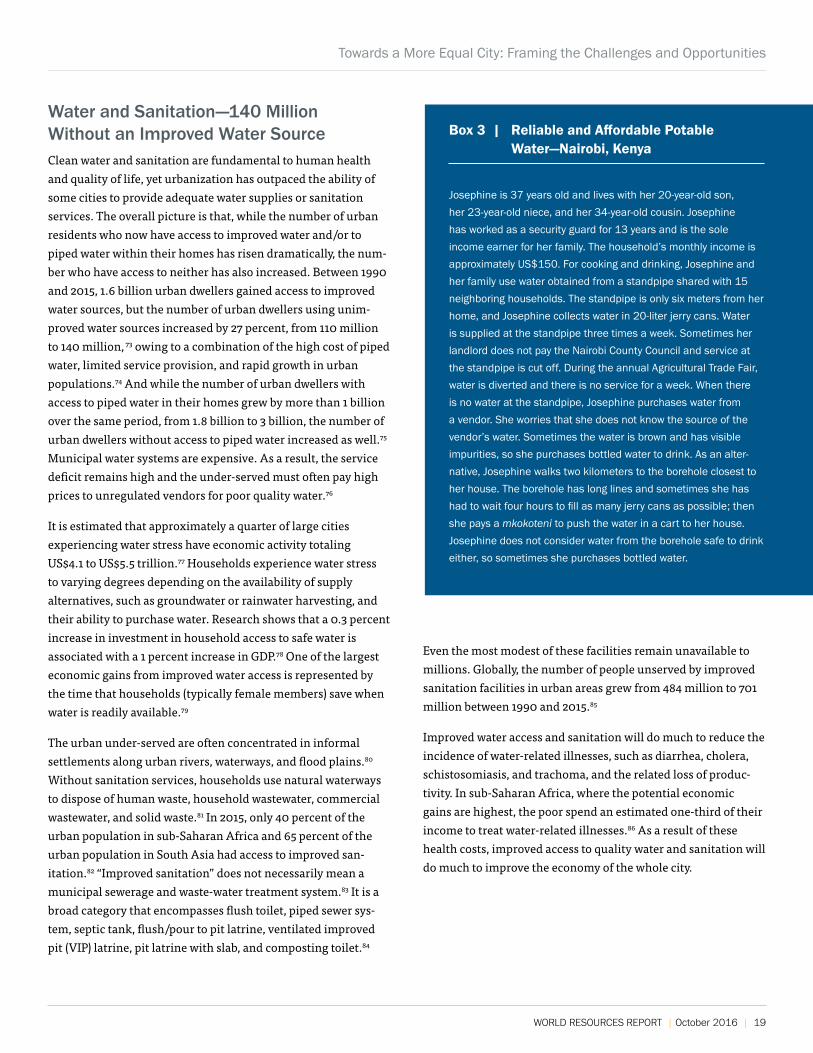
Josephine is 37 years old and lives with her 20-year-old son,
her 23-year-old niece, and her 34-year-old cousin. Josephine
has worked as a security guard for 13 years and is the sole
income earner for her family. The household’s monthly income is
approximately US$150. For cooking and drinking, Josephine and
her family use water obtained from a standpipe shared with 15
neighboring households. The standpipe is only six meters from her
home, and Josephine collects water in 20-liter jerry cans. Water
is supplied at the standpipe three times a week. Sometimes her
landlord does not pay the Nairobi County Council and service at
the standpipe is cut off. During the annual Agricultural Trade Fair,
water is diverted and there is no service for a week. When there
is no water at the standpipe, Josephine purchases water from
a vendor. She worries that she does not know the source of the
vendor’s water. Sometimes the water is brown and has visible
impurities, so she purchases bottled water to drink. As an alter-
native, Josephine walks two kilometers to the borehole closest to
her house. The borehole has long lines and sometimes she has
had to wait four hours to fill as many jerry cans as possible; then
she pays a mkokoteni to push the water in a cart to her house.
Josephine does not consider water from the borehole safe to drink
either, so sometimes she purchases bottled water.
Box 3 | Reliable and Affordable Potable Water—Nairobi, Kenya
Water and Sanitation—140 Million Without an Improved Water SourceClean water and sanitation are fundamental to human health and quality of life, yet urbanization has outpaced the ability of some cities to provide adequate water supplies or sanitation services. The overall picture is that, while the number of urban residents who now have access to improved water and/or to piped water within their homes has risen dramatically, the num-ber who have access to neither has also increased. Between 1990 and 2015, 1.6 billion urban dwellers gained access to improved water sources, but the number of urban dwellers using unim-proved water sources increased by 27 percent, from 110 million to 140 million, 73 owing to a combination of the high cost of piped water, limited service provision, and rapid growth in urban populations.74 And while the number of urban dwellers with access to piped water in their homes grew by more than 1 billion over the same period, from 1.8 billion to 3 billion, the number of urban dwellers without access to piped water increased as well.75 Municipal water systems are expensive. As a result, the service deficit remains high and the under-served must often pay high prices to unregulated vendors for poor quality water.76
It is estimated that approximately a quarter of large cities experiencing water stress have economic activity totaling US$4.1 to US$5.5 trillion.77 Households experience water stress to varying degrees depending on the availability of supply alternatives, such as groundwater or rainwater harvesting, and their ability to purchase water. Research shows that a 0.3 percent increase in investment in household access to safe water is associated with a 1 percent increase in GDP.78 One of the largest economic gains from improved water access is represented by the time that households (typically female members) save when water is readily available.79
The urban under-served are often concentrated in informal settlements along urban rivers, waterways, and flood plains.80 Without sanitation services, households use natural waterways to dispose of human waste, household wastewater, commercial wastewater, and solid waste.81 In 2015, only 40 percent of the urban population in sub-Saharan Africa and 65 percent of the urban population in South Asia had access to improved san-itation.82 “Improved sanitation” does not necessarily mean a municipal sewerage and waste-water treatment system.83 It is a broad category that encompasses flush toilet, piped sewer sys-tem, septic tank, flush/pour to pit latrine, ventilated improved pit (VIP) latrine, pit latrine with slab, and composting toilet.84
Even the most modest of these facilities remain unavailable to millions. Globally, the number of people unserved by improved sanitation facilities in urban areas grew from 484 million to 701 million between 1990 and 2015.85
Improved water access and sanitation will do much to reduce the incidence of water-related illnesses, such as diarrhea, cholera, schistosomiasis, and trachoma, and the related loss of produc-tivity. In sub-Saharan Africa, where the potential economic gains are highest, the poor spend an estimated one-third of their income to treat water-related illnesses.86 As a result of these health costs, improved access to quality water and sanitation will do much to improve the economy of the whole city.

20 |
Energy—More than 482 Million Unserved by Modern Cooking Fuels, 131 Million Unserved by ElectricityEnergy fuels the economic productivity of a city and electricity (or energy) consumption per capita is a statistically significant predictor of a city’s per capita GDP.87 If a city cannot provide basic access to electricity, it is unlikely to provide enough electricity to enhance its overall material wellbeing.88 How much energy a household consumes is a measure of its ability to meet basic needs as well as its economic productivity, since many low-income households operate businesses in their homes.89 In Salvador, Brazil, a survey of two neighborhoods found that more than half the local enterprises were located in the owners’ houses in one neighborhood and virtually all of them were home-based in the other.90 If low-income households and household enterprises like these had access to less polluting, affordable, and reliable energy, their economic productivity would be advanced beyond what is possible under current constraints.
Job Mauti is 36 years old. He moved from a rural agricultural
area in the Lake Victoria basin to Nairobi in search of work 17
years ago. Job is married and has five children between one and
14 years old. His sister-in-law lives with his family. Their house is
one room measuring 300 square feet. The walls are mud and the
roof is sheet iron. Job has worked as a security guard for the past
15 years, and he is the sole income earner in the household. He
earns approximately US$100 per month. The walk to work takes
two hours each way. To cook, Job’s family uses a combination
of kerosene and charcoal briquettes. Job worries about the lack
of ventilation in his house and the fact that there is no separate
cooking area safely away from the children. His wife mixes char-
coal dust and clay to make the briquettes for the family’s use. For
the other household energy needs, Job has an illegal electricity
connection to Kenya’s national power utility company. Job uses the
electricity for lighting; to power a TV, radio, and DVD player; and
to charge his mobile phone. While electricity is available day and
night, power outages occur approximately three times per day, and
the connection cannot support heavy load appliances, like a refrig-
erator or clothing iron. Job worries that the quality of his electrical
connection will damage his appliances. Even more disconcerting
is his family’s vulnerability to the hazards of electric shocks, which
Job claims are not uncommon with this type of connection.
Box 4 | Clean, Reliable, and Affordable Energy—Nairobi, Kenya
Urban areas are generally the first to be served by national electricity grids and they consume nearly three-quarters of the world’s commercial energy, which leads to the mispercep-tion that energy access is not an urban problem.91 In fact, in lower-income countries (comprising heavily indebted poor countries, least developed countries, and low-income countries) the proportion of the urban population with access to modern, non-solid fuels in 2012 was only about 28 percent, according to the World Bank.92 Access to electricity was not much better. On average, 35 percent of urban dwellers in lower-income countries lacked formal access to electricity.93 (It should be noted, how-ever, that methods for estimating access to electricity do not adequately capture access gained through informal and illegal means.) In total, over 482 million urban residents lacked access to modern cooking fuels in 2012, and 131 million lacked access to electricity.94
The use of solid fuels for cooking—wood, coal, charcoal, and agricultural residues—has major health ramifications. Exposure to indoor air pollution from solid fuels can cause chronic sickness and premature death. The particulate emissions from solid fuel combustion contribute not only to pollution inside people’s homes, but also to ambient (outdoor) air pollution. In 2005, about 34 percent of China’s ambient fine particulate matter in its most dangerous form (PM2.5) was produced by residential coal and biomass combustion.95 In 2010, cooking with solid fuels accounted for 12 percent of PM2.5 concentrations worldwide, and for more than one-third in sub-Saharan Africa.96 Globally, in the same year, the use of solid fuels for household cooking is estimated to have resulted in 370,000 deaths due to outdoor ambient PM2.5 pollution, the majority of them occurring in South Asia.97 The quality of energy services has dramatic impacts on the environmental quality of the whole city.

WORLD RESOURCES REPORT | October 2016 | 21
Towards a More Equal City: Framing the Challenges and Opportunities
Transport—Poor People Spend 25 to 35 Percent of their Income on TransportationThe number of private vehicles in the world is rising dramatically and city infrastructure is being built to accommodate them, yet the great majority of urban inhabitants in the Global South still rely on public or informal transportation. There are just over 1 billion motor vehicles in the world today and this number is projected to double by 2030. Many cities continue to allocate significant resources to constructing additional road capacity, citing the need to accommodate the growing number of private vehicles. Yet, in Asian cities, for example, it is projected that the majority of urban households will not have access to private motorized vehicles even in 2020.98
Thus, in rapidly urbanizing areas of the Global South, trans-port systems are developing in an inherently inequitable way.99 Private motorization is rising with few if any controls, public transport is deficient or nonexistent, exclusionary planning too often neglects the needs of pedestrians and cyclists, and dis-proportionate investment in transport infrastructure serves the needs of the vehicle-owning rich and middle classes.100
In many cities in the Global South, the poor walk to work or use bicycles, locating themselves as close to employment opportuni-ties as possible. Where the poor reside far from employment, in peripheral areas of cities, they rely on public transport, informal modes, or a combination of the two to cover long distances to their workplace, and they spend a disproportionate amount of their income on transportation. On average, urban residents spend 8 to 16 percent of their household income on transport, but the urban under-served may spend as much as 25 to 35 percent of their income, 101 and this does not account for lost wages due to time spent in long commutes.102 They are also the most vulnerable to the risks of road accidents and adverse health impacts from exposure to transport-related air pollutants.103
Business-as-usual transport systems that favor the motorized few over the majority of non-motorized residents are already creating high economic costs for cities.104 The value of time lost to congestion-related delays ranges from 2 to 5 percent of GDP in Asia and up to 10 percent of GDP in Beijing and São Paulo.105 Urban road accidents result in a loss of productive years of life due to death and disability, cumulatively amounting to 2 percent of GDP in cities of the developing world.106 In a large, rapidly urbanizing country like India, the cost of health damages caused by urban outdoor air pollution—driven significantly by the growth in private motorized vehicles in urban areas—amounts
Anita is 24 years old and has lived all her life in Delhi. When
she attended university she would take three buses and walk
about 3 kilometers. For the past three years, Anita has worked
as a copyeditor for a leading newspaper, the Times of India. She
earns approximately US$326 per month. While she works a fixed
number of hours per week, she is sometimes required to work
evenings or nights. Her office is approximately 25 kilometers from
where she lives with her sister and brother-in-law. Anita typically
leaves home between 7:00 and 7:30 in the morning. She walks
five minutes from her house in Shalimar Garden then takes an
auto-rickshaw for another 10 minutes to Mohan Nagar, where
she changes to a shared auto-rickshaw. After about 30 minutes,
she arrives at Vaishali metro station. There, she takes the metro
to the Yamuna river bank and changes to another metro that
goes toward Noida Sector 16. From the metro station she takes a
10-minute cycle-rickshaw ride to her office. The entire trip takes
her one hour and 45 minutes. Anita could travel by bus with fewer
transfers, but she prefers the metro because service is more
frequent and it is safer, with a dedicated “ladies compartment.”
Anita worries about her safety, especially when traveling at night
or when the metro is crowded. A number of times she has been
stalked by men. She described how she once hid in a neighbor-
hood beauty parlor to avoid a man. She is afraid to complain
about her daily commute because her family will worry and
encourage her to look for a new job.
Box 5 | Safe, Convenient, and Affordable Transportation—Delhi, India
to 1.7 percent of the country’s GDP and is the largest contributor to the estimated cost of broader environmental degradation.107
Of the roughly $1 trillion that is invested in transport infra-structure each year, only a fraction of domestic, private, and international development financing is directed toward sus-tainable transport projects, policies, and programs.108 We define unsustainable transportation systems as those that favor private, motorized transport, channeling domestic and international funds to roads, bridges, and other infrastructure projects that benefit those who use personal vehicles, as opposed to the majority of people who use non-motorized, paratransit, and public transport modes. Sustainable transportation leads to “improvements in collective qualities of life” measured through multiple social, economic, and environmental indicators, even if it conflicts with individual short-term interests.109
22 |
How the Gap in Urban Services Affects People’s Quality of LifeIn most urban areas in the Global South, households lack access to quality, affordable, and reliable services and this directly affects the quality of people’s lives.
In urban areas, there is almost always a cost associated with acquiring services, whether they are provided as a public good, through the market, or through self-provision (e.g., paying legal or illegal fees to build a house, purchasing water from a vendor). However, in rapidly urbanizing areas, when service provision is unregulated, residents often find they have to pay more and receive lower quality services in return. For example, in Bangalore, people living in peripheral areas of the city not serviced by the municipal water supply pay roughly 10 times the municipal rate for water supplied by water tankers, even though it may be of lower quality.110
When the provision of services is not coordinated by cities, for-mal and informal markets emerge and residents self-provision, which creates problems of overuse, congestion, and environ-mental degradation. For example, evidence from Bangalore shows that almost 16 percent of total annual electricity demand is met by polluting, diesel-powered generators used to provide power during frequent outages or blackouts.111 Extraction of groundwater through bore wells represents 42 percent of the water supplied in the city, in the absence of adequate public provision.112
The lack of access to urban services affects all income brackets to varying degrees and undermines the economic productivity and environmental sustainability of the city as a whole. Households toward the middle or upper end of the income distribution often have sufficient economic means to acquire services through the market, their personal networks, or through self-provisioning mechanisms. The lack of access to core services disproportionately affects the poor and lower-middle classes who have fewer resources and means available to them.
The urban under-served struggle with several overlapping dimensions of service accessibility. First, there is the issue of an individual’s proximity to a service; for example, how far the ser-vice is from the individual’s home or place of work. Second, there is the cost of the service and the relative cost of self-provisioning, obtaining a service illegally, or finding a suitable substitute. Individuals may struggle with the reliability of their services. Third, there is the quality, which often includes considerations of health and safety. Finally, there is the quantity of the service. Is there enough of the service available? These interrelated and overlapping dimensions illustrate how the broader category that we refer to as the “access” affects the quality of life of people living in struggling and emerging cities.
There is a strong association between the proportion of the population that is under-served and the quality, capacity, and accountability of local government. For example, many Latin American cities (e.g. Bogotá, Rosario, Porto Alegre) that have improved their urban governance over the preceding decades are now more responsive to residents and more capable of providing improved access to urban services.113
The lack of access to urban services affects all income brackets to
varying degrees and undermines the economic productivity and
environmental sustainability of the city as a whole.

WORLD RESOURCES REPORT | October 2016 | 23
Towards a More Equal City: Framing the Challenges and Opportunities
VI. LINKING THE URBAN SERVICE GAP TO THE ECONOMY AND ENVIRONMENT
The lack of access to services directly affects the quality of indi-viduals’ lives, but it also has a wider impact on economy and the environment of the city as a whole.
Urban Economic Growth and the Informal EconomyAccess to services is an important determinant of urban eco-nomic productivity.114 Cities need to invest in housing, energy, water and sanitation, and transportation infrastructure in order to reap the benefits of agglomeration.115 Low investment in the built environment and core services runs the risk of limiting economic specialization and connectivity, driving up the cost of doing business for the formal and (especially) the informal sectors of the economy.116 Inadequate provision of these services means that businesses pay higher costs for treating water, man-aging waste, and using generators for their energy needs, which affects their productivity. The informal economy may actually be harder hit because it is characterized by smaller firms, which, some analysts argue, are more dependent on access to services.117 It is worth noting that in some African cities, households and small businesses lack access to electricity and water not because the service does not exist, but because the connections are too costly.118
Most economic theorists predicted that the informal economy would decline as countries developed and urbanized.119 This has not happened; on the contrary, the informal economy has persisted and it is growing.120 Although it is difficult to measure, the informal economy is estimated to account for about one-half to three-quarters of all non-agricultural employment opportu-nities in the Global South.121 In Africa, the informal economy is responsible for 50 to 80 percent of GDP.122 Informal employment typically refers to poor, irregular, and unprotected employment conditions without social protection contributions from an employer.123 Regionally, the informal economy provides an esti-mated 45 percent of non-agricultural jobs in the Middle East and North Africa, 51 percent in Latin America, 65 percent in East and Southeast Asia (excluding China), and 66 percent in sub-Saharan Africa.124
In most cities in the Global South, the majority of employment opportunities are in the informal economy. For example, in sub-Saharan countries, the informal economy is estimated to
account for 60 percent of urban employment and 93 percent of all new jobs created.125 It is particularly important to women’s employment. Outside the agriculture sector, the informal economy in sub-Saharan Africa employs 74 percent of women compared to 61 percent of men.126 And more women than men are self-employed, especially in sub-Saharan Africa where women operating their own, single-person firms comprise 60 percent of informal employment.127 This pattern of smaller, informal firms is common in African cities.128 Many of these jobs trap workers in poverty and provide little protection or security.129 On the other hand, analysts and activists argue that the informal economy provides an important source of income and employment for the urban poor, as well as producing important products that feed into the formal economy.
The urban poor and women are overrepresented in the urban informal economy. Generally, these workers have lower levels of education.130 Many informal businesses consist of individu-als or family units that operate in or near their homes. Others operate in public spaces; these workers in particular face threats of bribes, eviction, and confiscations. Furthermore, informal workers are considerably more vulnerable because their employ-ment and incomes are often irregular, they typically do not have physical protection from injury, and there is no system of social protection or compensation available to them.
While the informal economy is often associated with poverty, it is important to acknowledge its diversity.131 Some workers choose informal work because they can earn more than their counterparts working in low-skilled jobs in formal employ-ment.132 There are also examples of jobs in the informal economy that require significant levels of knowledge and skill, some of them displaying high productivity and dynamic growth. Over time, our understanding of the distinction between the formal and the informal economy has become more discerning.133 It is now more widely recognized that many workers have elements of both formal and informal economic activities as part of their livelihood strategy.134
The persistence of the informal economy creates a number of challenges from the perspective of struggling and emerging cities. First, much of the informal economy exists outside the formal tax system and thus does not generate tax revenue for the city’s budget.135 However, in practice, this issue is more com-plicated than it first appears. Many governments have started charging informal vendors for day licenses, permits, operating fees, and instituting other mechanisms of taxation. In other cases, informal economic activity generates less income than

24 |
the threshold required to pay income taxes or corporate taxes. Second, the lack of regulation means that environmental deg-radation, including health impacts and hazards resulting from production in the informal economy, are largely uncontrolled.
Despite these problems, cities need to think about how they can better support the informal economy given its size, persistence and growth. Contrary to common perception, informal and formal enterprises seldom operate in isolation from one anoth-er.136 Research shows that the informal sector generally thrives in cities with robust formal sectors.137 Some economists argue that if these trends continue, “the informal sector may need to be viewed not as a problem to be solved by ‘formalization’ but as a sector in need of support to enhance the productivity of the poorest members of society.”138 For now and the foreseeable future, the informal economy will remain a key factor in the economic wellbeing of the urban economy as a whole.139 The challenge for cities is to ensure that workers in the informal economy have access to affordable and reliable services that will support economic growth.
Gaps in Urban Service Provision Affect the Environment and Natural Resource Use Many recent high-profile studies of the impacts of urbanization on the environment have focused solely on the relationship between cities and climate change, documenting how energy consumption in cities contributes to the increase in greenhouse gas emissions and, in turn, how climate change poses signifi-cant risks for cities, particularly those located in coastal areas.140 Taking a more holistic view, we find that rapid urbanization, and the gaps in urban service provision that accompany it, result in broader ecosystem degradation, unsustainable rates of natural resource use, and serious impacts on human health.
Urbanization and the associated changes in land use have direct and indirect impacts on ecosystems, both within and around cities.141 If cities continue to expand outward in an unmanaged way, more prime agricultural land will be converted to urban use and many natural areas with biodiversity will be damaged or permanently lost.142 One recent study projects that, if current pat-terns of declining population density persist, urban land cover will increase by 1.2 million km2 by 2030.143 This would represent a near tripling of the global urban land area that existed in 2000, and loss of habitat in areas rich in biodiversity.144
Management of water is one of the most significant challenges facing rapidly growing, densely populated cities. Demand for water rises with both population growth and economic devel-opment, and unsustainable rates of water withdrawals, regional competition for water between cities and other users, and pollu-tion of groundwater sources are leading to critical levels of water stress in many cities. About 381 million people, or one-quarter of the residents in large cities with populations greater than 750,000, have water supplies that are under stress.145 Climate change will likely increase these levels of water stress as pre-cipitation patterns change.146 Water stress is also exacerbated by excessive groundwater extraction, which leads to saline intrusion in coastal cities such as Bangkok, Chennai, Jakarta, Kolkata, Manila, and Shanghai.147 Water losses due to aging and inefficient water supply systems worsen the problem. Across the megacities in the Global South, water line leakages amount to more than 30 percent of the “end of pipe” use.148
Inadequate or nonexistent sewerage and wastewater treatment systems lead to contamination of freshwater supplies, pollution of marine and terrestrial ecosystems, and a range of serious and potentially fatal diseases. More than 80 percent of all sewage and most of the industrial wastewater in developing countries is discharged untreated into rivers, lakes, or the ocean.149 Pollution from untreated sewage makes the near-surface groundwater beneath many cities undrinkable, as is the case in Delhi, Karachi, and Lahore.150 In Pakistan, for example, only 2 percent of surveyed cities with a population of more than 10,000 had wastewater treatment facilities,151 and a study of 118 cities in China found 97 percent of groundwater sources polluted.152 Urban sewage and industrial effluents are also major sources of nutrient loading, which causes eutrophication of marine and coastal ecosystems, the most prevalent water quality problem globally.153 Lower-income segments of the population that do not have access to, or cannot afford, water treatment methods disproportionately bear the disease burden of drinking polluted water.
Cities are highly concentrated centers of energy consumption, with profound consequences for the global atmosphere and local and regional air quality. Urban areas already account for almost three-quarters of global CO2 emissions from final energy use.154 Consumption of both fuel energy and electricity is growing rapidly: of the 19 megacities155 in the Global South, six had 10-year growth rates in electricity consumption greater than 100 percent,156 and transportation fuel use and electricity consumption grew more than three times faster than population

WORLD RESOURCES REPORT | October 2016 | 25
Towards a More Equal City: Framing the Challenges and Opportunities
growth in a significant number of cities.157 Transport emissions per capita in the Global South are lower than in high-income countries because of lower rates of motorization; however, approximately 90 percent of the increase in global transport-related CO2 emissions is expected to come from developing countries, under business-as-usual conditions.158 While increasing electricity consumption is positive for economic development, supply-side inefficiencies and line losses, as well as the high costs of grid construction, make it difficult for many cities to meet rising demand. Yet, the level of future global GHG emissions will depend significantly on how new urban infrastructure is designed and developed because about 30 percent of future CO2 emissions “committed” annually are attributable to new urban building and transport systems.159
The current trends and modalities of energy consumption and motorization are directly responsible for growing air pollution concerns in many cities of the Global South. In particular, fine particulate matter (PM10 and especially PM2.5 i.e., particulates less than 10 micrograms and 2.5 micrograms in size, respectively) is pervasive in many cities and is responsible for serious respiratory health disorders. The World Health Organization’s (WHO) urban air quality data show that 98 percent of cities in low- and middle-income countries with more than 100,000 inhabitants do not meet WHO air quality guidelines.160 Of these cities, 70 percent have annual average PM10 levels at least 2.5 times the WHO’s recommended level.161 Most cities in Africa, South Asia, and Southeast Asia covered in the WHO database have deteriorating air quality,162 with the health damage burden largely borne by the urban poor.163 In all, over 1.3 million premature deaths worldwide are estimated to result from urban outdoor air pollution.164
The challenge for struggling and emerging cities, therefore, is to provide access to water and sanitation, energy, and transportation services for all urban dwellers, while decreasing GHG emissions and other deleterious environmental impacts, reducing rates of resource consumption, and increasing efficiency in service delivery. In other words, these cities need to innovate in the way they provide services to a growing number of urban residents without replicating the model of energy and resource-intensive urban development followed by the Global North.165
VII. SCALING FROM CORE SERVICE SECTORS TO TRANSFORMATIVE URBAN CHANGE
Up until this point we have emphasized the importance of providing core services to create the more equal city. However, to create a more equal city while improving the economy and the environment for all will require a broader transformative process. Our experience suggests that when cities solve a sem-inal problem that touches many people’s lives, this momentum for positive change can initiate change in other areas creating a virtuous cycle. A seminal problem is one that is sufficiently large and complex that its negative effects are felt by large segments of the urban population.
The World Resources Report will examine the potential of solutions to seminal problems to trigger broader cross-sectoral, institutional, citywide transformation. Drawing on a series of in-depth, city-level case studies, the World Resources Report will examine how transformative urban change does or does not happen, addressing the following questions:
▸ Is there a discernible pattern to how transformative urban change unfolds in a city and how it is ultimately institutionalized?
▸ What are the roles of governance, finance, and capacity to plan and manage urban change over time?
▸ What actions can coalitions of urban change agents take to support transformative urban change?
▸ Why and how does transformative urban change stall or regress?
In this paper, we analyze two well-known but very different cities to illustrate what we mean by transformative urban change—Medellín, Colombia, and Surat, India. The stories of these cities illustrate how transformative urban change spans different sectors; involves governance, finance, and planning; and brings together coalitions of urban change agents. The World Resources Report will go further, and present multiple in-depth, city-level case studies based on primary field research. These case studies will inform our understanding of transformative urban change.
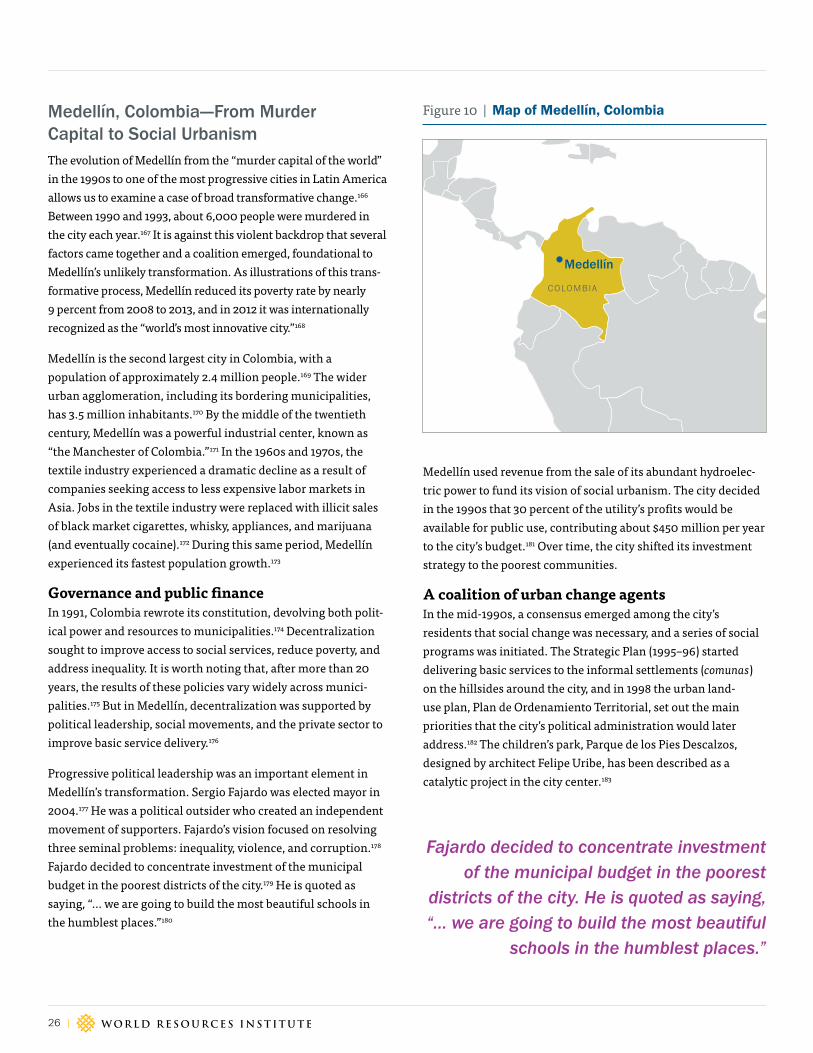
26 |
Medellín, Colombia—From Murder Capital to Social UrbanismThe evolution of Medellín from the “murder capital of the world” in the 1990s to one of the most progressive cities in Latin America allows us to examine a case of broad transformative change.166 Between 1990 and 1993, about 6,000 people were murdered in the city each year.167 It is against this violent backdrop that several factors came together and a coalition emerged, foundational to Medellín’s unlikely transformation. As illustrations of this trans-formative process, Medellín reduced its poverty rate by nearly 9 percent from 2008 to 2013, and in 2012 it was internationally recognized as the “world’s most innovative city.”168
Medellín is the second largest city in Colombia, with a population of approximately 2.4 million people.169 The wider urban agglomeration, including its bordering municipalities, has 3.5 million inhabitants.170 By the middle of the twentieth century, Medellín was a powerful industrial center, known as “the Manchester of Colombia.”171 In the 1960s and 1970s, the textile industry experienced a dramatic decline as a result of companies seeking access to less expensive labor markets in Asia. Jobs in the textile industry were replaced with illicit sales of black market cigarettes, whisky, appliances, and marijuana (and eventually cocaine).172 During this same period, Medellín experienced its fastest population growth.173
Governance and public finance In 1991, Colombia rewrote its constitution, devolving both polit-ical power and resources to municipalities.174 Decentralization sought to improve access to social services, reduce poverty, and address inequality. It is worth noting that, after more than 20 years, the results of these policies vary widely across munici-palities.175 But in Medellín, decentralization was supported by political leadership, social movements, and the private sector to improve basic service delivery.176
Progressive political leadership was an important element in Medellín’s transformation. Sergio Fajardo was elected mayor in 2004.177 He was a political outsider who created an independent movement of supporters. Fajardo’s vision focused on resolving three seminal problems: inequality, violence, and corruption.178 Fajardo decided to concentrate investment of the municipal budget in the poorest districts of the city.179 He is quoted as saying, “… we are going to build the most beautiful schools in the humblest places.”180
Medellín used revenue from the sale of its abundant hydroelec-tric power to fund its vision of social urbanism. The city decided in the 1990s that 30 percent of the utility’s profits would be available for public use, contributing about $450 million per year to the city’s budget.181 Over time, the city shifted its investment strategy to the poorest communities.
A coalition of urban change agentsIn the mid-1990s, a consensus emerged among the city’s residents that social change was necessary, and a series of social programs was initiated. The Strategic Plan (1995–96) started delivering basic services to the informal settlements (comunas) on the hillsides around the city, and in 1998 the urban land-use plan, Plan de Ordenamiento Territorial, set out the main priorities that the city’s political administration would later address.182 The children’s park, Parque de los Pies Descalzos, designed by architect Felipe Uribe, has been described as a catalytic project in the city center.183
Fajardo decided to concentrate investment of the municipal budget in the poorest
districts of the city. He is quoted as saying, “… we are going to build the most beautiful
schools in the humblest places.”
Medellín
C OLOMBIA
Figure 10 | Map of Medellín, Colombia

WORLD RESOURCES REPORT | October 2016 | 27
Towards a More Equal City: Framing the Challenges and Opportunities
Sergio Fajardo’s strategy of social urbanism committed resources to improve services in parts of the city where the Human Development Index (HDI) was the lowest, and the vision of social urbanism was expanded by the administration of Alonso Salazar Jaramillo (2008–11).184 Jaramillo expanded the construction of the cable car system to other low-income neighborhoods and continued the fight against corruption and the promotion of social equity.
The business community also supported the transformation in Medellín. For example, a group of entrepreneurs called Fundación Amor por Medellín bought a private school and donated it to the city.185 Other examples include a group of nine companies that contributed to the museum at Parque Explora, so admission could be free; the botanical garden received support from banks and private cultural organizations; and engineering firms designed public buildings pro bono.186
Transformative urban change across sectorsEffective local governance, public finance, and a progressive urban coalition combined with a series of such projects supported Medellín’s urban transformation. Below are a few examples of such projects.
To address the shortage of affordable housing, much of the informal housing in the comunas on the steep hillsides has been legalized.187 One of the first projects started under the vision of social urbanism was the metrocable, a gondola lift system of cable cars connecting the poorest, most densely populated hillside neighborhoods to the city, thereby linking residents outside formal economic networks to formal sector employment.188 While this project has been criticized for providing less than 10 percent of daily trips in the comunas, the aesthetic experience they afford has been cited as providing a sense of “inclusion and integration into a ‘modern’ city, helping to develop local pride and promote individual self-esteem.”189
As part of the vision of social urbanism, Medellín used a strategy of implementing large urban development projects (UDPs) in the poorest parts of the city.190 It was believed that the violence and
inequality that characterized Medellín were a result of the state’s abandonment of and disinvestment in marginalized districts, characterized by poverty and informal housing, the comunas.191 Many UDPs focused on physical planning solutions, such as schools, libraries, and parks. The size and aesthetic value of these projects were part of the strategy to contribute visually to the broader, virtuous cycle of urban transformation.192
Summary of transformative urban change in MedellínThe transformation of Medellín cuts across sectoral improve-ments in housing, transportation, and land use. The changes were supported by effective local governance and the redirec-tion of public financial resources to support a social urban-ism agenda. No single factor explains the transformation in Medellín—rather, there is an incomplete yet mutually rein-forcing effect of diverse factors. First, there was the untenable violence and inequality that plagued the city from the 1970s through the 1990s. Out of this crisis emerged a supportive policy environment and citywide commitment to social urbanism, which permeated elected officials, the business community, and civil society. Medellín’s city administration has maintained a consistent development strategy, even as administrations have changed over time.193 This underscores the importance of devel-oping a vision for a city that can be widely embraced. Medellín’s transformation is in part due to the fusion of social urbanism with physical projects and infrastructure improvements, enabled by capable governance and sufficient municipal finance.
Medellín’s transformation is in part due to the fusion of social
urbanism with physical projects and infrastructure improvements,
enabled by capable governance and sufficient municipal finance.

28 |
Surat, India—From Public Health Crisis to a Model of Urban CleanlinessIn 1994, the city of Surat, India experienced an outbreak of plague. The event triggered the country’s first large-scale urban sanitation and public health management program, and marked a turning point for municipal reforms in the city.194 Surat, one of India’s fastest growing cities, is the eighth largest city in the country with a population of almost 5 million.195 The port city has a strong economic base comprising diamond cutting and polishing industries (responsible for 42 percent of the world’s output), textiles, and other chemical, petrochemical, and natural gas-based industries.196 Because Surat has experienced faster economic growth than many other Indian cities in recent years, migrants constitute about 58 percent of its population.197
Surat is located on the banks of the Tapi River, which often floods during the rainy season, affecting settlements in its catchment areas. In 2005, the city was home to about 500,000 “slum” inhabitants, the majority of whom live alongside the Tapi River.198 Between 1990 and 2006, Surat witnessed four major floods, and the flood of 1994 resulted in a major plague outbreak.199 Three months of rainfall in the rainy season, subse-quent flooding and waterlogging, and the proliferation of solid waste in large parts of the city caused the epidemic. Households in informal settlements in low-lying areas faced the most serious impacts of both the flooding and the disease, because they lacked proper drainage.200 This crisis captured nationwide atten-tion and led to significant reforms in the city’s administration and health services.
Governance In the aftermath of the plague outbreak, under the leadership of then municipal commissioner, S.R. Rao, the Surat Municipal Corporation (SMC) implemented vigorous cleanup operations in the city, accompanied by significant governance reforms.201 Specific actions included efficient waste management and disposal, strengthening of disease surveillance systems, and increasing public awareness. Under S.R. Rao, access to sanitation rose from 63 percent to almost 97 percent, daily garbage collec-tion expanded to cover 98 percent of the city, and 75 percent of slums were paved.202 There was also near complete recovery of tax arrears. Rao’s 20 months in office left a legacy of civic pride and “citizen-politician-municipality cooperation” that is still visible in Surat.203
To respond to the crisis with speed and efficiency, the SMC implemented a more decentralized approach to governance and subdivided six administrative zones into 52 sanitary districts for waste collection.204 Accountability was transferred down to the ward level, and deliberate efforts were made to break down departmental silos and strengthen interagency coordination. Rao empowered the heads of all divisions with administrative and financial authority and ensured that SMC officers were in the field every day supervising cleanup operations. A daily mon-itoring system was established, with private contractors engaged to collect and dispose of the waste, and slum improvements were undertaken with the support of civil society groups.205 A system to redress grievances was set up to address citizen complaints promptly, and public health mapping with spatial documenta-tion of health data was initiated to foster preventive care and health management.206
Following the plague, the SMC began gathering data on the qual-ity of drinking water, leakage in water pipes, access to sanitation and drainage, and the occurrence of major diseases. It also set up a network of health surveillance centers, primarily in slums. These initiatives helped bring down the incidence of water-borne diseases in Surat by 50 percent between the mid-1990s and today.207 Other reforms related to financial management included an online property tax collection system that increased collection efficiency from 30 percent to over 80 percent, clearing many tax arrears.208 Besides structural changes—such as moving
Surat
INDIA
Figure 11 | Map of Surat, India
WORLD RESOURCES REPORT | October 2016 | 29
Towards a More Equal City: Framing the Challenges and Opportunities
from a hierarchical decision-making structure, the norm at the time, to a more decentralized structure—the SMC was the first municipal corporation in India to computerize all departments in 1998 and develop an information technology policy, making urban management more efficient.209
A coalition of urban change agentsWhile the role of the SMC and the leadership of municipal com-missioner S.R. Rao were significant, the private sector in Surat also played a key role in several urban development projects and provided disaster relief, partnering with the SMC and civil society organizations. The exodus of people fleeing the city to avoid the plague left many businesses without their workforce, and this led to significant support from businesses for the SMC’s efforts to clean up the city. The South Gujarat Chamber of Commerce and Industry, with about 70,000 businesses as members, was influential in city and state government deci-sions.210 This relationship of trust between the SMC and the city’s businesses also led to a strong revenue base for the city.
Transformative urban change across sectorsThe reforms implemented by the SMC after the plague clearly improved sanitation and solid waste management in the city, while also raising the capacity, reputation, and morale of the SMC. They have led to more efficient decision-making, greater private investment as the city’s physical appearance and governance improved, and a change in the attitudes of citizens, fostering greater citizen participation. These developments created a momentum for actions across multiple urban sectors, and spearheaded other progressive urban development initiatives, as discussed below.211
Given Surat’s high vulnerability to urban flooding and other risks such as sea level rise, higher seasonal monsoon precipitation, and associated public health concerns, the city has focused on climate adaptation and resilience planning since 2008.212 With the city’s chamber of commerce, the Rockefeller Foundation, and international consulting groups, a City Resilience Strategy was produced in 2011, the Surat Climate Change Trust was estab-lished, and three climate adaptation projects were implemented between 2013 and 2015.213 Resilience planning measures taken in the city include developing an improved early warning system for flood risks; mapping locations of flood risk; and regulating construction in floodplains; as well as improving wastewater and sanitation systems to reduce health risks from flooding, and improving health surveillance.214
In 2014, the city partnered with Microsoft to plan its transformation into a “smart city.” Initiatives under this partnership include enhancing already established e-governance solutions for property tax accounting and collection, citizen services, health tracking, managing water and sewerage systems, and a technology platform for police to respond to security and crime threats.215
Summary of transformative urban change in SuratIn Surat, the plague outbreak that resulted from the 1994 floods, and the major floods in 2006 that led to a leptospirosis outbreak, triggered unprecedented reforms in Surat’s administrative and fiscal policies. Strong leadership of vigorous city cleanup opera-tions enhanced the technical capacity of the local government. These changes have brought Surat to the forefront of urban man-agement in India, and the city is known for its state-of-the-art infrastructure.216 Institutional reforms favored more decentral-ized action for greater effectiveness, and partnerships with the private sector and civil society. The reforms also strengthened the revenue base, established disease surveillance systems, and catalyzed e-governance initiatives such as an early warning alert for flooding. The SMC has demonstrated commitment to citizen welfare at the highest levels, increasing community trust in the city’s leadership, and has promoted transparency. Surat is the only city in India to publish weekly data on budgeted and actual expenditures.217
Strong leadership of vigorous city cleanup operations enhanced the
technical capacity of the local government. These changes have
brought Surat to the forefront of urban management in India, and the
city is known for its state-of-the-art infrastructure.

30 |
VIII. LESSONS LEARNEDTransformative urban change happened in Medellín and Surat when several conditions were met. First, there was a strong commitment on the part of politicians, public and private sector actors, and engaged citizens—in other words, there was support from a broad coalition of urban change agents. Second, both cities had strong, visionary, and progressive local leadership and effective local governance, with high accountability. Third, the two cities also had access to sufficient financial resources to implement ambitious reforms—Medellín from its hydropower resources and Surat from a well-managed revenue base and con-tinued private sector investment in the city.218 And fourth, both cities were able to plan, manage, and sustain positive change over time. From our analysis of Medellín and Surat and other descriptions of transformative and sectoral change, we conclude that three key factors are involved in creating change: gover-nance, finance, and urban planning and management.
Figure 12 depicts our theory of transformative urban change. It starts with an issue that affects many people’s quality of life and serves as a trigger, around which a coalition of urban change agents from the public, private, and civil society sectors rally, act, and create momentum for solutions, thus bringing about a virtuous cycle of positive change across urban sectors, ultimately enhancing quality of life for a large number of residents.
GovernanceIn the context of the World Resources Report, urban governance refers to institutionalized relationships, norms, and rules that are used to shape, organize, and manage cities for the public good. Given this broad definition, urban governance extends beyond city government, mayors, and city councils to include civil society organizations and the public. Civil society organi-zations are particularly important in rapidly urbanizing areas where local governments are often weak, have limited capacity, and are severely under-resourced. In this context, non-state
Figure 12 | Virtuous cycle of transformative urban change
GOVERNAN
CE
FIN
ANCE
POSITIVESEMINAL CHANGE
PLANNING & MANAGEMENT E N A B L E R S
CROSS SECTORALSOLUTIONS
COALITION OF URBAN
CHANGE AGENTS
TRIGGER URBANTRANSFORMATION

WORLD RESOURCES REPORT | October 2016 | 31
Towards a More Equal City: Framing the Challenges and Opportunities
actors play a significant role in “governing without government.” In successful cases where change has been institutionalized over the long term, we find it is due to an effective partnership between civil society organizations and the government, as well as support from the private sector.219
Many urban observers associate the quality of urban governance with the way in which administrative and political decentral-ization policies are implemented.220 Many countries in the Global South were highly centralized until the 1990s, when decentralization policies were promoted.221 Administrative centralization meant that urban policies and development objectives were often determined by distant central govern-ments. Administrative decentralization was supposed to bring city government closer to the people, thus facilitating a better understanding of local contextual factors, and making munici-pal agencies more responsive to local residents.
For administrative decentralization to work, city governments must be able to coordinate complex bureaucratic functions and possess strong technical capacity. The reality is that many cities have overly complex bureaucracies, and large cities are often divided into competing political entities, spanning multiple geographic jurisdictions.222 In response to these challenges, the provision of infrastructure and core urban services often becomes the responsibility of special-purpose bodies. These bodies contribute to territorial and functional fragmentation, which in turn increases the difficulty of coordination among agencies.
Political decentralization is assumed to make municipal government more democratic and accountable.223 While many cities in the Global South have elected mayors, the quality of urban governance, politics, local democracy, and citizen participation varies greatly and is often inadequate.224 For example, in some cities, formal participatory processes are non-existent, and in others it is unclear how time-consuming participatory processes are tied to meaningful outcomes. While there is tremendous variation across geographic regions, many cities in Latin America started to improve their urban governance back in the 1980s and early 1990s. However, even in cities that are considered exemplary, like Bogotá, Colombia, there has been corruption and political setbacks.225
In theory, a democratic electoral process and well-designed public participation processes should protect governance from corruption and from powerful interest groups that exert undue political and economic influence over critical decisions affecting the public interest. Examples of powerful interest groups include multilateral corporations, construction companies, car drivers, and
the affluent classes in general.226 There is an extensive literature that critically examines the potential of urban politics and public participation to positively contribute to urban outcomes.227 A major weakness is vulnerability to elite capture because participants enter the process from unequal positions of power; they have uneven access to resources, and they have varying levels of knowledge of bureaucratic and political processes.228
Urban activists like Somsook Boonyabancha from Thailand, who has been working on behalf of the urban poor for years, argue in favor of expanded participatory spaces and new forms of participatory governance that allow for a horizontal (as opposed to hierarchical) distribution of power.229 In Boonyabancha’s experience, most successful city development models are made possible when mayors are open to broad participatory processes. In such cases, all city actors and institutions feel a common responsibility to manage the city together and make the best use of local resources, innovations, socio-cultural relationships, knowledge, and financial resources to develop the city for all residents.
FinanceThe World Resources Report defines finance to include all financial resources for cities, including both funding sources and finance obtained through instruments such as loans, bonds, and guarantees that provide capital or credit enhancement. These instruments allow cities to obtain upfront investment capital for large infrastruc-ture projects, for example. Funding includes non-reimbursable sources, such as fiscal transfers from national governments, taxes, fees/charges, and land sales and/or land value capture instruments, whereas finance requires repayment over time.
There is a strong positive correlation between municipal budgets per capita and service delivery, although financial resources are not the only factor. Cities in the Global South face particular constraints when it comes to raising revenue. They tend to have limited fiscal autonomy and a narrow resource base, and often depend on converting publicly owned agricultural or unused land to raise revenue. As Figure 9 illustrated, Global South cities with the largest populations have the lowest per capita budgets (the difference is especially pronounced in Africa, South Asia, and Latin America). National governments may be unable or unwilling to guarantee subnational borrowing and, as a result, municipal budgets are often highly dependent on resource trans-fers from state or central governments. This situation compli-cates accountability, and inhibits real devolution of decisions on public revenue and expenditure to the city level.
32 |
When city finances depend on transfers from higher levels of government, the problem of mismatched institutional accountability in the provision of urban services tends to arise. In Pakistan, for example, subnational levels of government collect only about 10 percent of total revenues, but account for 33 percent of public expenditures.230 The federal government collects 90 percent of total national revenues, of which 67 percent is spent at the federal level and the balance of 33 percent is transferred to subnational levels.231 An institutional conse-quence of these transfers is that urban service delivery organiza-tions report to higher levels of government (such as state water companies, federal power grids, national railway companies) and are often not accountable to the city government or the city-level beneficiaries of the urban services they are mandated to provide. This mismatch in institutional accountability sets the stage for a lack of demand focus, poor targeting of services for the under-served, graft, and corruption.
Fiscal decentralization has the potential to improve account-ability, transparency, and service delivery, but it is not a panacea. Greater fiscal autonomy must be accompanied by fiscal capac-ity. In many cities in the Global South there is disinclination to spend on the poor, and this leads to unspent allocations and a vicious cycle of less capacity, unresolved problems, and no political gains. In some cases, too much money is allocated to some sectors and not enough to others. To summarize, the fiscal challenges facing cities extend beyond lack of resources, and involve the willingness and ability to make more effective use of existing funds.
The provision of quality urban services is further undermined by “self-provisioning,” whereby urban communities provide for their own needs through private investment in urban services that are publicly unavailable or unreliable. In this way, service gaps in public goods are filled by costly market-based responses, but the partial solution imposes significant private costs on the individuals concerned and, often, social costs on the rest of the city. Self-provisioning erodes the incentive for public agencies to improve service delivery and undermines the political consensus for enhancing local accountability. The outcome is a negative feedback loop of citizen resistance to any municipal finance reforms that entail higher service fees or taxes.232
Planning and Management Planning and management refers broadly to a city’s capacity to coalesce around a vision; create a meaningful participatory process; and manage a mix of systems, skillsets, and knowledge that support effective management of the city.
Urban planning in the Global North has been redefined since the heyday of European town planning, rational comprehensive planning, and command and control style planning. These modes of planning emerged out of the Enlightenment era and built on lessons from neoclassical economics, engineering, and eventually systems analysis and policy science.233 A reading of planning history leads us to conclude that the best planning outcomes are concep-tualized by creative and visionary thinkers who are informed by participatory and deliberative processes. Such planning balances the economic, environmental, and equity concerns of city residents.
Planning and management capacity is often limited in cities of the Global South. The most rapidly growing cities are dealing with a deficit in infrastructure and services and a lack of capacity to keep up with growth and the increasing needs and priorities of citizens. Furthermore, many funding and other incentive pro-grams available from national governments stipulate conditions, for example, cities must demonstrate performance or create inte-grated plans in coordination with other agencies. Cities that lack planning and management capacity are unable to take advan-tage of these national incentives, they fall further below peer cities in terms of receiving funding or private investment, which, in a vicious cycle, further exacerbates their limited capacities.
Planning and management capacity are crucial to dealing with growing urban pollution, water and sanitation problems, conges-tion, and increasing inequality in access to urban services in many cities. Many of these problems are caused when private consump-tion is put before public welfare. In many countries in the Global South, relatively weak urban institutions do not have the capacity or incentive to identify a generalizable set of community prefer-ences for environmental, social, and economic outcomes. Urban planning and management require real technical capacity at the local level to analyze, assess, and implement “interventions that close the gap between the private and social calculus” such that cities can regulate and enforce policies and planning instruments that limit these problems.234 Very often, the urban planner does not have either the institutional mandate or the professional expertise to reconcile these diverse interests.235 In other contexts, urban decision-makers are focused on individual projects and, as a result, decisions are not coordinated as part of a vision and a plan that improves the city for all residents.
WORLD RESOURCES REPORT | October 2016 | 33
Towards a More Equal City: Framing the Challenges and Opportunities
IX. MAKING MORE EQUAL CITIES A REALITY
Urbanization is occurring in many countries where urban pop-ulation growth is outpacing economic growth, and the share of poor people living in urban areas is increasing globally. Many cities do not have the financial resources or the capacity to meet the service needs of their growing urban populations. Struggling and emerging cities are at a crossroads. They are under tremen-dous pressure to meet urgent needs while avoiding decisions that lead to unsustainable patterns of urban development.
In this context, the World Resources Report examines whether a more equal city is a viable entry point for achieving greater economic prosperity and environmental sustainability for the city as a whole. The priority areas for cities relate to land use, housing, water and sanitation, energy, and transportation. Our forthcoming papers will focus on how to implement actionable approaches in each of these areas (see Appendix).
Finding solutions to these priority sectoral problems is not enough. There are a few examples of cities that, against unlikely odds, have successfully addressed a seminal problem, triggering a broader virtuous cycle of urban transformation. Inspired by these examples, a series of in-depth, city-level case studies will analyze how transformative urban change happens.
Each paper will also examine governance, finance, and the capacity to plan and manage urban change over time. Some of the most powerful examples of positive change come from a coalition of urban change agents working to provide public goods and services. Public and private investment is needed to build infrastructure and deliver services as well as support the capacity of city governments. Effective planning and management are needed to envision, implement, and enforce plans that shape a more equal city.
Many cities do not have the financial resources or the capacity to meet the service needs of their growing urban populations. Struggling and
emerging cities are at a crossroads. They are under tremendous pressure to meet urgent needs while avoiding decisions that lead to unsustainable
patterns of urban development.
There is no better time to implement practical and scalable actions to make cities more equal. As described in this paper, the stakes are high and we need a better understanding of how to enable broader, more ambitious, citywide transformation. Three key international agreements present the opportunity for the global community to implement an agenda focused on sustainable cities—where all citizens have access to urban services. The 17 Sustainable Development Goals adopted by all UN member states set the 2030 agenda for sustainable development. The UNFCCC Paris Agreement on climate change has consensus from 195 countries to limit global warming by implementing actions related to climate change mitigation, adaptation, and finance starting in the year 2020. Finally, the New Urban Agenda, the outcome of the Habitat III conference in Quito, Ecuador, outlines a vision for cities for the next 20 years. While these global agreements are ambitious and promising, we are asking a great deal from cities, many of which have extremely limited resources and capacity. The World Resources Report provides knowledge about actionable approaches that makes urban transformation towards a more equal city possible.
34 |
APPENDIX: A PARTIAL LIST OF FORTHCOMING WRR RESEARCH PAPERS
PRIORITY AREA CHALLENGE KEY QUESTIONS
Managing Urban Expansion
Although compact development has benefits,236 the over-concentration and the lack of affordable housing remain a challenge in dense cities of the developing world. In addition, unplanned urban expansion into greenfield areas limits the capacity of regional agriculture and food production systems to sustain growing urban populations
What role does the political economy of urban land markets play in causing excessive, unplanned urban expansion in many cities?
How might cities plan land use, reform density regulations, and regulate land markets to limit urban expansion and to ensure that new urban development is properly planned and serviced?
How can municipalities capture the value of land within the city for public good?
How can private actors be encouraged to invest in energy-efficient and compact development?
How can municipalities in growing metropolitan regions improve coordination across sectors and jurisdictions for more effective governance?
Secure and Affordable Housing Within the City
In many cities, a shortage of affordable housing and an oversupply of high-end housing has led to sprawling development, inappropriate housing density, and unplanned communities that are not integrated into transportation and economic networks. Informal settlements proliferate to provide affordable housing, albeit of low quality
What is the availability of affordable housing in well-serviced central locations?
Under what conditions has in situ upgrading been successful, and why has it fallen short in other cases?
How have cities used rental housing to address the lack of affordable housing in city centers?
What changes can incentivize better use of underutilized land to shape and respond to local market dynamics and facilitate affordable housing supply in well-serviced locations?
Managing Water Risks and Water Distribution in Cities
Urban watersheds are threatened by the expanding urban footprint, human activity, industrial and commercial processes, and climate change—which will affect both water supply and demand. Many regions have weak environmental regulations and limited capacities to monitor and enforce regulations,237 causing urban water sources to become increasingly polluted. Coordination is weak among agencies responsible for maintaining water sources and distributing water
To address watershed risk:What regional trends might increase water risks for growing cities?What are the social and economic implications of these regional
trends? What solutions are available to cities to apply outside of their
jurisdictions to reduce the likelihood and consequences of risks to their water security?
To address water distribution and household access to affordable potable water in cities: What are the innovative institutional and governance approaches
to urban water stress? What are the alternative approaches for treating and delivering
affordable and reliable potable water cost-effectively?

WORLD RESOURCES REPORT | October 2016 | 35
Towards a More Equal City: Framing the Challenges and Opportunities
PRIORITY AREA CHALLENGE KEY QUESTIONS
Access to Clean, Affordable, and Reliable Energy
In rapidly urbanizing countries, the poor consume relatively little energy per capita, but their sources of energy are often the least environmentally sustainable.238 Cities will need to consider the increased demand that those who are under-served by energy today will place on future urban energy systems, and how their urban energy systems can be designed to serve the poor effectively and contribute to their economic productivity
What approaches will have the greatest impact on the under-served in terms of energy access, reliability, cost, and health?
How can cities simultaneously enhance energy services to the under-served, while ensuring that the city becomes more productive and reduces its overall GHG emissions?
What approaches exist to shift urban populations in low-income and sub-Saharan cities away from solid cooking fuels?
How can energy efficiency help the under-served? Where do policies need alignment between cities and national
governments? What innovative financial instruments can mobilize investment to
deliver energy services?
Sustainable Transportation Systems Improving Accessibility for All
There have been advances in sustainable mobility worldwide, but positive trends have been overwhelmed by motorization and its negative impacts. Most vehicle growth is happening in the Global South, creating congestion, increasing air pollution, and reducing physical activity. These negative impacts result in unequal access to urban opportunities and disproportionally affect the poor
What are key policy levers and how can they support social, economic, and environmental sustainability?
How can cities encourage policies that favor a new urban mobility agenda?
What is the way forward regarding finance, institutions, and technology to enable this new agenda?
APPENDIX: A PARTIAL LIST OF FORTHCOMING WRR RESEARCH PAPERS (CONTINUED)
36 |
REFERENCESAbers, Rebecca N. 2000. Inventing Local Democracy: Grassroots Politics in Brazil. Lynne Rienner Publishing.
Accra Metropolitan Assembly. 2012. “The Composite Budget of the Accra Metropolitan Assembly.” Republic of Ghana. http://www.mofep.gov.gh/sites/default/files/budget/AMA.pdf.
ACHR (Asian Coalition for Housing Rights). 2014. “Housing by People in Asia.” Newsletter of the Asian Coalition for Housing Rights 19: 1–5. Special Issue on How Poor People Set their Own Poverty Lines. http://www.achr.net/upload/downloads/file_16102014142111.pdf.
ADB (Asian Development Bank). 2012. “Inclusive and Sustainable Transport.” http://visual.ly/inclusive-and-sustainable-transport.
AfDB (African Development Bank). 2012. “Joint Statement by the Multilateral Development Banks on Sustainable Transport and Climate Change.” http://www.afdb.org/fileadmin/uploads/afdb/Documents/Generic-Documents/MDB_Joint_Statement_on_Sustainable_Transport_and_Climate_Change_for_the_UNFCC_COP21.pdf.
AfDB, OECD Development Centre, and UNDP. 2016. “African Economic Outlook 2016.” In Special Theme: Sustainable Cities and Structural Transformation 389. Abidjan, Cote d’Ivoire: African Development Bank; Paris, France: Organisation for Economic Co-operation and Development, New York, NY: United Nations Development Programme.
Ahluwalia, Isher Judge, Ravi Kanbur, and P.K. Mohanty. 2014. Urbanisation in India: Challenges, Opportunities and the Way Forward. New Delhi: Sage.
Ahmed, Qureshi Intikhab, Huapu Lu, and Shi Ye. 2007. “Urban Transportation and Equity: A Case Study of Beijing and Karachi.” Transportation Research Part A 42: 125–139.
Ahmedabad Municipal Corporation. 2015. “Budget 2014–15.” http://ahmedabadcity.gov.in/portal/jsp/Static_pages/amc_budget.jsp.
Alcadía Mayor de Bogotá D.C. 2015. “Informes de Ejecución Presupuestal.” http://www.shd.gov.co/shd/informes-presupuestales.
Anadkat, Vijay, and Amit Bhatt. 2013. “Bus Rapid Transit: Paradigm Shift in Indian Urban Mass Transport System.” Shelter 14(2).
Anguelovski, Isabelle, Eric Chu, and JoAnn Carmin. 2014. “Variations in Approaches to Urban Climate Adaptation: Experiences and Experimentation from the Global South.” Global Environmental Change 27: 156–167.
BBMP (Bruhat Bengaluru Mahanagara Palike). 2015. “Financial Position.” http://bbmp.gov.in/documents/10180/433958/Financial+Position_2015-16.pdf/b213e8cf-303d-464f-ad67-2966160adbe8.
Beard, Victoria A., and Carolina S. Sarmiento. 2014. “Planning, Public Participation, and Money Politics in Santa Ana (CA).” Journal of the American Planning Association. 80(2): 168–181.
Beard, Victoria A., Faranak Miraftab and Christopher Silver (eds.) 2008. Planning and Decentralization: Contested Spaces for Public Action in the Global South. London: Taylor and Francis.
Benjamin, Nancy, Katherine Beegle, Francesca Recanatini and Massimiliano Santini. “Informal Economy and the World Bank.” Policy Research Working Paper 6888. Economic Policy and Debt Department, Poverty Reduction and Economic Management Network, World Bank. May 2014.
Bhat, G.K., Anup Karanth, Lalit Dashora, and Umamaheshwaran Rajasekar. 2013. “Addressing Flooding in the City of Surat Beyond its Boundaries.” Environment and Urbanization 25(2): 249–441.
Biello, David. 2011. “Human Population Reaches 7 Billion—How Did This Happen and Can It Go On?” Scientific American Sustainability Blog, October 28, 2011. http://www.scientificamerican.com/article/human-population-reaches-seven-billion/.
Blair, Harry. 2000. “Participation and Accountability at the Periphery: Democratic Local Governance in Six Countries.” World Development 28: 21–39.
Boonyabancha, Somsook. 2016a. “Inclusive and Sustainable City Development: Community-led, Citywide Slum Upgrading and Housing Development.” Presented at the World Resources Institute. March 30, 2016, Washington, DC.
Boonyabancha, Somsook. 2016b. Personal communication between author and Somsook Boonyabancha.
Brand, Peter, and Julio D. Dávila. 2011. “Mobility Innovation at the Urban Margins: Medellín’s Metrocables.” City 15(1): 647–661.
British Geological Survey and WaterAID. 2008. “Groundwater Information Sheet: The Impact of Urbanisation.” London, UK and New York, NY.
Budget Office of the County Government of Mombasa. 2014. “Mombasa County Annual Development Plan 2015–2016 Financial Year.” Republic of Kenya. http://www.mombasa.go.ke/downloads/Mombasa%20County%2015-16%20ADP.pdf.
Budget Office of the County Government of Mombasa. 2015. “Fiscal Strategy Paper of the County Government of Mombasa: Enhancing Economic Transformation for Shared Prosperity in Mombasa County.” Republic of Kenya. http://www.mombasa.go.ke/downloads/Msa%20County%2015-16%20Fiscal%20Strategy%20Paper.pdf.
budgiT. 2016. “Lagos Data.” http://yourbudgit.com/data/lagos/.
Câmara Municipal de Belo Horizonte. 2015. “Estima a Receita e Fixa a Despesa do Município para o Exercício Financeiro de 2015.” http://cmbhsilin-ternet.cmbh.mg.gov.br:8080/silinternet/consultaNormas/detalheNorma.do?id=2c907f7649f63e42014abb0a77c90417&metodo=detalhar.
Câmara Municipal de São Paulo. 2014. “Projeto de Lei 01-00467/2014 do Executivo.” http://cmspbdoc.inf.br/iah/fulltext/projeto/PL0467-2014.pdf.
Câmara Municipal do Rio de Janeiro. 2015. “Legislação e Atividade Parlamentar.” http://www.camara.rj.gov.br/controle_atividade_parlamentar.php?m1= legislacao&m2=orc_municipal&m3=conceito&url=http://mail.camara.rj.gov.br/ APL/Legislativos/contlei.nsf/7cb7d306c2b748cb0325796000610ad8/ 20000da5023f44e183257dac0069f819?OpenDocument.
Castells-Quintana, David. 2016. “Malthus Living in a Slum: Urban Concentration, Infrastructure and Economic Growth.” Journal of Urban Economics 01(04): 1–16.
Census of India. 2011. “Cities Having Population 1 Lakh and Above, Census 2011.” http://censusindia.gov.in/2011-prov-results/paper2/data_files/India2/Table_2_PR_Cities_1Lakh_and_Above.pdf.
Chafe, Zoë A., Michael Brauer, Zbigniew Klimont, Rita Van Dingenen, Sumi Mehta, Shilpa Rao, Keywan Riahi, Frank Dentener, and Kirk R. Smith. 2014. “Household Cooking with Solid Fuels Contributes to Ambient PM
2.5 Air Pollution and the Burden of Disease.” Environmental Health Perspectives 122(12): 1314–1320.
Chatterjee, Urmila, Rinku Murgai, Ambar Narayan and Martin Rama. 2016. “Pathways to reducing poverty and sharing prosperity in India: Lessons from the last two decades.” Washington, DC: World Bank Group. http://documents.worldbank.org/curated/en/559851468910056173/pdf/106902-REPLACEMENT-WP-P148942-change-to-PUBLIC.pdf
Chen, Martha Alter. 2007. “Rethinking the Informal Economy: Linkages with the Formal Economy and the Formal Regulatory Environment.” New York, NY: United Nations Department of Economic and Social Affairs. http://www.un.org/esa/desa/papers/2007/wp46_2007.pdf.

WORLD RESOURCES REPORT | October 2016 | 37
Towards a More Equal City: Framing the Challenges and Opportunities
Chen, Martha Alter. 2012. “The Informal Economy: Definitions, Theories and Policies.” Working Paper 1. Women in Informal Employment: Globalizing and Organizing (WIEGO) Working Papers. WEIGO: Cambridge, MA: WEIGO. http://wiego.org/sites/wiego.org/files/publications/files/Chen_WIEGO_WP1.pdf.
Chuhan-Pole, Punam, Cesar Calderon, Gerard Kambou, Sebastien Boreux, Mapi M. Buitano, Vijdan Korman, Megumi Kubota, Rafael M. Lopez-Monti, Somik V. Lall, and Paul Brenton. 2016. “Africa’s Pulse: An Analysis of Issues Shaping Africa’s Economic Future.” Washington, DC: World Bank Group.
Cities Alliance. 2015. “Sustainable Development Goals and Habitat III: Opportunities for a Successful New Urban Agenda.” In Cities Alliance Discussion Paper — N° 3. Brussels: Cities Alliance. http://www.citiesalliance.org/sites/citiesalliance.org/files/Opportunities%20for%20the%20New%20Urban%20Agenda.pdf.
City of Johannesburg. 2015. “Medium Term Budget 2015/16–2017/18.” http://joburg.org.za/images/stories/2015/June/2015-16%20BUDGET%20BOOK.pdf.
City of New York. 2014. “Current and Projected Populations.” http://www1.nyc.gov/site/planning/data-maps/nyc-population/current-future-populations.page.
City of Porto Alegre. 2014. "Estima a Receita e Fixa a Despesa do Município de Porto Alegre para o Exercício Econômico-Financeiro de 2015."http://dopaonlineu-pload.procempa.com.br/dopaonlineupload/1303_ce_114152_1.pdf.
City of Yokohama. 2015. “Statistical Look at Yokohama.” http://www.city.yokohama.lg.jp/ex/stat/index-e.html.
Civico, Aldo. 2012. “We are Illegal, but Not Illegitimate. Modes of Policing in Medellín, Colombia.” Political and Legal Anthropology Review 35(1): 77–93.
Dasgupta, Aniruddha, and Victoria A. Beard. 2007. “Community Driven Development, Collective Action and Elite Capture in Indonesia.” Development & Change 38(2): 229–249.
Datt, Gaurav, Martin Ravallion, and Rinku Murgai. 2016. “Growth, Urbanization and Poverty Reduction in India.” Working paper 21983. Cambridge, MA: National Bureau of Economic Research. February. http://www.nber.org/papers/w21983.
DANE (Departamento Administrativo Nacional de Estadística). 2016. “Demografía y Población—Proyecciones de Población.” Bogotá D.C., Colombia. http://www.dane.gov.co/index.php/poblacion-y-demografia/proyecciones-de-poblacion.
Department of Census and Statistics, Government of Sri Lanka. 2012. “Population and Housing.” http://www.statistics.gov.lk/page.asp?page=Population%20and%20Housing.
Drabo, Alassane. 2013. “Intra-Country Health Inequalities and Air Pollution in Developing Countries.” Oxford Development Studies 41(4): 455–475.
Elmqvist, Thomas, Michail Fragkias, Julie Goodness, Burak Güneralp, Peter J. Marcotullio, Robert I. McDonald, Susan Parnell, Maria Schewenius, Marte Sendstad, Karen C. Seto, and Cathy Wilkinson (eds.). 2013. Urbanization, Biodiversity and Ecosystem Services: Challenges and Opportunities: A Global Assessment. Dordrecht, Heidelberg, New York, London: Springer. doi:10.1007/978-94-007-7088-1.
Enda Tiers Monde. n.d. “Cleanliness Campaign in Surat : A Case Study on Administrative Initiatives.” http://www.globenet.org/preceup/angl/docs_angl/Surat.rtf
Erickson, Peter, and Kevin Tempest. 2015. “Keeping Cities Green: Avoiding Carbon Lock-In due to Urban Development.” Seattle, WA: Stockholm Environmental Institute.
eThekwini Municipality. 2012. “eThekwini’s Economy—Fast Facts.” http://www.durban.gov.za/Resource_Centre/edge/Documents/Edge%20Fast%20Facts%20Issue%204%202012.pdf.
eThekwini Municipality. 2015. “Adjustments Budget 2014/2015.” http://www.durban.gov.za/Resource_Centre/reports/Budget/Documents/eThekwini%20Municipality%20Final%20Adjustment%20Budget%202014_2015.pdf.
Farvacque-Vitkovic, Catherine, and Mihaly Kopanyi. 2013. Municipal Finances: A Handbook for Local Governments [in English]. Washington, DC: The World Bank.
Ferrão, Paulo, and John E. Fernández. 2013. Sustainable Urban Metabolism. Cambridge, MA: MIT Press.
Finnegan, William. 2002. “Leasing the Rain.” The New Yorker, April 8. http://www.newyorker.com/magazine/2002/04/08/leasing-the-rain.
Foltyn, Simona. 2016. “Ethiopia: Oromo Protests Continue amid Harsh Crackdown.” Al Jazeera, March 24. http://www.aljazeera.com/indepth/features/2016/03/ethiopia-oromo-protests-continue-harsh-crack-down-160321082451685.html.
Friedmann, John. 1987. Planning in the Public Domain: From Knowledge to Action. Princeton, NJ: Princeton University Press.
GENUS (Global Energy Network for Urban Settlements). 2011. “Development Accounts Projects: Promoting Energy Access for the Urban Poor Worldwide.” New York, NY: UN Habitat. http://www.un.org/esa/devaccount/projects/2008/0809S.html.
Ghana Statistical Service. 2014. “2010 Population and Housing Census: Direct Analytical Report, Accra Metropolitan.” http://www.statsghana.gov.gh/docfiles/2010_District_Report/Greater%20Accra/AMA.pdf.
Ghani, Ejaz, and Ravi Kanbur. 2013. “Urbanization and (In)Formalization.” Policy Research Working Paper 6374. Washington, DC: The World Bank. https://a1papers.ssrn.com/sol3/papers.cfm?abstract_id=2225710.
Gilbert, Alan. 2015. “Urban Governance in the South: How did Bogota Lose its Shine?” Urban Studies 4: 665.
Glaeser, Edward L. 2014. “A World of Cities: The Causes and Consequences of Urbanization in Poorer Countries.” Journal of the European Economic Association 12(5): 1154–1199.
Global Commission on the Economy and Climate. 2014. “Better Growth, Better Climate: The New Climate Economy Report.” Washington, DC: Global Commission on the Economy and Climate. http://newclimateeconomy.report/2014/ .
Godfrey, Nick, and Roger Savage. 2012. “Future Proofing Cities: Risks and Opportunities for Inclusive Urban Growth in Developing Countries.” Epsom, UK: Atkins. http://futureproofingcities.com/downloads/FPC_Report_LowRes.pdf?dl=1.
Grübler, Arnulf, and David Fisk. 2013. Energizing Sustainable Cities: Assessing Urban Energy. Abingdon, UK, New York, NY: Routledge.
Gwilliam, Ken. 2002. “Cities on the Move: A World Bank Urban Transport Strategy Review.” http://siteresources.worldbank.org/INTURBANTRANSPORT/Resources/cities_on_the_move.pdf.
Harris, John R., and Michael P. Todaro. 1970. “Migration, Unemployment and Development: A Two-Sector Analysis.” American Economic Review 60(1): 126–142.
Hook, Walter. 2005. “Urban Transport and the Millennium Development Goals.” http://siteresources.worldbank.org/INTTSR/Resources/Hook_MDG_and_Transport_Article_final_nov05_no_pictures.pdf.
Hoornweg, Daniel, and Mila Freire. 2013. “Building Sustainability in an Urbanizing World.” In Urban Development Series, edited by Daniel Hoornweg, Mila Freire, Julianne Baker-Gallegos, and Artessa Saldivar-Sali. Washington, DC: World Bank. http://www.ires.nus.edu.sg/davoslist/63-1.pdf.
IBGE (Instituto Brasileiro de Geografia e Estatística). 2015. http://www.ibge.gov.br/.
IEA (International Energy Agency), and World Bank. 2013. “Global Tracking Framework.” In Sustainable Energy For All (SE4All): 289. http://trackingenerg-y4all.worldbank.org/~/media/GIAWB/GTF/Documents/GTF-2013-Full-Report.pdf.
38 |
ILO (International Labour Organization). 2016. “Informal Economy.” http://www.ilo.org/global/topics/employment-promotion/informal-economy/lang--en/index.htm.
ICRIER (Indian Council for Research on International Economic Relations) & WRI (World Resources Institute). 2016. “The Role of Full Cost Pricing in Designing Smart City Services.” Background paper, forthcoming.
INCEP (India New Climate Economy Partnership). 2016. “Better Cities, Better Climate: The Scale, Pace and Costs of India’s Urbanisation in the Post-Reform Period. What are the Lessons for India’s Urban Transition?” Synthesis report, Conference Draft for Consultation, July 2016.
INEGI (Instituto Nacional de Estadística y Geografía). 2010. “Censo de Población y Vivienda 2010.” http://www.inegi.org.mx/est/contenidos/proyectos/ccpv/cpv2010/default.aspx.
J-PAL. 2012. “J-PAL Urban Services Review Paper.” Cambridge, MA: Abdul Latif Jameel Poverty Action Lab.
Jagannathan, N. Vijay. 1987. Informal Markets in Developing Countries. New York, NY: Oxford University Press.
Janaagraha Centre for Citizenship and Democracy. 2014. “Annual Survey of India’s City-Systems 2014: Shaping India’s Urban Agenda.”
Jariwala, Priyanka, Sathish Selvakumar, Anuj Ghanekar, and Vikas Desai. 2015. “Transformation of Health Systems and Governance: Case of Surat City, Gujarat.” Paper presented at the Tenth Annual International Conference on Public Policy and Management. August 3–5, 2015, Bangalore, India.
Jerico, João Pedro, François P. Landes, Matteo Marsili, Isaac Pérez Castillo, and Valerio Volpati. 2016. “When Does Inequality Freeze an Economy?” http://arxiv.org/abs/1602.07300.
Johnson, Michael P. 2001. “Environmental Impacts of Urban Sprawl: A Survey of the Literature and Proposed Research Agenda.” Environment and Planning A 22: 717–735.
Jütting, Johannes, and Juan R. de Laiglesia (eds.). 2009. Is Informal Normal? Towards More and Better Jobs in Developing Countries. Development Centre Studies. Paris, France: Organisation for Economic Co-operation and Development.
K, Meera. 2014. “Should Bengalureans be Grateful for BWSSB’s Water Rates?” http://bangalore.citizenmatters.in/articles/should-bengalureans-be-grateful-for-bwssb-s-water-rates.
Kennedy, Christopher A., Iain Stewart, Angelo Facchini, Igor Cersosimo, Renata Mele, Chen Bin, Mariko Uda, Arun Kansal, Anthony Chiu, Kim Kwi-gon, Carolina Dubeux, Emilio Lebre La Rovere, Bruno Cunha, Stephanie Pincetl, James Keirstead, Sabine Barles, Semerdanta Pusaka, Juniati Gunawan, Michael Adegbile, and Mehrdad Nazariha. 2015. “Energy and Material Flows of Megacities.” Proceedings of the National Academy of Sciences of the United States of America 112(19): 5985–5990.
Kessides, Christine. 2006. “The Urban Transition in Sub-Saharan Africa: Implications for Growth and Poverty Reduction.” Washington, DC: Cities Alliance: 1–113. https://www.citiesalliance.org/sites/citiesalliance.org/files/CA_Docs/resources/paper-pres/ssa/eng/ssa_english_full.pdf.
Leather, James, Herbert Fabian, Sudhir Gota, and Alvin Mejia. 2011. “Walkability and Pedestrian Facilities in Asian Cities: State and Issues.” In ADB Sustainable Development Working Paper Series.
Lei, Y., Q. Zhang, K.B. He, and D.G. Streets. 2011. “Primary Anthropogenic Aerosol Emission Trends for China, 1990–2005.” Atmospheric Chemistry & Physics 11(3): 931–954.
Leonard, Annie. 2010. The Story of Stuff: The Impact of Overconsumption on the Planet, Our Communities and Our Health—and How We Can Make It Better. New York, NY: Free Press.
Mahendra, Anjali. 2014. “Universal Access to Affordable Housing, Social Services, and Public Utilities: Water and Sanitation, Transport, Energy and Waste Management.” Final Issues Paper: 101–133. Washington, DC: World Resources Institute.
Mani, Muthukumara, Anil Markandya, Aarsi Sagar, and Elena Strukova. 2012. An Analysis of Physical and Monetary Losses of Environmental Health and Natural Resources in India. Policy Research Working Papers. Washington, DC: World Bank. doi:10.1596/1813-9450-6219.
Mansuri, Ghazala, and Vijayendra Rao. 2012. Localizing Development: Does Participation Work? Washington, DC: The World Bank.
McDonald, Robert I. 2015. Conservation for Cities: How to Plan and Build Natural Infrastructure. Washington, DC: Island Press.
McDonald, Robert I., Katherine Weber, Julie Padowski, Martina Flörke, Christof Schneider, Pamela A. Green, Thomas Gleeson, Stephanie Eckman, Bernhard Lehner, Deborah Balk, Timothy Boucher, Günther Grill, and Mark Montgomery. 2014. “Water on an Urban Planet: Urbanization and the Reach of Urban Water Infrastructure.” Global Environmental Change 27: 96–105.
McGuirk, Justin. 2014. Radical Cities: Across Latin America in Search of a New Architecture. London, UK: Verso.
Messner, Dirk. 2015. “A Social Contract for Low Carbon and Sustainable Development: Reflections on Non-Linear Dynamics of Social Realignments and Technological Innovations in Transformational Processes.” Technology Forecasting and Social Change 98: 260–270.
Millennium Ecosystem Assessment. 2003. “Ecosystems and their Services.” In Ecosystems and Human Well-Being. Washington, DC: Island Press: 49–70.
Mitlin, Diana. 2016a. “Assessing Urban Poverty: Why Urban Poverty is Under-Estimated and Hence Global Poverty Successes Exaggerated.” Presented at the Workshop on Urban Poverty in Developing Countries. May 19–20, Duke University, Durham, NC.
Mitlin, Diana. 2016b. Personal communication between author and Diana Mitlin in reference to Slum Dweller International’s work in India to institutionalize change in Pune, and now emerging in Bhubaneshwar.
Mitlin, Diana, and David Satterthwaite. 2013. Urban Poverty in the Global South: Scale and Nature. New York, NY: Routledge.
Municipal Corporation of Greater Mumbai. 2015. “Budget Estimates A, B & G, 2015–2016.” http://www.mcgm.gov.in/irj/go/km/docs/documents/MCGM%20Department%20List/Chief%20Accountant%20(Finance)/Budget/Budget%20Estimate%202015-2016/1.M.C’s%20Speech/English%20Speech%20Budget%20A,B,G.pdf.
Municipio de Medellín. 2015. “Gaceta Oficial.” https://www.medellin.gov.co/irj/go/km/docs/pccdesign/SubportaldelCiudadano_2/PlandeDesarrollo_0_9/IndicadoresyEstadsticas/Shared%20Content/Presupuesto/2015/2015-Decreto%202150%20de%202014%20Gaceta%204270.pdf.
Muzammil, A.J.M. 2015. Mayor of Colombo Municipal Council—Budget 2016: 19. Colombo, Sri Lanka: Colombo Municipal Council.
Nairobi City County. 2014. “Nairobi County Integrated Development Plan 2014.” http://cog.go.ke/images/stories/CIDPs/Nairobi.pdf.
Nairobi City County. 2015. “Recurrent and Development Estimates for the FY 2015/2016 and Projections for FYs 2016/2017–2017/2018.” http://nairobi.go.ke/assets/Documents/BUDGET-FOR-FY-2015-2016.pdf.
National Bureau of Statistics China. “National Data.” http://data.stats.gov.cn/english/.
National Population Commission. 2016. “State Population.” Abuja, Nigeria: Government of Nigeria. http://www.population.gov.ng/index.php/state-population.

WORLD RESOURCES REPORT | October 2016 | 39
Towards a More Equal City: Framing the Challenges and Opportunities
New Climate Economy. 2015. “Better Growth Better Climate and Seizing the Global Opportuntity.” The New Climate Economy. Accessed September 15, 2016. http://newclimateeconomy.report/.
Oxford Economics. 2014. “Global Cities 2030: Methodology Note.” Oxford, UK: Oxford Economics.
Oxford Economics. 2016. Oxford Economic Database. http://www.oxfordeconomics.com./
Parnell, Susan. 2016. “Defining a Global Urban Development Agenda.” World Development: 529–540. February. http://dx.doi.org/10.1016/j.worlddev.2015.10.028.
Patil, Snehal. 2014. “Surat Partners with Microsoft to Become a Smart City.” Bangalore, India: Microsoft News Center. https://news.microsoft.com/en-in/surat-partners-with-microsoft-to-become-a-smart-city/.
Paul, Suman. 2014. “Finances and Governance of Urban Local Bodies: An Approach of Urban Development Perspective from a Developing Country (India).” Journal of Urban and Regional Analysis VI(2): 181–201.
Pieterse, Edgar. 2008. City Futures: Confronting the Crisis of Urban Development. London, UK: Zed Books.
Pocaterra, Juan José. 2016. “6 powerful lessons from the transformation of Medellin.” World Economic Forum, February 2016. https://www.weforum.org/agenda/2016/02/6-powerful-lessons-from-the-transformation-of-medellin/.
Potts, Deborah. 2012. “Whatever Happened to Africa’s Rapid Urbanization?” Counterpoints: 20.
PovcalNet. 2015. “An Online Analysis Tool for Global Poverty Monitoring.” Edited by The World Bank. http://iresearch.worldbank.org/PovcalNet/.
Pucher, John, Nisha Korattyswaropam, Neha Mittal, and Neenu Ittyerah. 2005. “Urban Transport Crisis in India.” Transport Policy 12: 185–198.
Rámirez, Juan Mauricio, Yadira Díaz, and Juan Guillermo Bedoya. 2014. “Decentralization in Colombia: Searching for Social Equity in a Bumpy Economic Geography.” Working Paper No. 62. Bogotá: Fedesarrollo Centro de Invetigación Económica y Social. http://www.fedesarrollo.org.co/wp-content/uploads/2014/03/working-paper-No-62.pdf.
Ravallion, Martin. 2016. The Economics of Poverty: History, Measurement and Policy. Oxford and New York: Oxford University Press.
Ravallion, Martin, Shaohua Chen, and Prem Sangraula. 2007a. “New Evidence on the Urbanization of Global Poverty.” WPS4199: 1–48.
Ravallion, Martin, Shaohua Chen, and Prem Sangraula. 2007b. “New Evidence on the Urbanization of Global Poverty.” Population and Development Review 33(4): 667–702.
Ravallion, Martin, Shaohua Chen, and Prem Sangraula. 2007c. “The Urbanization of Global Poverty.” World Bank Research Digest 1(4): 1, 8.
Rohith, B.R. 2014. “On Bangalore Outskirts, Water Price Doubles.” Times of India, April 24. http://timesofindia.indiatimes.com/city/bengaluru/On-Bangalore-outskirts-water-price-doubles/articleshow/34132760.cms.
Rose, Gregory L. 2011. “Gaps in the Implementation of Environmental Law at the National, Regional and Global Level,” 1–30. New York, NY: UNEP. http://www.unep.org/delc/Portals/24151/FormatedGapsEL.pdf.
Sakamoto, Ko, Holger Dalkmann, and Derek Palmer. 2010. “A Paradigm Shift Towards Sustainable Low Carbon Transport: Financing the Vision ASAP.” https://www.itdp.org/wp-content/uploads/2014/07/A_Paradigm_Shift_toward_Sustainable_Transport.pdf.
Satterthwaite, David. 2016. “Missing the Millennium Development Goal Targets for Water and Sanitation in Urban Areas.” Environment and Urbanization 28(1): 99–118.
Satterthwaite, David, and Alice Sverdlik. 2013. “Energy Access and Housing for Low-Income Groups in Urban Areas.” In Energizing Sustainable Cities: Assessing Urban Energy edited by A. Grubler and D. Fisk. London, Routledge.
Secretaría de Finanzas, Gaceta Oficial del Distrito Federal. 2015. “Presupuesto Operativo Anual 2015.”
SCBD (Secretariat of the Convention on Biological Diversity). 2012. “Cities and Biodiversity Outlook.” Montreal, Canada: SCBD. https://www.cbd.int/doc/health/cbo-action-policy-en.pdf.
Seoul Metropolitan Government. 2014. “Statistics of Seoul.” http://english.seoul.go.kr/get-to-know-us/statistics-of-seoul/seoul-statistics-by-category/#none.
Serageldin, Ismail. 1994. “Making Development Sustainable.” In Making Development Sustainable: From Concepts to Action, edited by Ismail Serageldin and Andrew Steer. Washington, DC: World Bank, 1994.
Seto, Karen C., Burak Güneralp, and Lucy R. Hutyra. 2012. “Global Forecasts of Urban Expansion to 2030 and Direct Impacts on Biodiversity and Carbon Pools.” Proceedings of the National Academy of Sciences 109(40): 16083–16088.
Seto, Karen C., Shobhakar Dhakal, Anthony Bigio, Hilda Blanco, Gian Carlo Delgado, David Dewar, Luxin Huang, Atsushi Inaba, Arun Kansal, Shuaib Lwasa, James McMahon, Daniel B. Müller, Jin Murakami, Harini Nagendra, and Anu Ramaswami. 2014. “Human Settlements, Infrastructure and Spatial Planning.” In Climate Change 2014: Mitigation of Climate Change, edited by O. Edenhofer, R. Pichs-Madruga, Y. Sokona, E. Farahani, S. Kadner, K. Seyboth, A. Adler, I. Baum, S. Brunner, P. Eickemeier, B. Kriemann, J. Savolainen, S. Schlömer, C. von Stechow, T. Zwickel and J. C. Minx. Contribution of Working Group III to the Fifth Assessment Report of the Intergovernmental Panel on Climate Change. Cambridge, UK and New York, NY: Cambridge University Press.
Shell and Centre for Livable Cities. 2014. “New Lenses on Future Cities: A New Lens Scenario Supplement.” Shell International BV. http://www.shell.com/energy-and-innovation/the-energy-future/scenarios/new-lenses-on-future-cities/_jcr_content/par/tabbedcontent/tab/textimage.stream/1447854282580/c391a74670d29b3e8f4f64a70a6d5653fb1f9fbeef0ede22dd2daccdb5cdab2c/newlensesonfuturecities-june-2014.pdf.
Siemens. 2010. “Latin American Green City Index: Medellín Colombia.” http://www.siemens.com/entry/cc/features/greencityindex_international/all/en/pdf/medellin.pdf.
Singapore Department of Statistics. 2016. “Latest Data.” Website. http://www.singstat.gov.sg/statistics/latest-data#16.
Singapore Government. 2015. “Budget 2015.” http://www.singaporebudget.gov.sg/budget_2015/RevenueandExpenditure.aspx.
Singh, Rozita, Xiao Wang, Juan Carlos Mendoza, and Emmanuel Kofi Ackom. 2015. “Electricity (In)accessibility to the Urban Poor in Developing Countries.” WIREs Energy Environment 4(4): 339–353.
SIWI (Stockholm International Water Institute). 2005. “Making Water a Part of Economic Development: The Economic Benefits of Improved Water Management and Services.” Stockholm, Sweden: Stockholm International Water Institute.
Sotomayor, Luisa. 2015. “Equitable Planning through Territories of Exception: The Contours of Medellín’s Urban Development Projects.” International Development Planning Review 37(1): 373–397.
Sperling, Daniel, and Deborah Gordon. 2008. “Two Billion Cars: Transforming a Culture.” Transportation Research (TR) News, November/December. http://onlinepubs.trb.org/onlinepubs/trnews/trnews259billioncars.pdf.
StatBank Denmark. 2016. “Municipality Budgets (DKK 1.000) by Region, Main Account, Dranst and Kind.” Distributed by Statistics Denmark. http://www.statbank.dk/statbank5a/SelectTable/Omrade0.asp?PLanguage=1.

40 |
Statistics South Africa. “Census 2011: Municipal Report, Gauteng.” Distributed by Statistics South Africa. http://www.statssa.gov.za/census/census_2011/census_products/KZN_Municipal_Report.pdf.
Steg, L., and R. Gifford. 2005. “Sustainable Transport and Quality of life.” Journal of Transport Geography 13: 59–69.
Steel, W. and D. Snodgrass. 2008. “Raising Productivity and Reducing Risks of Household Enterprises.” Diagnotic Methodology Framework. World Bank.
Surat Municipal Corporation. 2016. “Budget.” https://www.suratmunicipal.gov.in/Departments/Accounts/Budget.
Swamy, Shivanand, Anjana Vyas, and Shipra Narang. 2009. “Transformation of Surat: From Plague to Second Cleanest City in India.” Urban Management Innovations. Case Study #1. New Delhi, India: Urban Management Programme for Asia & the Pacific, and All Institute of Local Self Government.
Tacoli, Cecilia, Gordon McGranahan, and David Satterthwaite. 2014. “Urbanization, Rural-Urban Migration and Urban Poverty.” Background paper for the World Migration Report 2015: Migrants and Cities: New Partnerships to Manage Mobility. Geneva, Switzerland: International Organization for Migration (IOM).
Tendler, Judith. 1997. Good Government in the Tropics. Baltimore: The John Hopkins University Press.
Turok, Ivan. 2014. “The Seventh World Urban Forum in Medellín: Lessons for City Transformation.” Local Economy 29(6–7): 575–578.
UNCSD (United Nations Commission on Sustainable Development). 2012. “Sustainable, Low Carbon Transport in Emerging and Developing Economies.” In Rio 2012 Issues Briefs. New York, NY: UNCSD Secretariat and the Partnership for Sustainable, Low Carbon Transport (SLoCaT).
UNEP (United Nations Environment Programme). 2011. Keeping Track of Our Changing Environment: From Rio to Rio+20 (1992–2012). Nairobi, Kenya: UNEP. http://www.onu.org.br/rio20/img/2012/01/Keeping-Track-of-Changing-Environment-UNEP.pdf .
UNESCO (United Nations Educational, Scientific and Cultural Organization). 2009. World Water Development Report 2009: Water in a Changing World. Paris, France: UNESCO.
UNESCO 2015. World Water Development Report 2015: Water for a Sustainable World. Paris, France: UNESCO. http://www.unesco.org/new/en/loginarea/natural-sciences/environment/water/wwap/wwdr/2015-water-for-a-sustainable-world/.
UNFCCC (United Nations Framework Convention on Climate Change). 2015. “Historic Paris Agreement on Climate Change.” Press Release. http://newsroom.unfccc.int/unfccc-newsroom/finale-cop21/.
UN Habitat. 2003. The Challenge of Slums: Global Report on Human Settlements, 2003. London, UK: Earthscan.
UN Habitat. 2010. The State of African Cities Reports 2010: 270. http://mirror.unhabitat.org/pmss/listItemDetails.aspx?publicationID=3034.
UN Habitat. 2013. Planning and Design for Sustainable Urban Mobility: Global Report on Human Settlements 2013. http://unhabitat.org/planning-and-design-for-sustainable-urban-mobility-global-report-on-human-settlements-2013/.
UN Habitat. 2014. “The New Urban Agenda Will be Decided in Quito.” Press release. http://unhabitat.org/wp-content/uploads/2014/07/PR-The-New-Urban-Agenda-will-be-decided-in-Quito_-1.pdf.
UN Habitat. 2015. “Habitat III Issue Paper 22 on Informal Settlements.” http://unhabitat.org/wp-content/uploads/2015/04/Habitat-III-Issue-Paper-22_Informal-Settlements-2.0.pdf.
UN Habitat. 2016. “Urbanization and Development: Emerging Futures.” In World Cities Report. Nairobi, Kenya: UN Habitat.
UNICEF (United Nations International Children's Emergency Fund), and World Health Organization (WHO). 2012. Progress on Drinking Water and Sanitation: 2012 Update. New York, NY: UNICEF and Geneva, Switzerland: WHO.
United Nations. 2014. “World Urbanization Prospects: The 2014 Revision.” New York, NY: United Nations, Department of Economic and Social Affairs.
United Nations. 2015a. 2010 World Population and Housing Census Programme. New York, NY: United Nations Statistics Division, Demographic and Social Statistics. http://unstats.un.org/unsd/demographic/sources/census/censusdates.htm.
United Nations. 2015b. The Millennium Development Goals Report. http://www.un.org/millenniumgoals/2015_MDG_Report/pdf/MDG%202015%20rev%20(July%201).pdf.
United Nations. 2015c. “Transforming Our World: The 2030 Agenda for Sustainable Development.” https://sustainabledevelopment.un.org/content/documents/21252030%20Agenda%20for%20Sustainable%20Development%20web.pdf.
United States Census Bureau. 2010. “2010 Census Urban and Rural Classification and Urban Area Criteria.” https://www.census.gov/geo/reference/ua/urban-rural-2010.html.
Vanek, Joann, Martha Alter Chen, Françoise Carré, James Heintz, and Ralf Hussmanns. 2014. “Statistics on the Informal Economy: Definitions, Regional Estimates & Challenges.” Working Paper 2 (Statistics). In Women in Informal Employment: Globalizing and Organizing (WIEGO) Working Papers. WEIGO: Cambridge. http://wiego.org/sites/wiego.org/files/publications/files/Vanek-Statistics-WIEGO-WP2.pdf.
Vasconcellos, E.A. 1997. “The Making of the Middle-Class City: Transportation Policy in Sao Paulo.” Environment & Planning A(2): 293.
Vollmer, Derek, and Adrienne Grêt-Regamey. 2013. “Rivers as Municipal Infrastructure: Demand for Environmental Services in Informal Settlements along an Indonesian River.” Global Environmental Change 23: 542–55.
Watts, Jonathan. 2014. “Fury and Frustration in Brazil as Fares Rise and Transport Projects Flounder.” The Guardian, February 6. https://www.theguard-ian.com/world/2014/feb/06/brazil-bus-chaos-fare-rise.
WEIGO (Women in Informal Employment: Globalizing and Organizing). 2016. “Inclusive Cities and the Urban Informal Economy.” http://wiego.org/cities.
WHO (World Health Organization). 2014a. “Ambient (Outdoor) Air Pollution in Cities Database 2014.” http://www.who.int/phe/health_topics/outdoorair/databases/cities/en/.
WHO. 2014b. “Ambient Air Pollution Database Update 2014: Data Summary of the AAP Database.” http://www.who.int/phe/health_topics/outdoorair/databas-es/AAP_database_results_2014.pdf.
WHO. n.d.-a. “Burden of Disease Associated with Urban Outdoor Air Pollution for 2008.” http://www.who.int/phe/health_topics/outdoorair/databases/burden_disease/en/.
WHO. n.d.-b. “People Living in Informal Settlements.” http://www.who.int/ceh/indicators/informalsettlements.pdf.
WHO and UNICEF. n.d. “Improved and Unimproved Water Sources and Sanitation Facilities.” WHO and UNICEF, Joint Monitoring Programme for Water Supply and Sanitation. http://www.wssinfo.org/definitions-methods/watsan-categories/.
WHO and UNICEF. 2015. Joint Monitoring Programme for Water Supply and Sanitation Database. http://www.wssinfo.org/data-estimates/tables/.
Winrock International. 2005. “Enabling Urban Livelihoods Policy Making: Understanding the Role of Energy Services.” In Country Report. DFID KaR Project R8348. Salvador, Brazil: Winrock International.
WORLD RESOURCES REPORT | October 2016 | 41
Towards a More Equal City: Framing the Challenges and Opportunities
World Bank. 1994. World Development Report 1994: Infrastructure and Development. Washington, DC: Oxford University Press, Inc. https://openknowledge.worldbank.org/bitstream/handle/10986/5977/WDR%201994%20-%20English.pdf?sequence=2&isAllowed=y.
World Bank. 2010a. “Cities and Climate Change.” http://siteresources.worldbank.org/INTUWM/Resources/340232-1205330656272/CitiesandClimateChange.pdf.
World Bank. 2010b. Overview of Africa’s Infrastructure: A Time for Transformation. Washington, DC: The International Bank for Reconstruction and Development/The World Bank. doi:10.1596/978-0-8213-8041-3. https://openknowledge.worldbank.org/handle/10986/2692.
World Bank. 2013. “Planning and Financing Low-Carbon, Livable Cities.” http://www.worldbank.org/en/news/feature/2013/09/25/planning-financing-low-carbon-cities.
World Bank. 2016a. SE4ALL database. “Access to Electricity, Urban (% of Urban Population)” http://data.worldbank.org/indicator/EG.ELC.ACCS.UR.ZS.
World Bank. 2016b. World Development Indicators. http://databank.worldbank.org/data/reports.aspx?source=world-development-indicators.
X-Rates. 2015. “Monthly Average Exchange Rate, Brazilian Real to U.S. Dollar.” http://www.x-rates.com/average/?from=USD&to=BRL&amount=1&year=2015.
Zhao, Xiao, Anjali Mahendra, Nick Godfrey, Holger Dalkmann, Philipp Rode, and Graham Floater. 2016. “Unlocking the Power of Urban Transport Systems for Better Growth and a Better Climate.” In The New Climate Economy. The Global Commission on the Economy and Climate. http://2015.newclimateeconomy.report/wp-content/uploads/2016/01/Unlocking-the-power-of-urban-transport-systems_web.pdf.
42 |
ENDNOTES1. United Nations, 2014: 1.
2. United Nations, 2014: 1.
3. United Nations, 2014: 12.
4. Ravallion et al., 2007a.
5. United Nations, 2014.
6. Authors’ calculations based on analysis of PovcalNet last updated October, 2015.
7. World Bank, 2016b; WHO and UNICEF, 2015.
8. Parnell, 2016.
9. United Nations, 2015c.
10. UN Habitat, 2014: 1.
11. Cities Alliance, 2015.
12. United Nations, 2015b: 14.
13. New Climate Economy, 2015.
14. UN Habitat, 2016: 189–94.
15. UN Habitat, 2016: 193.
16. United Nations, 2014: 1.
17. Glaeser, 2014; Ravallion et al., 2007a.
18. Serageldin, 1994.
19. It should be noted that there are many approaches to dealing with inequality, for example, income inequality, spatial inequality, and addressing individual and collective rights. These aspects of inequality need to be addressed, and it is difficult to prioritize the importance of these approaches. However, the authors have made a strategic decision to focus on the economy, environment, and equity nexus. This takes us to a limited set of issues where cities can address the urgent needs of their inhabitants, and where decisions have the potential to result in unsustainable urban lock-in.
20. Hoornweg and Freire, 2013; McDonald, 2015.
21. Ghani and Kanbur, 2013: 23; Ravallion, 2016: 445–447.
22. Ravallion et al., 2007b.
23. Leonard, 2010; Biello, 2011; Ferrão and Fernández, 2013.
24. Jerico et al., 2016; Pieterse, 2008.
25. There is growing interest in the concept of transformative urban change and urban sustainability; for an example, see Messner (2015).
26. United States Census Bureau, 2010.
27. Oxford Economics, 2014: 4.
28. Oxford Economics, 2014: 4.
29. Some examples of countries that have not conducted a census in a decade or more include: Democratic Republic of Congo, Eritrea, Madagascar, Somalia, Pakistan, Yemen, Jordan, Lebanon, Guatemala, Haiti, Uzbekistan, and Ukraine (United Nations, 2015a).
30. For instance, the Global Commission on the Economy and Climate (2014) classified cities as Emerging Cities, Global Megacities, and Mature Cities based on population and income. Godfrey and Savage (2012) consid-ered five profiles of climate risk as a way to distinguish cities, and Shell and Centre for Livable Cities (2014) considered six archetypes based on energy use in cities. Each of these studies classified cities based on the particular theme of analysis.
31. (GDP per capita 2030/GDP per capita 2015)/(Population 2030/Population 2015).
32. United Nations, 2014: 11.
33. United Nations, 2014: 11.
34. United Nations, 2014: 11.
35. United Nations, 2014: 1.
36. United Nations, 2014: 37–38.
37. Tacoli et al., 2014: 8–9.
38. Tacoli et al., 2014: 8.
39. Tacoli et al., 2014: 8–9.
40. Tacoli et al., 2014: 8–9.
41. Glaeser, 2014.
42. Glaeser, 2014.
43. Glaeser, 2014: 1154.
44. Potts, 2012: 2.
45. Potts, 2012: 3; UN Habitat, 2010.
46. Castells-Quintana, 2016: 1.
47. Castells-Quintana, 2016: 1.
48. Ravallion et al. 2007c: 1; UN Habitat, 2003; Chatterjee et al., 2016.
49. Ravallion et al., 2007c: 1.
50. Ravallion et al., 2007c: 1.
51. Ravallion et al., 2007c: 1.
52. Ravallion et al., 2007c: 1.
53. Ravallion et al., 2007c: 1.
54. Mitlin, 2016a; ACHR, 2014.
55. Ravallion et al., 2007a: 27.
56. Ravallion et al., 2007c: 8.
57. World Bank, 2016b.
58. Ravallion et al., 2007a; Ravallion et al., 2007b; Ravallion et al., 2007c: 8.
59. Datt et al., 2016: 13.
60. Most other cities represented use exchange rates from January of each budget year. Given the variability of Brazil’s exchange rate in 2015, we cal-culated the budget for each city using the average of the real monthly aver-age exchange rates from January to December 2015, which ranged from 2.6358 to 3.9031. Our adjusted exchange rate used to calculate each Brazilian city’s budget was 1 US$ = 3.333 BRL$ for 2015 (X-Rates, 2015); Accra Metropolitan Assembly, 2012; Ghana Statistical Service, 2014; Budget Office of the County Government of Mombasa, 2014; Budget Office of the County Government of Mombasa, 2015; Nairobi City County, 2014; Nairobi City County, 2014; budgiT, 2016; National Population Commission, 2016; eThekwini Municipality, 2012; eThekwini Municipality, 2015; City of Johannesburg; Statistics South Africa; City of Johannesburg,
WORLD RESOURCES REPORT | October 2016 | 43
Towards a More Equal City: Framing the Challenges and Opportunities
Statistics South Africa, 2015; Muzammil, 2015; Department of Census and Statistics, Government of Sri Lanka, 2012; BBMP, 2015; Surat Municipal Corporation, 2016; Ahmedabad Municipal Corporation, 2015; Municipal Corporation of Greater Mumbai, 2015; Census of India, 2011; Municipio de Medellín, 2015; Alcadía Mayor de Bogotá D.C, 2015; DANE, 2016; Secretaría de Finanzas, Gaceta Oficial del Distrito Federal, 2015; INEGI, 2010; Accra Metropolitan Assembly, 2012; Câmara Municipal de São Paulo, 2014; Câmara Municipal do Rio de Janeiro, 2015; Câmara Municipal Belo Horizonte; IBGE, 2015; Seoul Metropolitan Government, 2014; National Bureau of Statistics China, 2014; City of Yokohama, 2015; StatBank Denmark, 2016; Singapore Government, 2015; Singapore Department of Statistics, 2016; City of New York, 2014.
61. Watts, 2014; Finnegan, 2002; Foltyn, 2016.
62. J-PAL, 2012: 11; Satterthwaite, 2016: 99.
63. Satterthwaite, 2016: 100.
64. J-PAL, 2012: 11.
65. United Nations, 2015b: 9.
66. United Nations, 2015b: 60.
67. UNEP, 2011: 7.
68. J-PAL, 2012.
69. UN Habitat, 2003: xxv.
70. “Trunk infrastructure” refers to the larger system of shared infrastructure.
71. Johnson, 2001.
72. Zhao et al., 2016: 8.
73. Authors’ calculations from UNICEF (United Nations International Children's Emergency Fund) and World Health Organization (WHO) Joint Monitoring Programme (JMP) for Water Supply and Sanitation database (WHO and UNICEF, 2015).
74. An improved drinking water source is one that, by the nature of its con-struction, adequately protects the source from outside contamination, particularly fecal matter. An improved drinking water source includes piped water on premises (piped household water connection located inside the user’s dwelling, plot, or yard), and other improved drinking water sources (public taps or standpipes, tube wells or boreholes, protected dug wells, protected springs, and rainwater collection). Unimproved drinking water sources include unprotected dug wells, unprotected springs, carts with small tanks/drums, tanker trucks (UNICEF and WHO, 2012).
75. Authors’ calculations from UNICEF (United Nations International Children's Emergency Fund) and World Health Organization (WHO) Joint Monitoring Programme (JMP) for Water Supply and Sanitation database (WHO and UNICEF, 2015).
76. K, 2014; Rohith, 2014.
77. McDonald et al., 2014: 100.
78. World Bank, 1994: 15 quoted in SIWI, 2005: 11.
79. SIWI, 2005: 6.
80. Vollmer and Grêt-Regamey, 2013: 1543.
81. Vollmer and Grêt-Regamey, 2013.
82. World Bank, 2016b.
83. WHO and UNICEF, n.d.
84. WHO and UNICEF, n.d.
85. WHO and UNICEF, n.d.
86. SIWI, 2005: 13.
87. Kennedy et al., 2015.
88. Kennedy et al., 2015.
89. Grübler and Fisk, 2013.
90. Winrock International, 2005: 67.
91. GENUS, 2011; Singh et al., 2015.
92. World Bank, 2016b. “Low income countries” includes heavily indebted poor countries, least developed countries, and low-income countries, per the World Bank country classification.
93. World Bank, 2016b; World Bank, 2016a; IEA and World Bank, 2013: 37.
94. World Bank, 2016b.
95. Lei et al., 2011: 941.
96. Chafe et al., 2014: 1314.
97. Chafe et al., 2014: 1314.
98. Leather et al., 2011: 6.
99. Sperling and Gordon, 2008; Mahendra, 2014: 14.
100. Ahmed et al., 2007.
101. Gwilliam, 2002: 5.
102. Hook, 2005: 2.
103. Pucher et al., 2005; Vasconcellos, 1997; Drabo, 2013.
104. ADB, 2012.
105. UN Habitat, 2013: 8; AfDB, 2012.
106. Gwilliam, 2002: xvii.
107. Mani et al., 2012: 7.
108. Sakamoto et al., 2010: 10.
109. Steg and Gifford, 2005.: 61.
110. Rohith, 2014; K, 2014.
111. ICRIER and WRI, 2016; INCEP, 2016: 39.
112. ICRIER and WRI, 2016: 31.
113. McGuirk, 2014; Abers, 2000.
114. Chuhan-Pole et al., 2016: 33.
115. UN Habitat, 2016: 5.
116. Chuhan-Pole et al., 2016.
117. Ghani and Kanbur, 2013: 24.
118. World Bank, 2010b.
119. Ghani and Kanbur, 2013.
120. Harris and Todaro, 1970; Ghani and Kanbur, 2013: 8.
121. ILO, 2016; Vanek et al., 2014: 7.
122. Steel and Snodgrass, 2008 quoted in Benjamin et al., 2014.
123. The informal economy encompasses (1) the informal sector (e.g, unincor-porated, unregistered and small enterprises), and (2) informal employment (e.g., employment without social contributions from an employer) (Chen 2012; ILO, 2016).

44 |
124. Vanek et al., 2014: 1.
125. AfDB, OECD Development Centre, and UNDP, 2016: 163; Kessides, 2006: xv; Vanek et al., 2014: 2.
126. Vanek et al., 2014: 2.
127. Vanek et al., 2014: 12.
128. Chuhan-Pole et al., 2016: 51.
129. AfDB, OECD Development Centre, and UNDP, 2016.
130. Ghani and Kanbur, 2013: 16.
131. Jütting and Laiglesia, 2009 quoted in Ghani and Kanbur, 2013: 17.
132. Ghani and Kanbur, 2013: 17.
133. Mitlin and Satterthwaite, 2013: 155.
134. Mitlin and Satterthwaite, 2013: 155.
135. Ghani and Kanbur, 2013: 19.
136. Chen, 2007: 7.
137. Ghani and Kanbur, 2013: 23.
138. Ghani and Kanbur, 2013: 20.
139. WEIGO, 2016.
140. Godfrey and Savage, 2012; Global Commission on the Economy and Climate, 2014; World Bank, 2010a.
141. SCBD, 2012.
142. Millennium Ecosystem Assessment, 2003.
143. Seto et al., 2012: 16083.
144. Seto et al., 2012: 16083.
145. McDonald et al., 2014: 100.
146. Elmqvist et al., 2013.
147. British Geological Survey and WaterAID, 2008.
148. Kennedy et al., 2015: 5988.
149. UNESCO, 2009: 138.
150. British Geological Survey and WaterAID, 2008.
151. UNESCO, 2009: 141.
152. UNESCO, 2015: 77.
153. UNESCO, 2009: 139.
154. Seto et al., 2014: 25.
155. Megacities are usually defined as having a population in excess of 10 million.
156. Kennedy et al., 2015: 5989.
157. Kennedy et al., 2015: 5989.
158. UNCSD, 2012: 1.
159. Erickson and Tempest, 2015: 1.
160. WHO, 2014a.
161. WHO, 2014b.
162. WHO, 2014a; Authors’ calculations based on WHO, 2014b.
163. Mani et al., 2012: 6–7.
164. WHO, No n.d.-a.
165. United Nations, 2014: 2.
166. Turok, 2014: 575.
167. McGuirk, 2014: 231.
168. Pocaterra, 2016.
169. DANE, 2016.
170. Siemens, 2010: 60.
171. McGuirk, 2014: 232.
172. Civico, 2012.
173. Sotomayor, 2015: 373.
174. Turok, 2014.
175. Rámirez et al., 2014.
176. Turok, 2014.
177. McGuirk, 2014: 237.
178. McGuirk, 2014: 238.
179. McGuirk, 2014: 241.
180. McGuirk, 2014: 241.
181. McGuirk, 2014: 250.
182. McGuirk, 2014: 236.
183. McGuirk, 2014.
184. Sotomayor, 2015: 374.
185. McGuirk, 2014.
186. McGuirk, 2014: 252–53.
187. Turok, 2014.
188. Brand and Dávila, 2011.
189. Brand and Dávila, 2011: 658.
190. Sotomayor, 2015.
191. Sotomayor, 2015: 379.
192. Sotomayor, 2015: 375.
193. Turok, 2014.
194. Jariwala et al., 2015.
195. Patil, 2014.
196. Bhat et al., 2013: 1.
197. Jariwala et al., 2015: 1.
198. Bhat et al., 2013: 2.
199. Bhat et al., 2013: 4.
200. Swamy et al., 2009.
201. Jariwala et al., 2015.
202. Jariwala et al., 2015: 7.
203. Swamy et al., 2009.
204. Swamy et al., 2009: 8.
205. Swamy et al., 2009; Jariwala et al., 2015.
WORLD RESOURCES REPORT | October 2016 | 45
Towards a More Equal City: Framing the Challenges and Opportunities
206. Swamy et al., 2009.
207. Enda Tiers Monde, n.d.: 27.
208. Swamy et al., 2009: 16.
209. Bhat et al., 2013.
210. Bhat et al., 2013: 2.
211. Swamy et al., 2009.
212. Anguelovski et al., 2014.
213. Anguelovski et al., 2014.
214. Bhat et al., 2013: 7.
215. Patil, 2014.
216. Jariwala et al., 2015.
217. Janaagraha Centre for Citizenship and Democracy, 2014: 47.
218. Ferrão and Fernández, 2013.
219. Mitlin, 2016b.
220. For example, Tendler (1997).
221. Beard et al., 2008.
222. Gilbert, 2015: 666.
223. Blair, 2000.
224. Gilbert, 2015: 666.
225. The United Nations in 2002 declared Bogotá an example for the rest of Latin America (Gilbert 2015: 666.).
226. Gilbert, 2015: 666.
227. Beard and Sarmiento, 2014; Dasgupta and Beard, 2007; Mansuri and Rao, 2012.
228. Dasgupta and Beard, 2007.
229. Boonyabancha, 2016a; Boonyabancha, 2016b.
230. Farvacque-Vitkovic and Kopanyi, 2013: 13
231. Farvacque-Vitkovic and Kopanyi, 2013: 13.
232. Paul, 2014: 182.
233. Friedmann, 1987.
234. Ahluwalia et al., 2014: 8.
235. For example, the rising middle class may vote for leafy, gated communities on the urban periphery and private car usage as their ideal of urban living, while the urban poor prefer open, accessible streets and pedestrianized areas that facilitate the organic development of the “bazaar” economy (Jagannathan, 1987).
236. Global Commission on the Economy and Climate, 2014.
237. Rose, 2011: 6.
238. Satterthwaite and Sverdlik, 2013.

46 |
WORLD RESOURCES REPORT | October 2016 | 47
Towards a More Equal City: Framing the Challenges and Opportunities
ACKNOWLEDGEMENTSThe authors would like to thank the many people who have contributed their knowledge and expertise. We express our particular gratitude to Aniruddha Dasgupta, Global Director of the WRI Ross Center for Sustainable Cities, who provided leadership and intellectual guidance, and to the entire WRI Ross Center team for their input and support during the development of this work. We are indebted to all our colleagues in WRI’s international offices who helped us conduct interviews with the urban under-served in cities of the Global South. These include Fernanda Boscaini, Caroline Donatti, Matheus Jotz, and Brenda Medeiros in Brazil; Radha Chanchani, Sahana Goswami, and Neha Mungekar in India; and Dana Corres, Celine Jacquin, and Angelica Vesga in Mexico. In addition, data were provided by Edith Alusa-Bosire and Murefu Barasa for Nairobi, Kwabena Bonsu and Magnus Quarshie for Accra, Abdulmutalib Yussuff for Lagos, and Jinzhou Song for Shanghai. We would like to give a heartfelt thank you to Diana Mitlin and David Satterthwaite from the International Institute for Environment and Development, who helped us conceptualize the paper, provided substantive comments on numerous drafts, and always found time for discussion. We are grateful to the many reviewers who helped strengthen the paper with their insightful comments. External reviews were provided by Ibidun Adelekan, Judy Baker, Eugenie Birch, Somsook Booyanbacha, William Cobbett, Kieran Donaghy, Sumila Gulyani, Ellen Hamilton, Arif Hasan, Rubbina Karruna, Annette Kim, Marcio Lacerda, Arthur Minsat, Diana Mitlin, Sheela Patel, Aromar Revi, David Satterthwaite, and Jonathan
Woetzel. Internal reviews were provided by Samuel Adams, Manish Bapna, Holger Dalkmann, Natalie Elwell, Toni Lindau, Adriana Lobo, Anne Maassen, Helen Mountford, Madhav Pai, Nitin Pandit, Janet Ranganathan, and Mark Robinson. We are grateful to the 22 participants who attended an all-day stakeholder workshop in November 2015, with many of whom we have stayed in contact while developing the paper.
Throughout the development of this paper and the larger World Resources Report, speakers traveled from around the world to present their work as part of our seminar series at WRI’s global office in Washington, DC. These speakers provided us with valuable feedback on the World Resources Report.
We would like to thank Carni Klirs for bringing the graphics to life, for the publication design, and layout. Thanks to Bill Dugan for art direction and guidance. We are grateful to Emily Matthews, Emily Schabacker, and Lael Giebel for editorial support. And thank you to Bruce Ross-Larson for his guidance on the initial framing of the paper. We are indebted to Sarah Dougherty and Emily Norford for their research support and assistance with references, and to Valeria Gelman and Adna Karabegovic for overall support in managing this work. We appreciate the help we received from Lauren Zelin, Michael Oko, Katherine Peinhardt, Alex Rogala, Anand Mishra, and Heather Scott in launching this paper and conducting outreach. Finally, we are eternally grateful to Hyacinth Billings for her patience and assistance with the publication process.
ABOUT WORLD RESOURCES INSTITUTE World Resources Institute is a global research organization that turns big ideas into action at the nexus of environment, economic opportunity and human well-being.
Our ChallengeNatural resources are at the foundation of economic opportunity and human well-being. But today, we are depleting Earth’s resources at rates that are not sustainable, endangering economies and people’s lives. People depend on clean water, fertile land, healthy forests, and a stable climate. Livable cities and clean energy are essential for a sustainable planet. We must address these urgent, global challenges this decade.
Our VisionWe envision an equitable and prosperous planet driven by the wise management of natural resources. We aspire to create a world where the actions of government, business, and communities combine to eliminate poverty and sustain the natural environment for all people.
ABOUT WRI ROSS CENTER FOR SUSTAINABLE CITIESWRI Ross Center for Sustainable Cities works to make urban sustainability a reality. Global research and on-the-ground experience in Brazil, China, India, Mexico, Turkey and the United States combine to spur action that improves life for millions of people.
Based on longstanding global and local experience in urban planning and mobility, WRI Sustainable Cities uses proven solutions and action-oriented tools to increase building and energy efficiency, manage water risk, encourage effective governance and make the fast-growing urban environment more resilient to new challenges.
Aiming to influence 200 cities with unique research and tools, WRI Sustainable Cities focuses on a deep cross-sector approach in four megacities on two continents, and targeted assistance to 30 more urban areas, bringing economic, environmental and social benefits to people in cities around the globe.
Copyright 2016 World Resources Institute. This work is licensed under the Creative Commons Attribution 4.0 International License. To view a copy of the license, visit http://creativecommons.org/licenses/by/4.0/
10 G Street, NE | Washington, DC 20002 | www.WRIRossCities.org
ABOUT THIS WORLD RESOURCES REPORTThis is the first working paper in a series of working papers that comprise the World Resources Report: Towards a More Equal City. It will be followed by other working papers on energy, housing, transportation, water and urban expansion. To obtain an electronic copy of this paper, other working papers, and to view supporting materials please visit www.citiesforall.org.
FUNDERSWe deeply appreciate the following donors for their generous financial support:
United Kingdom Department for International DevelopmentStephen M. Ross PhilanthropiesDenmark Ministry of Foreign AffairsIreland Department of Foreign Affairs and TradeNetherlands Ministry of Foreign AffairsSwedish International Development Cooperation AgencyUnited Nations Development Programme
ABOUT THE AUTHORSVictoria A. Beard is Director of Research in WRI Ross Center for Sustainable Cities and is leading the World Resources Report on sustainable cities. Her research focuses on comparative urbanization, community-based planning, and urban poverty.
Anjali Mahendra is Senior Research Associate in WRI Ross Center for Sustainable Cities and is co-leading the World Resources Report. Her research focuses on urban transportation policy and land use, integrated urban infrastructure planning, and urban economics.
Michael I. Westphal is Senior Associate in Sustainable Finance Center and a core member of the World Resources Report team. His research focuses on climate finance, energy, and urban sustainability.