towards a more perfect american payments union: the civil ... · towards a more perfect american...
TRANSCRIPT

Towards a More Perfect American Payments Union: The Civil Waras a Political Economic Watershed
John A. JamesUniversity of Virginia
and
David F. WeimanBarnard College, Columbia University
For presentation at the 2005 Annual Meetings of the Economic History Association.Please do not cite or quote without permission of the authors.
Weiman is grateful to Barnard College for research support and to Jessica Swithenbank andAriel Rubin for their able research assistance.

1
1. National Market Formation and Payments System Integration
In explaining the rise of big business and, in turn, America’s industrial hegemony in the late
nineteenth-century, Alfred Chandler (1977) specifies two necessary conditions: the diffusion of more
capital- and energy-intensive, scale-dependent industrial technologies and the formation of an integrated
national market. The latter, he argued, depended on the development of centralized national networks of
rail transportation, telegraphic communications, and wholesale distribution. Prior technological-
organizational innovations in these sectors, he argued, dramatically lowered the costs and risks of
shipping goods and transmitting information over space and so paved the way for pioneering
entrepreneurs to exploit the new technologies of the second industrial revolution to expand the scale and
scope of their markets and enterprises.
In his account of national market formation, Chandler surprisingly neglects the payments system.
This vital spatial-economic network consists of intermediaries that process payments orders and then
transfer good funds between buyers and sellers, that is, clear and settle payments instruments. The
simplest network is the shipment of legal tender, in this case specie, because it bundles the steps of
clearing and settlement. While simple in principle, this means of payment entails significant transactions
costs (e.g., for express shipping, storage, and insurance) and risks (of theft), especially during this period
of rapid economic and territorial expansion.
Alternative payments networks substitute a variety of paper claims over good funds – what
contemporaries referred to as “credit instruments” – for the actual stuff of money itself. During the
antebellum period the most common instruments used in long-distance transactions were bearer notes
issued by state-chartered banks (state bank notes for short) and bills of exchange. State bank notes
entitled the bearer to an equivalent value of specie when redeemed at the office of the issuing bank. A
bill of exchange was a written order to pay the person to whom it was addressed a specified amount at a
specific place (say a New York bank) and time (say 60 days hence) (Freyer 1976, p. 437). Both
instruments were transferrable or negotiable and so could substitute for costly, risky shipments of specie
in interregional trade (Goodfriend 1990). Their diffusion also economized on the use of potential bank
reserves for transactions and so could enhance total reserves in the banking system and credit supplies.
Still, as claims over specie, state bank notes and bills were subject to credit or default risk. And at some
2
1For a debate over the formation of the U.S. monetary union, see the contributions by Grubb,Michener and Wright, Rousseau, and Sylla in the forthcoming special issue of Financial History Review.
point in time (explicitly stated in the case of bills), they were presented for redemption and so imposed
transactions costs.
The potential benefits from the substitution of credit instruments for specie, then, depended on the
formation of a “more perfect” payments union for paper-based or credit payments instruments. We
characterize a “more perfect” or integrated payments system by the cost and predictability of the
payments terms. Obviously, buyers would remit credit instruments instead of shipping specie (or its
equivalent), only if they incurred lower transactions costs. Sellers also had to reckon the risk, timing, and
costs of final settlement, which determined how much “money” or purchasing power the payments
instrument would command in the market. These factors depended on the creditworthiness and
accessibility of pivotal intermediaries in the payments network and the liquidity of payments markets at
nodal locations.
By way of clarification, we distinguish between a monetary and payments system union. The former
refers to the adoption of a single, national monetary standard or unit of account. Article one (sections 8
and 10) of the Constitution enshrined this power exclusively in the federal government, and in his
Treasury “Report on the Public Mint,” Hamilton proposed and Congress enacted a dollar standard, the
value of which was set in terms of fixed amounts of gold and silver specie.1
Although it did not immediately displace the alternatives such as the Spanish dollar and British
pound, the American dollar standard had thoroughly diffused across the territorial U.S. by 1860.
Monetary unification by no means implied an integrated interregional payments system, which consisted
of bills of exchange and state bank notes, varying in their size, description, and denomination. In early
1863 the Chicago Tribune estimated that the 1,395 state-chartered banks in the Union alone (southern
slave states not included) had issued an estimated 8,370 different types of bank notes, not counting the
854 issues of “fraudulent broken and worthless banks” (quoted in Davis 1910, p. 25). Notes issued by
banks of uncertain reputation or circulating at a distance from the issuing bank frequently passed at
discounts off of their par value (see, for example, Gorton 1996). Bank note reporters like Thompson’s
3
2 This redemption network is described in more detail in Redenius (2005). After the system wasabolished in 1874, with redemption operations taken over by the Treasury, redemption cities becameknown as reserve cities, a more familiar terminology which we shall follow in the rest of this paper. NewYork later became known as a central reserve city.
and Van Court’s assisted agents in mediating this chaos of payments instruments, but not all may have
been well informed about the current values of different notes, much less about possible counterfeits.
According to Charles and Mary Beard, it took a Second American Revolution to forge a truly national
banking and payments system (1930, pp. 110-11; see also Ransom 1989, pp. 271-76). Absent the veto
power of Southern Democrats, Congress enacted in 1863 the first in a series of laws now known as the
National Banking Acts. Its primary purpose was the creation of a uniform national currency and was
actually called the National Currency Act. The new currency would be “uniform in every essential
particular, uniform in its appearance, in its security, in its method of redemption, and in its equivalency to
lawful money at all times and in all places within the territorial limits of the United States [with the
exception of California initially]” (U.S. Comptroller of the Currency 1889, p. 9)
A proponent of a uniform national currency since his days as Governor of Ohio in the mid-1850's,
Treasury Secretary Samuel P. Chase was the primary architect of the bill (Davis 1910, pp. 67-112). The
Act was modeled on earlier free banking laws notably that of New York. It established a new form of
bank organization, national banks with a federal charter. National banks, in turn, could issue a uniform
currency, national bank notes, secured by U.S. government bonds. Financial exigency was a secondary
motive behind the Act, as the spread of national banks would directly increase the demand for Union
bonds.
In addition to presenting notes for redemption at the office of the issuing bank, the 1864 Act
established a more elaborate system of 17 regional redemption centers plus a central redemption center in
New York. Country banks were required to maintain a redemption agent in at least one regional center, a
national bank which could also hold some of its mandated deposit reserves. New York national banks, by
the same token, served as both note redemption and deposit reserve agent for regional center banks.2 As
it turns out, this hierarchical network was not really necessary to ensure the circulation of notes at par
regardless of the location of the issuing bank. Sufficient conditions, it seems, were the earlier provisions
that (1) national banks buy and sell the notes of other national banks at par and that (2) the federal

4
3Given the protests against the National Banking Acts in peripheral regions, notably the PopulistCritique of the “money trust,” it is doubtful that the legislation even served this purpose.
government accept national bank notes for all domestic, but not international, transactions (Redenius
2002, pp. 35-36).
Like Hamilton’s Treasury Reports, Republican proponents of banking reform emphasized the dual
goals of economic and political unity. In his annual message to Congress in 1862, President Lincoln
spoke of a “long-felt want of an uniform circulating medium .... [to] facilitate commerce by cheap and
safe exchanges” (quoted in U.S. Comptroller of the Currency 1878, p. xxvi). In 1863 Governor Yates of
Illinois observed that a uniform currency “would tend to more closely knit the States together.” “Had a
uniform currency existed throughout the Union previously to the breaking out of the rebellion,” he further
speculated, “our relations would have been so interwoven as to have rendered it difficult for the traitors to
have consummated, to the extent now unfortunately existing, the secession of the revolted States” (U.S.
Secretary of the Treasury 1863, p. 163; see also Davis 1910, pp. 110-112).
The National Banking Acts may have served the goal of political unification, but in and of itself did
not create an integrated national payments system.3 Its direct impact was to create a paper currency unit,
the national bank note, whose value was pegged 1-for-1 to the dollar unit of account. By the late 1860s,
however, all currency including national bank notes made up less than half of the U.S. money supply.
More to the point, indirect evidence on the composition of deposits at national banks suggests that as
early as 1881 specie and paper currency accounted for less than 10% of wholesale payments in large
reserve cities and less than 20% elsewhere (Kinley 1912). According to these sources, the vast majority
of the money supply and of long-distance payments instruments consisted of bank deposits and bank
drafts and checks respectively.
Despite this qualification, we too see the Civil War era as a critical watershed in the formation of a
more integrated payments system. While also focusing on the National Banking Acts, we emphasize its
indirect impacts on the banking system, not the currency. The pyramidal structure of note redemption
and deposit reserve centers, we argue, concentrated correspondent banking in New York City. As a
result, a New York sight draft or check – essentially a bill of exchange issued by banks and redeemable
for cash or deposits at the office of their New York correspondent – became the standard of payment for
5
long-distance transactions regardless of the location of buyer and seller. Moreover, because New York
correspondents directly cleared and settled these payments instruments through the auspices of their
clearinghouse, they were less costly and more reliable and liquid instruments.
The unintended consequences of the National Banking Acts is only part of our story. The other
critical element involves the internalization of payments within the banking system. In other words,
compared to the antebellum period, long-distance payments flows after the Civil War were increasingly
mediated by the visible hand of banks, rather than markets, and took the form of transfers of deposits
between banks via ledger entries to their correspondent accounts. Thus, New York correspondents
increasingly mediated all, not just interbank, long-distance payments.
This shift was part and parcel of a broader transformation in the banking business. Instead of
discounting bills of exchange which bundled a credit and payments transaction, banks increasingly
supplied distinct but related credit and payments services and instruments. On the credit side, they would
purchase their customers’ one-name paper, often unsecured promissory notes, in exchange for currency
but more often for a ledger entry to their deposit account. In turn, to make long-distance payments,
customers purchased New York sight drafts or checks with their deposits.
The more fundamental causes of these banking innovations are bound up with structural economic
changes – rapid territorial expansion, the shifting economic center from rural agricultural to urban
industrial sectors, and the rise of big business in distribution and manufacturing. The latter two put a
premium on the more rapid turnover of sales and hence the greater liquidity of payments instruments,
while territorial expansion diluted the close-knit networks of intermediaries whose endorsements
supported the bill market. Through their dual specialization as market-makers in liquidity and
information-intensive lenders, banks were ideally suited to fill the niche.
Yet, the Civil War mattered in this case as well, more as catalyst than cause. In the wake of specie
suspension, monetary policy fueled rapid inflation, the rate of which peaked at 45 percent in 1864, and
eroded the value of 60- and even 30-day bills. To minimize their inflation risk, wholesalers and
manufacturers offered large discounts on cash sales and so induced buyers to borrow directly from their
banks. Structural conditions explain the persistence of these terms, even after the macro environment
turned in a deflationary direction.

6
4Kahn and Roberds (1999) compare the characteristics of checks versus bank notes and concludenotes to have been the superior payments vehicle precisely because they did not require immediatecollection and settlement.
5Checks in contrast were not widely used as intercity or interregional means of payments until aroundthe 1880's. See James and Weiman (2004).
To show the impacts of Union banking and monetary policies, we document the changes in
correspondent banking system and domestic exchange rates before and after the Civil War. In the next
section we set the historical context by delineating the structure of the antebellum payments system and in
particular the role of correspondent banking before 1860. In section three we use published balance sheet
data of state banks up to 1864 and national banks from 1865 to 1869 to analyze trends in the levels of
correspondent balances and their concentration in New York. Finally, with data from local newspapers
section four analyzes regional domestic exchange markets where local banks bought and sold New York
funds. We conclude by considering a path not taken, the bankers’ acceptance, the modal payments
instrument in Europe, which was explicitly prohibited to national banks.
2. The antebellum payments system
Notes, rather than deposits, were the principal form of bank liability used as means of payment in
antebellum America. In 1819, for example, notes or “circulation” issued by chartered banks were 74
percent larger than their deposits (Van Fenstermaker 1965, p. 76). Even by the late 1850s, country banks
– those outside of large urban centers regardless of region – continued to rely more heavily on note issues
(see for example Calomiris and Schweikart 1988). As claims on a bank and not also an individual deposit
account, notes could pass from hand to hand in the course of trade without requiring timely clearing and
settlement.4 They circulated at par locally, because bearers always had the option of presenting them at
the issuing bank’s counter for redemption in specie (Gorton 1996, p. 353).
State bank notes also mediated longer-distance transactions (e.g., Atherton 1971, p. 139; Knodell
1988; Gorton 1996).5 There is no direct information on the extent to which bank notes circulated across
states or across regions. Van Court’s Bank Note Reporter, published in Philadelphia, for example,
published quoted discounts on notes from banks in every state or territory over the 1839-1858 period save

7
6Jay Cooke, for example, got his start as the employee of a note broker (Hammond 1957, pp. 702-3).
7Bank of United States notes however had been redeemable at par at any branch, regardless of the cityof issue. The fact that their value did not decline with distance made them the paper money of choice forlong-distance payments before 1836 (Temin 1969, p. 36).
8Gorton and Mullineaux (1987, pp. 458-459) argue that such secondary market makers had strongincentives to monitor the quality of assets backing bank notes and in turn their price quotations revealedtheir information to buyers and sellers of bank notes.
9New York’s free banking law would institutionalize these arrangements by requiring country banksto maintain a redemption agent in at least one of four urban centers including New York City (Myers1931, p. 105; see for example New York State Banking Department 1859, Table ??). The New York lawserved as the model for the National Currency and Banking Acts discussed below.
10For more detail about antebellum note redemption arrangements, see Redenius (2005).
Iowa, Minnesota, Missouri, and Texas. Gorton (1996, p. 354), relying on qualitative rather than
quantitative evidence, believes antebellum interregional note flows to have been significant.
Note brokers, or “shavers,” in large commercial centers mediated this payments system. They
bought, sold, and/or sent out-of-town or “foreign” notes back to the issuing bank for redemption (see
Hammond 1957, pp. 702-703).6 Out-of-town notes were usually valued at a discount from par or face
value because of the costs involved in returning it to the issuing bank for redemption and the risk that
when it was presented at the counter the issuing bank might refuse to pay for it.7 Their current market
prices were published regularly in bank note reporters.8
Such foreign bank notes were more likely to have been acceptable (not being legal tender) and hence
able to stay in circulation longer if more convenient provision for redemption had been made. Thus,
interior banks began to hold deposits in financial center banks to facilitate note redemption (see
Bodenhorn 2000, pp. 192-193, 197). The Suffolk system, lasting from the mid-1820's to the late 1850's
was the first, if not most (in)famous example of such an arrangement (Bodenhorn 2002; Rolnick et al.
1998; Calomiris and Kahn 1996). It supported the circulation of bank notes at par across virtually all of
New England.9 Western banks (in Ohio and Indiana) similarly had established redemption accounts with
Philadelphia and New York banks by the 1840s (Knodell 1988, p. 297).10

8
11Colwell (1860, p. 5) observed, “Precious metals make up not 5 percent of operations of trade andindustry in this country... All the rest are accomplished by means of credit,” credit here encompassingbanks notes as well as bills and promissory notes.
12Bodenhorn (1992, pp. 594-95; 2000, pp. 176-177) however is rather less celebratory and moreskeptical of Biddle’s claims in this regard than most earlier writers.
Bank notes were cheaper and more convenient to ship than hard money. Indeed, specie was rarely
used in non-local, non-retail transactions (Colwell 1860, pp. 135, 190, 262, 447).11 But there was an
alternative to shipping cash as a means of financing non-local transactions, the use of a credit instrument
such as a bill of exchange. Although it had been the primary instrument in the financing of foreign trade
since early in the colonial period, it had made little inroad into the finance of domestic trade initially
during the early republic. Dealings in non-local domestic or inland bills of exchange were thin to
nonexistent, the province of assorted note brokers and a few state banks.
Under Nicholas Biddle’s leadership, the Second Bank of the United States essentially created the
domestic bill of exchange market and came to dominate this system of interregional payments in the
1820s and early 1830s (Catterall 1902, pp. 138-143; Bodenhorn 1992; Bodenhorn 2000, pp. 168- 177).12
Branches in interior cities were instructed whenever possible to replace local promissory notes with
domestic bills of exchange, “thus tying note issue at those branches to the means of redeeming them at
eastern branches and preserving the liquidity of the Bank as a whole” (Knodell 1998, p.715). As a result,
BUS purchases of domestic exchange rose from less than $6 million in 1820 to almost $70 million by
1833, more than enough to finance the total volume of trade passing through New Orleans from the
Midwest (Bodenhorn 1992, p. 595).
The centralization of payments through the BUS branches yielded significant economies of scale and
scope, which lowered the cost and risk of transferring funds from one location to another (Knodell 1998,
p. 716; 2003). At the branch level, the BUS could utilize more fully its fixed capacity and realize
economies of bulk shipments. For the system as a whole, it could economize on the shipments of reserve
assets between branches through multilateral rather than bilateral net settlement of payments imbalances.
These advantages enabled the Bank to act as a market maker in domestic exchange, reducing and
stabilizing exchange costs.

9
13The domestic bill of exchange operations of the BUS in turn led to a thriving internal draft marketas well, for example (Catterall 1902, pp. 141-42; Hammond 1957, p. 318).
This centralization of the interregional payments system was short-lived, however. The closing of the
interstate branches of the BUS in 1836 ushered in a period of financial disintermediation in interregional
payments (Knodell 1998). Note brokers and private bankers, which had been overshadowed by BUS
operations, became active participants in a more fragmented system of domestic exchanges (Knodell
1998, pp. 717-719; Bodenhorn 2000, pp. 177-185). Individuals needing to make payments in New York,
for example, could buy bills payable there through a broker. Remittance and collection of domestic bills
was again handled by private agents, now interstate networks of private bankers or exchange brokers.
Jane Knodell (1998, p. 717) finds the growth in domestic exchange facilities in Cincinnati and Cleveland
during this period to have been primarily in this ‘unregulated’ sector. Sylla (1976) estimates that by 1860
private banks accounted for almost one-third the number and one-quarter the capital invested in the
banking sector, and domestic exchange operations was one of their principal activities.
Banks also mediated this more open bills market. Country banks routinely discounted their
customers’ bills of exchange drawn on large commercial centers like New York and established
correspondent relations with city banks there to redeem the maturing bills (Hammond 1957, p. 700).
Instead of repatriating the accumulating balances, banks adopted a less costly option of selling the funds
(known in this case as New York exchange) to other local customers who needed to make payments there.
This local market for sight drafts on New York and other centers, thus, complemented the domestic bill of
exchange market and provided customers with an alternative means of making long-distance payments.13
The use of both payments instruments, bank notes and bills, led to accumulations of interbank
balances in financial centers– either for purposes of note redemption or as a source of domestic exchange.
These correspondent bank relationships between smaller country banks holding assets called “due from
other banks” and larger city banks holding liabilities labeled “due to other banks” proliferated after the
1820's (Bodenhorn 2000, pp. 192-198; Redlich 1968, p. 51). Warren Weber (2003) describes the pattern
of such antebellum interbank relationships using a data source which disaggregated the amounts due from
other banks for Pennsylvania creditor banks over the 1850's. He finds that country banks dealt virtually
entirely with banks in financial centers (Philadelphia, New York, Baltimore, or Pittsburgh), the choices of

10
14Myers (1931, pp. 103-125) describes the accumulation of interbank balances in new York in theantebellum period in some detail.
15Such a market was legally possible. A check, being a special form of a bill of exchange, could havebeen passed from endorser to endorser as bills of exchange had in earlier periods. Bills of exchangehowever had usually circulated among the relatively tight-knit community of merchants but for a moregeneral circulation “the country is too extended for the knowledge requisite for this degree of confidence;hence we use more bank notes” (Klein 1911, p. 607).
which were determined by trade patterns. In addition, these relationships were highly stable ones with a
single bank in a particular city.
As New York emerged as the preeminent commercial center, maintaining a New York correspondent
became increasingly important for interior banks. Even in 1835 net bankers’ balances held in New York
amounted to $4.40 million as compared with $2.93 million in Philadelphia and $1.03 million in Boston;
by 1850 that total had risen to $12.51 million vis-à-vis $2.45 million in Philadelphia and $4.17 million in
Boston (Bodenhorn 2000, p. 196). By 1850 almost 600 out of 700 incorporated U.S. banks maintained
New York accounts (Myers 1931, p. 115), with brokers and out-of-town individuals holding about an
equal amount (over $17 million).14 A. B. Johnson, president of the Ontario Branch Bank in Utica, New
York, observed in 1857: “The selling of drafts on New York becomes ... one of the regular sources of
profit to country banks, as well as of convenience to men of business; and every country bank keeps
funds there...” (Johnson 1857, p. 26; quoted in Weber 2003, p. 471).
Although individual deposits as a share of banks’ convertible liabilities steadily increased over the
antebellum period, their circulation was almost exclusively confined to local transactions. This spatial
constraint derives from the greater informational demands of checks drawn on an individual’s (rather than
a bank’s) account. Upon receipt of a check, the payee would have to determine whether the bank upon
which it was drawn would redeem it in specie at par, but also whether the payer had sufficient funds in
his/her account to cover the item. Because the value of checks depended on the latter more idiosyncratic
information, they had to be returned to the issuing bank for redemption rather than sold or transferred in a
secondary market .15
Still, from their inception urban banks were primarily banks of deposit rather than banks of note
issue. Extant systematic data show the value of deposits exceeding that of notes in circulation on balance
11
16“On that day bedlam reigned in the money market; porters with bags of gold dashed from one bankto another, settling accounts. An unfortunate by-product of this system was the possibility of running uplarge balances due to other banks, and lending on the basis of funds belonging to those banks until the endof the week, when the necessity of building up reserves forced the calling of demand loans and sent therates soaring” (Myers 1931, 94-95).
sheets of urban commercial banks as early as 1803 in Boston, 1814 in Philadelphia, 1824 in Baltimore,
and 1831 in New York (Van Fenstermaker 1965, p. 41). To ameliorate the risk of check transactions,
banks in these cities initially deployed messengers each day to present checks to the issuing banks for
collection, although they only settled accounts between themselves less frequently, on Friday mornings in
the case of New York.16 To expedite the clearing and settlement of the growing volume of check
transactions, New York banks followed the London model and organized the New York Clearing House
in 1853. Like the operations of the BUS, the clearinghouse centralized and internalized these interbank
transactions. Each business day morning (10:00am in New York), banks swapped items for collection
and then reckoned the total amounts total due from and due to other members. In the early afternoon
(1:30pm in New York), they settled their accounts through a single transaction with the clearinghouse.
The clearinghouse received payments from net debtor banks in gold (and later legal-tender notes or
reserve deposit at the clearinghouse) and distributed the funds to creditor banks. The multilateral clearing
and settlement of accounts was clearly much more efficient than the bilateral system which it replaced.
Clearing houses were organized in Boston and Philadelphia later in the 1850's and subsequently spread
rapidly to other cities. By 1907 there were clearinghouses in 106 cities (Cannon 1910).
3. The correspondent banking system and interbank balances before and after the Civil War
Since state bank notes circulated at par locally before the Civil War, the substitution of national bank
notes for state-chartered private notes should have had little impact on making local payments. However,
national bank notes were a national currency, acceptable at par anywhere, regardless of the location of the
issuing bank. If state bank notes had constituted the principal means of making antebellum non-local or
interregional payments, the substitution of national for privately issued currency could have had dramatic
consequences for the institutional structure that had developed to intermediate payments at a distance, the
correspondent banking system. To the extent that state bank notes were no longer used as a means of
payment, holding correspondent balances to facilitate note redemption was no longer necessary. The tax
12
17Our data omit postwar state-chartered banks. National banks constituted the great bulk of allchartered banks after the war-- 79 percent in 1865, 85 percent in 1866, 87 percent in 1867 (White 1983, p.12). Since the remaining state-chartered banks were generally small, shares of bank assets would be evenhigher. Private banks do not appear in either the antebellum or postbellum figures.
In view of the dramatic changes in the price level over the decade of the 1860's, it seemed a good ideato put value figures in real terms. We, therefore, report all values in 1914 dollars, based on the Warren-Pearson wholesale price index.
on and subsequent sharp contraction in state bank notes in circulation would have undermined the raison
d’être of the correspondent network based on note redemption. To be sure, the tiered system of reserve
balances under the National Banking Act subsequently gave a new rationale for holding interbank
deposits but the pattern of those interbank relationships may have been transformed significantly from the
antebellum structure.
The first column of Table 1 shows the level of interbank balance holdings (due from banks) of state-
chartered banks outside of New York City for the pre-1862 dates and of national banks outside of New
York City for the postwar period.17 Examining the wartime period, although potentially quite interesting,
might be rather like looking through a glass darkly in view of the effects wartime inflation may have had
on desired real balance holdings and of alterations in the National Banking laws before they took their
final form in 1865 which affected both the numbers and operations of national banks. So, we discretely
jump from the beginning to the end of the war here. The antebellum figures are a compendium of state
reports based on various call dates put together by the Secretary of the Treasury. Since some state reports
might come from seasons when bankers’ balances were high and others when they were low, not much
stock should be put in the precise levels or short-term movements which might be due to compositional
effects. They are probably reasonable indicators of general magnitudes and longer trends nonetheless.
The postbellum figures are consistently measured at the same time of the year (autumn call date).
All this said, we see real values of due from banks, except for some gyration around 1857/58 due to
the panic and a dip in 1865 perhaps due to the still incomplete coverage of the national banking system,
roughly stable in the immediate antebellum and postbellum periods in the upper $50 million range. The
system of interbank balances as a whole seem to have been neither decimated nor greatly stimulated by
the effects of the National Banking Acts and the war (although one should perhaps take into account the

13
18 The Secretary of the Treasury (1863, p. 221) reported almost 20 percent of total due from banksheld by Southern and Southwestern banks in 1860/61. Particular New York banks, notably the PhenixBank, Merchants’ Bank, and the Mechanics’ Bank, were favorites of Southern depositors (Myers 1931, p.111).
19 To be sure, some New England balances were deposited outside New England. Vermont, forexample, allowed some required reserves to have been held as New York balances, while Connecticutbanks held increasing amounts of balances in New York rather than Boston. Massachusetts banks after1858 could count New York balances as required reserves (Myers 1931, pp. 106-110).
20 With the breakdown of Boston’s Southern trade and the consequent sharp depreciation of Bostonexchange many merchants were led to redeem their notes in New York rather than Boston. Massachusettsbank balances in New York increased as a result (Myers 1931, p. 110). During the early stages of thewar, the invasion of Pennsylvania by southern armies also led to a shift of many balances fromPhiladelphia to New York (Myers 1931, p. 111).
21 The first postwar decade or so most probably represented the high point for the directconcentration of correspondent balances in New York. Later in the nineteenth century, a morehierarchical structure developed in which country banks increasingly maintained balances in reserve-cityregional financial centers and banks from those cities in turn held New York accounts. See Redenius(2002).
collapse of the Southern banking system which had held substantial balances in New York).18 Interbank
balances held in New York banks (due to banks), again state-chartered antebellum and national-chartered
postbellum, are shown in column 2, with New York’s share of total due from banks in column 3. These
figures might understate New York’s position in the correspondent system, because we know under the
Suffolk system and its successor, the Bank of Mutual Redemption, banks all over New England held
balances in Boston for note redemption (Myers 1931, p. 109). We take New York’s share of due from
banks held by banks outside New England therefore as an upper bound to its true position.19 These
figures are reported in columns 4 and 5. Before the Civil War New York balances accounted for around
half, more (column 5) or less (column 3), of total interbank balances with the figure rising sharply in
1861/62.20 After the war the New York share was substantially higher– over 80 percent immediately after
the war in the fall of 1865, between two-thirds and three-quarters over the second half of the 1860's.21
To what extent was the increasing centralization on New York simply a result of the tiered reserve
structure of the national banking system? We calculate the excess or discretionary holdings of bankers’
balances above those which satisfied legal reserve requirements. Since bankers’ balances typically paid
interest while vault cash did not, it is usually assumed that country and reserve city banks would have
kept the maximum possible amount of legal reserves (three-fifths for country banks, one-half for reserve

14
22 Legal reserves are calculated as three-fifths (for country banks) or one-half (for reserve city banks)of the total of national bank notes outstanding, individual and government deposits, and net due to banks(due to banks less due from banks) if the latter is positive (Myers 1931, p. 222).
23 Alternatively, we might assume that banks put all their vault assets qualifying as lawful reserves–specie, legal tender notes, and 3 percent Treasury certificates– toward satisfying their reserverequirements with the difference made up by due from national banks holdings. Such a calculation wouldmaximize the amount of bankers’ balances held for discretionary purposes and provide an upper bound totrue discretionary holdings. As it turns out, the upper bounds turned out almost always to be around orabove 100 percent– all due from banks holdings were discretionary rather than for reserve purposes. Thisupper bound seemed to be too high to be that informative, so we limit ourselves here to just consideringthe lower bound figures.
24 New England, where they were roughly stable, being one exception; the Western states, because ofthe anomalous 1865 observation probably due to small sample variation, being another.
25 Weber (2003, pp. 466-468) finds that throughout the 1850's (except 1857, 1858) Philadelphiabanks had virtually nothing due from banks in New York City. The low levels of New York balancesheld, at least initially, by Philadelphia, Boston, and Baltimore banks may therefore have reflected apersistence of antebellum practices. That said however, it is rather puzzling as to why interbankrelationships between Eastern financial centers would have been so weak.
city banks) in the form of bankers’ balances. So we take the difference between total due from banks and
three-fifths or one-half respectively of required reserves as discretionary or excess bankers’ balances.22
This would have been a lower bound to the true proportion of discretionary balances since some banks
might not have held bankers’ balances as the maximum possible proportion of required reserves.23 On the
other, interior banks did need to maintain some balances for note redemption purposes, an offset to the
lower bound of unknown magnitude.
Table 2 presents calculated discretionary balances in levels and as a percentage of total due from
banks, by class (country and reserve city) in panel I and by class by region in panel II. First of all, it is
clear that country banks held balances substantially in excess of those for required reserves. Country
banks as a whole held at least half of total interbank balances above the maximum allowable for required
reserves. Moreover, in most regions the proportion of discretionary balances was rising over time.24
Discretionary interbank holdings of reserve city banks were much lower– until 1868 as a whole reserve
city total due from banks was smaller than the one-half of legal reserves that may have been held as such;
hence calculated discretionary balances were negative. This was due primarily to the low interbank
balance holdings of other Eastern financial center banks– Boston, Philadelphia, and Baltimore (New
England, Middle Atlantic, and Border state regions).25 Even so, the lower proportional holdings of New

15
26 When average due from banks per bank is regressed on average bank size (total assets) in the crosssection (by year, across states for country banks and reserve cities) the estimated coefficient issignificantly negative. In addition, the absolute value of the coefficient increases over time.
27 Another motive for country banks to hold city balances was to earn interest paid on bankers’balances with funds which otherwise may have been idle at home. A regression of the log of due frombanks on a time trend and call date dummies from 1866 to 1869 shows seasonal variation of around 10percent. Thus, even if some 10 percent of interbank deposits represented deposits of temporarily idlefunds to earn interest, some 40 percent of due from banks must have been held to facilitate exchangedealings (since country bank discretionary interbank deposit holdings averaged about half of total duefrom banks. See Table 2).
28 Underlying such an inference is the rather heroic assumption, among others, that the volume ofinterregional commercial activity, and hence the need for exchange, was comparable between theimmediate prewar and postwar periods. Since we don’t have output measures for the immediate postwarperiod, it’s rather difficult to assess its validity.
York balances (reserve city legal reserve balances could only be held in New York) is consistent with
there having been economies of scale in correspondent balance holdings– larger absolute levels of
interbank deposits were likely to have been more stable with inflows roughly balancing outflows, so
larger banks (generally reserve city) could hold proportionally smaller correspondent balances than
smaller (country) banks.26
Substantial proportions of discretionary correspondent balances held by interior banks must therefore
have been associated with dealings in domestic exchange– purchasing bills of exchange or accepting
drafts drawn on, say, New York banks and in turn selling New York funds or drafts drawn on accounts
there. Even with the disappearance of its role in state bank note redemption, the correspondent banking
system did not shrivel away.27 Another way to get at the relative importance of exchange dealings in
holding correspondent balances would be to compare discretionary holdings postwar with total interbank
deposits prewar. Real discretionary due from bank holdings of Midwestern national banks over 1865-69
amounted to 55 percent of real due from banks holdings of Midwestern state banks over 1859-1861.
Non-note redemption, primarily exchange, operations must have accounted for something over half of
antebellum Midwestern banks’ interbank deposits.28 In antebellum New England under the Suffolk
system note redemption was an important function of city correspondent deposits. Pursuing the same
exercise there, we find rather smaller proportions for exchange balances relative to total antebellum due

16
from banks– 29 percent for Maine banks, 45 percent for New Hampshire banks, 20 percent for Vermont
banks.
Now consider the effects on New York City banking structure. A national charter offered little to
New York banks. The attraction of being able to issue national banks notes was small when in
September, 1859 notes outstanding for New York chartered banks amounted to only 10.8 percent of
individual deposits and 8.7 percent of total deposits (individual deposits plus due to banks). Membership
in the national system depended instead primarily on how it would have affected relationships with
correspondents. The original 1863 Act allowed three-fifths of legal reserves to held as balances in
Boston, Providence, New York, Philadelphia, Baltimore, Cincinnati, Chicago, St. Louis, or New Orleans,
while those cities in turn had to maintain 25 percent reserves in their vaults. Thus, New York would not
have been able to hold reserve balances from other financial centers and the flow of balances into the city
would have been limited. As a result, a report to the New York Clearing House urged New York banks
not to participate in the national system, and on February 29, 1864 the Clearing House unanimously
adopted a resolution to refuse exchanges in the Clearing House to all national bank notes (Gische 1979,
pp. 42- 49). The resistance of New York banks in turn made national bank membership less attractive to
interior banks since they would not be able to count balances held in New York banks as part of legal
reserves. The concerted opposition of New York banks then was a significant obstacle to the conversion
of state-chartered banks to national status over 1863 and early 1864.
In the meantime, new national banks began to be organized in New York. By November, 1863 three
had been formed– the First National Bank with a capital of $200,000 organized by John Thompson,
publisher of Thompson’s Bank Note Detector, the Second National Bank with a capital of $300,000, and
the Third National Bank with a capital of $300,000. John Austin Stevens, president of the Bank of
Commerce, the largest bank in the country, had been an early supporter of Samuel Chase and softer
toward the idea of a national banking system than most of his peers. However, the 1863 Act precluded
the conversion of the Bank of Commerce to a national charter because it required double liability of
shareholders while the Bank of Commerce charter specifically limited shareholders to single liability. As
a result of Comptroller of the Currency Hugh McCulloch’s influence, the 1864 Act exempted the Bank of
Commerce by name from the double liability provision of the previous act. Less than a month after the
Act’s passage McCulloch wrote to John Austin Stevens, “Our National Banks in the country and in other

17
Cities are now selecting their correspondents in New York, and the longer the conversion of the Bank of
Commerce is deferred, the fewer valuable accounts will it secure at the start, and the more difficult it will
for it to take that controlling position in the National System of Banking, which with its large capital and
the ability of its managers, it ought to assume.” In addition, banks in redemption, later reserve, cities, as
we have seen, were allowed to keep one-half of their 25 percent required reserves in the form of balances
at New York national banks (Gische 1979, pp. 46-57).
The directors of the Bank of Commerce decided to switch to a national charter in November, 1864.
This conversion led many/most other state-chartered New York banks to follow. In the first quarter of
1865 eight other city banks had gone over, while five more were in the process. The 10 percent tax on
state bank notes passed in spring 1865 did not take effect until July 1, 1866 and seemed unlikely to have
been a prime consideration here. Country banks in turn may have been reluctant to convert until New
York banks had done so, so that they would have been able to hold their legal reserves as bankers’
balances there. However, as we shall see, converted, originally state-chartered, banks later proved to
have been relatively unsuccessful in attracting new correspondent deposits.
Table 3 shows changes in the real value of due to banks accounts of New York banks over the period
spanning the Civil War. A rise in New York due to banks holdings after the war as well as an increase in
the share of total due from banks of interior banks held in New York had been evident in Table 1. In
panel I of Table 3 we see that this was not simply the result of a general expansion of the New York
banking system. The ratio of due to banks relative to individual deposits and relative to total assets both
rise in the postbellum period as shown in columns 2 and 3. Furthermore, these gains did not accrue to
existing banks. Panel II shows the experience of banks that had existed before the war (and subsequently
converted to a national charter). There seems to have been no pronounced increase in the ratio of due to
banks relative to individual deposits or total assets after the war. In contrast, similar figures are shown for
newly chartered national banks in panel III. First note that these banks held almost as many interbank
deposits as those of individuals. Due to banks constituted around a third of total assets for these banks,
while it was only something over 10 percent for banks which dated back to the antebellum period.
Interbank deposits from across the country were not just concentrated in New York relative to other
financial centers, but also highly concentrated within New York banks as well. Margaret Myers (1931,
pp. 116-119) traces a trend toward greater concentration in due to banks holdings from the time of the

18
29 Weber finds, interestingly, that the Philadelphia correspondent banking market in the 1850's wasnot highly concentrated and that entry was easy (2003, p. 466).
30 See, for example, Sprague’s treatment of the Panic of 1873 (1910, pp. 15-35) or a more moderntake in Calomiris and Gorton (1991).
first published reports. By 1847 six out of the fifty-four banks held 63 percent of bankers’ balances in the
city.29 The business of the remaining banks was, in O.M.W. Sprague’s words, “of a purely local
character, having no more general significance than that of banks with an equal volume of business in
Maine or Kentucky” (1910, p. 15).
The concentration of interbank balances has been traditionally associated with the payment of interest
on those balances by some New York banks (it did not seem to have been a general practice at the time).
Such interest payments was viewed with disapproval by most bankers and by the banking theory of the
time. Drawing more “idle” balances to New York made those city banks more vulnerable to sudden and
large withdrawals by interior banks, seasonally and especially during times of financial stringency. In
addition, interest-paying banks had to find assets to hold which paid reasonably high returns. Most banks
favored stock-exchange loans and call loans in particular, which were regarded as particularly liquid.
Thus, banks holding large amounts of bankers’ balances faced greater withdrawal risks on the one hand
and also greater risk of negative shocks to the value of their asset portfolio through stock market
fluctuations on the other.30 In the aftermath of the Panic of 1857 the New York Clearing House
considered but rejected a ban on interest payments because of the opposition of six out of the forty-six
members. While not identified, it would seem a reasonable guess that they were the six banks paying
interest at the time (Myers, 1931, pp. 123-124). The Comptroller of the Currency in his 1866 report (p.
viii), for example, observed that New York City banks “should be the most conservative of all banks.
They should not be allowed to jeopardize the funds of country banks by loaning them for speculation, and
they would not, if they were not obliged to pay interest on them.” He urged Congress to ban national
banks paying interest on bank balances, but that did not happen.
This change in the nature of the New York bankers’ balance market is reflected in Table 4 in three
measures of concentration– the Gini coefficient and the shares of the total held in the top seven and top
19
31 We choose seven as well as the more traditional ten because Sprague (1910, pp. 16-17) focuses onthe seven banks with the largest due to banks holdings in his discussion of the Panic of 1873.
ten banks-- all of which show a similar pattern.31 There is a sharp increase in concentration from the
immediate prewar to the immediate postwar and then the indexes drift downward, but by the end of the
decade still remain higher than antebellum levels. The national banking laws appeared to increase overall
concentration levels among New York banks rather modestly.
We examine the compositional changes underlying the aggregate concentration levels in Table 5,
which lists the ten banks with the largest holdings of due to banks in order at three year intervals over the
1860's. Note first of all the increasing specialization within the New York banking system. In 1860 only
two of the top ten interbank-balance-holding banks had due to banks levels greater than those of deposits
due individuals; by 1869, six of the top ten did. Note also that five of the top ten banks in 1866 and 1869–
the First, Third, Fourth, Ninth, and Central National Banks– were newly organized national banks, all of
which paid interest on deposits (Sprague, 1910, p. 15). Indeed, all of them seemed to have been designed
to be bankers’ banks, with due to banks holdings greater than individual deposits (except for the Fourth
National Bank, for which the ratio was around two-thirds or three-fourths). A sixth bankers’ bank, the
Importers’ and Traders’, did date back to the antebellum period, but experienced a remarkable sixty-fold
increase in real due to banks over the decade, presumably associated with paying interest on deposits.
The payment of deposit interest alone however does not seem to have been sufficient for success in
the competition for interbank deposits. After all, the leading bankers’ balance holders in 1860 all paid
interest. Of those, only the leader, the Park Bank, maintained its position over the decade, and even so
showed no pronounced longer-term increase in the ratio of bankers’ to individual deposits
(notwithstanding the blip in 1866). Other leaders of 1860, such as the American Exchange, the
Mercantile, and the Mechanics’ Banks, maintained more or less stable bankers’-individual deposit ratios,
but found their relative position fading. Only the Metropolitan Bank experienced a dramatic decline, with
the real value of its bankers’ balances halving over the decade. Apparently there may have been some
first-mover advantage in the bankers’ balance market. Existing banks generally were able to hold on to
their existing balances, but newly chartered national banks seemed to have had an advantage in the
competition for country bank accounts. Between July 1863 and March 1864 ten newly-organized

20
32In his manual on Practical Banking, for example, Albert Bolles (1888, pp. 130-36) then editor ofBankers’ Magazine noted the parallel between the domestic and foreign exchange markets and, in fact,explained exchange rate fluctuations in terms of domestic rather than foreign exchange transactions.
national banks began operations in New York. By October 1864 four of them (the First, the Fourth, the
Ninth, and the Central National Banks) already had more almost $5.7 million (real) in bankers’ balances.
The Bank of Commerce, lured to convert to get in the competition for correspondents, did not begin
operations as a national bank until January 13, 1865 (Gische 1979, p. 57), and nevertheless found its
status slipping over the last half of the decade. Other state-chartered banks which converted to national
status shortly thereafter also never really seemed to have been in the game for new interior banks’
business even though the total number of national banks was increasing from 467 in 1864 to 1,294 in
1865 to 1,634 in 1866. And if, following Weber’s observation (2003), correspondent relationships were
very stable, the pattern of interbank relationships established at this time would have persisted for decades
to come.
This restructuring of the New York bankers’ balance market was reflected to a lesser extent in the
rankings of banks by total assets appearing in Table 6. In 1866 three of the ten largest New York national
banks– the Fourth, the Central, and the Ninth National Banks– were newly organized, and all of them
held substantial amounts of bankers’ balances. In both 1866 and 1869 three of the ten had due to banks in
excess of individual deposits (as opposed to one, the Park, in 1860 and 1863). Some banks however were
able to stay relatively large without participating in the interbank balance market. The Bank of New York
and the Union National Bank, for example, held virtually no interbank deposits.
4. The domestic exchange market
To assess the impact of the National Banking Acts and other Civil War policies on payments system
integration, we analyze the market for domestic exchange before and after the Civil War. The domestic
counterpart to the foreign exchange market, the domestic exchange market furnished agents with an
alternative means of making long-distance, domestic payments.32 Instead of shipping specie or currency,
they could purchase a draft (or check) drawn on their bank’s correspondent account in a distant
commercial center, say New York. In settling their accounts in New York, then, they would remit a
payments instrument that New York sellers could readily deposit or cash at local bank.
21
33See Gische 1979. Our preliminary research into the minutes of the New York Clearing HouseAssociation meetings affirms the resistance of incumbent banks to entry by new national banks.
The decision to purchase a draft versus ship legal tender or its equivalent depended, of course, on the
relative costs and risks of each. The National Banking Act(s) directly altered this economic calculus by
creating a truly national paper currency, one whose value did not decay with increasing distance from the
issuing bank. Thus, like their state bank counterparts, national bank notes afforded buyers a lower cost
means of remitting funds to distant commercial centers relative to specie shipments. But unlike state bank
notes, they did not subject sellers at these locations to market and default risks. Thus, the NBA at least in
principle greased the wheels of the long-distance payments system and hence long-distance trade.
All other things being equal, this abstract logic implies that National Banking Act should have led to
the demise or at least the decline of the domestic exchange market and hence of correspondent banking.
Indeed, large New York correspondents feared this outcome and, as noted above, staunchly opposed the
NBA.33 Although we lack the data on flows of interregional payments to test this hypothesis, indirect
evidence suggests that domestic exchange market flourished, not faded, during the early postbellum
period. Country banks continued to accumulate correspondent balances in New York, which in turn they
sold customers to make long distant payments. Moreover, over time these balances would account for an
increasing share of the assets of country national banks and of the liabilities of New York correspondent
banks (James and Weiman 2004; Watkins 1929).
Obviously, all other things, in particular the terms of trade in the domestic exchange market, did not
remain constant. Extending the parallel to the foreign exchange market, we measure the price of domestic
exchange as the premium or discount on non-local funds relative to par. Consider, for example, the
purchase of $1,000 of New York funds in Chicago and New Orleans in early April 1859. Because the
domestic exchanges constituted a fixed exchange rate system with mint parity equal to one, the par value
of New York funds was $1,000 in each city. In Chicago at this time, however, New York funds
commanded a premium of 1.5% and so sold for $1,015. In New Orleans, by contrast, they were sold at a
discount of 1/8% and so cost only $998.75. As in the foreign exchange market, these deviations from par
were bounded by the cost of shipping specie or its equivalent, that is specie shipping points.

22
Domestic exchange rates varied not only across space but also over time. At any location they
depended on the prevailing conditions of supply and demand in the market for non-local (e.g., New York)
funds. In commercial centers with specialized agricultural hinterlands, like Chicago and New Orleans,
the price of New York funds fluctuated over the course of the year with the strong seasonal shifts in trade
flows and resulting balance of payments. During the spring planting season when farm households and so
local merchants stocked their shelves with goods purchased from New York jobbers, the demand for New
York exchange and hence exchange rates surged. After the fall harvest season and the sale of crops via
New York brokers, balances held in New York banks were replenished and were sold at lower prices,
even at discounts.
Following the disruption to the domestic payments system occasioned by Jackson’s veto of the
Second Bank of the United States and the ensuing bank panics in 1837 and 1839, domestic exchange rates
fell sharply over the late antebellum and postbellum periods. Between February 1839 (a non-suspension
date) and 1850, the price of New York funds in Cincinnati declined from a premium of 2.5 to 0.70
percent. And by 1892 the average rate on New York exchange charged by Ohio national banks was a
mere 0.02 percent (Elliot 1968 [1845], p. 1170; Knodell 1998, p. 720; U.S. Comptroller of the Currency
1892, p. 30). The Comptroller of the Currency noted this dramatic decline in exchange rates in 1878 and
again in 1890 (U.S. Comptroller of the Currency 1878, p. xxv; 1890, p. 21). According to the latter
report, the decline in exchange rates since 1859 yielded annual savings in transactions costs of over $100
million.
Despite the creation of a single national currency and the sharp fall in domestic exchange rates over
the latter half of the nineteenth century, the U.S. was not a completely unified payments system,
characterized by uniform terms of payment regardless of geographic location. Indeed, this condition
would not be fully realized until the founding of the Federal Reserve System, which mandated “par
clearing” (Weiman and James 2005, pp. 128-30; Jessup 1967). In fact, we should not really expect to see
the convergence of market (rather than administered) exchange rates to par (i.e., a zero discount or
premium), except under very specific conditions of trade and capital flows. For example, by the end of
the century, the major centers of the Northeast constituted a par settlement region because of their dense
reciprocal trade and financial interactions. By contrast, in developing regions, the combination of chronic

23
34 For Chicago, we collected weekly data through 1860 and monthly data thereafter. The prewar datacame from a single article that reviewed historical market data for Chicago including domestic exchangerates. It typically lists four rates per month at different days of the week for each month. The post-1860data are for the first business day of the month. For New Orleans we collected weekly data from theSaturday morning issue. From the text of the reports, we infer that the rates are indicative of thoseprevailing at the end of the week. We are also collecting data from the Boston and Charleston marketsand will likely expand the sample to include Cincinnati and St. Louis.
trade deficits and spatially segmented capital markets resulted in persistent but small premiums on New
York exchange throughout the postbellum period (James 1998; James and Weiman 2004).
The growth of long-distance domestic trade and hence the formation of a truly national market did not
require complete uniformity in the terms of payments such as par clearing or settlement. A necessary
condition for what we call payments system integration is the greater standardization and predictability in
the terms of payment. When buyers remitted a credit instrument such as a bank note or a sight draft
rather than specie in making a long-distance payment, sellers only needed to know with reasonable
certainty the value of the instrument – the credibility and accessibility of the lender, the timing of final
settlement and hence float costs, and other explicit transactions costs. These criteria imply a more
standardized means of payment with lower default and liquidity risks.
For evidence on the properties of and rates on domestic sight drafts before and after the Civil War, we
collected data from newspaper reports in three regional centers, two in the south (Charleston and New
Orleans) and one in the midwest (Chicago) for dates before and after the Civil War.34 By way of
illustration, we reproduce the daily reports from the Charleston Courier (for September 18, 1857) and the
New Orleans Price-Current (for October 2, 1858) in Figures 1 and 2. As the two items clearly show,
newspapers recorded this information in a more or less systematic fashion. The Charleston report simply
listed the different instruments for the purchase and sale of foreign and domestic exchange and prevailing
rates. In more narrative fashion, the New Orleans item describes prevailing market conditions (“The
market is very plentifully supplied ...”) and the range of rates on the various instruments.
A comparison of the reports before and after the Civil War establish one condition for payments
system integration, namely the greater standardization of payments instruments and means of payment.
Consider first the antebellum market in Charleston (see Figure 1). Before the Civil War, intermediaries
could buy and sell domestic exchange in a variety of forms and locations. On the buy side, the demand
for domestic exchange was limited to correspondent balances in New York. Still, agents had numerous
24
35Our analysis of the New Orleans market draws on reports over the entire period. We selected thereport on October 2, 1858, because it contained data on a wider range of instruments transacted. Additional information and quotations are taken from reports on the following dates: January 1, 1859;April 30, 1859; and May 7, 1859.
options in the form of instruments of varying maturities. They could buy a sight draft, that is a check
drawn on a New York correspondent bank, which at this date sold at par. But, if they did not demand
“immediacy,” they could opt for what were referred to as “short” sight bills with maturities of less than a
month and pay a slight discount of c-d %. Also, the report records the price of the standard trade credit
instrument, the 60-day bill of exchange, which sold at a higher discount incorporating both exchange and
interest rates.
The “supply” side lists only two generic instruments – foreign bills and domestic checks. Still, the
market was characterized by heterogeneity in the spatial location of the funds. Charleston agents, it
seems, had accumulated balances in several northeastern commercial centers – Boston, Philadelphia,
Baltimore as well as New York – presumably through the sale of (e.g.) cotton and rice exports. In turn,
they sold these balances to factors and merchants who needed the funds to make purchases in these
markets. The rates, it is interesting to note, were the same regardless of the location of the funds. Thus,
while banks and other intermediaries seemed to concentrate their correspondent balances in New York
and hence only sold New York exchange, their New York agents would clear and settle checks drawn on
banks in other northeastern cities on the same terms as New York checks.
According to the New Orleans report (see Figure 2), the domestic exchange market also supported
transactions in various time and sight instruments.35 Like in Charleston, the basic time instrument was the
60-day bill, in this case drawn “on the North” which meant “New York, Boston, etc.” Although the
reports infrequently mention rates on shorter maturities (30- and even 40-day bills), they most frequently
quoted the prices on different qualities of the standard instrument. In particular, a bill drawn on “A.1.
New-York drawers” typically sold at higher prices than those with other signatures, for example 1c%
discount versus 1¼ to 2% discount.
The market for sight funds included bank checks but also bills of varying qualities (“banker’s” versus
“outside” bills) and maturities (“short sight” bills payable in 5 to 15 days). Like in Charleston, we also
find evidence, albeit indirect, of two distinct but related funds markets – one directly mediated by banks

25
36We do not have direct evidence on the organization of the “outside” market, but presume that itcomprised note brokers and private bankers trading in bills (see Bodenhorn 2000, pp. 177-85).
37To illustrate, we report market quotations from January 1, 1859. Banker’s and “out of door” billssold at ¾% discount, while “Banks were sellers at 5/8% discount.” Like Knodell (1998, 2004), wemaintain that internalization of payments in the banking system yielded significant economies of scaleand scope. The higher rates on bank-mediated transactions could also be evidence of banks’ higher costsor market power (see Gorton and Mullineaux 1987; Kahn and Roberds 1999; Bodenhorn 2000, pp. 177-85). We cannot entirely reject this view. Still, applying the logic of the survivor test, we would expect tosee the decline in banks’ exchange business. Yet, from reports on banks’ balance sheets in theWednesday issue of the Price Current, their exchange assets, that is New York balances, increased from$7.0 to $8.6 million between early April 1857 to early April 1860. We view this trend as indirectevidence of an increasing, not decreasing, relative demand for bank-mediated payments services,especially as early April was a peak demand period in the exchange market (see Figure 6).
and an open, curb (“out of door”) market.36 Reports for other weeks indicate transactions in two bank
instruments – bank checks and banker’s bills. The former, we are occasionally told, were sold at the bank
office to meet the “counter demand.” They uniformly commanded higher prices than banker’s bills – that
is discounts lower and premiums higher in absolute value. In the reports banker’s bills were lumped
together with other “outside” bills and so were also presumably sold in the open market. The evidence, in
other words, suggests greater demand for and, we presume, higher quality of funds supplied directly by
banks rather than in the open market.37
Compared to those for the late antebellum period, the reports from November 1872 show a striking
convergence or standardization of the domestic exchange market along two dimensions: maturity and
location. In the Charleston market (see Figure 3) transactions were confined to a single instrument, New
York sight drafts. Like Charleston, the New Orleans market (see Figure 4) included sight drafts sold by
“banks checking on New York,” but also sight bills sold in the open or “commercial” market. Thus,
consistent with other evidence on shifts in commercial practices and banks’ balance sheets over the Civil
War divide, we see signs of a waning, if not moribund, market for bills of exchange, or two-name paper
(see section 5). Additionally, by this date New York banks – rather than other New York intermediaries
(i.e., drawers or payers on bills) and banks in other commercial cities – thoroughly dominated the
exchange market.
According to this qualitative evidence, the domestic exchange market in the early postbellum period
satisfied a vital criterion for payments system integration. Paralleling the creation of a uniform national
currency was the crystallization of New York balances as the means of long-distance payments. Balances

26
lodged with a New York correspondent had, in effect, become synonymous with “domestic exchange,”
and in fact contemporaries used the two terms interchangeably.
Under these conditions, sellers could expect to receive payment via a single, reliable, and liquid
instrument, a bank draft backed by clearing balances held in the largest New York banks. This
transformation did, however, shift the market risk onto buyers. Unlike in the antebellum period when
sellers in commercial centers received payment in instruments whose market rather than par value was
uncertain – non-local state bank notes and bills of exchange – now buyers had to purchase domestic
exchange from banks or in the “commercial” market and so faced a similar kind of price risk. So in
addition to the level of exchange rates relative to the cost of shipping national bank notes, buyers also had
to gauge the degree of uncertainty in or liquidity of local domestic exchange markets.
We gauge this risk by the variation in the price of domestic exchange in two preeminent regional
centers, Chicago and New Orleans. Figure 5 graphs domestic exchange rates in Chicago before and after
the Civil War. The rate measures the percentage premium or discount which Chicago banks charged their
retail customers for over-the-counter transactions in New York exchange. The data run weekly through
1860 and monthly thereafter. The graphs omit the extreme values during the Panic of 1857 and the onset
of the Civil War, which would otherwise skew the scale.
The top graph in Figure 5 covers the entire period and shows sharp, successive declines in exchange
rates. Before the war rates ranged from a premium of 1.0 to 1.5%. They rose rapidly in November 1860
after Lincoln’s election and remained very high (touching 10 % several times) through the first half of
1861. They then dropped in three discrete steps of diminishing magnitude (see the bottom graph in
Figure 5 for a more detailed look and Table 7). In the first and largest step rates fell in late 1861 by 75 to
80 percent to around ¼ % premium. They dropped further to around c% in mid-1864 and then to only
1/10% at the end of 1865, where they stayed for the rest of the decade. So, normal (non- financial crisis)
exchange rates declined by more than ten-fold from the late 1850's to the late 1860's, and the largest
decline occurred during the Civil War era itself.
For New Orleans we graph weekly retail or counter rates on New York exchange for discrete periods
before and after the Civil War, September 1856 through August 1860 and September 1868 through
August 1873 (see Figure 6). Like in the Chicago case we truncate the graph to avoid the extreme values
during the Panic of 1857. The New Orleans rates exhibit a similar but less striking downward trend.
27
38An extension of our simple example from Chicago illustrates the point. If rates increased by 10basis points, then agents would incur an additional $1 in costs in purchasing $1000 of exchange. Thischange would correspond to a 7 percent increase in average rates in the late 1850's, but a 150 percentincrease in the late 1860's.
Excluding the panic years, rates averaged a discount of around -0.09 % before the Civil War. From 1868
to 1873 New York funds commanded on average a small premium of 0.06 %.
Both markets vividly illustrate our point about trends in domestic exchange rates. While magnitudes
do decline over time by over 90 percent in Chicago and 40 percent in New Orleans, they show no
tendency to converge to par or a zero discount or premium. Instead, in both markets rates fluctuate
seasonally between par and a 0.1% premium in Chicago and between a discount of -0.25% and a
premium of 0.375 % in New Orleans.
More important for our argument, the variation in and hence uncertainty over rates declines
significantly over period (see Table 7). We measure the variation in exchange rates by the standard
deviation, because agents would be more concerned about level, not percentage, changes.38 In Chicago
the standard deviation in exchange rates falls from 51 to 5 basis points, or by 90 percent, between the late
1850's and late 1860's. Excluding the panic years, the variation in rates in New Orleans drops by 80
percent, from 52 to 11 basis points. These magnitudes, in fact, overstate the variability and hence
uncertainty in rates, as rates in both markets fluctuated in discrete, predictable ways. In New Orleans, for
example, during the spring and summer months rates remained rather constant at the seasonal peak of
0.375%. And in the winter months they fluctuated narrowly around their average seasonal low of -0.25%.
Thus, despite the fluctuations in rates, merchants could accurately predict seasonal rates and so adjust
their prices accordingly.
Two alternative but related hypotheses have been advanced to explain the declining variability in
domestic exchange rates. Both emphasize the narrowing of the specie points in the domestic exchange
market but for different reasons. Garbade and Silber (1979) emphasize exogenous technological-
organizational factors that fueled rapid productivity growth in the rail transport sector. The resulting
decline in railroad freight rates would lower the specie shipping points in the domestic exchange market
and hence the variability of domestic exchange rates. For Philips and Swamy (1998), the passage of the
National Currency and Banking Acts was the more decisive factor, as it effectively substituted paper bank
28
39 Garbade and Silber (1979, p. 15) cite an 1868 American Express circular quoting charges of $1.00per $1,000.00 for shipping currency, while the rate for gold was $1.50. If the cost of shipping currencyhowever was indeed only a third less than that for specie, then something of a puzzle remains inexplaining the magnitude of the decline in exchange rates over the war.
notes for gold as good funds in the final settlement of transactions. Since currency shipping costs were
significantly lower than those for specie, the diffusion of national bank notes would have reduced the
currency shipping points (analogous to gold points) and thereby the bounds within which spot exchange
rates could fluctuate.39
Neither explanation is entirely consistent with our evidence on the variability of Chicago and New
Orleans exchange rates. Consider first the Garbade-Silber view in light of the trends in the Chicago
market. The discrete drops in and exchange rate levels and variability may cast doubt on the impact of
transport costs due to productivity growth. According to Fishlow’s estimates, total factor productivity in
the railroad sector did grow more than twice as fast in the 1860s than in the succeeding four decades, at
an annual average rate of 4.5 versus 2.1 percent (1966, pp. 626-36). He attributes this rapid productivity
growth mainly to greater capacity utilization because of the expansion of demand for railroad services
during the Civil War era. As evidence, he notes the dramatic 50 percent drop in the capital-output ratio.
Still, his estimates of real freight rates show that these benefits were not immediately passed on to
consumers. Relative to 1859 levels, average rates fell by only 15% during the 1860s versus 40 percent in
the 1870s. The graphs in Figure 7 corroborate the point. They show real freight rates for three main east-
west trunk lines between 1860 and 1885 (Shannon 1945, pp. 296-97). Strikingly, freight like exchange
rates fell in successive steps, but the timing is off. The initial sharp drop in exchange rates preceded the
decline in transport costs, which occurred between 1862 and 1864. Moreover, freight rates remained
relatively stable until the end of the decade, whereas exchange rate levels and variability declined two
more times (see Table 7).
The alternative view confronts the same empirical anomaly. The first sharp decline in the Chicago
domestic exchange market occurred in late 1861 and so preceded by two years the passage of the National
Banking Act and, a fortiori, the diffusion of national bank notes. As a variation on this theme, we
observe that the Treasury Department issued $60 million of transferrable notes in July 1861 and an initial
$150 million of legal tender notes (greenbacks) in February 1862. These monetary policy rather than

29
40 Unlike Chicago however, the city had only two national banks over the period 1867 through 1870(U.S. Comptroller of the Currency 1867, p. 393; 1870, p. 383). Although there was some turnover duringthis short horizon, the total value of outstanding local bank note issues remained roughly constant at $1.1million.
banking innovations could have furnished the domestic exchange market with a more portable settlement
media, especially since greenbacks were legal tender.
To explain the second drop in the New York exchange rate in mid-1864, we might consider the
growth of national banking in Chicago. At the outbreak of the Civil War Chicago had no incorporated
commercial banks (although some eighty-six banking offices of various kinds). It had only one national
bank (the First National) at the beginning of 1864 and added seven more over the course of year (James
1938, pp. 338, 351). This innovation in the banking sector could explain the 1864 decline, if the rapid
growth in national banking increased the supply and use of national bank notes in interregional
shipments.
In the case of New Orleans we see a similar, but less dramatic drop in exchange rate variability over
the Civil War. The standard deviation (excluding panic periods) declines from antebellum levels of 52
basis points to 30 in the September 1868 to February 1870 period (Table 7).40 Then, in the early 1870's
there is another decrease from 30 to 11 basis points (see below).
In support of their hypothesis Philips and Swamy cite the authority of the Comptroller of the
Currency, who in 1890 (p. 21) attributed the sharp decline in exchange rates to the National Currency and
Banking Acts. We do not entirely disagree with their view but in the end put more weight on the
monetary and banking policy innovations that affected the structure of the banking system rather than the
regulation of bank note issues. The spread of legal tender paper currency or its equivalent may have
spurred the initial decline in exchange rate levels and variability in the Chicago market, but its
inflationary effects also transformed the payments system by embedding it more directly within the
banking system rather than in an open market. As promissory notes and bank drafts replaced bills of
exchange as means of credit and payment, banks more directly mediated the market for short-term trade
credit and corresponding payments instruments. If we can take the qualitative evidence in the weekly
reports on the exchange market, then this change in New Orleans occurred abruptly in mid-February
1869. After this date the newspaper reports no longer list rates on 30- and 60-day bills of exchange and
30
41 By rights, the endorser should have been the other party in a commercial transaction. But overtime the suspicion grew that more and more of such loans were in reality “accommodation paper,” notbased on specific transactions.
on shorter term sight bills that were commonly traded in the more market-based antebellum payments
system.
The internalization of payments within the banking system was a necessary but not sufficient
condition for greater payments system integration. The other critical ingredient was the hierarchical
organization and hence greater administrative coordination of payments flows through central reserve or
correspondent banks. Here we can now see the powerful but indirect effect of the National Banking Act,
which promoted the concentration of correspondent balances in New York (see Table 3 and 4). As a
result, New York exchange or funds became the standard means of payment for buyers and sellers
regardless of their location, as long as their banks maintained a New York correspondent which most did.
And because of the increasing centralization of correspondent relations and balances among a handful of
large New York banks, they could more effectively coordinate the vast flows of payments instruments
and insure the greater liquidity of bankers’ balances (see also James and Weiman 2004).
5. The Path Not Taken: Bankers’ Acceptances
The inland bill of exchange, otherwise known as a trade acceptance, was, as we noted, primarily the
creation of the Second Bank of the United States. Trade acceptances arose out of specific commercial
transactions in which the drawer of the bill (payee) forwarded the bill to the payer or his/her agent who
wrote “accepted” over its face and signed it. This two-name negotiable instrument was known as an
“acceptance” with the payer as the “acceptor.” The drawer then could take the acceptance to his/her local
bank for discount, and the bank in turn would arrange collection of the bill from the drawee. After the
demise of the Second Bank, in the later antebellum period, the promissory note, eclipsed by the trade
acceptance under the BUS, revived. While a trade acceptance or bill was in principle rooted in a specific
transaction and hence self-liquidating, promissory notes were based on the personal security of the maker,
in the antebellum period usually endorsed by a second party (two-name paper) or secured by collateral.41
Someone making an interregional payment in a commercial transaction would first secure local funds by
discounting a promissory note at his/her bank and then purchase funds where the payment was due

31
42 Lyman Gage, ex-Secretary of the Treasury and president of the First National Bank of Chicago,recalled however that in antebellum Chicago wholesalers and jobbers settled their accounts by bothacceptances and notes, with more weight to the latter (Klein 1911, p. 528). Other writers went still furtherin emphasizing the relative importance of antebellum promissory notes. J. S. Gibbons, for example, in hisstudy of the banks of New York in 1857, wrote “commerce in its broadest sense is carried on bypromissory notes” (1858, p. 214). J.J. Klein cites an alleged prevalence of notes in New Orleans and seesa decline in domestic bills of exchange, displaced in payments by abundant private bank notes (1911, pp.443, 529) .
43 While time bills of exchange (e.g., sixty day) were typically quoted in antebellum newspapers, inthe postbellum period only sight rates (New York exchange) appeared.
44 Wesley C. Mitchell (1903, pp. 374-375) observed of the wartime period: “Men realized theirinability to foresee the future and, knowing that it might bring great price fluctuations in either direction,sought protection against these changes by limiting their future pecuniary obligations as much aspossible... When no one could foresee with confidence what would be the relative purchasing power of adollar three months in advance, it was obviously risky for a merchant to accept a note due in ninety daysfor goods sold, or to give such a note due in ninety days for goods bought. Consequently, cash balancesincreased in importance and credit operations diminished.”
45 See also Commercial and Financial Chronicle, 1865, Vol. I, p. 325.
through the domestic exchange market in contrast to accepting a bill, which bundled the credit and
exchange functions together.
Trade acceptances did not disappear along with the Second Bank. Margaret Myers (1931, p. 203)
claims that in 1846 trade acceptances were still quite popular and in about the same volume as promissory
notes in New York.42 Bodenhorn (2000, pp. 183-185, 210-211) also emphasizes the use of bills in the
finance of antebellum trade and finds them in widespread use in the years before the Civil War. Trade
acceptances, as well as their promissory note counterparts, double-name paper, however were casualties
of the Civil War.43 Inflation and uncertainty discouraged the more leisurely and longer-term credit
arrangements of the antebellum period (see Myers 1931, pp. 52-55) and encouraged cash settlement
instead.44 Sellers, reluctant to make longer-term contracts in fixed dollar terms, reduced the length of
credit terms and offered substantial discounts for cash, 13 to 18 percent per annum, while buyers, whose
real debts had been in turn been reduced by inflation, were better able to pay cash (Klein 1912, pp. 44-47;
Greef 1938, p. 70; Porter and Livesay 1971, pp. 126-127). The Secretary of the Treasury in his 1865
report observed, for example: “It is undoubtedly true that trade is carried on much more largely for cash
than was ever the case previous to 1861, and that there is a much greater proper demand for money than
there would be if sales were made, as heretofore, on credit” (p. 11).45

32
46 Perhaps, in view of the continual postbellum controversies about the appropriate monetarystandard and price level with the Greenbackers and the Free Silver movement, substantial uncertaintiesstill remained in peacetime for both buyers and sellers. But one would probably not have expecteddramatic changes over the immediate three to six months that the older credit arrangements would haverun. The reason that the status quo ante bellum was not restored is a bit of a puzzle.
47 The precise timing of this shift however is unclear. Klein (1912, p. 46) found single- and double-name open-market paper to have been “about evenly divided at the end of the Civil War. But Greef(1938, p. 67) cited New York and Boston dealers to the effect that open-market paper was predominantlytwo-name until around 1885.
Changes in the distribution system reinforced this trend. Rather than making periodic buying trips toEastern cities, local merchants were increasingly serviced by traveling salesmen. Purchases becamesmaller and more frequent, less suited to finance by bills of exchange or endorsed paper (Greef 1938, pp.72-73).
Even though wartime inflation was short-lived, the cash discount system which it had given rise to
became, somewhat curiously as inflation gave way to deflation,46 the established commercial practice in
the postbellum era. Buyers wanting to take advantage of the cash discount would take their notes to their
bank for discount. Among antebellum promissory notes, the endorsed, or two-name, form had been
dominant, with some single-name paper emerging in the decade or so before the war (Greef 1938, p. 30).
But such two-name endorsed paper was increasingly displaced by single-name unsecured paper.47 The
cash discount system made it more attractive for agents to borrow in anticipation of meeting their
obligations, and this was more often accomplished by issuing a single-name promissory note. In 1886,
the first year in which the categories were distinguished, the Comptroller of the Currency found two-
name paper down to about half of New York and country national bank loan and discount portfolios, with
that proportion falling to one-fifth for New York banks and one-third for country banks by 1900 (Myers
1931, pp. 322-323). A similar, but even more dramatic, decline befell the trade acceptance, which was
said to have been used in no more than 3 percent of domestic credit transactions by the end of the century
(Klein 1911, p. 126). Paralleling the replacement of two-name by one-name instruments was the
evolution of dealer organization in which the antebellum system of note or bill brokers gave way to the
commercial paper houses of the later nineteenth-century (Greef 1938, pp. 64-65).
The evolution from a commercial credit system based on financing specific transactions to one in
which the provision of credit based on more generalized financial reputation or condition might be seem
to have been an advance toward more a sophisticated system, but there were some downsides. Even
though the commercial paper market flourished in late nineteenth-century, overall the market for

33
48 To be sure, city banks would sometimes rediscount paper of country correspondents which neededthe money, but it was not until the Federal Reserve system that rediscounting become more generallypracticed.
negotiable instruments may have become less liquid. Access to the open market, since the instrument,
single-name paper, was unendorsed, was essentially limited to relatively large firms with financial
reputations beyond reproach. Even so, there was no secondary market in commercial paper– it almost
always had to be held until maturity.48 Bills of exchange or endorsed paper could have been resold
through brokers, but there was no such market in single-name paper. As the options in turning paper into
cash before maturity became much more limited for holders, so also did choices for makers in originating
paper become more constricted as well. Smaller and less well known borrowers could only then discount
their single-name promissory note with their local bank. As the market moved away from two-name bills
and notes, financing options for the average borrower most probably became narrower. While the open
market in commercial paper opened up more possibilities for larger firms in borrowing, the credit market
for more average borrowers probably became more fragmented.
The road not taken in American commercial credit was the bankers’ acceptance. If a bill of exchange
had been accepted by a bank rather than by the payer, the instrument became known as a bankers’
acceptance. Often bank customers would have in effect lines of credit under which their bank stood ready
to accept their bills up to an amount agreed upon in advance. The bill then became an unconditional
liability of the accepting bank and was thus backed or guaranteed by its reputation rather than just the
seller’s as in a commercial transaction. If the accepting bank was well known and established, as
Lawrence Jacobs in his report to the National Monetary Commission noted, the result was “a practical
uniformity of security” (1910, p. 5). This uniformity of security allowed the acceptance to be easily resold
in a broad and active public discount market. “Through the addition of the banker’s signature the
question of the maker’s credit is eliminated and the note, instead of being a mere evidence of an advance,
is transformed into a standard investment [which] commands the broadest possible market” (Warburg
1910, p. 7). Bankers’ bills underlay the discount markets of London, Paris, and Berlin, where discount
rates were quite stable and funds moved freely between countries (see Warburg 1910; Jacobs 1910, pp. 6-
7).
34
49 Laughlin (1912, p. 94) provides a list of the relevant court cases.
50 Jacobs observes, “Foreign banks will not purchase it [U.S. commercial paper] because they are notacquainted with or sure of the rating of miscellaneous mercantile establishments and because such papercould not be readily disposed of in case it became necessary or profitable to withdraw funds from NewYork for remittance elsewhere” (1910, p. 9).
In the postbellum United States national banks were barred from accepting bills. Though not
specifically prohibited by the National Banking Acts, courts ruled that national banks could not legally
exercise any powers not explicitly granted, and accepting bills was not. Banks were able to lend money
on personal security, but they could not lend credit (act as guarantors) on personal security (Laughlin
1912, p. 95).49 Critics of postbellum banking institutions saw this prohibition as having profound
consequences. The single-name promissory note, on which there was no “practical uniformity of
security,” depending instead on the reputations of various mercantile and manufacturing firms, was the
principal commercial credit instrument, as we have seen. Only a relatively few firms of unquestioned
financial standing could sell their notes in the open market, and, once sold, the notes had to be held to
maturity, there being no rediscount market. Although European bills were readily bought and sold
between countries, American commercial paper was not held abroad.50 For liquidity, New York banks
were forced to invest in the call loan market, which was notoriously volatile, while London banks could
have invested in the more stable bankers’ bill market. The European discount system offered stability
and liquidity, while the American system based on single-name paper and call loans did not (Warburg
1910, pp. 42-43).
We of course can not be sure how the postbellum financial system would have functioned if the
creation of bankers’ acceptances had not prohibited to national banks, but the Federal Reserve Act made
them legal (see Ferderer 2003, pp. 667-668), so an examination of the early Fed period should give us
some clues. In Europe small or average borrowers, where ever located, could have had access to the
acceptance market through branches of nationwide banks if there had been no strong local one. The U.S.
system of unit banks however had created a structure in which most local borrowers had to rely on their
local bank rather than on larger money center banks for finance, and most of those local banks in turn
would not have had the financial standing to create acceptances which would have been widely accepted.
We would expect only large financial center banks to have been able to participate in the acceptance

35
market, and that is what we observe. In 1925, 75 percent of all acceptances were created by New York
banks; adding Boston and Chicago banks brings the total to around 90 percent (Ferderer 2003, p. 669). It
seems unlikely that smaller interior borrowers and banks would have been able to participate in a
postbellum acceptance market.
Secondly, it seems unlikely that the bankers’ acceptance would have displaced the single-name
promissory note in the finance of domestic trade. Their principal use rather proved to have been in
foreign trade. Although the value of bankers’ acceptances had risen from close to zero to over $1 billion
by the close of the 1920's, those arising from the finance of domestic trade usually ran less than 20
percent of the total (at least after 1925 when we have detailed data) (James 1995, p. 235). Increased use
of bankers’ acceptances then primarily represented a displacement of sterling bills (i.e., drawn on sterling
accounts) by dollar-denominated bills, rather than a substitution for domestic promissory notes. Although
acceptances were very liquid, they did not, similarly, dislodge call loans as the preferred very liquid
secondary reserve asset of New York banks, perhaps because they generally had lower yields.
Finally, several writers have emphasized the importance of a central bank for a smoothly functioning
discount market. Warburg (1910, p. 31) said the two were “absolutely interdependent” with the central
bank acting as an indispensable “buffer.” Ferderer (2003, pp. 678), along these lines, found Federal
Reserve banks playing important roles as market makers of last report in the early acceptance market. In
the period after the Civil War the United States did not, of course, have a central bank. New York banks
may have filled this void to some degree in a hypothetical postbellum discount market (see Garbade and
Silber 1979), but the overall stability of such a market would still remain problematic.
5. Summary and Conclusion
Embodying Hamilton’s recommendations, the Coinage Act of 1792 formally constituted the United
States as a single monetary union. The formation of a uniform national payments system, however,
would await the passage of the Federal Reserve Act of 1913. In the interim the National Banking Acts
would represent an important intermediate step. By creating a uniform national currency, national bank
notes which were valued at par throughout the country, they significantly reduced the cost and risk
making non-local payments.

36
Their indirect consequences, however, proved to be more significant . The 1864 Act established a
tiered system of redemption, later reserve, cities that firmly established New York as the focus of the
correspondent banking system and thus of the interregional payments network. And within New York
correspondent relations and balances became more concentrated among a handful of newly formed
national banks, which specialized in the correspondent banking business. As a result, these large New
York correspondents could directly mediate interbank payments among virtually all banks in the U.S. and
hence clear and settle virtually all interregional payments. At the same time, because of Union monetary
policies, banks became the pivotal nodes in the long-distance payments system and transferred funds
interregionally through ledger entries to correspondent accounts, primarily in New York.
The internalization of long-distance payments in the correspondent banking system and the greater
centralization of correspondent banking in New York, in turn, forged a more unified national payments
system. As evidence of payments system integration, we point to the sharp declines in the levels, but
especially variability of domestic exchange rates in Chicago and New Orleans. These trends imply lower
costs in transferring funds across space and the greater liquidity of local markets for transferring funds
across banking institutions. Consequently, buyers and sellers could more efficiently and reliably count on
using New York exchange to settle their long-distance transactions.
37
References
Atherton, Lewis E. (1971). The Frontier Merchant in Mid-America. Columbia, MO: University ofMissouri Press.
Beard, Charles and Mary (1930). The Rise of American Civilization. New York: The MacMillanCompany.
Bodenhorn, Howard (2002). “Making the Little Guy Pay: Payments-Systems Networks, Cross-Subsidization, and the Collapse of the Suffolk System.” Journal of Economic History 62, 147-69.
Bodenhorn, Howard (2000). A History of Banking in Antebellum America. New York: CambridgeUniversity Press.
Calomiris, Charles W., and Gary Gorton (1991). “The Origins of Bank Panics: Models, Facts, and BankRegulation.” In R. Glenn Hubbard, ed., Financial Markets and Financial Crises, Chicago:University of Chicago Press. Pp. 109-173.
Calomiris, Charles W., and Charles Kahn (1996). “The Efficiency of Self-Regulated Payments Systems:Learning from the Suffolk System.” Journal of Money, Credit, and Banking 28, 766-797.
Cannon, James G. (1910). Clearinghouses. Washington, D.C.: Government Printing Office.
Catterall, Ralph C. H. (1902). The Second Bank of the United States. Chicago: University of ChicagoPress.
Chandler, Alfred D., Jr. (197). The Visible Hand: The Managerial Revolution in American Business. Cambridge, Mass.: Harvard University Press.
Chicago Tribune, various issues, 1860-1869.
Colwell, Stephen (1860). The Ways and Means of Payment: A Full Analysis of the Credit System, with itsVarious Modes of Adjustment. Philadelphia: J.B. Lippincott & Co.
Davis, Andrew M. (1910). The Origin of the National Banking System. Washington, D.C.: GovernmentPrinting Office.
Elliott, Jonathan (1968 [1845]). The Funding System of the United States and of Great Britain. NewYork: Augustus M. Kelley.
Ferderer, J. Peter (2003). “Institutional Innovation and the Creation of Liquid Financial Markets: TheCase of Bankers’ Acceptances, 1914-1934.” Journal of Economic History, 63, 666-694.
Fishlow, Albert (1966). “Productivity and Technological Change in the United States, 1840-60 and1900-10.” In Dorothy S. Brady, ed., Output, Productivity, and Employment in the United States after1800. New York: Columbia University Press, 583-646.
38
Freyer, Tony A. (1976). “Negotiable Instruments in the Federal Courts in Antebellum AmericanBusiness.” Business History Review 50, 435-55.
Garbade, Kenneth D., and William L. Silber (1979). “The Payments System and Domestic ExchangeRates: Technological versus Institutional Change.” Journal of Monetary Economics 5, 1-22.
Gibbons, J.S. (1858). The Banks of New York, Their Dealers, the Clearing House, and the Panic of 1857. New York: D. Appleton and Co.
Gische, David M. (1979). “The New York City Banks and the Development of the National BankingSystem, 1860-1870.” The American Journal of Legal History 23, 21-67.
Goodfriend, Marvin S. (1990). “Money, Credit, Banking, and Payment System Policy.” In David B.Humphrey, ed., The U.S. Payment System: Efficiency, Risk and the Role of the Federal Reserve. Boston: Kluwer Academic Publishers, 247-77.
Gorton, Gary (1996). “Reputation Formation in Early Bank Note Markets.” Journal of Political Economy104, 346-97.
Gorton, Gary, and Donald Mullineaux (1987). “The Joint Production of Confidence: EndogenousRegulation and Nineteenth Century Commercial-Bank Clearinghouses.” Journal of Money, Credit,and Banking 19, 457-68.
Greef, Albert O. (1938). The Commercial Paper House in the United States. Cambridge, MA: HarvardUniversity Press.
Hammond, Bray (1957). Banks and Politics in America. Princeton: Princeton University Press.
Jacobs, Lawrence (1910). Bank Acceptances. Washington, D.C.: Government Printing Office.
James, F. Cyril (1938). The Growth of Chicago Banks, 2 Vols. New York: Harper and Brothers.
James, John A. (1995). “The Rise and Fall of the Commercial Paper Market, 1900-1929.” In Michael D.Bordo and Richard E. Sylla (eds.), Anglo-American Financial Systems: Institutions and Markets inthe Twentieth Century, Burr Ridge, IL: Irwin. Pp.
James, John A. (1998). “Did the Fed’s Founding Improve the Efficiency of the U.S. Payments System? Commentary.” Federal Reserve Bank of St. Louis Review 80. Pp. 143-50.
James, John A. and David F. Weiman (2004). “From Drafts to Checks: The Evolution of CorrespondentBanking Networks and the Transformation of the U.S. Payments System, 1850-1914,” unpublishedmanuscript.
James, John A. and David F. Weiman (2005). “Financial Clearing Systems.” In Richard R. Nelson, ed.,The Limits of Market Organization. New York: Russell Sage Foundation, Pp. 114-55.
Jessup, Paul F. (1967). The Theory and Practice of Nonpar Banking. Evanston: Northwestern UniversityPress.

39
Kahn, Charles, and William Roberds (1999). “Demandable Debts as a Means of Payment: Banknotesversus Checks.” Journal of Money, Credit, and Banking 31, 500-525.
Klein, Joseph J. (1911-1912). “The Development of Mercantile Instruments of Credit in the UnitedStates.” Journal of Accountancy 12, 321-344, 422-449, 526-607; 13, 44-50, 122-132, 207-217.
Knodell, Jane (2003). “Profit and Duty in the Second Bank of the United States' Exchange Operations.” Financial History Review 10, 5-30.
Knodell, Jane (1998). “The Demise of Central Banking and the Domestic Exchanges: Evidence fromAntebellum Ohio.” Journal of Economic History 58, 714-30.
Knodell, Jane (1988). “Interregional Financial Integration and the Banknote Market: The Old Northwest,1815-1845.” Journal of Economic History 48, 287-98.
Laughlin, J. Laurence (1912). Banking Reform. Chicago: National Citizens’ League.
Mitchell, Wesley C. (1903). A History of the Greenbacks. Chicago: University of Chicago Press.
New Orleans Price Current and Commercial Intelligencer, various issues, Sept. 1856 through August1873.
New York (State). Banking Dept. Report of the Superintendent of Banks. Albany: various publishers,dates (from 1856 to 1864).
Phillips, Ronnie J. and P.A.V.B. Swamy (1998). “Par Clearance in the Domestic Exchanges: The Impactof National Bank Notes.” Research in Economic History 18, 121-44.
Porter, Glenn, and Livesay, Harold C. (1971). Merchants and Manufacturers. Baltimore: The JohnsHopkins Press.
Ransom, Roger L. (1989). Conflict and Compromise: The Political Economy of Slavery, Emancipation,and the Civil War. New York: Cambridge University Press.
Redenius, Scott A. (2005). “Banknote Redemption Networks under the National Banking Act, 1863-1874,” unpublished manuscript.
Redenius, Scott A. (2002). Between Reforms: The U.S. Banking System in the Postbellum Period. Unpublished Ph.D. dissertation, Yale University.
Redlich, Fritz (1968). The Molding of American Banking: Men and Ideas. New York: Johnson ReprintCo.
Rolnick, Arthur, Bruce Smith, and Warren Weber (1998). “Lessons from a Laissez-Faire PaymentsSystem.” Federal Reserve Bank of Minneapolis Quarterly Review 22, 11-21.
Shannon, Fred A. (1945). The Farmer’s Last Frontier: Agriculture, 1860-1897. White Plains, NY: M.E.Sharpe.

40
Sprague, O. M. W. (1910). History of Crises under the National Banking System. Washington, D.C.:Government Printing Office.
Sylla, Richard E. (1996). “Forgotten Men of Money: Private Bankers in Early U.S. History.” Journal ofEconomic History 36, 173-188.
Temin, Peter (1969). The Jacksonian Economy. New York: W. W. Norton.
U.S. Comptroller of the Currency (1865-1869, 1878, 1889, 1890). Annual Report. Washington, D.C.:Government Printing Office.
U.S. Secretary of the Treasury (1863). Annual Report on the Condition of Banks. Washington, D.C.:Government Printing Office.
Van Fenstermaker, J. (1965). The Development of American Commercial Banking, 1782-1837. Kent,OH: Kent State University Press.
Warburg, Paul H. (1910). The Discount System in Europe. Washington, D.C: Government PrintingOffice.
Watkins, Leonard L. (1929). Bankers' Balances: A Study of the Effects of the Federal Reserve System onBanking Relationships. Chicago: A.W. Shaw.
Weber, Warren E. (2003). “Interbank Payments Relationships in the Antebellum United States: Evidencefrom Pennsylvania.” Journal of Monetary Economics 50, 455-474.
White, Eugene N. (1983). The Regulation and Reform of the American Banking System, 1900-1929. Princeton, NJ: Princeton University Press.

Table 1New York City Banks’ Share of Correspondent Balances
($1,000's)
Due from banks- Due to banks- New York Due from banks- New YorkYear outside New York New York banks share outside NYC and New England share
1857/58 52,314.4 23,600.4 45.1% 40,338.5 58.5%1858/59 74,808.8 25,816 34.5 60,270 42.81859/60 65,055.8 26,213.7 40.3 49,831.6 52.61860/61 57,710.3 27,275.1 47.3 42,308.9 64.51861/62 59,198.7 33,287 56.2 40,262.3 82.7
1865 49,216.5 39,516.4 80.31866 59,302.3 42,663 71.91867 54,274.6 38,573.7 71.11868 63,279.7 43,615.5 68.91869 57,311.7 42,615.3 74.4
Notes: Prewar figures are for all state-chartered banks; postwar figures are for national banks only. Nominal values are deflated bythe Warren-Pearson wholesale price index. Prewar figures are biennial averages; postwar figures are for the fourth (autumn) call date.
Sources: U.S. Secretary of the Treasury, Annual Report on the Condition of the Banks in the United States, 1863. Washington:Government Printing Office, 1863, pp. 220-223. U.S. Comptroller of the Currency, Annual Report, 1865, pp. 138-141;1866, pp. 2-31;1867, pp. 564-601;1868, pp. 562-602; 1869, pp. 558-593.
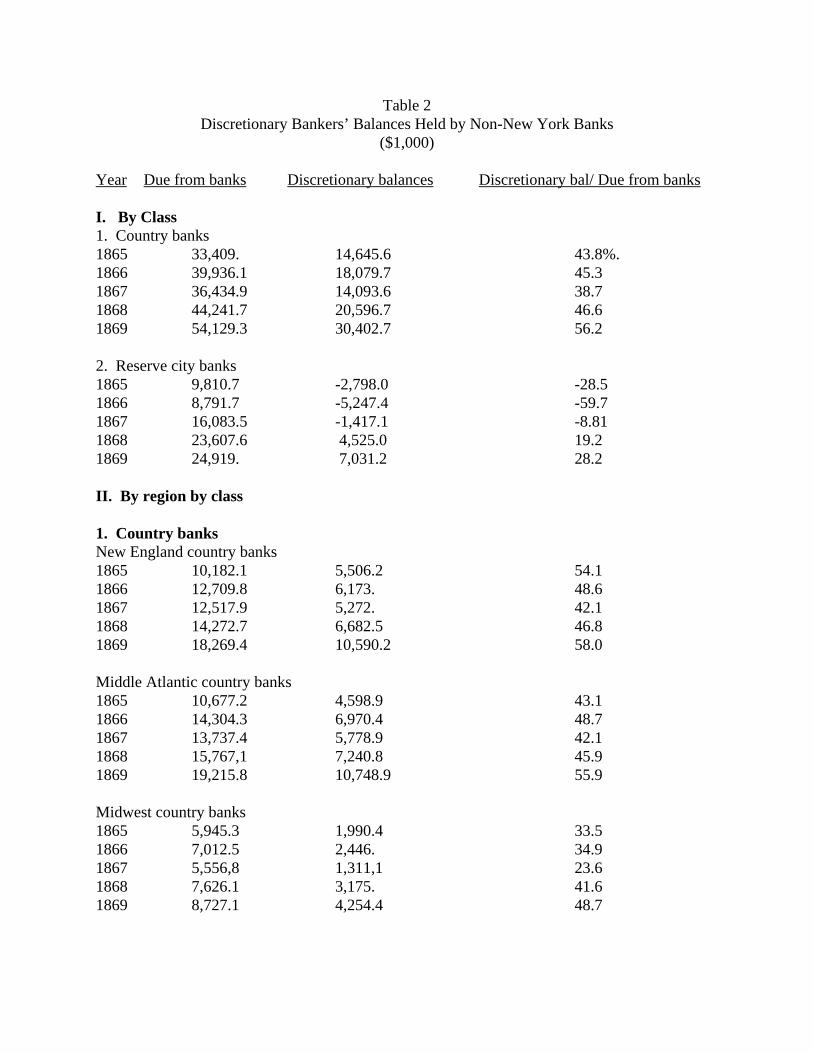
Table 2Discretionary Bankers’ Balances Held by Non-New York Banks
($1,000)
Year Due from banks Discretionary balances Discretionary bal/ Due from banks
I. By Class1. Country banks1865 33,409. 14,645.6 43.8%.1866 39,936.1 18,079.7 45.31867 36,434.9 14,093.6 38.71868 44,241.7 20,596.7 46.61869 54,129.3 30,402.7 56.2
2. Reserve city banks1865 9,810.7 -2,798.0 -28.51866 8,791.7 -5,247.4 -59.71867 16,083.5 -1,417.1 -8.811868 23,607.6 4,525.0 19.21869 24,919. 7,031.2 28.2
II. By region by class
1. Country banksNew England country banks1865 10,182.1 5,506.2 54.11866 12,709.8 6,173. 48.61867 12,517.9 5,272. 42.11868 14,272.7 6,682.5 46.81869 18,269.4 10,590.2 58.0
Middle Atlantic country banks1865 10,677.2 4,598.9 43.11866 14,304.3 6,970.4 48.71867 13,737.4 5,778.9 42.11868 15,767,1 7,240.8 45.91869 19,215.8 10,748.9 55.9
Midwest country banks1865 5,945.3 1,990.4 33.51866 7,012.5 2,446. 34.91867 5,556,8 1,311,1 23.61868 7,626.1 3,175. 41.61869 8,727.1 4,254.4 48.7

Plains country banks1865 1,630.9 609.3 37.41866 1,816.4 647.1 35.61867 1,302.5 382.4 29.41868 2,857.1 1,730.7 60.61869 3,060.2 1,913.4 62.5
South country banks1865 821. 350.7 42.71866 1,881.4 932.3 49.61867 1,672.6 811. 48.51868 1,953.9 1,049.3 53.71869 2,322.9 1,450.9 62.5
Border country banks1865 4,088.3 1,533.8 37.51866 2,149.4 888.5 41.31867 1,476.1 487.1 33.01868 1,495.1 563. 37.71869 2,327.4 1,350.1 58.0
West country banks1865 64.2 56.3 87.61866 62.3 22.4 36.01867 161.6 51.1 31.61868 267.7 155.5 58.11869 206.6 94.7 45.8
2. Reserve city banksNew England reserve city banks1865 4,141.7 -515.7 -12.41866 2,769.3 -3,028.6 -109.41867 5,012.7 -426.2 -8.51868 7,257.6 1,326.7 18.31869 7,679.6 2,775.5 36.1
Middle Atlantic reserve city banks1865 3,140.6 -2,580.2 -82.21866 3,393.1 -1,667.2 -49.11867 5,848. -611.4 -10.51868 7,715.7 889.8 11.51869 7,736.5 910. 11.8

Midwest reserve city banks1865 2,528.4 297.9 11.81866 1,965.6 209.6 10.71867 3,082.5 246.4 8.01868 5,687.8 2,487.3 43.71869 6,115.8 2,861.4 46.8
Plains reserve city banks1867 601.2 -62.7 -10.41868 1,113.4 169.2 15.21869 1,134.7 347.8 30.7
South reserve city banks1867 146.1 -37.8 -25.91868 171.9 3.1 1.81869 594.4 390.6 65.7
Border reserve city banks1866 663.7 -761.3 -114.71867 1,393. -525.5 -37.71868 1,661.2 -351.1 -21.11869 1,658.1 -254.1 -15.3
Notes: Nominal values deflated by the Warren-Pearson wholesale price index; Figures are forthe third (mid-summer) call date.New England country- ME, NH, VT, MA, RI, CNMiddle Atlantic country- NY, NJ, PA, DLMidwest country- OH, IN, IL, MI, WIPlains country- IA, MN, KA, NB, MOSouth country- VA, NC, SC, GA, AL, MS, LA, AR, TXBorder country- MD, DC, WV, KY, TNWest country- CO, NV, MT, ID, ORNew England reserve city- BostonMiddle Atlantic reserve city- Albany, Philadelphia, PittsburghMidwest reserve city- Cincinnati, Cleveland, Chicago, Detroit, MilwaukeePlains reserve city- St. Louis, LeavenworthSouth reserve city- New OrleansBorder reserve city- Baltimore, Washington, Louisville
Sources: U.S. Comptroller of the Currency, Annual Report

Table 3New York City Banks’ Interbank Deposits
($1,000's)
Year Due to banks Due to banks/Deposits Due to banks/ Total assets
I. Total
1858 15,052.2 36.34% 14.61%1859 28,894.5 24.31 10.231860 20,204.7 26.17 10.031861 23,052.9 29.74 12.311862 44,137.7 33.40 16.851863 30,523.4 22.59 12.761864 17,394.5 21.01 12.32
1865 39,516.4 43.10 21.781866 42,663.0 38.79 19.361867 38,573.7 29.01 14.931868 43,615.5 32.09 16.361869 42,615.3 33.39 16.22
II. Prewar and subsequently converted banks
1858 15,052.2 36.34% 14.61%1859 28,894.5 24.31 10.231860 20,204.7 26.17 10.031861 23,052.9 29.74 12.311862 44,137.7 33.40 16.851863 30,523.4 22.59 12.761864 17,394.5 21.01 12.32
1865 26,266.2 33.64 18.691866 24,435.5 27.00 14.571867 21,504.2 19.59 10.661868 25,996.2 23.82 12.681869 25,264.1 23.21 12.06

III. New national banks
1865 13,252.2 97.42% 32.43%1866 18,227.5 93.53 34.551867 17,069.6 73.48 30.111868 17,619.4 65.82 28.621869 17,351.2 92.58 32.59
Notes: Nominal values deflated by the Warren-Pearson wholesale price index; Figures are forthe fourth (autumn) call date.
Sources: New York State......; U.S. Comptroller of the Currency, Annual Reports

Table 4Concentration in New York Bankers’ Balances
Year Gini coefficient Share of largest seven Share of largest ten
1858 .7183 .6063 .72591859 .6879 .5737 .69461860 .6962 .5770 .69291861 .7017 .6181 .72751862 .6801 .5887 .69561863 .6945 .6141 .71091864 .6791 .5977 .6923
1865 .7645 .7277 .79121866 .7251 .6639 .75661867 .7319 .6508 .74091868 .7147 .6382 .73421869 .7126 .6241 .7289
Notes: Indexes based on balance sheet data reported during the fourth (September/October) calldate.

Table 5Ten Largest New York Banks by Bankers’ Balance Holdings
($1,000)
Name Due to banks Due to banks/ Deposits Rank in total assets
18601. Park 2,832. 1.08 62. Bank of Commerce 2,726.5 .48 23. Metropolitan 2,413.3 .69 44. American Exchange 1,528.4 .37 35. Bank of America 1,430.7 .45 56. Mercantile 1,312.9 1.13 197. Merchants’ 1,056.7 .31 78. Bank of the Republic 992.3 .28 109. Manhattan Co. 857. .27 910. Bank of State of NY 823.6 .25 11
18631. Park 3,834.1 1.00 62. Bank of America 3,731.5 .83 33. Metropolitan 2,881.4 .75 54. Broadway 2,705.1 .45 105. Bank of Commerce 2,195.6 .41 16. American Exchange 1,754.9 .31 27. Bank of State of NY 1,642.7 .21 48. Mercantile 1,316.7 .88 249. Merchants’ 889.1 .18 810. Manhattan Co. 749.5 .18 13
18661. National Park 8,039.9 1.99 52. Fourth National 6,172.7 .76 13. Central National 4,761.8 1.00 34. Ninth National 3,642.6 2. 45 95. Natl Bank of Commerce 2,378.4 .42 26. Metropolitan National 1,764.0 .76 77. Importers’ & Traders’ Natl 1,564.4 .72 158. American Exchange Natl 1,458.4 .30 69. Third National 1,319.7 .79 1810. First National 1,176.9 1.32 27

18691. National Park 6,109.6 1.13 42. Fourth National 5,790.2 .67 13. Central National 4,129.3 1.30 54. Importers’ & Traders’ Natl 3,720.7 1.37 95. First National 2,510.1 2.29 216. Ninth National 2,415.0 1.78 197. Third National 1,921.9 1.61 228. Natl Bank of Commerce 1,636.7 .33 29. Merchants’ National 1,534.0 .35 810. Metropolitan National 1,293.4 .32 7
Notes: Figures are for the fourth (autumn) call date; nominal values are deflated by the Warren-Pearson wholesale price index.

Table 6Ten Largest New York Banks by Total Assets
($1,000)
Name Total assets Due to banks/ Deposits Rank in due to banks
18601. Bank of Commerce 18,782.4 .48 22. American Exchange 11,849.1 .37 43. Metropolitan 11,045.1 .69 34. Bank of America 8,456.1 .45 55. Park 8,328.3 1.08 16. Merchants’ 8,034.9 .31 77. Bank of New York 7,785.8 .05 268. Manhattan Co. 7,578.7 .27 99. Bank of the Republic 7,385.2 .25 810. Bank of State of NY 6,759.9 .25 10
18631. Bank of Commerce 17,038.3 .41 52. American Exchange 12,074.6 .31 63. Bank of America 11,573.3 .83 24. Bank of State of NY 11,427. .21 75. Metropolitan 11,153.3 .75 36. Park 10,554.2 1.01 17. Union 8,824.5 .08 178. Merchants’ 8,652.6 .18 99. Bank of New York 8,366.9 .09 2010. Broadway 8,033.2 .45 4
18661. Fourth National 19,084.1 .76 22. Natl Bank of Commerce 17,800.2 .42 53. Central National 12,468.4 1 00 34. Bank of New York 11,952.1 .03 235. National Park 11,544.6 1.99 16. American Exchange Natl 10,553.4 .30 87. Metropolitan National 7,830.4 .76 68. Merchants’ National 7,156.7 .33 119. Ninth National 6,514.1 2.45 410. Mechanics’ National 6,490.1 .11 17

18691. Fourth National 20,331.5 .67 22. Natl Bank of Commerce 19,733.8 .33 83. Bank of New York 18,740.1 .05 154. National Park 14,595.5 1.13 15. Central National 10,853.6 1.30 36. American Exchange Natl 10,760.1 .26 117. Metropolitan National 10,631.3 .32 108. Merchants’ National 9,066.6 .35 99. Importers’ & Traders’ Natl 8,346.6 1.37 410. Union National 7,554.4 .05 26
Notes: Figures are for the fourth (autumn) call date; nominal values are deflated by the Warren-Pearson wholesale price index.

A. Chicago Market
Date Average1 Standard Deviation
1/1854-8/1857 1.09 0.3243/1858-10/1860 1.49 0.51410/1861-5/1864 0.13 0.1356/1864-6/1865 0.07 0.0657/1865-12/1869 0.07 0.048
% Change1858/60 to 1865/69 -95.6% -90.7%1858/60 to 1861/64 -91.6% -73.8%1861/64 to 1865/69 -47.0% -64.5%
B. New Orleans Market
ActualAbsolute Value2
Antebellum -0.13 0.49 0.711Excluding panic years -0.09 0.44 0.516
9/1868 to 2/1870 -0.05 0.25 0.3013/1870 to 8/1873 0.11 0.28 0.107
% ChangeAll years
to 2/1870 -50.3% -57.7%to 8/1873 -45.2% -85.0%
Excluding panic yearsto 2/1870 -42.9% -41.9%to 8/1873 -37.1% -79.4%
Notes:1) The mean value measures the average discount (-) orpremium (+) over the period.2) Because New Orleans rates fluctuate between discounts andpremium, we measure the absolute value of the average rate. Thisis clearer indicator of the deviation from par.
AverageStandard Deviation
Table 7Domestic Exchange Rates in the Chicago and New Orleans
Markets before and after the Civil War

Index for Figures 1 through 4: Weekly Exchange Reports from the Charleston Courier and New Orleans Price Current
Figure 1 Charleston Courier, September 18, 1857
Figure 2 New Orleans Price Current, October 2, 1858
Figure 3 Charleston Courier, January 9, 1872
Figure 4 New Orleans Price Current, November 6, 1872


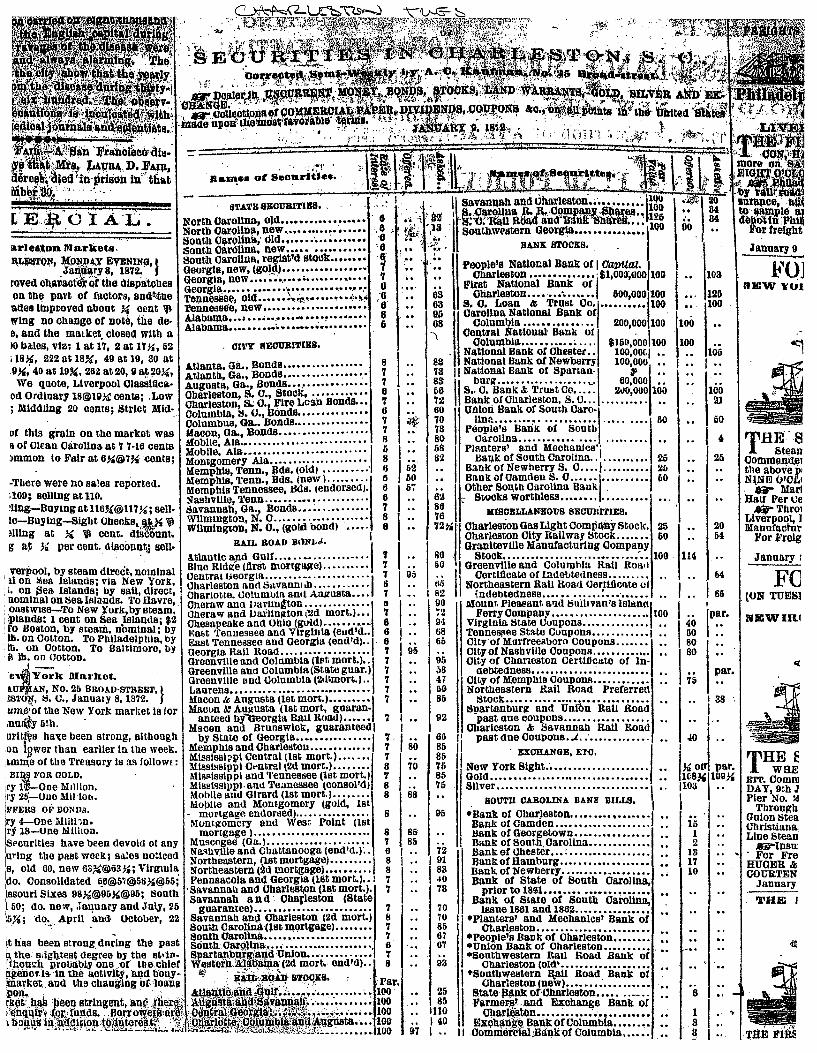


reta
il xr
ate
perc
ent
date1854 1856 1858 1860 1862 1864 1866 1868
0
.5
1
1.5
2
3
reta
il xr
ate
perc
ent
date1861 1862 1863 1864 1865 1866 1867 1868 1869
0
.1
.2
.3
.4
.5
Figure 5Chicago Domestic Exchange Rate

Figure 6New Orleans Domestic Exchange, 9/1856-8/1860 and 9/1868-8/1873
-1.5
-1.0
-0.5
0.0
0.5
1.0
1.5
9/6/1856 3/7/1857 9/5/1857 3/6/1858 9/4/1858 3/5/1859 9/3/1859 3/3/1860 1/9/1869 7/10/1869 1/8/1870 7/9/1870 1/7/1871 7/8/1871 1/6/1872 7/6/1872 1/4/1873 7/5/1873
% P
rem
ium
or
Dis
coun
t
After the Civil Before the Civil War
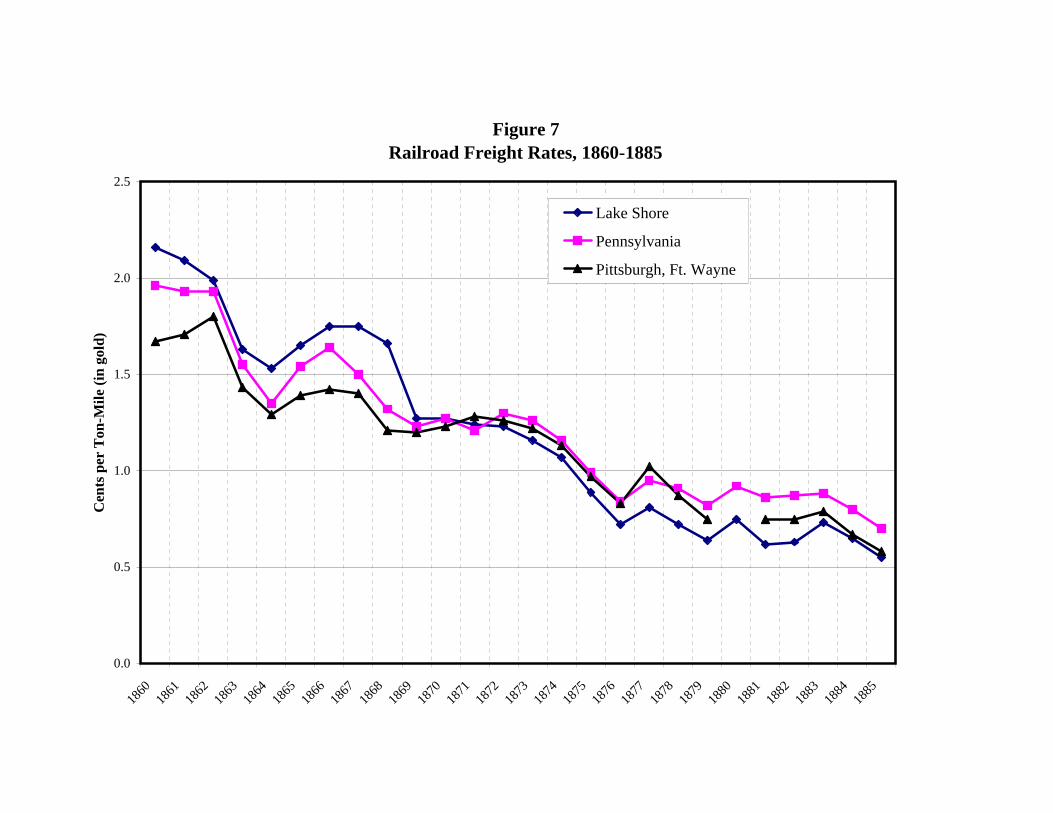
Figure 7Railroad Freight Rates, 1860-1885
0.0
0.5
1.0
1.5
2.0
2.5
1860
1861
1862
1863
1864
1865
1866
1867
1868
1869
1870
1871
1872
1873
1874
1875
1876
1877
1878
1879
1880
1881
1882
1883
1884
1885
Cen
ts p
er T
on-M
ile (i
n go
ld)
Lake Shore
Pennsylvania
Pittsburgh, Ft. Wayne