towards a sustainable humanitarian supply chain
TRANSCRIPT

HAL Id: tel-02317052https://tel.archives-ouvertes.fr/tel-02317052
Submitted on 15 Oct 2019
HAL is a multi-disciplinary open accessarchive for the deposit and dissemination of sci-entific research documents, whether they are pub-lished or not. The documents may come fromteaching and research institutions in France orabroad, or from public or private research centers.
L’archive ouverte pluridisciplinaire HAL, estdestinée au dépôt et à la diffusion de documentsscientifiques de niveau recherche, publiés ou non,émanant des établissements d’enseignement et derecherche français ou étrangers, des laboratoirespublics ou privés.
Towards a sustainable humanitarian supply chain :characterization, assessment and decision-support
Laura Laguna Salvado
To cite this version:Laura Laguna Salvado. Towards a sustainable humanitarian supply chain : characterization, assess-ment and decision-support. Other [cs.OH]. Ecole des Mines d’Albi-Carmaux, 2018. English. �NNT :2018EMAC0016�. �tel-02317052�

THÈSETHÈSEen vue de l’obtention du
DOCTORAT DE L’UNIVERSITÉ DE TOULOUSEDOCTORAT DE L’UNIVERSITÉ DE TOULOUSEdélivré par
IMT – École Nationale Supérieure des Mines d’Albi-Carmaux
présentée et soutenue par
Laura LAGUNA SALVADÓ
le 9 avril 2018
Towards a Sustainable Humanitarian Supply ChainCharacterization, Assessment and Decision-support
École doctorale et discipline ou spécialité :EDSYS : Génie industriel et informatique
Unité de recherche :Centre Génie Industriel, IMT Mines Albi
Directeur(s) de Thèse :Matthieu Lauras, Maître-Assistant, HDR, IMT Mines Albi
Tina Comes, Professeur, University of Agder (UiA)
Autres membres du jury :Gyöngyi Kovács, Professeur, Hanken School of Economics Helsinki, (Rapporteur)
Valérie Botta-Genoulaz, Professeur, INSA Lyon, (Rapporteur)Chihab Hanachi, Professeur, IRIT Toulouse, (Président)
Dubey Rameshwar, Professeur Associé, Montpellier Business School, (Examinateur)

i
Contents
REMERCIEMENTS ........................................................................................................................... 5
RESUM EN CATALÀ .................................................................................................................................... 7
RÉSUMÉ LONG EN FRANÇAIS ................................................................................................................. 9
INTRODUCTION .............................................................................................................................. 9
PROBLEMATIQUE SCIENTIFIQUE ET TERRAIN .............................................................................. 11
METHODOLOGIE DE RECHERCHE ................................................................................................. 13
1ERE CONTRIBUTION : METAMODELE DE LA CLH ...................................................................... 14
2EME CONTRIBUTION : LA MAISON DES OPERATIONS DE LA CLH DURABLE ............................... 15
3EME CONTRIBUTION : UN SYSTEME D’AIDE A LA DECISION POUR LE MASTER PLANNING
(COMMENT ?) ............................................................................................................................... 15
PERSPECTIVES.............................................................................................................................. 16
CHAPTER I. INTRODUCTION ....................................................................................................... 19
1. HUMANITARIAN SUPPLY CHAIN CONTEXT ............................................................................. 19
1.1. Humanitarian Disasters ................................................................................................... 19
1.2. Humanitarian aid ............................................................................................................. 22
1.3. Humanitarian Supply Chain ............................................................................................ 28
2. PROBLEM STATEMENT ............................................................................................................. 30
2.1. Towards a Humanitarian Sustainable Supply Chain ....................................................... 30
2.2. Research gaps .................................................................................................................. 36
2.3. Research Statement .......................................................................................................... 37
3. THE IFRC APPLICATION CASE ................................................................................................. 39
3.1. The Red Cross and Red Crescent movement .................................................................... 39
3.2. The IFRC Humanitarian Supply Chain network strategy ................................................ 40
4. RESEARCH METHODOLOGY ..................................................................................................... 43
5. MANUSCRIPT STRUCTURE ....................................................................................................... 46
CHAPTER II. HUMANITARIAN SUPPLY CHAIN METAMODELING .................................... 49
1. TOWARDS AN EXPLICIT CONCEPTUALIZATION OF THE HSC ................................................... 49
1.1. From conceptualization to metamodeling ........................................................................ 50

ii
1.2. Research direction ............................................................................................................ 51
2. BACKGROUND AND RELATED WORKS ...................................................................................... 53
2.1. Humanitarian Supply Chain domain ................................................................................ 53
2.2. Supply Chain domain ....................................................................................................... 54
2.3. Disaster Management domain ......................................................................................... 56
3. HUMANITARIAN SUPPLY CHAIN METAMODEL PROPOSAL ...................................................... 59
3.1. HSC system description .................................................................................................... 60
3.2. HSC metamodel ................................................................................................................ 65
3.3. Potential uses and engineering methods .......................................................................... 73
4. ILLUSTRATION: A&C RLU ACADEMIC FIELD RESEARCH ........................................................ 78
4.1. Field research planning ................................................................................................... 78
4.2. Field research supports .................................................................................................... 78
4.3. Implementation ................................................................................................................. 83
4.4. Analysis & research directions: IFRC sub-regionalization ............................................. 83
4.5. Results communication ..................................................................................................... 87
5. DISCUSSION .............................................................................................................................. 88
CHAPTER III. SUSTAINABLE HUMANITARIAN SUPPLY CHAIN PERFORMANCE .......... 89
1. INTRODUCTION ........................................................................................................................ 89
2. BACKGROUND .......................................................................................................................... 91
2.1. Sustainability: a historical perspective ............................................................................ 91
2.2. The Triple Bottom Line .................................................................................................... 92
2.3. Sustainability of the Supply Chain ................................................................................... 94
2.4. Sustainability in the HSC ................................................................................................. 98
2.5. Conclusion ...................................................................................................................... 100
3. DEFINITION OF SUSTAINABLE HSC PERFORMANCE .............................................................. 102
3.1. Economic dimension ...................................................................................................... 102
3.2. Environmental dimension ............................................................................................... 103
3.3. Social dimension ............................................................................................................ 104
3.4. Conclusion: The house of SHSC operations .................................................................. 105
4. SHSC MATURITY ASSESSMENT .............................................................................................. 108
4.1. HSC sustainability assessment method .......................................................................... 108
4.2. A proof of concept: Assessing the sustainability of IFRC HSC ...................................... 110
5. DISCUSSION ............................................................................................................................ 118

iii
CHAPTER IV. PLANNING SUSTAINABLE HSC OPERATIONS .............................................. 119
1. INTRODUCTION ...................................................................................................................... 119
2. HUMANITARIAN SUPPLY CHAIN PLANNING .......................................................................... 121
2.1. Humanitarian Supply Chain Planning Matrix ............................................................... 121
2.2. SHSC Master Planning problem .................................................................................... 123
2.3. Master Planning Approaches ......................................................................................... 124
2.4. A Multi-Objective Decision Problem ............................................................................. 125
2.5. Conclusion ..................................................................................................................... 126
3. SHSC MASTER PLANNING OBJECTIVES ................................................................................ 127
3.1. The set of SHSC Master Planning objectives ................................................................. 127
4. INTERACTIVE LEXICOGRAPHIC OPTIMIZATION METHOD ALGORITHM ................................. 129
5. SHSC MASTER PLANNING MODEL ........................................................................................ 132
5.1. The supply network and assumptions ............................................................................. 132
5.2. Mathematical Model sets and parameters ..................................................................... 133
6. MASTER PLANNING FOR THE IFRC A&C RLU USE CASE ..................................................... 141
6.1. Sustainability at the IFRC .............................................................................................. 141
6.2. Limitations ..................................................................................................................... 150
7. DISCUSSION ........................................................................................................................... 150
CHAPTER V. CONCLUSION AND PERSPECTIVES.................................................................. 153
1. ACADEMIC AND PRACTICAL CONTRIBUTIONS ....................................................................... 153
2. PERSPECTIVES ........................................................................................................................ 155
BIBLIOGRAPHY ..................................................................................................................................... 159
LIST OF FIGURES .................................................................................................................................... 171
LIST OF TABLES ..................................................................................................................................... 175
LIST OF ABBREVIATIONS..................................................................................................................... 177
APPENDIX A. INVENTORY AT THE A&C RLU ................................................................................ 179
APPENDIX B. USE CASE INPUT DATA SAMPLES ............................................................................ 180
APPENDIX C. USE CASE OUTPUT DATA SAMPLES ....................................................................... 185
APPENDIX D. MODEL ............................................................................................................................. 187

iv

5
Remerciements
C’est Matthieu qui m’a poussée à transformer ma curiosité pour le domaine de la logistique
humanitaire en travaux de recherche. Merci Matthieu, merci beaucoup pour ton soutien depuis la
minute 0, pour m’avoir donné ta confiance. J’ai appris énormément de ta persévérance et optimisme.
Thank you, Tina. You have been a great source of inspiration and challenge. It has been a pleasure to
be part of your research team. Thank you also for all the opportunities you offered all along this way
(Norway, the Triplex, Delft, …) All those experiences have been completely amazing and have shaped
me as researcher and person.
Merci aussi à Mathieu Grenade, et donc la Fédération International de la Croix Rouge, pour avoir cru
à ce projet et avoir joué le jeu. Spécialement pour l’accueil de toute l’équipe au Panama, qui a
beaucoup contribué à construire ce projet.
Je remercie les rapporteurs et membres du jury d’avoir accepté et accompli cette tâche si critique.
C’était un vrai challenge et plaisir de discuter avec vous tous.
J’aimerais remercier aussi Arnaud Cabal (MSF), qui m’a ouvert les portes dans le domaine passionnant
de la logistique humanitaire.
Merci à tous les collègues du Centre de Génie Industriel de l’IMT Mines Albi. Merci à vous tous pour
tous les bons moments partagés.
Hossein, it was a pleasure to share this adventure with you, the best practitioner ever ;-)
Isabelle, tu étais l’âme du CGI tel que je l’ai connu. Merci pour ton amitié, pour avoir partagé ta joie de
vivre, tu me manques.
Merci Nico… Gracies als amics i la familia que heu seguit aquest projecte des de la distancia. Sense
vosaltres tot seria molt més dificil!

6

7
RESUM EN CATALÀ
Per una cadena de subministrament d’ajuda humanitària sostenible:
caracterització, avaluació i suport a la presa de decisions
Paraules clau. Cadena de subministrament humanitària, presa de decisions, planificació tàctica, gestió de crisi,
sostenibilitat.
La cadena de subministrament humanitària (CSH) és un element clau per millorar la resposta davant
les crisis humanitàries. Les organitzacions humanitàries (OH) han rebut pressions tant internes com
externes que han conduit a una millora substancial de la gestió dels recursos (eficiència i eficàcia)
durant els darrers anys.
Tot hi així, com que la diferència entre les necessitats de finançament i els recursos disponibles
tendeix a créixer, i els mecenes demanen cada cop més transparència i justificació de les despeses, el
coneixement i gestió del rendiment segueix essent cabdal. D’altra banda, la pressió de l’opinió publica
empeny les OH a integrar els reptes de sostenibilitat, més enllà dels resultats econòmics.
A l’inici d’aquest projecte de recerca, gràcies als resultats de la investigació de camp, es van identificar
les dificultats per considerar la sostenibilitat en la presa de decisions de la CSH. A part de la manca de
coneixement generalitzat sobre què és la sostenibilitat i com mesurarla, alguns dels frens majors per
planificar operacions humanitàries sostenibles son la manca de sistemes de suport per la presa de
decisió i una cultura de sostenibilitat específica a la CSH.
La tesi aborda diferents aspectes per facilitar l’introducció de la noció de rendiment sostenible en la
gestió de la CSH. En aquest sentit, s'han investigat tres pistes de recerca que han permès de
desenvolupar un sistema de suport a la presa de decisió per a la planificació d'operacions de la CSH
durables:
(a) Com es pot obtenir un coneixement exhaustiu d'una CSH?, La contribució proposada és
una Meta-Model de la CSH, basat en la definició d’un sistema col·laboratiu, útil tant per a la
investigació sobre el terreny com per al desenvolupament de sistemes de suport a la decisió.
(b) Què significa sostenibilitat en el context de la CSH? A partir de la recerca bibliogràfica
contrastada amb la investigació de camp, s'estableix un marc per definir el rendiment
sostenible de la CSH basat en la TBL (Tripple Bottom Line) que considera les dimensions
econòmica, mediambiental i social.
(c) Com prendre decisions sostenibles en el context de la CSH? Aquesta contribució es basa
en un algoritme d'investigació operativa que permet d'integrar el rendiment sostenible en la
presa de decisions de manera interactiva. El procés de decisió estudiat és el de la planificació
tàctica (selecció de proveïdors, mitjans de transport, magatzems) per la distribució d'ajuda
humanitària en una zona geogràfica continental.
Les tres contribucions han estat aplicades a casos pràctics basats en l'activitat de la Federació
Internacional de la Creu Roja (FICR).

8

Vers un Système d’Aide à la Décision pour une CLH Durable
9
RÉSUMÉ LONG EN FRANÇAIS
Introduction
Des Chaîne Logistiques Humanitaires pourquoi ?
La Chaîne Logistique Humanitaire (CLH) a pour but d’acheminer, au bon endroit et au bon moment,
les articles de première nécessité appropriés aux personnes touchés par des crises humanitaires.
Ce qu’on appelle une crise humanitaire, est la conséquence d’un ou une suite d’évènements d’origine
naturel et/ou humain qui menacent la survie d’un grand nombre de personnes.
En cas de crise, la première réponse vient toujours de la population et d’organisations locales. Ce n’est
que quand les besoins dépassent la capacité du territoire que la communauté internationale se
mobilise. Depuis des décennies, les Organisations Humanitaires (OH) telles que les ONGs et les
agences des Nations Unies travaillent - souvent en coordination avec les autorités locales, militaires ou
encore le secteur privé - pour porter assistance aux populations affectés par les crises majeures en
suivant les principes d’humanité, impartialité et neutralité. Les OH sont capables de fournir de l’aide
humanitaire à plusieurs crises en parallèle avec des CLH très réactives même si les ressources dont
elles disposent sont souvent insuffisantes, le turnover des « humanitaires » est élevé, et les Systèmes
d’Information (SI) utilisés sont plutôt rudimentaires.
Dans les dernières années on a constaté une poussée des besoins d’aide humanitaire. Les évènements
(dangers) causent de plus en plus d’impacts due à l’augmentation de leur récurrence et magnitude.
L’exposition de la population aux dangers augmente plus vite que descends la vulnérabilité, ce qui
conduit à un incrément du risque.
La CLH, de plus en plus professionnalisée, a été identifié comme un élément clé pour garantir le
succès des opérations de réponse aux crises humanitaires. Dans cette thèse on a commencé pour
s’intéresser à l’évolution de la CLH pour mieux comprendre les défis à venir.
Evolution de la Chaîne Logistique Humanitaire
Si l’on considère le cycle de la gestion d’une crise (préparation, réponse, récupération, atténuation), les
décideurs de la CLH ont tendance à focaliser les efforts dans la gestion de la phase de réponse. En
effet, et en contraste avec la chaîne d’approvisionnement industrielle, le moteur principal de la CLH a
été typiquement la réactivité et l’efficacité depuis le début (s. XX).
Cependant, plusieurs « échecs » dans la réponse à des crises humanitaires majeures on mit en cause
l’approche. L’un des exemples le plus frappant est l’ouragan Mitch, en 1998, où les problématiques
d’approvisionnement ont été suivies avec une couverture médiatique sans précédents. Dû à cette
médiatisation, l’opinion publique et grands donateurs ont exercé une forte pression vers les OH qui a
poussé à investir des ressources sur les phases de préparation, en amont des crises.
Dès lors, même si les fonds disponibles ont bien augmenté, les ressources sont toujours insuffisantes
dû à l’augmentation des besoins. L’écart entre les besoins et le financement a tendance à se creuser. De

Résumé long en Français
10
plus, les donateurs exigent de plus en plus de transparence et de responsabilité dans l’utilisation des
fonds. Par conséquent, la maîtrise de la performance de la CLH est un facteur clé et concerne tant
l’efficacité que l’efficience des opérations.
Le terme « durabilité », ou performance durable, a été utilisé dans un large éventail de disciplines et de
contextes, mais il a reçu peu d'attention dans le domaine de la réponse aux crises humanitaires. Cela
n’est pas surprenant car toute CLH contribue à sauver des vies et à améliorer les conditions de vie de
la population et donc ceci semble tout justifier.
Néanmoins, certaines OH se sont déjà engagées pour développer des activités plus durables, même si
aujourd'hui il s'agit d'une déclaration de haut niveau. Tant la recherche sur le terrain comme la
littérature scientifique soulignent que les décideurs dans le contexte de l’aide humanitaire n'ont pas les
outils adéquats pour évaluer l’impact de leurs décisions en termes de durabilité.
Plus encore, l’évolution dans les attentes de l'opinion publique (et donc les donateurs) suggère que la
durabilité de la CLH, en termes de performance, devra être prise en compte dans les années à venir
pour assurer la compétitivité, et donc le maintien de l’activité.
La Figure 10, dans le chapitre d’introduction de ces travaux de thèse, synthétise l’évolution dans les
attentes liées à la performance depuis le début de la CLH jusqu’à nos jours.
C’est donc dans ce contexte que ces travaux de recherche se positionnent, avec l’hypothèse que
maitriser la performance durable dans les années à venir sera incontournable pour les décideurs de la
CLH.
Défis de la Chaîne Logistique Humanitaire durable
Pour maitriser la performance durable des opérations dans la CLH, trois défis majeurs ont été
identifiés d’après la littérature scientifique et les données/observations au terrain.
- Difficultés à mesurer la durabilité
La performance durable est souvent définie par le biais de la TBL, pour Tripple Bottom Line en
anglais, qui se compose des dimensions économiques, environnementale et sociale. La TBL
est une approche systémique qui souligne la nécessité d’atteindre un minimum de
performance pour les trois dimensions, mais il n’existe pas de consensus sur les compromis et
les synergies entre les trois.
La définition macro-économique de la durabilité et les trois dimensions peuvent expliquer le
développement durable d'un point de vue conceptuel, mais ne fournissent pas assez
d'indications sur la manière dont la durabilité doit être abordée dans le contexte des
opérations de la CLH.
- Planification insuffisante
Pour maîtriser la performance il faut être capable d’anticiper l’impact des décisions, ce qui
relève de la planification. Cependant, le contexte des CLH est caractérisé par un manque de
planification structurée (Haavisto et Kovács, 2014). De plus, le réseau de logistique
humanitaire est de plus en plus complexe à gérer, avec des entrepôts dits de « pre-
positionnement » localisés tout autour du Globe, des partenariats avec des industriels ou
encore des organismes de coordination inter-organisation comme les Clusters des Nations
Unies.

Vers un Système d’Aide à la Décision pour une CLH Durable
11
Ce manque de planification lié à la complexité du réseau, entraîne des défaillances dans la
gestion de l’approvisionnement (i.e. gestion des stocks, mode de distribution, choix des
fournisseurs), et donc des inefficacités et inefficiences telles que l'effet coup de fouet ou les
retards de distribution, et constitue un obstacle à l'alignement des opérations sur des objectifs
durables.
- Absence de systèmes d'aide à la décision adéquats
Dans les chaînes d’approvisionnement commerciales, les processus de planification sont de
plus en plus pris en charge par des systèmes d’aide à la décision (ERP, TMS, APS). Un
système d’aide à la décision est généralement défini comme « un système d’information
interactif basé sur ordinateur conçu pour prendre en charge des solutions aux problèmes de
décision » (Liu et al. 2010). Dans la gestion des opérations, les systèmes d’aide à la décision
reposent souvent sur des approches de recherche opérationnelle (RO).
En matière de gestion des crises humanitaires, il est de plus en plus reconnu la nécessité
d’étudier l’applicabilité de la RO. Bien que de nombreuses recherches aient été menées sur la
mise au point de modèles de RO pour appuyer la prise de décision dans la CLH, très peut ont
un impact réel sur le terrain (Laguna Salvadó et al. 2015).
Problématique scientifique et terrain
La littérature souligne que la durabilité est toujours négligée dans les contextes humanitaires, même si
elle est essentielle pour aligner les objectifs opérationnels sur les objectifs à long terme de l'action
humanitaire. Plusieurs auteurs ont appelé à davantage de recherches pour intégrer la durabilité aux
prises de décision humanitaires (Haavisto et Kovács 2014; Klumpp et al. 2015; Kunz et Gold 2017).
Il est fondamental de bien comprendre le contexte de la CLH et de concevoir des solutions reposant
sur une hypothèse forte, basée sur le terrain. Par conséquent, l'objectif de ce travail de recherche est
d'aborder les questions de recherche suivantes :
Question de recherche 1 : Comment conceptualiser formellement ce qu'est un CLH ?
Le CLH est un système collaboratif dans lequel de nombreux acteurs et parties prenantes
interagissent pour atteindre l'objectif ultime de « alléger la souffrance humaine ». Pour
améliorer la performance globale d’un système, il est essentiel d’en avoir une connaissance
suffisante. Des travaux de recherche antérieurs ont proposé des modèles pour définir ces
connaissances, mais aucun de couvre totalement la CLH en tant que système collaboratif.
La difficulté donc, reste de disposer d’une conceptualisation partagée et suffisamment
explicite de la CLH pour, d’une part, comprendre, puis pour améliorer le comportement du
système. Cette question de recherche est intéressante à la fois pour l’académique et les
praticiens de terrain, car elle devrait contribuer au partage des connaissances et à la
communication entre les praticiens eux-mêmes, ainsi qu’entre les praticiens et les
universitaires. Il peut également contribuer à la recherche en facilitant la conception et analyse
de la recherche sur le terrain.

Résumé long en Français
12
Question de recherche 2 : Que signifie la durabilité des opérations de la CLH et
comment peut-on l’évaluer ?
Compte tenu de l’augmentation du nombre de publications scientifiques qui s’intéressent au
concept de « durabilité » dans de nombreuses disciplines, on peut considérer la durabilité
comme un sujet à la mode. Ceci n’empêche pas les difficultés pour définir qu’est-ce que la
performance durable dans le cadre de la CLH.
Déjà, la durabilité est un concept multidimensionnel. De plus, on remarque que le niveau de
granularité des mesures de la durabilité proposées dans la littérature sont généralement
contraires à la transférabilité de ces mesures. C’est-à-dire, il semble que l’évaluations de la
durabilité corresponds souvent à des objectifs de haut niveau (petite granularité) qui ne sont
pas transférables (et donc n’appuient pas) les niveaux de décision tactiques et opérationnels
(petite granularité). Ainsi, à ces niveaux de décision, chaque secteur d'activité doit trouver un
moyen fiable de quantifier la durabilité.
Même si les OH ont déjà souscrit au programme de développement durable, il est encore
difficile de concrétiser ce qu'est une performance durable aux différents niveaux de décision.
Cette question de recherche est pertinente pour les académiques car elle vise à contribuer à
combler le fossé entre les concepts généraux de durabilité et le domaine de recherche, ainsi
que pour les praticiens car elle vise à permettre l’évaluation de la durabilité dans les processus
décisionnels en matière de CLH.
Question de recherche 3 : Comment aider les décideurs à faire des compromis en
matière de durabilité et à en explorer les conséquences de manière consciente et
systématique ?
Pour améliorer la durabilité des opérations, les décideurs peuvent tirer parti de l’évaluation a
priori de la durabilité dans le processus de planification. Pour planifier des opérations durables,
les décideurs doivent faire des compromis sur la durabilité de manière transparente, sur la base
de leur connaissance de la situation (objectifs et intérêts organisationnels, expertise, etc.) et de
la prise de conscience de leurs conséquences.
Cependant, les systèmes d'aide à la décision qui traitent des compromis ne sont pas alignés sur
les exigences des praticiens en termes de compétences et de temps. Les utilisateurs doivent
généralement gérer des pondérations et des dépendances abstraites et complexes, ce qui peut
constituer un obstacle à l'acceptabilité des systèmes d'aide à la décision sur le terrain. Le défi
consiste alors à concevoir et à développer une approche de système d’aide à la décision qui
contribue à réduire l’écart entre les propositions académiques et la convivialité sur le terrain.
Cette orientation de recherche est intéressante pour les universitaires car elle vise à utiliser des
méthodes pour des non-experts et, partant, à améliorer systématiquement les processus de
planification des CSS.
La Figure 17, dans le chapitre d’introduction aux travaux de recherche, montre une synthèse des
grandes problématiques abordées dans ces travaux. L’objectif finale étant de proposer un système
d’aide à la décision pour une CLH durable, trois étapes sont abordées :

Vers un Système d’Aide à la Décision pour une CLH Durable
13
- la description du système CLH, afin de structurer la connaissance,
- la description des objectifs de durabilité, pour ainsi pourvoir évaluer la durabilité dans le
contexte de la CLH, et
- la prise de décisions qui prennent en compte la durabilité du système, et donc pour pouvoir
proposer un système pour aider à la planification tactique (Master Planning) de la CLH.
Méthodologie de recherche
Pour répondre aux questions de recherche, et réduire l'écart entre la pratique et la recherche
(fortement critiquée), nous avons suivi une approche de recherche inductive. Inductive, car le
problème et les solutions sont tous deux fondés sur des recherches sur le terrain, dans le but de créer
une hypothèse générale.
Dans ce sens, on a suivi la philosophie de la recherche-action. Nous avons donc collaboré tout au long
du projet avec la branche logistique de la Fédération Internationale de la Croix Rouge (FICR), plus
précisément avec le Centre Logistique Régional de l’Amérique et des Caraïbes, située au Panama.
La force des propositions repose sur la capacité d'identifier un problème pertinent pour les OH. La
méthode utilisée est la collecte de données sur le terrain, avec une analyse et des retours sur les
résultats vers les OH. Nous avons utilisé des données secondaires et primaires de la FICR, et d’autres
ONGs et agences humanitaires.
Les données secondaires se trouvaient principalement sur Internet et sont constitués notamment de
rapports annuels et communications sur les opérations. Le site reliefweb.net a été utilisé comme point
de départ.
Pour les données primaires, nous avons mené une campagne de recherche sur le terrain au Panama, au
Centre Logistique Régional de la FICR, et utilisé des entretiens semi-structurés, des observations et un
accès aux documents.
Recherche terrain avec la FICR au Panama
Où? Centre Logistique Régional de la FICR en Amérique (Panama). Bureaux et
entrepôts.
Quand? 10 jours en septembre 2015
Qui? Un chercheur sur le terrain et deux dans le « back office »
Quoi? Formaliser les processus opérationnels de la CLH. L’objectif était d’identifier
les défis du système et opportunités pour les décideurs.
Les résultats des recherches sur le terrain (enjeux métiers), associés à la revue de la littérature, ont
permis de formuler les trois questions de recherche (enjeux scientifiques) développées dans ce
manuscrit.

Résumé long en Français
14
Pour construire des contributions scientifiques, des travaux approfondis ont permis de mettre au point
des méthodes originales, ou ont adapté les méthodes existantes permettant de répondre aux questions
de recherche et aux enjeux de l’organisation, la FICR.
De plus, un démonstrateur de chaque contribution a été développé et validé avec une preuve de
concept basée sur des données de recherche sur le terrain.
1ère contribution : Métamodèle de la CLH
Pour faciliter la formalisation et la compréhension de la CLH, le chapitre 2 du manuscrit présente un
métamodèle du système CLH. La contribution s’appuie sur les travaux de Benaben et al. (2016), qui
ont proposé de définir tout système collaboratif à partir de quatre briques : le contexte, les partenaires,
les objectifs et le comportement. Ces quatre briques forment le cœur du métamodèle, sur lequel des
concepts correspondants a un domaine donné peuvent être structurés.
Dans ce chapitre il est décrit la couche du métamodèle correspondante au système CLH. La Figure 34
montre une synthèse de cette contribution. Cette approche repose sur l'hypothèse que le CLH est un
système collaboratif qui peut être décrit par des concepts spécifiques au domaine, mais assez
génériques pour être transposables d’une CLH à une autre. Nous avons construit et organisé le
métamodèle à partir des concepts retrouvés dans la littérature ainsi que grâce aux recherches terrain.
Cette proposition est originale étant donné qu’aujourd’hui, il n’existe pas de conceptualisation formelle
standard d’un système CLH. Elle permet donc d’organiser les informations relatives à une CLH d’une
manière structurée. Les utilisations potentielles d’un tel métamodèle sont multiples, et nous mettons
donc en avant :
- le développement de supports pour la recherche terrain : le métamodèle est un outil
qui permet de structurer l’information pour générer de la connaissance. Pendant les
explorations de terrain, il peut faciliter la recollecte d’information d’une manière
structurée, ainsi que la réutilisation de résultats (modèles).
- le développement de systèmes d’information spécialisés de la CLH : le métamodèle
permettrait à des SI d’intégrer et d’interpréter l’information et générer donc de la
connaissance et notamment de l’aide a la décision.
- soutenir des étapes concrètes d’amélioration continue pour les aspects logistiques :
pour identifier les points faibles d’une CLH donnée, il faut maitriser l’état actuel
(cartographie ASIS). Le métamodèle permettrait de faciliter cette tâche et d’assurer
l’intégrité des éléments nécessaires pour analyser.
Nous avons validé et démontré l’intérêt du métamodèle de la CLH en construisant des supports pour
la recherche terrain. Ces outils ont été utilisées dans le cadre du cas d’étude de la FICR et on permit un
recueil exhaustif et reproductible d’information.
Limites : L'application pratique (et donc la validation) du métamodèle pour d’autres utilisations
suggérées telles que la définition des spécifications d’un système d’information, ou pour faciliter la
coordination et interopérabilité des OH, n'a pas été mise en œuvre.

Vers un Système d’Aide à la Décision pour une CLH Durable
15
2ème contribution : la maison des opérations de la CLH durable
Les objectifs de cette seconde contribution sont doubles :
(1) clarifier le concept de la CLH durable,
(2) créer un cadre pour évaluer la performance des opérations.
Tout d’abord, on a défini un cadre de mesure de la performance : La Maison des opérations de la CLH
durable. Ce cadre traduit les concepts de durabilité en opérations concrètes de la chaîne
d’approvisionnement (achats, entreposage, transport) et souligne la nécessité de prendre en compte les
trois dimensions du TBL pour améliorer la durabilité opérations. Les critères ont été définis en tenant
compte de l'analyse de la littérature sur la durabilité de la chaîne d’approvisionnement et de l'impact
des processus (achats, stockage et transport) sur les différentes sous-dimensions.
Ensuite, un modèle et une méthode pour évaluer la maturité de performance de la CLH durable sont
proposés. Pour illustrer l'utilisation du modèle d'évaluation de la maturité, une preuve de concept a été
construite avec une étude de cas de là FICR. La Figure 49 et la Figure 53 montrent la Maison des
opérations de la CLH durable et le modèle pour mesurer la maturité d’un système de CLH en termes
de durabilité respectivement.
Ce chapitre contribue de manière significative à la discussion naissante sur la durabilité des CLHs. Il
amène des éléments de discussion et pour l’évaluation concrète de la durabilité des opérations de la
CLH, qui semble encore difficile dans de nombreuses disciplines.
Le cadre de performance présenté dans le chapitre 3 constitue donc la base de l'élaboration d'un
système d'aide à la décision permettant d'optimiser la planification des opérations de la CLH en ce qui
concerne les impacts du TBL. Toutefois, la durabilité étant un concept multidimensionnel aux
objectifs contradictoires, le défi consiste maintenant à maitriser les compromis et synergies au travers
des dimensions économique, environnementale et sociale.
Limites : le cadre a été mis au point grâce aux contributions des recherches sur le terrain avec la FICR,
ainsi qu’aux grilles d’évaluation de la maturité. Une validation plus large devrait être menée avec des
experts de différents OH, afin de consolider un point de repère permettant de comparer les
organisations.
3ème contribution : un système d’aide à la décision pour le Master
Planning (comment ?)
Enfin, la dernière contribution (chapitre 4) développe une approche pour intégrer de manière concrète
la prise en compte de la performance durable lors de la planification des opérations de la CLH.
À partir des recherches sur le terrain et de la littérature, le niveau de planification tactique est identifié
comme un bon catalyseur pour introduire la durabilité dans le processus de prise de décision.
Par conséquent, le problème de la planification tactique (Master Planning) de la CLH durable a été
abordé. Sur la base du réseau de la FICR en Amérique, un ensemble de critères de performance
durable (social, économique et environnemental) ont été sélectionné et définis à fin d’être mesurables.

Résumé long en Français
16
Ensuite, le réseau logistique dit amont (des fournisseurs jusqu’aux points d’entré aux endroits
géographiques affectés par des crises) et les indicateurs sont modélisé mathématiquement avec les
outils de recherche opérationnelle déterministes. Il est proposé de résoudre le système avec un
algorithme d’ordonnancement lexicographique interactif qui permet de prendre en compte l’expertise
des décideurs dans le processus de planification. La Figure 59 montre le diagramme logique de
l’algorithme qui a été développé dans cette contribution.
Limites : le cas d'utilisation de la FICR en Amérique couvre le processus décisionnel interne et en
amont, qui ne représente qu'un périmètre limité de l'ensemble de la CLH (des fournisseurs aux
utilisateurs finaux). L'application pratique à un périmètre plus large et à d’autres OH reste à faire. De
plus, beaucoup de données sont nécessaires pour exécuter le modèle. La capacité de collecte de ces
données doit donc être étudiée en amont, de même que la sensibilité des résultats.
Perspectives
Le chapitre 5 du manuscrit présente les contributions, résultats et conclusion de ces travaux, que nous
avons déjà évoqué dans ce résumé.
Pour synthétiser, les trois grandes questions qu’ont été abordées pour aller vers une CLH durable sont
donc :
- la modélisation du système CLH en tant que système collaboratif,
- la définition de la performance durable dans le contexte de la CLH, et
- le développement d’un outil pour aider à planifier les opérations tactiques d’une CLH.
Nous présentons ici une feuille de route visant à consolider les propositions et à proposer de nouvelles
orientations de recherche.
Perspectives à court terme (validation)
i. Validation plus large avec scénario réel :
Pour démontrer la validité des propositions, toutes les contributions ont été validées via le cas
d'utilisation de la FICR en Amérique. Néanmoins, chacune des contributions a été construite
avec un ensemble de données limité étendu par des hypothèses. Bien que les hypothèses aient
été discutées avec les praticiens ou fondées sur des observations sur le terrain et / ou la revue
de la littérature, il serait pertinent de définir un scénario basé sur un ensemble complet de
données réelles.
ii. Validation en temps réel :
Pour construire un scénario réel, il serait approprié de s’engager avec la FICR sur une
campagne de recherche sur le terrain dédiée à la collecte et exploitation de données en temps
réel. En outre, les praticiens pourraient effectuer une étape de validation en comparant les
résultats de performance avec et sans utiliser le système d’aide à la planification de la CLH.
Vers un Système d’Aide à la Décision pour une CLH Durable
17
iii. Hypothèses du modèle contrastés avec d'autres OH :
Les hypothèses ont été construites sur les spécificités de la CLH amont de la FICR. Il s’agit
d’une limitation et l’une des perspectives serait donc d’étendre la validation à un plus grand
nombre d’OH, tels que le Plan Alimentaire Mondial (PAM) ou même Médecins sans
Frontières (MSF), qui gèrent des réseaux de CLH similaires. La portée des autres CLH peut
différer en termes de contexte (i.e. conflits armés) et, par conséquent, l'hypothèse et les
contraintes du modèle de flux de réseau CLH peuvent différer.
iv. Une évaluation plus approfondie de la sensibilité :
La sensibilité du modèle doit être examinée plus en profondeur avec un jeu de données réel.
L'objectif est d'aider les utilisateurs à interpréter et à anticiper les conséquences de leurs choix
au cours du processus de décision.
Perspectives à moyen terme (mise en œuvre)
v. Interaction homme-machine
Dans la troisième contribution, nous nous sommes concentrés sur l'algorithme et le modèle
permettant d'évaluer la durabilité et de résoudre le problème décisionnel lié à la planification
durable. Bien que nous ayons pris en compte le savoir-faire des utilisateurs pour hiérarchiser
les objectifs de performance, l’utilisation du système reste complexe pour les non-initiés. Pour
renforcer l'approche de la recherche appliquée, des travaux supplémentaires doivent être
menés pour concevoir et développer des interactions ergonomiques homme-machine.
Développer des interfaces utilisables (efficaces, performantes et satisfaisantes) est une
question interdisciplinaire qui concerne l'ingénierie informatique et qui bénéficierait également
d'une perspective des sciences sociales (conception d'interaction) (Dix 2009).
vi. Transfert technologique
Une fois le prototype mis en œuvre, il est important d’envisager la diffusion du système d’aide
à la décision parmi les utilisateurs potentiels (accès à la connaissance). L’intégration avec les
systèmes d’information existants (par exemple, ERP) est une question connexe importante à
prendre en compte. Cela peut notamment révéler des problèmes d'interopérabilité.
Perspectives à long therme (évolutions)
vii. Évaluations du cycle de vie
Une approche standard pour évaluer les impacts d'un produit sur les différentes dimensions
de la durabilité consiste à effectuer une analyse du cycle de vie (ACV). Cette évaluation a
généralement été réalisée pour la dimension environnementale, mais certains auteurs
envisagent également de réaliser une ACV sociale. C'est une perspective intéressante à suivre
car elle peut permettre d'identifier, dans une perspective d'amélioration continue, les étapes de
la CLH qui ont l'impact le plus négatif.

Résumé long en Français
18
viii. Vers un système de planification avancée humanitaire
Le but ultime de la CLH est de générer un comportement décisionnel synergique avec toutes
les parties prenantes de la réponse humanitaire en amont et en aval. Ce travail de recherche a
abordé une première étape, avec le développement d'un module de planification de base, pour
la CLH en amont. Cependant, la question de savoir comment les décisions prises en amont
ont un impact sur la durabilité globale des CLH reste posée. Comment les décideurs peuvent-
ils acquérir une perspective holistique ?
Par conséquent, pour améliorer les opérations de la CLH, deux perspectives intéressantes se
dégagent :
(1) l’intégration des différents niveaux de planification et
(2) l’intégration des parties prenantes en amont et en aval.
Pour les Chaînes Logistiques commerciales, les APS (Advanced Planning Systems) sont
considérées comme la solution pour intégrer tous les processus de décision en utilisant une
approche hiérarchique. Cependant, le contexte des opérations humanitaires soulève des
difficultés supplémentaires : les réseaux en aval sont déployés de manière ad-hoc, les
collaborations entre les parties prenantes peuvent être sporadiques et la prise de décision peut
être décentralisée.
- Est-il alors possible de développer une SAP humanitaire agile et/ou flexible ?
- Comment aborder la dynamique et l'incertitude du système ?
Néanmoins, de nombreuses études ont déjà été menées sur la prise de décision au niveau
stratégique, avec par exemple la conception du réseau (Aurélie Charles 2010; Vargas Florez et
al. 2015), ou au niveau opérationnel avec des problèmes de prise de décision concernant la
distribution du dernier kilomètre (Burcu Balcik. et al 2008). Des questions restent à résoudre :
- Comment introduire la perspective durable dans les différents niveaux de décision et
- Comment assurer l’interopérabilité des différents systèmes ?
L’utilisation du métamodèle CLH peut être un facteur facilitant le développement de l’APS
humanitaire durable, si elle est utilisée comme référence commune pour définir le réseau.
ix. Agilité (détection, adaptation)
Enfin, les opérations de la CLH durable doivent faire face à un degré d'incertitude élevé. Par
conséquent, le processus de prise de décision requiert des méthodes qui s’adaptent à la
dynamique de l’environnement. Notre contribution se limite à la conception d'un processus
(le schéma directeur) et, pour faire face à l'incertitude, nous avons proposé une approche de
planification à horizon glissant. Un système agile peut détecter les écarts entre le plan et la
réalité et s'adapter à la nouvelle situation. Un processus décisionnel agile peut être mis en
œuvre en ajoutant les deux dimensions : détection et adaptation.

19
Chapter I. INTRODUCTION
“When a humanitarian disaster hits, affected
communities frequently require essential, appropriate and
timely humanitarian assistance.”
(Humanitarian Coalition 2015)
1. Humanitarian Supply Chain Context
We introduce in this section the concepts of humanitarian disasters and the response to them to
obtain an overview of what a Humanitarian Supply Chain (HSC) is and what the main challenges to be
solved in the future will be.
1.1. Humanitarian Disasters
1.1.1. Disaster terminology
For the moment, there is no consensus on the definition of a “humanitarian disaster”. In the
academic literature, Pearce defined it as “a non-routine event that exceeds the capacity of the affected
area to respond to it in such a way as to save lives; to preserve property; and to maintain the social,
ecological, economic, and political stability of the affected region” (Holguín-Veras et al. 2012; Pearce,
2000). The United Nations International Strategy for Disaster Reduction (UNISDR) defines a disaster
as a “serious disruption of the functioning of a community or a society (due to hazardous events
interacting with conditions of vulnerability and exposure) leading to widespread human, material,
economic or environmental losses and impacts” (UNISDR, 2009). This second definition stresses the
fact that disasters are always the consequence of a hazard.
A hazard is defined as “something that is dangerous and likely to cause damage” (Cambridge
dictionary, 2017). Therefore, the disaster’s severity depends on how much impact a hazard has on a
society and the environment. The UNISDR highlights that the impact of a hazard depends on
population vulnerability1 and exposure2 (UNISDR, 2017). This approach is in line with the academic
literature that studies how to mitigate the risk and impact of hazards. Exposure emphasizes that the
location of the hazard influences its impact. For example, the same magnitude earthquake that hits a
city or that hits a desert will not have the same consequences. The impact also depends on the
standards of living in the area. If the city is in a developing country the damage may be more severe.
Vulnerability emphasizes that some groups are more prone to damage. Poor populations are more
likely to be vulnerable than rich populations. Within affected communities, typically vulnerable groups
include children, pregnant and nursing women, migrants, and displaced people
1 Vulnerability is the characteristics determined by physical, social, economic and environmental factors or processes which increase the susceptibility of an individual, a community, assets or systems to the impacts of hazards (UNISDR, 2017).
2 Exposure is the situation of people, infrastructure, housing, production capacities and other tangible human assets located in hazard-prone areas (UNISDR, 2017).

Chapter I. Introduction
20
1.1.2. Humanitarian disaster typologies
Humanitarian disasters are often classified by the origin of the hazard: either natural, caused by
physical or biological hazards; or man-made (Van Wassenhove, 2006). The speed of the hazard onset
is also a relevant characteristic. Sudden-onsets refer to disasters that impact a community within a
short period of time. A typical example of a natural sudden-onset is an earthquake. Slow-onset
disasters are the humanitarian disasters that evolve progressively over time, for example droughts. The
main difference is that slow-onset disasters can be mitigated by early response. Unfortunately, as
stated by the United Nations Office for the Coordination of Humanitarian Affairs (UNOCHA), the
response to most slow-onset disasters often ends up resembling the response to sudden-onset
disasters (United Nations, 2011). Moreover, some disasters are recurrent due to the cyclical frequency
of natural hazards such as hurricanes or floods. An example is the “El Niño” phenomenon, which
generates both heavy rains and droughts in irregular cyclical patterns (every 2 to 7 years), and affects
especially the South American Pacific coastal areas (Vargas Florez et al. 2015).
The combination of several or prolonged hazards may lead to “complex disasters”. These are
characterized by extensive violence, displacement of populations, severe damage to societies and
economies and even more challenging: the potential prevention of the arrival of humanitarian
assistance because of political and military constraints. This complex disaster context is a risk for
humanitarian responders, as illustrated by the MSF (Médécins Sans Frontières) and ICRC
(International Committee of the Red Cross and Red Crescent) hospital attacks during the on-going
Syrian conflict.
In Table 1, a few recent examples are classified by origin of the hazard occurrence. The lines between
types of disaster are often blurred. Thus, this classification is illustrative, but non-exhaustive, and may
be controversial.
Table 1 Examples of Humanitarian Disaster classification by hazard typology
Natural Man-Made (and complex
emergencies)
Sudden-
onset
Nepal Earthquake (2015)
Ecuador Earthquake (2016)
Irma and Maria Hurricanes (2017)
Pakistan recurrent floods
Central African Republic, South Sudan
political conflict escalation (2016)
Earthquake, Tsunami and Fukushima
nuclear disaster (2011)
Samarco dam collapse (2015)
Slow-onset Sahel droughts (recurrent)
Zika outbreak (2016)
Ebola Outbreak (2013)
Syrian conflict (ongoing)
South Sudan chronic political crisis

Towards a Sustainable Humanitarian Supply Chain
21
1.1.3. Impact
Disaster impacts may include loss of life, injury, disease, and other negative effects on human physical,
mental, and social well-being, together with damage to property, destruction of assets, loss of services,
social and economic disruption, and environmental degradation.
A positive trend is that the number of casualties due to natural disasters has tended to decrease since
the beginning of the 20th century. Thanks to the improvement of early warning and planning systems,
disasters such as floods have became less deadly, while in contrast, earthquakes have became more
dangerous with the growth of cities and their vulnerability. However, statistics show a significant rise
in the number of affected people (Figure 1), particularly during the last ten years.
Figure 1 People targeted by humanitarian aid in the last decade (OCHA, 2017)
Evidence indicates that the exposure of persons and assets in all countries has increased faster than
vulnerability has decreased, as highlighted by the Sendai framework for disaster risk reduction (United
Nations, 2015).
Natural disasters are exacerbated by climate change and are increasing in frequency and intensity. The
United Nations Development Program (UNDP) highlighted that there has been a substantial increase
in heavy precipitation events, that droughts have become more common and more intense in tropical
and sub-tropical regions and that intense tropical cyclone activity has been on the rise since the 1970s
(UNDP, 2008). A clear example is the occurrence of increasingly severe hurricanes: Sandy (2012),
Matthew (2016), and Harvey, Irma, Jose & Maria (2017) illustrate this trend. The data from the last 40
years shows that that the intensity is becoming stronger for Atlantic hurricanes (Figure 2).
Figure 2 Atlantic hurricane trends (UCSUSA, 2016)
0
20
40
60
80
100
120
2005 2006 2007 2008 2009 2010 2011 2012 2013 2014 2015 2016 2017
Mil
lio
ns
People targeted by humanitarian aid

Chapter I. Introduction
22
Man-made disasters, mainly armed conflicts, have become a driver of prolonged humanitarian needs.
The main consequences are the increase in the number of populations forcibly displaced: refugees and
Internally Displaced People. The Syrian conflict has contributed substantially to these records,
especially in 2015, along with conflicts in neighboring countries such as Iraq and Yemen, and in many
other African crises. The total number has doubled from 1997, to attain 65.6 million people in 2016,
as shown in Figure 3.
Figure 3 Trend of global displacement & proportion displaced 1997-2016 (UNHCR, 2017)
Even though the proportion of newly displaced people has decreased, the problem now for the long-
term displaced population is that “many people remain in limbo for years in Internally Displaced
People camps, urban slums or other areas of refuge, a situation defined as protracted displacement.
“Lacking a permanent home or sustainable livelihoods, they often have little prospect of reaching a
durable solution” (UNHCR, 2017).
To sum up, the trends show an increase in both natural and man-made disaster occurrences and
impacts. Therefore, there is also an increase in the short- and long-term humanitarian needs.
Professionalization of humanitarian operations is more than ever a critical issue.
1.2. Humanitarian aid
1.2.1. The Disaster Management Cycle
Humanitarian disaster management is described as a four-phase cycle: preparedness, response,
recovery and mitigation phases (Figure 4).

Towards a Sustainable Humanitarian Supply Chain
23
Figure 4 Disaster Management Cycle (Haddow and Bullock, 2004)
In the short term, affected communities need external interventions to maintain and improve the
quality of life of the affected population. Such assistance may range from providing specific but
limited aid, such as transport, temporary shelter, and food, to establishing semi-permanent settlements
in camps and other locations, before coming back to a “normal” situation. Providing such relief aid is
the role of humanitarian responders during the response phase. Before a disaster happens, efforts are
put on the preparedness of the areas and populations at risk. Humanitarian Organizations (HOs) have
developed disaster preparedness initiatives during the past decades, which have provided quicker and
more effective responses to humanitarian crises. As an example, the Inter-Agency Standing
Committee (IASC) proactively anticipates the coordination of international responders with the
Emergency Response Preparedness approach.
In the long term, humanitarian responders work on the recovery of the affected communities to come
back to a “normal” situation and on the development of community’s resilience1 to mitigate the
impacts of future disasters. Mitigation is typically addressed by the scope of development projects,
which addresses systematic problems of developing countries, with a focus on economic, social and
political development.
This separation between short and long-term humanitarian aid is blurred, because it is not clear when
the relief is finished and the recovery begins. This thesis focuses, however, on relief assistance delivery
(short-term humanitarian needs coverage), so therefore on the preparation and response phases
exclusively.
1.2.2. Humanitarian Actors
In the aftermath of a disaster, the first responders are local or national. They can belong to many
different actors such as the authorities, civil defense, communities (e.g. churches), local or
1 Resilience is defined as: “The ability of a system, community or society exposed to hazards to resist, absorb,
accommodate to and recover from the effects of a hazard in a timely and efficient manner, including through the preservation and restoration of its essential basic structures and functions”, United Nations Office for Disaster Risk Reduction (UNISDR), “2009 UNISDR Terminology on Disaster Risk Reduction”, Geneva, May 2009 (http://www.unisdr.org/we/inform/terminology).

Chapter I. Introduction
24
international Non-Governmental Organizations (NGOs), which are already in the field. When the
authorities of a country/region are overwhelmed by a humanitarian crisis, the international community
is mobilized. The IASC, for example, activates exceptional response mechanisms when an emergency
requires a system-wide response (so-called Level 3 emergencies). For the designation of an L3
emergency, the IASC protocol establishes the analysis of five criteria: scale, complexity, urgency,
capacity, and reputational risk.
The international response includes a large variety of HOs (NGOs, UN agencies, humanitarian
agencies, etc.), which interact with other stakeholders: governments, militaries, media, donors
(public/private), etc. Figure 5 gives an overview of the variety of organizations that are part of the
humanitarian response.
Our focus is on HOs, which include Humanitarian Agencies such as the World Food Programme
(WFP), the International Federation of the Red Cross (IFRC), the ICRC and local and international
NGOs (i.e. MSF, Save the Children, Care). HOs are supposed to provide relief assistance while
following humanitarian principles: humanity, neutrality, impartiality and independence. The UN
General Assembly formally established these core principles in 1991 (humanity, impartiality and
neutrality) and 2004 (independence) was inspired and reiterated by the IFRC/ICRC. Nonetheless,
each HO has its own mandates in accordance with the HO’s objectives. The common characteristics
of HOs are (Charles and Lauras 2011):
• They are under-resourced, with limited skills availability and high employee turnover that limits institutional memory and efficiency.
• Ineffective leverage of technology (i.e. non-robust equipment) and in particular, Information Systems that are relatively basic.
• Decision-making tends to be distributed and does not follow command/control approaches.
• HOs deal with several disasters at the same time, including both relief assistance and development projects.

Towards a Sustainable Humanitarian Supply Chain
25
Figure 5 The Humanitarian Decision-makers Taxonomy (Gralla et al. 2013)

Chapter I. Introduction
26
1.2.3. Humanitarian Organization coordination
Coordination in a humanitarian disaster context can be defined as the relationship and interactions
among different actors operating within the relief environment (Balcik et al. 2010). HO coordination is
an important issue, as experience has demonstrated that a lack of coordination within or between HOs
leads to inefficiencies and ineffective relief operations. Coordination, still considered a weakness of the
humanitarian sector, can take place at different granularity levels (local, global) and in different forms
(Laguna Salvadó et al. 2015).
• Intra-Organizational Coordination concerns the internal relationships and interactions within an organization. The organizational structure is a key element (e.g. field teams with Head Quarters). This can be difficult due to the lack of “command and control” hierarchical approaches in organizations such as the IFRC, where the National Societies are autonomous.
• Inter-Organizational Coordination concerns the coordination between organizations at local and global levels. This coordination is difficult, variable, and rather low (Charles et al. 2010). The main difficulties and enablers at the local (Table 2) and global level (Table 3) were summarized by Charles et al. (2010):
Table 2 Coordination barriers and enablers to implement collaboration networks involving
humanitarian organizations at a local level (Charles et al. 2010)
Table 3 Barriers and enablers to implement collaboration networks involving HOs at a global level
(Charles et al. 2010)

Towards a Sustainable Humanitarian Supply Chain
27
Nonetheless, efforts have been made to improve this challenging coordination. The foundations of
the current HO international coordination system were set by UN General Assembly resolution
46/182 in December 1991. Almost 15 years later, in 2005, a major reform of the humanitarian
coordination approach, known as Humanitarian Reform, introduced a number of new elements to
enhance predictability, accountability and partnership. The Cluster Approach, a coordination
facilitator mechanism, was one of these new elements.
Figure 6 UN cluster coordination approach
In the Cluster Approach, HOs (both UN and non-UN) are represented in one (or several) of the 8
main clusters of humanitarian action: Food and Security, Early Recovery, Education, Water Sanitation
& Hygiene, Logistics, Health & Nutrition, and Shelter and Protection. The lead organization is
designated by the IASC and has clear responsibility for coordination. The main objective of the system
is to facilitate the exchange of information between the different HOs in the field in the aftermath of a
disaster. One of the core functions of a cluster at country-level is to inform strategic decision-makers,
and provide coordination of needs assessment, gap analysis and prioritization (UN OCHA, 2014).
However, some HOs feel that the Cluster Approach is contradictory to the humanitarian principles of
independence, impartiality, and neutrality (Humphries, 2013). Other arguments against it are the lack
of performance, most notably in overhead and lack of agility1. Delaunay, the MSF-USA Executive
Director, declared in 2012, “Coordination should not be an end. It should be a means and too often, especially what
we have learned over the years in emergency situations, the coordination mechanism itself is an obstacle to intervene. It
slows down the process.” (Labbé, 2012).
There are other experiences of UN inter-organizational coordination approaches such as the one
deployed during the West Africa Ebola Outbreak. WHO led the UN Mission for Ebola Emergency
Response (UNMEER). It was set up as a temporary measure to meet immediate needs related to the
unprecedented fight against Ebola. The mission deployed financial, logistical and human resources to
Guinea, Liberia and Sierra Leone. However, as it was deployed “ad-hoc” in a complex situation, and
1 Agility is defined as (Detection + Adaptation) x Reactivity by (Bénabén 2012)

Chapter I. Introduction
28
some problems were encountered such as the lack of expertise of management leaders (Comes et al.
2015).
Out of all the sectors of the humanitarian response, this thesis focuses on the “logistics” activities, and
in particular on certain HSC management challenges.
1.3. Humanitarian Supply Chain
To have the right resources in the right place and at the right time is crucial for a successful
humanitarian intervention. In a disaster response, the main flows concerned were defined by
(Tomasini and Van Wassenhove, 2009) as the 5b’s: boxes (materials), bucks (finance), bodies
(manpower), brains (knowledge and skills) and bytes (info).
HSC management is defined by (Thomas & Mizushima, 2005) as “the process of planning,
implementing and controlling the efficient, cost-effective flow and storage of goods and materials, as
well as related information, from point of origin to point of consumption.” (Kovács and Spens, 2012)
adds that HSC management also includes coordination and collaboration with supply chain third party
service providers, and across HOs, but does not include the development aid aspect of humanitarian
logistics.
Depending on the disaster, HSCs can take many forms and concern different actors. However, the
material flow follows repetitive patterns. A typical HSC connects emergency item suppliers to the
beneficiaries through a network of organizations, warehouses and transport flows (Figure 7) to satisfy
the humanitarian needs.
Figure 7 HSC network (inspired from (Baharmand et al. 2015))
In contrast to commercial supply chains (SC), and due to the nature of disasters, HSCs deal with
extremely uncertain and unexpected needs, which result in the design and deployment of ad-hoc
downstream networks to reach the beneficiaries (point of demand, see Figure 7). The upstream HSC
deals with all upcoming and on-going humanitarian crises and resulting aggregated demands. Finally,
the main humanitarian-specific attributes are (Widera et al. 2013):
• Prioritization of responsive (effective) instead of efficient (cost-effective) behaviors: due to
the HSC purpose of “alleviating human suffering”, the main concern at the response phase

Towards a Sustainable Humanitarian Supply Chain
29
has historically been to satisfy humanitarian needs “no matter what the cost”. This tendency is
changing due to funding shortage.
• Uncertain and unpredictable demand: due to the nature of disaster, it is difficult to build long-
term planning of humanitarian needs. Even though past trends allow “forecasting” of the
potential needs, at least for recurrent disasters, decision-makers always face strong uncertainty.
• The role of donors as buyers and beneficiaries as end users: The definition of the customers
of an HSC is difficult due to this duality. The value expected by beneficiaries and donors is
not the same, but is strongly related. Thus, HSC decision-makers have to satisfy both
beneficiaries’ and donors’ expectations.
• A highly volatile environment, and partly temporary and unknown HSC design: not only is
demand uncertain, but also the environment and the HSC itself. Depending on the disaster
context (which is unknown), the HSC network will adapt and deploy on the fly.
• Focus on procurement and distribution within the logistics value chain: With the exception of
kitting, no transformation is made to the emergency products.
Some HOs have made HSCs part of their “core business”, such as the IFRC, the UN Humanitarian
Response Depot (UNHRD), managed by WFP, or MSF. These HOs have developed specialized skills
in supply chain management (SCM).

Chapter I. Introduction
30
2. Problem Statement
In this section, the past evolutions and upcoming challenges that the HSC managers face from a
practical perspective will first be discussed, and second, the gaps will be identified from an academic
perspective.
2.1. Towards a Humanitarian Sustainable Supply Chain
Even though HSC has always been part of disaster response, the awareness of its key role grew
significantly during the last decade. Therefore, the management of HSC operations has evolved from a
reactive behavior focused on disaster response towards the current effective/efficient behavior that
includes the preparation phase. Nonetheless, performance has not been systematically evaluated in the
HSC field, probably because measuring the “alleviation of human suffering” is intangible (Beamon
and Balcik, 2008). This section explores past, present and future trends of HSC performance.
2.1.1. The effective and fire-fighting HSC management approach
In contrast with commercial supply chain performance approaches, effectiveness is, and has been, the
main driver or value of HSC (Widera et al. 2013). Effectiveness is the ability to enhance the expected
results (Lauras, 2004). It is commonly defined as achieving target outcomes.
Therefore, considering that the expected results of a relief operation are to alleviate human suffering
by procuring emergency relief items, we can acknowledge that the effectiveness of an HSC is the
ability to satisfy humanitarian needs in terms of emergency items (i.e. shelter, food, hygiene), on time.
However, fire-fighting behavior has also characterized disaster relief operations. Fire fighting happens
when, due to time pressure, decision-makers rush from one humanitarian response to the next, and no
time can be invested in solving problems.
Consequently, up until the end of the 20th century, decision-makers were mainly focused on response,
and overlooked the preparedness phase. In addition, HSC management was a “back-office” support
function.
At that time, the occurrence of major humanitarian disasters made evident the weaknesses of a
responsive management approach. Due to the scale of the disasters, along with the unprecedented
media coverage, the weakness of disaster response management became obvious, especially in terms
of HSC. For instance, both Hurricane Mitch (1998) and the Indian Ocean Tsunami (2004) placed
HSC under stress.
The response to Hurricane Mitch revealed the deficiencies of the IFRC HSCs in terms of
effectiveness (weak responsiveness, lack of vertical coordination).
Hurricane Mitch (1998)
What? Between 22 October and 1 November 1998, a 180-mph Category 5 storm, the worst to hit
the Gulf of Mexico in 200 years, swept through a number of Central American countries
devastating the economies of Honduras, Nicaragua and Guatemala.
Disaster outcome: 10,000 people were estimated dead while some two million were left homeless.
About 400 bridges were destroyed in the region, while the course of rivers was changed and a
three-foot layer of mud was deposited on flooded airport airfields.

Towards a Sustainable Humanitarian Supply Chain
31
Response weakness: IFRC’s technical staff and relief delegates arrived late in the region.
Emergency Response Units were deployed at the eleventh hours. It took weeks to mobilize and
distribute basic supplies such as food, water and shelter to the population.
Source: INSEAD Case studies (2004)
Some years later, the disappointing response to the Indian Ocean Tsunami of 2004 weakened the
perception of the HSC. The lack of preparedness and coordination in this response was criticized in
the World Disaster Report 2004.
Indian Ocean Tsunami (2004)
What? In the early hours of the morning of Sunday 26 December 2004 a massive earthquake
measuring 9.0 on the Richter scale struck the west of northern Sumatra. The quake triggered a
powerful tsunami that swept the coasts of neighboring countries and caused serious damage and
loss of life.
Disaster outcome: At least five million people were affected in Indonesia, Sri Lanka, Maldives,
India, Thailand, Seychelles, and Myanmar. The death toll exceeded 280,000 people, and more than
one million people were displaced as a result of the destruction.
Response weakness: The donors’ response was unprecedented thanks to media coverage and
familiarity with the affected areas (tourism). Moreover, there was also a huge mobilization of HOs.
However, the low quality of operations and the excess of donated but unnecessary goods caused an
HSC overload that added to operational problems inherent in the quantity and quality of local and
international staff; inadequate methods, programs and tools, and little involvement in process
management or coordination. Therefore, the consequences were obstructed airports, excess
containers blocking ports and customs areas, saturated warehouses, expensive materials and
equipment deteriorating in the sun and rain, inadequate supplies and insufficient staff to provide
records of materials, poor logistics reports and, in addition to losses, the theft and sale of
donations.
Source: (Costa et al. 2012)
Accordingly, HOs started considering HSC as a key factor for improving disaster response
performance.
2.1.2. An effective and efficient disaster response
To face internal and external pressure, and maintain a competitive position, HOs encountered the
urgent need to go beyond the effective and fire-fighting approach. Thus, they started to invest time
and resources on the preparedness phase, with a special focus on how to improve HSC performance.
The effectiveness approach was also challenged by humanitarian needs and funding trends.
Humanitarian needs are rising year after year. Both people targeted by HOs and the appeals requested
by the HOs are increasing (Figure 8). Since 2006, needs have quadrupled. In addition, funding is also
rising, even though the growth is less significant. Thus, there is a continuously increasing gap between
humanitarian needs and available funding. Figure 9 shows how unmet requirements have been rising
for the last 10 years.

Chapter I. Introduction
32
Figure 8 Inter-agency appeals: funding requested and people targeted (OCHA, 2017)
Figure 9 Requirements, funding and unmet requirements (source: Global Humanitarian Assistance
report 2016)
Bearing in mind that HSC management was recognized as the most expensive part of relief operations
(Van Wassenhove, 2006), HSC managers started considering cost-efficiency in addition to
effectiveness, to obtain a competitive advantage. Donors are asking for greater accountability, and
have become less tolerant of inefficiencies (Balcik et al. 2010). Thus, reducing the cost of operations,
with an efficient performance perspective, allows HOs to compete in the “humanitarian donor
market” and to retain and gain public and private donors who finance the operations.
Therefore, the change in performance paradigm plus the focus on the HSC resulted in a main strategic
change. Major HSC organizations like IFRC or WFP shored up the design of their HSC. They
deployed a network of strategically located prepositioned stocks.
This distribution strategy consists in pushing products from prepositioned contingency stocks into the
country as soon as the humanitarian needs are assessed. If the response capacity of the contingency
stock is exhausted, a pull model is then set up to source further goods from the suppliers. This hybrid
model allows the first needs to be rapidly satisfied and gives decision-makers some buffer time to plan
the upcoming procurement process.
This was a step forward in improving effectiveness (the reduction in response times) and efficiency
(the reduction of acquisition costs) thanks to the management of centralized stocks and long-term

Towards a Sustainable Humanitarian Supply Chain
33
relationships with suppliers (Jahre, 2008; Laguna Salvadó et al. 2016). Since then, the HSC has made
significant progress in improving the efficiency of aid delivery. However, there are some limitations to
this regionalization strategy.
“66% of the disaster response is related to small or middle scale emergencies, most of them recurrent”
Silent disasters campaign (Barrena, 2015)
The rise in humanitarian need is significant at all scales, including small- and medium-scale disasters.
However, considering that only 10% of large disasters become news headlines (Barrena, 2015), and
that 66% of disaster operations are for small and medium disasters, HOs struggle to get funds because
of the lack of media coverage.
These so-called silent disasters are often recurrent, affecting the same region several times. In some
areas, droughts occur regularly with shorter or longer breaks in between. Other recurring disasters are
hurricanes (e.g. Haiti was affected by four of them in the course of 2008) or floods (e.g. Pakistan was
affected in 2010, 2011 and 2012) (Ferris et al. 2013).
In the last few years, different models of shared and common service provision have emerged in the
HSC context. The main objective of these approaches is to improve the cost efficiency of the regional
structures. Examples are the IFRC or UNHRD logistic network, which offers specialized HSC
services to the humanitarian community. These recent changes have contributed to rationalizing HSCs
and meeting increasing needs, but are not sufficient (Laguna Salvadó et al. 2016). For instance, the
economic sustainability to maintain these structures is still a challenge, and there is also room for
improvement in terms of effectiveness.
2.1.3. HSC “in the age of sustainable development”1
“Billions of citizens continue to live in poverty and are denied a life of dignity. There are rising inequalities within
and among countries. There are enormous disparities of opportunity, wealth and power. Gender inequality
remains a key challenge. Unemployment, particularly youth unemployment, is a major concern. Global health
threats, more frequent and intense natural disasters, spiraling conflict, violent extremism, terrorism and related
humanitarian crises and forced displacement of people threaten to reverse much of the development progress made
in recent decades. Natural resource depletion and adverse impacts of environmental degradation, including
desertification, drought, land degradation, freshwater scarcity and loss of biodiversity, add to and exacerbate the
list of challenges which humanity faces.”
Transforming our world: the 2030 Agenda for Sustainable Development
UN Assembly Resolution (2016)
Even if world political leaders do not address the sustainable development challenges as they should,
the commitment for sustainable development has captured public opinion, and people have become
more sensitive to and concerned about the environmental and societal impact of their actions and
choices. The 2030 Agenda for Sustainable Development, with 17 Sustainable Development Goals,
emphasizes that developing a sustainable global economy is central to the debate.
The term sustainability has been widely used in a broad range of disciplines and contexts, but in the
context of disaster response it has been given little attention. This is not surprising considering that
“alleviating human suffering” is seen as a priority and comes first regardless of social, environmental
1 Adapted from the UN report title, ‘The United Nations in the Age of Sustainable Development’

Chapter I. Introduction
34
and other costs (Oloruntoba, 2015). In the literature it is also argued that any HSC system is
(somehow) a sustainable system since it contributes to saving lives and improving the living conditions
of the population. Nonetheless, the same author rejects the argument by stressing the fact that SHSCs
are conditioned by pursuing direct sustainability objectives while general HSCs may indirectly serve
the purposes of sustainable development (Klumpp et al. 2015).
At the top management level, HOs have already been involved in the development of sustainable
behavior, as the declaration below illustrates. However, today, it is still a high-level statement, and
HSCs do not have the tools to manage a sustainable management approach.
“We happily endorse the 2030 Agenda, and our network stands ready to partner with governments, UN
agencies, civil society, the corporate sector and communities themselves to turn this ambition into a reality.”
-IFRC Secretary General, Elhadj AS SY
New York, 25 September 2015
The trends of increased globalization in the commercial SC have assisted logistics and SCM activities,
but they have also been detrimental from a sustainability perspective (Grant et al. 2017). However, the
commercial sector has understood the competitive advantage of considering sustainability, as
illustrated by “green” marketing, or Corporate Social Responsibility programs: when seeking to
improve the environment, and social and economic performance, companies act in their own interests,
in the interests of their stakeholders and in the interests of society at large (Sisco et al. 2015).
Sustainability has been identified as one of the biggest opportunities for doing business for decades
(Hart, 1996). It has become an approach to both ensure long-term business viability and to obtain a
“social license” to operate (integrity of a brand), and therefore, to enhance a competitive advantage
(Kunz and Gold 2017).
The evolution of public opinion expectations (donors) suggests that sustainability will also have to be
considered in the coming years for HOs seeking a competitive advantage. Sustainable Humanitarian
Supply Chain (SHSC) implies innovative, socially responsible and proactive decision-making by all the
stakeholders. According to (Oloruntoba, 2015) sustainable decision-making must:
• Minimize negative impacts;
• Enable long-term maintenance of community wellbeing; and
• Maintain a balance between life-saving, social, ethical, environmental and economic goals.
Les tendances à la mondialisation croissante dans le commerce SC ont aidé les activités de logistique et
de gestion de la chaîne logistique, mais elles ont également été préjudiciables du point de vue de la
durabilité (Grant et al. 2017). Cependant, le secteur commercial a compris l’avantage concurrentiel de
la durabilité, comme en témoignent les programmes de marketing «vert» ou de responsabilité sociale
des entreprises: lorsqu’ils cherchent à améliorer l’environnement et les performances sociales et
économiques, les entreprises agissent dans leur propre intérêt. intérêts de leurs parties prenantes et de
la société en général (Sisco et al. 2015). La durabilité a été identifiée comme l'une des plus grandes
opportunités pour faire des affaires depuis des décennies (Hart, 1996). C'est devenu une approche à la
fois pour assurer la viabilité à long terme de l'entreprise et pour obtenir un «permis social» (intégrité
d'une marque), et donc pour renforcer un avantage concurrentiel (Kunz et Gold 2017).
L'évolution des attentes de l'opinion publique (donateurs) suggère que la durabilité devra également
être prise en compte dans les années à venir pour les sociétés à la recherche d'un avantage
concurrentiel. Sustainable Humanitarian Supply Chain (SHSC) implique une prise de décision

Towards a Sustainable Humanitarian Supply Chain
35
innovante, socialement responsable et proactive par toutes les parties prenantes. Selon (Oloruntoba,
2015), une prise de décision durable doit:
• minimiser les impacts négatifs;
• permettre le maintien à long terme du bien-être de la communauté; et
• Maintenir un équilibre entre les objectifs vitaux, sociaux, éthiques, environnementaux et
économiques.
2.1.4. Towards a SHSC
We demonstrated that HSC management has evolved over the past decades from a fire-fighting
approach towards a performance-oriented perspective (efficiency and effectiveness). HOs have
invested in HSCs in terms of strategy, and this evolution has been accompanied by
professionalization, and an increase in skills (Jahre, 2008). To sum up, until now, the main objectives
of the management of an HSC have consisted in improving competitiveness by effectively managing
supply flows, while minimizing costs.
Figure 10 Evolution of HSC performance expectations
However, due to the awareness of donors and HOs to global sustainability challenges, the HSC needs
to evolve and consider sustainability for near-future operations management. Thus, sustainability is a
new paradigm for HSC managers that has been identified as a future requirement to maintain an
“order winner1” position.
HOs are already concerned about the sustainability of disaster response, but difficulties remain for
HSC decision-making to concretely introduce sustainability to their decision processes. Therefore,
there is a call for more research that addresses issues of sustainability in HSC planning and decision-
making (Haavisto and Kovács, 2014; Klumpp et al. 2015).
This research work focuses on how to support HSC decision-makers to establish and enhance a
concrete SHSC system.
1 The terms "order winners" and "order qualifiers" refer to the factors that may lead to competitive advantage and market success.
Before
•Effectiveness
Today
•Effectiveness
+ Efficiency
Tomorrow
•Sustainability

Chapter I. Introduction
36
2.2. Research gaps
The literature states that sustainability is still overlooked in humanitarian settings, although it is
essential for aligning operational objectives with longer-term objectives of humanitarian action.
Although both practitioners and academics are concerned by HSC sustainability, the state of the art
reveals several risks and challenges to enhancing sustainable HSC operations. Therefore, several
authors have called for more research to integrate sustainability into humanitarian decision-making
(Haavisto and Kovács 2014; Klumpp et al. 2015; Kunz and Gold 2017).
2.2.1. Gap 1: Difficulties in measuring sustainability
Sustainability approaches are a young topic in the field of SCM. The academic publications have
appeared since the year 2000 but they mainly have a qualitative nature. State of the art works show
that even though the concern for sustainable SC is widespread, there is a gap between intentions
(discourse) and implementation (Ashby et al. 2012). They also warn of the gap between management
research and management practice.
Following the Triple Bottom Line (TBL) model, it is widely accepted to present sustainability as the
balance between environmental, societal and economic dimensions. TBL is a systemic approach
developed in the mid-90s by John Elkington to "capture the essence of sustainability by measuring the
impact of an organization's activities including its profitability and shareholder values and its social,
human and environmental capital” (Savitz, 2012). It stresses the need to achieve a minimum in
performance for the three dimensions. However, there is no consensus regarding the trade-offs and
synergies across the economic, environmental and social objectives in a humanitarian context.
Moreover, there is not a standard definition for each dimension.
The macro-economic definition of sustainability and the three dimensions can explain sustainable
development on a conceptual level, but do not provide much guidance on how sustainability shall be
addressed in the context of HSC operations.
2.2.2. Gap 2: Planning shortcoming
To improve sustainable operations, decision-makers need to evaluate the impact of their decisions on
TBL dimensions. The role of anticipating the impact of decisions is the job of planning. “Planning
supports decision-making by identifying alternatives of future activities and selecting some good ones
or even the best one” (Stadtler, 2005).
However, the HSC context is characterized by a lack of structured planning processes (Haavisto and
Kovács, 2014). Overlooking planning results in a lack of coordination and inefficiencies such as the
bullwhip effect or distribution delays, and it is a barrier to aligning operations with sustainable
objectives.
2.2.3. Gap 3: Lack of adequate Decision-support Systems
On the commercial SC management side, planning processes are supported by decision-support
systems such as ERP (Enterprise Resource Planning), TMS (Transportation Management System),
WMS (Warehouse Management System), and more recently, APS (Advanced Planning System).
Therefore, developing adequate HSC planning decision-support systems may enable decision-makers
to improve performance, and eventually consider sustainability challenges (Hella Abidi et al. 2014).
A decision-support system is generally defined as “an interactive computer-based information system
that is designed to support solutions on decision problems” (Liu et al. 2010). In Operations

Towards a Sustainable Humanitarian Supply Chain
37
Management (OM), decision-support systems are often based on Operational Research (OR)
approaches.
In disaster management, there is an increasing recognition of the need for study of OR applicability.
Although much research has been conducted on developing OR models to support HSC decision-
making, just a few have a real impact in the field (Laguna Salvadó et al. 2015). (Holguín-Veras et al.
2012) highlights the need for more research on specific OR models (routing, inventory allocation,
planning) in humanitarian settings: “…as a result of the unique and complex features of Humanitarian
Logistics – which are significantly different from the commercial setting – there is an urgent need for
analytical tools that capture such complexity and enable disaster responders to determine the best
course of action.”
2.3. Research Statement
Addressing the sustainability of an HSC is a young subject of discussion, which deserves the attention
of the academic community to solve the increasing scientific challenges. Today, very little research
work has addressed the specific gaps that HSC -decision-makers have found in concretizing an SHSC.
Difficulties in measuring sustainability, planning shortcomings and a lack of adequate decision-support
systems have been identified as the main practical gaps from an Operations Management perspective.
Moreover, in the HSC research domain, there is still a gap between research proposals and field
implementation. To contribute to bridging these gaps, it is fundamental to have a clear understanding
of the HSC setting, and to build solutions with a strong, field-based hypothesis. Therefore, the
objective of this research work is to address the following research questions:
RQ1: How to formally conceptualize what an HSC is?
The HSC can be described as a collaborative system, where many actors and stakeholders interact to
achieve the ultimate goal of alleviating human suffering. To improve the overall performance of this
system, it is essential to have sufficient knowledge of it. Previous research work has proposed models
able to define such knowledge, but only partially and in a way that does not allow reusability. The
difficulty remains in having a shared and sufficiently conveyed conceptualization of the HSC system
for first, understanding, and second, improving system behavior. This research question is interesting
for both academics and field practitioners, as it should contribute to knowledge sharing and
communication among practitioners themselves, and between practitioners and academics. It also may
contribute to academia by facilitating field research design and cross-case and longitudinal study
analysis.
RQ2: What does sustainability mean in HSC operations and how can it be assessed?
Sustainability is a broad multidimensional concept. Given the increase in scientific publications
considering sustainability in many disciplines, it can be considered a trendy topic. Nonetheless, the
level of granularity of sustainability assessments is typically contrary to measurement transferability. It
appears that sustainability assessments either remain at high-level definitions, aggregations and
objectives that do not support tactical and operational decision levels, or are closely linked to the
interests or needs of particular sectors and decision-makers. Thus, in low decision-making levels, each
sector of activity has to find a reliable way to quantify sustainability. Even if HOs have already
subscribed to the sustainability agenda, it is still difficult to concretize what a sustainable performance
is at the different HSC decision levels. This research question is relevant for academics as it aims to
contribute to bridging the gap between the general concepts of sustainability and the HSC research
Chapter I. Introduction
38
domain, and also for practitioners as it aims to enable the assessment of sustainability in HSC
decision-making processes.
RQ3: How to support decision-makers consciously and systematically making sustainability trade-offs and exploring
consequences?
To enhance sustainable operations, decision-makers may benefit from considering the sustainability
assessment “a priori”, in the planning process. To plan sustainable operations, -decision-makers need
to make sustainability dimension trade-offs transparently, based on their knowledge of the situation
(organizational objectives and interests, expertise, etc.), and being aware of the consequences.
However, decision-support systems that address trade-offs are not aligned with practitioners’
requirements in terms of skills and time. Users typically have to deal with abstract and complex
weightings and dependencies, so it may represent a barrier for the acceptability of decision-support
systems in the field. The challenge here is then to design and develop a decision-support system
approach that contributes to bridging the gap between academic proposals and field usability. This
research direction is interesting for academics as it aims to make accessible the use of OR methods for
non-experts, and therefore it aims to improve systematically HSC planning processes.

Towards a Sustainable Humanitarian Supply Chain
39
3. The IFRC application case
This thesis has been conducted in close relation with the IFRC HSC, and especially, with the
American and Caribbean Regional Logistics Unit (A&C RLU). This section presents the IFRC
organization, and provides an overview of the A&C RLU.
3.1. The Red Cross and Red Crescent movement
The International Red Cross and Red Crescent Movement is a global humanitarian network of 80
million people that helps those facing disaster, conflict and health and social problems. It consists of
the ICRC, the IFRC and the 190 Red Cross and Red Crescent National Societies (NS).
Humanity, impartiality, neutrality, independence, voluntary service, unity and universality are the key
principles to the International Red Cross and Red Crescent Movement distinct identity. These seven
Fundamental Principles provide an ethical, operational and institutional framework to the work of the
Red Cross and Red Crescent Movement. They are at the core of its approach to helping people in
need during armed conflict, natural disasters and other emergencies.
The ICRC, the Federation and the National Societies are independent bodies. Each has its own
individual status and exercises no authority over the others.
Figure 11 The Red Cross and Red Crescent International Movement
The ICRC is an impartial, neutral and independent organization whose mission is to protect the lives
and dignity of victims of war and internal violence and to provide them with assistance.
The IFRC coordinates and directs international assistance following natural and man-made disasters in
non-conflict situations.
The IFRC works with NSs in responding to catastrophes around the world. Their reliefs operations
are combined with development work, including disaster preparedness programs, health and care
activities, and the promotion of humanitarian values.
National Societies

Chapter I. Introduction
40
3.2. The IFRC Humanitarian Supply Chain network strategy
The Logistics, Procurement and Supply Chain Management (LPSCM) Department of the IFRC
provides humanitarian logistics services1. Its key mission is to support the core work of the Red Cross
Red Crescent network. It also offers these services on a non-profit basis to third parties in the
humanitarian sector and to governments. The worldwide activities of the IFRC LPSCM focus on
three strategic objectives:
1. Support the enhancement of National Society logistics capacities
2. Increase the IFRC’s logistics capacity to deliver logistics services for preparedness and
operational activities
3. Provide agreed logistics services to third parties in the humanitarian sector
The mission of the IFRC HSC upstream network is composed of five Regional Logistics Units (RLU)
strategically located in Panama, Kuala Lumpur, Nairobi, Beirut and Budapest, to respond to
humanitarian needs.
Moreover, sub-regional logistics units (LU) based at the country level with the support of the NS are
connected to each RLU. This second layer, which responds to the need to get closer to beneficiaries, is
still under deployment. LU stocks are located inside NS warehouses as part of the RLU contingency
stock. The operational mode is linear: the regional hub manages all warehouse procurement, and each
sub-regional warehouse distributes only to internal country needs.
Figure 12 Linear sub-regional design
The sub-regional approach aims to add or reinforce a logistics capacity layer closer to the beneficiaries,
while maintaining the RLU and its advantages. This enables the IFRC to:
• Improve response time, thanks to shorter geographical distance. Moreover, involving (or
empowering) the country level on preparedness contributes to improving disaster response.
• Enhance local capability, which may also encourage local sourcing with a positive impact on
the local economy.
• Re-design the HSC; this is an opportunity to improve the cost-efficiency of the system.
1 It used to be called Global Logistic Services (GLS) up until 2016
RegionalPre-posi onedStocks
RLU
SUPPLIER
HeadQuarters
LU
LULU
LU
Sub-regionalPre-posi onedStocks

Towards a Sustainable Humanitarian Supply Chain
41
However, the linear approach (stocks coming from the suppliers to the beneficiaries through regional
and sub-regional hubs) continues to require high contingency stock. As long as the RLU strategy has
not been reviewed, the regional contingency stock coverage increases if we take into account the hub
and sub-regional stocks, which was already overestimated.
3.2.1. A&C RLU activity
The American continent is a good example of recurrent disasters. Looking at the Global Humanitarian
Assistance Report 2015 (Swithern et al. 2015), none of the American countries is in the top 10 of
affected countries nor in that of the international humanitarian assistance recipients (2004 to 2013).
The crises affecting America are mostly natural disasters with recurrent patterns such as El Niño
(Charvériat, 2000). These small- and medium-scale crises constitute a very high percentage of
emergency interventions by HOs (Vargas Florez et al. 2015). Individually, each generates only a local
impact, where there is no need to mobilize a massive amount of relief items.
In 2014, the A&C RLU launched 16 Disaster Response Emergency Funds (DREF) for small-
magnitude disasters and three appeals (large-scale disaster funding procedures) (Figure 13). If we
extrapolate the trend of the last 15 years, it seems that the number of small-to-medium response
operations will tend to rise.
Figure 13 Emergency appeals and DREFs 2001-2015 (source: IFRC PADRU, 2015)
This pattern has a strong impact on the activity of the A&C RLU, which is sized for large-scale
disaster responses. Each RLU has a contingency stock to assist 5,000 families, but the activity in a
standard year can be considered low in America.
3.2.2. Cost recovery
The working costs of RLUs have been based since 2012 on full-cost recovery (assets and
infrastructure). This mechanism charges the costs of (i) supplying goods and services and (ii) covering
overheads related to the logistics services management. In a standard year, responses to crises do not
generate enough rotation to cover the fixed cost of RLUs (IFRC, 2012).
The IFRC’s strategy consists mainly in providing a panel of specialized services like procurement,
warehousing and distribution to third parties. For the IFRC, the main customers of these services are
the Partner NS and some international organizations such as Oxfam. Partner NSs are NSs from
developed countries that invest part of their funds on prepositioning relief items in addition to the
RLU contingency stock. But even though this provides some extra revenue, it is not sufficient to
ensure the economic long-term sustainability of RLUs like those of the A&C.
5 42
75
36 6
2
8
3 42 3
1
8 75
9
13 13 13
2018 18
13
19
1013
18
0
5
10
15
20
25
2001 2002 2003 2004 2005 2006 2007 2008 2009 2010 2011 2012 2013 2014 2015
#
yearEmergency Appeal DREF

Chapter I. Introduction
42
Figure 14 Logistics services provided by the IFRC (Grenade, 2015)
3.2.3. Operations
The IFRC has announced that it aims to reduce response time to 48 hours (Grenade 2015). Although
with regionalization, emergency items are closer to the field than they used to be, this aim is still out of
reach. By locating stocks closer to disaster-prone areas, transport time can be reduced.
Beyond risks to stock, the supply trigger procedures and coordination between actors can also cause
delays. For the IFRC, an RLU cannot start any procurement activity without a formal request from the
field assessment team. And this can take from several days to some weeks. An IFRC Procurement
Officer (Panama, September 2015) explained a case where the request took three weeks to be
validated. There was a crisis in the West Indies and the French Red Cross responded - instead of the
IFRC - with their contingency stock placed at Guadeloupe island (not part of the IFRC contingency
stock) because the RLU was waiting for the request validation. Practitioners consider that these
recurrent delays are mainly due to cultural distances (no knowledge of the country), as Jahre has
pointed out: “even if RLUs are geographically closer to the regions often struck by disasters, they are still too far from
the local communities with regards to culture, knowledge and geographical distance … they are stuck in the middle”.
3.2.4. Procurement strategy
Today, the procurement process of the IFRC is based on a competitive bidding process. In addition to
the framework agreements with international suppliers that provide part of the standard contingency
stock (e.g. blankets, jerry cans, kitchen sets, etc.). For regular replenishment (non-emergency), items
are sourced internationally, mainly from Asia, due to the competitive cost even though there are long
lead-times.
However, local sourcing stimulates local economies and reduces transportation costs. Moreover, local
shipments require less documentation than international consignments that can stay blocked at
customs for long periods. Despite these advantages, some items are difficult to be sourced at the
country level as long as the procedures to purchase are strict to maintain standards. And at the
regional level there is a lack of knowledge and visibility of the local sourcing capacity (quality and
availability) because they are too far geographically and also culturally.

Towards a Sustainable Humanitarian Supply Chain
43
4. Research Methodology
The objective of this research project is to develop concrete solutions to support sustainable decision-
making in HSCs with a scientific, applied research1 approach. Enhancing sustainable operations is an
interdisciplinary matter as broad as the subject of ‘sustainability’: engineering sciences, economic
sciences and social sciences are concerned to some extent. Here, we identify and address the problem
with an engineering science point of view and methodologies.
The main difficulty is still to develop decision-support systems adequate for humanitarian needs and
uses. One of the biggest criticisms in the HSC literature review is the barrier between scientific
proposals and field acceptance (Holguín-Veras et al. 2012). Several authors conclude that field-
grounded research should allow for building more adequate proposals. (Kunz et al. 2017) highlight the
importance for both academics and practitioners to “jointly define research projects”.
In this context, field-oriented research is a requirement for adequately developing applied research
proposals to enhance an SHSC. However, it is not a trivial matter to classify a particular type of
research into a single research methodology paradigm (Laurencelle, 2005). In the SCM literature, the
most popular research methodologies are Model Building, Surveys, Case Study Research and Action
Research (Seuring and Müller, 2005).
Our proposed research methodology fits in with the philosophy of Action Research, which has been
identified as valid and relevant in the context of SCM (Müller, 2005). Briefly, “Action Research uses a
scientific approach to study the resolution of important social or organizational issues together with
those who experience these issues directly” (Coughlan and Coghlan, 2002). However, the Action
Research paradigm has been criticized by some authors, mainly for the positivistic paradigm position.
The principal difficulty in validating Action Research is the lack of impartiality on the part of the
researcher and the view of Action Research as a “consulting process masquerading as research”
(Coughlan and Coghlan, 2002). The research process has been carried out in close relation with the
IFRC to identify the problem, which explicitly shared the interest in moving towards an SHSC, and
has contributed by providing information and feedback on our proposals. However, they have not led
the research process and we have been free to address the problems we found relevant from both
practical and academic points of view.
Given the nature of the research questions, which aim to improve the performance of an organization,
Design Sciences’ research methodologies are also relevant (Figure 15).
1 Applied research aims to find a solution for an immediate problem facing a society or an industrial/business organization
Awareness of Problem Suggestion Development Evaluation Conclusion
Process
steps
Outputs Proposal Tentative design Artifact
Performance measures Result

Chapter I. Introduction
44
Figure 15 The general methodology of design research (Järvinen, 2007)
Design Sciences belongs to the Information Systems domain, which is at the confluence of people,
organizations, and technology (Holmström et al. 2009). Design Sciences is a problem solving process
through the building and evaluation of artifacts designed to meet the identified business need. The
concordance between the characteristics of Action Research and Design Sciences has been highlighted
by (Järvinen, 2007), who concludes that they should be considered similar research approaches. Both
approaches have 5 similar steps, illustrated in Figure 15 with the design sciences approach.
In summary, to contribute to bridging the gap between practitioners and academics we followed an
inductive research approach. Inductive, because the problem and the solutions are both grounded in
field research, with the aim of creating a general hypothesis (Figure 16):
Figure 16 Research methodology overview
Field grounded motivations:
This is a critical step, as the relevance of the proposals rests on the capacity to identify a relevant
problem for practitioners. The method used to identify a business challenge together with field
practitioners is field data gathering, analysis and feedback with practitioners.
For data gathering, we used both secondary and primary data from HOs. Secondary data was mainly
found on the Internet, and consists of annual reports and operations updates. For the primary data,
we conducted a field research campaign and used semi-structured interviews, observations and access
to HO documents.

Towards a Sustainable Humanitarian Supply Chain
45
A&C Field Research
Where? IFRC A&C RLU Office (Ciudad del Saber, Panama) & Warehouse (Panama Pacific Airport)
When? 10 days in September 2015
Who? One field researcher on site and two in the “back office”
What? The focus was on the upstream HSC business processes. The aim was to identify decision-makers’
challenges.
Prior to the field research: Interviews with the Logistics Development Coordinator
On site: Observation of and semi-structured interviews with six IFRC A&C RLU team members.
Afterwards: The observations and data analysis helped to draw a picture of the business processes, and to
identify the opportunities and challenges addressed in this thesis.
Gap identification:
Once the business stakes were defined, this step consisted in identifying the scientific challenges
related to the business problem. To do so, it was necessary to know the state of the art, so we could
build the contributions on existing evidence. The results of both the field research, mixed with the
literature review, led to finding the three research questions presented previously.
The literature review was focused on past research work, and specific keywords to identify relevant
contributions.
Building scientific contributions and implementation:
This step consisted in conducting in-depth work to build original methods or to adapt existing ones
(for previously addressed scientific challenges) to answer the research questions and address the
business stakes. Moreover, a prototype of each contribution is developed and validated with a proof of
concept based on field research data.
Evaluation & conclusions
Each proposal has been implemented with a realistic case study based on the A&C RLU. Discussion
with practitioners allowed us to identify a scope relevant for this purpose and to build the case based
on data from the field.

Chapter I. Introduction
46
5. Manuscript Structure
With the objective of supporting decision-makers to enhance an SHSC, the contributions are
structured following a 3W story line: What? Why? How?
The first step (what?) is to describe the system that we want to have an influence on. Therefore, the
research question addressed in Chapter 2 is:
RQ1: How to formally conceptualize what an HSC is?
Chapter 2 discusses the background on HSCs, SCs and disaster management collaborative systems
knowledge structuring with reference models and metamodels, and proposes a specific metamodel for
HSC to support field data gathering and knowledge structure. The concepts gathered during field
research, added to the HSC core literature, have allowed an original and innovative HSC metamodel to
be built. Model instances built from this metamodel provide potential input for developing adequate
decision-support systems, as well as for supporting the design and analysis of field-oriented research.
We illustrate the proposal with an example based on the A&C RLU.
The second step (why?) is to describe the decision-maker pursued objectives pursued by decision-
makers. The research question addressed in Chapter 3 is thus:
RQ2: What does sustainability mean in HSC operations and how can it be assessed?
In Chapter 3 we give an overview of the significance of sustainability, and how it has been addressed
in the literature and in practice. Previous research has shown that the challenge for HOs is to consider
a sustainability perspective in their decision-making processes. We propose a performance
measurement definition. Based on field research with the A&C RLU and a literature review on
humanitarian performance measurement and sustainability, we define a set of criteria, objectives and
key performance indicators that translates sustainability concepts to the context of HSC. Built on the
TBL philosophy, the environmental and social dimensions are added to the economic one. The aim of
Chapter 3 is to define the objectives of HOs to enhance SHSC operations. The framework use is
illustrated with a maturity model of the SHSC.
The third step (how?) is to make sustainable decisions. Chapter 4 addresses the challenge of
introducing sustainability objectives to the HSC decision-makers process:
RQ3: How to support decision-makers consciously and systematically making sustainability trade-offs and exploring
consequences?
In Chapter 4, an OR approach is proposed to define sustainable planning “a priori”: to anticipate
outcomes with a decision-support system. To build the decision-support system, we model the SHSC
Master Planning network flow problem, and propose an algorithm which ensures the decision-maker’s
central role. We illustrate the proposal with a use case based on the A&C RLU. This contribution has
the originality of addressing both the challenges to improving the planning processes and to including
sustainable objectives in the context of HSC.
Finally, in Chapter 5 we discuss the conclusions and the perspectives of this research project.

Towards a Sustainable Humanitarian Supply Chain
47
Figure 17 Manuscript Big Picture
Structuring
the HSC Knowledge
Defining &
Assessing Sustainability in
the HSC Context
Developing a
SHSC Master Planning
What?
How?
Towards an SHSC Decision Support System Purpose?
Why?
Describing the
system
Making
Sustainable
Decisions
Describing the
Objectives
Chap.
2
Chap.
3
Chap.
4

Chapter I. Introduction
48

49
Chapter II. HUMANITARIAN SUPPLY CHAIN METAMODELING
1. Towards an explicit conceptualization of the HSC
As discussed in the introduction, to improve the performance of the HSC, one of the challenges is to
consider the complexity of the field. A shared, reusable and sufficiently conveyed view of the HSC
domain may contribute to facilitating knowledge generation (field research data collection and
analysis) and communication (between both practitioners and academics).
“The more we know about a given domain and the more precise we are in representing it, the
bigger the chance that we have of constructing computational systems and services that are
consistent with the reality of that domain.” (Guizzardy, 2005).
This part of our research aims to provide an explicit conceptualization of the HSC domain to build a
bridge between “real world” data and the knowledge needed for decision-making, as illustrated in
Figure 18. We consider here “data” as the raw data without contextualization, “information” as an
understanding of the relationships among the domain data (HSC in this concrete case), and
“knowledge” as the use of information to make decisions.
Figure 18 Chapter 2 research positioning
Therefore, this chapter addresses the research question: How to formally conceptualize what an HSC is?
(Knowledge) Decision Making
(Information) Explicit
Conceptualization
(Data) Gathering

Chapter II Humanitarian Supply Chain Metamodeling
50
1.1. From conceptualization to metamodeling
Concept /ˈkɒnsɛpt/
Noun. An abstract idea
Conceptualize /kənˈsep.tʃu.ə.laɪz/
Verb. To form a concept or idea of (something)
Conceptualization /kənˈsɛptjʊəlʌɪz/
Count noun. An abstract idea or concept of something
From a philosophical point of view, a concept is “an idea or mental image that corresponds to some
distinct entity or class of entities, or to its essential features, or determines the application of a term
(especially a predicate), and thus plays a part in the use of reason or language” (Oxford Dictionary). A
conceptualization (as well as an abstraction) is described as “an immaterial entity that only exists in the
mind of a user or a community of users of a language” (Guizzardi, 2005). Ullman’s triangle (1972)
represents the relationships between a thing in reality, its conceptualizations and a symbolic
representation of this conceptualization (Figure 19).
Figure 19 Adapted from Ullman’s triangle
Thus, to build an explicit conceptualization of the HSC, we need to represent the concepts of the
domain with symbols that refer to the things in the field.
Guizzardy (2005) stated that a model is the abstraction of a given portion of reality articulated
according to a domain conceptualization. A model can be used either to document existing situations
(descriptive mode) or to describe situations that have yet to eventuate (prescriptive mode)
(Henderson-Sellers and Bulthuis, 2012). Within the Information Systems field, conceptual modeling is
defined as a formal description of some aspects of the physical or social reality for understanding and
communicating (Wand et al. 1995).
According to (Kung and Solverg, 1986), the main roles of conceptual models are (1) supporting
communication between developers and users, (2) helping analysts understand a domain, (3) providing
input for the design process, and (4) documenting the original requirements for future reference. In
Concept
(conceptualization)
HSC domain (reality)
Symbol
(language)
abstracts
refers to
represents

Towards a Sustainable Humanitarian Supply Chain
51
addition, the use of conceptual models allows static phenomena (things and their properties) and
dynamic phenomena (events, processes) of a domain to be represented (Wand and Weber, 2002).
Formal (conceptual) models are built using more general models, also referred to as metamodels, or
modeling language.
A metamodel then is the ‘model of models’: an explicit model of the constructs and rules needed to
build specific models within a domain of interest (Gaševic et al. 2006). It (i) describes a domain that is
representative of more than one instance in a less abstract domain, and (ii) is the core of a modeling
language used to describe those instances (Bataille and Castellani, 2001; Henderson-Sellers, 2011). If
we consider that no modeling is possible without some sort of metamodel (explicit or implicit), this
also becomes true for metamodeling, as it also needs its own methods and tools, which, in turn, can be
described one level higher in metamodels (and so on).
Moreover, metamodels are closely related to ontologies. In the Information System literature, an
ontology is usually referred to as a formal, explicit specification of a shared conceptualization for a
domain of interest (Gruber 1993) which may be used as a unifying framework (Uschold and
Gruninger, 1996). It describes knowledge that can be used and reused to facilitate the comprehension
of concepts and relations in a given domain as well as the communication between different domain
actors.
When using the ontology concept for engineering purposes, two main categories are typically
considered (Henderson, 2011):
• Domain ontologies, which are used to create common vocabulary for a specific application
domain and are vital to ensuring that elements in the model have well-defined semantics;
• Meta-ontologies, which are equivalent to the metamodel of a modeling language and thus
encapsulate the concepts needed for creating domain ontologies.
Over the past decades, there has been tremendous growth in metamodeling and ontology
development (Henderson-Sellers and Bulthuis, 2012). In the literature both concepts often seem to be
used indistinctly. Even if metamodels and meta-ontologies are not necessarily equivalent there is a
fuzzy link between them. Metamodels can have ontological properties while treating them as a
representation of the language underlying a worldview. Guizzardi conducted an in-depth study
concerning the relationship between language, conceptualization metamodels and ontologies
(Guizzardi, 2005). We conclude that to support the explicit conceptualization of a domain of interest,
here the HSC, a formal metamodel should provide a high-level framework to define model concepts
and its relationships.
1.2. Research direction
In order to address the research question, the center of this contribution is to specify an HSC
metamodel (or meta-ontology), which is a set of terms naming concepts (classes) and relations. The
metamodel should formally represent the abstract domain-conceptualization. The main objective is to
use the metamodel to support analysts (academics and practitioners) in the creation of HSC
conceptual models (or sets of organized data), or instances of the metamodel. Figure 20 shows the
explicit conceptualization approach.

Chapter II Humanitarian Supply Chain Metamodeling
52
Figure 20 A metamodel as an explicit representation of a domain (inspired from Guizzardi, 2005)
In the sections below, an overview of the background and recent works is provided (section 2), related
to the development of metamodels (including meta-ontologies) and referent models in Disaster
Management, Supply Chains and HSC domains. Second, the main contribution of this chapter is
presented: the HSC metamodel. Third, the use of a metamodel is illustrated in the IFRC case. This
proof of concept has been built on the data gathered during the field research of IFRC A&C RLU.
Finally, some discussions and further research directions are presented.
Domain - Conceptualization
Case - Conceptualization
reality
is an abstraction of
is an abstraction of
used to compose is an
instance of
Abstract domain Real domain
Metamodel
Model
used
to compose is an instance of
Model Model
Case - Conceptualization Case -
Conceptualization
Formal domain
represents
represents

Towards a Sustainable Humanitarian Supply Chain
53
2. Background and related works
HSC has roots in both Disaster Management and SC. It integrates concepts and relationships coming
from both domains (Figure 21). The HSC operates under the conditions of humanitarian disasters,
therefore, (i) the objectives (life and death vs. profit and loss), (ii) the high levels of demand
uncertainty, (iii) the SC formation (ad-hoc downstream design and implementation), and (iv) the
changing operational conditions, make HSC part of Disaster Management, and a specific case within
the SC. These specificities contribute to the fact that methods and best practices from SC are not
necessarily appropriate for the HSC, and vice versa (Charles and Lauras, 2011).
In this section we provide an overview of metamodels and reference models in the three afore-
mentioned areas, to identify the opportunities and limitations of current research. Reference models
(or standards) are interesting for the purposes of building a shared and explicit metamodel of the HSC
because they provide well-accepted and structured frameworks for concepts related to the domain.
Even if the relationships are not explicit, they may provide validated concepts used in the domain.
Figure 21 The Humanitarian Supply Chain domains
2.1. Humanitarian Supply Chain domain
In the specific HSC literature, we can identify different reference models that contribute to a better
understanding of the HSC. (Kovács and Spens, 2007) proposed one of the first models related to
humanitarian logistics. It provides a highly conceptual framework that distinguishes actors, phases and
logistical processes of disaster relief logistics. (Blecken, 2010) proposed a specific reference framework
for HSC, based on commercial SC reference models. It is organized in two dimensions. The
hierarchical breakdown organizes SC tasks at strategic, tactical and operational levels. The structural
breakdown organizes SC tasks related to assessment, procurement, warehousing and transport (Figure
22). These two dimensional frameworks help to classify the business tasks that are performed within
an HSC.
Disaster Management Supply Chain
Humanitarian
Supply
Chain

Chapter II Humanitarian Supply Chain Metamodeling
54
Figure 22 Blecken reference task framework model (Blecken, 2010)
Franke et al. (2011) combine Blecken’s reference process model with a tool for coordinating the
design, run-time and monitoring of inter-organizational humanitarian logistics processes. Both
Blecken’s and Franke’s reference models are focused on the business process conceptualization of the
logistics operations while the aim of our research work is to consider a wide view of the HSC system.
Nonetheless, these contributions are relevant for our problem as they can support the identification
and the definition of process concepts to be included in the HSC metamodel. However, they do not
formalize a metamodel as such, which limits their reusability.
Overstreet et al. (2011) carried out a literature review on humanitarian logistics models. None of the
models discussed addresses the challenge of data gathering and structuring through a metamodel.
Many mathematical models have been developed in the context of OR dedicated to HSC (Altay and
Green, 2005; Van Wassenhove, 2006; Galindo and Batta, 2013). They are typically case-based, and do
not provide any conceptual metamodels. However, these models are still interesting because they
provide concepts and definitions of the HSC domain and relationships.
2.2. Supply Chain domain
In the commercial SC domain, many reference models have been developed; they mainly focus on the
explicit conceptualization of business processes and activities in order to study their current practices
and improve on them. They allow the processes to be conceptualized from several viewpoints and at
various abstraction levels. There are many process modeling techniques and tools in the literature
(Alotaibi, 2017; Min and Zhou, 2002).
The most famous SC reference model is probably the Supply Chain Operations Reference (SCOR)
(Zhou et al. 2011). It structures the inter-organizational SC business processes around six top-level
management processes: plan, source, make, deliver, return and enable. These levels are split into sub-
levels.
Another reference model for representing an SC, the value stream in this case, is Value Stream
Mapping (VSM). It is related to the Lean philosophy which begins by learning about the different
kinds of waste that can affect the system (Womack and Jones, 1996). Waste is anything that adds cost
or time without adding value (Tapping et al., 2002). VSM is a visual representation of a workflow with
quantitative data at each step of the process. Its principle consists in breaking down a process value
stream along different operations (at a company scale) or along different installations (at a network
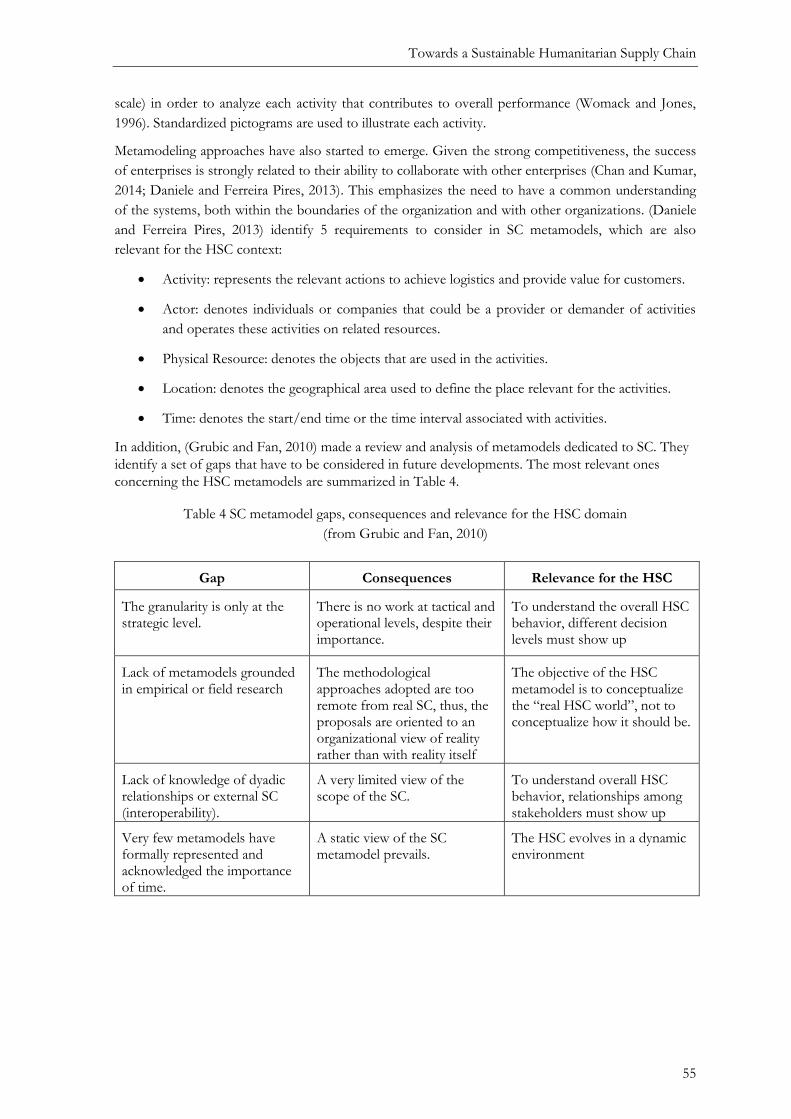
Towards a Sustainable Humanitarian Supply Chain
55
scale) in order to analyze each activity that contributes to overall performance (Womack and Jones,
1996). Standardized pictograms are used to illustrate each activity.
Metamodeling approaches have also started to emerge. Given the strong competitiveness, the success
of enterprises is strongly related to their ability to collaborate with other enterprises (Chan and Kumar,
2014; Daniele and Ferreira Pires, 2013). This emphasizes the need to have a common understanding
of the systems, both within the boundaries of the organization and with other organizations. (Daniele
and Ferreira Pires, 2013) identify 5 requirements to consider in SC metamodels, which are also
relevant for the HSC context:
• Activity: represents the relevant actions to achieve logistics and provide value for customers.
• Actor: denotes individuals or companies that could be a provider or demander of activities
and operates these activities on related resources.
• Physical Resource: denotes the objects that are used in the activities.
• Location: denotes the geographical area used to define the place relevant for the activities.
• Time: denotes the start/end time or the time interval associated with activities.
In addition, (Grubic and Fan, 2010) made a review and analysis of metamodels dedicated to SC. They
identify a set of gaps that have to be considered in future developments. The most relevant ones
concerning the HSC metamodels are summarized in Table 4.
Table 4 SC metamodel gaps, consequences and relevance for the HSC domain
(from Grubic and Fan, 2010)
Gap Consequences Relevance for the HSC
The granularity is only at the strategic level.
There is no work at tactical and operational levels, despite their importance.
To understand the overall HSC behavior, different decision levels must show up
Lack of metamodels grounded in empirical or field research
The methodological approaches adopted are too remote from real SC, thus, the proposals are oriented to an organizational view of reality rather than with reality itself
The objective of the HSC metamodel is to conceptualize the “real HSC world”, not to conceptualize how it should be.
Lack of knowledge of dyadic relationships or external SC (interoperability).
A very limited view of the scope of the SC.
To understand overall HSC behavior, relationships among stakeholders must show up
Very few metamodels have formally represented and acknowledged the importance of time.
A static view of the SC metamodel prevails.
The HSC evolves in a dynamic environment

Chapter II Humanitarian Supply Chain Metamodeling
56
More recently, and in the context of the European research project called C2NET1, (Jiang et al. 2016)
have developed a specific metamodel for the SC domain. Their proposal is built on Benaben’s
collaborative layered metamodel, with the aim of supporting Small and Medium Enterprise supply
network data gathering and knowledge exploitation to optimize the logistics assets. The metamodel
concepts and relationships are identified from collaborative business ontologies and reference models
such as: Enterprise ontology, TOVE, SCOR, Transport ontology, etc.
Given the parallels between the HSC and the SC domain, concepts and relationships from the existing
SC metamodels cited in this section can instigate an HSC domain metamodel.
2.3. Disaster Management domain
In the larger domain of crisis and disaster management, along with the open data movement and the
semantic web, a lot of interest has been dedicated to developing crisis and disaster management
metamodels (Aaltonen 2009; Asadi et al. 2011; Bénabén et al. 2008; Comes, Vybornova, et al. 2015;
Imran et al. 2013). Only a few, however, attempt to represent crisis and disaster management
information and knowledge structures in reusable form (metamodel). Most of the models in the
literature facilitate access to crisis management expertise; however, they have several limitations
(Benaben et al. 2016):
• Most of these metamodels are not formalized.
• Most of these metamodels do not provide detail of each crisis management phase.
• These metamodels focus on specific cases. The extraction of general concepts relating to
specific types of crises, such as cyclones, is not generalizable.
We focus in the following section on proposals that address these challenges, and which are general
enough to be interesting from an HSC domain perspective.
To overcome these limitations, (Benaben et al. 2016) presented a general crisis metamodel and
associated ontology to facilitate knowledge sharing and develop advanced crisis management systems.
They structure the metamodel with a perspective of “collaboration”. To explicitly conceptualize the
crisis response, they consider four knowledge areas: (i) the studied system, corresponding to the sub-
part of the world impacted by the crisis; (ii) the crisis system, corresponding to the properties of a
specific crisis; (iii) the treatment system, corresponding to a description of the abilities of actors who
can be deployed in a crisis response; and (iv) the collaborative process, corresponding to a description
of the crisis response. In particular, the metamodel’s objective is to design the collaboration process.
Thus, it identifies a particular partner, the mediator, whose role is to orchestrate the collaboration of
other selected partners.
This approach can be generalized to other inter/intra-organizational collaboration situations than
crisis responses. For example, it can be applied to virtual enterprise collaboration settings, where
different partners share workflows. However, depending on the area of application, the concepts may
not be the same. Thus, the proposed metamodel is structured with different layers as described in
Figure 23:
1 The C2NET project aims to create cloud-enabled tools which small and medium enterprises (SMEs) could afford, in order to help them to overcome the current economic crisis and to enhance their competitiveness in the global economy (C2NET Proposal, SEP 210155140 SignedEC)

Towards a Sustainable Humanitarian Supply Chain
57
Figure 23 Structuration of a collaboration metamodel (from Lauras et al. 2014)
• A core metamodel relates to the general concepts of collaboration in social systems. This
“kernel” is common to all collaborative situations regardless of the application domain;
• A set of layers that helps to define the concepts associated with a particular domain of
application with a specific granularity level.
Their approach has been tested and validated, especially through several specific instantiations
regarding crisis management applications (civil crises, but not humanitarian disasters), virtual
enterprise applications and healthcare applications. Based on this principle, and considering the HSC
as part of a crisis response, it is possible to define a specific layer for HSC that would be linked with
the existing layer dedicated to the parent crisis management domain.
(Othman and Beydoun, 2010) developed a disaster management metamodel to help access Disaster
Management knowledge, which is typically distributed across time, space and people. In contrast to
(Benaben et al. 2016), they used existing disaster response models, and ten earlier crisis metamodels
(Benaben et al. 2008) to identify the concepts and potential relationships. Moreover, their proposal is
structured following the phases of the crisis management cycle: mitigation, preparedness, response and
recovery. This approach is interesting because it adds the cyclical dimension of the disaster response;
however, there is no relationship established between the different phases of metamodels, and the
concepts are too specific for rescue operations.
Another original contribution to Disaster Response knowledge management is the Humanitarian
eXchange Language (HXL) Situation and Response Standard (Clark et al. 2015). HXL is a project led
by UNOCHA that aims to define data exchange for disaster responses. This is a joint project between
academics and practitioners with a knowledge management approach, developed with the specific
humanitarian field constraints that may be considered. Data is structured in 4 main topics:
• Geolocalization Information
• Victim Profiles
• Response Actions
• Situation and Evolution
All the reference models and metamodels discussed in this section are complementary and interesting.
Concepts and relationships can be considered to be within the HSC domain. However, for building a
specific metamodel for the HSC system, some of the concepts are either not relevant (outside the

Chapter II Humanitarian Supply Chain Metamodeling
58
HSC system scope), or not specific enough. The main conclusion here is that the Collaborative System
metamodel with the Crisis Management layer can be used as a metamodel for building the specific
HSC metamodel.

Towards a Sustainable Humanitarian Supply Chain
59
3. Humanitarian Supply Chain Metamodel Proposal
As discussed in the introduction, the purpose of the HSC metamodel is to deal with the problem of
structuring and sharing the implicit and explicit HSC conceptualization. In the background section it
has been highlighted that previous research on Disaster Management and SC domains provide
valuable metamodeling and reference model approaches, concepts and relationships that can be
integrated into the HSC metamodel.
According to Benaben et al. (2016), collaborative systems can be built on a layered metamodel
structure. The core is a metamodel that defines the general concepts of collaboration systems. It is
common to all collaborative situations regardless of the application domain. Around the core, a set of
layers allows the concepts associated with a particular domain of application to be defined.
Considering that the HSC domain is a child of Disaster Response, the proposal is structured on two
complementary layers. The first one relates to generic concepts and relationships in crisis
management. The second one relates to the HSC domain, and is based on the knowledge contained in
the previous section.
Therefore, considering that the HSC system is a collaborative system, the HSC system metamodel is
built as an external layer of a collaborative system core, in the continuity of a Crisis Management layer,
which structures the concepts and relationships in Crisis Management (Lauras et al. 2015) and
(Bénaben et al. 2016). The Crisis Management layer here becomes a “meta-metamodel”, and the core,
the “meta-meta-metamodel” of the HSC.
Figure 24 The HSC metamodel layer positioning
The HSC layer integrates SC and specific HSC domain reference models and previous field research
(Figure 24).
Collaborative system metamodel core
Crisis Management
metamodel layer
H SC metamodel layer
“meta-meta-metamodel”
“meta-metamodel”
“metamodel”
Is an instance of
Is an instance of
represents H SC Domain-conceptualization
Field observati
ons
SCM reference models
HSC reference models
represents

Chapter II Humanitarian Supply Chain Metamodeling
60
This section presents the HSC layer, which is connected to the Crisis Management layer proposed by
(Benaben et al. 2016). First, the system description is given. Next, the metamodel formalization is
presented, using UML graphical language, accompanied by precise descriptions, relationships and links
to the Crisis Management metamodel.
3.1. HSC system description
This section provides an overview of the concepts and relationships to be considered in the HSC
system. Most of these concepts have been already discussed in the introduction; however, here we get
a structured overview of the HSC system under the four areas of the collaborative systems metamodel:
context, objectives, partners and behavior.
As described in (Benaben et al. 2016) a collaborative system can be described with four sub-domains
(Context, Partners, Objectives and Behavior) that contain concepts dedicated to the collaboration
situation:
• Objective: objectives addressed by the partners.
• Context: components and characteristics of the considered environment, along with related
opportunities, threats and risks.
• Partners: resources and the know-how of partners, including capabilities, patterns,
instructions, and resources (people, material, information, etc.) and flows (links among
capabilities).
• Behavior: characteristics of the collaboration. This package includes the business activities and
processes, and associated events.
3.1.1. Objectives
According to (Sarkis et al. 2012), the HSC system encompasses the planning and management of all
activities related to material, information and financial flows in disaster relief. Importantly, it also
includes coordination and collaboration with supply chain partners, third party service providers
(3PL), and across HOs in a complex and dynamic environment. To be successful, the HSC has to be
able to respond to multiple interventions, often on a global scale, as quickly as possible and within a
short time frame (Van Wassenhove, 2006). The main objective of the HSC is then to satisfy the
material humanitarian needs identified in the aftermath of a crisis.
The HSC operates without the market forces of demand and supply regulated through price.
“Donors have become particularly influential in prompting HOs to think in terms of greater donor
accountability and transparency of the whole HSC” (Van Wassenhove, 2006). Moreover, and as
discussed in the introduction, the financial gap gives donors the role of “customers”. Therefore,
despite the traditional focus on the responsiveness of HSC operations, now, HOs are motivated to
measure performance and invest in improving it.
Thus, HOs consider the performance of the operations as an objective. This performance is not
universal, and depends on the HO’s strategy.
3.1.2. Context
In the HSC literature it is clearly stated that the HSC evolves in a complex environment characterized
by:
Towards a Sustainable Humanitarian Supply Chain
61
• The large number of stakeholders interacting in the field.
• A politically volatile climate in which the HSC must operate, which implies issues of safety.
• A high level of uncertainty in terms of demand, supply and environment.
• The possibility of unforeseeable conditions and very short time frames.
This environment adds an element of risk to the enhancement of HO objectives. SC risks refer to the
possibility and effects of a mismatch between supply and demand (beneficiary’s needs in an HSC
context). ‘‘Risk sources are the environmental, organizational or supply chain-related variables that
cannot be predicted with certainty and that impact on the SC outcome variables. Risk consequences
are the focused supply chain outcome variables like costs or quality” (Jüttner et al. 2003). The potential
mismatch of sources in the HSC is grouped here in three categories of danger:
• Organizational failure: During a crisis response, HOs can be overwhelmed and it can be
difficult to apply best practices in terms of collaboration, planning or scheduling. There is
evidence of a frequent lack of planning in relief supply chains, resulting in inefficiencies. For
example, the overuse of expensive and unsafe air charters, failure to pre-plan stocks,
congestion at ports caused by unplanned deliveries, delivery of useless or unwanted items to
disaster victims and a lack of inter-organizational collaboration (Oloruntoba and Gray, 2009).
• Assessment uncertainty: Demand is often unpredictable, and may evolve during HSC
operations. The difficulties in assessing the exact needs can generate misalignment (in both
shortages and overstocks).
• Supply shortage: Even if HSC organizations are agile enough to manage organizational
failures and needs misalignments, the peaks in demand of specific emergency items within
short time periods can produce shortages at the local and international level. A clear and
recent example is the shortage of homologated Personal Protection Equipment during the
West Africa Ebola Outbreak in 2014-2015.
These dangers are related to disaster environment elements such as the beneficiaries (who are the
origin of the demand), the administrative procedures (access) and the logistics infrastructures, all of
them related to the affected geographical area.
• The socio-cultural context impacts the beneficiary’s requirements. Even though beneficiaries
do not express their needs as a customer can do on the commercial SC (HOs assess the
needs), beneficiaries are part of a certain community, which may have cultural specificities.
For example, in terms of dietary restrictions or kitchen tool standards.
• Administrative procedures such as customs clearance can produce extra delays in relief item
distribution, and have to be considered while planning the operations.
• The logistics infrastructures are required for carrying out logistics activities. They are often at
the origin of HSC disruption or extra delays due to congestion or collapse.
Moreover, there is the media, which plays an interesting role in the funding of HO operations. HOs
need to highlight the consequences of disasters and their interventions to attract donors. It has been
demonstrated that the lack of media coverage has a negative impact on funding, as illustrated by the
so-called silent disasters. Only 10% of world disasters became a news headline (IFRC, 2015).

Chapter II Humanitarian Supply Chain Metamodeling
62
Moreover, because the media places such intense pressure on agencies to compete for visibility,
organizations also have to consider communication with the international community, which mainly
happens through the media (even if they are not always able to manage it effectively). For instance,
Van Wassenhove (2006) explains that ineffective use of the media by HOs can lead to waves of
unsolicited donations (with resulting bottlenecks) instead of the much-needed resources.
3.1.3. Partners
The HSC is comprised of different partners with different motivations. By partners, we refer here to
the actors who have an active role in the HSC network. We do not consider here the beneficiaries,
insofar as the demand is assessed by HOs. In the literature, donors, HOs, governments, the military
and private Third Party Logistics Providers (3PLs) are considered to be the main HSC partners
(Kovács and Spens, 2007). HOs can be considered the primary actors of an HSC supply network as
long as they have the role of managing public and private donations. HOs include aid agencies such as
all the UN agencies (i.e. WFP, UNICEF), the IFRC/ICRC, and local and international non-
governmental organizations (NGOs) such as Oxfam or MSF.
Figure 25 Actors in the supply network of humanitarian aid (Kovács and Spens, 2007)
HO relationships occur within the HO itself and with the other partners. HO internal relationships
(collaborations) occur vertically between headquarters and field staff, and between various national or
regional divisions, or horizontally across functional units (Day et al. 2012). The definition of the
internal structures cannot be generalized. However, HO internal links can be represented with
hierarchical “parent-child” relationships. When non-command and control management exists, there
is a need to define a coordination entity that gathers the different decision-makers, such as PADRU
(Pan American Disaster Response Unit) for the IFRC.
Partner-based relationships are mainly with other HOs, with 3PLs, or with military units and
governments. These relationships can be defined as “customer-logistics service provider”
relationships. When an HO offers a service to a government, it can be considered that the HO is the
Logistics Service Provider and the government the customer, whereas when an HO orders a service
from a 3PL, the HO has the customer role.
Therefore, all these partners can take the role of a Logistics Service Provider, as they contribute to the
HSC network with material resources, skills, facilities or services. They can also be customers, as long
as they receive services from other organizations.
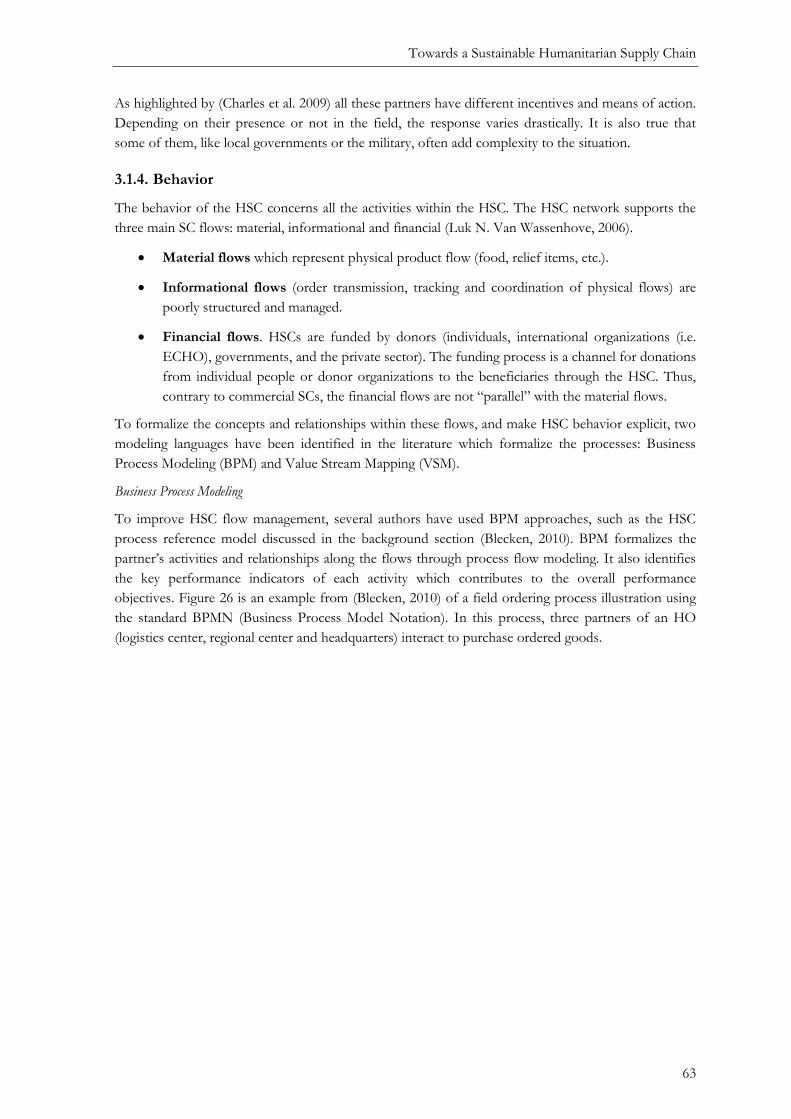
Towards a Sustainable Humanitarian Supply Chain
63
As highlighted by (Charles et al. 2009) all these partners have different incentives and means of action.
Depending on their presence or not in the field, the response varies drastically. It is also true that
some of them, like local governments or the military, often add complexity to the situation.
3.1.4. Behavior
The behavior of the HSC concerns all the activities within the HSC. The HSC network supports the
three main SC flows: material, informational and financial (Luk N. Van Wassenhove, 2006).
• Material flows which represent physical product flow (food, relief items, etc.).
• Informational flows (order transmission, tracking and coordination of physical flows) are
poorly structured and managed.
• Financial flows. HSCs are funded by donors (individuals, international organizations (i.e.
ECHO), governments, and the private sector). The funding process is a channel for donations
from individual people or donor organizations to the beneficiaries through the HSC. Thus,
contrary to commercial SCs, the financial flows are not “parallel” with the material flows.
To formalize the concepts and relationships within these flows, and make HSC behavior explicit, two
modeling languages have been identified in the literature which formalize the processes: Business
Process Modeling (BPM) and Value Stream Mapping (VSM).
Business Process Modeling
To improve HSC flow management, several authors have used BPM approaches, such as the HSC
process reference model discussed in the background section (Blecken, 2010). BPM formalizes the
partner’s activities and relationships along the flows through process flow modeling. It also identifies
the key performance indicators of each activity which contributes to the overall performance
objectives. Figure 26 is an example from (Blecken, 2010) of a field ordering process illustration using
the standard BPMN (Business Process Model Notation). In this process, three partners of an HO
(logistics center, regional center and headquarters) interact to purchase ordered goods.

Chapter II Humanitarian Supply Chain Metamodeling
64
Figure 26 A ‘field ordering’ process model example (Blecken, 2010)
Value Stream Mapping
The HSC network information and material flows can be also represented from a value stream
perspective. A VSM represents the physical flow from origin to destination for a given product (or
product family) and the related information flows. It makes explicit the waste, such as unnecessary
transportation, inventory or any activities, therefore improving the overall HSC network flows. Figure
27 shows an example of a Personal Protection Equipment value stream during the Ebola Outbreak
built with data from the field (Laguna Salvadó, Laura et al. 2015).

Towards a Sustainable Humanitarian Supply Chain
65
Figure 27 VSM example: “VSM for the Personal Protection Equipment value chain” (Laguna Salvadó,
Laura et al. 2015)
3.2. HSC metamodel
The full HSC metamodel is structured as presented in Figure 28. At the center, the Collaboration
Systems core metamodel, surrounded by the Crisis Management layer and the HSC layer.
Figure 28 HSC layered metamodel structure inspired from (Lauras et al. 2014)
The HSC metamodel is formalized using the graphical UML (Unified Modeling Language), which
links classes (the concepts) using different kinds of relationships: association, inheritance, aggregation
and composition (Figure 29).
HSC layer
Crisis Management
layer Core
metamodel

Chapter II Humanitarian Supply Chain Metamodeling
66

Towards a Sustainable Humanitarian Supply Chain
67
Figure 29 UML relationships between classes used on the HSC metamodel

Chapter II Humanitarian Supply Chain Metamodeling
68
• An association is a linkage between two classes.
• Inheritance refers to the ability of one class (child class) to inherit the identical functionality of
another class (parent class), and then add new functionality of its own.
• Aggregation is a special type of association used to model a "whole to its parts" relationship.
• The composition relationship is just another form of the aggregation relationship, but the
child class's instance existence is dependent on the parent class's instance existence.
To build the HSC layer, the concepts and relationship specifics from the HSC domain have been
defined as classes and linked to the Crisis Management generic layer. Only the HSC Behavior package
has been connected directly to the Core (see Chapter I.3.1.4 for more details). The HSC packages are
then: (i) HSC Context, (ii) HSC Partners, (iii) HSC Objectives and (iv) HSC Behavior.
3.2.1. HSC Context Package
Figure 30 HSC Context Package
The HSC Context package (Figure 30) defines the circumstances that form the setting where the HSC
system has to evolve. Based on the HSC domain characteristics captured in the previous section, what
is relevant for the concretizing of the HSC has been identified from each Crisis Management general
concept. We have defined the concepts listed below to characterize the environment specificities.
The Crisis Management “Goods” concept inherits “Logistics Infrastructure”:
• Logistics Infrastructure: any man-made element related to logistics activities (e.g. airport, bridges,
etc.).
The Crisis Management “People” concept inherits “Humanitarian Aid Beneficiaries”, which
aggregates “Cultural Considerations”.
• Humanitarian Aid Beneficiaries: Any group of people affected by the crisis situation and seeking
humanitarian aid.
• Cultural Considerations: the cultural specificities of any group of humans that can affect HSC
(e.g. food exceptions, hygiene standards).
The Crisis Management “Civilian Society” concept inherits “Media”.

Towards a Sustainable Humanitarian Supply Chain
69
• Media: any characteristic related to media that can influence the HSC, for example the donors,
or any stakeholder decisions.
The Crisis Management “Territory” concept inherits “Administrative Procedure”.
• Administrative Procedure: any procedure related to an administrative area (customs,
pharmaceutical authorizations, etc.). This will have an impact on the Stakeholders process.
Moreover, the HSC system has intrinsic risks related to context; we have identified three main risks
sources:
• Demand uncertainty: as a consequence of crisis uncertainty.
• Organizational failures: any risk source related to the HSC partner processes. There can be
undesired behavior as a consequence of the context (i.e. the bullwhip effect caused by
logistics infrastructure disruption, as observed in the Haiti crisis, 2010; or the Nepal
Earthquake, 2015).
• Supply shortage: Private Suppliers may be not able to supply some item references, as observed
during the Ebola Outbreak for Personal Protection Equipment.
3.2.2. HSC Objectives Package
As discussed previously, the goal of the HSC is to manage the flows (physical, informational, and
financial) to provide material assistance to the populations affected by a humanitarian crisis, and
therefore, to alleviate human suffering. The HSC objectives are to satisfy humanitarian needs, and to
maintain or enhance performance that can be expressed in different dimensions depending on each
partner’s strategy. Therefore, two classes inherit from the Crisis Management “Mission” class:
• Beneficiaries’ needs forecast: humanitarian needs generated by the crisis situation that have to be
satisfied.
• Performance dimension: Partner’s objectives in terms of performance.

Chapter II Humanitarian Supply Chain Metamodeling
70
Figure 31 Objectives Package
3.2.3. HSC Partner Package
The HSC partner package (Figure 32) includes all the concepts and relationships that help to describe
the HSC system (actors, resources and skills) and the links between them.
• HSC Stakeholders: inherits from Actor and is the parent class for any organization that has a
role in the HSC.
• Donor: can be a private or a public actor. They provide Funds, or in-kind donations of any kind
of resources, and also unsolicited goods (products, services, facilities, transportation).
Donations are either for a concrete crisis response or for general humanitarian responses.
• Humanitarian Organization: the parent concept of an NGO or International NGOs and
Humanitarian Agencies. HOs can inherit from other HOs, to represent internal relationships.
• Military: national or international forces collaborating on HSC operations.
• Private 3PL: Providers or Third Party Logistics are any private companies specialized in
logistic services and product supply.
• Public Authority: local, regional or national authority that can play a role in the HSC decisions
related to location or access authorizations.
• Coordination platform: the concept relates to all stakeholder coordination initiatives (e.g. UN
Logistics Cluster).

Towards a Sustainable Humanitarian Supply Chain
71
Figure 32 HSC Partner package
HSC stakeholders can be both Customers and Logistics Service Providers. For example, HOs can provide
HSC services for other HOs, and outsource services from private companies as the IFRC does
(Laguna Salvadó et al. 2016).
• Customer: Any organization that orders services and/or products to another organization.
• Logistics Service Provider: Any organization that provides services and/or products and has
facilities/skills/transport fleets and/or stocks.
• Skills: all the human capabilities (management and operational).
• Transport fleets: the transportation vehicle fleets owned by HOs or other actors (cars, planes,
trucks, etc.).
• Facilities: all the buildings (e.g. warehouses) and materials necessary for the logistic operation.
• Products: the emergency items that can be medical, food or non-food items (shelters, hygiene
kits, etc.).
• Stock: Collections of products.
• Stakeholder service: Any service provided to a third stakeholder, e.g. stock management, supply.
3.2.4. HSC Behavior Package
The HSC Behavior Package conceptualizes the process of an HSC, related to the material, information
and finance flows as they are. In contrast, the Crisis Management Behavior package was developed to
define and orchestrate the Crisis Management partner process. It includes concepts such as a

Chapter II Humanitarian Supply Chain Metamodeling
72
“mediation component” and a “mediator pool” which corresponds to a mediation information system
that should define all the partners’ processes.
Therefore, the HSC Behavior Package concepts are connected directly to the Collaborative Model
metamodel (core). The advantage of a layered approach is that in the future, the HSC could evolve in
a direction where a strong collaboration can occur (a central mediator who decides for a group of
partners), and then it would be possible to link to the Crisis Management Behavior layer to use its
concepts.
The HSC Behavior package (Figure 33) formalizes the operational processes that the HSC partners
use to achieve the objectives in a given context. This package includes concepts related to both
modeling approaches discussed in the previous section: a process oriented view (BPM), and a value
stream oriented view (VSM).
Figure 33 HSC Behavior Package
The main concepts of both approaches are conceptualized in the HSC metamodel, and linked directly
to the core concept “Process”.
• Business Process: business oriented flow of activities
• Value Stream Process: value stream oriented flow of activities
Both modeling approaches are made up of a sequence of activities that produces an outcome:
• Activity: any task performed by a partner of the HSC.
• Flow: defines the link between activities.
• KPI: Key Performance Indicator, to measure the outcome of a process
Then, to define a business process it also contains:
• Gateway: defines the flow/activity sequence.

Towards a Sustainable Humanitarian Supply Chain
73
• Event: anything that takes place, for example a start or end event of a business process (i.e.
order reception)
• Swimlane: defines the events and activities related partners.
And the additional value stream process concepts are:
• Inventory: the staging areas between each activity in the process.
• Timeline: the time consumed by activity/inventory
3.3. Potential uses and engineering methods
The conceptualization of HSC knowledge is required for both academics and practitioners to make
the relationships among the stakeholders explicit. The HSC metamodel aims to provide a shared and
common understanding of the HSC concepts and relationships, which can support data gathering,
information contextualization and knowledge exploitation (Figure 34). It defines a framework for
keeping, comparing and reusing information.
Figure 34 HSC metamodel contribution
The following section describes the potential uses of such a contribution, and engineering methods for
implementing it are suggested.
3.3.1. HSC academic field research
It is clear that a real gap exists between research proposals on HSC and their application in the field.
Among the authors aware of this issue, (Galindo and Batta, 2013; Pedraza-Martinez et al., 2013) have
indicated that research work should be closer to practice, taking into consideration real problems and
real data. The problem is that such an approach is time-consuming, as researchers find it difficult to
get accurate, and above all, reliable data to support their work (Galindo and Batta, 2013). Another
issue is the capacity of researchers to structure this knowledge in order to support the development of
original research and operational innovation for humanitarians.
Tomasini and Van Wassenhove (2009) argued that one of the main humanitarian challenges consists
in learning from previous disasters by capturing, codifying and transferring knowledge of logistics
operations. Researchers are no doubt aware that the main criterion of the success of scientific
approaches consists in producing a complete and representative model of the studied system that
helps practitioners to address problems in practice. Considered an art by many and weird science by
some, modeling is not as simple as it seems. This is particularly true in the humanitarian context, as in
(Knowledge) Decision Making
(Information) Explicit
Conceptualization
(Data) Gathering
H SC domain Metamodel

Chapter II Humanitarian Supply Chain Metamodeling
74
all new research areas, where researchers have difficulty identifying appropriate decision variables and
parameters to be able to develop accurate and relevant models (Charles and Lauras, 2011).
Field research, in the context of HSC operations management, seeks to understand the AS-IS state of
the current system’s business process, and to identify limits, weaknesses and potential improvements
and enablers. To do so, a macroscopic picture of the existing system can be seen as a priority.
Typically, diagnosis of an SC (and any other corporate system), are made by conducting an
investigation with various actors of the SC, to acquire knowledge of the organization, its culture and
its modes of operation (Lauras, 2004). This approach can be supported by the use of interview
questionnaires, and other graphical supports (i.e. maps, flow diagrams, organizational charts).
Afterwards, the collected elements have to be analyzed.
To enhance the integrity and repeatability of the analysis (within different systems, or the system over
time), it is interesting to build the investigation with reusable field research supports. SC investigation
supports are kept confidential by consulting groups, who develop their own references. Moreover,
both in the literature and the practice there is no consensus on SC field data gathering support
structuration: (Uschold and Gruninger, 1996) highlighted the need for common frameworks for field
research. A classic methodology for designing field investigation can be structured with four steps,
inspired from (Berthier, 1998):
• Field research planning: objective, hypothesis, implementation plan, scope;
• Prepare field research supports: define a research protocol, questionnaires, graphic
supports, an observation strategy;
• Implementation: introduction, data gathering, feedback;
• Analysis & research questions: AS-IS evaluation, preliminary research questions;
• Results communication: share the diagnoses.
Therefore, using the HSC metamodel to build the questionnaires and supports may facilitate the
evaluation of the observed systems by building consistent and repeatable analyses.
Figure 35 HSC metamodel use within the diagnosis method
3.3.2. HSC continuous improvement
Beyond the scientific approaches, practitioners can also take advantage of using the HSC metamodel
as a support in improving HSC processes. On the commercial SC, continuous improvement
approaches have increased in order to align the SC process with market needs (Van Wassenhove,
2006). Continuous improvement is generally defined as “a culture of sustained improvement targeting
the elimination of waste in all systems and processes of an organization” (Bhuiyan and Baghel, 2005).
H SC domain Metamodel
Field research planning
Prepare field research supports
Implementation Analyze & research questions
Results communication

Towards a Sustainable Humanitarian Supply Chain
75
Therefore, it can have a positive impact on cost, customer service, capacity utilization and
sustainability (Kovács et al. 2016). Continuous improvement was popularized by Lean Manufacturing
practices, which involves everyone working together to make improvements without necessarily
making huge capital investments. In the context of HSC, it is not a well-developed approach: however,
(Fulzele et al. 2016; Pettit and Beresford, 2009) identified it as a success factor in measuring and
improving performance, and (Cozzolino et al. 2012; Taylor and Pettit, 2009) also encourage the
adaptation of commercial lean practices in the context of HSC.
Continuous improvement occurs through evolutionary improvement (improvements are incremental),
or through radical changes (innovative ideas or new technology). The approach is cyclical, with
methods such as the data-driven improvement cycle DMAIC (Define Measure Analyze Improve
Control):
• Define: The purpose of this step is to identify the business problem, goal, potential resources,
project scope and high-level project timeline.
• Measure: This is a data collection step, the purpose of which is to establish process
performance baselines.
• Analyze: The purpose of this step is to identify, validate and select root causes for
elimination.
• Improve: The purpose of this step is to identify, test and implement a solution for the
problem in part or in whole.
• Control: The purpose of this step is to sustain the gains. Monitor the improvements to
ensure continued and sustainable success.
In this context, the use of the HSC metamodel should facilitate the identification of the business
problem and the continuous improvement project scope, as well as the measurement and analysis
steps.
Figure 36 HSC metamodel use within the DMAIC method
3.3.3. HSC Information Systems design
People, organizations, and Information Systems software must communicate between and among
themselves. However, as discussed by (Uschold and Gruninger, 1996), due to different needs and
background contexts, there can be widely varying viewpoints and assumptions regarding what is
essentially the same subject matter.
Define
Measure
Analyze Improve
Control H SC domain
Metamodel
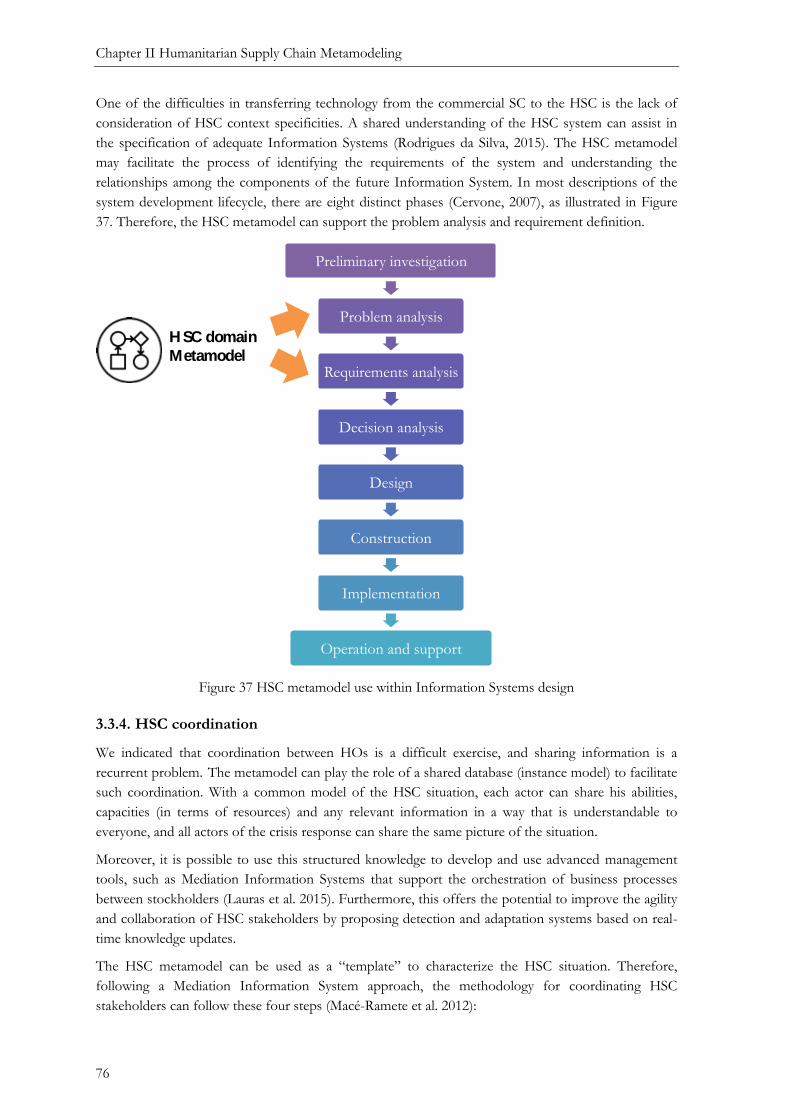
Chapter II Humanitarian Supply Chain Metamodeling
76
One of the difficulties in transferring technology from the commercial SC to the HSC is the lack of
consideration of HSC context specificities. A shared understanding of the HSC system can assist in
the specification of adequate Information Systems (Rodrigues da Silva, 2015). The HSC metamodel
may facilitate the process of identifying the requirements of the system and understanding the
relationships among the components of the future Information System. In most descriptions of the
system development lifecycle, there are eight distinct phases (Cervone, 2007), as illustrated in Figure
37. Therefore, the HSC metamodel can support the problem analysis and requirement definition.
Figure 37 HSC metamodel use within Information Systems design
3.3.4. HSC coordination
We indicated that coordination between HOs is a difficult exercise, and sharing information is a
recurrent problem. The metamodel can play the role of a shared database (instance model) to facilitate
such coordination. With a common model of the HSC situation, each actor can share his abilities,
capacities (in terms of resources) and any relevant information in a way that is understandable to
everyone, and all actors of the crisis response can share the same picture of the situation.
Moreover, it is possible to use this structured knowledge to develop and use advanced management
tools, such as Mediation Information Systems that support the orchestration of business processes
between stockholders (Lauras et al. 2015). Furthermore, this offers the potential to improve the agility
and collaboration of HSC stakeholders by proposing detection and adaptation systems based on real-
time knowledge updates.
The HSC metamodel can be used as a “template” to characterize the HSC situation. Therefore,
following a Mediation Information System approach, the methodology for coordinating HSC
stakeholders can follow these four steps (Macé-Ramete et al. 2012):
Preliminary investigation
Problem analysis
Requirements analysis
Decision analysis
Design
Construction
Implementation
Operation and support
H SC domain
Metamodel

Towards a Sustainable Humanitarian Supply Chain
77
• HSC characterization: definition of the context, the partners and the objectives of the
collaboration.
• Collaboration deduction: analyzing the knowledge gathered from the previous step, in order
to deduce collaborative behaviors.
• Orchestration: introduction, data gathering, feedback.
• Monitoring: research protocols, questionnaires, graphic supports, observation strategy.
Figure 38 HSC metamodel use within the coordination method
H SC domain Metamodel
HSC characterization
Collaboration deduction
Orchestration Monitoring

Chapter II Humanitarian Supply Chain Metamodeling
78
4. Illustration: A&C RLU academic field research
Because practitioners and academics ideally would like to have a perfect understanding of the HSC
operating modes, they have to collect and organize data. However, due to the complexity of disaster
response, direct observation, and manual data collection and processing without a clear and
transparent methodology is fastidious and inefficient.
This section presents a potential use of the HSC metamodel, based on the A&C RLU use case.
Intentionally simplified, this proof of concept aims to give readers an example of field research design
supported by the HSC metamodel, and how can it support structured data gathering.
Figure 39 Metamodel used for A&C RLU diagnosis
4.1. Field research planning
The IFRC sub-regionalization strategy was still vague when the collaboration with the IFRC began in
2015. The initial goal was to support the A&C RLU to become more cost-effective by developing
innovative HSC approaches. In compliance with (Eisenhardt, 1989), we decided to create research
propositions based on empirical evidence.
Therefore, the scope of the field research was the A&C RLU, and the objective was to identify
weaknesses of the current activity model in terms of business processes, decision-making and
information systems.
The strategy for collecting the A&C RLU AS-IS business process data was to do field research at the
Panama hub, based on interviews with practitioners, observations and data collection:
(1) Before the field campaign: Conducting preliminary informal interviews with the Regional
Logistics Development Coordinator; primary and secondary data collection.
(2) During the field campaign: Conducting on-site semi-structured interviews with all the A&C
RLU practitioners; observations and primary data collection.
(3) After the field campaign: Complete the data and analysis with remote informal interviews.
4.2. Field research supports
From the HSC metamodel and the aim of making a diagnosis of a current state, the following
interview protocol was devised to guide the visit of a field team to the A&C RLU. It was inspired
(Knowledge) Decision Making
(Information) Explicit
Conceptualization
(Data) Gathering A& C Field research
supports design
H SC domain Metamodel

Towards a Sustainable Humanitarian Supply Chain
79
from previous field research work conducted by the Disaster Resilience Lab (Comes et al. 2015; Van
de Walle and Comes, 2014).
Four generic categories of information are aligned with the HSC metamodel packages: the context, the
objectives, the partners and the behavior (Figure 40). However, given the interactions between the
concepts, there is an overlap between the questions and the related “packages”.
Figure 40 From the metamodel concepts & field research plan, to the field research supports
Context: Identify the characteristics of the A&C region in terms of logistics infrastructure, cultural &
climatological specificities.
Objective: Identify the regional humanitarian needs profile and the A&C RLU performance
approaches.
Partners: Identify the A&C RLU resources and relationships with other humanitarian actors (i.e.
donors, suppliers, 3PL).
Behavior: Identify the physical, informational and financial flows, the information systems and
decision-making processes.
4.2.1. Interview protocol
The interview protocol provides key elements that should be discussed and addressed in the
opportunities we have to talk to various people in the A&C RLU. However, it is important to take
advantage of the opportunity to have an open conversation and to capture as much data as possible.
The elements in this document (1) help us map the content of the interviews and (2) ensure that we all
collect the same information at the same level of detail.
Ideally, this document is set up in such a way that the same method can be applied by others as well:
for example, in a second field visit as well as during online interviews outside of the field.
H SC domain
Metamodel
Context
Partners
Behavior
Objectives
Field research supports
Perimeter
Research questions
Field research plan

Chapter II Humanitarian Supply Chain Metamodeling
80
Introduction
Please share with us who you are, a bit of your background and what role you are currently playing in the A&C RLU
activities.
PART 1: Context
The first part aims to describe both the A&C regional context and the A&C RLU objectives. The key
here is to understand the regional profile; including logistics infrastructures and cultural specificities.
Can you explain to us what the specificities of the A&C region are? I would like to understand how the regional
context is affecting your work.”
● Disasters typically affecting the region.
● Seasonality?
● Logistics infrastructure? Logistics hubs, transportation, etc. (use of geographical maps)
● Cultural specificities?
PART 2: Objectives
The second part aims to understand the humanitarian needs, the objectives the organization has, and
the objectives per department. Moreover, the challenge is to find out how these objectives are
evaluated.
Needs
● Type of humanitarian needs in the region?
Organization/Department:
● Type and size of the A&C RLU organization, the supply network
● Size of operations
● What are the A&C RLU objectives, your department’s objectives?
Outcome:
● How are the objectives evaluated?
● Any KPIs or indicators that you are reporting? How often? To whom?
● What is the impact of your monitoring / reporting?
● Potentially off the record: would you suggest any strategic changes / lessons learned?
● Time frame: during what stages are decisions being made?
● Is the decision reversible? Can it be adapted or changed?

Towards a Sustainable Humanitarian Supply Chain
81
PART 3: Partners
The objective here is to provide a mapping of the links between partners, and to identify the assets
and skills of each.
Cartography
● What are the skills and assets that the A&C RLU has?
● Which organizations do you interact with? (Governments, donors, etc.)
● Can I have a list of your providers?
● Any partners? (Network / Cluster, formal and informal links to other organizations)
Coordination
● Who do you coordinate with? How do you coordinate with others internally? (with respect to
other departments, logs, transportation companies, suppliers, etc.)
● How do you coordinate between the A&C RLU and the field (“your customers”)?
PART 3: Behavior
Quantitative data
● Do you have any data on the volumes of items that have been managed (supply and delivery)
during the last few years (throughput? flow per time unit? flow per item or group of items?).
Could you give us any information about where we can find such data?
● What is the cycle-time of item X (reception time, waiting time, transportation time, shipment
time, frequency of shipments, etc.)?
Network and Flow cartography
● Could you explain the different material flows? (use of geographical maps)
● Which are the most representative emergency kits?
● Could you map the physical flow main steps from the source to the beneficiaries or
destruction? Could you draw them in a diagram? If possible, provide any information about
the suppliers and the beneficiaries.
● What are the main difficulties in managing these flows?
Activity and Business Process cartography
● Which are the main activities that you or your colleagues have to manage (procurement,
stock, dispatch, shipment, kitting, transportation, coordination, etc.)?
● Could you explain the relationship that exists between all these activities?
If sufficient time: How would that look in such a diagram?
Hand Out Simple Diagram
● For the most important (of each of these activities), what are the main Inputs and Outputs
(materials, information, documents, people, etc.), the main Resources (human, skills,
equipment, machinery, vehicles, ITC, etc.) and the main Controls (objectives, constraints,
order, etc.)?
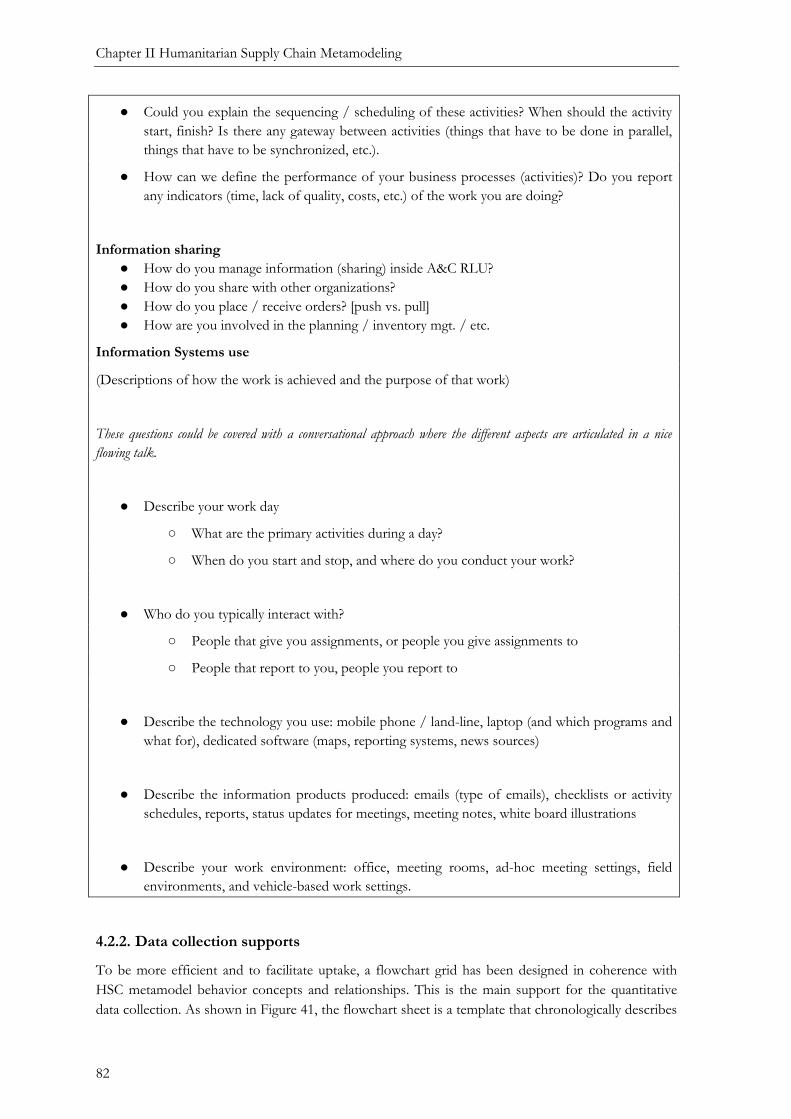
Chapter II Humanitarian Supply Chain Metamodeling
82
● Could you explain the sequencing / scheduling of these activities? When should the activity
start, finish? Is there any gateway between activities (things that have to be done in parallel,
things that have to be synchronized, etc.).
● How can we define the performance of your business processes (activities)? Do you report
any indicators (time, lack of quality, costs, etc.) of the work you are doing?
Information sharing
● How do you manage information (sharing) inside A&C RLU?
● How do you share with other organizations?
● How do you place / receive orders? [push vs. pull]
● How are you involved in the planning / inventory mgt. / etc.
Information Systems use
(Descriptions of how the work is achieved and the purpose of that work)
These questions could be covered with a conversational approach where the different aspects are articulated in a nice
flowing talk.
● Describe your work day
○ What are the primary activities during a day?
○ When do you start and stop, and where do you conduct your work?
● Who do you typically interact with?
○ People that give you assignments, or people you give assignments to
○ People that report to you, people you report to
● Describe the technology you use: mobile phone / land-line, laptop (and which programs and
what for), dedicated software (maps, reporting systems, news sources)
● Describe the information products produced: emails (type of emails), checklists or activity
schedules, reports, status updates for meetings, meeting notes, white board illustrations
● Describe your work environment: office, meeting rooms, ad-hoc meeting settings, field
environments, and vehicle-based work settings.
4.2.2. Data collection supports
To be more efficient and to facilitate uptake, a flowchart grid has been designed in coherence with
HSC metamodel behavior concepts and relationships. This is the main support for the quantitative
data collection. As shown in Figure 41, the flowchart sheet is a template that chronologically describes

Towards a Sustainable Humanitarian Supply Chain
83
the activities of an HSC. These activities are classified in 4 main categories: operation, transfer,
stock/wait and control. For each activity the main inputs, outputs and resources can be traced, in
addition to other relevant information like cycle time or available capacity.
The rationale for using such a template is to describe the value stream map and business processes. It
is important to notice that through this approach small parts of the HSC concepts are collected from
each practitioner’s point of view. All these elements should then be connected with the HSC
metamodel relationships.
To complement the data collection step, information can be gathered (qualitative and quantitative) on
physical flows that involve all processes throughout the A&C HSC. These elements can be visualized
in geographical maps.
Figure 41 Example of the workflow grid to support the field interview protocol
4.3. Implementation
The fieldwork was conducted during a 10-day mission in October 2015 at the IFRC A&C RLU
Panama site (office and warehouse).
The on-site research started with a meeting where the field research campaign was introduced to the
team. Then, for a week all members of the RLU structure were interviewed individually at the IFRC
office: Head, Service Officer, Procurement Officers, Logistics Officers and Warehouse Manager and
Officers as well as the PADRU Coordinator. The warehouse facilities (which are located on a different
site) were also visited for one day.
During the 10 days, there was continuous feedback with the A&C Logistics capacity development
officer, to discuss missing information or misunderstandings, and to gather as much complete data as
possible.
4.4. Analysis & research directions: IFRC sub-regionalization
The interviews and observations highlighted that the strategy is currently evolving. We identified the
sub-regionalization challenges and the practitioners’ needs.
Operation Considered Flow : Filed by: General Comments:
Transfer Organization:
Stock/Wait Location: Date:
Outstanding Respondent:
Control Position:
AS IS description Main Evolutions km Qt Time Inputs Outputs Resources Controls Events Comments
IFRC FIELD RESEARCH: SUPPLY CHAIN ORIENTED INTERVIEW GUIDELINE
Description of the Value Stream
Order preparation 0 3000
Customs
0.5
0 3000 0.5
Description of the Business Processes
Waiting for shipment
to the airport0
Transfer to the
airport (truck)3
3000 1
Waiting for cargo
shipment0
3000 0.3
3000 0.3

Chapter II Humanitarian Supply Chain Metamodeling
84
4.4.1. The set-up
The sub-regional logistics network design consists of a regional hub extended by a network of
capacities (inventory and infrastructures) and capabilities (logistics skills) at the country level (Figure
42). The sub-regional contingency stocks are owned by the IFRC, but hosted by the Red Cross
National Societies (independent entities, but members of the IFRC), who are in charge of logistics
management (warehousing, customs, transportation). In the function of capability enhancement, they
could also be in charge of sourcing and procurement.
Figure 42 Linear sub-regional design
When starting our analysis in 2015, the network had four sub-regional prep-stocks that were already
deployed and a dozen more were planned. Although the network is growing, the operation mode is
centralized. The RLU, based in Panama, manages all warehouse procurement, and the Sub-Regional
Logistics Units (LU) distribute only for internal country needs. As almost all the stocks are mobilized
from (or through) the regional hub, and transportation options are limited, decision-making at the
regional level is based on reliable monitored information and the experience of the practitioners. With
the current information management system, it will be difficult to enhance responsiveness and
sustainability due to the increase in the overall stock level (decentralization) and to the rigidity of
operations. Figure 43 summarizes the main outcomes from the field research, according to the sub-
regionalization strategy.
Strengths
• Local sourcing: Developing a local (country level) logistic capacity is an enabler to
develop local procurement.
• Response time: Pre-positioning contingency stock closer to the potential beneficiaries
permits a reduction of response time.
Weaknesses
• Cost: The multiplication of contingency stocks and facilities increases the fixed and
immobilization costs of the HSC network.
• Vulnerability of the contingency stock: Getting closer to the potential affected areas by
natural phenomenon may increase the exposure of the contingency stocks.
Opportunities
RegionalPre-posi onedStocks
RLU
SUPPLIER
HeadQuarters
LU
LULU
LU
Sub-regionalPre-posi onedStocks

Towards a Sustainable Humanitarian Supply Chain
85
• Operations coordination: Given that the sub-regional network increases the potential
material flows in the HSC network, there is the opportunity to improve HSC
coordination within the A&C RLU and NS.
• Sustainable decision-making: Moreover, the operations coordination can be managed with
a sustainability perspective.
Threads
• Current Information Systems: The coordination of the supply operations is limited by
current Information Systems, which do not permit a real-time exchange of information
within the sub-regional network.
• Decision-making based on experience: To coordinate (i.e. plan) operations may be a
challenge with experienced base approaches given the increasing complexity of the
network.
Figure 43 IFRC sub-regionalization SWOT analysis
4.4.2. Improvement road map
From the field research analysis, three main improvement steps have been identified.
4.4.2.1. Short term: Implementing capacities and capabilities
The first step in enhancing a sustainable sub-regional system is to implement capacities and
capabilities at a country level.
The first challenge is to define an RLU strategy with respect to capacity, and to determine optimal
stock levels for the sub-regional network. To improve in-country logistics capability, there is a need
for functioning infrastructures (warehouses, materials, vehicles, etc.) as well as people with dedicated
logistics skills. Warehouse deployment is based on an agreement with the A&C RLU, the concerned
Strengths
- Local sourcing
- Response time
Weaknesses
- Cost
- Exposure of the contingency stock
Opportunities
- Operations coordination
- sustainable decision-making
Threads
- Current Information Systems (IS)
- Decision making based on experience

Chapter II Humanitarian Supply Chain Metamodeling
86
NS, and funding organizations (IFRC or a Partner NS). A&C RLU wants to involve NSs as
“subcontractors”, and this is a huge obstacle.
NSs have very different maturity levels concerning logistics. To cope with this situation, A&C RLU is
in charge of developing logistics capacities through the National Societies Logistics Capacity
Enhancement (NSLCE).
One main issue with this is the high turnover of local volunteers and as a consequence, the volatility of
NS priorities. Moreover, NSLCE is financed by Partner NSs (such as Norway or Canada), and it is
difficult to sustain enhancement in the long term, when funding runs out.
4.4.2.2. Mid term: Monitoring the capacities and capabilities
Once the capacities and capabilities are deployed, the next challenge is how to manage and ensure the
real-time state of the network. This is a prerequisite for any decision or action on the network.
However, as observed during our research visit to A&C RLU in 2015, the current HSC Management
Support Systems have several limitations to properly supporting this approach. Practitioners will
struggle to manage the inventories and replenishments properly (no visibility, no warnings, no
decision-support) and will consequently increase the fixed costs.
The support used for following inventory levels is the HumLog software application for warehouse
management. The Panama warehouse manager sends a report (an Excel Spreadsheet) each month to
the Logistics Officer who integrates the inventory level with another Excel Spreadsheet. Then, the
Logistics Officer has to manually verify the inventory levels in accordance with defined thresholds. In
the future, there will be at least eight more stock capacities (warehouses) to be followed in “real-time”
and there will also be the corresponding increase in capabilities to manage. In all evidence, the
management system is not ready to do that.
4.4.2.3. Long term: Planning sustainable relief operations
To make sustainable use of the sub-regional network, practitioners should be able to coordinate
network resources during the same operation (Figure 44). For instance, when there is a need in the
region, which warehouse will have to send what and when? Who will manage the replenishments?
Today, decision-making is based only on the Procurement Officer’s experience and is fully centralized.
However, when the network is deployed the possible options will be multiplied by the combination of
cost (items, transport), lead-time, and event expiration date. Thus, experience will not be enough to
establish the best response for executing.

Towards a Sustainable Humanitarian Supply Chain
87
Figure 44 Sub-regional coordinated response
4.5. Results communication
The results of the field research were shared and discussed with the IFRC with the aim of highlighting
the priorities and identifying the research directions to be followed.
Part of the field research results were also communicated with scientific publications at the 2016
ISCRAM conference (Laguna Salvadó et al. 2016).
Finally, this thesis mansucript summarizes the overall impact of the field research.
capaci escapabili es
capaci escapabili es
capaci escapabili es
capaci escapabili es
capaci escapabili es
RLU
need
LU
LU
LU

Chapter II Humanitarian Supply Chain Metamodeling
88
5. Discussion
Both academics and practitioners may benefit from a clear understanding of the HSC system in order
to improve performance. This chapter aims to move the conceptualization of HSC knowledge a step
forward by developing a metamodeling approach. Metamodels facilitate integration among
stakeholders, information systems, intelligent processing and shared reuse of knowledge among
systems (Pinto and Martins, 2004). It is particularly promising in a humanitarian context that requires
making the knowledge of the relationships among relief stakeholders explicit (Humphries, 2013).
The HSC metamodel has been developed to provide a framework for classifying gathered data by
connecting it to HSC concepts. It has a clear, collaborative perspective, and builds on the Crisis
Management metamodel proposed by (Benaben et al. 2016). The HSC metamodel is a layer that
includes four packages defining the HSC collaborative system (context, partners, objectives and
behavior).
The potential uses are numerous, including the design and fulfillment of academic field research, the
implementation of continuous improvement approaches, the design of adequate information systems
and even the development of collaborative decision-support systems. The results of current and future
research work should be helpful, considering that each organization —each actor— possesses its own
knowledge, with its own semantics, usually limited to its core activity. However, even though all the
actors possess all the knowledge of the domain collectively, none of them will master all the
knowledge or its boundaries individually.
The illustration of the IFRC field research design using the HSC metamodel as a framework for
building field research supports is simple proof of the usability of the proposal. The proposed HSC
metamodel is a first attempt to describe all the concepts related to the HSC as a layered metamodel,
developed by a limited group of experts. It aims to bring a shared and common understanding of the
HSC.
However, a significant limitation of this study is that validity and reliability in qualitative research is
controversial. To go further, a reference metamodel should be validated with a large spectrum of
humanitarian actors, including academics and practitioners. The different perspectives of the actors
may produce some misunderstandings with the concepts included in the model, or with the
identification of missing concepts unknown by the author. More work has to be done to obtain a
generic HSC metamodel that can be accepted by the humanitarian community as a standard.
Moreover, the metamodel gives a static view of the HSC. By implementing it, we can obtain a
“picture” of the HSC as observed in a given moment. Due to the dynamic nature of the HSC, the
need for introducing a time dimension concept to the metamodel is considered.

89
Chapter III. SUSTAINABLE HUMANITARIAN SUPPLY CHAIN
PERFORMANCE
“Definitional diversity is to be expected
during the emergent phase of any potentially big idea
of general usefulness.”
Gladwin et al. (1995)
1. Introduction
Typically, HSCs refers to criteria such as efficiency and effectiveness to measure the performance of
their operations. This approach allows HSCs to maintain their order-qualifier position in the
humanitarian response “marketplace”.
To secure an order-winning position, and in line with the global trend to address sustainability
challenges, there is increasing interest in sustainable approaches in HSC management. In the HSC
literature, several papers call for innovations on the sustainability of humanitarian response (Haavisto
and Kovács 2014; Kunz and Gold 2017). (Haavisto and Kovács 2014) highlighted the need to find a
link between the short-term aims on operational performance and the long-term impact.
Moreover, sustainability is an abstract concept, and depending on the perspectives of people,
disciplines and organizations, the concept of sustainability is addressed or understood in different
manners and for different purposes. From the academic side, while sustainability is used in a wide
range of scientific disciplines, it does not ‘belong’ to any body of knowledge (Oloruntoba 2015), and
there are no clear standards and definitions. Already on 1995, academics expected that
sustainability would “remain fuzzy, elusive, contestable, and/or ideologically controversial for some
time to come” (Gladwin et al. 1995).
Although performance measurement and metrics are essential to effectively manage SC
operations (Gunasekaran and Kobu 2007), the development of performance measurement systems for
HSC operations is still in its infancy.
Therefore, even if sustainability can be considered a future lever to maintain an “order winner”
position for HOs, it remains an abstract objective that is difficult to quantify in HSC operations. The
challenge for HSC practitioners is first to develop an understanding of what a SHSC is, so then they
can adopt suitable performance measures and metrics to make the right decisions that contribute to
creating the value expected by donors: sustainability.
This can be achieved by a sustainable performance approach that goes beyond the
effectiveness/efficiency paradigm. Moreover, using a sustainability maturity model can also contribute
to improving sustainable performance (Kurnia et al. 2014). Unfortunately, in the literature there is no
unanimously accepted performance measurement framework, nor any maturity model, for defining
and measuring HSC operations sustainable performance.
To begin closing this research gap, this chapter addresses the following research question: What does
sustainability mean in HSC operations and how can it be assessed?

Chapter III Sustainable Humanitarian Supply Chain Performance
90
To address the above question, we suggest a framework and assessment model to define and quantify
sustainable performance in HSC operations.
In this way, this chapter contributes to turning sustainability from a set of high-level principles and
blurry definitions into a concrete and measurable criterion for the HSC decision-making process.
Starting from a literature review on sustainability, sustainable SC performance and SHSC to obtain an
overview of the state of the art, including methods and models, the maturity of sustainability will be
assessed. The literature review was a qualitative selection of papers based on citation rate. We also
considered HO reports to identify “best practices” in the sustainability field.
The remainder of the chapter is structured as follows: in Section 2, a literature review of sustainable
SC, maturity models and SHSC performance approaches is presented, which outlines the origins and
characteristics of the sustainability concept, and shows how this global challenge is affecting
organizations with a focus on SC. Section 3 develops the first contribution of this chapter: a SHSC
operations framework. In section 4, a maturity assessment model and method based on the SHSC
operations framework are presented and illustrated with the IFRC application case. Finally, in Section
5 the implications of the proposal are discussed.

Towards a Sustainable Humanitarian Supply Chain
91
2. Background
Sustainability /səsteɪnəˈbɪlɪti/
Noun. The ability to be maintained at a certain rate or level.
This section provides an exploratory overview of sustainability as it has been addressed in practice and
literature to clarify the notion of SHSC and examine how to build a consistent SHSC framework.
2.1. Sustainability: a historical perspective
Sustainable development is strongly related to the concept of progress and growth. This concept dates
back as far as the Greco-Roman period, which was the starting point for formulating ideas of
progress. Christian theology later consolidated this understanding by introducing “a linear conception
of time as a directed succession of events, that transformed the way of thinking about history and
progress” (Du Pisani 2006). The idea evolved over the centuries, and during the Industrial Revolution
(18th Century), human progress became strongly linked to economic growth and material prosperity.
Industrialization, however, also brought about a growing gap between rich and poor and
environmental degradation caused by the exploitation of raw materials on an unprecedented scale.
Therefore, in the 20th century, the ideas about growth and development where challenged. In the late
1960’s and 1970’s, people became aware of the threats that industrial and commercial expansion posed
to the environment and their own survival as human beings (pollution and resource depletion).
Western societies became conscious that scientific and technological progress could not address the
problems related to the massive consumption of resources. This period saw the beginning of
environmental protection movements, with NGOs such as Greenpeace. The notion of sustainable
development emerged, taking the word ‘sustainability’ from the ecology discourse1.
The modern idea of sustainable development was defined on 1987 during The World Commission on
Environment and Development (so called Brundtland Commission):
“Development that meets the needs of the present without compromising the ability of
the future generations to meet their own needs”
(Brundtland, 1983).
It was the first time sustainability was presented as the balance between the dimensions environment,
society and the economy (Du Pisani 2006). Nonetheless, sustainable development, as addressed by the
Brundtland Commission, has been subject to considerable criticism, as it is accused of:
(i) being vague, “it sounds so good everyone can agree with it whatever their own interpretation” (Pearce
et al., 1989),
(ii) promoting ‘fake greenery’ (Robinson 2004).
(iii) being an oxymoron. ‘Is it possible to increase world industrial output in a way that is environmentally
sustainable?’ (Robinson 2004).
Although sustainability is still a fuzzy and, at times, contested concept, the definition of the
Brundtland commission is still the most widely used (Klumpp et al. 2015).
1 In ecology, sustainability refers to the state or condition that can be maintained over an indefinite period of time.

Chapter III Sustainable Humanitarian Supply Chain Performance
92
Today, there is a consensus that sustainability is the scientific and political challenge of the 21st
century. Environmental sustainability is the most “mainstream” concern, due to the urgent need to
address climate change. In November 2017, for the second time after the 1992 “World scientist’s
warning to humanity”, 15,000 scientists signed a strong message of alarm on environmental trends,
making a special call for a “… more environmentally sustainable alternative to business as usual”
(Ripple et al. 2017).
The social consequences of the environmental crisis are also of great concern. Global commitments
like the Millennium Development Goals (MDGs), updated by the 2030 Agenda for Sustainable
Development (ASD), both promoted by the United Nations, are an attempt to define sustainable
development goals with a focus on the societal aspects. The UN SDGs includes 17 goals (Figure 45)
with 169 targets that relate to the three dimensions of sustainability: economic, social and
environmental.
Figure 45 UN Sustainable development goals
During the 2016 World Humanitarian Summit HOs committed to contributing to the empowerment
of local communities as a way to improve resilience. Sustainability challenges are already being
addressed by HOs as part of their development programs, primarily during reconstruction and
mitigation phases, by working on sustainable solutions that allow the impact of disasters to be
reduced.
2.2. The Triple Bottom Line
Sustainability has gained recognition since the early 2000s in business. Corporate social responsibility (,
good governance, and many other terms have been used to define the policies, practices, and
programs to incentivize the positive impacts of companies on societal aspects (Jamali et al. 2008;
Pojasek 2012; Virakul 2015).
In the literature, it is a widely accepted notion to present organizational sustainability as a
consideration of the balance between environment, society and economy, also known as the TBL
(Carter and Easton 2011; Carter and Rogers 2008; Elkington 1998; Virakul 2015). These three pillars
are also referred to as “People, Planet and Profit”. The TBL model is a systemic approach developed
on the mid 90’s by John Elkington to “capture the essence of sustainability by measuring the impact

Towards a Sustainable Humanitarian Supply Chain
93
of an organization's activities including its profitability and shareholder values and its social, human
and environmental capital” (Savitz 2012). It stresses the need to engage on the performance
achievement of these three sustainability dimensions.
This idea comes from the recognition of the environmental, economic and social systems intersection,
where sustainability is achieved (Mebratu 1998). The TBL dimensions are defined here as:
Figure 46 TBL dimensions
• Economic sustainability or “Profit”: relates to cost and productivity considerations. An
organization has to use its resources so that it can consistently produce an operational profit,
and sustain its activities.
• Social sustainability or “People”: relates to proper and favorable business impact for
employees, population, and the area in which the organization conducts its activities.
• Environment sustainability or “Planet”: relates to environmental impact. It attempts to
benefit the natural setting as much as possible or at least do no damage and decrease the
environmental effect.
According to (Pojasek 2012), all activities, products and services have a footprint. This footprint
creates impacts on each of the TBL dimensions. Each impact creates risks for the organization’s
sustainability. The organization can mitigate these risks through a sustainable management of
operations that avoid creating negative impacts, as far as is possible.
Figure 47 Sustainability with an organizational perspective (Pojasek 2012)
TBL is widely used as a synonym of sustainability in the business literature. However, some authors
argue that the TBL elements are conflicting and that their common achievement is therefore
impossible (Milne and Gray 2013). Accordingly, the TBL approach, as it is currently used, reinforces a
position where financial viability is prioritized and environmental and social considerations remain an
afterthought. It is considered by some as a pathway for corporations to easily ignore or bypass key
sustainability issues (Sridhar and Jones 2013).
Here, the problem may not be the TBL philosophy itself, but to recognise and accept the limited
function of measuring sustainability, which is useful for (Burritt and Schaltegger 2010):
Environment
EconomySociety
SustainableManagement
Footprint Impacts Risks

Chapter III Sustainable Humanitarian Supply Chain Performance
94
• Providing information about an organization’s impact;
• Understanding situations;
• Answering specific questions;
• And enabling comparisons.
2.3. Sustainability of the Supply Chain
80% of global trade passes through SCs. The SC is considered one of the most important levers for
business to create positive (or negative) impacts in the world (Carter and Easton 2011). Therefore, SC
sustainability is a growing global concern. According to the UN Global Compact Initiative a
sustainable SC should follow ten Principles related to the environmental and social dimensions.
The UN Global Compact Principles for SSCM
Human Rights
• Principle 1: Businesses should support and respect the protection of internationally proclaimed human
rights; and
• Principle 2: make sure that they are not complicit in human rights abuses.
Labour
• Principle 3: Businesses should uphold the freedom of association and the effective recognition of the
right to collective bargaining;
• Principle 4: the elimination of all forms of forced and compulsory labour;
• Principle 5: the effective abolition of child labour; and
• Principle 6: the elimination of discrimination in respect of employment and occupation.
Environment
• Principle 7: Businesses should support a precautionary approach to environmental challenges;
• Principle 8: undertake initiatives to promote greater environmental responsibility; and
• Principle 9: encourage the development and diffusion of environmentally friendly technologies.
Anti-Corruption
• Principle 10: Businesses should work against corruption in all its forms, including extortion and bribery.
Derived from: the Universal Declaration of Human Rights, the International Labour Organization’s Declaration on Fundamental Principles
and Rights at Work, the Rio Declaration on Environment and Development, and the United Nations Convention Against Corruption (Sisco
et al. 2015).
The objective of Sustainable Supply Chain Management (SSCM) is to contribute to reducing the
negative footprint (Kleindorfer et al. 2005). The most cited definition of SSCM is from (Seuring and
Müller 2008):
“The management of materials, information and capital flows as well as cooperation
among companies along the SC while integrating goals from all three dimensions of
sustainable development, i.e. economic, environmental and social, which are derived from
customer and stakeholder requirement”
More recently, (Ahi and Searcy 2013) proposed an extended definition that integrates the previous
one, but covers 7 business sustainability characteristics (economic, environmental, social, stakeholder,
volunteer, resilience, and long-term focuses) and 7 SCM characteristics (flow, coordination,
stakeholder, relationship, value, efficiency, and performance focuses):

Towards a Sustainable Humanitarian Supply Chain
95
“The creation of coordinated SCs through the voluntary integration of economic,
environmental, and social considerations with key inter-organizational business systems
designed to efficiently and effectively manage the material, information, and capital flows
associated with the procurement, production, and distribution of products or services in
order to meet stakeholder requirements and improve the profitability, competitiveness, and
resilience of the organization over the short and long-term.”
Sustainable SCM (SSCM) is therefore a challenging task that basically needs to integrate economic,
environmental, and social dimensions in the decision-making processes.
2.3.1. Sustainable SC Performance measurement
Performance /pəˈfɔː.məns/ Noun. How well a person, machine, etc. does a piece of work or an activity
Performance Measurement is a way to quantify and control the outcomes obtained in any
organization’s process. It can be used to compare goals, standards, past results or organizations, and to
anticipate the impact of decisions on planning processes. Given the far-reaching consequences of their
activities, SC decision-makers are in a position to impact the economic, social and environmental
dimensions of sustainability (Carter and Easton 2011).
The traditional objective of SC performance is to maximize financial profit, paying little or no
attention to environmental and social impacts.
SC performance measurement has been addressed widely in the literature. The main focus of the
academic studies has been (Ahi and Searcy 2015):
• Evaluating and monitoring progress,
• Reporting of performance,
• Identifying achievements,
• Promoting improved process understanding,
• Identifying critical issues,
• Providing guidance for future actions, among other topics.
There is evidence of growing interest in research that focuses specifically on measuring performance
in sustainable SCs. Although SSCM is still a young discipline, there has been a dramatic rise in the
number of publications since the beginning of the 2000’s. A search of the Web of Science database
shows an exponential increase in publications with the topic “sustainable SC performance”.

Chapter III Sustainable Humanitarian Supply Chain Performance
96
Figure 48 Sustainable SC performance WoS publications growth
While analyzing sustainability SC disclosure initiatives, (Okongwu et al. 2013) identified TBL
performance as one of the main drivers. Also (Baumann 2011; Beske and Seuring 2014; Carter and
Liane Easton 2011; Seuring and Müller 2008; Taticchi et al. 2015) refer to the TBL when addressing
SC sustainability. Therefore, TBL performance measurements for SC operations are abundant in the
literature. (Chardine-Baumann and Botta-Genoulaz 2014) define the sustainable performance of a
practice as the combination of its economic, social and environmental performances. A recent study
identified a total of 2555 unique metrics in the SSCM literature published by the end of 2012 (Ahi and
Searcy 2015). The results highlight the great variety of approaches for measuring SC sustainability.
Academic proposals typically deal with the strategic decisional level (network design) (Eskandarpour et
al. 2015), or with a focus on one of the SC SCOR reference operational processes (Huan et al. 2004):
make, source, deliver or return. Moreover, the TBL dimensions are often addressed alone, or two by
two (economic-environmental, economic-social or environmental-social).
2.3.2. Economic performance
The SC economic performance dimension measures the financial benefit. The economic performance
is therefore strongly related to the satisfaction of customer expectations. For different industries,
customers look at different measures, such as delivery service, where time is no doubt their major
concern; whereas for parts manufacturing, the accuracy of the specification may be the most
important consideration (Chan 2003). The economic performance is a balance between effectiveness
in delivering customer value and the cost-efficiency of the SC process. SC models have typically
focused on performance measures such as a combination of cost (inventory costs and operating costs)
and customer responsiveness (i.e. lead time, stock-out probability, fill rate) (Beamon 1999).
2.3.3. Environmental performance
The environmental impact of increasingly globalized SCs has been widely investigated since the
1990’s. It is the most highly-developed concept of the TBL. “Green business”, or corporate
commitment to environmental protection has been demonstrated to lead to competitive advantage
(Esty and Winston 2009), as it is seen as an opportunity for growth and profit. Reducing resource
consumption can lead to an improvement in economic performance.
0,00%
2,00%
4,00%
6,00%
8,00%
10,00%
12,00%
14,00%
16,00%
18,00%
20,00%
2000 2001 2002 2003 2004 2005 2006 2007 2008 2009 2010 2011 2012 2013 2014 2015 2016
% o
f T
ota
l p
ub
licati
on
on
th
is
peri
od
e
Year of publication
Sustainable SC performance SC performance

Towards a Sustainable Humanitarian Supply Chain
97
Environmental performance focuses on environmental protection principles that cover all phases of a
product's life cycle, from the extraction of raw materials through the design, production, and
distribution phases, to the use of the product by consumers and its disposal at the end of the product's
life cycle (Ahi and Searcy 2015). The World Economic Forum estimates that logistics activity accounts
for 6% of the total 50,000 mega-tons of CO2 annually produced by human activity (Grant et al. 2017).
Therefore, it is not surprising that the most popular metric for measuring environmental impact is the
carbon footprint emitted by a company or an SC. Some other key indicators, even if defined using
different words, are related to energy use, hazardous wastes generated, and material recovery
(Okongwu et al. 2013).
2.3.4. Social performance
Social sustainability has been less fully explored than the environmental dimension in SCs.
Furthermore, the definition of social sustainability itself is still not clear. Social sustainability in SCs
typically refers to issues of social justice and human rights, with studies focusing on practices such as
supplier human rights actions, labor conditions, gender equality or supplier compliance with child
labor laws, and the delivery of social justice through sourcing from “ethical” suppliers. Including social
aspects in network design decisions allows a better evaluation of the impact of an SC on its
stakeholders: employees, customers and local communities.
2.3.5. Standard Sustainable SC performance frameworks
The debate remains open in the Operations Management literature regarding the possibility of having
standard sustainable SC performance measures. Given the lack of standardization, some authors argue
that indicators need to be established on a case-by-case basis (Bouchery et al. 2010). Also (Pojasek
2012) suggests that each organization should create its own definition of the term. Others argue that it
is possible to have a standard set of indicators to measure the sustainable performance of a given
process (i.e. source, make, deliver) (Veleva and Ellenbecker 2001).
SSCM performance measurement has been mostly addressed - both in practice and in the literature -
with a focus on accountability reporting (Carter and Rogers 2008). Therefore, methods such as Life
Cycle Sustainability Assessment (LCSA), ISO 26000 (international standard), or the Global Reporting
Initiative (GRI) suggest frameworks to report the impact of the SC on sustainability. The GRI is one
of the most used references in terms of sustainability reporting. It provides guidelines on how a report
should be built. The GRI defines a list of over 90 indicators in the three TBL categories. The social
category is further divided into four sub-categories, which are Labor Practices and Decent Work,
Human Rights, Society and Product Responsibility (Global Reporting Inititative 2015). Although the
GRI is widely-used by many organizations, it has been criticized for its complexity. It adds a lot of
criteria, and gathering and analyzing the data is time- and cost-consuming.
Other references, such as the ISO 14000 international standard family, or GreenSCOR are focused
only on one of the environmental dimensions. For example, ISO 14031 is designed for environmental
performance evaluation with indicators in three key areas: (1) environmental condition indicators, (2)
operational performance indicators and (3) management performance indicators.

Chapter III Sustainable Humanitarian Supply Chain Performance
98
2.3.6. Sustainability maturity methods and models
Maturity /məˈtʃʊə.rə.ti/ Noun. A very advanced or developed form or state
A maturity model is defined by (Battista 2013) as:
“A framework conceived to evaluate the maturity of an organization through the definition
of a set of structured levels that describe how well behavior, practices and processes can
reliably and sustainably produce required outcomes”.
The origin of maturity models comes from the “Capability Maturity Model” (Paulk et al. 1993), which
is used to assess an organization on a scale of five process maturity levels. Each level ranks the
organization according to its standardization of processes in areas as diverse as software engineering,
systems engineering, project management, risk management, system acquisition, information
technology (IT) services and personnel management (Correia et al. 2017).
The use of maturity models to analysis and optimize processes has seen exponential growth in recent
years, with encouraging results. Therefore, many authors have focused on the development of SC
sustainability specific domain models (Baumann 2011; Golinska and Kuebler 2014; Kurnia et al. 2014;
Okongwu et al. 2013; Reefke et al. 2014; Srai et al. 2013). (Correia et al. 2017) recently published a
literature review on the topic, and identified the potential uses of Maturity Models as:
• A descriptive tool for the evaluation of strengths and weaknesses
• A prescriptive instrument to help develop a guide (roadmap) for performance improvement
• Comparative tool to evaluate the processes/organization and compare them with standards
and best practices from other organizations
• Enablers for internal and external benchmarking
Typically, a method to assess a maturity level consists of measures and questionnaires, which allow the
organization to perform self-assessment and benchmarking of their sustainability level. However,
there is no standard definition of maturity levels. As an example, (Baumann 2011) proposes an
analytical evaluation model to characterize the global performance of an SC based on performance
measurement aggregation, which is built on the TBL dimensions. The maturity of sustainable practices
is defined on 4 levels proportional to the degree of implementation.
2.4. Sustainability in the HSC
Today, there is no clear global consensus on how the humanitarian system should address HSC
sustainability. Previous research focuses on: (i) the theoretical conceptualization of sustainability and
(ii) the analytical modeling of the HSC at different levels (i.e. network design, operations, or
procurement policy).
Towards a Sustainable Humanitarian Supply Chain
99
2.4.1. HSC sustainability concept
Recently, (Klumpp et al. 2015) proposed a definition for sustainable humanitarian operations built on
a combination of HOs’ objectives, logistics definition (from the CSCMP1) and the Brundtland
sustainable development definition:
“Sustainable humanitarian logistics has the objective to assure every human being—
especially in situations of disasters and emergencies—a standard of living adequate for the
health and well-being of himself and of his family, including food, clothing, housing and
medical care and necessary social services by planning, implementing, and controlling the
efficient, effective forward and reverse flow and storage of goods, services and related
information throughout the whole SC in a manner that meets the needs of the present
without compromising the ability of future generations to meet their own needs”
This definition includes a large (but fuzzy) view of stakeholders’ expectations on sustainability. With
an analysis of Annual Reports from several HOs – given the lack of sustainability reports –, (Haavisto
and Kovács 2014) concluded that HOs mainly view sustainability in terms of the expectations of
society and the beneficiaries.
Moreover, according to (Hausladen and Haas 2013), development aid and ad-hoc disaster relief have
to be considered simultaneously to achieve sustainability. They proposed a theoretical framework to
integrate a TBL-oriented sustainability perspective within HSC operations planning. It is a holistic
approach that combines disaster relief assistance and long-term planned continuous development for
strategic, tactical and operational planning.
Also with a theoretical point of view, Kunz and Gold (2015) have developed a framework of SHSC at
the rehabilitation phase. The sustainable performance is conceptualized as flowing from a strategic
reconciliation between relief organizations’ enablers (resources, capabilities and commitment) and
beneficiaries’ requirements, via an optimal SC design.
2.4.2. Analytical approaches
Apart from the theoretical discussions on sustainability, few proposals use analytical methods to assess
SHSC performance.
HSC Network design
(Dubey and Gunasekaran 2016) identify three important characteristics of SHSC networks that
contribute to HSC performance: agility, adaptability and alignment, and explore possible linkages using
extant literature and interpretive structural modeling with sustainability.
Accordingly, dynamic sensing, responsiveness and flexibility are important dimensions of HSC agility.
In order to improve the adaptability of the HSC network, focus should be placed on culture,
developing mutual respect and trust among SC partners and responding to environmental needs. HSC
alignment can be improved by effective communication design, through proper training and
development, collaboration and by maintaining transparency.
1 The Council of SC Management Professionals (http://cscmp.org)

Chapter III Sustainable Humanitarian Supply Chain Performance
100
Table 5 Humanitarian SC performance enablers (Dubey and Gunasekaran 2016)
HSC Operations
Within the SC processes, transport has been the focus of sustainable SC research and practice due to
the high energy consumption, emission of gases, noise pollution and other impacts on the
environmental dimension. Therefore, in the context of HSC, (Wei et al. 2015) presented an
optimization model to demonstrate the interest of measuring the impact of HSC transport on TBL
performance. The model ensures sustainable economic operations with an effective use of the
financial resources of donors (minimization of the economic dimension). For the environmental
dimension it computes the resulting CO2 emissions of transportation, and for the social dimension, it
constrains a timely distribution and measures the response ‘credibility’. The objective of the
mathematical model is to minimize the total cost of procurement plus transportation.
HSC Procurement policies
Using Value Chain Analysis (VCA), (Taylor and Pettit 2009) demonstrate that the use of local
manufacturing and prepositioning stocks reduces the Carbon Footprint. Considering that the HSC has
similar processes to a commercial SC, (Van Kempen et al. 2017) used a LCSA to discuss international
versus local procurement strategies and their impact on the TBL. The study focuses on the
distribution of kitchen sets to refugee camps, and although difficulties were encountered in collecting
data, they conclude that based on the LCSA, local sourcing is preferable over international sourcing in
social and environmental TBL dimensions.
2.5. Conclusion
The TBL is the most widely accepted approach to address sustainability. Even if it comes from the
for-profit sector, in the literature many authors have already made the assumption that it is a
substantial part of a sustainable humanitarian system (Klumpp et al. 2015; Kunz and Gold 2017).
Unfortunately, there is no universal definition of the three TBL dimensions; neither is there an
accepted standard to measure it. Even if this lack of standardization can be seen as a weakness, several
authors highlight the fact that it provides the possibility to adjust this general framework to any
organization.

Towards a Sustainable Humanitarian Supply Chain
101
Moreover, there is significant literature on SC and HSC that deals with one or several of the TBL
dimensions. Indicators are abundant in the literature referring to each dimension. The difficulty
remains in identifying the objectives that decision-makers need to consider in SHSC operations.
Thus, the macro-economic definition of sustainability, and the three categorical dimensions can
explain sustainability on a conceptual level (Santiteerakul et al. 2015), but do not provide much
guidance on how sustainability should be measured in the context of HSC operations. Nonetheless,
according to (Haavisto and Kovács 2014), the sustainable performance expectations from the
organization’s perspective seem to have been overlooked.
Therefore, given our focus on HSC operations decision-making, we aim to address sustainable
performance in the light of SC and program sustainability expectations. Nonetheless, we want to
consider also the context expectations (beneficiary and societal expectations), to be coherent with the
broad conceptualization of sustainability.
The ultimate objective then, is to define a performance framework that links the short-term
performance expectations and the long-term impact of aid in the social and environmental
dimensions, and to define a maturity model to monitor SHSC performance.

Chapter III Sustainable Humanitarian Supply Chain Performance
102
3. Definition of Sustainable HSC performance
This section presents the SHSC operational performance framework to assess the impact of
operations. It is based on the TBL dimensions, and decomposed into a set of sub-dimensions, with
the related definitions and examples of criteria to measure it. The criteria are related to the main HSC
processes: procurement, warehousing and transport.
3.1. Economic dimension
Traditional SC performance is directed towards financial and operational indicators (Kunz and Gold
2017). In HSC, the added value of operations is defined by accomplishing general humanitarian
ambitions like “saving lives”. To do so, the main criteria to evaluate HSC performance are generally
effectiveness, efficiency, and equity (Gralla et al. 2014).
Effectiveness is the capability of achieving the organization’s target. In a “value driven” organization,
the target will be to satisfy the customer’s needs. In HSC, donors ask for specific aims and target levels
such as numbers of households that are provided with humanitarian relief items, shelter, or education.
In HSC literature, the effectiveness objective usually corresponds to the demand satisfied. To measure
it, different KPI are proposed, like population coverage, order fulfillment, stock-out minimization, etc.
By looking at the specifics of the three HSC processes, the effectiveness key performance indicator for
“source” will be defined as a measurement of effective replenishment, for “make”, as the strategic
contingency stock level maintenance, and for “deliver”, as the needs coverage (real demand) on time.
Others have used the deprivation cost approach (Holguín-Veras et al. 2013) or the amount of
suffering of the victims.
Equity is considered as an important objective by HOs, however, considering it as a performance
indicator is still the exception rather than the rule in the humanitarian setting. Here it is understood as
a complement of effectiveness because it is an integral part of humanitarian principles. It also could be
considered in the social dimension, as it has a direct link with societal wellbeing. In fact, equity has
been defined as the intersection between people and profits (Carter and Easton 2011). Tzur measured
the equity of HSCs using the Gini Index (Tzur 2016), a non-linear measurement of inequality. Others
have used disparity in demand satisfaction. Non-discriminatory distribution is an objective for the
“making” and “distribution” processes (contingency stock maintenance, needs coverage). For the
sourcing process, field-observations at the IFRC also show that the objective is the respect of fair
commercial competition.
Efficiency can be defined as the ability to avoid wasting resources to reach a target. In HSC, this
dimension corresponds to the minimization of operation costs. Although making a profit is not their
objective, non-profit organizations also care about financial wellbeing, since financial stability is crucial
to their missions and survival. Cost key performance indicators have already been used as an objective
function in many humanitarian distribution models (Beamon and Balcik 2008). Regarding the
upstream HSC, Beamon and Balcik identified three dominating costs: the cost of supplies, distribution
costs, and inventory holding costs. Other costs that can be considered are handling costs, kitting or
consolidation costs (cost of building emergency item kits).
Thus, we propose the performance criteria, objectives and key performance indicators, as presented in
Table 6, to define and quantify the economic TBL performance dimension of the HSC operations.

Towards a Sustainable Humanitarian Supply Chain
103
Table 6 Economy sub-dimensions, definitions and criteria
Sub-
dimension Definition Procurement Warehousing Transport
Criteria
example
Effectiveness The ability to satisfy
demand on time
x
x
x
Needs coverage
on time,
deprivation cost
Equity
The ability to satisfy
the demand in a
proportional manner
(downstream)
x
Inequality
measures (i.e.
Gini index)
Efficiency
The ability to reduce
the financial
spending
x
x
x
x
x
HSC costs
(Acquisition
cost +
Holding cost +
Kitting cost +
Distribution
cost)
3.2. Environmental dimension
The HSC is not a closed system. Therefore, the achievement of its objective of emergency items
distribution it will inevitably imply consumption of resources (materials, energy) and discharge into the
environment (wastes, pollution, noise).
Table 7 Environmental footprint of the HSC schema, inspired from (Hervani et al. 2005)
Waste
Pollution
Noise…
Energy
Materials

Chapter III Sustainable Humanitarian Supply Chain Performance
104
SC literature contends that logistics operations can particularly influence pollution (i.e. air, noise), and
the conservation of resources (i.e. energy, water) (Murphy and Poist 2003). Thus, we assume that
performance in these two areas constitutes the HSC environmental dimension.
The objectives of measuring environmental pollution are mostly to reduce green house gas emissions,
and to manage hazardous materials. Hazardous materials are rare in Humanitarian relief distribution,
but they may be present as part of the wastes for medical relief organizations (e.g., medical disposals
were an important consideration in the Ebola response). However, we consider that its management it
is outside the procurement, warehousing and transport processes, and thus outside the scope of this
study. Regarding greenhouse gases, the most widely used key performance indicator is direct and
indirect CO2 emissions, or the carbon footprint, coming from life cycle assessment approaches (LCA)
(Baumann 2011). Carbon emissions can be differentiated between two categories: stationary sources
(emissions from material processing, manufacturing, and warehousing) and non-stationary sources
(emissions from inbound and outbound logistics) (Sundarakani et al. 2010). In the GreenSCOR
reference model, best practice and performance metrics are suggested by each of the SCOR processes
regarding pollution reduction and resource conservation. However, there is no agreed framework for
measuring the environmental footprint of the SC.
The resource conservation objective is to reduce wastes like energy, water, packaging, etc. Resources
are consumed all along the SC processes. Inventory immobilization (contingency stock) generates
significant energy consumption, especially in warm countries (air conditioning). Choices with regard to
the mode of packaging or transportation may influence the quantity of packaging consumed
We summarize the criteria on the environmental dimension in Table 8.
Table 8 Environment sub-dimensions, definitions and criteria
Sub-
dimensions
Definition Procurement Warehousing Transport Criteria example
Pollution
reduction
Ability to reduce
the HSC footprint
x
x
x
Carbon Footprint
Resources
conservation
Ability to reduce
resources
consumption
(energy, water,
packaging…)
x
x
x
Resources
management
capability
3.3. Social dimension
The social dimension was the last to be developed in the TBL framework; it has been typically
neglected in quantitative models (Brandenburg et al. 2014). In holistic social definitions, there are
many criteria that can be found: education, equity and access to social resources, health and well-being,
quality of life, and social capital.
Internal and external factors need to be differentiated here. In HSC operations, internal factors are
related to labor conditions and external factors to community empowerment. Both criteria build the
social sustainability performance as Table 9 shows.
Labor conditions are strongly highlighted by the 2030 Agenda for Sustainable Development, which
aims at enhancing prosperity by reducing poverty and economic disparity (wages), gender equality or

Towards a Sustainable Humanitarian Supply Chain
105
decent work. The labor conditions objective for the HSC seeks to preserve the health and security of
employees, and ensure good conditions of work (Baumann 2011).
Table 9 Social sub-dimensions, definitions and criteria
Sub-
dimension
Definition Procurement Warehousing Transport Criteria
example
Local
communities
empowerment
The ability to develop
local wealth
x x x Local
procurement
Labour
conditions
Ensure good
conditions of work
and preserve health
and security of
employees
x
x
x
x
x
Employee
management
(internal)
Suppliers
assessment
(external)
One pillar of a humanitarian organization’s strategy (HWS 2015) is to empower local communities
with the aim, (among others), of improving disaster resilience (Comes 2016). Community
empowerment can be seen as an external influence including contribution to employment and the
creation of wealth. Many authors also refer to the positive impact of local sourcing as an action in
favor of community empowerment (Kovács and Spens 2011; Kunz and Gold 2017) with a positive
impact on regional economic development. Therefore, the current trend is favoring local sourcing
wherever possible (Haavisto and Kovács 2014).
3.4. Conclusion: The house of SHSC operations
Despite the published studies, including those noted above, no comprehensive inventory of metrics
applied to SSCM is yet available.
The proposal set up concrete criteria, objectives and KPI sets for assessing the operations impact in
the TBL approach. Figure 49 illustrates the proposed approach with the “House of SHSC
Operations”.
The House of SHSC Operations is based on the HSC operational processes: Procurement,
Warehousing and Transportation. Each pillar is built on one of the TBL performance criteria. To
enhance an overall sustainable performance, the three pillars have to be balanced, so the roof is in
equilibrium. This image reflects the importance of considering all the TBL performance objectives to
enhance an overall sustainable performance. Carter and Rogers (2008) emphasize that organizations
that seek to maximize the performance of all three pillars simultaneously will outperform
organizations that only maximize the economic performance, or the ones that attempt to achieve high
levels of social and environmental performance without explicit considerations of economic
performance.
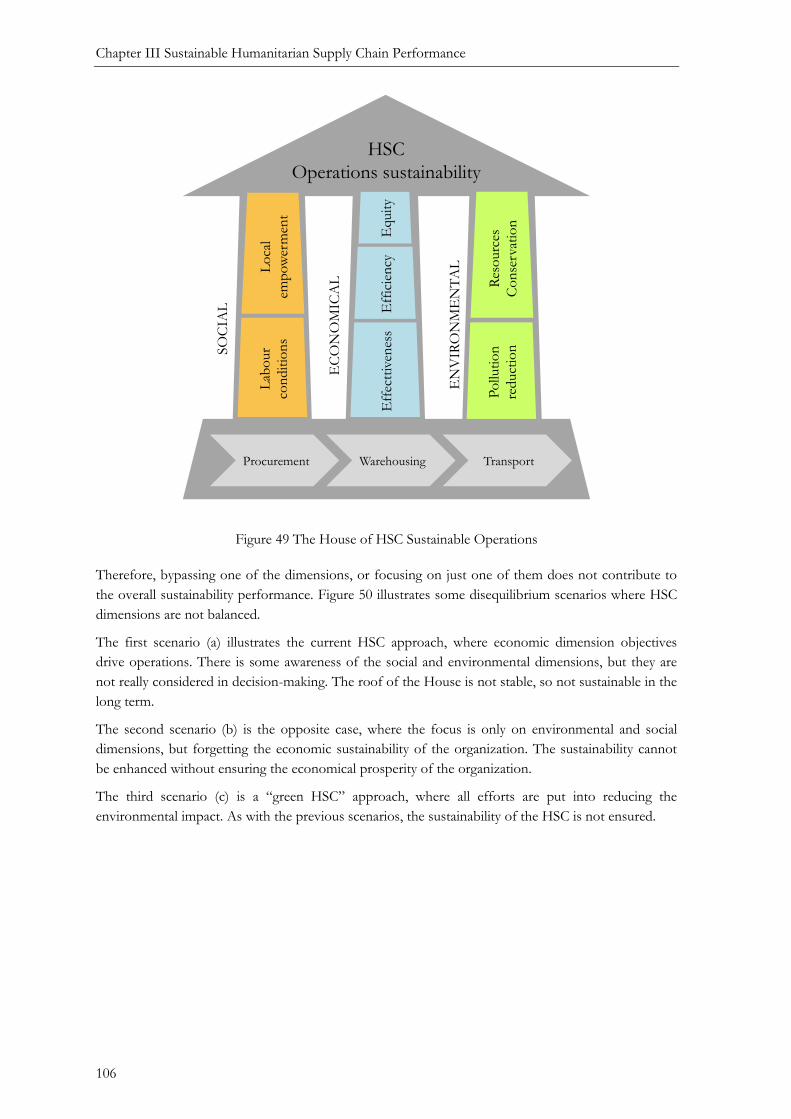
Chapter III Sustainable Humanitarian Supply Chain Performance
106
Figure 49 The House of HSC Sustainable Operations
Therefore, bypassing one of the dimensions, or focusing on just one of them does not contribute to
the overall sustainability performance. Figure 50 illustrates some disequilibrium scenarios where HSC
dimensions are not balanced.
The first scenario (a) illustrates the current HSC approach, where economic dimension objectives
drive operations. There is some awareness of the social and environmental dimensions, but they are
not really considered in decision-making. The roof of the House is not stable, so not sustainable in the
long term.
The second scenario (b) is the opposite case, where the focus is only on environmental and social
dimensions, but forgetting the economic sustainability of the organization. The sustainability cannot
be enhanced without ensuring the economical prosperity of the organization.
The third scenario (c) is a “green HSC” approach, where all efforts are put into reducing the
environmental impact. As with the previous scenarios, the sustainability of the HSC is not ensured.
Procurement Warehousing Transport
HSC
Operations sustainability
Lo
cal
emp
ow
erm
ent
Lab
our
con
dit
ion
s
SO
CIA
L
EC
ON
OM
ICA
L
EN
VIR
ON
ME
NT
AL
Res
ourc
es
Co
nse
rvat
ion
Po
lluti
on
reduct
ion
Equit
y E
ffec
ttiv
enes
s E
ffic
ien
cy

Towards a Sustainable Humanitarian Supply Chain
107
(a) (b)
(c)
Figure 50 Illustration of HSC operations sustainability conceptual “disequilibrium”
Finally, Figure 51 illustrates the case where all the dimensions are considered, without reaching the
maximum performance expectations in any of them. The sustainability is then reached, without
excelling in any of the dimensions.
Figure 51 A balanced SHSC performance
Procurement Warehousing Transport
HSC Operations sustainability
Local
empowerm
ent
Labor
conditions Po
lluti
on
reduct
ion
Equit
y E
ffec
ttiv
enes
s E
ffic
ien
cy
Procurement Warehousing Transport
Lo
cal
emp
ow
erm
ent
Lab
our
con
dit
ion
s
SO
CIA
L
EC
ON
OM
ICA
L
EN
VIR
ON
ME
NT
AL
Res
ourc
es
Co
nse
rvat
ion
Po
lluti
on
reduct
ion
Equit
y E
ffec
ttiv
enes
s
HSC
Operations sustainability
Procurement Warehousing Transport
HSC
Operatio
ns susta
inabilit
y
Lab
our
con
dit
ion
s
Res
ourc
es
Co
nse
rvat
ion
Po
lluti
on
red
uct
ion
Eff
ectt
iven
ess
Procurement Warehousing Transport
HSC
Operations sustainability
Lo
cal
emp
ow
erm
ent
Lab
our
con
dit
ion
s
Res
ourc
es
Co
nse
rvat
ion
Pollution
reduction
Equity
Effectiveness
Efficiency

Chapter III Sustainable Humanitarian Supply Chain Performance
108
4. SHSC maturity assessment
Previously, we have defined the elements that impact the ability of an HSC to be sustainable. Once
sustainable performance dimensions and sub-dimensions have been defined with the “House of HSC
sustainable operations”, the challenge remains to measure them. This section suggests a maturity
assessment model that enables quantification of SHSC performance.
The interest of the assessment model is that it involves both benchmarking and monitoring SHSCs.
Benchmarking allows internally or externally different systems or sub-systems to be compared, for
example disaster responses, or for the case of the IFRC, different RLUs. Monitoring enables the
evolution of a system over time to be assessed, and therefore drive the performance.
4.1. HSC sustainability assessment method
4.1.1. Assessment model
A performance maturity level assessment, based on the TBL dimensions and sub-dimensions, is a way
to measure the sustainability of the HSC. For this specific purpose, we suggest using a quantitative and
symbolic modeling approach (Figure 52). The SHSC maturity is built on the maturity of each of the
TBL dimensions, defined here by five levels:
Figure 52 HSC sustainable performance maturity levels
• L0 – Unaware: The sustainable performance dimension is not considered at all by decision-
makers. There is no information.
Procurement Warehousing Transport
SHSC
Maturity Level
SO
CIA
L
EC
ON
OM
ICA
L
EN
VIR
ON
ME
NT
AL
L0
L1
L2
L3
L4
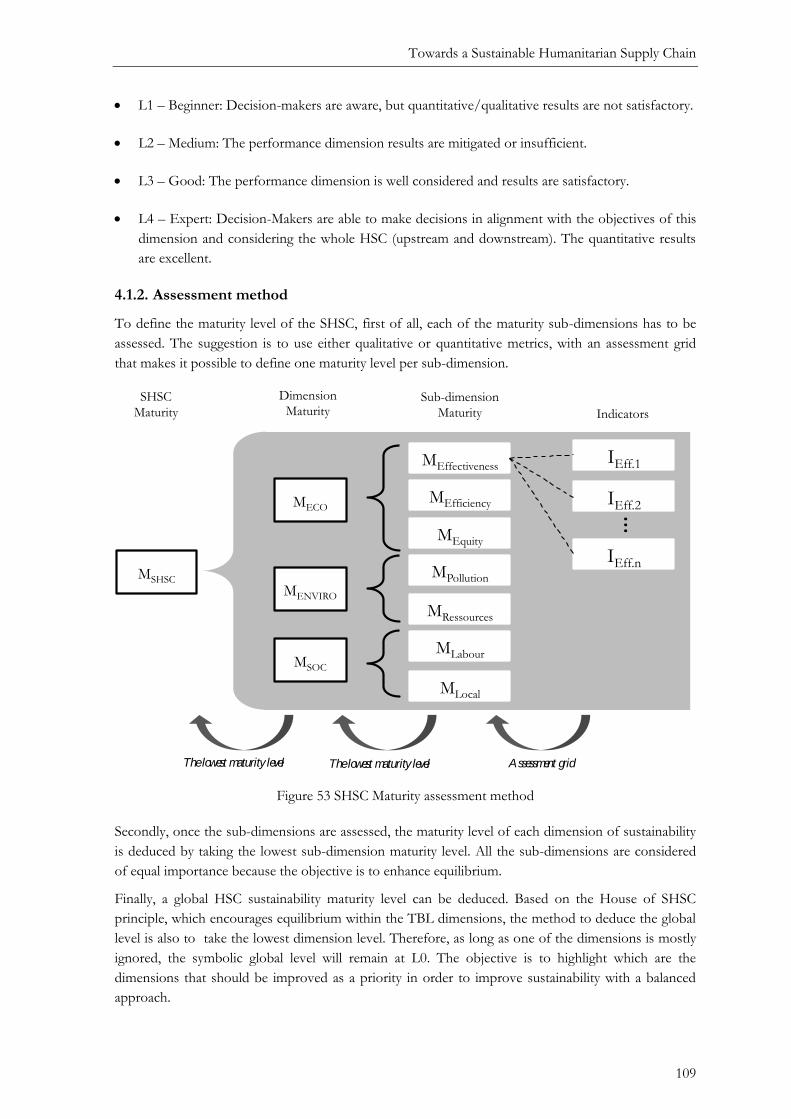
Towards a Sustainable Humanitarian Supply Chain
109
• L1 – Beginner: Decision-makers are aware, but quantitative/qualitative results are not satisfactory.
• L2 – Medium: The performance dimension results are mitigated or insufficient.
• L3 – Good: The performance dimension is well considered and results are satisfactory.
• L4 – Expert: Decision-Makers are able to make decisions in alignment with the objectives of this
dimension and considering the whole HSC (upstream and downstream). The quantitative results
are excellent.
4.1.2. Assessment method
To define the maturity level of the SHSC, first of all, each of the maturity sub-dimensions has to be
assessed. The suggestion is to use either qualitative or quantitative metrics, with an assessment grid
that makes it possible to define one maturity level per sub-dimension.
Figure 53 SHSC Maturity assessment method
Secondly, once the sub-dimensions are assessed, the maturity level of each dimension of sustainability
is deduced by taking the lowest sub-dimension maturity level. All the sub-dimensions are considered
of equal importance because the objective is to enhance equilibrium.
Finally, a global HSC sustainability maturity level can be deduced. Based on the House of SHSC
principle, which encourages equilibrium within the TBL dimensions, the method to deduce the global
level is also to take the lowest dimension level. Therefore, as long as one of the dimensions is mostly
ignored, the symbolic global level will remain at L0. The objective is to highlight which are the
dimensions that should be improved as a priority in order to improve sustainability with a balanced
approach.
SHSC
Maturity
Dimension
Maturity Sub-dimension
Maturity Indicators
MENVIRO
MSOC
MECO
MSHSC
MEffectiveness
MEfficiency
MEquity
MPollution
MRessources
MLabour
MLocal
IEff.1
IEff.2
IEff.n
…
The lowest maturity level The lowest maturity level Assessment grid

Chapter III Sustainable Humanitarian Supply Chain Performance
110
4.2. A proof of concept: Assessing the sustainability of IFRC HSC
To illustrate how to use the SHSC maturity assessment model, we built a use case based on the IFRC
A&C RLU operations. First, a set of the metrics and the assessment grid are defined, and secondly,
the results are given and interpreted.
4.2.1. Assessment metrics & grid
The metrics to assess the sustainability performance can be either quantitative or qualitative. As long
as the objective is to define a performance level for each of the sub-dimensions, we consider a
quantitative measure if possible (a ratio can be defined). Otherwise, we have defined a qualitative
assessment of the criteria, which is based on the practitioner’s appreciation of the dimension (i.e. for
the labor conditions). The metrics are inspired by previous discussion, and are illustrative. Depending
on the HO, the criteria to define each of the sub-dimensions, as well as the measures, may be
different.
Table 10 presents an example of the metrics and Table 11 shows an assessment grid that can be used
for each criterion in the IFRC upstream context.
Table 10 Sustainability performance metrics per dimension
All the economical dimensions are quantifiable. For effectiveness, the ratio between the total needs
over a time period, and the needs covered on time are considered. For efficiency, we consider a HSC
Costs ROI (Return of Investment). A negative ROI result implies that the HSC system loses money,
and a positive gives the margin that is generated. The equilibrium is around 0, considering that the
objective is not to make a profit but to maintain the activity. For equity we propose using the Gini
Index, as suggested by (Tzur 2016). It allows the inequalities within the distribution to be determined,
where 0 indicates that there is no inequality.
TBL Sub-dimension Criteria Typology Measurement
Eco
no
mic
Effectiveness Demand satisfaction quantitative Needs coverage on time total demand
Efficiency HSC Cost ROI quantitative (Net incomes-HSC Cost) Net incomes
Equity Non-discriminatory distribution
quantitative Gini Index (beneficiary
inequality)
En
vir
on
men
tal Pollution
reduction Carbon footprint qualitative Appreciation
Resource conservation
Reduction resource consumption
qualitative Appreciation
So
cial
Local community development
Local procurement quantitative CHF expended locally CHF total expenses
Labor conditions Employee management qualitative Appreciation

Towards a Sustainable Humanitarian Supply Chain
111
The environmental sub-dimensions are both qualitative. The overall objective is to reduce both the
carbon footprint and the consumption of resources. Given that it is not possible to normalize these
absolute values, we define different maturity levels in Table 11. The Carbon Footprint levels are based
on the LCA assessment approach, which seeks to include the whole product lifecycle (from raw
materials to end of life). For resource conservation (reducing consumption) the levels are similar,
considering consumption of resources such as water, energy, packaging, etc. Therefore, expertise is
reached when the Carbon Footprint and LCA sub-dimensions are managed upstream and
downstream. The high level is also reached by using LCA and resource consumption assessments
while planning operations.
Last but not least, for the social sub-dimension, we consider one quantitative and one qualitative
factor. Local community empowerment (local procurement) is measured as the ratio of local
investment over total investment. At the IFRC, it is not expected that 100% of local investments will
be reached in the short term, due to the difficulties in finding some emergency items locally owing to
strict requirements, and also because of the framework agreements the organization has with global
suppliers. Labor conditions (employee management) are assessed through internal and provider audits.
The high level is reached when the labor conditions are considered in the planning phase.

Chapter III Sustainable Humanitarian Supply Chain Performance
112
Table 11 SHSC performance assessment grid
UN
AW
AR
E
BE
GIN
NE
R
ME
DIU
M
GO
OD
E
XC
EL
EN
T
TB
L
Sub-d
imensi
on
L0
L1
L2
L3
L4
Economic
Eff
ect
iven
ess
<
10%
10%
≥ I
ndic
ato
r <
50%
50%≥
Indic
ato
r <
75%
75%
≥ I
ndic
ato
r <
90%
≥ 9
0%
Eff
icie
ncy
<-1
0%
-1
0%
≥ I
ndic
ato
r <
-5%
-5
% ≥
In
dic
ato
r <
0%
0%
≥ I
ndic
ato
r <
5%
≥
5%
Equit
y >
50%
50%
≥ I
ndic
ato
r >
30%
30%
≥ I
ndic
ato
r <
10%
10%
≥ I
ndic
ato
r <
0%
0%
Environmental
Polluti
on r
edu
ctio
n
no
in
fo
Th
e C
arb
on
fo
otp
rin
t is
asse
ssed
occ
asio
nal
ly
Th
e C
arb
on
em
issi
on
s ar
e as
sess
ed
syst
emat
ical
ly
LC
A: T
he
Car
bo
n
emis
sio
ns
are
asse
ssed
in
tern
ally
+ e
xter
nal
ly
(up
stre
am a
nd
do
wn
stre
am)
SC
flo
ws
are
pla
nn
ed
bas
ed o
n L
CA
im
pac
t
Res
ourc
es
conse
rvati
on
no
in
fo
Res
ourc
es u
se is
asse
ssed
occ
asio
nal
ly
A m
anag
emen
t sy
stem
for
po
lluti
on
an
d e
ner
gy
use
is
in p
lace
syst
emat
ical
ly
A g
lob
al m
anag
emen
t
syst
em is
in p
lace
(u
pst
ream
an
d
do
wn
stre
am)
SC
flo
ws
are
pla
nn
ed t
o
reduce
res
ourc
es
con
sum
pti
on
Social
Loca
l com
munit
y dev
elop
ment
0%
0%
≥In
dic
ato
r <
30%
30%
≥In
dic
ato
r <
50%
50%
≥In
dic
ato
r <
70%
≥ 7
0%
Labor
condit
ion
s n
o in
fo
Occ
asio
nal
In
tern
al
asse
ssm
ent
Sys
tem
atic
In
tern
al
asse
ssm
ent
Sup
plie
rs a
sses
smen
t
SC
flo
ws
are
pla
nn
ed
bas
ed o
n lab
or
con
dit
ion
s

Towards a Sustainable Humanitarian Supply Chain
113
4.2.2. Illustrative results
Based on the IFRC A&C field observations and discussion with practitioners, the following illustrative
data set was built, with its related sub-dimensions maturity levels.
Effectiveness
Table 12 Data set to assess effectiveness
Order # Lead time Grand Total (CHF) Value delivered on
time (<1 week)
1 10.00 650
2 8.00 9107
3 7.00 554 554.00
4 28.00 17831
5 22.00 15000
6 36.00 5000
7 5.00 50000 50000.00
8 18.00 50000
9 9.00 58000
10 5.00 5000 5000.00
11 1.00 16000 16000.00
12 11.00 28000
13 15.00 17000
14 5.00 35000 35000.00
15 5.00 136000 136000.00
16 5.00 32000 32000.00
TOTAL 475142 274554
RATE 58%
The effectiveness is computed as the proportion of orders delivered on time. The data from 2015
A&C IFRC operations do not consider an expected delivery time. For the illustration, the hypothesis
is made that an acceptable delivery lead-time is one week (7 days) since orders placed will usually be
urgent (Table 1).
Efficiency
In a standard year, it is obvious that response to crises does not generate enough rotation to cover the
fixed cost of RLUs. Based on the data of the A&C RLU activity between January and September
2015, an amount of nearly 760,000 CHF was charged to customers for a total number of 41 orders.
From this total amount, 56,000 CHF corresponds to a service fee (around 7%), and the rest to the
procurement costs (704,000 CHF). The income value, extrapolated over a year, results in a total
income of around 1,000,000 CHF, and the procurement costs 940,000 CHF (Table 13).
The holding inventory costs correspond to the expenses generated due to the inventory’s existence
(i.e. waste, infrastructure, handling). This value is evaluated at between 20 and 30% of the mean
inventory level value for the industry, depending on the deterioration and obsolescence risks.
Considering that the A&C IFRC infrastructure is of basic standard, and that emergency items are
robust, and only hygiene kits are perishable in the long term, we diminish this value to 10% to make

Chapter III Sustainable Humanitarian Supply Chain Performance
114
the estimation. Appendix A contains the A&C RLU contingency stock value on September 2015.
Considering the hypothesis that this value is close to the mean over the year, the Holding Costs of the
region are around 90,000 CHF over the year (Table 13).
Table 13 Data set to assess efficiency
HSC Costs (year) HSC Incomes
(year)
Procurement costs 940,000 CHF
Holding costs (including handling, waste and
infrastructure)
90,000 CHF
Service Provision Income 1,000,000 CHF
TOTAL 1,030,000 CHF 1,000,000 CHF
RATE -3%
If we compute the effectiveness indicator with this data set, considering that the HSC annual Costs are
around 90,000, and that the net income (without the procurement costs) is around 75,000:
𝐻𝑆𝐶 𝐶𝑜𝑠𝑡 𝑅𝑂𝐼 =(1,000,000 − (1,030,000 + )
1,000,000⁄ = −3%
Without a full data set, it is difficult to establish an exact value for the effectiveness indicator.
However, the A&C RLU has clearly stated the difficulties it has in covering the costs (IFRC 2013,
2014)
Equity
In the assessment grid it is suggested that the equity should be assessed based on the Gini Index. The
value of this index is between 0 and 1, and represents the level of inequality within a studied
population. In this case it is the satisfaction of the customer orders of the HSC. The red line in Figure
54 represents the Lorenz curve (Gastwirth 1972), which plots the proportion of the variable observed
of the population (y axis) that is cumulated by the bottom x%. The Gini index is equal to the A area
divided by the sum of the A and B areas, that is to say: Gini = A / (A + B). The bigger A is, the
higher is the level of inequality.
Figure 54 Gini Index
The IFRC A&C decision-makers ensure that if there is a situation where they have to share the
upstream resources within different demand points, this will be done equitably (although this situation
A
B
Lorenz Curve
Line of
Equ
ality
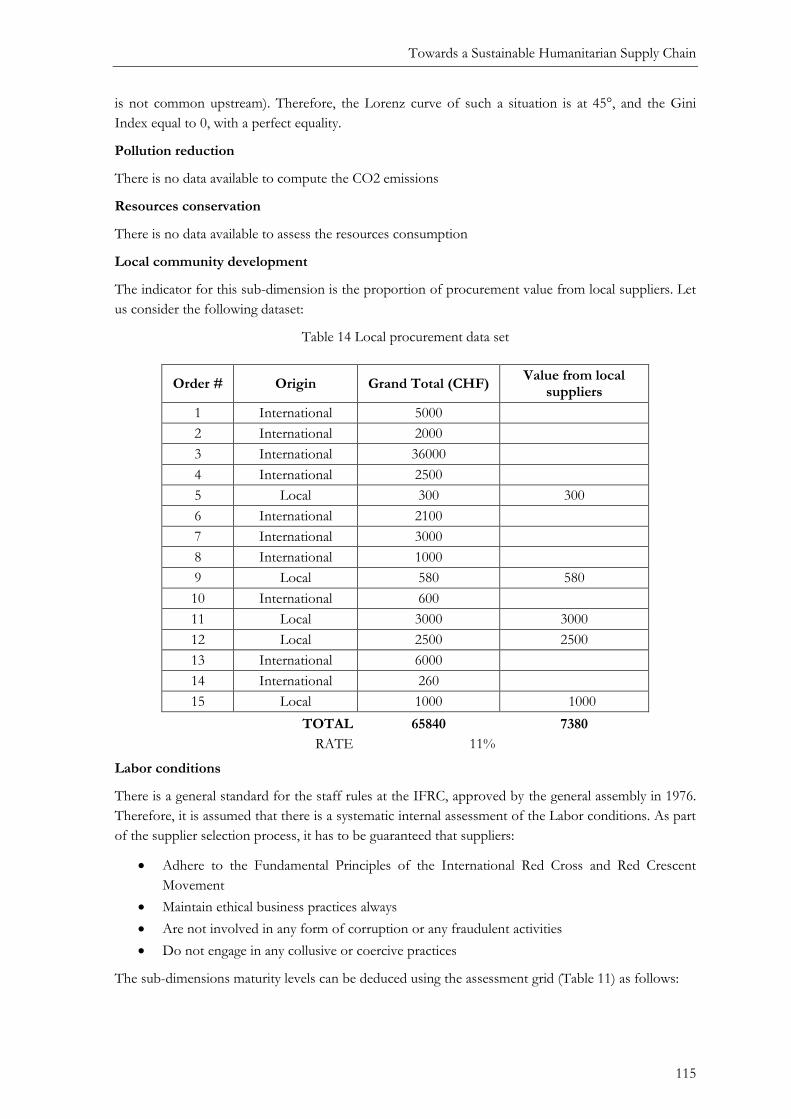
Towards a Sustainable Humanitarian Supply Chain
115
is not common upstream). Therefore, the Lorenz curve of such a situation is at 45°, and the Gini
Index equal to 0, with a perfect equality.
Pollution reduction
There is no data available to compute the CO2 emissions
Resources conservation
There is no data available to assess the resources consumption
Local community development
The indicator for this sub-dimension is the proportion of procurement value from local suppliers. Let
us consider the following dataset:
Table 14 Local procurement data set
Order # Origin Grand Total (CHF) Value from local
suppliers
1 International 5000
2 International 2000
3 International 36000
4 International 2500
5 Local 300 300
6 International 2100
7 International 3000
8 International 1000
9 Local 580 580
10 International 600
11 Local 3000 3000
12 Local 2500 2500
13 International 6000
14 International 260
15 Local 1000 1000
TOTAL 65840 7380
RATE 11%
Labor conditions
There is a general standard for the staff rules at the IFRC, approved by the general assembly in 1976.
Therefore, it is assumed that there is a systematic internal assessment of the Labor conditions. As part
of the supplier selection process, it has to be guaranteed that suppliers:
• Adhere to the Fundamental Principles of the International Red Cross and Red Crescent
Movement
• Maintain ethical business practices always
• Are not involved in any form of corruption or any fraudulent activities
• Do not engage in any collusive or coercive practices
The sub-dimensions maturity levels can be deduced using the assessment grid (Table 11) as follows:

Chapter III Sustainable Humanitarian Supply Chain Performance
116
Table 15 Illustrative assessment of the A&C RLU
TBL Sub-dimension L0 L1 L2 L3 L4 Dimension Maturity
level
Eco
no
mic
Effectiveness x
L2 Efficiency x
Equity x
En
vir
on
men
tal
Pollution reduction x
L0
Resource conservation x
So
cial
Local community development x
L1
Labour conditions x
For the economic dimension, both effectiveness and efficiency performance are well developed, but
still far from optimal. The high immobilization of stocks, and the low turnover of inventory cause the
level of efficiency to be negative. Regarding effectiveness, the response time is still long, in most cases.
Equity is considered as achieved, given that it is considered as a constraint by IFRC decision-makers.
For the environmental dimension, nothing is done to assess and reduce the carbon footprint and
resource consumption.
For the social dimension, local procurement is being developed, but it is still difficult to find suppliers
that satisfy the requirements in most countries. This indicator could be improved with the
development of sub-regional LUs. Regarding the Labor conditions, the IFRC standards are
satisfactory, but no information was found on the assessment of their supplier’s labor conditions.
To increase the readability of the assessment grid, these results can be presented in the form of a radar
graph (Figure 55). Each TBL dimension is then assessed as the lowest one within its sub-dimensions
levels (Table 15). The global maturity level of the A&C RLU is also defined by the lowest dimension
level (L0), as showed in Figure 56.
A simple analysis of the results from the SHSC maturity assessment allows us to identify the sub-
dimensions that have to be prioritized in order to achieve a more balanced sustainability performance.
This result shows that the environmental dimension is completely overlooked by decision-makers at
the A&C RLU. Based on this model approach to improving the overall SHSC performance, the
priority should be to work on both environmental sub-dimensions. The social dimension also remains
in a lower maturity level than the economic dimension, as is predictable, given that the SHSC is still in
its infancy.

Towards a Sustainable Humanitarian Supply Chain
117
Figure 55 A&C RLU SHSC sub-dimensions performance maturity level (radar graph)
Figure 56 A&C RLU SHSC performance maturity level
0
1
2
3
4 Effectiveness
Efficiency
Equity
Pollution reduction Resources conservation
Local community
development
Labor conditions
Procurement Warehousing Transport
SOCIAL ECONOMICAL ENVIRONMENTAL
L0
L1
L2
L3
L4

Chapter III Sustainable Humanitarian Supply Chain Performance
118
5. Discussion
The overall aim of this thesis is to set the basis for a Humanitarian Decision-support System in
sustainable operations planning. The literature review and previous research show the challenge for
HOs to consider sustainability in their decision-making processes. The objectives of this chapter are
twofold: (1) clarifying the concept of SHSC, (2) building a framework for assessing the performance
of SHSC operations.
First, a performance measurement framework that translates sustainability concepts into concrete
HSC operations (procurement, warehousing, transport) is defined. Based on the TBL approach,
environmental and social dimensions are added to the economic dimension. The House of SHSC
operations is a general framework that stresses the need to consider the three TBL dimensions to
enhance sustainable operations. The criteria have been defined considering the literature review on
sustainable SC and the impact that HSC processes (procurement, warehousing and transport) have on
the different sub-dimensions. Secondly, a model and method to assess SHSC performance maturity is
suggested. To illustrate the use of the maturity assessment model, a proof of concept has been built
based on the IFRC HSC use case.
This chapter contributes significantly to the fledgling discussion of HSC sustainability. It bridges the
gap between high-level sustainability theoretical discussions and the concrete assessment of HSC
operations sustainability, which still seems to be difficult in many disciplines.
The contributions have been developed thanks to inputs from IFRC field research. The practical
application to various humanitarian relief operations is yet to be achieved.
The SHSC performance framework presented in this chapter forms the basis for developing a
Decision-support System that makes it possible to optimize the planning of HSC operations with
regard to TBL impacts. However, as sustainability is a multi-dimensional concept, with conflicting
objectives, the challenge now is to address these trade-offs and synergies across the economic,
environmental and social dimensions. Therefore, the next chapter discusses this set of problem, and
develops a Decision-support System, which integrates the HSC sustainable operations framework.

119
Chapter IV. PLANNING SUSTAINABLE HSC OPERATIONS
This chapter has been published as:
Laguna-Salvadó, L., Lauras, M., Okongwu, U., & Comes, T. (2018). A multicriteria Master
Planning DSS for a sustainable humanitarian supply chain. Annals of Operations Research, 1-
41.
1. Introduction
Enhancing sustainable operations is a challenge in terms of decision-making. As discussed in the
previous chapter, many conflicting dimensions have to be considered with a holistic view of the HSC
system. Therefore, the decision process should take into account the complexity of sustainability
objectives and trade-offs.
Along an HSC many different individual decisions are made and coordinated. In an HSC network
such as the IFRC, but also the WHO or even MSF, decisions are centralized (e.g.. relief items
standardization), or decentralized (e.g. regionally adapted operations design). Moreover, decisions are
of different importance, from the rather simple question of scheduling shipments, to the challenging
decision of whether to open or close a warehouse. To enhance a sustainable HSC, the impact of any
decision has to be assessed in terms of sustainable performance.
Given that HOs have a project management approach where the response to each disaster constitutes
a project, humanitarian efforts have for a long time been focused more on the execution steps (with
very reactive behavior) and much less on the planning steps. As a result, the lack of preparedness and
planning – developing strategies and coordinating HSC operations – has led to inefficiencies and
misallocation of resources (Jahre 2008). Today, anticipating the performance outcomes of HSCs has
become very necessary and important, for three major reasons.
There is a need for decision-makers to evaluate the impact of their decisions with respect to
sustainable performance objectives. In the humanitarian sector, this practice would enhance not only
the improvement of HSC processes both a priori and a posteriori, but also the anticipation of the
impact of future actions on performance. We note that in this sector the inclusion of the concept of
sustainability in the management process is quite recent, and decision-makers do not have concrete
indicators and tools for measuring sustainability performance. Moreover, the lack of structured
planning processes in HSCs (Haavisto and Kovács 2014), which are typically supported by decision-
support systems, hinders the management a priori of the impact of both strategic and operational
decisions. Thus, developing a decision-support systems adapted to the HSC not only may help to
improve the performance of planning processes (Abidi et al. 2014), but also will enable decision-
makers to take into consideration sustainability performance objectives. Structured planning processes
are necessary to align decisions with the expected performance objectives.

Chapter IV Planning sustainable HSC operations
120
Decision-support systems for planning are not commonly used for managing HSCs. Previous
researchers have highlighted that misalignment with field specificities and lack of trust are the main
reasons for the difficulties of transferring information technology from the commercial sector to
humanitarian settings (Abidi et al. 2014). Using a functional model specifically created for HSCs may
facilitate the development of appropriate IT systems (Blecken 2010).
The trends are clear: scholars and practitioners are asking for more solutions that support decision-
making, but also emphasize the importance of including humanitarian context constraints. The
challenge remains to find a planning method that considers the problem of sustainable performance
multi-criteria decision-making.
Therefore, this chapter aims to address the following research question: How to support Decision-Makers
in consciously and systematically making sustainability trade-offs and exploring their consequences?

Towards a Sustainable Humanitarian Supply Chain
121
2. Humanitarian Supply Chain Planning
Improving the planning process of HSC operations is necessary to align decisions with the expected
sustainable performance throughout the process. In commercial SCs, decision-support systems have
been developed to supports the different planning decisions and time horizons (Figure 57).
Figure 57 Commercial SC planning matrix (Adapted from Stadtler, 2005)
Advanced Planning Systems (APS), for example, have shown an impressive potential for integrating
organizational units and planning efforts along an SC (Forme et al. 2009). Unlike traditional Enterprise
Resource Planning (ERP), APS systems try to find feasible, (near) optimal plans across the SC
(Stadtler 2005). APSs are modular, and cover the different tasks and decision levels from the SC
planning matrix.
2.1. Humanitarian Supply Chain Planning Matrix
Although planning decision-support systems are widely used in commercial SC, they are not common
in the HSC. The decomposition of the HSC on tasks and time horizons has been discussed in the
literature, and (Blecken 2010) suggested an HSC standard referent model including processes and
decision levels, which has already been discussed and used in previous chapters (Figure 58). The
standard referent decision levels suggested for HSC are the same as those in commercial SCs: strategic,
tactical and operational, also referred to as long, mid and short-term horizon levels (Stadtler 2005).
However, in practice, HSC tactical and operational planning is mainly based on the experience of
decision-makers. Nonetheless, as in the commercial SC, HSC decision-makers may also benefit from
the decision-support systems in the low decision levels, notably because of information granularity and
the decision perimeter.
2.1.1. HSC Strategic planning
Decisions at this level should create the prerequisites for the development of the HSC in the future.
They typically concern the design and structure of an SC and, at the HSC upstream have long-term
effects, noticeable over several years. The HSC downstream design, however, is typically planned ad-
hoc, when a crisis occurs (Baharmand and Comes 2015).
Decision-support systems at the strategic level have been explored both for the upstream HSC design
and for the downstream (Balcik and Beamon 2008; Charles 2010; Vargas Florez et al. 2015).
Strategic
Tac cal
Opera onal ERP
APS

Chapter IV Planning sustainable HSC operations
122
This decision level is a lever to enhance economic sustainability, as it involves the design of the HSC
network, and therefore allows the improvement of the network performance in terms of efficiency,
effectiveness or agility ( Charles 2010; Dubey and Gunasekaran 2016; Jahre 2008; Laguna Salvadó et
al. 2016).
2.1.2. HSC Tactical planning
Within the scope of the strategic decisions, tactical planning, or mid-term planning, aims to define the
forecast demand and to find the most suitable way of fulfilling it through an effective management of
the assessment, procurement, warehousing and transport processes across an organization’s supply
network and over a medium-term planning horizon. This planning horizon allows for the
consideration of seasonal developments, e.g. of demand.
This decision level has been overlooked both in practice and in the literature in the HSC domain (both
Master Planning and Demand Planning), probably because of the segmented nature of the
management of disaster responses within HOs. HSCs already have a limited ability to anticipate
demand, due to the uncertainty of the occurrence of a humanitarian crisis. Moreover, HSC managers
conceive each disaster response as a single SC solution instead of building a tactical planning system
that aggregates the HO’s network, in parallel with other on-going operations.
Master Planning allows a link to be made between the strategic decisions and the operational process,
and to coordinate the different processes of procurement, warehousing and transport to ensure the
fulfillment of needs (Demand Planning). Therefore, this decision level is a lever to improve SHSC
performance, as it globally defines the operations that will take place according to the assessed
demand. It enables the optimization of HSC flows, and therefore, of operational performance.
2.1.3. HSC Operational planning
The lowest planning level has to specify all activities as detailed instructions for immediate execution
and control. Therefore, short-term planning models require the highest degree of detail and accuracy
to define procurement, warehousing and transport tasks. Short-term planning is restricted by the
decisions on structure and quantitative scope from the upper levels.
Field research at the A&C RLU shows that in the upstream HSC, the operational capacity exceeds the
workload; so there is no urgency to optimize resource allocation for the operational level tasks.
In the HSC literature, operational level research works focus on transport planning, especially the
downstream HSC with the last mile distribution problems (Balcik et al. 2008; Van Wassenhove and
Pedraza Martinez 2012).
2.1.4. Conclusion
Field research at the A&C RLU (upstream) highlights the “case by case” management of the
humanitarian crisis, which was identified as a main weakness to improve the overall performance of
the regional operations. There is a need to improve coordination within the different warehouses, the
procurement process and the distribution flows. Therefore, considering the SHSC Master Planning
problem seems relevant for both practitioners and academics.
Figure 58 illustrates the positioning of this Chapter contribution within Blecken’s HSC reference
Model (Blecken 2010).
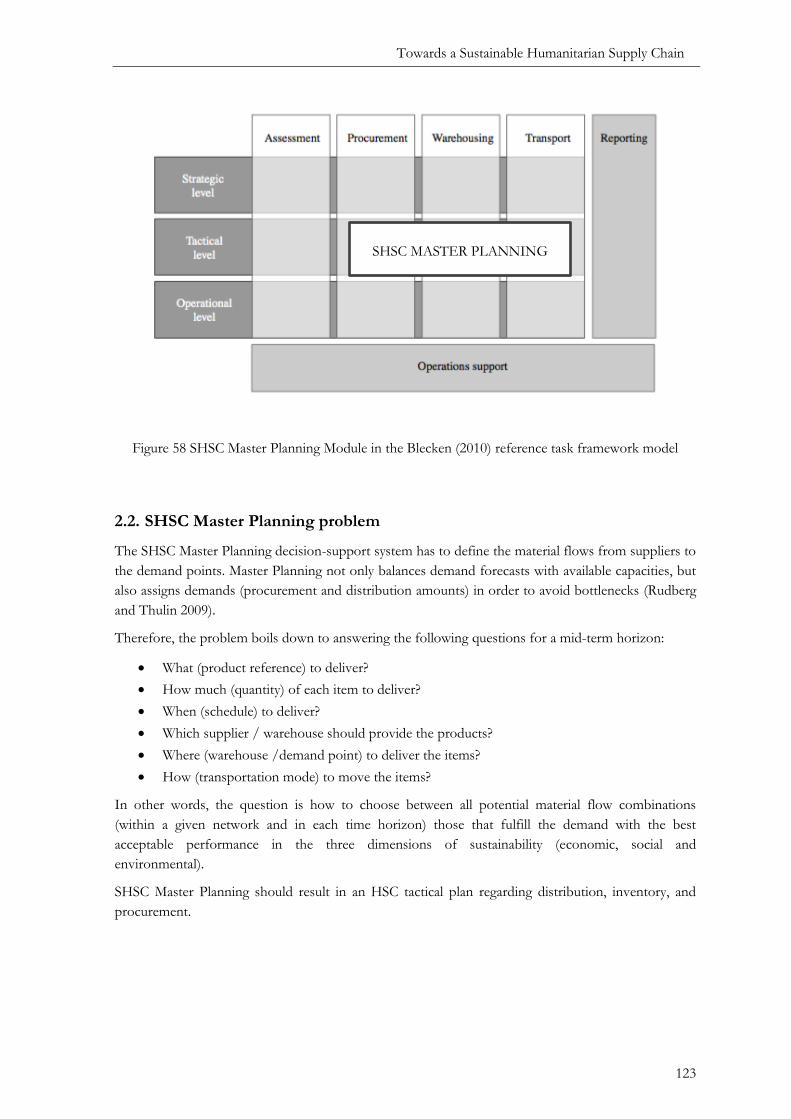
Towards a Sustainable Humanitarian Supply Chain
123
Figure 58 SHSC Master Planning Module in the Blecken (2010) reference task framework model
2.2. SHSC Master Planning problem
The SHSC Master Planning decision-support system has to define the material flows from suppliers to
the demand points. Master Planning not only balances demand forecasts with available capacities, but
also assigns demands (procurement and distribution amounts) in order to avoid bottlenecks (Rudberg
and Thulin 2009).
Therefore, the problem boils down to answering the following questions for a mid-term horizon:
• What (product reference) to deliver?
• How much (quantity) of each item to deliver?
• When (schedule) to deliver?
• Which supplier / warehouse should provide the products?
• Where (warehouse /demand point) to deliver the items?
• How (transportation mode) to move the items?
In other words, the question is how to choose between all potential material flow combinations
(within a given network and in each time horizon) those that fulfill the demand with the best
acceptable performance in the three dimensions of sustainability (economic, social and
environmental).
SHSC Master Planning should result in an HSC tactical plan regarding distribution, inventory, and
procurement.
SHSC MASTER PLANNING

Chapter IV Planning sustainable HSC operations
124
2.3. Master Planning Approaches
In the commercial SC, before OR tools like optimization and simulation entered the “enterprise-
planning arena”, Master Planning was often done by MRP II systems1, or by simple calculations using
spreadsheets without considering capacity limitations (Rudberg & Thulin, 2009).
OR-related decision-support systems that conduct Master Planning use mathematical programming to
maximize performance objectives while taking constraints (e.g. capacity) into consideration as an
integrated part of the planning process.
To be able to optimize the Master Planning problem, procurement, inventory and distribution must be
monitored. Inputs are forecast demand data and network constraints in terms of a model that defines
capacity and dependencies between different processes.
The three major difficulties in using optimization methods and approaches to define a plan are,
according to Fleischmann et al. (Stadtler and Kilger 2005):
• There are often several criteria, which imply conflicting objectives and ambiguous preferences
between alternatives. This is the main concern when introducing the sustainable performance
that typically considers at least the three TBL conflicting dimensions.
• A huge number of alternatives are a predominant feature in SC planning. In the case of
continuous decision variables, e.g. order sizes, the set of alternatives is actually infinite.
• Uncertainty. The forecast demand may be fuzzy. Moreover, nearly always, reality deviates
from the plan, especially in the context of HSC. The uncertainty in the data is addressed using
fuzzy logic approaches, which model the vagueness and imprecision by adding a probabilistic
dimension to the values. Exact methods can also be used. The deviation has to be controlled
and the plan needs to be revised if the discrepancy is too large. Planning on a rolling horizon
basis is an implementation of this plan-control-revision interaction. The planning horizon
(e.g. three months) is divided into periods (e.g. weeks). This procedure is a common way of
coping with uncertainty in operational planning, both in classical planning systems and in OR
approaches.
OR Master Planning approaches are an attempt to “computerize” planning. Therefore, decision-
makers have to be aware that modeling is a relaxation of reality, and remains only a decision- support
system. Human knowledge will still be essential to bridge the gap between model and reality.
Otherwise, OR solutions will hardly ever be adopted, especially in the context of humanitarian
operations.
Nonetheless, OR methods have a “tremendous potential” in the disaster response domain, according
to (Altay and Green 2005; Galindo and Batta 2013). Since 2005, there has been a noticeable increase in
the publications that address HSC decision-support system problems with OR methods (Charles and
Lauras 2011). OR is a well-established discipline regarding allocation of scarce resources, because it
offers the tools to support HSC operational decision-making (Van Wassenhove and Pedraza Martinez
2012). By adapting OR best practices that have proven their value in commercial SCs, relevant
1 MRP II is a successive planning concept that begins with a not necessarily feasible schedule derived from end product demand. The bill of material is used together with inventory records, lot-sizing rules, and expected lead times to calculate the time-phased material requirements. Capacity limits are not explicitly taken into account, therefore, the planned process may be infeasibleunfeasible (Drexl and Kimms 2013).

Towards a Sustainable Humanitarian Supply Chain
125
solutions can be proposed to the complex problems faced by HOs (Charles and Lauras 2011).
2.4. A Multi-Objective Decision Problem
Due to the multi-objective nature of sustainability performance measurement, decision-makers must
deal with the conflicting objectives between the economic, social and environmental dimensions of
sustainability. Many OR modeling approaches can be found in the literature to solve multi-objective
decision problems (Branke 2008; Deb et al. 2016).
As multiple Pareto optimal solutions usually exist, the most preferred results (or acceptable solution)
can be found by using different philosophies. In no-preference methods, no decision-maker is
expected to be available, but a neutral compromise solution is identified without preference
information. The other classes are so-called a priori, a posteriori and interactive methods and they all
involve preference information from the decision-maker in different ways. In an a posteriori method,
multiple solutions are generated for decision-makers to choose from. A priori methods require that
sufficient preference information is expressed before the solution process.
In the specific case of Master Planning problem, the objective is to support the decision-maker in the
planning, by giving a single acceptable solution, so the a-posteriori methods are not considered.
Regarding the a-priori methods, it appears difficult to put a weight on the sustainable performance
objectives. However, discussion with experts allows the hypothesis that the decision-maker can order
the sustainable performance dimensions by relative importance. Well-known examples of a priori
methods include the utility function method, the lexicographic method, and goal programming.
In the utility function method, the decision-maker assigns weights to prioritize objective functions. As
Gralla discusses, these weights are based on assumptions about the relative importance of each
objective (Gralla et al. 2014). We note that in theory, and based on previous chapter conclusions, all
three dimensions need to be equally considered, but in practice they have different relative importance
in any given real-life planning situation.
Goal programming can be thought of as an extension or generalization of linear programming to
handle multiple, normally conflicting objective measures. Each of these measures is given a goal or
target value to be achieved. Unwanted deviations from this set of target values are then minimized in
an achievement function.
In the Lexicographic Optimization Method (LOM), the decision-maker ranks the objective functions
according to some subjective degree of priority, and then a multi-stage optimization algorithm enables
a solution to be found (Branke 2008; Rentmeesters et al. 1996; Sherali 1982). Considering that the
decision-maker has an active role, and can prioritize the objectives “a priori”, the balance between
SHSC performance objectives can be addressed following an interactive variant of the LOM. As long
as the decision-maker has only to classify the objectives by priority, this approach avoids the need to
specifying an abstract weight between objectives that are not homogeneous (cost vs. CO2 emissions
vs. social costs…).
However, with the LO described previously, it is very likely that the process stops before less
important objective functions are taken into consideration. Combining different methods could help
to improve the preferred plan. In the literature, there is an extension of the LOM (Rastegar and
Khorram 2014; Wray et al. 2015), which introduces a slack component. With the slack or constraint
relaxation, the Interactive LOM (ILOM) increases the range of possible feasible solutions at each
stage. The decision-maker can interact with the algorithm by defining a small deviation from the
optimal value of a primary variable so as to improve the secondary value functions. Interactive

Chapter IV Planning sustainable HSC operations
126
methods are interesting because they allow the readjustment of the a priori inputs or the introduction
of additional information depending on the behavior of the model. Thus, the decision-maker can
orient the solution process toward preferred solutions.
2.5. Conclusion
Until now, the main objectives of HSC managers have been to improve competitiveness by simply
having an effective management of the supply flows while minimizing costs. With the continuous
development of the sustainability paradigm, social and environmental performance indicators need to
be added to the performance measurement dashboard of HSCs. But, the lack of structured planning
processes, concrete sustainability measurement tools, and decision-support systems jeopardizes the
enhancement of sustainable operations. Tactical planning has been overlooked, but it has a huge
potential because it is at the crossroads between decision levels and HSC process.
In Chapter 3, we developed a conceptual performance framework to assess the maturity of SHSC
operations based on the TBL model. This framework is, however, generic and does not consider the
various decision levels (strategic, tactical and operational). Consequently, it does not by itself allow a
concrete quantification for the Master Planning processes.
Although tactical decision-making shows a potential to improve SHSC performance, the literature has
overlooked Master Planning problems in the HSC. This chapter aims to contribute to filling this gap
by setting the basis for a Master Planning decision-support system, following an OR approach.
The remainder of the chapter is organized as follows. Sections 2, 3 and 4 present the SHSC Master
Planning contributions: selection of Master Planning sustainable performance criteria; an ILOM
proposal, and the adaptation of the network flow model for SHSC Master Planning. Section 5
presents a proof of concept, with a numerical application based on the A&C IFRC upstream use case,
to demonstrate the relevance of the proposed decision-support system. Finally, conclusions and
perspectives are presented in section 6.

Towards a Sustainable Humanitarian Supply Chain
127
3. SHSC Master Planning Objectives
To solve the sustainable Master Planning problem, the impact of material flows on sustainable
performance needs to be measured. Therefore, based on the sub-dimensions identified in Chapter 3,
we suggest considering only the sustainable performance criteria that can be quantified. To select the
indicators, three main parameters have been assessed:
(i) The decisions taken in the Master planning process (flow selection) have an impact on the
sub-dimension criteria
(ii) The sub-dimension criteria have to be quantifiable, so it is important to have access to the
related data
(iii) There is at least one indicator per TBL dimension.
Based on these constraints, each of the sub-dimensions is evaluated (Table 16). The sub-dimensions
selected are effectiveness, efficiency, local empowerment and pollution reduction.
Table 16 SHSC Sub-dimension selection
TBL Sub-dimension Criteria (i) Master planning
impact (ii) Data accessibility
Eco
no
mic
Effectiveness Demand satisfaction
Yes Yes
(Outcome of the Master Plan)
Efficiency HSC Cost Yes, on variable costs Yes
Equity Non-discriminatory distribution
Yes Yes
(Outcome of the Master Plan)
En
vir
on
men
tal
Pollution reduction
Carbon footprint
Yes* Yes, based on transport
flows
Resource conservation
Reduction in resource consumption
N/A Difficult to quantify, need for an LCA per
flow
So
cial
Local community development
Local procurement
Yes Yes
(Outcome of the Master Plan)
Labour conditions
Employee management
Yes Difficult to quantify,
need or an audit per flow
Considering the equity sub-dimension, when asked, the IFRC upstream managers state that in the face
of a dilemma resulting from the shortage of resources (even though this is not typically happening at
the upstream level), the distribution of items may be shared equally between the demand points that
need them most urgently. Therefore, in the Master Planning problem, equity is considered as a
constraint, and not as an objective function.
3.1. The set of SHSC Master Planning objectives
Four sustainable performance objectives have been retained to define the SHSC: effectiveness,
efficiency, local empowerment and pollution reduction. Although all four of them have to be

Chapter IV Planning sustainable HSC operations
128
considered, effectiveness is an essential criterion to maintain HSC activities and the value chain.
Humanitarian guidelines, principles, and measures of success emphasize meeting the needs of
beneficiaries as the first priority (Gralla et al. 2014).
Hence, effectiveness it is an order qualifier objective, and has a larger relative importance than the
other three objectives, so it is translated in the ILOM approach as the 1st lexicographic objective
(presented in the next section). The other three objectives have a conditional lexicographic order
depending on situational state variables (that is, the strategic priorities, the funding/needs gap, etc.).
With the aim of simplifying the understanding of the SHSC Master Planning ILOM algorithm and the
mathematical model, effectiveness is defined separately from the conditional lexicographic TBL
dimensions. Therefore, in this Chapter, it is considered hereafter as a prerequisite in the SHSC.
Table 1 summarizes the set of objectives retained to measure the sustainable performance of SHSC
Master Planning.
Table 17 Sustainability performance measures and indicators
Sub-dimensions Criteria
Order qualifier Effectiveness Demand satisfaction
TB
L d
imen
sio
ns
(ord
er w
inn
er) Economy Efficiency Variable operations cost
Social Local empowerment Local sourcing rate
Environmental Pollution reduction Carbon Footprint

Towards a Sustainable Humanitarian Supply Chain
129
4. Interactive Lexicographic Optimization Method Algorithm
To plan the HSC processes from a sustainability perspective, the four indicators that were retained in
previous section have to be considered in a multi-objective optimization model. As discussed
previously, it is unlikely that a single solution will be found that simultaneously satisfies each optimal
objective.
To choose the method, the decision-makers needs and capabilities have been considered. It is
important to integrate decision-makers into the definition of an objective trade-off. However, given
the difficulties in comparing the values of the objectives (i.e. carbon footprint vs. cost of operations)
we made the hypothesis that decision-makers can give a priority order to the objectives.
If the decision-maker has an active role and can prioritize the objectives “a priori”, the problem can be
solved using the interactive variant of the ILOM. Effectiveness is an essential objective (order
qualifier). The other three objectives (efficiency, local empowerment and pollution reduction) may be
prioritized depending on v contextual variables: the decision level, HSC network perimeters (single or
inter-organizational; upstream or downstream) or situation (disaster response, replenishment).
The proposed algorithm is illustrated by a flow chart in Figure 59. The pool on the left represents the
decision-maker’s tasks, while the pool on the right represents the decision-support system activities.
The algorithm solves the SHSC Master Planning problem considering the four sustainable
performance indicators. The execution starts when the decision-maker wants to define a Master Plan
for HSC operations. But before then, (s)he has to define the HSC network model to identify potential
suppliers, warehouses, forecast needs, potential transportation flows.
The algorithm is as follows (Figure 59):
(a) The first task of the decision-maker is to rank the sustainability performance objectives (economic,
social and environmental) according to their relative importance or LO. This input gives the
optimization order to the decision-support system (LO1, LO2, LO3). LO0 is the effectiveness, which is
not prioritized but is rather considered as a prerequisite.
(b) For the decision-support system, the first activity is to solve the optimization problem with the
effectiveness objective function (OF). The output of this activity (solving Sub-Model 0) is the
effectiveness optimal value (O0) that the model can attain with the network and forecast demand.
• Sub-model 0
Optimize: Effectiveness OF
Subject to: HSC network model
(c) The loop (n from 1 to 3) starts with one iteration per criterion. Following the LO approach, the
Sub-model ‘n’ is constrained by the previous (n-1) optimal value found, but with a tolerance defined
by the decision-maker. To define this tolerance, the decision-support system computes On with a
variation on the On-1 tolerance value. For the first iteration, LOn-1 is the effectiveness, so the decision-
support system optimizes the LO1 Objective Function (either economic, social or environmental) with
a variation on the effectiveness constraint tolerance.
• Sub-model 1
From t = 0 to t=T;
Optimize: LO1 Objective Function

Chapter IV Planning sustainable HSC operations
130
Subject to: HSC network model + Effectiveness Constraint(t)
(d) The result is displayed to the decision-maker, who decides which is the most “acceptable” trade-
off: deteriorating the Effectiveness optimal value or improving the O1 optimal value. The decision-
maker fixes the pair: O1 optimal value and tolerance level t0.
(e) These values serve as input for the decision-support system.
The second loop (n=2) will repeat the process with LO1 and LO2, in order to define O2 optimal value
and tolerance level t1, while the third loop (n=3) repeats the process with LO2 and LO3 in order to
define O3 optimal value and tolerance level t2,
• Sub-model 2
From t = 0 to t=T;
Optimize: LO2 Objective Function
Subject to: HSC network model + Effectiveness Constraint (t0) + LO1 Constraint (t)
• Sub-model 3
From t = 0 to t=T;
Optimize: LO3 Objective Function
Subject to: HSC network model + Effectiveness Constraint (t0) + LO1 Constraint (t1)
+ LO2 Constraint (t)
(f) At the end of the third loop, the output is the most acceptable Master plan, based on the LO
optimization and the decision-maker’s expertise.

Towards a Sustainable Humanitarian Supply Chain
131
Figure 59 ILOM algorithm for SHSC Master Planning

Chapter IV Planning sustainable HSC operations
132
5. SHSC Master Planning Model
The SHSC Master Planning model is a variant of the network-flow problem (Bradley et al. 1977). The
common problem in the industrial sector relates to the distribution of a product from plants (origins)
to consumers (destinations), with the objective being to minimize costs. In the case of an SHSC, the
main differences that we address are due to the following reasons:
• The network provides more than one product,
• The optimization objectives are multiple, since sustainability is multidimensional
• The problem is solved considering several time periods (time horizon).
5.1. The supply network and assumptions
The supply network is composed of three elements: supplier, warehouse and customer. The model is
sufficiently abstract to represent a large variety of HSC designs and perimeters. Supplier refers to the
source of relief products. Depending on the perimeter, suppliers can be private sector providers or
other HOs that are specialized in the distribution of relief products. Warehouse refers to the
intermediate locations where relief products are stored, but can also represent permanent locations
with contingency stocks or warehouses deployed when a disaster occurs. Customer refers to the
demand points of relief products, but can also be a field entry point (hub or warehouse), a distribution
point or a third-party organization warehouse. The sources, destinations, and intermediate points are
the nodes of the network, while the transportation links connecting the nodes (or flows) are the arcs
(see Fig. 5). As in the standard problem, the suppliers’ capacity, as well as the total number of
products required by the customers, are assumed to be known. The products can be sent directly from
source to destination, or may be routed or sourced through intermediate points (warehouses).
Figure 60 SHSC Master Planning problem network elements
The Master Planning is calculated for a number of periods on a pre-defined time horizon. Whereas in
the industrial sector the tactical level typically considers 6 to 12 months, in the HSC this period may be
shorter due to uncertainties, and depending on the HSC perimeters considered. The last-mile
distribution activity may be characterized by a shorter time horizon and granularity than the upstream
HSC (permanent network of prepositioned stocks).
supplier
warehouse
customer
flow

Towards a Sustainable Humanitarian Supply Chain
133
The following assumptions are developed based on both the field research presented in the
methodology section and information gathered from the literature. All the network elements are
supposed to be known a priori by the decision-maker.
5.2. Mathematical Model sets and parameters
This section describes all components of the flow network model: the indices and the objects built of
parameters and variables.
5.2.1. Model indices
Symbol Description
Indices
t t € [1.. nbT] time periods
f Flow record index
s Product-supplier record index defined by (sid, sprod)
w Product-warehouse record index defined by (wid, wprod)
c Product-customer (demand point) record index defined by (cid, cprod)
5.2.2. HSC Network model objects
5.2.2.1. Distribution Flow object
The distribution flow object gathers the data related to the physical connections between the network
nodes. Each record is a physical connection between nodes, unique for each product.
Symbol Description
Input parameters
Fori(f) Origin
fdes(f) Destination
fpro(f) Product reference
ftlt(f) Lead time (or flow ∆t)
fitc(f) Product acquisition cost
fcost(f) Cost (acquisition and transport) per unit
fenv(f) CO2 emission par unit

Chapter IV Planning sustainable HSC operations
134
fsoc(f) Defines nearness: 1 if local, 0 any other
fope(t,f) The flow is operational (1) or not (0) at time t
fexp(t,f) Expected products reception, defined before t0
Variables
Fin(t,f) Quantity of products received at fdes at period t
Fout(t,f) Quantity of products shipped from fori at period t
5.2.2.2. Customer-product (demand point) object
Each record relates to one product and demand point throughout the time horizon.
Symbol Description
Input parameters
cid(c) Customer identification
cpro(c) Product reference
cunc(c) Product standard cost
cqua(t,c) Units of products needed at time t
ctqua(c) Estimated value of the total amount of products needed by customer during the time
horizon
cpri(t,c) Priority of the needs/penalty par unit
Variables
Cin(t,c) Units of products received by the client at time t
Csto(t,c) Units of stock-out products at period t
Cove(t,c) Units of over-stock products at period t
Ctpen(c) Total stock-out penalty value over the time horizon

Towards a Sustainable Humanitarian Supply Chain
135
5.2.2.3. Supplier-product object
Each record relates to one product and sourcing point throughout the time horizon.
Symbol Description
Input parameters
Sid(s) Supplier identification
Spro(s) Product reference
ssca(t,s) Supplier shipment capacity for product p at period t
Variables
Sout(t,s) Products shipped at period t
5.2.2.4. Warehouse-product object
Each record relates to one product inventory and location throughout the time horizon.
Symbol Description
Input parameters
wid(w) Warehouse identification
wpro(w) Product reference
wini (w) Inventory level at period t0
wreq(w) Expected Contingency stock level (constant in the time horizon)
wtreq(w) Expected Contingency stock value
wunc(c) Product standard cost
Variables
Winv(t,w) Warehouse inventory level at period t
Wsto(t,w) Warehouse contingency stock-out
Wove(t,w) Warehouse contingency over-stock
Wtavg(w) Warehouse average inventory level
Wtpen(w) Warehouse total penalty over the time horizon

Chapter IV Planning sustainable HSC operations
136
5.2.3. Other Parameters
Each record relates to one constraint regarding the TBL objectives.
Symbol Description
Input parameters
effopt Optimal effectiveness constraint
eff_tol Effectiveness constraint tolerance
envopt Optimal Pollution reduction constraint
env_tol Pollution reduction constraint tolerance
socopt Optimal local empowerment constraint
soc_tol Local empowerment constraint tolerance
ecoopt Optimal efficiency constraint
eco_tol Efficiency constraint tolerance
5.2.4. Objective functions
In this section, we will first present four sub-models before presenting the general model and the
constraints of the algorithm. Each sub-model (objective function) represents one of the performance
objectives. The order of the general constraints depends on the optimization sequencing.
5.2.4.1. Objective function for effectiveness
The objective function for effectiveness aims to find a feasible distribution planning that maximizes
the satisfaction of demand on time. It is computed as the maximum value that can be achieved if
everything is on time, minus the penalty for delays. The maximum value refers to the value of the total
demand for a given period multiplied by its priority factor plus the contingency stock value of one
period. The customer’s penalty is proportional to the total stock-out quantity par period, the priority
of demand, and the product’s standard value divided by the number of periods. The warehouse’s
penalty is proportional to the total warehouse stock-out quantity in the time horizon divided by the
number of periods.
𝑀𝑎𝑥 ∑ 𝑐𝑡𝑞𝑢𝑎(𝑐) − ∑ 𝐶𝑡𝑝𝑒𝑛(𝑐)/𝑛𝑏𝑇𝑐 +𝑐 ∑ 𝑤𝑡𝑟𝑒𝑞(𝑤) −𝑤 ∑ 𝑊𝑡𝑝𝑒𝑛(𝑤)/𝑛𝑏𝑇𝑤 (1a)
where:
𝑐𝑡𝑞𝑢𝑎(𝑐) = ∑ 𝑐𝑞𝑢𝑎(𝑐, 𝑡) × 𝑐𝑝𝑟𝑖(𝑐)𝑡 × 𝑐𝑢𝑛𝑐(𝑐) (1b)
𝐶𝑡𝑝𝑒𝑛(𝑐) = ∑ 𝐶𝑠𝑡𝑜(𝑐, 𝑡) × 𝑐𝑝𝑟𝑖(𝑐) × 𝑐𝑢𝑛𝑐(𝑐)𝑡 (1c)
𝑤𝑡𝑟𝑒𝑞(𝑤) = 𝑤𝑟𝑒𝑞(𝑤) × 𝑤𝑢𝑛𝑐(𝑤) (1d)

Towards a Sustainable Humanitarian Supply Chain
137
𝑊𝑡𝑝𝑒𝑛(𝑤) = ∑ 𝑊𝑠𝑡𝑜(𝑤, 𝑡)𝑡 × 𝑤𝑢𝑛𝑐(𝑤) (1e)
5.2.4.2. Objective Function for efficiency (economic dimension)
The objective function for efficiency aims to minimize the costs of purchasing and distribution while
satisfying the needs. In our model, the fixed cost of purchasing is not taken into consideration since
the cost function is proportional to the product flow (quantity delivered).
Min ∑ ∑ 𝐹𝑖𝑛(𝑓, 𝑡) × 𝑓𝑐𝑜𝑠𝑡 (𝑓)𝑡𝑓 (2)
5.2.4.3. Objective Function for pollution reduction (environmental dimension)
The objective function for pollution reduction aims to minimize carbon emissions in the procurement
and distribution activities. To compute the unitary emission of a shipped product, the Greenhouse
Gas protocol is the most common model (Absi et al. 2013). The total amount is calculated with a
linear function that depends on both the distance travelled and the carbon emission of the vehicle
used (gCO/kilometer). Based on this model, the carbon emission indicator is proportional to the
number of units of products allocated to each flow in the network, depending on the transportation
flow.
Min ∑ ∑ 𝐹𝑖𝑛(𝑓, 𝑡) × 𝑓𝑒𝑛𝑣 (𝑓)𝑡𝑓 (3)
5.2.4.4. Objective function for local empowerment (social dimension)
The objective function for local empowerment aims to maximize local investments in the
procurement distribution activities. In other words, this objective function maximizes purchases from
local suppliers. Local suppliers are defined by the decision-maker and include those located not only in
the same region, but also in neighboring countries.
Max ∑ ∑ 𝐹𝑖𝑛(𝑓, 𝑡) × 𝑓𝑖𝑡𝑐 (𝑓)𝑡𝑓|𝑓𝑠𝑜𝑐=𝑙𝑜𝑐𝑎𝑙 (4)
5.2.5. General constraints
These objective functions are subject to two categories of constraints: general and sustainability
performance constraints.
5.2.5.1. Flow-balance
The flow-balance constraints apply the conservation-of-flow law which states that for all inflow
records (Fin), when the time is equal to or less than the flow lead time, the inflow can only be the
delivery quantities scheduled before t0 (fexp).
𝐹𝑖𝑛(𝑓, 𝑡) = 𝑓𝑒𝑥𝑝(𝑓, 𝑡), f t / t ≤ ftlt(f) (5a)

Chapter IV Planning sustainable HSC operations
138
Another way of expressing them is that the inflow record (Fin) is equivalent to the outflow (Fout)
from a node before the flow ∆t.
𝐹𝑖𝑛(𝑓, 𝑡) = 𝐹𝑜𝑢𝑡(𝑓, 𝑡 − 𝑓𝑡𝑙𝑡(𝑓)), f t / t > ftlt(f) (5b)
5.2.5.2. Supplier-balance
The supplier-balance constraint stipulates that for each supplier-product record, the quantity of
products dispatched at period t must be equal to the sum of all the inbound flows at time t for which
the point of origin and product are the same as for the supplier-product couple.
𝑆𝑜𝑢𝑡(𝑠, 𝑡) = ∑ 𝐹𝑜𝑢𝑡(𝑓, 𝑡)𝑓|𝐹𝑜𝑟𝑖(𝑓)=𝑠𝑖𝑑(𝑠) & 𝑓𝑝𝑟𝑜(𝑓)=𝑠𝑝𝑟𝑜(𝑠) , s t (6)
5.2.5.3. Maximum capacity of suppliers
The quantity of products dispatched must not exceed the maximum capacity of the suppliers per
period.
𝑆𝑜𝑢𝑡(𝑠, 𝑡) ≤ 𝑠𝑠𝑐𝑎(𝑠, 𝑡), s t (7)
5.2.5.4. Warehouse inventory-balance
For each warehouse-product couple, the sum of the inventory in the warehouse (Winv) at time t-1 and
the products received at time t is equal to the sum of the inventory at time t and the products
dispatched at time t. At time t1, the warehouse inventory level at time t-1 is represented by the
parameter wini.
𝑤𝑖𝑛𝑖(𝑤) + ∑ 𝐹𝑖𝑛(𝑓, 1)
𝑓|𝑓𝑑𝑒𝑠(𝑓)=𝑤𝑖𝑑(𝑤) & 𝑓𝑝𝑟𝑜(𝑓)=𝑤𝑝𝑟𝑜(𝑤)
= 𝑊𝑖𝑛𝑣(𝑤, 1) + ∑ 𝐹𝑜𝑢𝑡(𝑓, 1)
𝑓|𝑓𝑜𝑟𝑖(𝑓)=𝑤𝑖𝑑(𝑤) & 𝑓𝑝𝑟𝑜(𝑓)=𝑤𝑝𝑟𝑜(𝑤)
w , t =1 (8a)
𝑤𝑖𝑛𝑣(𝑤, 𝑡 − 1) + ∑ 𝐹𝑖𝑛(𝑓, t)
𝑓|𝑓𝑑𝑒𝑠(𝑓)=𝑤𝑖𝑑(𝑤) & 𝑓𝑝𝑟𝑜(𝑓)=𝑤𝑝𝑟𝑜(𝑤)
= 𝑊𝑖𝑛𝑣(𝑤, t) + ∑ 𝐹𝑜𝑢𝑡(𝑓, t)
𝑓|𝑓𝑜𝑟𝑖(𝑓)=𝑤𝑖𝑑(𝑤) & 𝑓𝑝𝑟𝑜(𝑓)=𝑤𝑝𝑟𝑜(𝑤)
w, t >1 (8b)
5.2.5.5. Satisfaction of the warehouse contingency stock level
The stock-out quantity (Wsto) refers to the difference between the desired contingency stock and the
actual inventory level. It becomes an over-stock (Wove) if the requested quantity is less than the
inventory level.

Towards a Sustainable Humanitarian Supply Chain
139
𝑊𝑖𝑛𝑣(𝑤, 𝑡) − 𝑤𝑟𝑒𝑞(𝑤) = 𝑊𝑜𝑣𝑒(𝑤, 𝑡) − 𝑊𝑠𝑡𝑜(𝑤, 𝑡), w, t (9a)
We note that at the end of the planning horizon, the forecast demand may tend to be underestimated
(the demand estimation veracity and the forecast quantities decrease with the time horizon) due to the
unexpected consequences and behavior of humanitarian crises. Hence, the model forces the network
to finish the planned period with the required contingency stock level. This prevents the economic
objective function from depleting the contingency stocks.
Winv(w, nbT) = wreq(w), w (9b)
5.2.5.6. Customer (or Demand Point) balance
For each Demand Point-product couple, the quantity of products received per period is equal to the
sum of all the inbound flows (Fin).
𝐶𝑖𝑛(𝑐, 𝑡) = ∑ 𝐹𝑖𝑛(𝑓, 𝑡)𝑓|𝑓𝑑𝑒𝑠(𝑓)=𝑐𝑖𝑑(𝑐) & 𝑓𝑝𝑟𝑜(𝑓)=𝑐𝑝𝑟𝑜(𝑐) c,t (10)
5.2.5.7. Satisfaction of the demand
The quantity of products that a demand point receives at period t, must be equal to the demand
(cqua). It may be lower in case of stock-out or higher due to over-stock.
𝐶𝑖𝑛(𝑐, 1) + 𝐶𝑠𝑡𝑜(𝑐, 1) = 𝑐𝑞𝑢𝑎(𝑐, 1) + 𝐶𝑜𝑣𝑒(𝑐, 1), c, t=1 (11a)
𝐶𝑖𝑛(𝑐, 𝑡) + 𝐶𝑠𝑡𝑜(𝑐, 𝑡) = 𝑐𝑞𝑢𝑎(𝑐, 𝑡) + 𝐶𝑜𝑣𝑒(𝑐, 𝑡) + 𝐶𝑠𝑡𝑜(𝑐, 𝑡 − 1) − 𝐶𝑜𝑣𝑒(𝑐, 𝑡 − 1), c, t>1 (11b)
However, given that the objective is to respond to all the demands and that the network can achieve
this a priori, the model forces the satisfaction of all the demand.
∑ creq(c, t) 𝑡 = ∑ Cin(c, t) 𝑡 , c, t (11c)
5.2.5.8. Equity constraint
The equity constraint forces the distribution of products to be proportional to demand, with the same
ratio for all the priority customers (level 1) and a tolerance of 10%.
∑ 𝐶𝑠𝑡𝑜(𝑐, 𝑡)𝑡∑ 𝐶𝑞𝑢𝑎(𝑐, 𝑡)𝑡
⁄ <
(∑ ∑ 𝐶𝑠𝑡𝑜(𝑐, 𝑡)𝑡𝑐
∑ ∑ 𝐶𝑞𝑢𝑎(𝑐, 𝑡)𝑡𝑐⁄ ) × 1.1, c/cpen(c)=Level 1 (12)
5.2.6. Sustainability performance constraints
5.2.6.1. Effectiveness constraint
The effectiveness constraint is the maximum value obtained by the objective function for
effectiveness (Effopt) minus a given tolerance (%).
𝐸𝑓𝑓𝑜𝑝𝑡[1 − (1 − 𝐸𝑓𝑓𝑡𝑜𝑙)] ≤
∑ 𝑐𝑡𝑞𝑢𝑎(𝑐) − ∑ 𝐶𝑡𝑝𝑒𝑛(𝑐)/𝑛𝑏𝑇𝑐 +𝑐 ∑ 𝑤𝑡𝑟𝑒𝑞(𝑤) −𝑤 ∑ 𝑊𝑡𝑟𝑒𝑞(𝑤)/𝑛𝑏𝑇𝑤 (13)

Chapter IV Planning sustainable HSC operations
140
5.2.6.2. Economy (Efficiency) constraint
The economy constraint is the minimum value obtained by the objective function for Economy
(Ecoopt) plus a given tolerance (%).
𝐸𝑐𝑜𝑜𝑝𝑡 × (1 + 𝑒𝑐𝑜𝑡𝑜𝑙) ≥ ∑ 𝐹𝑖𝑛(𝑓) × 𝑓𝑐𝑜𝑠𝑡 (𝑓) (14)
5.2.6.3. Environment (Pollution reduction) constraint
The environment constraint is the minimum value obtained by the objective function for
Environment (Envopt) plus a given tolerance (%).
𝐸𝑛𝑣𝑜𝑝𝑡 × (1 + 𝑒𝑛𝑣𝑡𝑜𝑙) ≥ ∑ 𝐹𝑖𝑛(𝑓) × 𝑓𝑒𝑛𝑣 (𝑓) (15)
5.2.6.4. Social (Local empowerment) constraint
The social constraint is the maximum value obtained by the objective function for social (Socopt)
minus a given tolerance (%).
𝑆𝑜𝑐𝑜𝑝𝑡 − (𝑠𝑜𝑐𝑜𝑝𝑡 × 𝑠𝑢𝑠𝑡𝑜𝑙) ≤ ∑ ∑ 𝐹𝑖𝑛(𝑓, 𝑡) × 𝑓𝑖𝑡𝑐 (𝑓)𝑡𝑓|𝑓𝑠𝑜𝑐=𝑙𝑜𝑐𝑎𝑙 (16)

Towards a Sustainable Humanitarian Supply Chain
141
6. Master Planning for the IFRC A&C RLU use case
This section illustrates the SHSC Master Planning decision-support system in use, following the A&C
RLU use case.
We developed the Master Planning dataset based on the field study data gathered at the A&C RLU, as
well as on interviews with the Regional Logistic Development Officer. We also built it by imagining
what the future IFRC upstream HSC would look like.
6.1. Sustainability at the IFRC
To enhance sustainable operations with the future (or under construction) sub-regional network,
decision-makers should be able to coordinate the different stakeholders during an operation. For
instance, if there is a need in the region, which warehouse will have to send what and when? Who will
manage the replenishments? Today, decision-making is only based on the Procurement Officer’s
experience and is fully centralized.
When the network will be deployed the possible options will be a combination of variables that need
to be considered, e.g., cost (items, transport), sourcing, or lead-time. Thus, experience will not be
enough to establish the best response to execute and decision-support systems will be needed.
Figure 61 Sub-regional coordinated response
6.1.1. American & Caribbean IFRC sub-regional upstream network
The A&C RLU network is composed of 7 LUs and the Panama RLU. All warehouses are located
close to the respective capitals and in proximity to Logistic infrastructures such as seaports and/or
airports. The contingency stock level of each LU is defined by the IFRC strategy. The Panama RLU
has a contingency stock level that corresponds to the needs of 5,000 families. LUs have smaller
quantities, which can support between 2,000 and 5,000 families depending on the country. Figure 62
shows the geographical locations of warehouses (house), demand points (star) and regional and local
suppliers (pointer).
• Capaci es• capabili es
• Capaci es• capabili es
• Capaci es• capabili es
• Capaci es• capabili es
• Capaci es• capabili es
ZLU
need
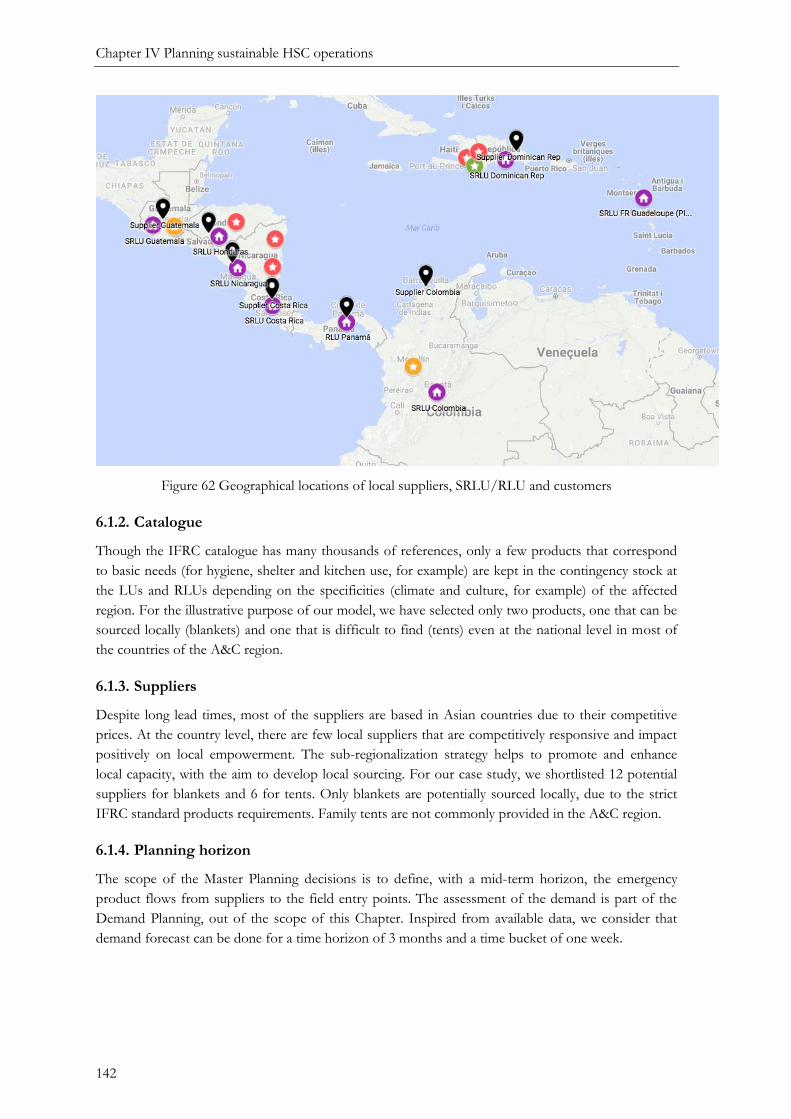
Chapter IV Planning sustainable HSC operations
142
Figure 62 Geographical locations of local suppliers, SRLU/RLU and customers
6.1.2. Catalogue
Though the IFRC catalogue has many thousands of references, only a few products that correspond
to basic needs (for hygiene, shelter and kitchen use, for example) are kept in the contingency stock at
the LUs and RLUs depending on the specificities (climate and culture, for example) of the affected
region. For the illustrative purpose of our model, we have selected only two products, one that can be
sourced locally (blankets) and one that is difficult to find (tents) even at the national level in most of
the countries of the A&C region.
6.1.3. Suppliers
Despite long lead times, most of the suppliers are based in Asian countries due to their competitive
prices. At the country level, there are few local suppliers that are competitively responsive and impact
positively on local empowerment. The sub-regionalization strategy helps to promote and enhance
local capacity, with the aim to develop local sourcing. For our case study, we shortlisted 12 potential
suppliers for blankets and 6 for tents. Only blankets are potentially sourced locally, due to the strict
IFRC standard products requirements. Family tents are not commonly provided in the A&C region.
6.1.4. Planning horizon
The scope of the Master Planning decisions is to define, with a mid-term horizon, the emergency
product flows from suppliers to the field entry points. The assessment of the demand is part of the
Demand Planning, out of the scope of this Chapter. Inspired from available data, we consider that
demand forecast can be done for a time horizon of 3 months and a time bucket of one week.

Towards a Sustainable Humanitarian Supply Chain
143
Figure 63 Master Planning Rolling horizon
6.1.5. Demand Points and Scenario
As discussed in the Introduction, the main service offered by the IFRC upstream is the management
of procurement, warehousing and distribution processes of emergency products to feed entry points
(warehouses, airports, seaports, etc.). It does not cover last-mile delivery. The demand can be then
classified into different categories depending on the origin or the priority level.
For the illustration, we consider three priority levels: no priority/priority/urgent. The latter level adds
a proportional penalty to the effectiveness when not delivered on time. Moreover, only urgent needs
are considered by the equity constraint.
The demand of the illustration dataset is based on the socio-economic situation and the political
instability of most of the countries in the area, as well as on natural phenomena (such as El Niño) that
make the population especially vulnerable.
The illustration scenario is situated at the beginning of the rainy season, and therefore several
countries are expecting flooding in the coming weeks/months. The consequence may be displaced
people in Dominican Republic, Nicaragua, Honduras, Guatemala and Haiti and therefore, the need of
tents and blankets (among other emergency items not considered here). Moreover, Colombia is facing
a long-term political crisis, and the number of displaced people is increasing slightly.
Figure 64 shows the total demand of each product per week, versus the capacity. It is evident that the
total supply capacity is oversized. The situation is not a grave crisis, so the choices between suppliers
can be made depending on the different performance dimensions (economic, environmental, social).
In an extreme crisis situation, where the total demand is close to, or exceeds the total capacity, there is
no interest on using such an approach, because the effectiveness prioritization would constrain almost
any other option.
t0 1 2 3 4 5 6 7 8 9 10 11 12 Weeks
Rolling Master Planning horizon
t0 3 4 5 6 7 8 9 10 11 12 13 14
t0 2 3 4 5 6 7 8 9 10 11 12 13

Chapter IV Planning sustainable HSC operations
144
Figure 64 Demand versus capacity per week
6.1.6. Sustainable performance objectives
The LO of the performance objectives has to be established by the decision-maker. Funding is always
a problem in the A&C RLU due to the recurrent disasters affecting this area, which do not receive the
attention of the media. The strategy of the IFRC is to give more priority to the development of local
markets than to environmental considerations. Therefore, it is assumed in this paper that the decision-
maker prioritizes the three sustainability dimensions in the following order: (1) economic, (2) social
and (3) environmental.
6.1.7. Numerical application
Based on this hypothesis, we built a database for the A&C RLU network flow. This database is
composed of four sub-databases that can be seen in Appendix B. They are:
1) Suppliers’ weekly capacity information
2) Warehouse inventory input data of LUs and the RLU,
3) Demand input data, and
4) Input data to define the potential flows.
The initial inventory corresponds to the target contingency stock level. The demand input data
correspond to the estimated needs per product and per demand point for the first 7 weeks of the
planning horizon. The “cpen” value represents de priority of the order (the higher this parameter, the
higher the priority).
The flow database is constituted of 150 flows from suppliers to LUs and the RLU. To limit the
quantity of flows, it is assumed that suppliers do not deliver directly to the field. The parameters used
to define each flow are: origin, destination, mode, distance, lead-time, product environmental impact,
product economy impact, product social impact, and the outstanding orders (expected receipts). Table
18 shows the parameters used to compute the cost and environmental impact. They are proportional
to the transported weight and distance. For the multimodal flows, the different parameters are applied
proportionally to the distance. They are inspired from (Meiginien 2014), and although they do not
allow the exact real impact to be measured, they give a magnitude for comparison between the
different options. It has to be noted that the environmental indicator results are expressed on CHF to
0
10000
20000
30000
40000
50000
60000
70000
80000
90000
Week
+1
Week
+2
Week
+3
Week
+4
Week
+5
Week
+6
Week
+7
Week
+8
Week
+9
Week
+10
Week
+11
Week
+12
Quantity
Demand vs. capacity per week
Blanket needs
Family tent needs
Family tents capacity
Blanket capacity

Towards a Sustainable Humanitarian Supply Chain
145
homogenize the results, and that the equivalence has been computed as 100 CHF par ton of CO2.
This pricing is inspired from the 2016 World Bank report (Zechtar et al. 2016).
Table 18 Model parameters
Transport type Transport Cost
CHF/(T Km)
Transport emissions
gCO2/(T Km)
Ship long
(from Asia) 0,001 16,05
Ship short (within
the region) 0,005 16,05
Air 0,2 1320
Road 0,1 81,48
6.1.8. Results and discussion
First an illustration of the decision-making process with one LO will be presented. Then, an
Experimental Plan will be outlined, showing the behavior of the model when all the potential LOs are
considered. Finally, the interest of using the interactive tolerance variation will be discussed.
6.1.8.1. Sustainable Master Planning decision process
We simulated the decision-making process based on the ILOM (see Figure 59). The objectives of the
ILOM are:
• LO0: Effectiveness
• LO1: Economic
• LO2: Social
• LO3: Environmental
The first optimization step aims to maximize the Master Planning effectiveness of the SHSC. Then,
following the algorithm, the optimal LO1 (Economic) is calculated with the Effectiveness tolerance as
a constraint. The interface shows the results of varying the Effectiveness constraint tolerance. In the
example, the computation was done using variations that go from 0 to 20% with an incremental step
of 1% (see Figure 65).

Chapter IV Planning sustainable HSC operations
146
Figure 65 First iteration output: Economy indicator vs. Effectiveness Tolerance variation
We observe that demand fulfillment, which is the main performance driver, is not impacted by small
tolerance variations. Small tolerances induce delays only on the warehouses inventory level. To
illustrate the decision-making algorithm, we assume that the decision-maker chose to sacrifice 2%.
With 2% tolerance, the Effectiveness constraint is then fixed at 27 Million CHF and the minimal
Economy Optimum at 10 million CHF.
Then, the second iteration loop computes the Social optimum (LO2) with the fixed effectiveness
constraint plus the variation of the Economy optimum (LO1) as a constraint. The result is shown in
Figure 66.
Figure 66 Second iteration output: Social indicator vs. Economy Tolerance variation
Considering that a degradation of 2% of the Economy Indicator (about 10,000 CHF) allows the Social
Indicator to increase by 1.2 Million CHF (about 1,205,500 CHF), we assume that the decision-maker
accepts a 1% tolerance for the Economy Indicator. The Economy constraint is then fixed at 9.9
Million CHF and the Social optimum (O2) at 3.7 Million CHF.
0 CHF
2 CHF
4 CHF
6 CHF
8 CHF
10 CHF
12 CHF
0% 5% 10% 15% 20%
Eco
no
my (
CH
F)
Mil
lio
ns
Effectiveness tolerance % variation
0 CHF
1 CHF
2 CHF
3 CHF
4 CHF
5 CHF
6 CHF
7 CHF
8 CHF
9 CHF
0% 5% 10% 15% 20%
So
cia
l (C
HF
) Mil
lio
ns
Economy tolerance % variation
Eco. Tolerance 1%:
Cost increases by 10,000
CHF
Local investment
increases by 1.2
Million CHF
Eco. Tolerance 10%:
Cost increases by 100,000
CHF
Local investment
increases by 4.5
Million CHF
Effect. Tolerance 2%:
Demand coverage 100%
3 LUs have a stock reduction of 1 to 3 weeks
Effect. Tolerance 10%:
Demand coverage 100%
5 LUs have a stock-reduction of 1 to 3 weeks

Towards a Sustainable Humanitarian Supply Chain
147
The last optimization loop computes the LO3 optimum (Environmental) with the O2 optimum
(Social) tolerance variation as a constraint. It varies from 0 to 20%, with incremental steps of 1%. The
interface with the decision-maker shows the resulting graph (see Figure 67).
Figure 67 Third iteration output: Environment indicator vs. Social Tolerance variation
The output graph resulting from the third iteration leaves a low choice margin for the decision-maker.
Reducing the Social Indicator by 1% (37 thousand CHF) allows an improvement of 17.7 thousand
CHF on the Carbon Footprint, whereas a reduction of 2% (63 thousand CHF) leads to an
improvement of 18.5 thousand CHF. The assumption is therefore to accept a tolerance of 1%. The
Social constraint is then fixed at 37 thousand CHF and the minimum Environment optimum (LO3) at
17.7 thousand CHF. The resulting Master Planning indicators are summarized in Table 19.
Table 19 Results of the Master Planning Indicators
Indicator Effectiveness Economic Social Environmental
Accepted Tolerance
2% 1% 1% /
Value 27 CHF Million
9.9 CHF Million
37 CHF thousand
17.7 CHF thousand
In addition to the indicators, the model outputs are the weekly procurement and distribution flows.
Table 20 shows a sample of the Master Planning flows allocation for the SHSC.
405 CHF
410 CHF
415 CHF
420 CHF
425 CHF
430 CHF
0% 5% 10% 15% 20%
En
viro
nm
en
t (1
,000 C
HF
)
Social tolerance % variation
Social tolerance of 1%:
Local investment decreases by 37 thousand CHF
Environmental cost decreases by 17.7 thousand CHF
Social tolerance of 2%:
Local investment decreases by 63 thousand CHF
Environmental cost decreases by 18.5 thousand CHF

Chapter IV Planning sustainable HSC operations
148
Table 20 SHSC Master Planning case flows allocation sample
The decision-maker also has access to the planning of receipts, the eventual stock-outs (or over-
stocks) and the expected inventory levels.
6.1.8.2. Experimental Plan of LO
For a better understanding of the proposed SHSC Master Planning decision-support system, as well as
the behavior of the algorithm, we built an Experimental Plan with all the possible Lexicographic
Orders. Given that effectiveness is considered as a fixed LO objective and that only the three other
objectives (economic, social and environmental) have to be ordered, there are six possible LO
combinations of the performance indicators. Table 21 summarizes the six combinations
Table 21 Experimental Plan Lexicographic Orders
Order LO0 LO1 LO2 LO3
A (example) Effectiveness Economic Social Environmental
B Effectiveness Economic Environmental Social
C Effectiveness Social Economic Environmental
D Effectiveness Social Environmental Economic
E Effectiveness Environmental Economic Social
F Effectiveness Environmental Social Economic
Figure 68 shows how the optimal values of the three TBL objectives evolve with the tolerance
variation of effectiveness. All the LO1 objectives benefit from the relaxation of the LO0 (effectiveness).
The improvements in the objectives amount to a decrease of 95% for the environmental impact and
an increase of 20% for the social impact.
#
1
2
3
4
5
6
7
8
9
10
11
12
13
14
15
16
#Origin
fori1001
2001
2001
2001
2001
2001
2001
2001
2001
2001
2001
2001
2001
2001
2001
2003
#Destination Mode
fdes2001 Sea
2002 Air
2003 Air
2004 Air
2005 Air
2006 Air
2007 Air
2008 Air
2002 Multi
2005 Sea
2007 Sea
2003 Road
2004 Road
2006 Road
2008 Road
2001 Air
Product
Blanket
Blanket
Blanket
Blanket
Blanket
Blanket
Blanket
Blanket
Blanket
Blanket
Blanket
Blanket
Blanket
Blanket
Blanket
Blanket
1 2 3 4 5 6 7 8 9 10 11 12
12000 7574 0 0 0 0 0 0 0 0 0 0
0 0 0 0 0 0 0 0 0 0 0 0
0 0 0 0 0 0 0 0 0 0 0 0
0 0 0 0 0 0 0 0 0 0 0 0
0 0 0 0 0 0 0 0 0 0 0 0
0 0 0 0 0 0 0 0 0 0 0 0
0 0 0 0 0 0 0 0 0 0 0 0
0 0 0 0 0 0 0 0 0 0 0 0
0 0 0 0 0 0 0 0 0 0 0 0
0 0 0 0 0 2000 0 0 0 0 0 0
0 0 0 0 0 2000 0 0 0 0 0 0
0 0 0 426 4100 0 200 9900 6000 0 0 0
0 0 0 0 0 0 0 0 0 0 0 0
0 0 0 0 9000 0 0 0 3900 0 0 0
0 0 0 0 0 0 0 0 0 0 0 0
0 0 0 0 0 0 0 0 0 0 0 0
Fout

Towards a Sustainable Humanitarian Supply Chain
149
Figure 68 Variation of the TBL indicators (LO1) while varying effectiveness tolerance
The results of LO1, LO2 and LO3 depend on the tolerance defined for LO0. Fixing the tolerance at 2%
for LO0 (effectiveness), we observed that LO1 and LO2 tolerances also have an impact on the next
optimization sequences.
Table 22 shows the results of the Experimental Plan of the LO, with the case data first of all set at a
tolerance of 2% for LO0; 0% for LO1 and 0% for LO2 (Table 4a) and then at 2% for LO0; 1% for
LO1 and 1% for LO2 (Table 22b) The indicators are normalized based on the optimal result that can
be achieved with the LO0 tolerance fixed at 2%. The results show that both the LO and the tolerance
variation have a relevant impact on the indicators. It can be observed that with a 0% tolerance (Table
22a) the order of LO2 and LO3 has no impact on the indicators, while with a 1% tolerance (Table 4b)
there is a significant impact of the order on the indicators. It is therefore important to fix the tolerance
using an interactive method, since it may lead to an important degradation of the indicators, which
may not be acceptable by the decision-maker.
0%
20%
40%
60%
80%
100%
120%
140%
0% 5% 10% 15% 20%
TB
L i
nd
icato
rs e
volu
tio
n (
%)
Effectiveness tolerance % variation
LO1: Eco (A&B)
LO1: Soc (C&D)
LO1: Env (E&F)

Chapter IV Planning sustainable HSC operations
150
Table 22 Experimental Plan (for a: tolerance = 0, and for b: tolerance = 1%)
(a) LO0 LO1 LO2 LO3
A 98% 100% 30% 160%
B 98% 100% 160% 30%
C 98% 100% 125% 324%
D 98% 100% 324% 125%
E 98% 100% 110% 81%
F 98% 100% 81% 110%
Tolerance 2% 0% 0% 0%
(b) LO0 LO1 LO2 LO3
A 98% 101% 44% 112%
B 98% 101% 113% 44%
C 98% 99% 121% 238%
D 98% 99% 241% 121%
E 98% 101% 108% 73%
F 98% 101% 82% 110%
Tolerance 2% 1% 1% 1%
6.2. Limitations
The illustrations presented above show that our proposal allows sustainable alternatives to be found
for supporting humanitarian logistics. However, this illustration also indicates that decision-makers
have a lot of intermediate choices to make all through the process in order to reach a good solution
(ordering the TBL criteria and fixing the tolerance ratios). All these intermediate decisions can be
difficult to make in an emergency context. Moreover, such a Master Planning system (as in the case of
any planning system) needs a lot of data to run correctly. But in an HSC, this kind of dataset is not
easy to put together and could constitute a considerable limitation to our proposal. Nevertheless,
practitioners already collect such kind of data (on demand, suppliers, etc.) but may not do so in such
an exhaustive manner.
7. Discussion
Given the growing interest in sustainable approaches for the management of humanitarian supply
chains (HSCs), both academics and humanitarian organizations (HOs) are in search of effective
methods for the implementation of the three sustainability dimensions (economic, social and
environmental). In this chapter, we have proposed an approach that can be used for the tactical
planning of sustainable operations in the HSC. Based on information gathered from the literature on
sustainable HSC and performance measurement, as well as our field research, we presented three
complementary contributions aimed at the development of a Master Planning decision-support system
for an SHSC.
Effectiveness
Economy
Social
Environmental

Towards a Sustainable Humanitarian Supply Chain
151
We started by defining a set of performance indicators used to quantify the Master Planning
performance of the SHSC. A brief discussion enabled us to retain four parameters (Effectiveness,
Efficiency, Local empowerment and Carbon emission) as the key performance indicators for the
tactical Master Planning. To solve the multi-objective problem, we presented an ILOM approach. This
sequential and interactive optimization algorithm makes it possible to take into consideration the
expertise of the decision-maker by prioritizing the performance objectives. This allows a sequence of
single-objective problems to be solved while progressively adding the optimums of previous solutions
as constraints. Finally, we proposed a network flow model to execute the Master Planning of the
SHSC while optimizing the performance objectives.
For the numerical illustration of our model, we built a case study inspired from the A&C IFRC
Regional upstream network. The outcome of the case shows how the ILOM approach enables the
decision-maker’s expertise and knowledge of the prioritization of planning performance objectives to
be integrated. In this experimental section, we emphasized the interest of using an interactive
approach to define tolerances. We note that an interactive approach is mandatory since there is no
trivial method for identifying a priori the impact of tolerance on performance objectives.
Several perspectives arise from this research work. The first one would consist in testing our proposal
in a real context by applying it to real-life operations. Such a project is currently going on with the
A&C RLU of IFRC. The objective here is firstly to go deeper into the assessment of the benefits and
limits of our proposal, and secondly to ensure its usability by practitioners.
The second perspective would consist in assessing the accuracy of our ILOM outputs with respect to
current practices. Our proposal is mathematically and theoretically valid but the relevance of the
outputs remains to be studied and confirmed.
The third perspective would consist in extending the experimental plan to dataset combinations in
order to better support decision-makers in using the SHSC Master Planning system that correspond to
their own business objectives. Although we were able to develop a business case to concretely test our
proposal, the parameterization remains complex for users who have to make a lot of intermediate
choices in the process. Therefore, it might be valuable to help them by performing a sensitivity
analysis of our model and by suggesting sets of parameters depending on the target objective
(especially regarding the tolerance ratios).
The fourth perspective would consist in considering much more variability and uncertainty in our
Master Planning system. Currently, our proposal is purely deterministic and the hazards are only
managed through the rolling horizon of the plan. For further research, it may be interesting to use a
stochastic or fuzzy approach. The last perspective is about considering an extension of the SHSC
Master Planning to a global HSC management model, just as the for-profit business sectors are doing
with Advanced Planning Systems.

152

153
Chapter V. CONCLUSION AND PERSPECTIVES
“Utopia lies at the horizon.
When I draw nearer by two steps,
it retreats two steps.
If I proceed ten steps forward, it
swiftly slips ten steps ahead.
No matter how far I go, I can never reach it.
What, then, is the purpose of utopia?
It is to cause us to advance.”
- Eduardo Galeano
1. Academic and practical contributions
The “raison d’être” of HSCs is to diminish human suffering. However, HSCs are not isolated systems.
The increasing financial gap between needs and funding that HOs are suffering from, the global
pressure to embrace sustainable development, and donor’s expectations on accountability, all lead us
to the conclusion that HSCs should consider a sustainable performance approach as an “order
winner” enabler.
Enhancing sustainability in the HSC is a utopia. Sustainability can only be attained by a transformation
of our entire society, culture, and economic system. However, this is not an overnight transformation,
and thus, the short term challenge is to support organizations on their way towards sustainability. In
this context, enhancing sustainability in the HSC can be seen as a “continuous improvement” process
that constantly questions the impact of decisions in the short and in the long term.
There are many aspects of the HSC where this evolution can take place, from the mitigation of the
impact of disasters, which may contribute to reducing humanitarian needs, to the conscious design of
relief items or the strength of collaboration and synergies between actors.
These problems have been addressed here from an Operations Management perspective. From field
observations and a literature review, three main gaps were identified: (1) the difficulties in measuring
the impact of humanitarian operations on « sustainability », (2) a lack of planning in the context of
HSC and (3) the difficulties in developing adequate decision-support systems (academic and in-
practice gap).
These issues have been addressed through an inductive research approach, based on IFRC field
research outcomes, and with three main focuses: What? Why? How?
What? The HSC system
RQ1: How to formally conceptualize what an HSC is?
Why? Sustainability in the HSC
RQ2: What does sustainability mean in HSC operations and how can it be assessed?
How? Planning Sustainable HSC operations

Conclusion and Perspectives
154
RQ3: How to support Decision-makers in consciously and systematically making sustainability
trade-offs and exploring consequences?
1st contribution: An HSC metamodel (what?)
To facilitate the formalization and understanding of HSC systems, Chapter 2 presents an HSC
dedicated metamodel. This approach lies in the idea that the HSC is a collaborative system, where
different actors have to interact. The HSC system is formalized with four packages: the context, the
partners, the objectives and the behavior. This proposal is original given that today, there is no
standard formal conceptualization of an HSC system. Potential uses are multiple: it may facilitate field
research design, as well as the development of HSC dedicated Information Systems, or support
concrete continuous improvement steps for logistics aspects. We have made an HSC metamodel
proof of concept, by building field research supports in alignment with the metamodel.
Limits: a proof of concept of the HSC metamodel has been done only to develop field research
supports. The practical application (and therefore validation) for the other suggested uses is yet to be
implemented (to define information system requirements and to facilitate coordination).
2nd contribution: the house of SHSC operations (why?)
The second contribution seeks to define the objectives that an SHSC should consider. Following the
TBL approach, we propose a set of dimensions that defines SHSC operational performance. This
second contribution merges the literature on the concept of sustainability, and sustainable
performance with the field of HSC operations. The framework is used to build an SHSC maturity
assessment method, implemented with an A&C RLU proof of concept, which enables the
measurement of sustainability.
Limits: the framework has been developed thanks to inputs from IFRC field research, as well as the
maturity assessment grids. A wider validation of the sustainable criteria and maturity assessment
process should be conducted with experts from different HOs, in order to consolidate a benchmark to
compare organizations.
3rd contribution: A Master Planning decision-making system (how?)
Finally, the last contribution pursues the objective of concretely incorporating a sustainable
performance approach while planning SHSC operations. From field research and the literature, the
tactical Master Planning process is identified as a potential enabler to introduce sustainability in the
decision-making process. Therefore, the SHSC Master Planning problem has been addressed. Based
on the IFRC A&C network, a set of sustainable performance criteria has been selected. Then, the
multi-objective decision problem is solved with an Interactive Lexicographic Ordering Algorithm that
allows decision-makers’ expertise to be taken into account, linked to a deterministic HSC network
flow model. The relevance of the proposal is illustrated through the A&C RLU use case.
Limits: the A&C RLU use-case covers the upstream and internal decision-making process, which is
only a limited perimeter of the entire IFRC HSC (from suppliers to end-users). The practical
application to a larger perimeter and various HOs is yet to be accomplished. Nonetheless, a lot of data
is already needed to run the model, so the capability of gathering this data has to further investigated,
as well as the sensitivity of the outputs.

Towards a Sustainable Humanitarian Supply Chain
155
2. Perspectives
This research has contributed to the literature on the challenge of enhancing SHSC operations. Based
on the Technology Readiness Level (TRL) scale1, the contributions are on level 3-4 maturity levels:
“research to prove feasibility”. We present here a research agenda to both consolidate the proposals
and to propose further research directions.
• The short-term perspectives aim at consolidating a TRL 5 (technology validated in relevant
environment). Therefore, we consider the need to validate the contributions with (i) a real
scenario from the IFRC HSC network, (ii) a wider set of HO use cases, (iii) and a deeper
study of the model sensitivity.
• The mid-term perspectives aim at consolidating a TRL 7 (system prototype demonstration in
operational environment). Therefore, it appears relevant to reinforce the prototype
implementation with the development of (iv) adequate interfaces in alignment with
practitioners’ expectations (usability), and (v) methods for a successful technology transfer to
the end-users (acceptability).
• The long-term perspectives aim at going beyond the scientific proposals. Within the many
potential evolutions, we find it relevant to consider three main research directions. First, (vi) a
deeper study of sustainability assessment all along the HSC lifecycle. Secondly, (vii) the
extension over two dimensions of the SHSC planning decision-support system: the decision
planning levels and tasks, and the end-to-end supply chain (from suppliers to beneficiaries).
Last, but not least, (viii) the integration of an agile decision-making dimension into the
decision-making process.
Short-term perspectives (validation)
x. Wider Validation with real scenario: to demonstrate the validity of the proposals, all the
contributions have been validated through the IFRC A&C RLU use case. Nonetheless, each
of the contributions was built with a limited data set extended by assumptions. Although the
assumptions were discussed with practitioners or built on field observations, and/or the
literature review, it would be relevant to frame a complete dataset with real data.
To build a real scenario, it would be appropriate to engage with the IFRC on a field research
campaign dedicated to gathering the data, and to building the real scenario. Furthermore,
practitioners could perform a validation step, by contrasting the performance outcomes with
and without using the SHSC Master Planning system.
xi. Contrast model assumptions with other HOs: the assumptions were built on the specifics of the
IFRC upstream HSC. This is clearly a limitation, and thus, one perspective would be to
extend the validation with a wider range of HOs, such as the WFP or even MSF, who manage
similar HSC networks. The scope of other HSCs may differ in terms of disaster typology (i.e.
conflicting situations) and therefore, the HSC network flow model hypothesis and constraints
may differ.
1 Technology Readiness Levels (TRLs) are indicators of the maturity level of particular technologies. This measurement system provides a common understanding of technology status and addresses the entire innovation chain. There are nine technology readiness levels; TRL 1 being the lowest and TRL 9 the highest (European Comission 2017).

Conclusion and Perspectives
156
xii. A deeper sensitivity evaluation: the sensitivity of the model needs to be investigated more deeply
with a real dataset. The objective is to support the users in interpreting and anticipating the
implications of their choices during the decision process.
Mid-term perspectives (implementation)
xiii. Human-computer interaction: in the third contribution, we have focused on the algorithm and
model to assess sustainability, and solve the sustainable Master Planning decision-making
problem. Although we have considered the user dimension and user expertise on the
prioritization of the performance objectives, the usability of the system remains complex for
the non-initiated. To reinforce the applied research approach, further work has to be done to
design and develop ergonomic human-computer interactions. Developing usable (efficient,
effective and satisfying) interfaces is an interdisciplinary matter that concerns at least and
computer engineering, and which would also benefit from a social sciences perspective
(interaction design) (Dix 2009).
xiv. Technology transfer to the field: once a prototype has been implemented, it is important to
consider the dissemination of the decision-support system among the potential users (access
to knowledge). An important related issue to be considered is integration with existing
information systems (i.e. ERP). This may notably reveal interoperability challenges.
Long-term perspectives (evolutions)
xv. Life Cycle Assessments: a standard approach to assessing the impacts of a product on the
different dimensions of sustainability is to make a Life Cycle Assessment (LCA). This
assessment has typically been conducted for the environmental dimension, but some authors
also consider carrying out a social LCA. This is a challenging but interesting perspective to
follow because it may make it possible to identify, in a continuous improvement perspective,
the stages of the HSC that have the most negative impact.
xvi. Towards and Humanitarian Advanced Planning System: the ultimate goal of SHSC is to generate
synergic decision-making behavior with all the HSC stakeholders upstream and downstream.
This research work has addressed a first step, with the development of a Master Planning
module, for the upstream HSC. However, the question remains of how decisions taken
upstream impact on global HSC sustainability. How can decision-makers gain a holistic
perspective?
Therefore, to enhance SHSC operations, two interesting perspectives arise: (1) the integration
of the different planning levels (Figure 69) and (2) the integration of the upstream and
downstream stakeholders (Figure 70).
In the commercial SC context, APSs are seen as the solution to integrate all the decision
processes using a hierarchical approach. However, the context of humanitarian operations
brings additional difficulties: downstream networks are deployed ad-hoc, the collaborations
between stakeholders may be sporadic, and decision-making can be decentralized. Is it then
possible to develop a flexible Humanitarian APS? How can the dynamics and uncertainty in
the system be addressed?

Towards a Sustainable Humanitarian Supply Chain
157
Figure 69 Perspective: Planning decision levels and tasks integration
Figure 70 Perspective: Upstream and downstream integration
Nonetheless, many research studies have already been conducted that address strategic level
decision-making with, for example, network design (Aurélie Charles 2010; Vargas Florez et al.
2015), or operational levels with last mile distribution decision-making problems (Burcu
Balcik et al. 2008). The remaining issues still involve the questions of how to introduce the
sustainable perspective in the different decision levels and how to ensure the interoperability
of the different systems.
The use of the HSC metamodel may be an enabler to facilitate the development of
Humanitarian Sustainable APS (interoperability), if used as a common reference
conceptualization of the network.
xvii. Agility (detection, adaptation): finally, HSC operations have to cope with a high degree of
uncertainty. Therefore, the HSC decision-making process requires methods that adapt to the
dynamics of the environment. Our contribution is limited to the design of a process (the
Master Planning), and to deal with the uncertainty, we have proposed a rolling horizon
planning approach. An agile decision-making process can be implemented by adding the two
dimensions: detection and adaptation. An agile system can detect the deviations between plan
and reality, and adapt to the new situation.
SHSC MASTER PLANNING

158

159
BIBLIOGRAPHY
Aaltonen, M. (2009). Multi-ontology, sense-making and the emergence of the future. Futures,
41(5), 279–283.
Abidi, H., Leeuw, S. de, & Klumpp, M. (2014). Humanitarian supply chain performance
management: a systematic literature review. Supply Chain Management: An International Journal,
19(5/6), 592–608.
Ahi, P., & Searcy, C. (2013). A comparative literature analysis of definitions for green and
sustainable supply chain management. Journal of Cleaner Production, 52, 329–341.
Ahi, P., & Searcy, C. (2015). An analysis of metrics used to measure performance in green and
sustainable supply chains. Journal of Cleaner Production, 86, 360–377.
Alessandra Cozzolino, Silvia Rossi, & Alessio Conforti. (2012). Agile and lean principles in
the humanitarian supply chain. Journal of Humanitarian Logistics and Supply Chain Management,
2(1), 16–33.
Alotaibi, Y. (2017). Graphical business process modelling standards, techniques and
languages: a literature review. International Journal of Business Information Systems, 25(1), 18–54.
Altay, N., & Green, W. G. (2005). OR/MS research in disaster operations management.
European Journal of Operational Research, 175(1), 475–493.
Asadi, S., Badica, C., Comes, T., Conrado, C., Evers, V., Groen, F., et al. (2011). ICT
solutions supporting collaborative information acquisition, situation assessment and decision
making in contemporary environmental management problems: the DIADEM approach. In
Conference on Innovations in Sharing Environmental Observation and Information (EnviroInfo 2011),
October 5-7, 2011, Ispra, Italy (pp. 920–931).
Ashby, Leat, & Hudson-Smith. (2012). Making connections: a review of supply chain
management and sustainability literature. Supply Chain Management: An International Journal,
17(5), 497–512.
Baharmand, H., & Comes, T. (2015). A Framework for Shelter Location Decisions by Ant
Colony Optimization. In ISCRAM.
Baharmand, H., Laguna Salvadó, Laura, Comes, T., & Lauras, M. (2015). On the Literature
Divergences of the Humanitarian Supply Chain. Presented at the ISCRAM-med, Tunis.
Balcik, B., & Beamon, B. M. (2008). Facility location in humanitarian relief. International Journal
of Logistics Research and Applications, 11(2), 101–121.
Balcik, B., Beamon, B. M., Krejci, C. C., Muramatsu, K. M., & Ramirez, M. (2010).
Coordination in humanitarian relief chains: Practices, challenges and opportunities.
International Journal of Production Economics, 126(1), 22–34.

160
Balcik, B., Beamon, B. M., & Smilowitz, K. (2008). Last Mile Distribution in Humanitarian
Relief. Journal of Intelligent Transportation Systems, 12(2), 51–63.
Barrena, I. (2015, October). Mesa redonda con embajadores en Panamá, IFRC.
Bataille, V., & Castellani, X. (2001). Métamodélisation et ingénierie des systèmes
d’information. Ingénierie des systğmes d ͛information, 149–174.
Battista, C., & M., M. (2013). The Logistic Maturity Model: Application to a Fashion
Company. International Journal of Engineering Business Management, 1.
Baumann, E. (2011). Modèles d’évaluation des performances économique, environnementale et sociale dans
les chaînes logistiques (Phd thesis). INSA de Lyon.
Beamon, B. M. (1999). Measuring supply chain performance. International Journal of Operations
& Production Management, 19(3), 275–292.
Beamon, B. M., & Balcik, B. (2008). Performance measurement in humanitarian relief chains.
International Journal of Public Sector Management, 21(1), 4–25.
Bénabén, F. (2012). Conception de système d’Infromation de Médiation pour la prise en charge de
l’Intéroperabilité dans les Collaborations d’Organizations (HDR). INP Toulouse.
Bénabén, F., Hanachi, C., Lauras, M., Couget, P., & Chapurlat, V. (2008). A metamodel and
its ontology to guide crisis characterization and its collaborative management. In Proceedings of
the 5th International Conference on Information Systems for Crisis Response and Management (ISCRAM),
Washington, DC, USA, May (pp. 4–7).
Bénabén, F., Lauras, M., Truptil, S., & Salatgé, N. (2016). A Metamodel for Knowledge
Management in Crisis Management. In 2016 49th Hawaii International Conference on System
Sciences (HICSS) (pp. 126–135). Presented at the 2016 49th Hawaii International Conference
on System Sciences (HICSS).
Beske, P., & Seuring, S. (2014). Putting sustainability into supply chain management. Supply
Chain Management: An International Journal, 19(3), 322–331.
Bhuiyan, N., & Baghel, A. (2005). An overview of continuous improvement: from the past to
the present. Management Decision, 43(5), 761–771.
Blecken, A. (2010). Supply chain process modelling for humanitarian organizations.
International Journal of Physical Distribution & Logistics Management, 40(8/9), 675–692.
Bouchery, Y., Ghaffari, A., & Jemai, Z. (2010). Key Performance Indicators for Sustainable
Distribution Supply Chains: Set Building Methodology and Application.
Branke, J. (Ed.). (2008). Multiobjective optimization: interactive and evolutionary approaches. Berlin ;
New York: Springer.
Burritt, R. L., & Schaltegger, S. (2010). Sustainability accounting and reporting: fad or trend?
Accounting, Auditing & Accountability Journal, 23(7), 829–846.
Carter, C. R., & Liane Easton, P. (2011). Sustainable supply chain management: evolution and
future directions. International Journal of Physical Distribution & Logistics Management, 41(1), 46–62.

161
Carter, C. R., & Rogers, D. S. (2008). A framework of sustainable supply chain management:
moving toward new theory. International Journal of Physical Distribution & Logistics Management,
38(5), 360–387.
Cervone, H. F. (2007). The system development life cycle and digital library development.
OCLC Systems & Services: International digital library perspectives, 23(4), 348–352.
Chan. (2003). Performance Measurement in a Supply Chain. The International Journal of
Advanced Manufacturing Technology, 21(7), 534–548.
Chan, H. K., & Kumar, V. (2014). Special Issue – Applications of reference models for
supply-chain integration. Production Planning & Control, 25(13–14), 1059–1064.
Chardine-Baumann, E., & Botta-Genoulaz, V. (2014). A framework for sustainable
performance assessment of supply chain management practices. Computers & Industrial
Engineering, 76(Supplement C), 138–147. doi:10.1016/j.cie.2014.07.029
Charles, A. (2010). Improving the design and management of agile supply chains: feedback and application
in the context of humanitarian aid. Unicersité de Toulouse, Albi.
Charles, A., & Lauras, M. (2011). An enterprise modelling approach for better optimisation
modelling: application to the humanitarian relief chain coordination problem. OR Spectrum,
33(3), 815–841.
Charles, A., Lauras, M., & Tomasini, R. (2009). Learning from previous humanitarian
operations, a Business Process Reengineering approach. In Proceedings of the 6th International
ISCRAM Conference (p. 40). Accessed 6 June 2015
Charles, A., Lauras, M., & Tomasini, R. (2010). Collaboration Networks Involving
Humanitarian Organisations – Particular Problems for a Particular Sector. In L. M.
Camarinha-Matos, X. Boucher, & H. Afsarmanesh (Eds.), Collaborative Networks for a
Sustainable World (pp. 157–165). Springer Berlin Heidelberg.
Charvériat, C. (2000). Natural Disasters in Latin America and the Caribbean: An Overview of Risk
(SSRN Scholarly Paper No. ID 1817233). Rochester, NY: Social Science Research Network.
Clark, T., Keßler, C., & Purohit, H. (2015). Feasibility of Information Interoperability in the
Humanitarian Domain. In 2015 AAAI Spring Symposium Series.
Comes, T. (2016). Designing for Networked Community Resilience. Procedia Engineering, 159,
6–11.
Comes, T., Van de Walle, B., Laguna Salvadó, L., & Lauras, M. (2015). Understanding the
Health Disaster: Research Design for the Response to the 2014 West African Ebola
Outbreak, 107, 81–89.
Comes, T., Vybornova, O., & Van de Walle, B. (2015). Bringing Structure to the Disaster
Data Typhoon : An Analysis of Decision-Makers ’ Information Needs in the Response to
Haiyan. In 2015 AAAI Spring Symposium (pp. 7–11).
Correia, E., Carvalho, H., Azevedo, S., & Govindan, K. (2017). Maturity Models in Supply
Chain Sustainability: A Systematic Literature Review. Sustainability, 9(1), 64.

162
Costa, S. R. A. da, Campos, V. B. G., & Bandeira, R. A. de M. (2012). Supply Chains in
Humanitarian Operations: Cases and Analysis. Procedia - Social and Behavioral Sciences, 54, 598–
607.
Coughlan, P., & Coghlan, D. (2002). Action research for operations management. International
Journal of Operations & Production Management, 22(2), 220–240.
Daniele, L., & Ferreira Pires, L. (2013). An ontological approach to logistics. In M. Zelm, M.
J. Sinderen, & G. Doumeingts (Eds.), (pp. 199–213). Presented at the Enterprise
Interoperability, Research and Applications in the Service-oriented Ecosystem, IWEI 2013,
Surrey, UK: ISTE Ltd, John Wiley & Sons, Inc.
Day, J. M., Melnyk, S. A., Larson, P. D., Davis, E. W., & Whybark, D. C. (2012).
Humanitarian and disaster relief supply chains: a matter of life and death. Journal of Supply
Chain Management, 48(2), 21–36.
Deb, K., Sindhya, K., & Hakanen, J. (2016). Multi-objective optimization. In Decision Sciences:
Theory and Practice (pp. 145–184). CRC Press.
Dix, A. (2009). Human-Computer Interaction. In Encyclopedia of Database Systems (pp. 1327–
1331). Springer, Boston, MA.
Drexl, A., & Kimms, A. (2013). Beyond Manufacturing Resource Planning (MRP II): Advanced Models
and Methods for Production Planning. Springer Science & Business Media.
Du Pisani, J. A. (2006). Sustainable development – historical roots of the concept.
Environmental Sciences, 3(2), 83–96.
Dubey, R., & Gunasekaran, A. (2016). The sustainable humanitarian supply chain design:
agility, adaptability and alignment. International Journal of Logistics Research and Applications, 19(1),
62–82.
Eisenhardt, K. M. (1989). Building theories from case study research. The Academy of
Management Review, 14(4), 532–550.
Elkington, J. (1998). Accounting for the Tripple Bottom Line. Measuring Business Excellence,
2(3), 18–22.
Eskandarpour, M., Dejax, P., Miemczyk, J., & Péton, O. (2015). Sustainable supply chain
network design: An optimization-oriented review. Omega, 54(Supplement C), 11–32.
Esty, D., & Winston, A. (2009). Green to Gold: How Smart Companies Use Environmental Strategy to
Innovate, Create Value, and Build Competitive Advantage. John Wiley & Sons.
European Comission. (2017). Horizon 2020 work programme 2016-17 - 20. General
Annexes. European Comission.
Ferris, E., Petz, D., & Stark, C. (2013). The year of recurring disasters: A review of Natural Disasters
in 2012. The Brookings Institution.
Forme, F. A. G. L., Genoulaz, V. B., & Campagne, J. P. (2009). The role of APS systems in
Supply Chain Management: a theoretical and industrial analysis. International Journal of Logistics

163
Systems and Management, 5(3/4), 356. doi:10.1504/IJLSM.2009.022502
Franke, J., Widera, A., Charoy, F., Hellingrath, B., & Ulmer, C. (2011). Reference process
models and systems for inter-organizational ad-hoc coordination-supply chain management in
humanitarian operations. In 8th International Conference on Information Systems for Crisis Response
and Management (ISCRAM’2011).
Fulzele, V., Gupta, R., & Shankar, R. (2016). Identification and Modelling of Critical Success
Factors of a Humanitarian Supply Chain. In Managing Humanitarian Logistics (pp. 33–50).
Springer, New Delhi.
Galindo, G., & Batta, R. (2013). Review of recent developments in OR/MS research in
disaster operations management. European Journal of Operational Research, 230(2), 201–211.
Gaševic, D., Djuric, D., & Devedžic, V. (2006). Model Driven Architecture and Ontology
Development. Springer Science & Business Media.
Gastwirth, J. L. (1972). The Estimation of the Lorenz Curve and Gini Index. The Review of
Economics and Statistics, 54(3), 306–316.
Gladwin, T. N., Kennelly, J. J., & Krause, T.-S. (1995). Shifting paradigms for sustainable
development: Implications for management theory and research. Academy of management Review,
20(4), 874–907.
Global Logistic Services IFRC. (2012). 2011 GLS Annual Report.
Global Repporting Inititative. (2015). GRIG4 - Reporting Principles and Standard
Disclosures. GRI.
Golinska, P., & Kuebler, F. (2014). The Method for Assessment of the Sustainability Maturity
in Remanufacturing Companies. Procedia CIRP, 15, 201–206.
Gralla, E., Goentzel, J., & Fine, C. (2014). Assessing Trade-offs among Multiple Objectives
for Humanitarian Aid Delivery Using Expert Preferences. Production and Operations Management,
23(6), 978–989.
Gralla, E., Goentzel, J., & Van de Walle, B. (2013). Field-based decision makers’ information needs in
sudden onset disasters. Accessed 26 September 2017
Grant, D. B., Wong, C. Y., & Trautrims, A. (2017). Sustainable Logistics and Supply Chain
Management: Principles and Practices for Sustainable Operations and Management. Kogan Page
Publishers.
Grenade, M. (2015, September). IFRC Global Logistics Service - Colombia. Panamá.
Gruber, T. R. (1993). A translation approach to portable ontology specifications. Knowledge
acquisition, 5(2), 199–220.
Grubic, T., & Fan, I.-S. (2010). Supply chain ontology: Review, analysis and synthesis.
Computers in Industry, 61(8), 776–786.
Guizzardi, G. (2005). Ontological Foundations for Structural Conceptual Models. Universiteit
Twente, Enschede. Retrieved from http://doc.utwente.nl/50826/1/thesis_Guizzardi.pdf
164
Gunasekaran, A., & Kobu, B. (2007). Performance measures and metrics in logistics and
supply chain management: a review of recent literature (1995–2004) for research and
applications. International Journal of Production Research, 45(12), 2819–2840.
Haavisto, I., & Kovács, G. (2014). Perspectives on sustainability in humanitarian supply
chains. Disaster Prevention and Management: An International Journal, 23(5), 610–631.
Hart, S. L. (1996). Beyond greening- Strategies for a Sustainable World. Harvart Business Review,
66–78.
Hausladen, I., & Haas, A. (2013). Considering Sustainability in the Context of Hu-manitarian
Logistics. In Managing Humanitarian Supply Chains (pp. 314–329). DVV Media Group GbbH.
Accessed 14 April 2016
Hella Abidi, Sander de Leeuw, & Matthias Klumpp. (2014). Humanitarian supply chain
performance management: a systematic literature review. Supply Chain Management: An
International Journal, 19(5/6), 592–608.
Henderson-Sellers, B. (2011). Bridging metamodels and ontologies in software engineering.
Journal of Systems and Software, 84(2), 301–313.
Henderson-Sellers, B., & Bulthuis, A. (2012). Object-Oriented Metamethods. Springer Science &
Business Media.
Hervani, A. A., Helms, M. M., & Sarkis, J. (2005). Performance measurement for green supply
chain management. Benchmarking: An International Journal, 12(4), 330–353.
Holguín-Veras, J., Jaller, M., Van Wassenhove, L. N., Pérez, N., & Wachtendorf, T. (2012).
On the unique features of post-disaster humanitarian logistics. Journal of Operations Management,
30(7–8), 494–506.
Holguín-Veras, J., Pérez, N., Jaller, M., Van Wassenhove, L. N., & Aros-Vera, F. (2013). On
the appropriate objective function for post-disaster humanitarian logistics models. Journal of
Operations Management, 31(5), 262–280.
Holmström, J., Ketokivi, M., & Hameri, A.-P. (2009). Bridging Practice and Theory: A Design
Science Approach. Decision Sciences, 40(1), 65–87.
Huan, S. H., Sheoran, S. K., & Wang, G. (2004). A review and analysis of supply chain
operations reference (SCOR) model. Supply Chain Management: An International Journal, 9(1), 23–
29.
Humanitarian Coalition. (2015, May 6). Humanitarian Needs. Text.
Humphries, V. (2013). Improving Humanitarian Coordination: Common Challenges and
Lessons Learned from the Cluster Approach | The Journal of Humanitarian Assistance. The
Journal of Humanitarian Assistance. Accessed 8 October 2014
IFRC. (2013). Global Logistic Services Annual Report. IFRC.
IFRC. (2014). Global Logistic Services Annual Report. IFRC.
Imran, M., Elbassuoni, S., Castillo, C., Diaz, F., & Meier, P. (2013). Extracting information

165
nuggets from disaster-related messages in social media. In ISCRAM (pp. 791–800). Baden-
Baden.
Jahre, M. (2008). The organisational change of logistics in International Federation of the Red Cross and
Red Crescent Societies (Case Study). HUMLOG-NET Project. Accessed 11 June 2015
Jamali, D., Safieddine, A. M., & Rabbath, M. (2008). Corporate Governance and Corporate
Social Responsibility Synergies and Interrelationships. Corporate Governance: An International
Review, 16(5), 443–459.
Järvinen, P. (2007). Action Research is Similar to Design Science. Quality & Quantity, 41(1),
37–54.
Jiang, Z., Lamothe, J., & Bénaben, F. (2016). Meta-Modeling of Collaborative Supply Chain.
In Enterprise Interoperability VII (pp. 307–320). Springer, Cham. Accessed 17 December 2017
Jüttner, U., Peck, H., & Christopher, M. (2003). Supply chain risk management: outlining an
agenda for future research. International Journal of Logistics Research and Applications, 6(4), 197–
210.
Kleindorfer, P. R., Singhal, K., & Van Wassenhove, L. N. (2005). Sustainable Operations
Management. Production and Operations Management, 14(4), 482–492.
Klumpp, M., De Leeuw, S., Regattieri, A., & de Souza, R. (2015). Humanitarian Logistics and
Sustainability. Springer. Accessed 13 November 2015
Kovács, G., Spens, K., & Haavisto, I. (2016). Supply Chain Management for Humanitarians: Tools
for Practice. Kogan Page Publishers.
Kovács, G., & Spens, K. M. (2007). Humanitarian logistics in disaster relief operations.
International Journal of Physical Distribution & Logistics Management, 37(2), 99–114.
Kovács, G., & Spens, K. M. (2011). Trends and developments in humanitarian logistics – a
gap analysis. International Journal of Physical Distribution & Logistics Management, 41(1), 32–45.
Kovács, G., & Spens, K. M. (Eds.). (2012). Relief Supply Chain Management for Disasters:
Humanitarian, Aid and Emergency Logistics. IGI Global. http://services.igi-
global.com/resolvedoi/resolve.aspx?doi=10.4018/978-1-60960-824-8. Accessed 17
December 2017
Kunz, N., & Gold, S. (2017). Sustainable humanitarian supply chain management – exploring
new theory. International Journal of Logistics Research and Applications, 1–20.
Kunz, N., Wassenhove, L. N. V., Besiou, M., Hambye, C., & Kovács, G. (2017). Relevance of
humanitarian logistics research: best practices and way forward. International Journal of
Operations & Production Management, 37(11), 1585–1599.
Kurnia, S., Rahim, M. M., Samson, D., & Prakash, S. (2014). Sustainable Supply Chain
management capability maturity: framework development and initial evaluation. ECIS 2014
Proceedings.
Laguna Salvadó, L., Lauras, M., Comes, T., & Grenade, M. (2016). A study on the sub-

166
regionalization of Humanitarian Supply Chain: the IFRC case. In Proceedings of the International
Conference on Information Systems for Crisis Response and Management. Presented at the ISCRAM
2016, Rio de Janeiro.
Laguna Salvadó, L., Lauras, M., Comes, T., & Van de Walle, B. (2015). Towards More
Relevant Research on Humanitarian Disaster Management Coordination. Presented at the
ISCRAM 2015 Conference, Kristiansand.
Laguna Salvadó, Laura, Lauras, M., & Comes, T. (2015). Humanitarian Value Stream
Mapping: Application to the EBOLA Outbreak. Presented at the 12th International
Conference on Information Systems for Crisis Response and Management, Kristiansand
(Norwey).
Lauras, M. (2004). Méthodes de diagnostic et d’évaluation de performance pour la gestion de chaînes
logistiques: application à la coopération maison-mère–filiales internationales dans un groupe pharmaceutique et
cosmétique. Institut National Polytechnique de Toulouse.
Lauras, M., Bénaben, F., Truptil, S., Lamothe, J., Macé-Ramète, G., & Montarnal, A. (2014).
A meta-ontology for knowledge acquisition and exploitation of collaborative social systems.
In Behavior, Economic and Social Computing (BESC), 2014 International Conference on (pp. 1–7).
IEEE.
Lauras, M., Truptil, S., & Bénaben, F. (2015). Towards a better management of complex
emergencies through crisis management meta-modelling. Disasters, 39(4), 687–714.
Laurencelle, L. (2005). Abrégé sur les méthodes de recherche et la recherche expérimentale (PUQ.).
Liu, S., Duffy, A. H. B., Whitfield, R. I., & Boyle, I. M. (2010). Integration of decision support
systems to improve decision support performance. Knowledge and Information Systems, 22(3),
261–286.
Macé-Ramete, G., Lauras, M., Benaben, F., & Lamothe, J. (2012). A collaborative information
system supporting decision and coordination in transport crisis context. In 9th International
Conference on Modeling, Optimization & SIMulation.
Mebratu, D. (1998). Sustainability and sustainable development: historical and conceptual
review. Environmental impact assessment review, 18(6), 493–520.
Meiginien, B. (2014). Guide méthodologique Transport de marchandises - Caractéristiques de l’offre et
capacité des modes de transport (2nd ed.). Paris: Cerema.
Milne, M. J., & Gray, R. (2013). W(h)ither Ecology? The Triple Bottom Line, the Global
Reporting Initiative, and Corporate Sustainability Reporting. Journal of Business Ethics, 118(1),
13–29.
Min, H., & Zhou, G. (2002). Supply chain modeling: past, present and future. Computers &
Industrial Engineering, 43(1–2), 231–249. doi:10.1016/S0360-8352(02)00066-9
Müller, M. (2005). Action research in supply chain management–an introduction. Research
methodologies in supply chain management, 349–364.
Murphy, P. R., & Poist, R. F. (2003). Green perspectives and practices: a “comparative

167
logistics” study. Supply Chain Management: An International Journal, 8(2), 122–131.
Okongwu, U., Morimoto, R., & Lauras, M. (2013). The maturity of supply chain sustainability
disclosure from a continuous improvement perspective. International Journal of Productivity and
Performance Management, 62(8), 827–855.
Oloruntoba, R. (2015). Chapter 3: A Planning and Decision-Making Framework for
Sustainable Humanitarian Logistics in Disaster Response. In Humanitarian Logistics and
Sustainability. Springer.
Oloruntoba, R., & Gray, R. (2009). Humanitarian aid: an agile supply chain? International
Journal of Physical Distribution & Logistics Management, 39(6), 486–505.
Othman, S. H., & Beydoun, G. (2010). A Disaster Management Metamodel (DMM)
Validated. In B.-H. Kang & D. Richards (Eds.), Knowledge Management and Acquisition for Smart
Systems and Services (pp. 111–125). Springer Berlin Heidelberg.
Paulk, M. C., Curtis, B., Chrissis, M. B., & Weber, C. V. (1993). Capability maturity model,
version 1.1. IEEE Software, 10(4), 18–27.
Pearce, L. D. R. (2000). An integrated approach for community hazard, impact, risk and vulnerability
analysis: HIRV. The University of British Columbia.
Pettit, S., & Beresford, A. (2009). Critical success factors in the context of humanitarian aid
supply chains. International Journal of Physical Distribution & Logistics Management, 39(6), 450–468.
Pojasek, R. B. (2012). Understanding sustainability: An organizational perspective.
Environmental Quality Management, 21(3), 93–100.
Rastegar, N., & Khorram, E. (2014). Relaxation of constraints in lexicographic multiobjective
programming problems. Optimization: A Journal of Mathematical Programming and Operations
Research, 64(10), 2111–2129.
Reefke, Ahmed, & Sundaram. (2014). Sustainable Supply Chain Management—Decision
Making and Support: The SSCM Maturity Model and System. Global Business Review,
15(4_suppl), 1S–12S.
Rentmeesters, M. J., Tsai, W. K., & Lin, K.-J. (1996). A theory of lexicographic multi-criteria
optimization. In Engineering of Complex Computer Systems, 1996. Proceedings., Second IEEE
International Conference on (pp. 76–79). IEEE.
Ripple, W. J., Wolf, C., Newsome, T. M., Galetti, M., Alamgir, M., Crist, E., et al. (2017).
World Scientists’ Warning to Humanity: A Second Notice. BioScience.
Robinson, J. (2004). Squaring the circle? Some thoughts on the idea of sustainable
development. Ecological Economics, 48(4), 369–384.
Rodrigues da Silva, A. (2015). Model-driven engineering: A survey supported by the unified
conceptual model. Computer Languages, Systems & Structures, 43, 139–155.
Rudberg, M., & Thulin, J. (2009). Centralised supply chain master planning employing
advanced planning systems. Production Planning & Control, 20(2), 158–167.

168
Santiteerakul, S., Sekhari, A., Bouras, A., & Sopadang, A. (2015). Sustainability Performance
Measurement Framework for Supply Chain Management. ResearchGate. Accessed 13
December 2016
Sarkis, J., Spens, K. M., & Kovács, G. (2012). Chapter 11: A Study of Barriers to Greening the
Relief Supply Chain. In Relief supply chain management for disasters: humanitarian aid and emergency
logistics. Hershey, PA: Information Science Reference.
Savitz, A. (2012). The Triple Bottom Line: How Today’s Best-Run Companies Are Achieving Economic,
Social and Environmental Success -- and How You Can Too. John Wiley & Sons.
Seuring, S., & Müller, M. (2005). Is there a right research design for your supply chain study?
In Research Methodologies in Supply Chain Management (pp. 1–12). Springer.
Seuring, S., & Müller, M. (2008). Core issues in sustainable supply chain management - a
Delphi study. Business Strategy and the Environment, 17(8), 455–466. doi:10.1002/bse.607
Sherali, H. D. (1982). Equivalent weights for lexicographic multi-objective programs:
Characterizations and computations. European Journal of Operational Research, 11(4), 367–379.
Sisco, C., Chorn, B., & Pruzan-Jorgensen, P. M. (2015). Supply Chain Sustainability, a practical
guide for continuous improvement. UN Global Compact. Accessed 16 November 2017
Srai, Alinaghian, & Kirkwood. (2013). Understanding sustainable supply network capabilities
of multinationals: A capability maturity model approach. Proceedings of the Institution of Mechanical
Engineers, Part B: Journal of Engineering Manufacture, 227(4), 595–615.
Sridhar, K., & Jones, G. (2013). The three fundamental criticisms of the Triple Bottom Line
approach: An empirical study to link sustainability reports in companies based in the Asia-
Pacific region and TBL shortcomings. Asian Journal of Business Ethics, 2(1), 91–111.
Stadtler, H. (2005). Supply chain management and advanced planning––basics, overview and
challenges. European Journal of Operational Research, 163(3), 575–588.
Stadtler, H., & Kilger, C. (Eds.). (2005). Supply chain management and advanced planning: concepts,
models, software and case studies (3rd ed.). Berlin ; New York: Springer.
Sundarakani, B., de Souza, R., Goh, M., Wagner, S. M., & Manikandan, S. (2010). Modeling
carbon footprints across the supply chain. International Journal of Production Economics, 128(1),
43–50.
Swithern, S., Sardiwal, D., & GHA, team. (2015). Global Humanitarian Assitance report 2015.
Global Humanitarian Assitance.
Taticchi, P., Garengo, P., Nudurupati, S. S., Tonelli, F., & Pasqualino, R. (2015). A review of
decision-support tools and performance measurement and sustainable supply chain
management. International Journal of Production Research, 53(21), 6473–6494.
Taylor, D., & Pettit, S. (2009). A consideration of the relevance of lean supply chain concepts
for humanitarian aid provision. International Journal of Services Technology and Management, 12(4),
430–444.

169
Tomasini, R. M., & Van Wassenhove, L. N. (2009). From preparedness to partnerships: case
study research on humanitarian logistics. International Transactions in Operational Research, 16(5),
549–559.
Tzur, M. (2016, March 5). The humanitarian pickup and distribution problem. Presented at the
EuroHope mini-conference, Hamburg.
UCSUSA. (2016). Hurricanes and Climate Change. Union of Concerned Scientists. Accessed 26
September 2017
UNISDR. (2009). Terminology on Disaster Risk Reduction. Accessed 24 September 2017
United Nations. (2011). OCHA and Slow Onset Emergencies. UN OCHA.
United Nations. (2015). Sendai Framework for Disaster Risk Reduction 2015 - 2030.
Uschold, M., & Gruninger, M. (1996). Ontologies: Principles, methods and applications. The
knowledge engineering review, 11(2), 93–136.
Van de Walle, B., & Comes, T. (2014). Risk Accelerators in Disasters; Insights from the
Typhoon Haiyan Response on Humanitarian Information Management and Decision
Support. Disaster Resiliance Lab.
Van Kempen, E. A., Spiliotopoulou, E., Stojanovski, G., & de Leeuw, S. (2017). Using life
cycle sustainability assessment to trade off sourcing strategies for humanitarian relief items.
The International Journal of Life Cycle Assessment, 22(11), 1718–1730.
Van Wassenhove, L. N. (2006). Humanitarian aid logistics: supply chain management in high
gear†. Journal of the Operational Research Society, 57(5), 475–489.
Van Wassenhove, L. N., & Pedraza Martinez, A. J. (2012). Using OR to adapt supply chain
management best practices to humanitarian logistics. International Transactions in Operational
Research, 19(1–2), 307–322.
Vargas Florez, J., Lauras, M., Okongwu, U., & Dupont, L. (2015). A decision support system
for robust humanitarian facility location. Engineering Applications of Artificial Intelligence, 46, 326–
335.
Veleva, V., & Ellenbecker, M. (2001). Indicators of sustainable production: framework and
methodology. Journal of Cleaner Production, 9(6), 519–549.
Virakul, B. (2015). Global challenges, sustainable development, and their implications for
organizational performance. European Business Review, 27(4), 430–446.
Wei, X., Al-Refaie, A., Robles, M., & Noche, B. (2015). Chapter 11: A Sustainable
Humanitarian Relief Network Study for the Wenchuan Earthquake. In Humanitarian Logistics
and Sustainability (pp. 195–215). Springer.
Widera, A., Dietrich, H.-A., Hellingrath, B., & Becker, J. (2013). Understanding Humanitarian
Supply Chains–Developing an Integrated Process Analysis Toolkit. In 10th International
ISCRAM Conference. Presented at the Information Systems for Crisis Response and
Management, Baden-Baden.

170
Wray, K. H., Zilberstein, S., & Mouaddib, A.-I. (2015). Multi-Objective MDPs with
Conditional Lexicographic Reward Preferences. In Twenty-Ninth AAAI Conference on Artificial
Intelligence (pp. 3418–3424). Presented at the AAAI, Austin, Texas, USA: AAAI Press.
Zechtar, R., Kerr, T., Kossoy, A., Oppermann, K., Peszko, G., Ramstein, C., & Pritz, N.
(2016). State and Trends of Carbon Pricing 2016. Washington: World Bank, Ecofys and Vivid
Economics.
Zhou, H., Benton, W. C., Schilling, D. A., & Milligan, G. W. (2011). Supply Chain Integration
and the SCOR Model. Journal of Business Logistics, 32(4), 332–344.

171
LIST OF FIGURES
Figure 1 People targeted by humanitarian aid in the last decade (OCHA, 2017) ...................................... 21
Figure 2 Atlantic Hurricanes trends (UCSUSA 2016) ................................................................................... 21
Figure 3 Trend of global displacement & proposition displaced 1997-2016 (UNHCR, 2017) ............... 22
Figure 4 Disaster Management Cycle (Haddow and Bullock, 2004) ........................................................... 23
Figure 5 The Humanitarian Decision-makers Taxonomy (Gralla et al. 2013) .......................................... 25
Figure 6 UN clusters coordination approach .................................................................................................. 27
Figure 7 HSC network (inspired from (Baharmand et al. 2015) .................................................................. 28
Figure 8 Inter-agency appeals: funding requested and people targeted (OCHA, 2017) ........................... 32
Figure 9 Requirements, funding and unmet requirements (source: Global Humanitarian Assistance
report 2016) ................................................................................................................................................. 32
Figure 10 Evolution of the HSC performance expectations ........................................................................ 35
Figure 11 The Red Cross and Red Crescent International Mouvement ..................................................... 39
Figure 12 Linear sub-regional design ................................................................................................................ 40
Figure 13 Emergency appeal and DREF 2001-2015 (source: IFRC PADRU, 2015) ............................... 41
Figure 14 Logistic services provided by the IFRC (Grenade 2015) ............................................................ 42
Figure 15 The general methodology of design research (Järvinen 2007) .................................................... 44
Figure 16 Research methodology overview ..................................................................................................... 44
Figure 17 Manuscript Big Picture ...................................................................................................................... 47
Figure 18 Chapter 2 research positioning ........................................................................................................ 49
Figure 19 Adapted from Ullman’s triangle ...................................................................................................... 50
Figure 20 A metamodel as an explicit representation of a domain (inspired from Guizzardi 2005) ..... 52
Figure 21 The Humanitarian Supply Chain domain....................................................................................... 53
Figure 22 Blecken reference task framework model (Blecken 2010) .......................................................... 54
Figure 23 Structuration of collaboration metamodel (Lauras et al. 2014) .................................................. 57
Figure 24 The HSC metamodel layer positioning........................................................................................... 59
Figure 25 Actors in the supply network of humanitarian aid from (Kovács and Spens 2007) ............... 62
Figure 26 A ‘field ordering’ process model example (Blecken, 2010) ......................................................... 64
Figure 27 VSM example: “VSM for the PPE value chain” (Salvadó et al. 2015) ...................................... 65
Figure 28 HSC layered metamodel structure inspired on (Lauras et al. 2014) ........................................... 65
Figure 29 UML Relationship between classes used on the HSC metamodel ............................................ 67

172
Figure 30 HSC Context Package ....................................................................................................................... 68
Figure 31 Objectives Package ............................................................................................................................ 70
Figure 32 HSC Partner’s package ...................................................................................................................... 71
Figure 33 HSC Behaviour Package ................................................................................................................... 72
Figure 34 HSC metamodel contribution .......................................................................................................... 73
Figure 35 HSC metamodel use within the diagnosis method ....................................................................... 74
Figure 36 HSC metamodel use within the DMAIC methode ...................................................................... 75
Figure 37 HSC metamodel use within Information Systems design ........................................................... 76
Figure 38 HSC metamodel use within the coordination methode .............................................................. 77
Figure 39 Metamodel use for A&C RLU diagnosis ....................................................................................... 78
Figure 40 From the metamodel concepts & field research plan, to the field research supports ............ 79
Figure 41 Example of the workflow grid to support the field interview protocol .................................... 83
Figure 42 Linear sub-regional design ................................................................................................................ 84
Figure 43 IFRC sub-regionalization SWOT analyse ...................................................................................... 85
Figure 44 Sub-regional coordinated response ................................................................................................. 87
Figure 45 UN Sustainable development goals ................................................................................................ 92
Figure 46 TBL dimensions ................................................................................................................................. 93
Figure 47 Sustainability with an organizational perspective (Pojasek 2012) ............................................... 93
Figure 48 Sustainable SC performance WoS publications evolution .......................................................... 96
Figure 49 The House of HSC Sustainable Operations ................................................................................ 106
Figure 50 Illustration of HSC operations sustainability conceptual “disequilibrium” ............................ 107
Figure 51 A balanced SHSC performance ..................................................................................................... 107
Figure 52 HSC sustainable performance maturity levels ............................................................................. 108
Figure 53 SHSC Maturity assessment methode ............................................................................................ 109
Figure 54 Gini Index ......................................................................................................................................... 114
Figure 55 A&C RLU SHSC sub-dimensions performance maturity level (radar graph) ....................... 117
Figure 56 A&C RLU SHSC performance maturity level ............................................................................ 117
Figure 57 Commercial SC planning matrix (Adapted from Stadtler, 2005) ............................................. 121
Figure 58 SHSC Master Planning Module in the Blecken (2010) reference task framework model.... 123
Figure 59 ILOM algorithm for SHSC Master Planning .............................................................................. 131
Figure 60 SHSC Master Planning problem network elements ................................................................... 132
Figure 61 Sub-regional coordinated response ............................................................................................... 141
Figure 62 Geographical locations of local suppliers, SRLU/RLU and customers ................................. 142

173
Figure 63 Master Planning Rolling horizon ................................................................................................... 143
Figure 64 Demand versus capacity per week ................................................................................................ 144
Figure 65 First iteration output: Economy indicator vs. Effectiveness Tolerance variation ................. 146
Figure 66 Second iteration output: Social indicator vs. Economy Tolerance variation ......................... 146
Figure 67 Third iteration output: Environment indicator vs. Social Tolerance variation ...................... 147
Figure 68 Variation of the TBL indicators (LO1) while varying effectiveness tolerance ....................... 149
Figure 69 Perspective: Planning decision levels and tasks integration ...................................................... 157
Figure 70 Perspective : Upstream and downstream integration ................................................................. 157

174

175
LIST OF TABLES
Table 1 Examples of Humanitarian Disaster classification by hazard typology ........................................ 20
Table 2 Coordination Barriers and enablers to implement collaboration networks involving
humanitarian organizations on a local level (Charles et al. 2010) ....................................................... 26
Table 3 Barriers and enablers to implement collaboration networks involving HOs on a global level
(Charles et al. 2010) ................................................................................................................................... 26
Table 4 SC metamodels gaps, consequences and relevance for the HSC domain .................................... 55
Table 5 Humanitarian SC performance enablers (Dubey and Gunasekaran 2016) ................................ 100
Table 6 Economy sub-dimensions, definitions and criteria ........................................................................ 103
Table 7 Environmental footprint of the HSC schema, inspired from (Hervani et al. 2005) ................. 103
Table 8 Environment sub-dimensions, definitions and criteria ................................................................. 104
Table 9 Social sub-dimensions, definitions and criteria ............................................................................... 105
Table 10 Sustainability performance metrics par dimension ...................................................................... 110
Table 11 SHSC performance assessment grid ............................................................................................... 112
Table 12 Data set to assess effectiveness ....................................................................................................... 113
Table 13 Data set to assess efficiency ............................................................................................................. 114
Table 14 Local procurement data set .............................................................................................................. 115
Table 15 Illustrative assessment of the A&C RLU ...................................................................................... 116
Table 16 SHSC Sub-dimensions selection ..................................................................................................... 127
Table 17 Sustainability performance measures and indicators ................................................................... 128
Table 18 Model parameters .............................................................................................................................. 145
Table 19 Results of the Master Planning Indicators .................................................................................... 147
Table 20 SHSC Master Planning case flows allocation sample .................................................................. 148
Table 21 Experimental Plan Lexicographic Orders ..................................................................................... 148
Table 22 Experimental Plan (for a: tolerance = 0, and for b: tolerance = 1%) ....................................... 150

176

177
LIST OF ABBREVIATIONS
APS Advance Planning System
A&C RLU American & Caribbean Regional Logistic Unit (IFRC)
BPM Business Process Modeling
BPMN Business Process Modeling Notation
ERP Enterprise Resource Planning
GRI Global Reporting Initiative
LCA Life Cycle Assessment
LCSA Life Cycle Social Assessment
LOM Lexicographic Optimization Method
LU Logistic Unit
HO Humanitarian Organization
HSC Humanitarian Supply Chain
SHSC Sustainable Humanitarian Supply Chain
IASC Inter-Agency Standing Committee
ICRC International Committee of the Red Cross and the Red Crescent
ILOM Interactive Lexicographic Optimization Method
IFRC International Federation of the Red Cross and the Red Crescent
LO Lexicographic Order
MSF Médecins Sans Frontières / Doctors Without Borders
NGO Non Governmental Organization
NS Red Cross and Red Crescent National Society
OF Optimization Function
OR Operational Research
PADRU Pan American Disaster Response Unit
RLU Regional Logistic Unit
SC Supply Chain
SCM Supply Chain Management
SCOR Supply Chain Operations Reference
SSCM Sustainable Supply Chain Management
TBL Triple Bottom Line

178
UNDP United Nations Humanitarian Development Programme
UNHRD United Nations Humanitarian Response Depots
UNOCHA United Nations Coordination of Humanitarian Affairs
UNISDR United Nations International Strategy for Disaster Reduction
UN United Nations
VSM Value Stream Mapping
WFP World Food Programme
3PL Third Party Logistics

179
APPENDIX A. INVENTORY AT THE A&C RLU
(September 2015)
RL
U-
Panam
aG
uate
mala
Nic
ara
gua
Hondu
ras
Ecu
ador
Sta
ndard
ite
ms
Qty
.V
alu
eQ
ty.2
Valu
e3Q
ty.3
Valu
e4Q
ty.4
Valu
e5Q
ty.5
Valu
e6
Bla
nke
t lig
ht
ther
mal
21003
87582.5
12025
10003.5
5000
23950
2500
11861.7
55000
Bla
nke
t m
ediu
m t
her
mal
4443
17389.7
22500
12950
Buck
et p
last
ic5281
15853.1
2500
1757.5
0
Fam
ily t
ent
316
112173.7
450
15061.5
Hyg
ien
e kit
2451
43241.0
4275
6437.7
5850
19771
1000
23240
1000
Jerr
ycan
00
00
1700
4726
2000
5539.6
82000
Kit
chen
set
6436
140695.2
8275
5898.7
5850
19541.5
1000
22970
1000
Mo
squit
o n
et2200
5544
1000
3550
2000
5760
2000
5720
2000
Sh
elte
r to
ol kit
4732
124956.9
6500
11435
250
7041.0
9500
Tar
pau
lin8395
105329.2
20
01550
16910.5
2000
21780
1000
To
tal o
f p
er c
oun
try
(CH
F)
652765.5
939082.5
90659
126164.0
2
Tota
l
Qty
.V
alu
e
35528
133397.7
6
6943
30339.7
2
5781
17610.6
2
366
127235.2
4
5576
92689.7
9
5700
10265.6
8
9561
189105.5
3
9200
20574
5982
143433.0
5
12945
144019.7
2
908671.1
1
Hold
ing c
ost
s (1
0%
)90
867.
111

180
APPENDIX B. USE CASE INPUT DATA SAMPLES
a) Suppliers Data
b) Inventory input data of LUs and the RLU
#Supplier Typology
Supplier I temFactory price par
unit (CH F)Supply capacity
par week
1001 International Relief Supplier A Blanket light thermal 6 12000
1002 International Relief Supplier B Blanket light thermal 5 13750
1003 International Relief Supplier C Blanket light thermal 7 9900
1006 International Relief Supplier D Family tent 150 2000
1009 International Relief Supplier E Family tent 160 2000
1009 International Relief Supplier E Blanket light thermal 6 1200
1010 International Relief Supplier F Family tent 170 3000
1011 International Relief Supplier G Blanket light thermal 6 5000
1012 Regional Panama Supplier Blanket light thermal 8 6000
1012 Regional Panama Supplier Family tent 300 1000
1013 Local Nicaragua Supplier Family tent 250 500
1014 Local Colombia Supplier Family tent 250 500
1014 Local Colombia Supplier Blanket light thermal 7 5000
1015 Local Honduras Supplier Blanket light thermal 7 5000
1016 Local Guatemala Supplier Blanket light thermal 7 5000
1017 Local Dominican Rep Supplier Blanket light thermal 7 5000
1018 Local Costa Rica Supplier Blanket light thermal 7 5000
1013 Local Nicaragua Supplier Blanket light thermal 7 5000
# National Society Blanket
Contingency StockFamily tent
Contingency Stock
1 2001 RLU Panama 40000 10000
2 2002 LU Colombia 20000 5000
3 2003 LU Nicaragua 8000 2000
4 2004 LU Honduras 20000 5000
5 2005 LU FR Guadelpoue 20000 5000
6 2006 LU Guatemala 8000 2000
7 2007 LU Dominican Rep 8000 2000
8 2008 LU Costa Rica 8000 2000

181
c) Demand input data

182
1d) Flows input data from suppliers to RLU and LUs
Times
#Origin #Destination ModeLead-time
(week)Product
Environmental
cost (CHF) /unit
Economic cost
(CHF)/unit
Local origin?
(1=Yes)1 2
fori fdes ftlt fenv fcost fsoc f exp
1001 2001 Sea 3 Blanket 0.0182 5.011 0 0 0
1012 2001 Road 0 Blanket 0.0004 8.005 1 0 0
1002 2001 Sea 5 Blanket 0.0155 5.010 0 0 0
1012 2001 Road 0 Family tent 0.0359 320.440 1 0 0
1006 2001 Sea 3 Family tent 1.6066 221.001 0 0 0
1009 2001 Sea 3 Family tent 1.4618 240.911 0 0 0
1009 2001 Sea 3 Blanket 0.0165 5.010 0 0 0
1010 2001 Air 0 Family tent 105.2700 369.500 0 0 0
1003 2001 Sea 4 Blanket 0.0091 5.006 0 0 0
1011 2001 Air 0 Blanket 1.1867 6.798 0 0 0
1013 2003 Road 0 Blanket 0.0003 7.503 1 0 0
1014 2002 Road 0 Family tent 0.0224 300.275 1 0 0
1013 2003 Road 0 Family tent 0.0224 300.275 1 0 0
1014 2002 Road 0 Blanket 0.0003 7.503 1 0 0
1015 2004 Road 0 Blanket 0.0003 7.503 1 0 0
1016 2006 Road 0 Blanket 0.0003 7.503 1 0 0
1017 2007 Road 0 Blanket 0.0003 7.503 1 0 0
1018 2008 Road 0 Blanket 0.0003 7.503 1 0 0
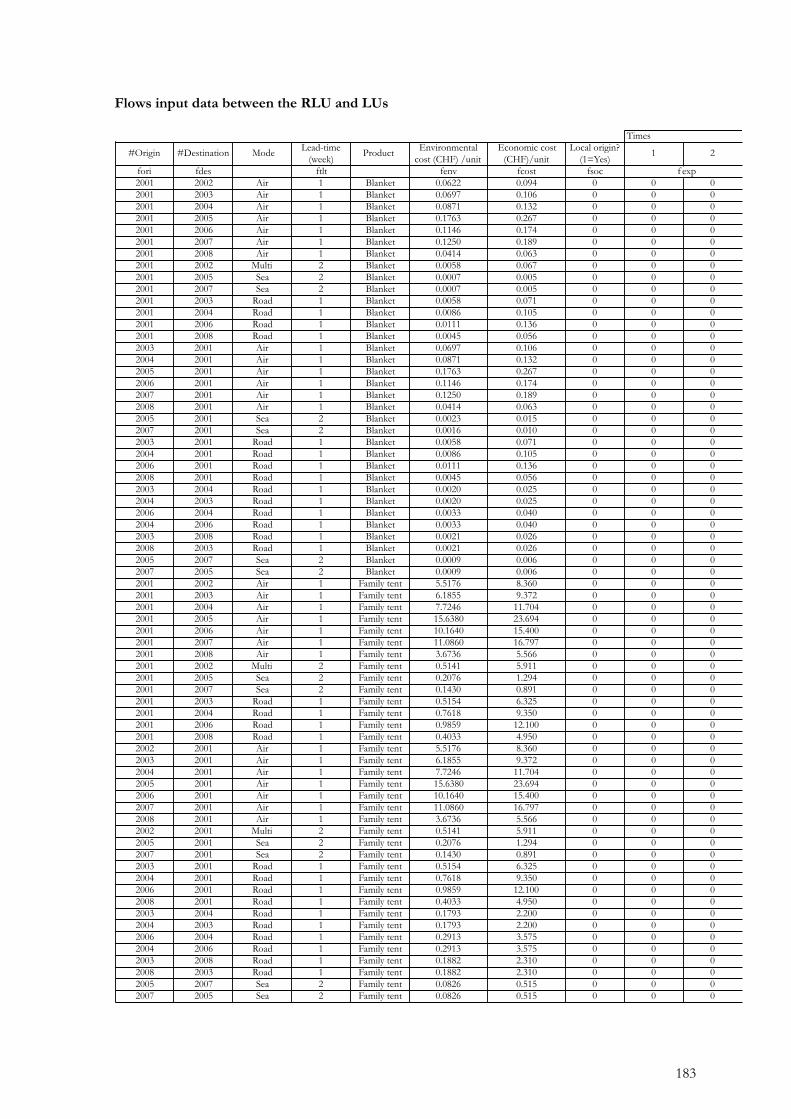
183
Flows input data between the RLU and LUs
Times
#Origin #Destination ModeLead-time
(week)Product
Environmental
cost (CHF) /unit
Economic cost
(CHF)/unit
Local origin?
(1=Yes)1 2
fori fdes ftlt fenv fcost fsoc f exp
2001 2002 Air 1 Blanket 0.0622 0.094 0 0 0
2001 2003 Air 1 Blanket 0.0697 0.106 0 0 0
2001 2004 Air 1 Blanket 0.0871 0.132 0 0 0
2001 2005 Air 1 Blanket 0.1763 0.267 0 0 0
2001 2006 Air 1 Blanket 0.1146 0.174 0 0 0
2001 2007 Air 1 Blanket 0.1250 0.189 0 0 0
2001 2008 Air 1 Blanket 0.0414 0.063 0 0 0
2001 2002 Multi 2 Blanket 0.0058 0.067 0 0 0
2001 2005 Sea 2 Blanket 0.0007 0.005 0 0 0
2001 2007 Sea 2 Blanket 0.0007 0.005 0 0 0
2001 2003 Road 1 Blanket 0.0058 0.071 0 0 0
2001 2004 Road 1 Blanket 0.0086 0.105 0 0 0
2001 2006 Road 1 Blanket 0.0111 0.136 0 0 0
2001 2008 Road 1 Blanket 0.0045 0.056 0 0 0
2003 2001 Air 1 Blanket 0.0697 0.106 0 0 0
2004 2001 Air 1 Blanket 0.0871 0.132 0 0 0
2005 2001 Air 1 Blanket 0.1763 0.267 0 0 0
2006 2001 Air 1 Blanket 0.1146 0.174 0 0 0
2007 2001 Air 1 Blanket 0.1250 0.189 0 0 0
2008 2001 Air 1 Blanket 0.0414 0.063 0 0 0
2005 2001 Sea 2 Blanket 0.0023 0.015 0 0 0
2007 2001 Sea 2 Blanket 0.0016 0.010 0 0 0
2003 2001 Road 1 Blanket 0.0058 0.071 0 0 0
2004 2001 Road 1 Blanket 0.0086 0.105 0 0 0
2006 2001 Road 1 Blanket 0.0111 0.136 0 0 0
2008 2001 Road 1 Blanket 0.0045 0.056 0 0 0
2003 2004 Road 1 Blanket 0.0020 0.025 0 0 0
2004 2003 Road 1 Blanket 0.0020 0.025 0 0 0
2006 2004 Road 1 Blanket 0.0033 0.040 0 0 0
2004 2006 Road 1 Blanket 0.0033 0.040 0 0 0
2003 2008 Road 1 Blanket 0.0021 0.026 0 0 0
2008 2003 Road 1 Blanket 0.0021 0.026 0 0 0
2005 2007 Sea 2 Blanket 0.0009 0.006 0 0 0
2007 2005 Sea 2 Blanket 0.0009 0.006 0 0 0
2001 2002 Air 1 Family tent 5.5176 8.360 0 0 0
2001 2003 Air 1 Family tent 6.1855 9.372 0 0 0
2001 2004 Air 1 Family tent 7.7246 11.704 0 0 0
2001 2005 Air 1 Family tent 15.6380 23.694 0 0 0
2001 2006 Air 1 Family tent 10.1640 15.400 0 0 0
2001 2007 Air 1 Family tent 11.0860 16.797 0 0 0
2001 2008 Air 1 Family tent 3.6736 5.566 0 0 0
2001 2002 Multi 2 Family tent 0.5141 5.911 0 0 0
2001 2005 Sea 2 Family tent 0.2076 1.294 0 0 0
2001 2007 Sea 2 Family tent 0.1430 0.891 0 0 0
2001 2003 Road 1 Family tent 0.5154 6.325 0 0 0
2001 2004 Road 1 Family tent 0.7618 9.350 0 0 0
2001 2006 Road 1 Family tent 0.9859 12.100 0 0 0
2001 2008 Road 1 Family tent 0.4033 4.950 0 0 0
2002 2001 Air 1 Family tent 5.5176 8.360 0 0 0
2003 2001 Air 1 Family tent 6.1855 9.372 0 0 0
2004 2001 Air 1 Family tent 7.7246 11.704 0 0 0
2005 2001 Air 1 Family tent 15.6380 23.694 0 0 0
2006 2001 Air 1 Family tent 10.1640 15.400 0 0 0
2007 2001 Air 1 Family tent 11.0860 16.797 0 0 0
2008 2001 Air 1 Family tent 3.6736 5.566 0 0 0
2002 2001 Multi 2 Family tent 0.5141 5.911 0 0 0
2005 2001 Sea 2 Family tent 0.2076 1.294 0 0 0
2007 2001 Sea 2 Family tent 0.1430 0.891 0 0 0
2003 2001 Road 1 Family tent 0.5154 6.325 0 0 0
2004 2001 Road 1 Family tent 0.7618 9.350 0 0 0
2006 2001 Road 1 Family tent 0.9859 12.100 0 0 0
2008 2001 Road 1 Family tent 0.4033 4.950 0 0 0
2003 2004 Road 1 Family tent 0.1793 2.200 0 0 0
2004 2003 Road 1 Family tent 0.1793 2.200 0 0 0
2006 2004 Road 1 Family tent 0.2913 3.575 0 0 0
2004 2006 Road 1 Family tent 0.2913 3.575 0 0 0
2003 2008 Road 1 Family tent 0.1882 2.310 0 0 0
2008 2003 Road 1 Family tent 0.1882 2.310 0 0 0
2005 2007 Sea 2 Family tent 0.0826 0.515 0 0 0
2007 2005 Sea 2 Family tent 0.0826 0.515 0 0 0

184
Flows input data from RLU and LUs to Demanding Points
Times
#Origin #Destination ModeLead-time
(week)Product
Environmental
cost (CHF) /unit
Economic cost
(CHF)/unit
Local origin?
(1=Yes)1 2
fori fdes ftlt fenv fcost fsoc f exp
2001 3005 Sea 2 Blanket 0.0010 0.006 0 0 0
2002 3005 Road 1 Blanket 0.0045 0.056 1 5000 0
2001 3008 Sea 2 Blanket 0.0016 0.010 0 0 2000
2001 3008 Air 1 Blanket 0.1115 0.169 0 0 0
2001 3008 Sea 2 Family tent 0.1430 0.891 0 0 500
2001 3008 Air 1 Family tent 9.8954 14.993 0 0 0
2001 3007 Sea 2 Blanket 0.0016 0.010 0 0 0
2001 3007 Air 1 Blanket 0.1115 0.169 0 0 0
2001 3005 Sea 2 Family tent 0.0860 0.536 0 0 0
2001 3005 Air 1 Blanket 0.0597 0.091 0 0 0
2001 3005 Air 1 Family tent 5.2998 8.030 0 0 0
2002 3005 Road 1 Family tent 0.4033 4.950 1 1000 0
2001 3007 Sea 2 Family tent 0.1430 0.891 0 0 0
2001 3007 Air 1 Family tent 9.8954 14.993 0 0 0
2007 3007 Road 1 Blanket 0.0015 0.019 1 0 0
2005 3007 Sea 2 Blanket 0.0016 0.010 0 0 0
2007 3007 Road 1 Family tent 0.1344 1.650 1 0 0
2005 3007 Sea 2 Family tent 0.1391 0.867 0 0 0
2001 3002 Air 1 Family tent 5.0820 7.700 0 0 0
2001 3003 Air 1 Family tent 5.0820 7.700 0 0 0
2001 3002 Air 1 Blanket 0.0573 0.087 0 0 0
2001 3003 Air 1 Blanket 0.0573 0.087 0 0 0
2004 3002 Road 1 Family tent 0.3137 3.850 1 0 0
2004 3003 Road 1 Family tent 0.3137 3.850 1 0 0
2004 3002 Road 1 Blanket 0.0035 0.043 1 0 0
2004 3003 Road 1 Blanket 0.0035 0.043 1 0 0
2003 3002 Road 1 Family tent 0.2317 2.844 1 0 0
2003 3003 Road 1 Family tent 0.1631 2.002 1 1000 0
2003 3004 Road 1 Blanket 0.0020 0.025 1 0 0
2006 3004 Road 1 Blanket 0.0033 0.040 0 0 0
2003 3004 Road 1 Family tent 0.1793 2.200 1 0 0
2006 3004 Road 1 Family tent 0.2913 3.575 0 0 0
2001 3004 Air 1 Blanket 0.0871 0.132 0 0 0
2001 3004 Air 1 Family tent 7.7246 11.704 0 0 0
2004 3004 Road 1 Blanket 0.0020 0.025 1 0 0
2005 3001 Sea 2 Blanket 0.0009 0.006 0 0 0
2005 3001 Sea 2 Blanket 0.0009 0.006 0 0 0
2001 3001 Sea 1 Blanket 0.0016 0.010 0 0 0
2001 3001 Sea 1 Family tent 0.1430 0.891 0 0 0
2001 3001 Air 1 Blanket 0.1250 0.189 0 0 0
2001 3001 Air 1 Family tent 11.2312 17.017 0 0 0
2007 3001 Road 1 Blanket 0.0011 0.014 1 2000 0
2007 3008 Road 2 Blanket 0.0015 0.019 1 0 0
2005 3008 Sea 2 Blanket 0.0016 0.010 0 0 0
2003 3002 Road 1 Blanket 0.0026 0.032 1 0 0
2003 3003 Road 1 Blanket 0.0018 0.023 1 5000 0
2004 3006 Road 1 Family tent 0.3137 3.850 1 0 0
2004 3006 Road 1 Blanket 0.0035 0.043 1 0 0
2006 3006 Road 1 Family tent 0.0448 0.550 0 0 0
2006 3006 Road 1 Blanket 0.0005 0.006 0 0 0
2001 3006 Air 1 Family tent 9.4380 14.300 0 0 0
2001 3006 Air 1 Blanket 0.1064 0.161 0 0 0
2007 3008 Road 2 Family tent 0.1344 1.650 1 0 0
2005 3008 Sea 2 Family tent 0.1391 0.867 0 0 0
2004 3004 Road 1 Family tent 0.1793 2.200 1 0 0
2007 3001 Road 1 Family tent 0.0986 1.210 1 500 0
2001 3004 Road 1 Blanket 0.0086 0.105 0 0 0
2001 3004 Road 1 Family tent 0.7618 9.350 0 0 0

185
APPENDIX C. USE CASE OUTPUT DATA SAMPLES
Flows result (OUT) sample from suppliers to RLU and LUs
#O
rigi
n#
Des
tin
atio
n M
ode
Pro
duct
1
23
45
67
89
10
11
12
fori
fdes
1001
2001
Sea
Bla
nket
12000
7574
00
00
00
00
00
1012
2001
Ro
adB
lan
ket
6000
3726
00
00
00
00
00
1002
2001
Sea
Bla
nket
00
00
00
00
00
00
1012
2001
Ro
adF
amily
ten
t1000
1000
1000
1000
1000
92
00
00
00
1006
2001
Sea
Fam
ily t
ent
2000
2000
2000
2000
2000
2000
2000
00
00
0
1009
2001
Sea
Fam
ily t
ent
2000
2000
2000
1101
500
00
00
00
0
1009
2001
Sea
Bla
nket
1200
1200
00
00
00
00
00
1010
2001
Air
Fam
ily t
ent
1607
00
00
00
00
00
0
1003
2001
Sea
Bla
nket
9900
9900
5200
9900
9900
00
00
00
0
1011
2001
Air
Bla
nket
5000
00
00
00
00
00
0
1013
2003
Ro
adB
lan
ket
5000
00
00
00
00
00
0
1014
2002
Ro
adF
amily
ten
t500
500
500
500
500
00
00
00
0
1013
2003
Ro
adF
amily
ten
t500
500
500
500
500
500
00
00
00
1014
2002
Ro
adB
lan
ket
2500
00
00
00
00
00
0
1015
2004
Ro
adB
lan
ket
5000
4000
00
00
00
00
00
1016
2006
Ro
adB
lan
ket
5000
5000
00
00
00
00
00
1017
2007
Ro
adB
lan
ket
5000
5000
00
00
00
00
00
1018
2008
Ro
adB
lan
ket
5000
00
00
00
00
00
0
Fo
ut
Tim
e

186
Flows result sample (IN) from suppliers to RLU and LUs
#O
rigi
n#
Des
tin
atio
n M
ode
Pro
duct
1
23
45
67
89
10
11
12
fori
fdes
1001
2001
Sea
Bla
nket
00
012000
7574
00
00
00
0
1012
2001
Ro
adB
lan
ket
6000
3726
00
00
00
00
00
1002
2001
Sea
Bla
nket
00
00
00
00
00
00
1012
2001
Ro
adF
amily
ten
t1000
1000
1000
1000
1000
92
00
00
00
1006
2001
Sea
Fam
ily t
ent
00
02000
2000
2000
2000
2000
2000
2000
00
1009
2001
Sea
Fam
ily t
ent
00
02000
2000
2000
1101
500
00
00
1009
2001
Sea
Bla
nket
00
01200
1200
00
00
00
0
1010
2001
Air
Fam
ily t
ent
1607
00
00
00
00
00
0
1003
2001
Sea
Bla
nket
00
00
9900
9900
5200
9900
9900
00
0
1011
2001
Air
Bla
nket
5000
00
00
00
00
00
0
1013
2003
Ro
adB
lan
ket
5000
00
00
00
00
00
0
1014
2002
Ro
adF
amily
ten
t500
500
500
500
500
00
00
00
0
1013
2003
Ro
adF
amily
ten
t500
500
500
500
500
500
00
00
00
1014
2002
Ro
adB
lan
ket
2500
00
00
00
00
00
0
1015
2004
Ro
adB
lan
ket
5000
4000
00
00
00
00
00
1016
2006
Ro
adB
lan
ket
5000
5000
00
00
00
00
00
1017
2007
Ro
adB
lan
ket
5000
5000
00
00
00
00
00
1018
2008
Ro
adB
lan
ket
5000
00
00
00
00
00
0
Fin
Tim
e
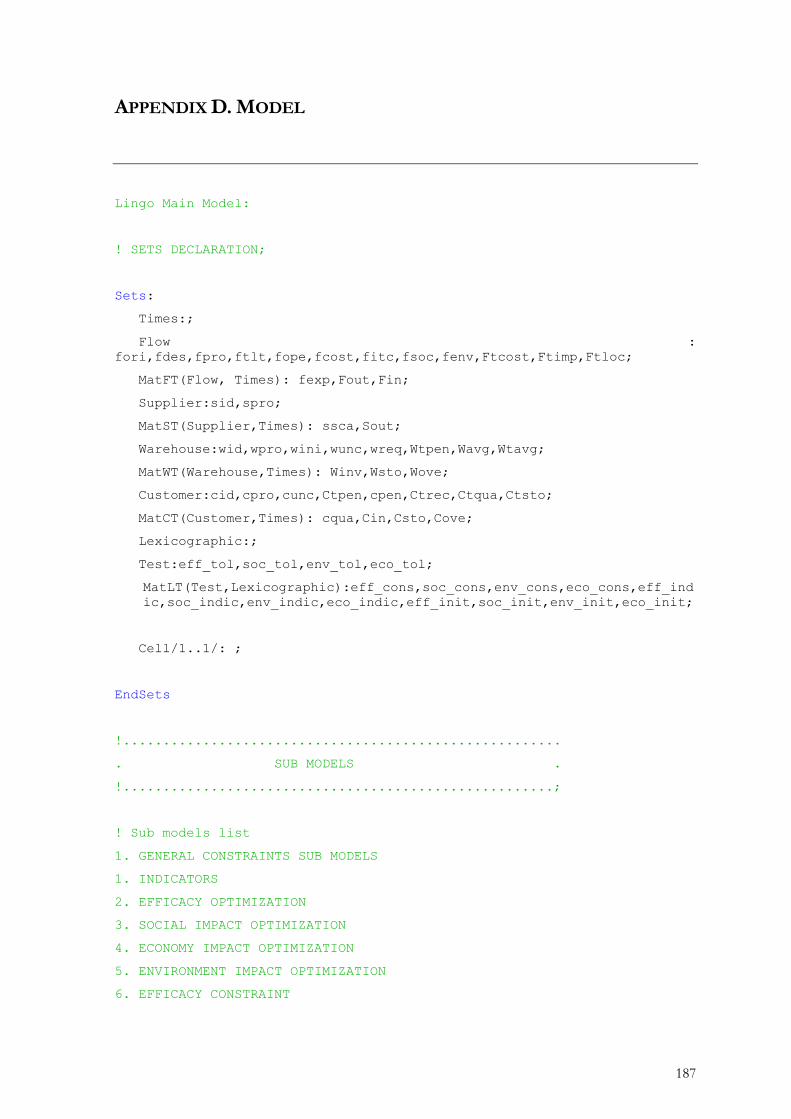
187
APPENDIX D. MODEL
Lingo Main Model:
! SETS DECLARATION;
Sets:
Times:;
Flow :
fori,fdes,fpro,ftlt,fope,fcost,fitc,fsoc,fenv,Ftcost,Ftimp,Ftloc;
MatFT(Flow, Times): fexp,Fout,Fin;
Supplier:sid,spro;
MatST(Supplier,Times): ssca,Sout;
Warehouse:wid,wpro,wini,wunc,wreq,Wtpen,Wavg,Wtavg;
MatWT(Warehouse,Times): Winv,Wsto,Wove;
Customer:cid,cpro,cunc,Ctpen,cpen,Ctrec,Ctqua,Ctsto;
MatCT(Customer,Times): cqua,Cin,Csto,Cove;
Lexicographic:;
Test:eff_tol,soc_tol,env_tol,eco_tol;
MatLT(Test,Lexicographic):eff_cons,soc_cons,env_cons,eco_cons,eff_ind
ic,soc_indic,env_indic,eco_indic,eff_init,soc_init,env_init,eco_init;
Cell/1..1/: ;
EndSets
!.......................................................
. SUB MODELS .
!......................................................;
! Sub models list
1. GENERAL CONSTRAINTS SUB MODELS
1. INDICATORS
2. EFFICACY OPTIMIZATION
3. SOCIAL IMPACT OPTIMIZATION
4. ECONOMY IMPACT OPTIMIZATION
5. ENVIRONMENT IMPACT OPTIMIZATION
6. EFFICACY CONSTRAINT

188
7. SOCIAL COSNTRAINT
8. ECONOMY CONSTRAINT
9. ENVIRONMENT CONSTRAINT
!******* 1. GENERAL CONSTRAINTS SUB MODELS **************;
SubModel Constraints:
! Numbero of time periods;
NT=@SIZE(Times);
! FlOWS CONSERVATION
@for(MatFT(f,t)|t#LE#ftlt(f):Fin(f,t)=fexp(f,t));
@for(MatFT(f,t)|t#GT#ftlt(f):Fin(f,t)=fout(f,t-
ftlt(f))+fexp(f,t));
@for(MatFT(f,t)|t#GT#(NT-ftlt(f)):fout(f,t)=0);
! SUPPLIERS
! supplier balance, or flow conservation;
@for(MatST(s,t):
Sout(s,t)=@sum(MatFt(f,t)|(fori(f)#EQ#sid(s)) #AND#
(fpro(f)#EQ#spro(s)): Fout(f,t)));
! supply capacity constraint;
@for(MatST(s,t):Sout(s,t)<=ssca(s,t));
! WAREHOUSE;
! warehouse balance, or flow conservation;
@for(MatWT(w,t)|t#EQ#1:
wini(w)+ @sum(Flow(f)|fdes(f)#EQ#wid(w)#AND#
fpro(f)#EQ#wpro(w): Fin(f,1))=
Winv(w,1)+@sum(Flow(f)|(fori(f)#EQ#wid(w)) #AND#
(fpro(f)#EQ#wpro(w)):Fout(f,1)));
@for(MatWT(w,t)|t#GT#1:
Winv(w,t-1)+@sum(Flow(f)|(fdes(f)#EQ#wid(w)) #AND#
(fpro(f)#EQ#wpro(w)):Fin(f,t))=
Winv(w,t)+@sum(Flow(f)|(fori(f)#EQ#wid(w)) #AND#
(fpro(f)#EQ#wpro(w)):Fout(f,t)));

189
! warehouse contingency stock constraint;
@for(MatWT(w,t): Winv(w,t)-wreq(w)=Wove(w,t)-Wsto(w,t));
@for(MatWT(w,t): Winv(w,NT)=wreq(w));
! CUSTOMERS;
! Total needs value over the periode:;
@for(Customer(c): ctqua(c)=@sum(Times(t):cqua(c,t))*cunc(c));
! Total received value:;
@for(Customer(c): Ctrec(c)=@sum(Times(t):Cin(c,t))*cunc(c));
! Total stockout value over the periode:;
@for(Customer(c): ctsto(c)=@sum(Times(t):csto(c,t))*cunc(c));
! Customer balance
@for(MatCT(c,t):Cin(c,t)=
@sum(Flow(f)|(fdes(f)#EQ#cid(c)) #AND# (fpro(f)#EQ#cpro(c)):
Fin(f,t)));
@for(MatCT(c,t)|t#EQ#1:Cin(c,1)+Csto(c,1)=Cqua(c,1)+Cove(c,1));
@for(MatCT(c,t)|t#GT#1:Cin(c,t)+Csto(c,t)=Cqua(c,t)+Cove(c,t)+Csto
(c,t-1)-Cove(c,t-1));
@for(Customer(c): Ctqua(c)=@sum(Times(t):Cin(c,t)*cunc(c)));
! EQUITY CONSTRAINT;
@for(Customer(c)|(cpen(c)#EQ#1.5) :
Ctsto(c)/ctqua(c)<(@sum(Customer(c):Ctsto(c))/@sum(Customer(c):ctqu
a(c)))+0.1);
@for(Customer(c)|(cpen(c)#EQ#1.5) :
Ctsto(c)/ctqua(c)>(@sum(Customer(c):Ctsto(c))/@sum(Customer(c):ctq
ua(c)))-0.1);
! OBJECTIVE FUNCTIONS CONSTRAINTS;
!effectiveness:
!Ctpen calculation _ Penalty of the stockout par customer and product;
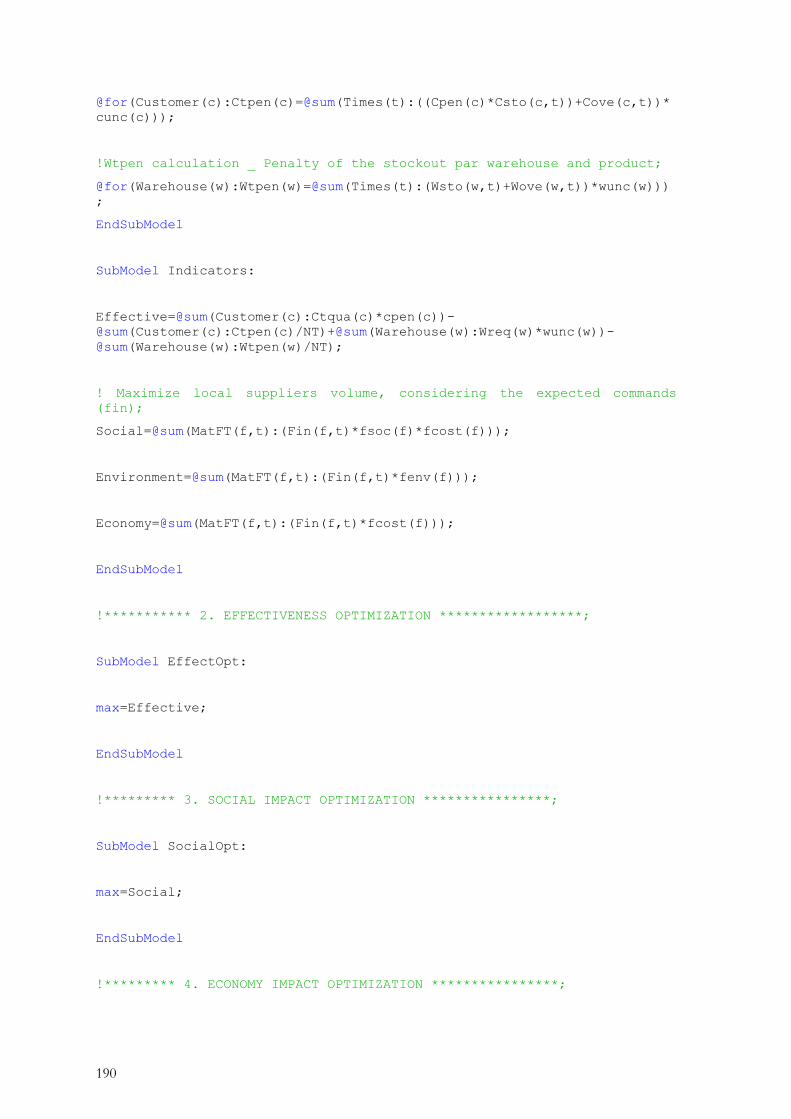
190
@for(Customer(c):Ctpen(c)=@sum(Times(t):((Cpen(c)*Csto(c,t))+Cove(c,t))*
cunc(c)));
!Wtpen calculation _ Penalty of the stockout par warehouse and product;
@for(Warehouse(w):Wtpen(w)=@sum(Times(t):(Wsto(w,t)+Wove(w,t))*wunc(w)))
;
EndSubModel
SubModel Indicators:
Effective=@sum(Customer(c):Ctqua(c)*cpen(c))-
@sum(Customer(c):Ctpen(c)/NT)+@sum(Warehouse(w):Wreq(w)*wunc(w))-
@sum(Warehouse(w):Wtpen(w)/NT);
! Maximize local suppliers volume, considering the expected commands
(fin);
Social=@sum(MatFT(f,t):(Fin(f,t)*fsoc(f)*fcost(f)));
Environment=@sum(MatFT(f,t):(Fin(f,t)*fenv(f)));
Economy=@sum(MatFT(f,t):(Fin(f,t)*fcost(f)));
EndSubModel
!*********** 2. EFFECTIVENESS OPTIMIZATION ******************;
SubModel EffectOpt:
max=Effective;
EndSubModel
!********* 3. SOCIAL IMPACT OPTIMIZATION ****************;
SubModel SocialOpt:
max=Social;
EndSubModel
!********* 4. ECONOMY IMPACT OPTIMIZATION ****************;
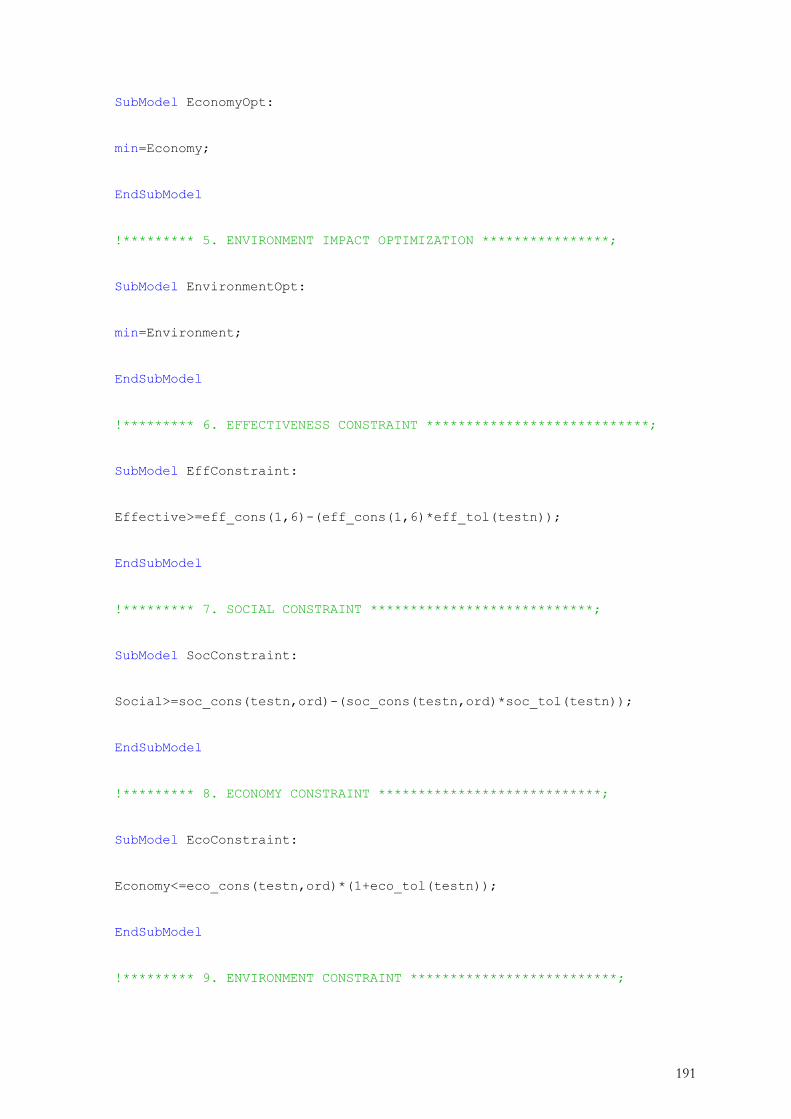
191
SubModel EconomyOpt:
min=Economy;
EndSubModel
!********* 5. ENVIRONMENT IMPACT OPTIMIZATION ****************;
SubModel EnvironmentOpt:
min=Environment;
EndSubModel
!********* 6. EFFECTIVENESS CONSTRAINT ****************************;
SubModel EffConstraint:
Effective>=eff_cons(1,6)-(eff_cons(1,6)*eff_tol(testn));
EndSubModel
!********* 7. SOCIAL CONSTRAINT ****************************;
SubModel SocConstraint:
Social>=soc_cons(testn,ord)-(soc_cons(testn,ord)*soc_tol(testn));
EndSubModel
!********* 8. ECONOMY CONSTRAINT ****************************;
SubModel EcoConstraint:
Economy<=eco_cons(testn,ord)*(1+eco_tol(testn));
EndSubModel
!********* 9. ENVIRONMENT CONSTRAINT **************************;

192
SubModel EnvConstraint:
!equal or lower than the constraint;
Environment<=1+@floor(env_cons(testn,ord)*(1+env_tol(testn)));
EndSubModel
SubModel vide:
EndSubModel


Towards a Sustainable Humanitarian Supply Chain: Characterization, Assessment and
Decision-support
Abstract. The Humanitarian supply Chain is a key element to enhance a performing response to humanitarian crisis. Because of the internal and external pressure, Humanitarian Organizations (HO) has done efforts during last decades to improve the crisis response in terms of effectiveness and efficiency. However, the performance is challenged by the increasing gap between funding and needs. The main donors ask for more transparency and accountability. Moreover, the pressure from the international community is pushing HO to integrate Sustainability challenges on a near future. Is in this context, and field research results, that the difficulties to consider sustainability on HSC decision-making. The lack of Decision Support Systems and a sustainability culture specific to the HSC have been identified as break to improve the planning of sustainable humanitarian operations. This research work seeks to introduce the sustainability notion to the management of the HSC. The approach followed is the development of a decision support system based on performance, to plan the HSC operations. Three research directions have been explored:
(a) How to gather an exhaustive knowledge of a HSC, for both field research and development of DSS? The proposed contribution is a Meta-Model of the HSC, for field research porpoise and for developing adequate Decision Support Systems.
(b) What sustainability means in HSC context? Based on a literature review and field research, a framework is established to define the HSC sustainable performance.
(c) How to make sustainable decisions during humanitarian response? This contribution is based on an Operational Research Algorithm, which permits to integrate the sustainable performance on decision making with an interactive approach. The thesis illustrates the three contributions with use cases based on the International Federation of the Red Cross (IFRC).
Keywords. Humanitarian Supply Chains, Decision-support, Tactical planning, Crisis management, Sustainability
Vers une chaîne logistique humanitaire durable : caractérisation, évaluation et aide à la
décision
Résumé. La chaîne logistique humanitaire (CLH) est essentielle pour assurer une réponse performante aux crises humanitaires. Les Organisations Humanitaires (OH) ont fait des efforts pendant les dernières décennies afin d'améliorer la réponse à la crise en termes d'efficience et d’efficacité. Tout de même, la performance est mise à l’épreuve dû au manque de fonds, et à l'augmentation des besoins humanitaires, le delta ne cessant pas de s’accroître. Les principaux donateurs exigent de plus en plus de transparence et de justification des dépenses. De plus, la pression de l’opinion publique et de la communauté internationale amène les OH à prendre en compte les enjeux du développement durable dans un futur proche. C'est dans ce contexte, et avec des études au terrain, qu'on a pu constater les difficultés pour intégrer le développent durable dans la prise de décision de la CLH. Le manque d'outils d'aide à la décision ainsi qu’une culture du développement durable spécifique à la CLH sont identifiés comme des freins pour améliorer la planification durable des opérations humanitaires. Le travail de recherche cherche à introduire la notion de développement durable dans la gestion des réseaux logistiques humanitaires. L'approche retenue est le développement d'un système d'aide à la décision basé sur la performance pour planifier les opérations de la CLH. Dans ce sens, trois directions de recherche ont été explorées :
(a) Comment recueillir une connaissance exhaustive de la CLH pour la recherche terrain ainsi que pour développer des Systèmes d'Aide à la Décision adéquats ? La contribution proposée est une méthodologie pour la recherche terrain qui s’appuie sur un Meta-Modèle de la CLH.
(b) Qu'est-ce que la durabilité signifie dans le contexte de CLH ? En base à une revue littéraire ainsi qu’aux recherches terrain, on a établi un cadre pour définir la performance durable d'une CLH.
(c) Comment prendre des décisions durables au cours de la réponse humanitaire ? Cette contribution est basée sur un algorithme de Recherche Opérationnelle qui permet d'intégrer la performance durable dans la prise de décision avec une approche interactive.
La thèse illustre les trois contributions avec des études de cas basées sur la CLH de la IFRC.
Mots-clés. Chaîne d'approvisionnement humanitaire, Aide à la décision, Planification tactique, Gestion des crises, Développement durable