towards better measurement of government - oecd.org · oecd (2007), "towards better...
TRANSCRIPT

Please cite this paper as:
OECD (2007), "Towards Better Measurement ofGovernment", OECD Working Papers on PublicGovernance, 2007/1, OECD Publishing.doi:10.1787/301575636734
OECD Working Papers on PublicGovernance 2007/1
Towards BetterMeasurement ofGovernment
OECD
1
OECD PROJECT ON MANAGEMENT IN GOVERNMENT
Working paper 1
TOWARDS BETTER MEASUREMENT OF
GOVERNMENT
2007
ORGANISATION FOR ECONOMIC CO-OPERATION AND DEVELOPMENT
2
ORGANISATION FOR ECONOMIC CO-OPERATION AND DEVELOPMENT
The OECD is a unique forum where the governments of 30 democracies work together to address the economic, social and environmental challenges of globalisation. The OECD is also at the forefront of efforts to understand and to help governments respond to new developments and concerns, such as corporate governance, the information economy and the challenges of an ageing population. The Organisation provides a setting where governments can compare policy experiences, seek answers to common problems, identify good practice and work to co-ordinate domestic and international policies. The OECD member countries are: Australia, Austria, Belgium, Canada, the Czech Republic, Denmark, Finland, France, Germany, Greece, Hungary, Iceland, Ireland, Italy, Japan, Korea, Luxembourg, Mexico, the Netherlands, New Zealand, Norway, Poland, Portugal, the Slovak Republic, Spain, Sweden, Switzerland, Turkey, the United Kingdom and the United States. The Commission of the European Communities takes part in the work of the OECD.
This work is published on the responsibility of the Secretary-General of the OECD. The opinions expressed and arguments employed herein do not necessarily reflect the official views of the Organisation or of the governments of its member countries.
3
Acknowledgements
The OECD Project on "Management in Government" was launched in 2005 with the ambition of providing governments with high quality comparative information on the public sector. Following the presentation of a feasibility report to the OECD Public Governance Committee in November 2005, three technical papers were prepared examining the overall project strategy and technical issues in the measurement of outputs and outcomes. These will shortly be published in a single volume "Measuring Government Activity" (OECD, forthcoming). The project is committed to the first publication of "Government at a Glance", providing a suite of indicators concerning public sector activities, in late 2009. This initial Working Paper summarises the project approach, and sets out those data which are currently available. It is a modest step towards the final goal, but not a trivial one. Reaching broad consensus on the approach for defining the scope of the public sector, and for classifying the indicators, represents one important milestone. Bringing together in a single publication the array of data that are currently available is another. These achievements are due in large measure to the excellent technical guidance provided by the three informal editorial groups comprising leading government and academic experts drawn from across the OECD (see http://www.oecd.org/gov/indicators for more details) and in close collaboration with other OECD Directorates (most particularly the Economics Department and the Statistics Directorate). The datasets themselves are the product of detailed technical work over many years by the staff of the GOV and ECO Directorates in the OECD. The project was led by Nick Manning, Jana Malinska and Dirk-Jan Kraan (OECD GOV).
4
TABLE OF CONTENTS
INTRODUCTION .......................................................................................................................................... 1
THE PROPOSED APPROACH..................................................................................................................... 2
1. Why measure government? .............................................................................................................. 2 1.1. Government is large................................................................................................................... 2 1.2. We have little to guide us in reforming it .................................................................................. 2
2. How will “Government at a Glance” help?...................................................................................... 2 3. How will it complement other global datasets?................................................................................ 3 4. What is the strategy for getting there?.............................................................................................. 4
4.1. A cautious path .......................................................................................................................... 4 4.2. An evolving role for the OECD ................................................................................................. 4 4.3. An ambitious but technically robust approach........................................................................... 4 4.4. A restrained approach ................................................................................................................ 7
5. The Starting Point............................................................................................................................. 7 5.1. What’s in stock?......................................................................................................................... 7 5.2. What can we learn from what we have? .................................................................................... 7
6. Some benchmarking highlights ........................................................................................................ 8 6.1. Revenues (Sub-central government).......................................................................................... 8 6.2. Inputs ......................................................................................................................................... 9 6.3. Processes.................................................................................................................................. 10 6.4. Outputs (Central government) ................................................................................................. 12
7. Moving forward with data collection ............................................................................................. 12 7.1. Priorities for data collection..................................................................................................... 12 7.2. New thinking in difficult areas ................................................................................................ 14
8. A resource for all ............................................................................................................................ 14
AVAILABLE PUBLIC MANAGEMENT DATA ...................................................................................... 17 Revenues
Revenue structure RS1. Revenue structure of sub-central governments...........................................................18
Tax autonomy RS2. Tax autonomy of sub-central governments.................................................................20 RS3. Evolution of tax autonomy of sub-central governments .............................................22 RS4. Tax autonomy of sub-central governments by type of tax..........................................24
Grants RS5. Grants by donor and recipient.....................................................................................26 RS6. Grant revenue by type of grant ...................................................................................30 RS7. Intergovernmental grants by government function.....................................................34
Fiscal rules RS8. Budget balance requirements for sub-central governments ........................................36 RS9. Tax and expenditure limits for sub-central governments............................................38 RS10. Tax and expenditure limits for sub-central governments..........................................40
5
RS11. Process rules and rule implementation requirements for sub-central governments..42 Inputs
Overall input mix I1. Mode of public sector production...................................................................................46
Labour Workforce size
I2. Employment in the public domain .................................................................................48 I3. Employment in the public domain within the total labour force....................................56
Workforce composition I4. Age structure of public sector employment....................................................................60 I5. Participation of women in public employment ..............................................................66
Compensation I6. Dispersion of earnings in the public sector ....................................................................70 I7. Public sector pension rights............................................................................................72 I8. Types of public sector pension schemes ........................................................................76
Processes Budget practices and procedures Budget formulation
P1. Credibility of the economic assumptions ......................................................................78 P2. Medium term fiscal framework .....................................................................................82 P3. Resolving disputes between ministries and the central budget authority ......................84 P4. Role of the legislature....................................................................................................86
Budget execution P5. Agency flexibility in budget execution .........................................................................88
Reporting, review and audit P6. Scope and focus of audit................................................................................................90 P7. Responsibility for programme evaluations....................................................................94 P8. Use of evaluations .........................................................................................................98 P9. Follow-up on evaluations ............................................................................................102
HRM arrangements System overview
P10. Characteristics of the general HRM arrangements....................................................106 P11. Characteristics of the senior civil service ..................................................................110
Pay policy P12. Institutional frameworks for pay determination ........................................................116 P13. Prevalence of performance-related pay .....................................................................118
Ethical infrastructure and oversight P14. Ethics infrastructure...................................................................................................120 P15. Scope of the conflict of interest policy......................................................................124 P16. Enforcing the conflict of interest policy ....................................................................128 P17. Conflict of interest policies for post-public employment ..........................................134
Internal and external reporting Open government
P18. Open government legislation.....................................................................................138 Performance measurement arrangements
P19. Types of performance measure used .........................................................................140 P20. Roles and responsibilities in performance management systems..............................144 P21. Use of performance measures in the budget process.................................................148
E-government readiness P22. Legal framework for e-government service provision ..............................................152 P23. E-government infrastructure......................................................................................154
6
P24. E-government benefits evaluation methodology .......................................................156 Centre of government Government offices
P25. Structure of government offices ................................................................................158 P26. Communication by government offices ....................................................................162
Management of regulatory quality P27. Institutional setting to promote quality in regulatory management systems .............164 P28. Rule making procedures ............................................................................................168 P29. Consultations and participation from the public........................................................172 P30. Use of regulatory tools and processes .......................................................................176 P31. Dimensions considered in regulatory impact analysis...............................................178 P32. Reducing administrative burdens .............................................................................182
Outputs Central government Financial proxy output
O1. Functional disaggregation of fiscal expenditures and revenues..................................186
1
OECD PROJECT ON MANAGEMENT IN GOVERNMENT “TOWARDS BETTER MEASUREMENT OF GOVERNMENT”
WORKING PAPER EDITION 1
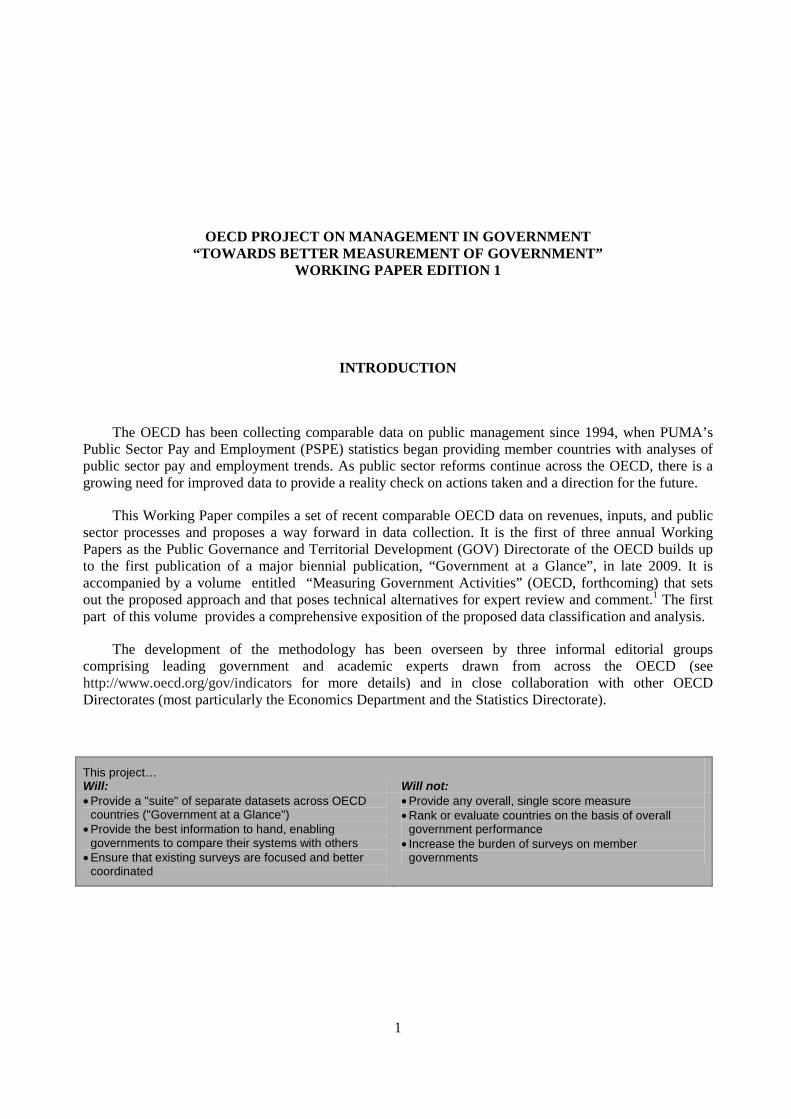
INTRODUCTION
The OECD has been collecting comparable data on public management since 1994, when PUMA’s Public Sector Pay and Employment (PSPE) statistics began providing member countries with analyses of public sector pay and employment trends. As public sector reforms continue across the OECD, there is a growing need for improved data to provide a reality check on actions taken and a direction for the future.
This Working Paper compiles a set of recent comparable OECD data on revenues, inputs, and public sector processes and proposes a way forward in data collection. It is the first of three annual Working Papers as the Public Governance and Territorial Development (GOV) Directorate of the OECD builds up to the first publication of a major biennial publication, “Government at a Glance”, in late 2009. It is accompanied by a volume entitled “Measuring Government Activities” (OECD, forthcoming) that sets out the proposed approach and that poses technical alternatives for expert review and comment.1 The first part of this volume provides a comprehensive exposition of the proposed data classification and analysis.
The development of the methodology has been overseen by three informal editorial groups comprising leading government and academic experts drawn from across the OECD (see http://www.oecd.org/gov/indicators for more details) and in close collaboration with other OECD Directorates (most particularly the Economics Department and the Statistics Directorate).
This project… Will: Will not: • Provide a "suite" of separate datasets across OECD
countries ("Government at a Glance") • Provide the best information to hand, enabling
governments to compare their systems with others • Ensure that existing surveys are focused and better
coordinated
• Provide any overall, single score measure • Rank or evaluate countries on the basis of overall
government performance • Increase the burden of surveys on member
governments

2
THE PROPOSED APPROACH
1. Why measure government?
How government activities are measured, matters. The size and economic significance of the public sector make it a major contributor to growth and social welfare.
1.1. Government is large
Given the size of government and its role in the economy, the contribution of government to national economic growth is of great significance, especially when looking at change rates over time. Recent work in the United Kingdom highlights that changing the basis of measurement of government activity can increase or decrease the measure of GDP significantly.2 Beyond economics, measuring government activity is important because of the size of its activities and the consequent need to understand what it is achieving with the very significant expenditures (in the OECD, between 36 and 57% of GDP in 2004). Its achievements, or otherwise, emerge in the quality and nature of the goods and services it provides, its redistributive activities, and in the nature of its regulation of market and individual behaviour.
1.2. We have little to guide us in reforming government
There is a persistent problem in public management reform recommendations – they are rarely based on empirical evaluations, and in practice can owe more to policy fashion than to evidence and with significant over-claiming about “best practice”. The OECD is one of the few authoritative sources of comparative public management data – but overall, there is very limited data availability, a troubling concern that is well-recognised in all recent analyses of public management reforms.
2. How will “Government at a Glance” help?
This biennial publication will address the challenge of providing data that will help governments and other analysts in two main ways:
1. For individual countries, it will enable robust benchmarking, using common units of analysis and facilitating a structured practitioner dialogue.
2. Longer term, it will contribute to OECD-wide lesson-learning concerning:
− Sector efficiency and institutional effectiveness, providing insights into the results of service provision via different institutional and managerial arrangements.
− Observed relationships (which changes in public sector processes are associated with which changes in public sector results?).
− Absorptive capacity (the impact on productivity of softer budget constraints following significant increases in sector expenditures, and the converse).
3
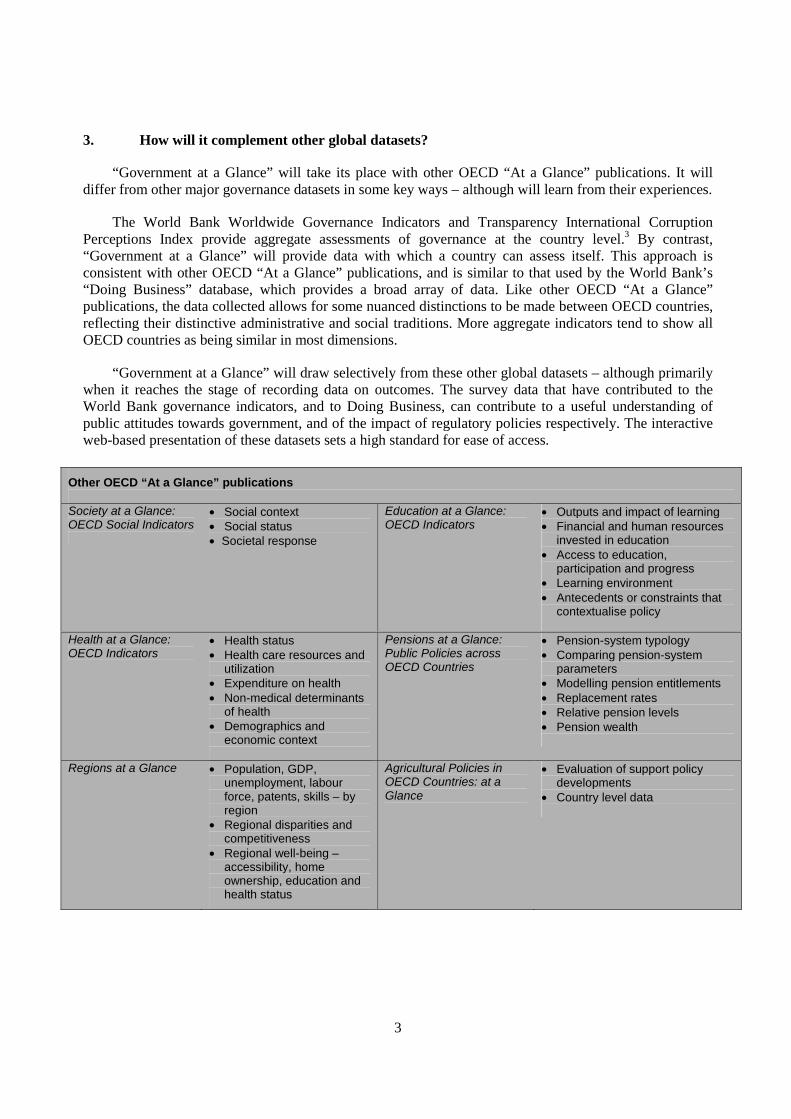
3. How will it complement other global datasets?
“Government at a Glance” will take its place with other OECD “At a Glance” publications. It will differ from other major governance datasets in some key ways – although will learn from their experiences.
The World Bank Worldwide Governance Indicators and Transparency International Corruption Perceptions Index provide aggregate assessments of governance at the country level.3 By contrast, “Government at a Glance” will provide data with which a country can assess itself. This approach is consistent with other OECD “At a Glance” publications, and is similar to that used by the World Bank’s “Doing Business” database, which provides a broad array of data. Like other OECD “At a Glance” publications, the data collected allows for some nuanced distinctions to be made between OECD countries, reflecting their distinctive administrative and social traditions. More aggregate indicators tend to show all OECD countries as being similar in most dimensions.
“Government at a Glance” will draw selectively from these other global datasets – although primarily when it reaches the stage of recording data on outcomes. The survey data that have contributed to the World Bank governance indicators, and to Doing Business, can contribute to a useful understanding of public attitudes towards government, and of the impact of regulatory policies respectively. The interactive web-based presentation of these datasets sets a high standard for ease of access.
Other OECD “At a Glance” publications Society at a Glance: OECD Social Indicators
• Social context • Social status • Societal response
Education at a Glance: OECD Indicators
• Outputs and impact of learning • Financial and human resources
invested in education • Access to education,
participation and progress • Learning environment • Antecedents or constraints that
contextualise policy
Health at a Glance: OECD Indicators
• Health status • Health care resources and
utilization • Expenditure on health • Non-medical determinants
of health • Demographics and
economic context
Pensions at a Glance: Public Policies across OECD Countries
• Pension-system typology • Comparing pension-system
parameters • Modelling pension entitlements • Replacement rates • Relative pension levels • Pension wealth
Regions at a Glance • Population, GDP, unemployment, labour force, patents, skills – by region
• Regional disparities and competitiveness
• Regional well-being –accessibility, home ownership, education and health status
Agricultural Policies in OECD Countries: at a Glance
• Evaluation of support policy developments
• Country level data
4
4. What is the strategy for getting there?
4.1. A cautious path
There is a fundamental choice of strategy in building a set of public management indicators. The principal choice is between:
1. starting with a broad-brush approach, gathering diverse statistics for the key stages in the public sector production process, and working towards some specific analyses; or
2. starting with specific, in-depth studies – such as developing unit costs for various public services outputs.
The most frequent request to the OECD is for basic benchmarking data, with senior officials seeking insights into how the structures and processes in their country compare to those in other countries. Starting from specific, in-depth studies would detract from the ability of the “Government at a Glance” to offer benchmarking in the short term. The intention is to provide a wide array of benchmark data, building out from areas in which GOV has some recognised competence and leading to more specific studies.
4.2. An evolving role for the OECD
There are many other bodies and institutions that develop useful public management datasets. OECD/GOV will continue to undertake some data collection in core areas – as it has a distinct comparative advantage in its access to governments – but this data collection role will be accompanied by an increased emphasis on networking. Combining its unique convening power with a clearer specification of technical standards and identification of data gaps it will encourage other data suppliers to work on priority areas and conform to OECD standards. This may have the additional advantage of minimising overlapping survey demands on OECD member government’s time. OECD/GOV will focus on priority information and will seek minimum new data consistent with its overall strategy, noting that long and complex survey instruments create disincentives to provide good responses.
It will be important to signal clearly to researchers and practitioners the areas in which new datasets could contribute to useful analyses. Governments and researchers can propose the inclusion of new datasets into “Government at a Glance” by providing detailed information about them in the forms that are posted on the www.oecd.org/gov/indicators website.
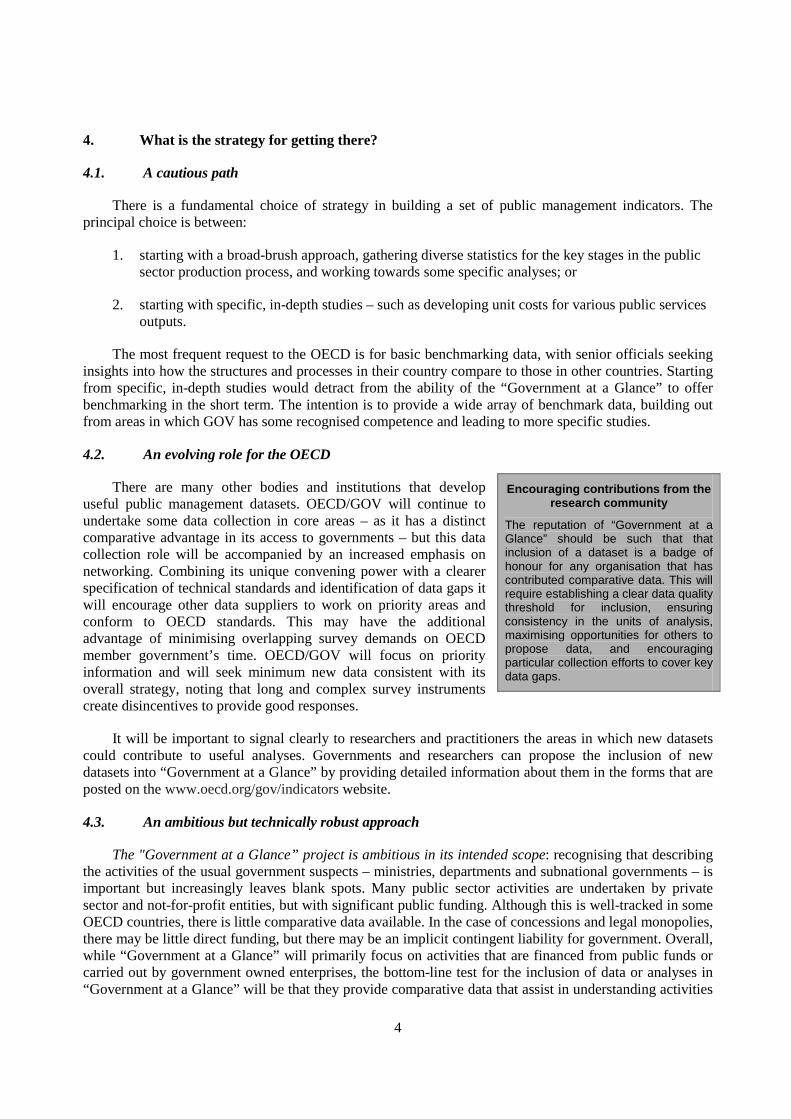
4.3. An ambitious but technically robust approach
The "Government at a Glance” project is ambitious in its intended scope: recognising that describing the activities of the usual government suspects – ministries, departments and subnational governments – is important but increasingly leaves blank spots. Many public sector activities are undertaken by private sector and not-for-profit entities, but with significant public funding. Although this is well-tracked in some OECD countries, there is little comparative data available. In the case of concessions and legal monopolies, there may be little direct funding, but there may be an implicit contingent liability for government. Overall, while “Government at a Glance” will primarily focus on activities that are financed from public funds or carried out by government owned enterprises, the bottom-line test for the inclusion of data or analyses in “Government at a Glance” will be that they provide comparative data that assist in understanding activities
Encouraging contributions from the research community
The reputation of “Government at a Glance” should be such that that inclusion of a dataset is a badge of honour for any organisation that has contributed comparative data. This will require establishing a clear data quality threshold for inclusion, ensuring consistency in the units of analysis, maximising opportunities for others to propose data, and encouraging particular collection efforts to cover key data gaps.
5
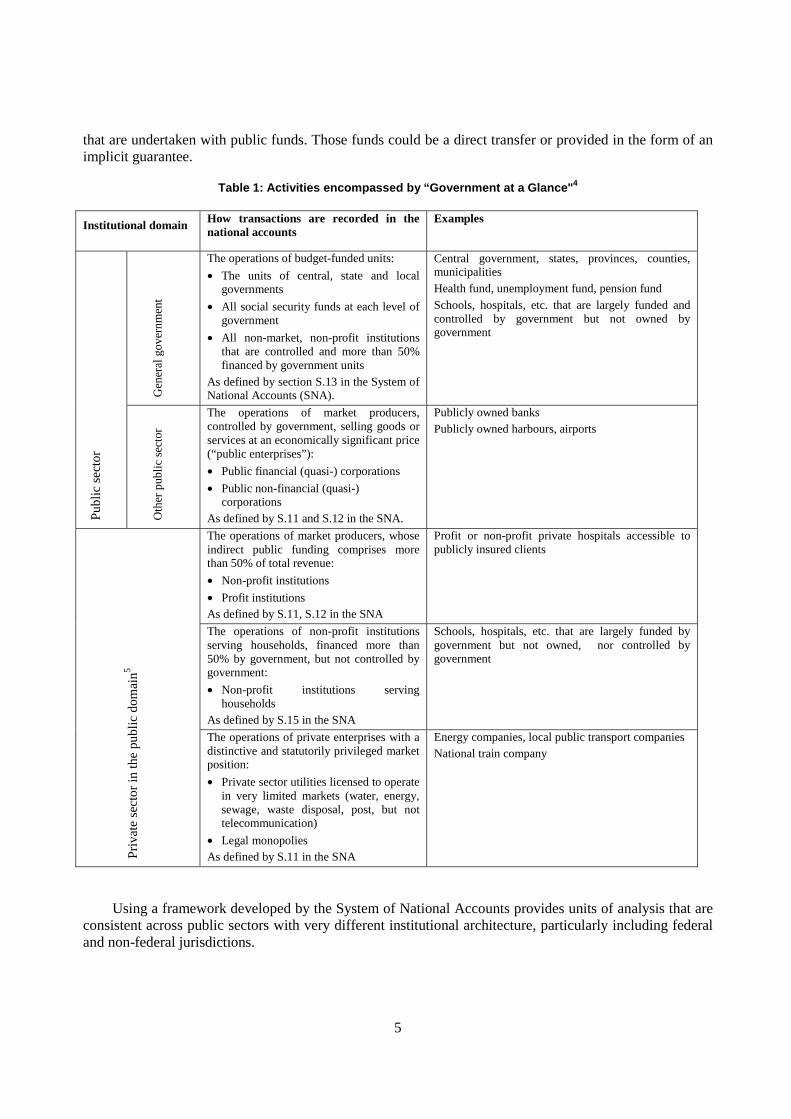
that are undertaken with public funds. Those funds could be a direct transfer or provided in the form of an implicit guarantee.
Table 1: Activities encompassed by “Government at a Glance"4
Institutional domain How transactions are recorded in the national accounts
Examples
Gen
eral
gov
ernm
ent
The operations of budget-funded units:
• The units of central, state and local governments
• All social security funds at each level of government
• All non-market, non-profit institutions that are controlled and more than 50% financed by government units
As defined by section S.13 in the System of National Accounts (SNA).
Central government, states, provinces, counties, municipalities Health fund, unemployment fund, pension fund Schools, hospitals, etc. that are largely funded and controlled by government but not owned by government
Publ
ic s
ecto
r
Oth
er p
ubli
c se
ctor
The operations of market producers, controlled by government, selling goods or services at an economically significant price (“public enterprises”):
• Public financial (quasi-) corporations
• Public non-financial (quasi-) corporations
As defined by S.11 and S.12 in the SNA.
Publicly owned banks Publicly owned harbours, airports
The operations of market producers, whose indirect public funding comprises more than 50% of total revenue:
• Non-profit institutions
• Profit institutions As defined by S.11, S.12 in the SNA
Profit or non-profit private hospitals accessible to publicly insured clients
The operations of non-profit institutions serving households, financed more than 50% by government, but not controlled by government:
• Non-profit institutions serving households
As defined by S.15 in the SNA
Schools, hospitals, etc. that are largely funded by government but not owned, nor controlled by government
Priv
ate
sect
or in
the
publ
ic d
omai
n5
The operations of private enterprises with a distinctive and statutorily privileged market position:
• Private sector utilities licensed to operate in very limited markets (water, energy, sewage, waste disposal, post, but not telecommunication)
• Legal monopolies As defined by S.11 in the SNA
Energy companies, local public transport companies National train company
Using a framework developed by the System of National Accounts provides units of analysis that are consistent across public sectors with very different institutional architecture, particularly including federal and non-federal jurisdictions.
6
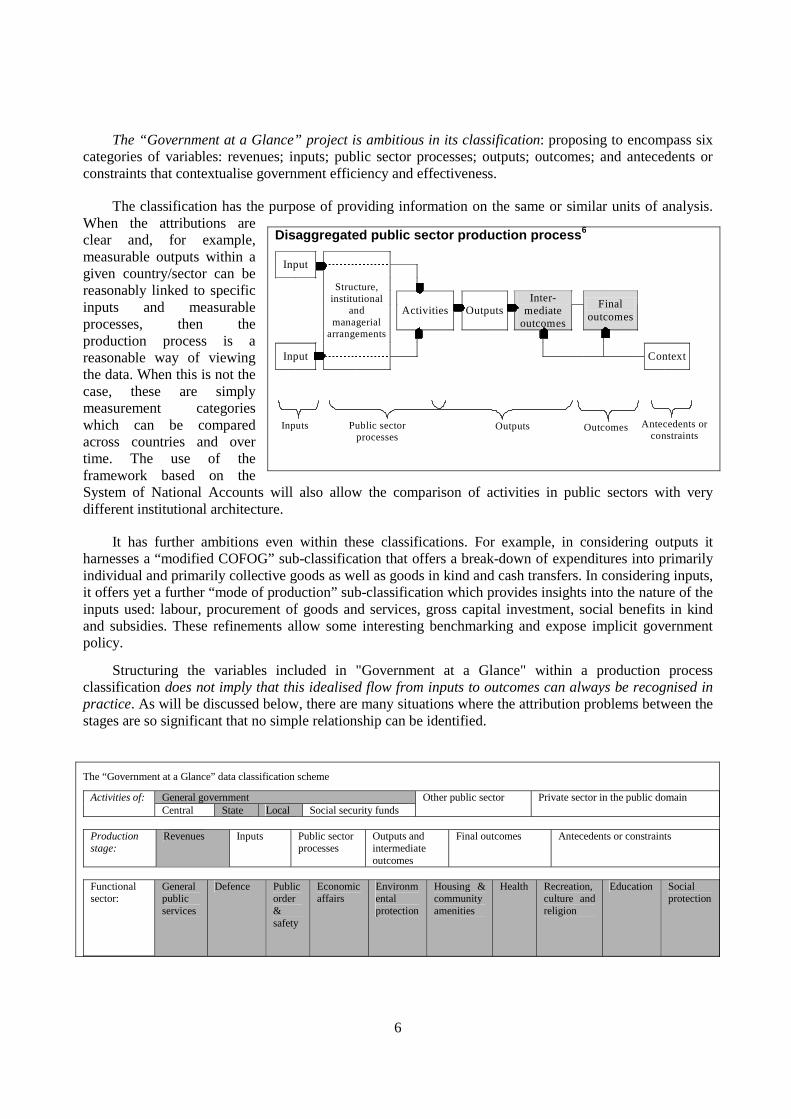
The “Government at a Glance” project is ambitious in its classification: proposing to encompass six categories of variables: revenues; inputs; public sector processes; outputs; outcomes; and antecedents or constraints that contextualise government efficiency and effectiveness.
The classification has the purpose of providing information on the same or similar units of analysis. When the attributions are clear and, for example, measurable outputs within a given country/sector can be reasonably linked to specific inputs and measurable processes, then the production process is a reasonable way of viewing the data. When this is not the case, these are simply measurement categories which can be compared across countries and over time. The use of the framework based on the System of National Accounts will also allow the comparison of activities in public sectors with very different institutional architecture.
It has further ambitions even within these classifications. For example, in considering outputs it harnesses a “modified COFOG” sub-classification that offers a break-down of expenditures into primarily individual and primarily collective goods as well as goods in kind and cash transfers. In considering inputs, it offers yet a further “mode of production” sub-classification which provides insights into the nature of the inputs used: labour, procurement of goods and services, gross capital investment, social benefits in kind and subsidies. These refinements allow some interesting benchmarking and expose implicit government policy.
Structuring the variables included in "Government at a Glance" within a production process classification does not imply that this idealised flow from inputs to outcomes can always be recognised in practice. As will be discussed below, there are many situations where the attribution problems between the stages are so significant that no simple relationship can be identified.
The “Government at a Glance” data classification scheme
General government Activities of: Central State Local Social security funds
Other public sector Private sector in the public domain
Production stage:
Revenues Inputs Public sector processes
Outputs and intermediate outcomes
Final outcomes Antecedents or constraints
Functional sector:
General public services
Defence Public order & safety
Economic affairs
Environmental protection
Housing & community amenities
Health Recreation, culture and religion
Education Social protection
Disaggregated public sector production process6
Input
Activities
Outputs
Inter-mediate
outcomes
Final outcomes
Structure, institutional
and managerial
arrangements
Input
Context
Inputs Public sector processes
Outputs Outcomes Antecedents or
constraints

7
4.4. A restrained approach
“Government at a Glance” will be policy neutral, taking government sector policies as a given and providing information that may assist in illuminating whether these could be implemented more efficiently and how the arrangements for implementation differ between similar arrangements in other countries or over time. It will very specifically not seek to explore questions concerning the sector outcomes that governments are seeking to achieve, as this is a question of political preference.
It will take a very cautious approach to the use of composite indicators on the grounds that these suggest a spurious degree of precision in inter-country ranking. It suggests some experimentation in narrowly defined areas following some evaluation of the risks involved. It also notes that there is a different type of indicator that could attract interest in the project. “Derived indicators” could show the degree to which countries have made data available to facilitate benchmarking, or could identify public sector processes for which there are time series and where there has been a significant variation between two dates.
5. The Starting Point
5.1. What’s in stock?
Over 1,000 variables (primarily survey questions) that GOV has collected in past surveys have been reviewed, examining sensitivity for publication, accuracy, variable format and unit of analysis. The use of these data in published reports has also been reviewed.
Some 100 variables appear to be policy relevant and suitable for inclusion in this Working Paper.
The data can be roughly classified as shown in the accompanying table. Only two datasets contain time series data (from the budgetary database and concerning public sector pay and employment), and there are significant conceptual and definitional challenges in both of these datasets.
5.2. What can we learn from what we have?
These data can be used for benchmarking. As noted this is the most frequent request to the OECD concerning public sector management with senior officials seeking comparisons with the structures and processes in their country and those in other countries.
The existing data sets allow some basic comparisons:
• The revenue data for sub-central government allow comparisons of the degree of fiscal decentralisation.
Currently available data REVENUES
Revenue structure Tax autonomy Grants
Sub-central government
Fiscal rules
INPUTS Overall input mix
Workforce size Workforce composition
Labour
Compensation PROCESSES
System overview Budget formulation Budget execution
Budget practices and procedures Reporting, review and audit
System overview Pay policy
HRM arrangements Ethical infrastructure and
oversight Open government Internal and
external reporting
Performance measurement arrangements
E-government readiness Centre of government
Government offices
Management of regulatory quality OUTPUTS Central government
Financial proxy output
8
• Data on the overall input mix provides a comparison of choices concerning the way in which expenditures are utilised to deliver in-kind goods and services, and could open up a sector-specific discussion concerning in-house provision versus contracting out.
• Data on labour inputs, within the modified and more comparable framework, will allow a comparison of the size of public sector workforces – opening up more realistic debates concerning the extent of government involvement in the economy.
• Measures of the various institutional arrangements and processes, allow more robust dialogue between practitioners and policy makers concerning the extent of reform measures.
• Data on central government financial proxy outputs provide a comparison of revealed policy preferences and could open up a broad discussion concerning the relative significance of spending areas, the choice of cash versus in kind transfers, the use of entitlements and the possible application of user charges.
6. Some benchmarking highlights from currently available data7
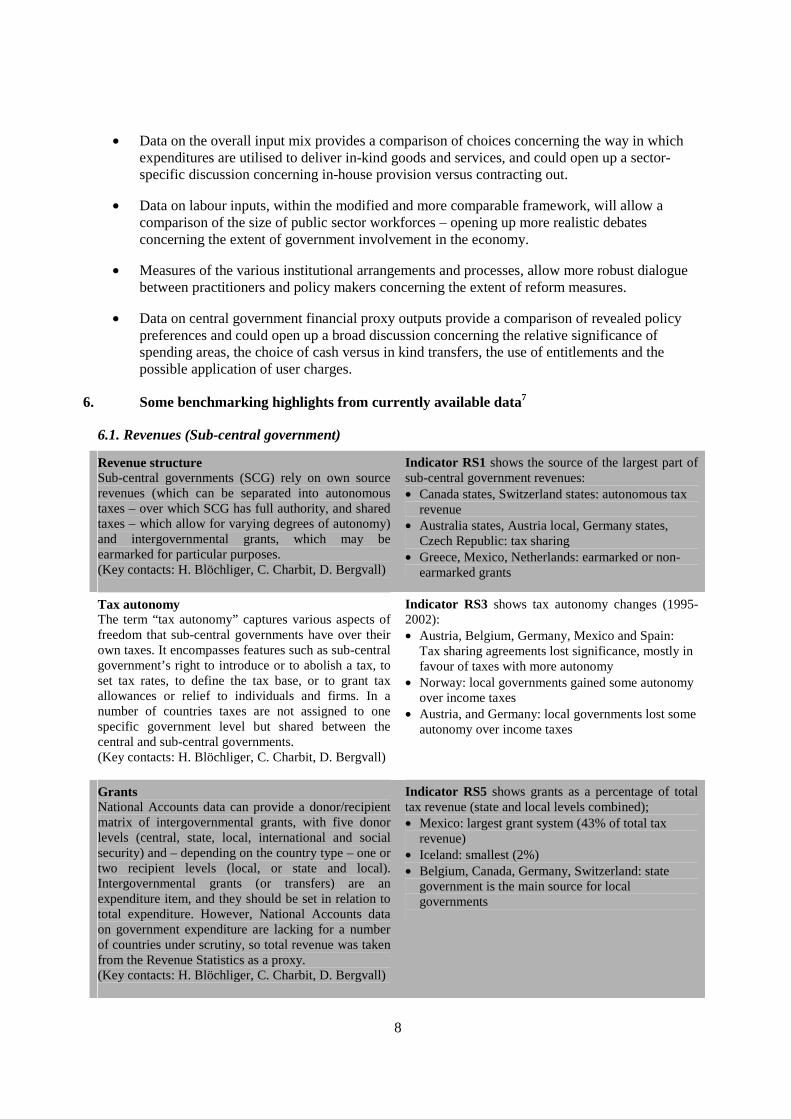
6.1. Revenues (Sub-central government)
Revenue structure Sub-central governments (SCG) rely on own source revenues (which can be separated into autonomous taxes – over which SCG has full authority, and shared taxes – which allow for varying degrees of autonomy) and intergovernmental grants, which may be earmarked for particular purposes. (Key contacts: H. Blöchliger, C. Charbit, D. Bergvall)
Indicator RS1 shows the source of the largest part of sub-central government revenues: • Canada states, Switzerland states: autonomous tax
revenue • Australia states, Austria local, Germany states,
Czech Republic: tax sharing • Greece, Mexico, Netherlands: earmarked or non-
earmarked grants
Tax autonomy The term “tax autonomy” captures various aspects of freedom that sub-central governments have over their own taxes. It encompasses features such as sub-central government’s right to introduce or to abolish a tax, to set tax rates, to define the tax base, or to grant tax allowances or relief to individuals and firms. In a number of countries taxes are not assigned to one specific government level but shared between the central and sub-central governments. (Key contacts: H. Blöchliger, C. Charbit, D. Bergvall)
Indicator RS3 shows tax autonomy changes (1995-2002): • Austria, Belgium, Germany, Mexico and Spain:
Tax sharing agreements lost significance, mostly in favour of taxes with more autonomy
• Norway: local governments gained some autonomy over income taxes
• Austria, and Germany: local governments lost some autonomy over income taxes
Grants National Accounts data can provide a donor/recipient matrix of intergovernmental grants, with five donor levels (central, state, local, international and social security) and – depending on the country type – one or two recipient levels (local, or state and local). Intergovernmental grants (or transfers) are an expenditure item, and they should be set in relation to total expenditure. However, National Accounts data on government expenditure are lacking for a number of countries under scrutiny, so total revenue was taken from the Revenue Statistics as a proxy. (Key contacts: H. Blöchliger, C. Charbit, D. Bergvall)
Indicator RS5 shows grants as a percentage of total tax revenue (state and local levels combined); • Mexico: largest grant system (43% of total tax
revenue) • Iceland: smallest (2%) • Belgium, Canada, Germany, Switzerland: state
government is the main source for local governments
9
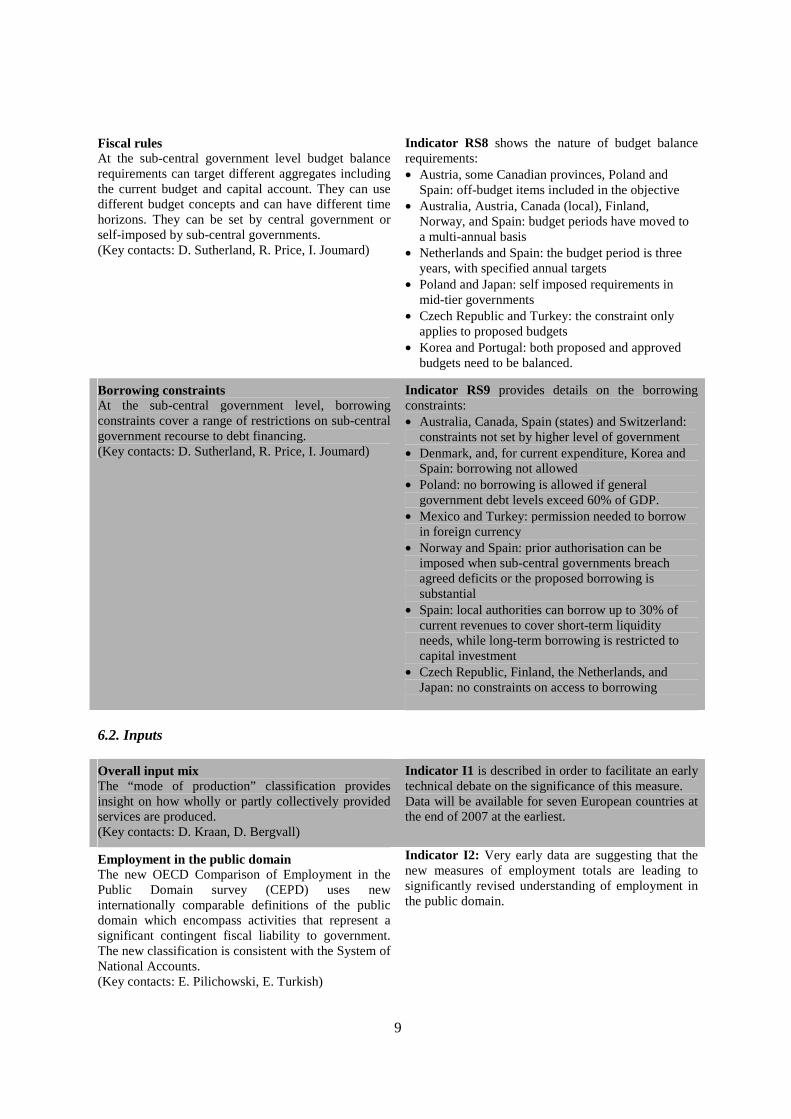
Fiscal rules At the sub-central government level budget balance requirements can target different aggregates including the current budget and capital account. They can use different budget concepts and can have different time horizons. They can be set by central government or self-imposed by sub-central governments. (Key contacts: D. Sutherland, R. Price, I. Joumard)
Indicator RS8 shows the nature of budget balance requirements: • Austria, some Canadian provinces, Poland and
Spain: off-budget items included in the objective • Australia, Austria, Canada (local), Finland,
Norway, and Spain: budget periods have moved to a multi-annual basis
• Netherlands and Spain: the budget period is three years, with specified annual targets
• Poland and Japan: self imposed requirements in mid-tier governments
• Czech Republic and Turkey: the constraint only applies to proposed budgets
• Korea and Portugal: both proposed and approved budgets need to be balanced.
Borrowing constraints At the sub-central government level, borrowing constraints cover a range of restrictions on sub-central government recourse to debt financing. (Key contacts: D. Sutherland, R. Price, I. Joumard)
Indicator RS9 provides details on the borrowing constraints: • Australia, Canada, Spain (states) and Switzerland:
constraints not set by higher level of government • Denmark, and, for current expenditure, Korea and
Spain: borrowing not allowed • Poland: no borrowing is allowed if general
government debt levels exceed 60% of GDP. • Mexico and Turkey: permission needed to borrow
in foreign currency • Norway and Spain: prior authorisation can be
imposed when sub-central governments breach agreed deficits or the proposed borrowing is substantial
• Spain: local authorities can borrow up to 30% of current revenues to cover short-term liquidity needs, while long-term borrowing is restricted to capital investment
• Czech Republic, Finland, the Netherlands, and Japan: no constraints on access to borrowing
6.2. Inputs
Overall input mix The “mode of production” classification provides insight on how wholly or partly collectively provided services are produced. (Key contacts: D. Kraan, D. Bergvall)
Indicator I1 is described in order to facilitate an early technical debate on the significance of this measure. Data will be available for seven European countries at the end of 2007 at the earliest.
Employment in the public domain The new OECD Comparison of Employment in the Public Domain survey (CEPD) uses new internationally comparable definitions of the public domain which encompass activities that represent a significant contingent fiscal liability to government. The new classification is consistent with the System of National Accounts. (Key contacts: E. Pilichowski, E. Turkish)
Indicator I2: Very early data are suggesting that the new measures of employment totals are leading to significantly revised understanding of employment in the public domain.
10
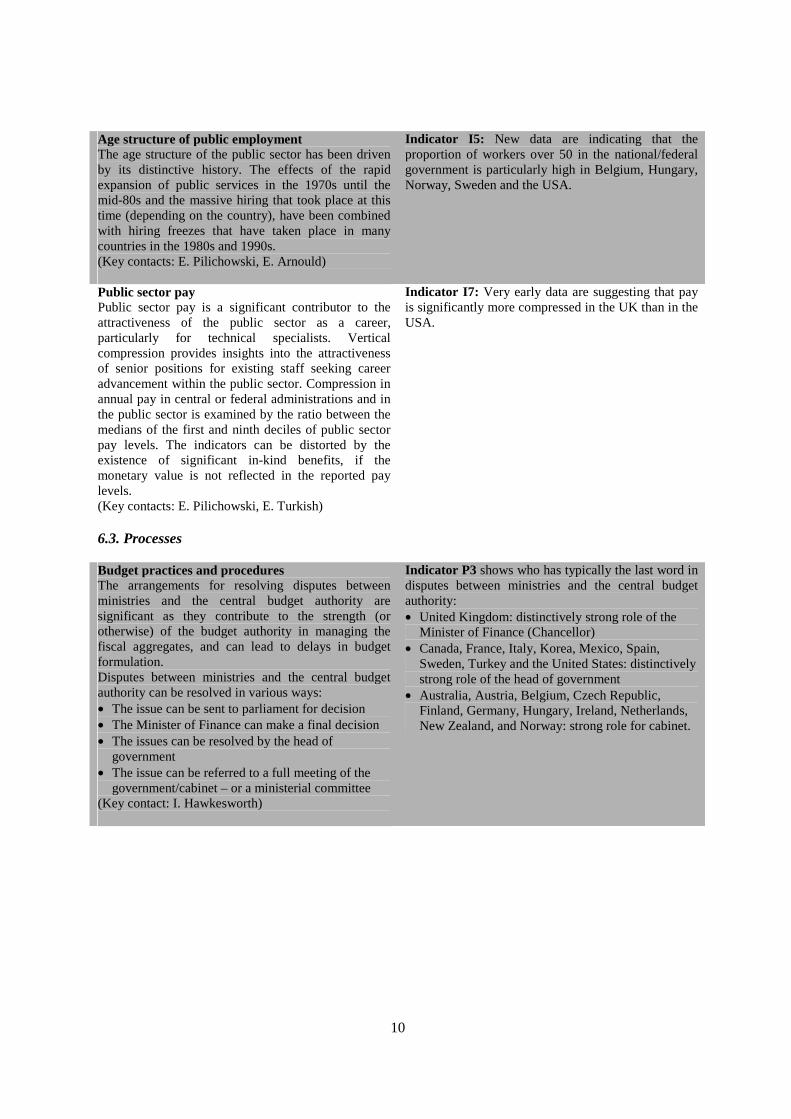
Age structure of public employment The age structure of the public sector has been driven by its distinctive history. The effects of the rapid expansion of public services in the 1970s until the mid-80s and the massive hiring that took place at this time (depending on the country), have been combined with hiring freezes that have taken place in many countries in the 1980s and 1990s. (Key contacts: E. Pilichowski, E. Arnould)
Indicator I5: New data are indicating that the proportion of workers over 50 in the national/federal government is particularly high in Belgium, Hungary, Norway, Sweden and the USA.
Public sector pay Public sector pay is a significant contributor to the attractiveness of the public sector as a career, particularly for technical specialists. Vertical compression provides insights into the attractiveness of senior positions for existing staff seeking career advancement within the public sector. Compression in annual pay in central or federal administrations and in the public sector is examined by the ratio between the medians of the first and ninth deciles of public sector pay levels. The indicators can be distorted by the existence of significant in-kind benefits, if the monetary value is not reflected in the reported pay levels. (Key contacts: E. Pilichowski, E. Turkish)
Indicator I7: Very early data are suggesting that pay is significantly more compressed in the UK than in the USA.
6.3. Processes
Budget practices and procedures The arrangements for resolving disputes between ministries and the central budget authority are significant as they contribute to the strength (or otherwise) of the budget authority in managing the fiscal aggregates, and can lead to delays in budget formulation. Disputes between ministries and the central budget authority can be resolved in various ways: • The issue can be sent to parliament for decision • The Minister of Finance can make a final decision • The issues can be resolved by the head of
government • The issue can be referred to a full meeting of the
government/cabinet – or a ministerial committee (Key contact: I. Hawkesworth)
Indicator P3 shows who has typically the last word in disputes between ministries and the central budget authority: • United Kingdom: distinctively strong role of the
Minister of Finance (Chancellor) • Canada, France, Italy, Korea, Mexico, Spain,
Sweden, Turkey and the United States: distinctively strong role of the head of government
• Australia, Austria, Belgium, Czech Republic, Finland, Germany, Hungary, Ireland, Netherlands, New Zealand, and Norway: strong role for cabinet.
11
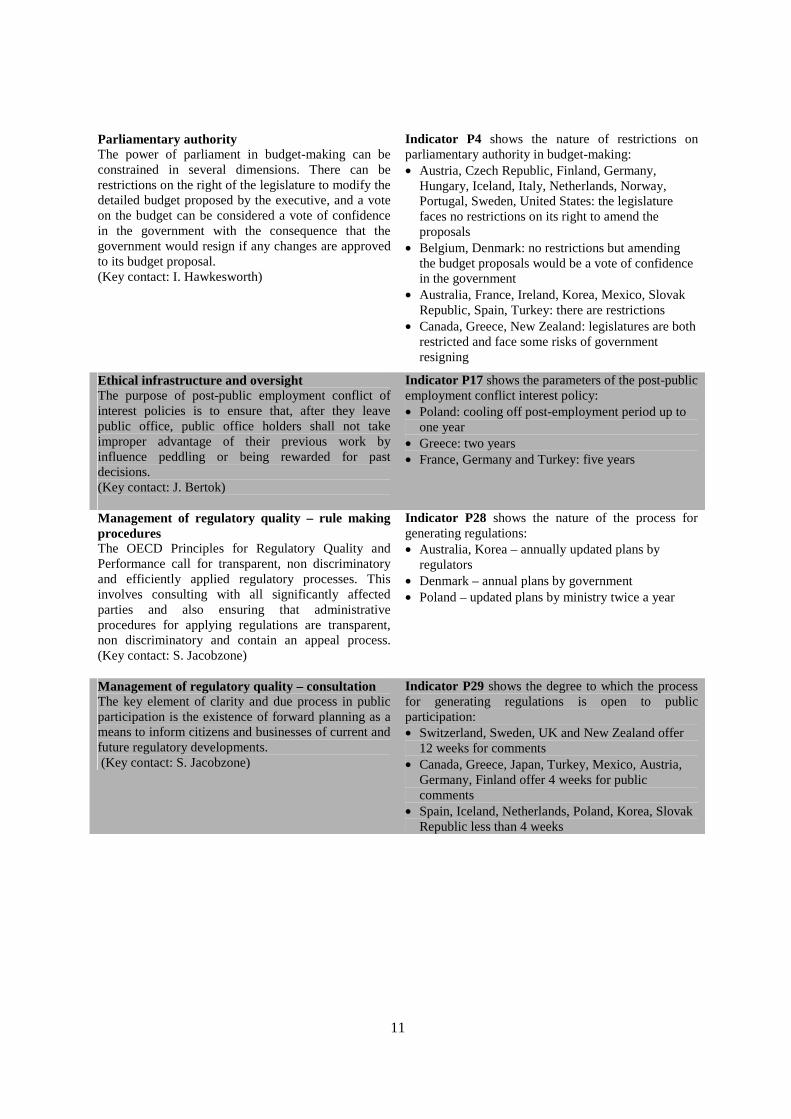
Parliamentary authority The power of parliament in budget-making can be constrained in several dimensions. There can be restrictions on the right of the legislature to modify the detailed budget proposed by the executive, and a vote on the budget can be considered a vote of confidence in the government with the consequence that the government would resign if any changes are approved to its budget proposal. (Key contact: I. Hawkesworth)
Indicator P4 shows the nature of restrictions on parliamentary authority in budget-making: • Austria, Czech Republic, Finland, Germany,
Hungary, Iceland, Italy, Netherlands, Norway, Portugal, Sweden, United States: the legislature faces no restrictions on its right to amend the proposals
• Belgium, Denmark: no restrictions but amending the budget proposals would be a vote of confidence in the government
• Australia, France, Ireland, Korea, Mexico, Slovak Republic, Spain, Turkey: there are restrictions
• Canada, Greece, New Zealand: legislatures are both restricted and face some risks of government resigning
Ethical infrastructure and oversight The purpose of post-public employment conflict of interest policies is to ensure that, after they leave public office, public office holders shall not take improper advantage of their previous work by influence peddling or being rewarded for past decisions. (Key contact: J. Bertok)
Indicator P17 shows the parameters of the post-public employment conflict interest policy: • Poland: cooling off post-employment period up to
one year • Greece: two years • France, Germany and Turkey: five years
Management of regulatory quality – rule making procedures The OECD Principles for Regulatory Quality and Performance call for transparent, non discriminatory and efficiently applied regulatory processes. This involves consulting with all significantly affected parties and also ensuring that administrative procedures for applying regulations are transparent, non discriminatory and contain an appeal process. (Key contact: S. Jacobzone)
Indicator P28 shows the nature of the process for generating regulations: • Australia, Korea – annually updated plans by
regulators • Denmark – annual plans by government • Poland – updated plans by ministry twice a year
Management of regulatory quality – consultation The key element of clarity and due process in public participation is the existence of forward planning as a means to inform citizens and businesses of current and future regulatory developments. (Key contact: S. Jacobzone)
Indicator P29 shows the degree to which the process for generating regulations is open to public participation: • Switzerland, Sweden, UK and New Zealand offer
12 weeks for comments • Canada, Greece, Japan, Turkey, Mexico, Austria,
Germany, Finland offer 4 weeks for public comments
• Spain, Iceland, Netherlands, Poland, Korea, Slovak Republic less than 4 weeks
12
6.4. Outputs (Central government)
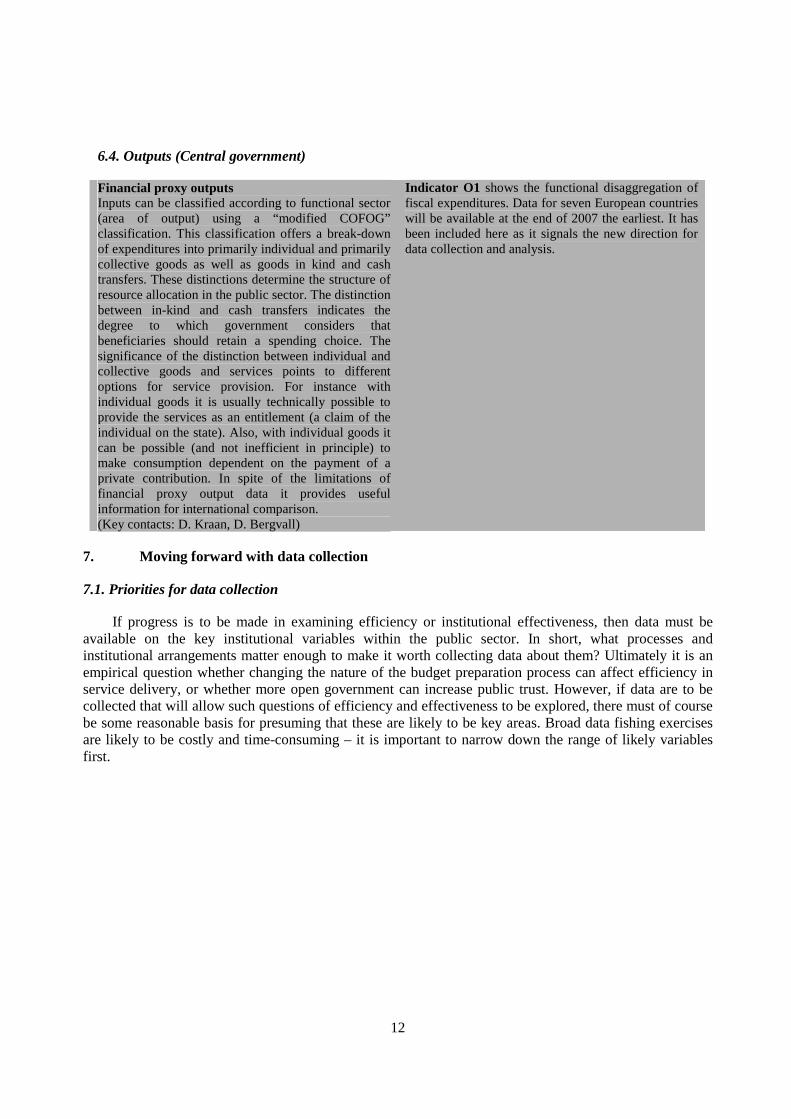
Financial proxy outputs Inputs can be classified according to functional sector (area of output) using a “modified COFOG” classification. This classification offers a break-down of expenditures into primarily individual and primarily collective goods as well as goods in kind and cash transfers. These distinctions determine the structure of resource allocation in the public sector. The distinction between in-kind and cash transfers indicates the degree to which government considers that beneficiaries should retain a spending choice. The significance of the distinction between individual and collective goods and services points to different options for service provision. For instance with individual goods it is usually technically possible to provide the services as an entitlement (a claim of the individual on the state). Also, with individual goods it can be possible (and not inefficient in principle) to make consumption dependent on the payment of a private contribution. In spite of the limitations of financial proxy output data it provides useful information for international comparison. (Key contacts: D. Kraan, D. Bergvall)
Indicator O1 shows the functional disaggregation of fiscal expenditures. Data for seven European countries will be available at the end of 2007 the earliest. It has been included here as it signals the new direction for data collection and analysis.
7. Moving forward with data collection
7.1. Priorities for data collection
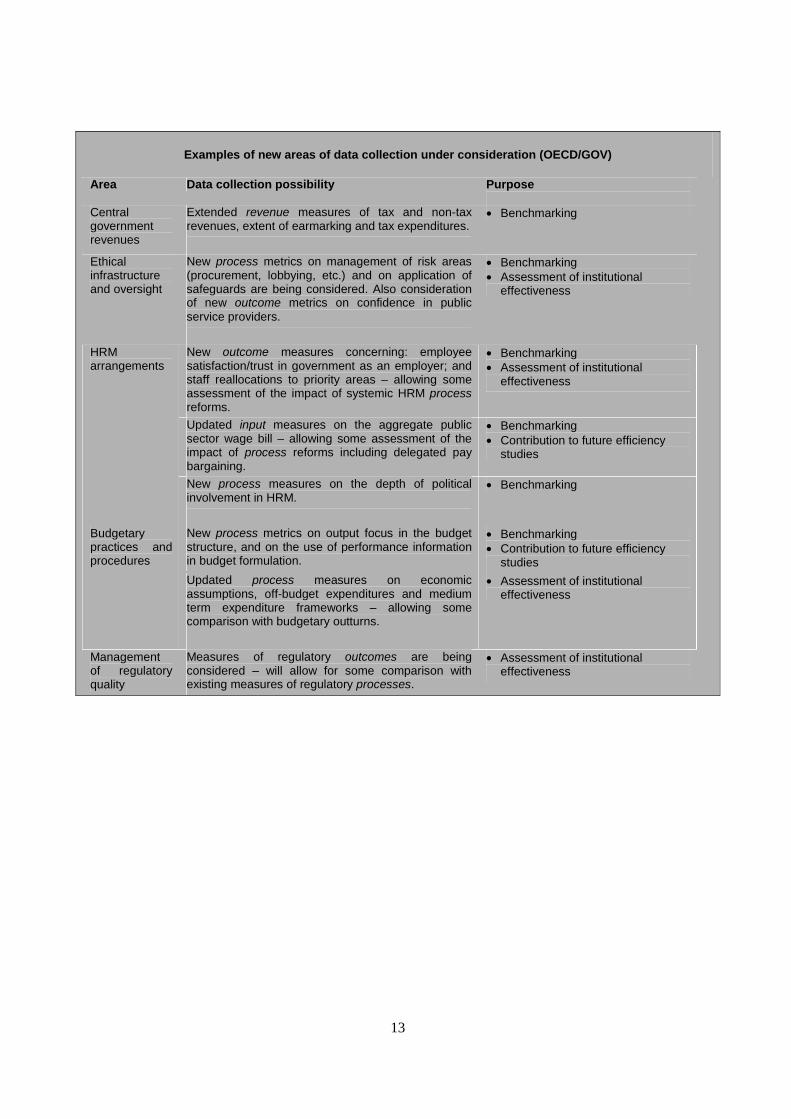
If progress is to be made in examining efficiency or institutional effectiveness, then data must be available on the key institutional variables within the public sector. In short, what processes and institutional arrangements matter enough to make it worth collecting data about them? Ultimately it is an empirical question whether changing the nature of the budget preparation process can affect efficiency in service delivery, or whether more open government can increase public trust. However, if data are to be collected that will allow such questions of efficiency and effectiveness to be explored, there must of course be some reasonable basis for presuming that these are likely to be key areas. Broad data fishing exercises are likely to be costly and time-consuming – it is important to narrow down the range of likely variables first.
13
Examples of new areas of data collection under consideration (OECD/GOV)
Area Data collection possibility Purpose
Central government revenues
Extended revenue measures of tax and non-tax revenues, extent of earmarking and tax expenditures.
• Benchmarking
Ethical infrastructure and oversight
New process metrics on management of risk areas (procurement, lobbying, etc.) and on application of safeguards are being considered. Also consideration of new outcome metrics on confidence in public service providers.
• Benchmarking • Assessment of institutional
effectiveness
New outcome measures concerning: employee satisfaction/trust in government as an employer; and staff reallocations to priority areas – allowing some assessment of the impact of systemic HRM process reforms.
• Benchmarking • Assessment of institutional
effectiveness
Updated input measures on the aggregate public sector wage bill – allowing some assessment of the impact of process reforms including delegated pay bargaining.
• Benchmarking • Contribution to future efficiency
studies
HRM arrangements
New process measures on the depth of political involvement in HRM.
• Benchmarking
New process metrics on output focus in the budget structure, and on the use of performance information in budget formulation.
• Benchmarking • Contribution to future efficiency
studies
Budgetary practices and procedures
Updated process measures on economic assumptions, off-budget expenditures and medium term expenditure frameworks – allowing some comparison with budgetary outturns.
• Assessment of institutional effectiveness
Management of regulatory quality
Measures of regulatory outcomes are being considered – will allow for some comparison with existing measures of regulatory processes.
• Assessment of institutional effectiveness
14
This is perhaps best undertaken by launching an extensive practitioner debate with relevant OECD expert groups and committees addressing the following questions:
1. Where will further benchmarking help?
a. Which specific data are necessary to assist?
b. Are the examples of new areas of data collection under consideration by GOV (see box above) heading in the right direction?
2. Which institutional arrangements matter for efficiency and effectiveness?
a. Which institutional arrangements are most likely to be the drivers of efficiency in service delivery (focusing on education, health, criminal justice, and transport)?
b. Which institutional arrangements are most likely to be associated with improvements in outcomes (see box on the left)?
c. Which particular measures would best capture these institutional arrangements?
3. Which additional output data should be collected?
a. Which output measures have the greatest resonance for governments?
b. Which measures will allow the development of relevant efficiency studies?8
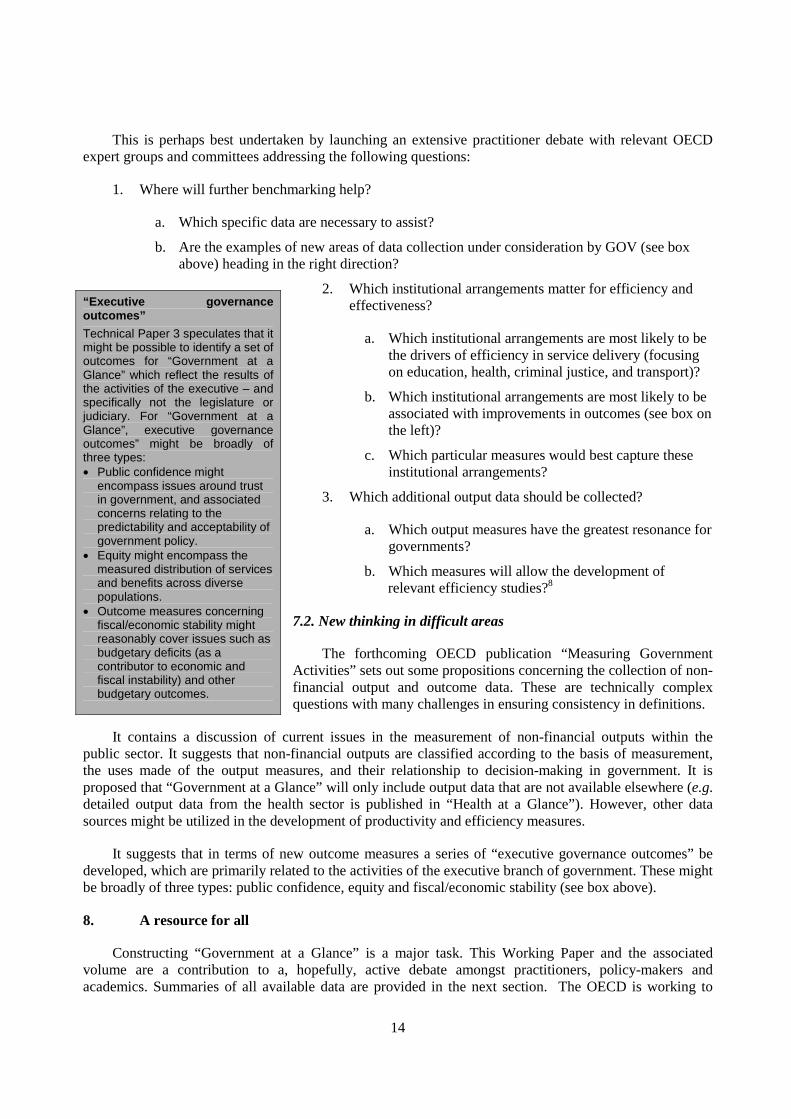
7.2. New thinking in difficult areas
The forthcoming OECD publication “Measuring Government Activities” sets out some propositions concerning the collection of non-financial output and outcome data. These are technically complex questions with many challenges in ensuring consistency in definitions.
It contains a discussion of current issues in the measurement of non-financial outputs within the public sector. It suggests that non-financial outputs are classified according to the basis of measurement, the uses made of the output measures, and their relationship to decision-making in government. It is proposed that “Government at a Glance” will only include output data that are not available elsewhere (e.g. detailed output data from the health sector is published in “Health at a Glance”). However, other data sources might be utilized in the development of productivity and efficiency measures.
It suggests that in terms of new outcome measures a series of “executive governance outcomes” be developed, which are primarily related to the activities of the executive branch of government. These might be broadly of three types: public confidence, equity and fiscal/economic stability (see box above).
8. A resource for all
Constructing “Government at a Glance” is a major task. This Working Paper and the associated volume are a contribution to a, hopefully, active debate amongst practitioners, policy-makers and academics. Summaries of all available data are provided in the next section. The OECD is working to
“Executive governance outcomes”
Technical Paper 3 speculates that it might be possible to identify a set of outcomes for “Government at a Glance” which reflect the results of the activities of the executive – and specifically not the legislature or judiciary. For “Government at a Glance”, executive governance outcomes” might be broadly of three types: • Public confidence might
encompass issues around trust in government, and associated concerns relating to the predictability and acceptability of government policy.
• Equity might encompass the measured distribution of services and benefits across diverse populations.
• Outcome measures concerning fiscal/economic stability might reasonably cover issues such as budgetary deficits (as a contributor to economic and fiscal instability) and other budgetary outcomes.
15
make these data available on-line as the ultimate intention is to allow the users to interpret the data rather than to reach a single conclusion. Comments and interpretations on the data and on the approach proposed for “Government at a Glance” are welcome at: [email protected].
1 Technical Paper 1: How and Why Should Government Activity Be Measured in "Government at a Glance"?
Technical Paper 2: Issues in Output Measurement for "Government at a Glance" Technical Paper 3: Issues in Outcome Measurement for "Government at a Glance"
2 Atkinson, Tony, Joe Grice, et al. (2005), Measurement of Government Output and Productivity for the National Accounts, Basingstoke, Palgraven, p.16.
3 World Bank Worldwide Governance Indicators: www.worldbank.org/wbi/governance/govdata/ Transparency International Corruption Perceptions Index:
www.transparency.org/policy_research/surveys_indices/cpi
World Bank "Doing Business" database: www.doingbusiness.org.
4 This characterisation builds on a framework that has been developed by Dirk-Jan Kraan, Elsa Pilichowski and Edouard Turkisch within the context of OECD work on the questionnaire for the Comparison of Employment in the Public Domain.
5 See footnote 8.
6 Based on:
Algemene Rekenkamer. 2006. Performance Audit Manual. The Hague: European Affairs & Government- wide Performance Audit Division, Netherlands Court of Audit. Boyne, George and Jennifer Law. 2004. "Designing Performance Measurements to Be Drawn on in the Second Generation of Local Public Service Agreements (Local PSAs)" (www.idea- knowledge.gov.uk/idk/aio/384232). Office of the Deputy Prime Minister. London Hatry, H.P. 1999. Performance Measurement: Getting Results. Washington, D.C.: Urban Institute Press. Pollitt, Christopher and Geert Bouckaert. 2004. Public Management Reform: A Comparative Analysis.
Oxford, UK: Oxford University Press. Van Dooren, Wouter, Miekatrien Sterck and Geert Bouckaert. 2006. "Recent Developments in Output
Measurement within the Public Sector: Report Prepared for the Organization for Economic Cooperation and Development". Public Management Institute, Katholieke Universiteit. Leuven, Belgium.
7 The precise definitions of the indicators are provided in the data annex.
8 There are arguments for cautiously broadening data collection to some non-OECD countries. However, those efforts will not compromise the quality or speed of collection of data for OECD countries.

16

17
AVAILABLE PUBLIC MANAGEMENT DATA
18
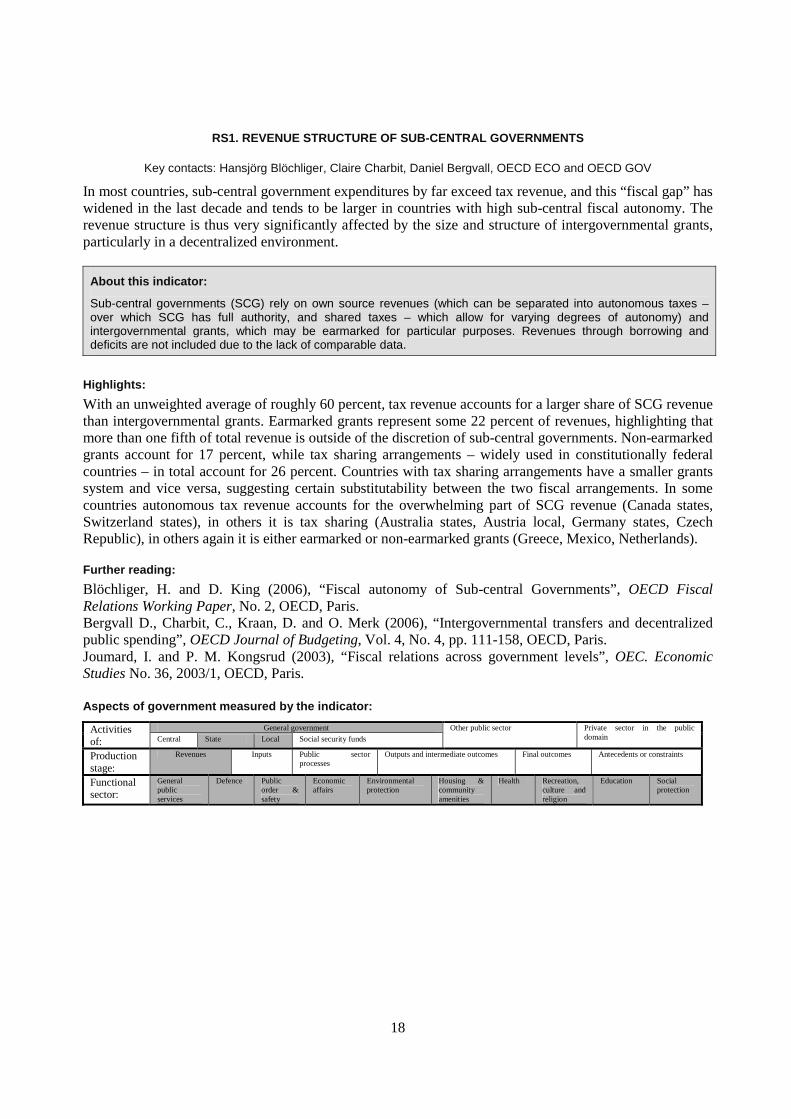
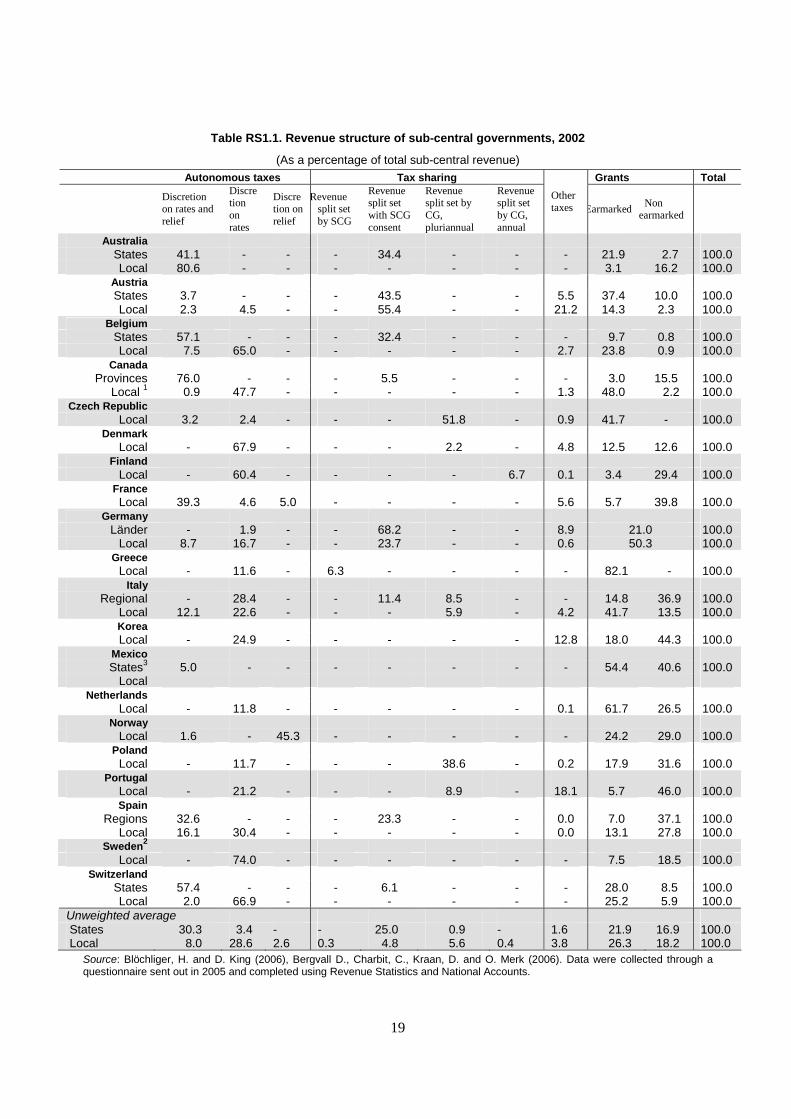
RS1. REVENUE STRUCTURE OF SUB-CENTRAL GOVERNMENTS
Key contacts: Hansjörg Blöchliger, Claire Charbit, Daniel Bergvall, OECD ECO and OECD GOV
In most countries, sub-central government expenditures by far exceed tax revenue, and this “fiscal gap” has widened in the last decade and tends to be larger in countries with high sub-central fiscal autonomy. The revenue structure is thus very significantly affected by the size and structure of intergovernmental grants, particularly in a decentralized environment.
About this indicator:
Sub-central governments (SCG) rely on own source revenues (which can be separated into autonomous taxes – over which SCG has full authority, and shared taxes – which allow for varying degrees of autonomy) and intergovernmental grants, which may be earmarked for particular purposes. Revenues through borrowing and deficits are not included due to the lack of comparable data.
Highlights:
With an unweighted average of roughly 60 percent, tax revenue accounts for a larger share of SCG revenue than intergovernmental grants. Earmarked grants represent some 22 percent of revenues, highlighting that more than one fifth of total revenue is outside of the discretion of sub-central governments. Non-earmarked grants account for 17 percent, while tax sharing arrangements – widely used in constitutionally federal countries – in total account for 26 percent. Countries with tax sharing arrangements have a smaller grants system and vice versa, suggesting certain substitutability between the two fiscal arrangements. In some countries autonomous tax revenue accounts for the overwhelming part of SCG revenue (Canada states, Switzerland states), in others it is tax sharing (Australia states, Austria local, Germany states, Czech Republic), in others again it is either earmarked or non-earmarked grants (Greece, Mexico, Netherlands).
Further reading:
Blöchliger, H. and D. King (2006), “Fiscal autonomy of Sub-central Governments”, OECD Fiscal Relations Working Paper, No. 2, OECD, Paris. Bergvall D., Charbit, C., Kraan, D. and O. Merk (2006), “Intergovernmental transfers and decentralized public spending”, OECD Journal of Budgeting, Vol. 4, No. 4, pp. 111-158, OECD, Paris. Joumard, I. and P. M. Kongsrud (2003), “Fiscal relations across government levels”, OEC. Economic Studies No. 36, 2003/1, OECD, Paris. Aspects of government measured by the indicator:
General government Activities of: Central State Local Social security funds
Other public sector Private sector in the public domain
Production stage:
Revenues Inputs Public sector processes
Outputs and intermediate outcomes Final outcomes Antecedents or constraints
Functional sector:
General public services
Defence Public order & safety
Economic affairs
Environmental protection
Housing & community amenities
Health Recreation, culture and religion
Education Social protection
19
Table RS1.1. Revenue structure of sub-central governments, 2002
(As a percentage of total sub-central revenue) Autonomous taxes Tax sharing Grants Total
Discretion on rates and relief
Discretion on rates
Discretion on relief
Revenue split set by SCG
Revenue split set with SCG consent
Revenue split set by CG, pluriannual
Revenue split set by CG, annual
Other taxes Earmarked
Non earmarked
Australia States 41.1 - - - 34.4 - - - 21.9 2.7 100.0 Local 80.6 - - - - - - - 3.1 16.2 100.0
Austria States 3.7 - - - 43.5 - - 5.5 37.4 10.0 100.0 Local 2.3 4.5 - - 55.4 - - 21.2 14.3 2.3 100.0
Belgium States 57.1 - - - 32.4 - - - 9.7 0.8 100.0 Local 7.5 65.0 - - - - - 2.7 23.8 0.9 100.0
Canada Provinces 76.0 - - - 5.5 - - - 3.0 15.5 100.0
Local 1 0.9 47.7 - - - - - 1.3 48.0 2.2 100.0 Czech Republic
Local 3.2 2.4 - - - 51.8 - 0.9 41.7 - 100.0 Denmark
Local - 67.9 - - - 2.2 - 4.8 12.5 12.6 100.0 Finland Local - 60.4 - - - - 6.7 0.1 3.4 29.4 100.0 France Local 39.3 4.6 5.0 - - - - 5.6 5.7 39.8 100.0
Germany Länder - 1.9 - - 68.2 - - 8.9 21.0 100.0
Local 8.7 16.7 - - 23.7 - - 0.6 50.3 100.0 Greece Local - 11.6 - 6.3 - - - - 82.1 - 100.0
Italy Regional - 28.4 - - 11.4 8.5 - - 14.8 36.9 100.0
Local 12.1 22.6 - - - 5.9 - 4.2 41.7 13.5 100.0 Korea Local - 24.9 - - - - - 12.8 18.0 44.3 100.0
Mexico States3 5.0 - - - - - - - 54.4 40.6 100.0
Local Netherlands
Local - 11.8 - - - - - 0.1 61.7 26.5 100.0 Norway Local 1.6 - 45.3 - - - - - 24.2 29.0 100.0
Poland Local - 11.7 - - - 38.6 - 0.2 17.9 31.6 100.0
Portugal Local - 21.2 - - - 8.9 - 18.1 5.7 46.0 100.0 Spain
Regions 32.6 - - - 23.3 - - 0.0 7.0 37.1 100.0 Local 16.1 30.4 - - - - - 0.0 13.1 27.8 100.0
Sweden2 Local - 74.0 - - - - - - 7.5 18.5 100.0
Switzerland States 57.4 - - - 6.1 - - - 28.0 8.5 100.0 Local 2.0 66.9 - - - - - - 25.2 5.9 100.0
Unweighted average States 30.3 3.4 - - 25.0 0.9 - 1.6 21.9 16.9 100.0 Local 8.0 28.6 2.6 0.3 4.8 5.6 0.4 3.8 26.3 18.2 100.0
Source: Blöchliger, H. and D. King (2006), Bergvall D., Charbit, C., Kraan, D. and O. Merk (2006). Data were collected through a questionnaire sent out in 2005 and completed using Revenue Statistics and National Accounts.
20
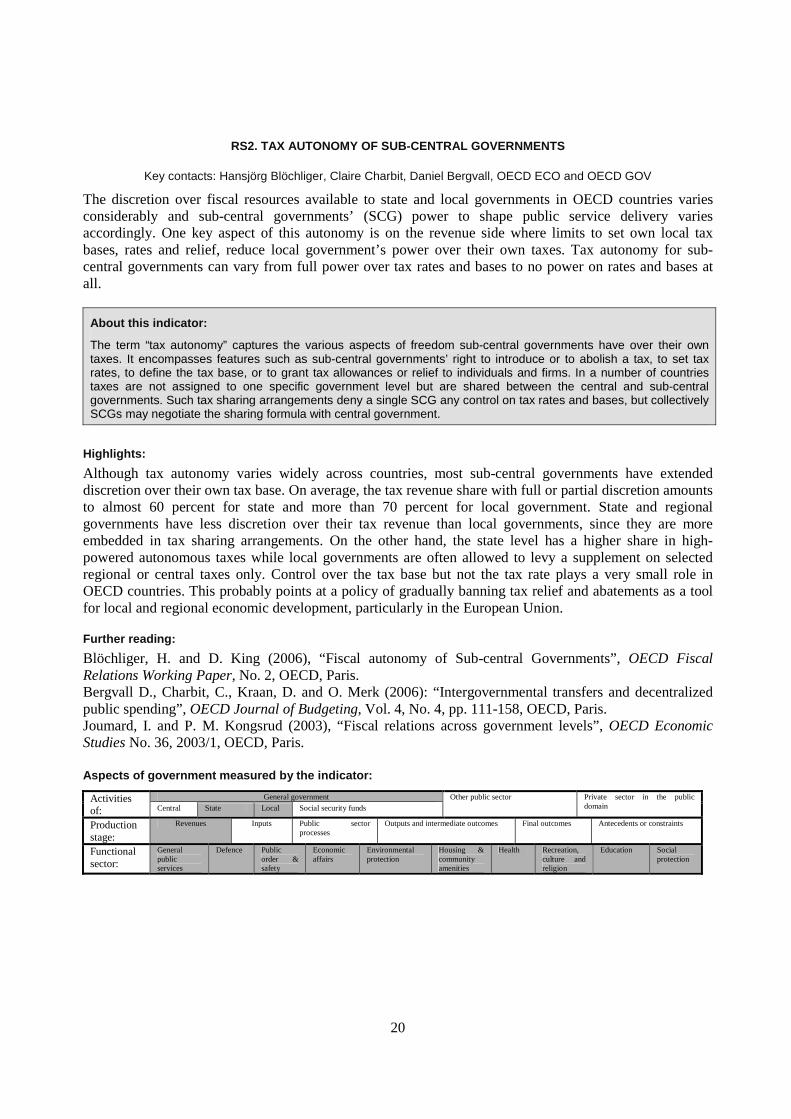
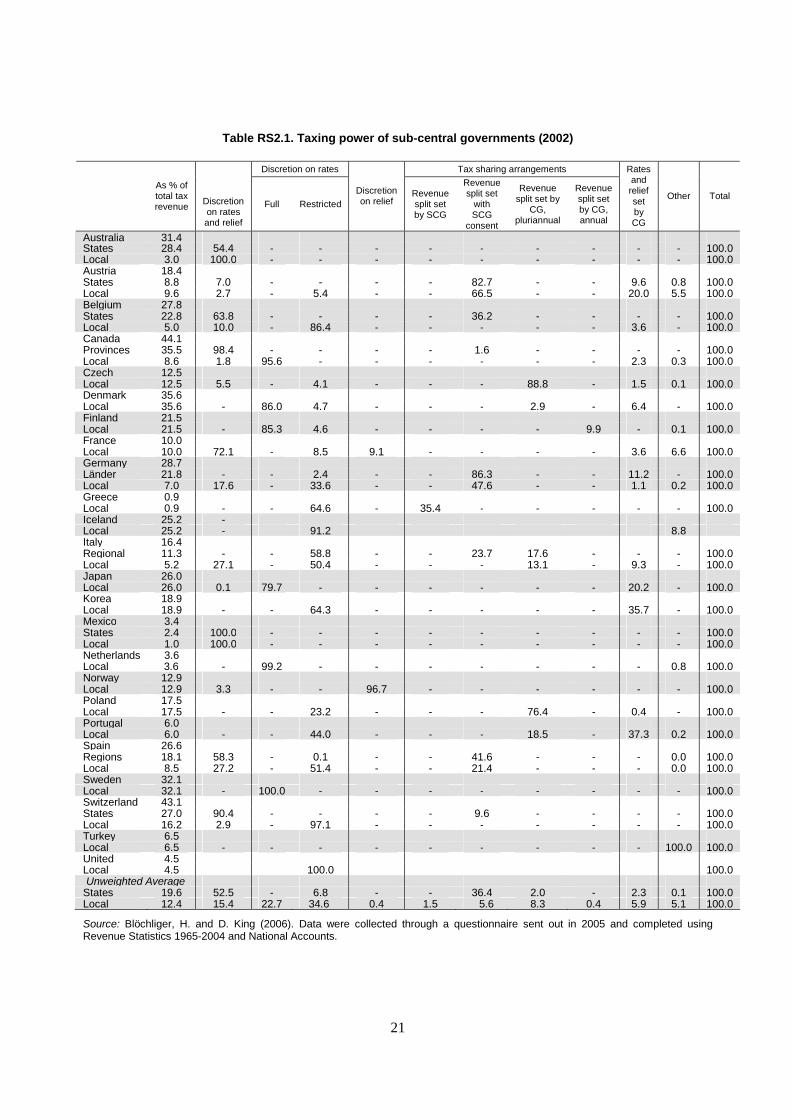
RS2. TAX AUTONOMY OF SUB-CENTRAL GOVERNMENTS
Key contacts: Hansjörg Blöchliger, Claire Charbit, Daniel Bergvall, OECD ECO and OECD GOV
The discretion over fiscal resources available to state and local governments in OECD countries varies considerably and sub-central governments’ (SCG) power to shape public service delivery varies accordingly. One key aspect of this autonomy is on the revenue side where limits to set own local tax bases, rates and relief, reduce local government’s power over their own taxes. Tax autonomy for sub-central governments can vary from full power over tax rates and bases to no power on rates and bases at all.
About this indicator:
The term “tax autonomy” captures the various aspects of freedom sub-central governments have over their own taxes. It encompasses features such as sub-central governments’ right to introduce or to abolish a tax, to set tax rates, to define the tax base, or to grant tax allowances or relief to individuals and firms. In a number of countries taxes are not assigned to one specific government level but are shared between the central and sub-central governments. Such tax sharing arrangements deny a single SCG any control on tax rates and bases, but collectively SCGs may negotiate the sharing formula with central government.
Highlights:
Although tax autonomy varies widely across countries, most sub-central governments have extended discretion over their own tax base. On average, the tax revenue share with full or partial discretion amounts to almost 60 percent for state and more than 70 percent for local government. State and regional governments have less discretion over their tax revenue than local governments, since they are more embedded in tax sharing arrangements. On the other hand, the state level has a higher share in high-powered autonomous taxes while local governments are often allowed to levy a supplement on selected regional or central taxes only. Control over the tax base but not the tax rate plays a very small role in OECD countries. This probably points at a policy of gradually banning tax relief and abatements as a tool for local and regional economic development, particularly in the European Union.
Further reading:
Blöchliger, H. and D. King (2006), “Fiscal autonomy of Sub-central Governments”, OECD Fiscal Relations Working Paper, No. 2, OECD, Paris. Bergvall D., Charbit, C., Kraan, D. and O. Merk (2006): “Intergovernmental transfers and decentralized public spending”, OECD Journal of Budgeting, Vol. 4, No. 4, pp. 111-158, OECD, Paris. Joumard, I. and P. M. Kongsrud (2003), “Fiscal relations across government levels”, OECD Economic Studies No. 36, 2003/1, OECD, Paris. Aspects of government measured by the indicator:
General government Activities of: Central State Local Social security funds
Other public sector Private sector in the public domain
Production stage:
Revenues Inputs Public sector processes
Outputs and intermediate outcomes Final outcomes Antecedents or constraints
Functional sector:
General public services
Defence Public order & safety
Economic affairs
Environmental protection
Housing & community amenities
Health Recreation, culture and religion
Education Social protection
21
Table RS2.1. Taxing power of sub-central governments (2002)
Discretion on rates Tax sharing arrangements
As % of total tax revenue
Discretion on rates and relief
Full Restricted
Discretion on relief
Revenue split set by SCG
Revenue split set
with SCG
consent
Revenue split set by
CG, pluriannual
Revenue split set by CG, annual
Rates and relief set by CG
Other Total
Australia 31.4 States 28.4 54.4 - - - - - - - - - 100.0 Local 3.0 100.0 - - - - - - - - - 100.0 Austria 18.4 States 8.8 7.0 - - - - 82.7 - - 9.6 0.8 100.0 Local 9.6 2.7 - 5.4 - - 66.5 - - 20.0 5.5 100.0 Belgium 27.8 States 22.8 63.8 - - - - 36.2 - - - - 100.0 Local 5.0 10.0 - 86.4 - - - - - 3.6 - 100.0 Canada 44.1 Provinces 35.5 98.4 - - - - 1.6 - - - - 100.0 Local 8.6 1.8 95.6 - - - - - - 2.3 0.3 100.0 Czech 12.5 Local 12.5 5.5 - 4.1 - - - 88.8 - 1.5 0.1 100.0 Denmark 35.6 Local 35.6 - 86.0 4.7 - - - 2.9 - 6.4 - 100.0 Finland 21.5 Local 21.5 - 85.3 4.6 - - - - 9.9 - 0.1 100.0 France 10.0 Local 10.0 72.1 - 8.5 9.1 - - - - 3.6 6.6 100.0 Germany 28.7 Länder 21.8 - - 2.4 - - 86.3 - - 11.2 - 100.0 Local 7.0 17.6 - 33.6 - - 47.6 - - 1.1 0.2 100.0 Greece 0.9 Local 0.9 - - 64.6 - 35.4 - - - - - 100.0 Iceland 25.2 - Local 25.2 - 91.2 8.8 Italy 16.4 Regional 11.3 - - 58.8 - - 23.7 17.6 - - - 100.0 Local 5.2 27.1 - 50.4 - - - 13.1 - 9.3 - 100.0 Japan 26.0 Local 26.0 0.1 79.7 - - - - - - 20.2 - 100.0 Korea 18.9 Local 18.9 - - 64.3 - - - - - 35.7 - 100.0 Mexico 3.4 States 2.4 100.0 - - - - - - - - - 100.0 Local 1.0 100.0 - - - - - - - - - 100.0 Netherlands 3.6 Local 3.6 - 99.2 - - - - - - - 0.8 100.0 Norway 12.9 Local 12.9 3.3 - - 96.7 - - - - - - 100.0 Poland 17.5 Local 17.5 - - 23.2 - - - 76.4 - 0.4 - 100.0 Portugal 6.0 Local 6.0 - - 44.0 - - - 18.5 - 37.3 0.2 100.0 Spain 26.6 Regions 18.1 58.3 - 0.1 - - 41.6 - - - 0.0 100.0 Local 8.5 27.2 - 51.4 - - 21.4 - - - 0.0 100.0 Sweden 32.1 Local 32.1 - 100.0 - - - - - - - - 100.0 Switzerland 43.1 States 27.0 90.4 - - - - 9.6 - - - - 100.0 Local 16.2 2.9 - 97.1 - - - - - - - 100.0 Turkey 6.5 Local 6.5 - - - - - - - - - 100.0 100.0 United 4.5 Local 4.5 100.0 100.0 Unweighted Average
States 19.6 52.5 - 6.8 - - 36.4 2.0 - 2.3 0.1 100.0 Local 12.4 15.4 22.7 34.6 0.4 1.5 5.6 8.3 0.4 5.9 5.1 100.0
Source: Blöchliger, H. and D. King (2006). Data were collected through a questionnaire sent out in 2005 and completed using Revenue Statistics 1965-2004 and National Accounts.
22
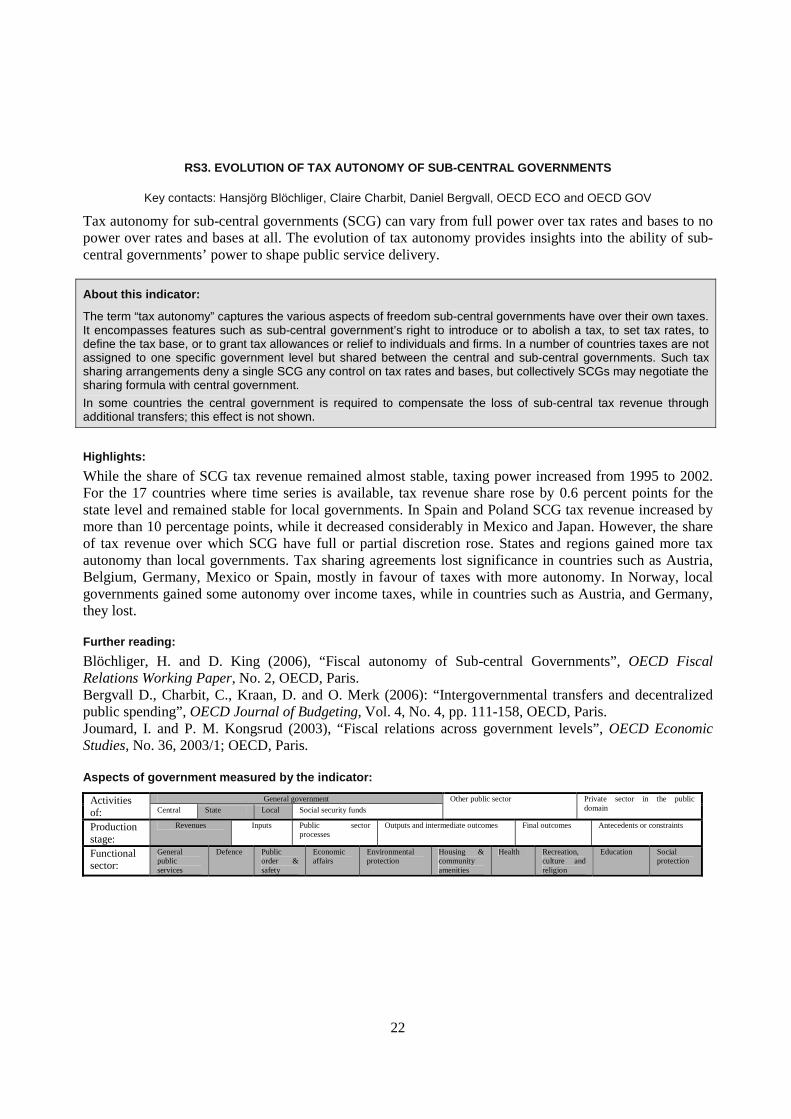
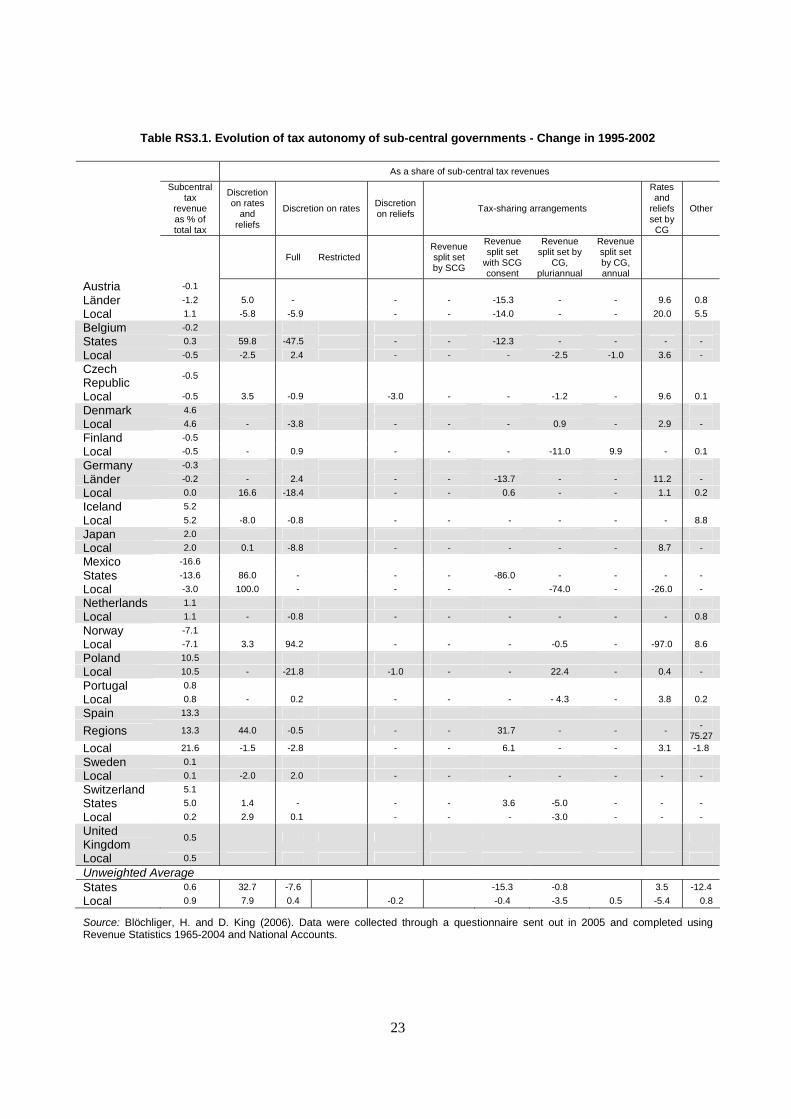
RS3. EVOLUTION OF TAX AUTONOMY OF SUB-CENTRAL GOVERNMENTS
Key contacts: Hansjörg Blöchliger, Claire Charbit, Daniel Bergvall, OECD ECO and OECD GOV
Tax autonomy for sub-central governments (SCG) can vary from full power over tax rates and bases to no power over rates and bases at all. The evolution of tax autonomy provides insights into the ability of sub-central governments’ power to shape public service delivery.
About this indicator:
The term “tax autonomy” captures the various aspects of freedom sub-central governments have over their own taxes. It encompasses features such as sub-central government’s right to introduce or to abolish a tax, to set tax rates, to define the tax base, or to grant tax allowances or relief to individuals and firms. In a number of countries taxes are not assigned to one specific government level but shared between the central and sub-central governments. Such tax sharing arrangements deny a single SCG any control on tax rates and bases, but collectively SCGs may negotiate the sharing formula with central government.
In some countries the central government is required to compensate the loss of sub-central tax revenue through additional transfers; this effect is not shown.
Highlights:
While the share of SCG tax revenue remained almost stable, taxing power increased from 1995 to 2002. For the 17 countries where time series is available, tax revenue share rose by 0.6 percent points for the state level and remained stable for local governments. In Spain and Poland SCG tax revenue increased by more than 10 percentage points, while it decreased considerably in Mexico and Japan. However, the share of tax revenue over which SCG have full or partial discretion rose. States and regions gained more tax autonomy than local governments. Tax sharing agreements lost significance in countries such as Austria, Belgium, Germany, Mexico or Spain, mostly in favour of taxes with more autonomy. In Norway, local governments gained some autonomy over income taxes, while in countries such as Austria, and Germany, they lost.
Further reading:
Blöchliger, H. and D. King (2006), “Fiscal autonomy of Sub-central Governments”, OECD Fiscal Relations Working Paper, No. 2, OECD, Paris. Bergvall D., Charbit, C., Kraan, D. and O. Merk (2006): “Intergovernmental transfers and decentralized public spending”, OECD Journal of Budgeting, Vol. 4, No. 4, pp. 111-158, OECD, Paris. Joumard, I. and P. M. Kongsrud (2003), “Fiscal relations across government levels”, OECD Economic Studies, No. 36, 2003/1; OECD, Paris. Aspects of government measured by the indicator:
General government Activities of: Central State Local Social security funds
Other public sector Private sector in the public domain
Production stage:
Revenues Inputs Public sector processes
Outputs and intermediate outcomes Final outcomes Antecedents or constraints
Functional sector:
General public services
Defence Public order & safety
Economic affairs
Environmental protection
Housing & community amenities
Health Recreation, culture and religion
Education Social protection
23
Table RS3.1. Evolution of tax autonomy of sub-central governments - Change in 1995-2002
As a share of sub-central tax revenues
Subcentral tax
revenue as % of total tax
Discretion on rates
and reliefs
Discretion on rates Discretion on reliefs
Tax-sharing arrangements
Rates and
reliefs set by
CG
Other
Full Restricted Revenue split set by SCG
Revenue split set
with SCG consent
Revenue split set by
CG, pluriannual
Revenue split set by CG, annual
Austria -0.1
Länder -1.2 5.0 - - - -15.3 - - 9.6 0.8
Local 1.1 -5.8 -5.9 - - -14.0 - - 20.0 5.5
Belgium -0.2
States 0.3 59.8 -47.5 - - -12.3 - - - -
Local -0.5 -2.5 2.4 - - - -2.5 -1.0 3.6 -
Czech Republic
-0.5
Local -0.5 3.5 -0.9 -3.0 - - -1.2 - 9.6 0.1
Denmark 4.6
Local 4.6 - -3.8 - - - 0.9 - 2.9 -
Finland -0.5
Local -0.5 - 0.9 - - - -11.0 9.9 - 0.1
Germany -0.3
Länder -0.2 - 2.4 - - -13.7 - - 11.2 -
Local 0.0 16.6 -18.4 - - 0.6 - - 1.1 0.2
Iceland 5.2
Local 5.2 -8.0 -0.8 - - - - - - 8.8
Japan 2.0
Local 2.0 0.1 -8.8 - - - - - 8.7 -
Mexico -16.6
States -13.6 86.0 - - - -86.0 - - - -
Local -3.0 100.0 - - - - -74.0 - -26.0 -
Netherlands 1.1
Local 1.1 - -0.8 - - - - - - 0.8
Norway -7.1
Local -7.1 3.3 94.2 - - - -0.5 - -97.0 8.6
Poland 10.5
Local 10.5 - -21.8 -1.0 - - 22.4 - 0.4 -
Portugal 0.8
Local 0.8 - 0.2 - - - - 4.3 - 3.8 0.2
Spain 13.3
Regions 13.3 44.0 -0.5 - - 31.7 - - - -75.27
Local 21.6 -1.5 -2.8 - - 6.1 - - 3.1 -1.8
Sweden 0.1
Local 0.1 -2.0 2.0 - - - - - - -
Switzerland 5.1
States 5.0 1.4 - - - 3.6 -5.0 - - -
Local 0.2 2.9 0.1 - - - -3.0 - - -
United Kingdom
0.5
Local 0.5
Unweighted Average
States 0.6 32.7 -7.6 -15.3 -0.8 3.5 -12.4
Local 0.9 7.9 0.4 -0.2 -0.4 -3.5 0.5 -5.4 0.8
Source: Blöchliger, H. and D. King (2006). Data were collected through a questionnaire sent out in 2005 and completed using Revenue Statistics 1965-2004 and National Accounts.
24
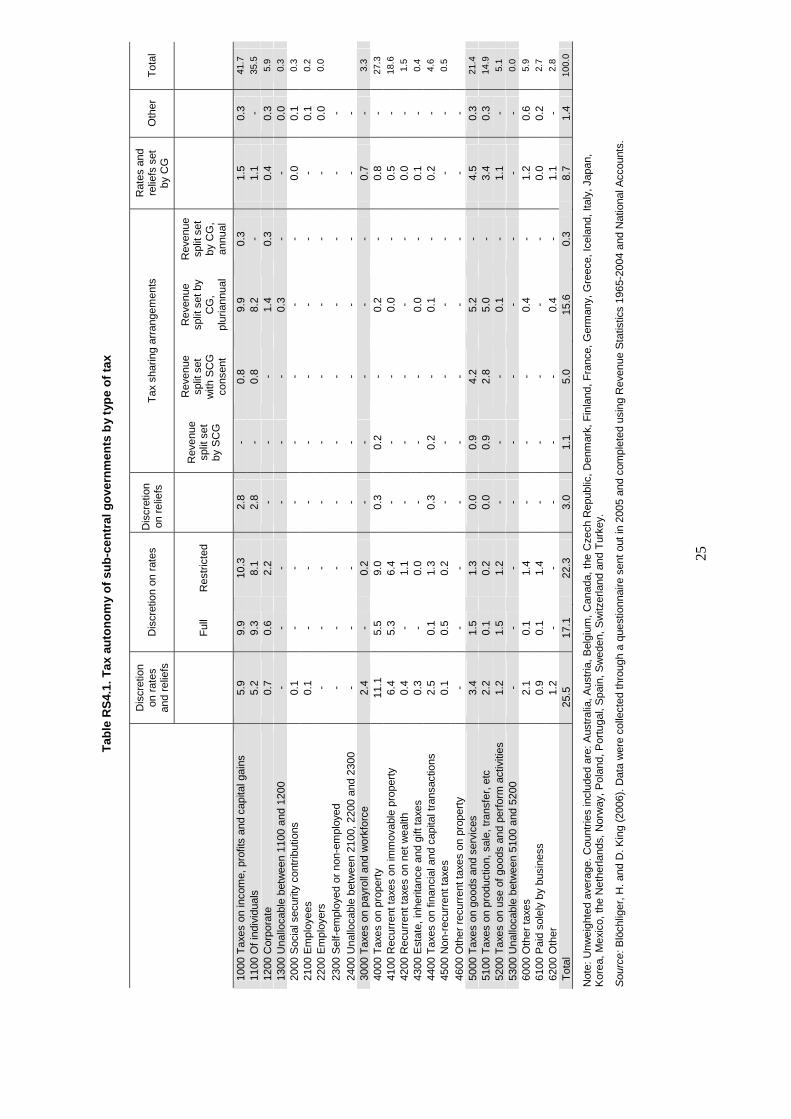
RS4. TAX AUTONOMY OF SUB-CENTRAL GOVERNMENTS BY TYPE OF TAX
Key contacts: Hansjörg Blöchliger, Claire Charbit, Daniel Bergvall, OECD ECO and OECD GOV
Tax autonomy for sub-central governments (SCG) can vary from full power over tax rates and bases to no power on rates and bases at all. The differences in tax autonomy by type of tax provide insights into the application of current beliefs about optimal tax location.
About this indicator:
The term “tax autonomy” captures the various aspects of freedom sub-central governments have over their own taxes. It encompasses features such as sub-central governments’ right to introduce or to abolish a tax, to set tax rates, to define the tax base, or to grant tax allowances or relief to individuals and firms. In a number of countries taxes are not assigned to one specific government level but are shared between the central and sub-central governments. Such tax sharing arrangements deny a single SCG any control on tax rates and bases, but collectively SCGs may negotiate the sharing formula with central government.
Highlights:
While fiscal federal theory asserts that mobile taxes should be allocated to higher levels of government, in practice the largest single tax assigned to local and regional governments is the highly mobile income tax on individuals, with 36 percent of total SCG tax revenue. If local corporate taxes are added, the share rises to more than 41 percent. Taxes on goods and services account for 21 percent of total SCG tax revenue. Taxes on immovable property, more liked by fiscal federal theorists, account for 19 percent only. While such local production and sales taxes are prone to externalities such as tax exportation, they may also help local governments to cover expenditures caused by individuals and firms from other jurisdictions. Property taxes are usually assigned more discretion than other taxes. Around a fourth of income tax revenue is embedded in tax sharing systems that restrict a single SCG’s control over this tax. Since many tax sharing arrangements include fiscal equalization, they counteract the drawbacks of local income taxation.
Further reading:
Blöchliger, H. and D. King (2006), “Fiscal Autonomy of Sub-Central Governments”, OECD Fiscal Relations Working Paper, No. 2, OECD, Paris. Bergvall D., Charbit, C., Kraan, D. and O. Merk (2006): “Intergovernmental Transfers and Decentralized Public Spending”, OECD Journal of Budgeting, Vol. 4, No. 4, pp. 111-158, OECD, Paris. Joumard, I. and P. M. Kongsrud (2003), “Fiscal Relations Across Government Levels”, OECD. Economic Studies No. 36, 2003/1, OECD, Paris. Aspects of government measured by the indicator:
General government Activities of: Central State Local Social security funds
Other public sector Private sector in the public domain
Production stage:
Revenues Inputs Public sector processes
Outputs and intermediate outcomes Final outcomes Antecedents or constraints
Functional sector:
General public services
Defence Public order & safety
Economic affairs
Environmental protection
Housing & community amenities
Health Recreation, culture and religion
Education Social protection
25
Tab
le R
S4.
1. T
ax a
uto
no
my
of
sub
-cen
tral
go
vern
men
ts b
y ty
pe
of
tax
D
iscr
etio
n on
rat
es
and
relie
fs
Dis
cret
ion
on r
ates
D
iscr
etio
n on
rel
iefs
T
ax s
harin
g ar
rang
emen
ts
Rat
es a
nd
relie
fs s
et
by C
G
Oth
er
Tot
al
Ful
l R
estr
icte
d
Rev
enue
sp
lit s
et
by S
CG
Rev
enue
sp
lit s
et
with
SC
G
cons
ent
Rev
enue
sp
lit s
et b
y C
G,
plur
iann
ual
Rev
enue
sp
lit s
et
by C
G,
annu
al
1000
Tax
es o
n in
com
e, p
rofit
s an
d ca
pita
l gai
ns
5.9
9.9
10.3
2.
8 -
0.8
9.9
0.3
1.5
0.3
41.7
11
00 O
f ind
ivid
uals
5.
2 9.
3 8.
1 2.
8 -
0.8
8.2
- 1.
1 -
35.5
12
00 C
orpo
rate
0.
7 0.
6 2.
2 -
- -
1.4
0.3
0.4
0.3
5.9
1300
Una
lloca
ble
betw
een
1100
and
120
0 -
- -
- -
- 0.
3 -
- 0.
0 0.
3 20
00 S
ocia
l sec
urity
con
trib
utio
ns
0.1
- -
- -
- -
- 0.
0 0.
1 0.
3 21
00 E
mpl
oyee
s 0.
1 -
- -
- -
- -
- 0.
1 0.
2 22
00 E
mpl
oyer
s -
- -
- -
- -
- -
0.0
0.0
2300
Sel
f-em
ploy
ed o
r no
n-em
ploy
ed
- -
- -
- -
- -
- -
2400
Una
lloca
ble
betw
een
2100
, 220
0 an
d 23
00
- -
- -
- -
- -
- -
30
00 T
axes
on
payr
oll a
nd w
orkf
orce
2.
4 -
0.2
- -
- -
- 0.
7 -
3.3
4000
Tax
es o
n pr
oper
ty
11.1
5.
5 9.
0 0.
3 0.
2 -
0.2
- 0.
8 -
27.3
41
00 R
ecur
rent
taxe
s on
imm
ovab
le p
rope
rty
6.4
5.3
6.4
- -
- 0.
0 -
0.5
- 18
.6
4200
Rec
urre
nt ta
xes
on n
et w
ealth
0.
4 -
1.1
- -
- -
- 0.
0 -
1.5
4300
Est
ate,
inhe
ritan
ce a
nd g
ift ta
xes
0.3
- 0.
0 -
- -
0.0
- 0.
1 -
0.4
4400
Tax
es o
n fin
anci
al a
nd c
apita
l tra
nsac
tions
2.
5 0.
1 1.
3 0.
3 0.
2 -
0.1
- 0.
2 -
4.6
4500
Non
-rec
urre
nt ta
xes
0.1
0.5
0.2
- -
- -
- -
- 0.
5
4600
Oth
er r
ecur
rent
taxe
s on
pro
pert
y -
- -
- -
- -
- -
-
5000
Tax
es o
n go
ods
and
serv
ices
3.
4 1.
5 1.
3 0.
0 0.
9 4.
2 5.
2 -
4.5
0.3
21.4
51
00 T
axes
on
prod
uctio
n, s
ale,
tran
sfer
, etc
2.
2 0.
1 0.
2 0.
0 0.
9 2.
8 5.
0 -
3.4
0.3
14.9
52
00 T
axes
on
use
of g
oods
and
per
form
act
iviti
es
1.2
1.5
1.2
- -
- 0.
1 -
1.1
- 5.
1 53
00 U
nallo
cabl
e be
twee
n 51
00 a
nd 5
200
- -
- -
- -
- -
- -
0.0
6000
Oth
er ta
xes
2.1
0.1
1.4
- -
- 0.
4 -
1.2
0.6
5.9
6100
Pai
d so
lely
by
busi
ness
0.
9 0.
1 1.
4 -
- -
- -
0.0
0.2
2.7
6200
Oth
er
1.2
- -
- -
- 0.
4 -
1.1
- 2.
8 T
otal
25.5
17
.1
22.3
3.
0 1.
1 5.
0 15
.6
0.3
8.7
1.4
100.
0
Not
e: U
nwei
ghte
d av
erag
e. C
ount
ries
incl
uded
are
: Aus
tral
ia, A
ustr
ia, B
elgi
um, C
anad
a, th
e C
zech
Rep
ublic
, Den
mar
k, F
inla
nd, F
ranc
e, G
erm
any,
Gre
ece,
Icel
and,
Ital
y, J
apan
, K
orea
, Mex
ico,
the
Net
herla
nds,
Nor
way
, Pol
and,
Por
tuga
l, S
pain
, Sw
eden
, Sw
itzer
land
and
Tur
key.
Sou
rce:
Blö
chlig
er, H
. and
D. K
ing
(200
6). D
ata
wer
e co
llect
ed th
roug
h a
ques
tionn
aire
sen
t out
in 2
005
and
com
plet
ed u
sing
Rev
enue
Sta
tistic
s 19
65-2
004
and
Nat
iona
l Acc
ount
s.
26
RS5. GRANTS BY DONOR AND RECIPIENT
Key contacts: Hansjörg Blöchliger, Claire Charbit, Daniel Bergvall, OECD ECO and OECD GOV
National Accounts data can provide a donor/recipient matrix of intergovernmental grants, with five donor levels (central, state, local, international and social security) and – depending on the country type – one or two recipient levels (local, or state and local). The category “international” displays funds directly allocated to sub-central government in some countries (e.g. EU grants).
About this indicator:
In reality, intergovernmental grants (or transfers) are an expenditure item, and they should be set in relation to total expenditure. However, National Accounts data on government expenditure are lacking for a number of countries under scrutiny, so total revenue was taken from the Revenue Statistics as a proxy.
Highlights:
On an unweighted average, grants account for 26 percent of total tax revenue (state and local levels combined); with Mexico having the largest grant system (43% of total tax revenue) and Iceland having the smallest (2%). At 72 percent, central government provides the overwhelming part of grants to local governments in both federal and unitary countries. In federal countries the central level is the main provider for states and regions with 86 percent. In the majority of federal countries (Belgium, Canada, Germany, Switzerland) state government is the main source for local governments. Nearly 3 percent of all grants flow between states/regions and only slightly less percent between local governments, pointing at various horizontal agreements or horizontal fiscal equalization schemes.
Further reading:
Blöchliger, H. and D. King (2006), “Fiscal autonomy of Sub-central Governments”, OECD Fiscal Relations Working Paper, No. 2, OECD, Paris. Bergvall D., Charbit, C., Kraan, D. and O. Merk (2006): “Intergovernmental transfers and decentralized public spending”, OECD Journal of Budgeting, Vol. 4, No. 4, pp. 111-158, OECD, Paris. Joumard, I. and P. M. Kongsrud (2003), “Fiscal relations across government levels”, OECD. Economic Studies No. 36, 2003/1; OECD, Paris. Aspects of government measured by the indicator:
General government Activities of: Central State Local Social security funds
Other public sector Private sector in the public domain
Production stage:
Revenues Inputs Public sector processes
Outputs and intermediate outcomes Final outcomes Antecedents or constraints
Functional sector:
General public services
Defence Public order & safety
Economic affairs
Environmental protection
Housing & community amenities
Health Recreation, culture and religion
Education Social protection
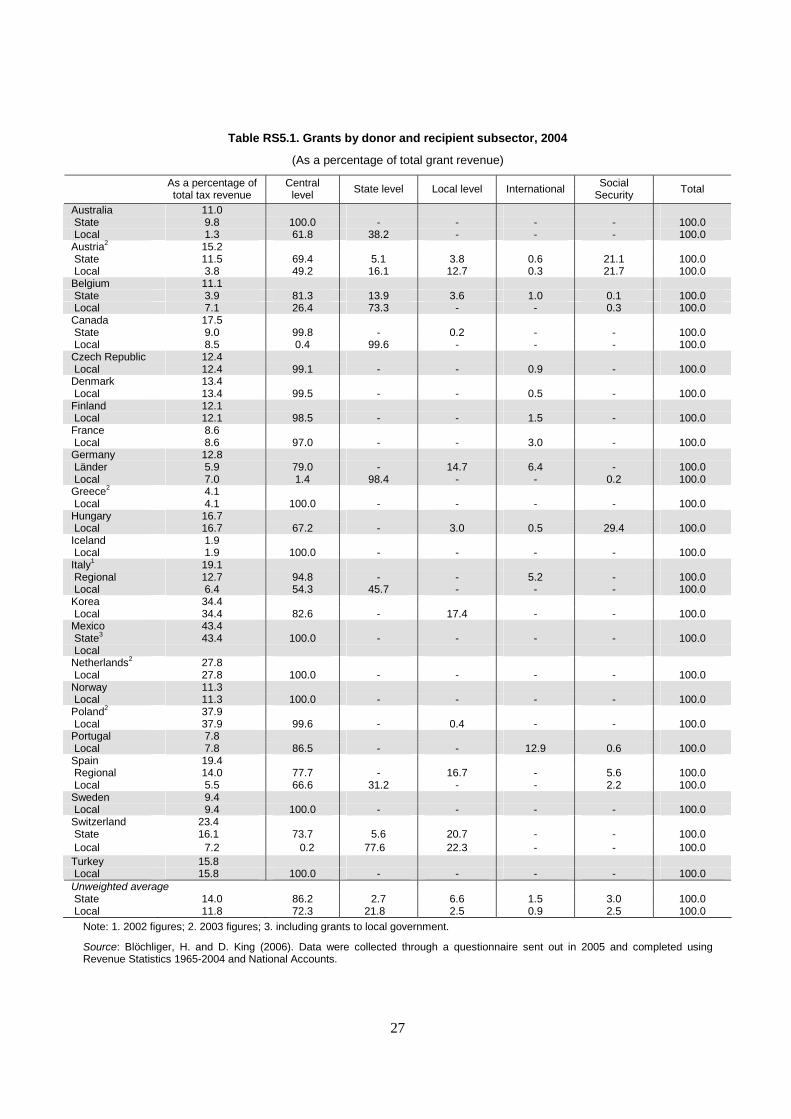
27
Table RS5.1. Grants by donor and recipient subsector, 2004
(As a percentage of total grant revenue)
As a percentage of total tax revenue
Central level State level Local level International Social
Security Total
Australia 11.0 State 9.8 100.0 - - - - 100.0 Local 1.3 61.8 38.2 - - - 100.0 Austria2 15.2 State 11.5 69.4 5.1 3.8 0.6 21.1 100.0 Local 3.8 49.2 16.1 12.7 0.3 21.7 100.0 Belgium 11.1 State 3.9 81.3 13.9 3.6 1.0 0.1 100.0 Local 7.1 26.4 73.3 - - 0.3 100.0 Canada 17.5 State 9.0 99.8 - 0.2 - - 100.0 Local 8.5 0.4 99.6 - - - 100.0 Czech Republic 12.4 Local 12.4 99.1 - - 0.9 - 100.0 Denmark 13.4 Local 13.4 99.5 - - 0.5 - 100.0 Finland 12.1 Local 12.1 98.5 - - 1.5 - 100.0 France 8.6 Local 8.6 97.0 - - 3.0 - 100.0 Germany 12.8 Länder 5.9 79.0 - 14.7 6.4 - 100.0 Local 7.0 1.4 98.4 - - 0.2 100.0 Greece2 4.1 Local 4.1 100.0 - - - - 100.0 Hungary 16.7 Local 16.7 67.2 - 3.0 0.5 29.4 100.0 Iceland 1.9 Local 1.9 100.0 - - - - 100.0 Italy1 19.1 Regional 12.7 94.8 - - 5.2 - 100.0 Local 6.4 54.3 45.7 - - - 100.0 Korea 34.4 Local 34.4 82.6 - 17.4 - - 100.0 Mexico 43.4 State3 43.4 100.0 - - - - 100.0 Local Netherlands2 27.8 Local 27.8 100.0 - - - - 100.0 Norway 11.3 Local 11.3 100.0 - - - - 100.0 Poland2 37.9 Local 37.9 99.6 - 0.4 - - 100.0 Portugal 7.8 Local 7.8 86.5 - - 12.9 0.6 100.0 Spain 19.4 Regional 14.0 77.7 - 16.7 - 5.6 100.0 Local 5.5 66.6 31.2 - - 2.2 100.0 Sweden 9.4 Local 9.4 100.0 - - - - 100.0 Switzerland 23.4 State 16.1 73.7 5.6 20.7 - - 100.0 Local 7.2 0.2 77.6 22.3 - - 100.0 Turkey 15.8 Local 15.8 100.0 - - - - 100.0 Unweighted average State 14.0 86.2 2.7 6.6 1.5 3.0 100.0 Local 11.8 72.3 21.8 2.5 0.9 2.5 100.0
Note: 1. 2002 figures; 2. 2003 figures; 3. including grants to local government.
Source: Blöchliger, H. and D. King (2006). Data were collected through a questionnaire sent out in 2005 and completed using Revenue Statistics 1965-2004 and National Accounts.
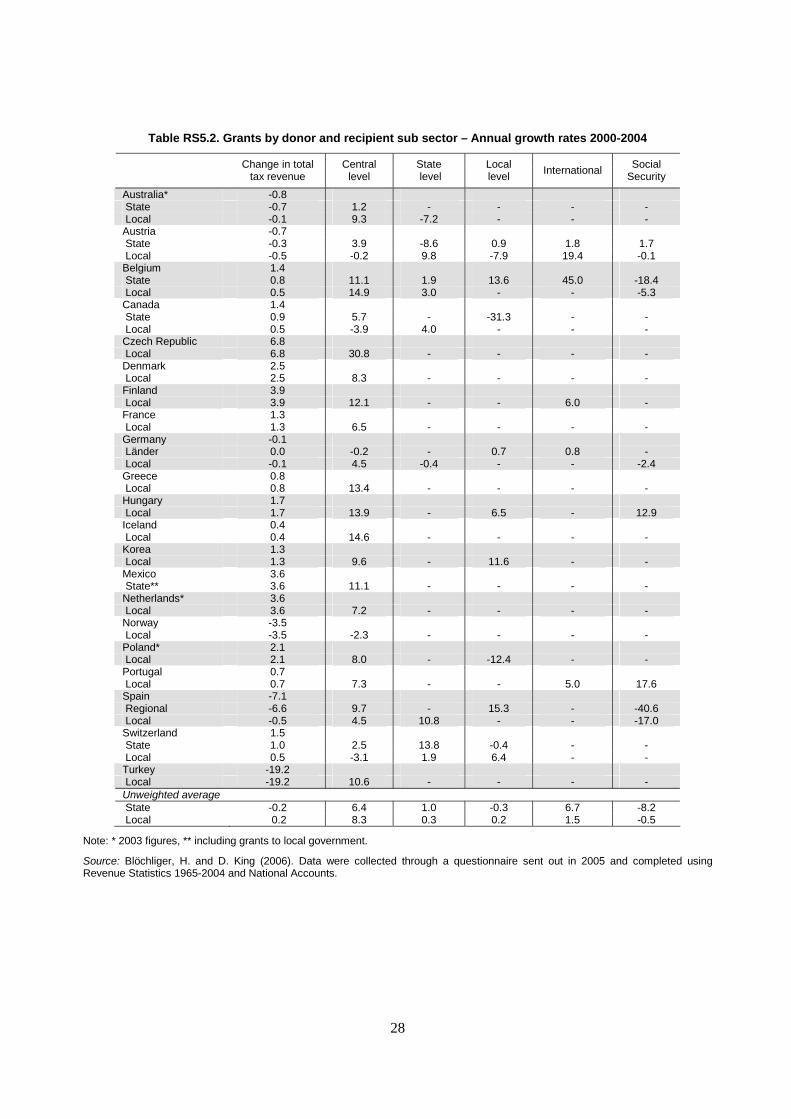
28
Table RS5.2. Grants by donor and recipient sub sector – Annual growth rates 2000-2004
Change in total
tax revenue Central
level State level
Local level
International Social Security
Australia* -0.8 State -0.7 1.2 - - - - Local -0.1 9.3 -7.2 - - - Austria -0.7 State -0.3 3.9 -8.6 0.9 1.8 1.7 Local -0.5 -0.2 9.8 -7.9 19.4 -0.1 Belgium 1.4 State 0.8 11.1 1.9 13.6 45.0 -18.4 Local 0.5 14.9 3.0 - - -5.3 Canada 1.4 State 0.9 5.7 - -31.3 - - Local 0.5 -3.9 4.0 - - - Czech Republic 6.8 Local 6.8 30.8 - - - - Denmark 2.5 Local 2.5 8.3 - - - - Finland 3.9 Local 3.9 12.1 - - 6.0 - France 1.3 Local 1.3 6.5 - - - - Germany -0.1 Länder 0.0 -0.2 - 0.7 0.8 - Local -0.1 4.5 -0.4 - - -2.4 Greece 0.8 Local 0.8 13.4 - - - - Hungary 1.7 Local 1.7 13.9 - 6.5 - 12.9 Iceland 0.4 Local 0.4 14.6 - - - - Korea 1.3 Local 1.3 9.6 - 11.6 - - Mexico 3.6 State** 3.6 11.1 - - - - Netherlands* 3.6 Local 3.6 7.2 - - - - Norway -3.5 Local -3.5 -2.3 - - - - Poland* 2.1 Local 2.1 8.0 - -12.4 - - Portugal 0.7 Local 0.7 7.3 - - 5.0 17.6 Spain -7.1 Regional -6.6 9.7 - 15.3 - -40.6 Local -0.5 4.5 10.8 - - -17.0 Switzerland 1.5 State 1.0 2.5 13.8 -0.4 - - Local 0.5 -3.1 1.9 6.4 - - Turkey -19.2 Local -19.2 10.6 - - - - Unweighted average State -0.2 6.4 1.0 -0.3 6.7 -8.2 Local 0.2 8.3 0.3 0.2 1.5 -0.5
Note: * 2003 figures, ** including grants to local government.
Source: Blöchliger, H. and D. King (2006). Data were collected through a questionnaire sent out in 2005 and completed using Revenue Statistics 1965-2004 and National Accounts.

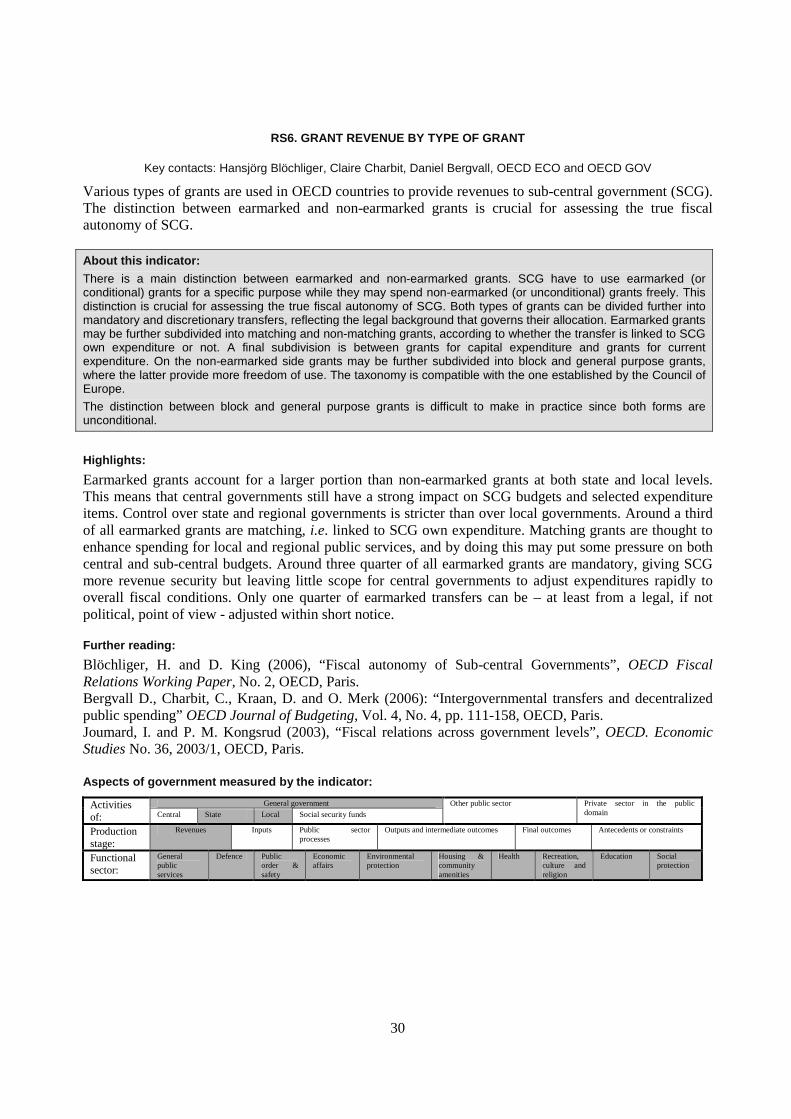
30
RS6. GRANT REVENUE BY TYPE OF GRANT
Key contacts: Hansjörg Blöchliger, Claire Charbit, Daniel Bergvall, OECD ECO and OECD GOV
Various types of grants are used in OECD countries to provide revenues to sub-central government (SCG). The distinction between earmarked and non-earmarked grants is crucial for assessing the true fiscal autonomy of SCG.
About this indicator:
There is a main distinction between earmarked and non-earmarked grants. SCG have to use earmarked (or conditional) grants for a specific purpose while they may spend non-earmarked (or unconditional) grants freely. This distinction is crucial for assessing the true fiscal autonomy of SCG. Both types of grants can be divided further into mandatory and discretionary transfers, reflecting the legal background that governs their allocation. Earmarked grants may be further subdivided into matching and non-matching grants, according to whether the transfer is linked to SCG own expenditure or not. A final subdivision is between grants for capital expenditure and grants for current expenditure. On the non-earmarked side grants may be further subdivided into block and general purpose grants, where the latter provide more freedom of use. The taxonomy is compatible with the one established by the Council of Europe.
The distinction between block and general purpose grants is difficult to make in practice since both forms are unconditional.
Highlights:
Earmarked grants account for a larger portion than non-earmarked grants at both state and local levels. This means that central governments still have a strong impact on SCG budgets and selected expenditure items. Control over state and regional governments is stricter than over local governments. Around a third of all earmarked grants are matching, i.e. linked to SCG own expenditure. Matching grants are thought to enhance spending for local and regional public services, and by doing this may put some pressure on both central and sub-central budgets. Around three quarter of all earmarked grants are mandatory, giving SCG more revenue security but leaving little scope for central governments to adjust expenditures rapidly to overall fiscal conditions. Only one quarter of earmarked transfers can be – at least from a legal, if not political, point of view - adjusted within short notice.
Further reading:
Blöchliger, H. and D. King (2006), “Fiscal autonomy of Sub-central Governments”, OECD Fiscal Relations Working Paper, No. 2, OECD, Paris. Bergvall D., Charbit, C., Kraan, D. and O. Merk (2006): “Intergovernmental transfers and decentralized public spending” OECD Journal of Budgeting, Vol. 4, No. 4, pp. 111-158, OECD, Paris. Joumard, I. and P. M. Kongsrud (2003), “Fiscal relations across government levels”, OECD. Economic Studies No. 36, 2003/1, OECD, Paris. Aspects of government measured by the indicator:
General government Activities of: Central State Local Social security funds
Other public sector Private sector in the public domain
Production stage:
Revenues Inputs Public sector processes
Outputs and intermediate outcomes Final outcomes Antecedents or constraints
Functional sector:
General public services
Defence Public order & safety
Economic affairs
Environmental protection
Housing & community amenities
Health Recreation, culture and religion
Education Social protection
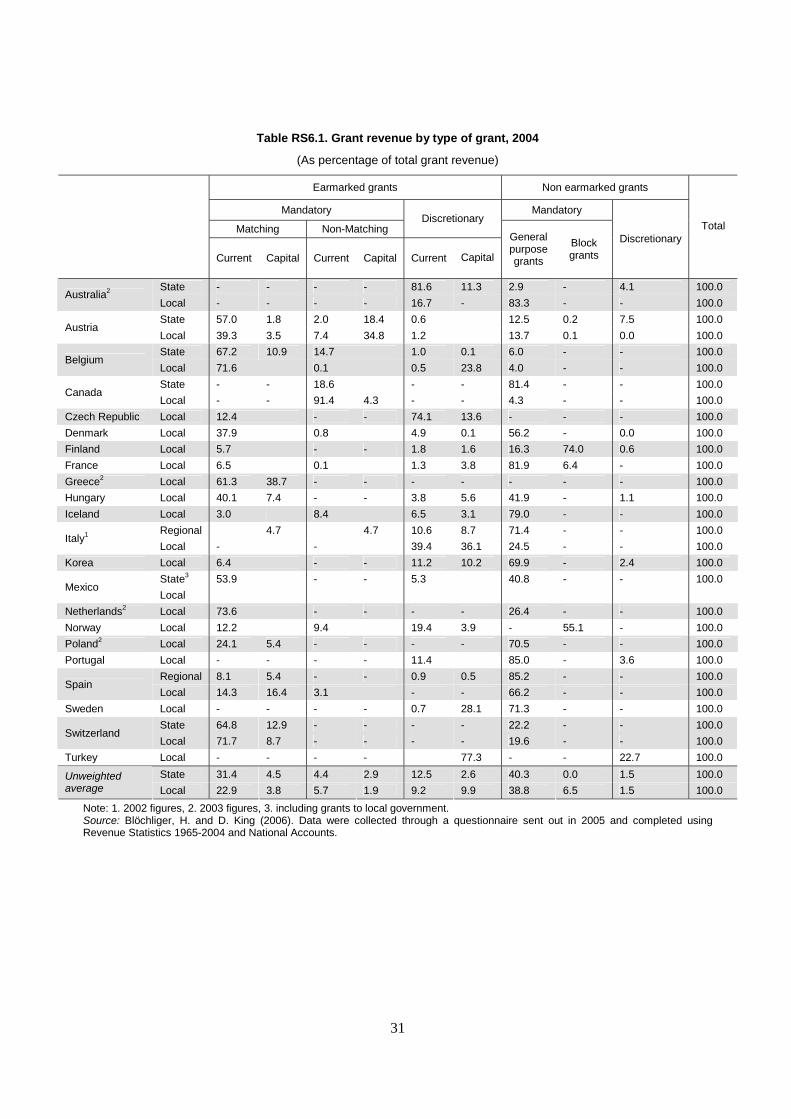
31
Table RS6.1. Grant revenue by type of grant, 2004
(As percentage of total grant revenue)
Earmarked grants Non earmarked grants
Mandatory Mandatory
Matching Non-Matching Discretionary
Current Capital Current Capital Current Capital
General purpose grants
Block grants
Discretionary Total
State - - - - 81.6 11.3 2.9 - 4.1 100.0 Australia2
Local - - - - 16.7 - 83.3 - - 100.0
State 57.0 1.8 2.0 18.4 0.6 12.5 0.2 7.5 100.0 Austria
Local 39.3 3.5 7.4 34.8 1.2 13.7 0.1 0.0 100.0
State 67.2 10.9 14.7 1.0 0.1 6.0 - - 100.0 Belgium
Local 71.6 0.1 0.5 23.8 4.0 - - 100.0
State - - 18.6 - - 81.4 - - 100.0 Canada
Local - - 91.4 4.3 - - 4.3 - - 100.0
Czech Republic Local 12.4 - - 74.1 13.6 - - - 100.0
Denmark Local 37.9 0.8 4.9 0.1 56.2 - 0.0 100.0
Finland Local 5.7 - - 1.8 1.6 16.3 74.0 0.6 100.0
France Local 6.5 0.1 1.3 3.8 81.9 6.4 - 100.0
Greece2 Local 61.3 38.7 - - - - - - - 100.0
Hungary Local 40.1 7.4 - - 3.8 5.6 41.9 - 1.1 100.0
Iceland Local 3.0 8.4 6.5 3.1 79.0 - - 100.0
Regional 4.7 4.7 10.6 8.7 71.4 - - 100.0 Italy1
Local - - 39.4 36.1 24.5 - - 100.0
Korea Local 6.4 - - 11.2 10.2 69.9 - 2.4 100.0
State3 53.9 - - 5.3 40.8 - - 100.0 Mexico
Local
Netherlands2 Local 73.6 - - - - 26.4 - - 100.0
Norway Local 12.2 9.4 19.4 3.9 - 55.1 - 100.0
Poland2 Local 24.1 5.4 - - - - 70.5 - - 100.0
Portugal Local - - - - 11.4 85.0 - 3.6 100.0
Regional 8.1 5.4 - - 0.9 0.5 85.2 - - 100.0 Spain
Local 14.3 16.4 3.1 - - 66.2 - - 100.0
Sweden Local - - - - 0.7 28.1 71.3 - - 100.0
State 64.8 12.9 - - - - 22.2 - - 100.0 Switzerland
Local 71.7 8.7 - - - - 19.6 - - 100.0
Turkey Local - - - - 77.3 - - 22.7 100.0
State 31.4 4.5 4.4 2.9 12.5 2.6 40.3 0.0 1.5 100.0 Unweighted average Local 22.9 3.8 5.7 1.9 9.2 9.9 38.8 6.5 1.5 100.0
Note: 1. 2002 figures, 2. 2003 figures, 3. including grants to local government. Source: Blöchliger, H. and D. King (2006). Data were collected through a questionnaire sent out in 2005 and completed using Revenue Statistics 1965-2004 and National Accounts.
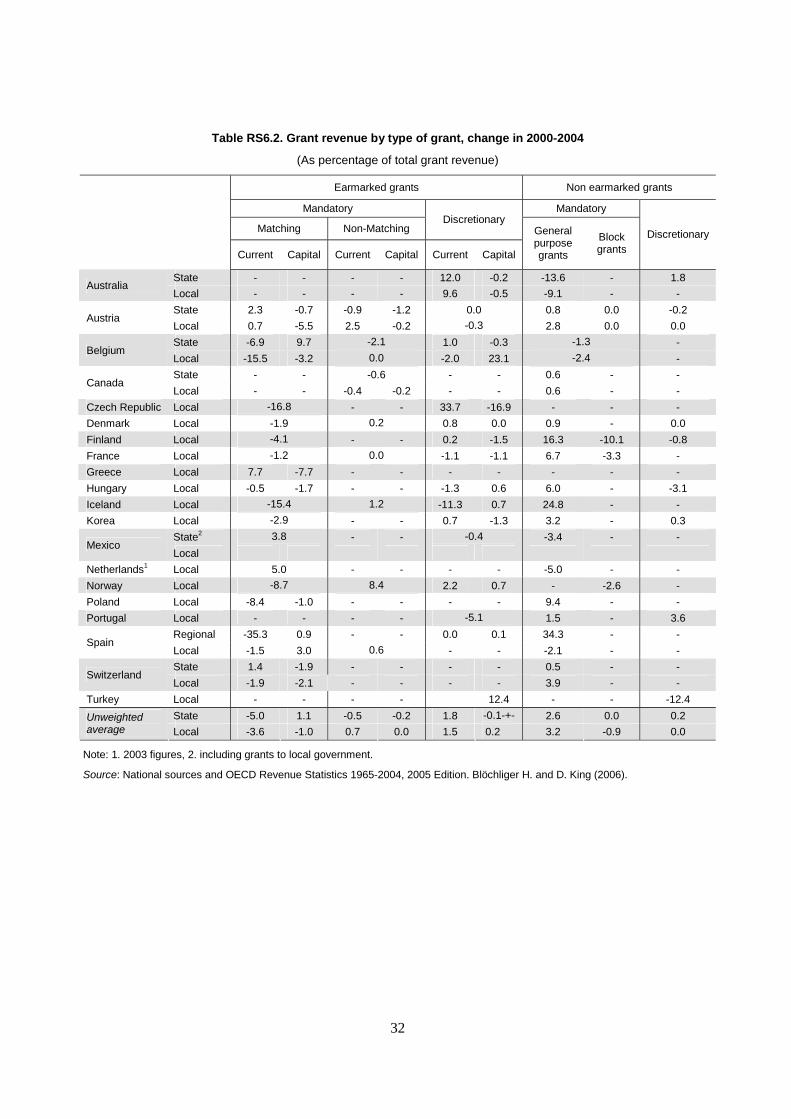
32
Table RS6.2. Grant revenue by type of grant, change in 2000-2004
(As percentage of total grant revenue)
Earmarked grants Non earmarked grants
Mandatory Mandatory
Matching Non-Matching Discretionary
Current Capital Current Capital Current Capital
General purpose grants
Block grants
Discretionary
State - - - - 12.0 -0.2 -13.6 - 1.8 Australia
Local - - - - 9.6 -0.5 -9.1 - -
State 2.3 -0.7 -0.9 -1.2 0.0 0.8 0.0 -0.2 Austria
Local 0.7 -5.5 2.5 -0.2 -0.3
2.8 0.0 0.0
State -6.9 9.7 -2.1
1.0 -0.3 -1.3
- Belgium
Local -15.5 -3.2 0.0
-2.0 23.1 -2.4
-
State - - -0.6 - - 0.6 - - Canada
Local - - -0.4 -0.2 - - 0.6 - -
Czech Republic Local -16.8
- - 33.7 -16.9 - - -
Denmark Local -1.9 0.2
0.8 0.0 0.9 - 0.0
Finland Local -4.1
- - 0.2 -1.5 16.3 -10.1 -0.8
France Local -1.2
0.0
-1.1 -1.1 6.7 -3.3 -
Greece Local 7.7 -7.7 - - - - - - -
Hungary Local -0.5 -1.7 - - -1.3 0.6 6.0 - -3.1
Iceland Local -15.4
1.2
-11.3 0.7 24.8 - -
Korea Local -2.9
- - 0.7 -1.3 3.2 - 0.3
State2 3.8
- - -0.4
-3.4 - - Mexico
Local
Netherlands1 Local 5.0 - - - - -5.0 - -
Norway Local -8.7
8.4
2.2 0.7 - -2.6 -
Poland Local -8.4 -1.0 - - - - 9.4 - -
Portugal Local - - - - -5.1
1.5 - 3.6
Regional -35.3 0.9 - - 0.0 0.1 34.3 - - Spain
Local -1.5 3.0 0.6
- - -2.1 - -
State 1.4 -1.9 - - - - 0.5 - - Switzerland
Local -1.9 -2.1 - - - - 3.9 - -
Turkey Local - - - - 12.4 - - -12.4
State -5.0 1.1 -0.5 -0.2 1.8 -0.1-+-+
2.6 0.0 0.2 Unweighted average Local -3.6 -1.0 0.7 0.0 1.5 0.2 3.2 -0.9 0.0
Note: 1. 2003 figures, 2. including grants to local government.
Source: National sources and OECD Revenue Statistics 1965-2004, 2005 Edition. Blöchliger H. and D. King (2006).
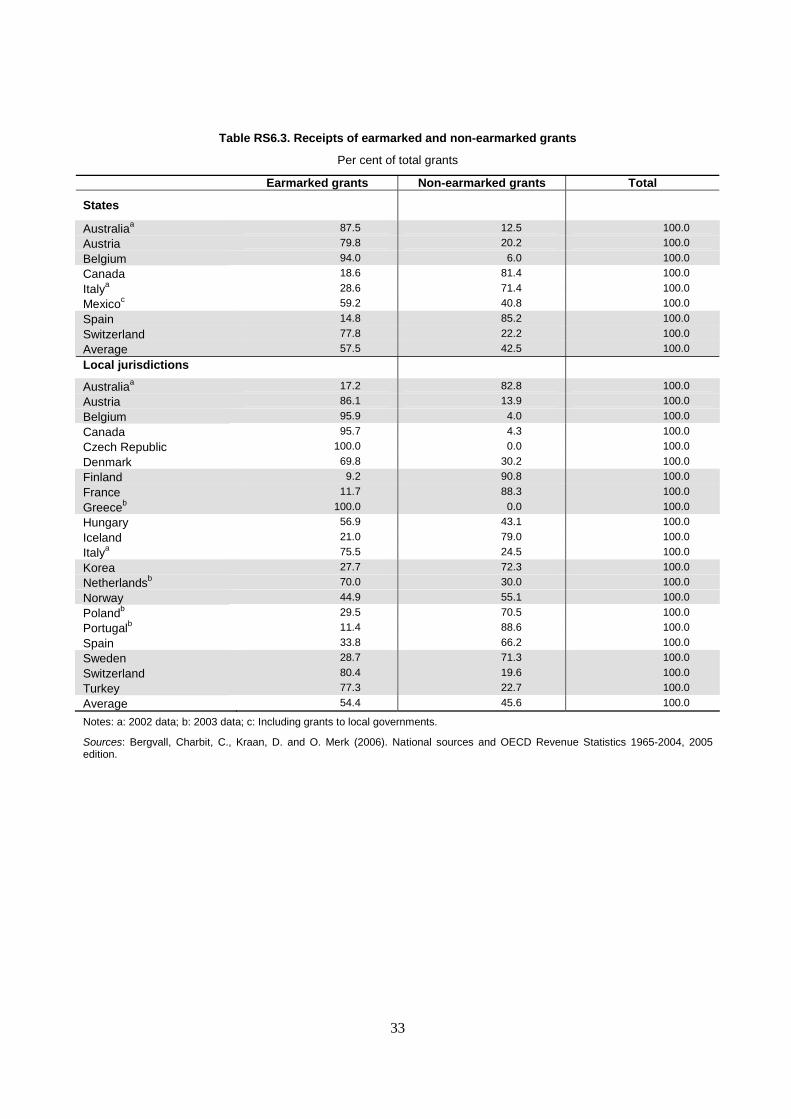
33
Table RS6.3. Receipts of earmarked and non-earmarked grants
Per cent of total grants
Earmarked grants Non-earmarked grants Total
States
Australiaa 87.5 12.5 100.0
Austria 79.8 20.2 100.0
Belgium 94.0 6.0 100.0
Canada 18.6 81.4 100.0
Italya 28.6 71.4 100.0
Mexicoc 59.2 40.8 100.0
Spain 14.8 85.2 100.0
Switzerland 77.8 22.2 100.0
Average 57.5 42.5 100.0
Local jurisdictions
Australiaa 17.2 82.8 100.0
Austria 86.1 13.9 100.0
Belgium 95.9 4.0 100.0
Canada 95.7 4.3 100.0
Czech Republic 100.0 0.0 100.0
Denmark 69.8 30.2 100.0
Finland 9.2 90.8 100.0
France 11.7 88.3 100.0
Greeceb 100.0 0.0 100.0
Hungary 56.9 43.1 100.0
Iceland 21.0 79.0 100.0
Italya 75.5 24.5 100.0
Korea 27.7 72.3 100.0
Netherlandsb 70.0 30.0 100.0
Norway 44.9 55.1 100.0
Polandb 29.5 70.5 100.0
Portugalb 11.4 88.6 100.0
Spain 33.8 66.2 100.0
Sweden 28.7 71.3 100.0
Switzerland 80.4 19.6 100.0
Turkey 77.3 22.7 100.0
Average 54.4 45.6 100.0
Notes: a: 2002 data; b: 2003 data; c: Including grants to local governments.
Sources: Bergvall, Charbit, C., Kraan, D. and O. Merk (2006). National sources and OECD Revenue Statistics 1965-2004, 2005 edition.
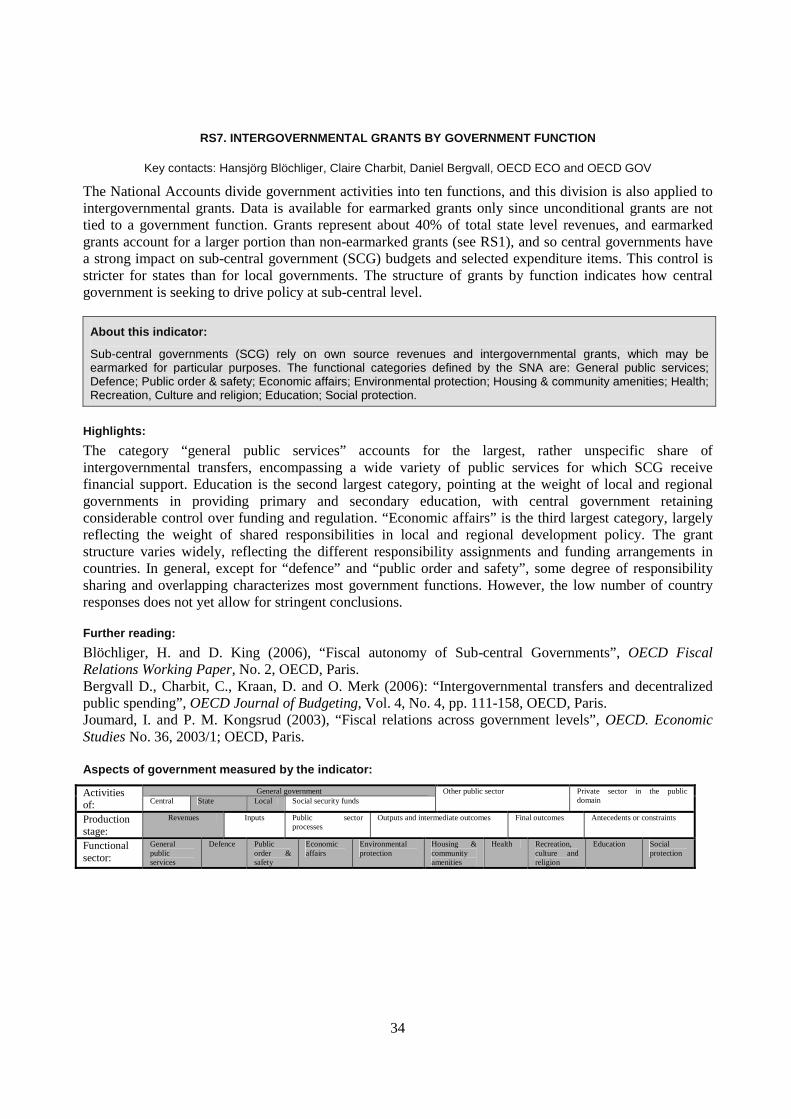
34
RS7. INTERGOVERNMENTAL GRANTS BY GOVERNMENT FUNCTION
Key contacts: Hansjörg Blöchliger, Claire Charbit, Daniel Bergvall, OECD ECO and OECD GOV
The National Accounts divide government activities into ten functions, and this division is also applied to intergovernmental grants. Data is available for earmarked grants only since unconditional grants are not tied to a government function. Grants represent about 40% of total state level revenues, and earmarked grants account for a larger portion than non-earmarked grants (see RS1), and so central governments have a strong impact on sub-central government (SCG) budgets and selected expenditure items. This control is stricter for states than for local governments. The structure of grants by function indicates how central government is seeking to drive policy at sub-central level.
About this indicator:
Sub-central governments (SCG) rely on own source revenues and intergovernmental grants, which may be earmarked for particular purposes. The functional categories defined by the SNA are: General public services; Defence; Public order & safety; Economic affairs; Environmental protection; Housing & community amenities; Health; Recreation, Culture and religion; Education; Social protection.
Highlights:
The category “general public services” accounts for the largest, rather unspecific share of intergovernmental transfers, encompassing a wide variety of public services for which SCG receive financial support. Education is the second largest category, pointing at the weight of local and regional governments in providing primary and secondary education, with central government retaining considerable control over funding and regulation. “Economic affairs” is the third largest category, largely reflecting the weight of shared responsibilities in local and regional development policy. The grant structure varies widely, reflecting the different responsibility assignments and funding arrangements in countries. In general, except for “defence” and “public order and safety”, some degree of responsibility sharing and overlapping characterizes most government functions. However, the low number of country responses does not yet allow for stringent conclusions.
Further reading:
Blöchliger, H. and D. King (2006), “Fiscal autonomy of Sub-central Governments”, OECD Fiscal Relations Working Paper, No. 2, OECD, Paris. Bergvall D., Charbit, C., Kraan, D. and O. Merk (2006): “Intergovernmental transfers and decentralized public spending”, OECD Journal of Budgeting, Vol. 4, No. 4, pp. 111-158, OECD, Paris. Joumard, I. and P. M. Kongsrud (2003), “Fiscal relations across government levels”, OECD. Economic Studies No. 36, 2003/1; OECD, Paris. Aspects of government measured by the indicator:
General government Activities of: Central State Local Social security funds
Other public sector Private sector in the public domain
Production stage:
Revenues Inputs Public sector processes
Outputs and intermediate outcomes Final outcomes Antecedents or constraints
Functional sector:
General public services
Defence Public order & safety
Economic affairs
Environmental protection
Housing & community amenities
Health Recreation, culture and religion
Education Social protection
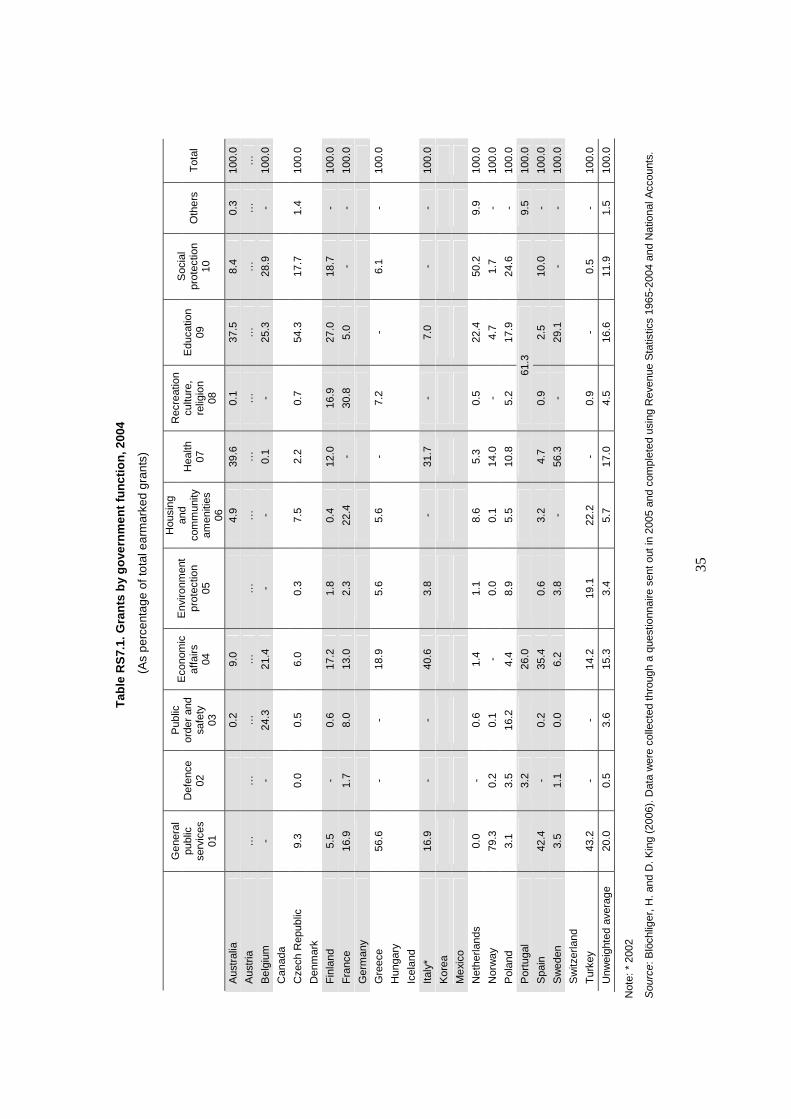
35
T
able
RS
7.1.
Gra
nts
by
go
vern
men
t fu
nct
ion
, 200
4
(A
s pe
rcen
tage
of t
otal
ear
mar
ked
gran
ts)
Gen
eral
pu
blic
se
rvic
es
01
Def
ence
02
Pub
lic
orde
r an
d sa
fety
03
Eco
nom
ic
affa
irs
04
Env
ironm
ent
prot
ectio
n 05
Hou
sing
an
d co
mm
unity
am
eniti
es
06
Hea
lth
07
Rec
reat
ion
cultu
re,
relig
ion
08
Edu
catio
n 09
Soc
ial
prot
ectio
n 10
O
ther
s T
otal
Aus
tral
ia
0.2
9.0
4.
9 39
.6
0.1
37.5
8.
4 0.
3 10
0.0
Aus
tria
…
…
…
…
…
…
…
…
…
…
…
…
Bel
gium
-
- 24
.3
21.4
-
- 0.
1 -
25.3
28
.9
- 10
0.0
Can
ada
Cze
ch R
epub
lic
9.3
0.0
0.5
6.0
0.3
7.5
2.2
0.7
54.3
17
.7
1.4
100.
0
Den
mar
k
Fin
land
5.
5 -
0.6
17.2
1.
8 0.
4 12
.0
16.9
27
.0
18.7
-
100.
0
Fra
nce
16.9
1.
7 8.
0 13
.0
2.3
22.4
-
30.8
5.
0 -
- 10
0.0
Ger
man
y
Gre
ece
56.6
-
- 18
.9
5.6
5.6
- 7.
2 -
6.1
- 10
0.0
Hun
gary
Icel
and
Italy
* 16
.9
- -
40.6
3.
8 -
31.7
-
7.0
- -
100.
0
Kor
ea
Mex
ico
Net
herla
nds
0.0
- 0.
6 1.
4 1.
1 8.
6 5.
3 0.
5 22
.4
50.2
9.
9 10
0.0
Nor
way
79
.3
0.2
0.1
- 0.
0 0.
1 14
.0
- 4.
7 1.
7 -
100.
0
Pol
and
3.1
3.5
16.2
4.
4 8.
9 5.
5 10
.8
5.2
17.9
24
.6
- 10
0.0
Por
tuga
l
3.2
26
.0
61
.3
9.
5 10
0.0
Spa
in
42.4
-
0.2
35.4
0.
6 3.
2 4.
7 0.
9 2.
5 10
.0
- 10
0.0
Sw
eden
3.
5 1.
1 0.
0 6.
2 3.
8 -
56.3
-
29.1
-
- 10
0.0
Sw
itzer
land
Tur
key
43.2
-
- 14
.2
19.1
22
.2
- 0.
9 -
0.5
- 10
0.0
Unw
eigh
ted
aver
age
20.0
0.
5 3.
6 15
.3
3.4
5.7
17.0
4.
5 16
.6
11.9
1.
5 10
0.0
Not
e: *
200
2
Sou
rce:
Blö
chlig
er, H
. and
D. K
ing
(200
6). D
ata
wer
e co
llect
ed th
roug
h a
ques
tionn
aire
sen
t out
in 2
005
and
com
plet
ed u
sing
Rev
enue
Sta
tistic
s 19
65-2
004
and
Nat
iona
l Acc
ount
s.
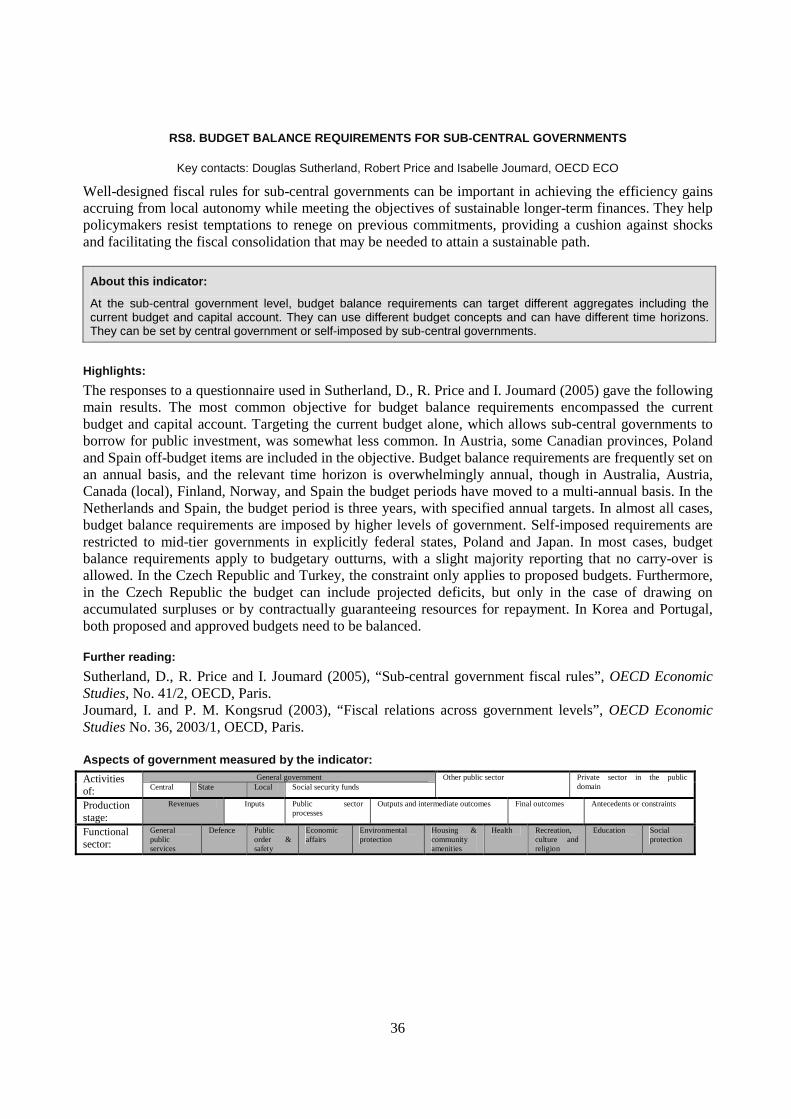
36
RS8. BUDGET BALANCE REQUIREMENTS FOR SUB-CENTRAL GOVERNMENTS
Key contacts: Douglas Sutherland, Robert Price and Isabelle Joumard, OECD ECO
Well-designed fiscal rules for sub-central governments can be important in achieving the efficiency gains accruing from local autonomy while meeting the objectives of sustainable longer-term finances. They help policymakers resist temptations to renege on previous commitments, providing a cushion against shocks and facilitating the fiscal consolidation that may be needed to attain a sustainable path.
About this indicator:
At the sub-central government level, budget balance requirements can target different aggregates including the current budget and capital account. They can use different budget concepts and can have different time horizons. They can be set by central government or self-imposed by sub-central governments.
Highlights:
The responses to a questionnaire used in Sutherland, D., R. Price and I. Joumard (2005) gave the following main results. The most common objective for budget balance requirements encompassed the current budget and capital account. Targeting the current budget alone, which allows sub-central governments to borrow for public investment, was somewhat less common. In Austria, some Canadian provinces, Poland and Spain off-budget items are included in the objective. Budget balance requirements are frequently set on an annual basis, and the relevant time horizon is overwhelmingly annual, though in Australia, Austria, Canada (local), Finland, Norway, and Spain the budget periods have moved to a multi-annual basis. In the Netherlands and Spain, the budget period is three years, with specified annual targets. In almost all cases, budget balance requirements are imposed by higher levels of government. Self-imposed requirements are restricted to mid-tier governments in explicitly federal states, Poland and Japan. In most cases, budget balance requirements apply to budgetary outturns, with a slight majority reporting that no carry-over is allowed. In the Czech Republic and Turkey, the constraint only applies to proposed budgets. Furthermore, in the Czech Republic the budget can include projected deficits, but only in the case of drawing on accumulated surpluses or by contractually guaranteeing resources for repayment. In Korea and Portugal, both proposed and approved budgets need to be balanced.
Further reading:
Sutherland, D., R. Price and I. Joumard (2005), “Sub-central government fiscal rules”, OECD Economic Studies, No. 41/2, OECD, Paris. Joumard, I. and P. M. Kongsrud (2003), “Fiscal relations across government levels”, OECD Economic Studies No. 36, 2003/1, OECD, Paris. Aspects of government measured by the indicator:
General government Activities of: Central State Local Social security funds
Other public sector Private sector in the public domain
Production stage:
Revenues Inputs Public sector processes
Outputs and intermediate outcomes Final outcomes Antecedents or constraints
Functional sector:
General public services
Defence Public order & safety
Economic affairs
Environmental protection
Housing & community amenities
Health Recreation, culture and religion
Education Social protection
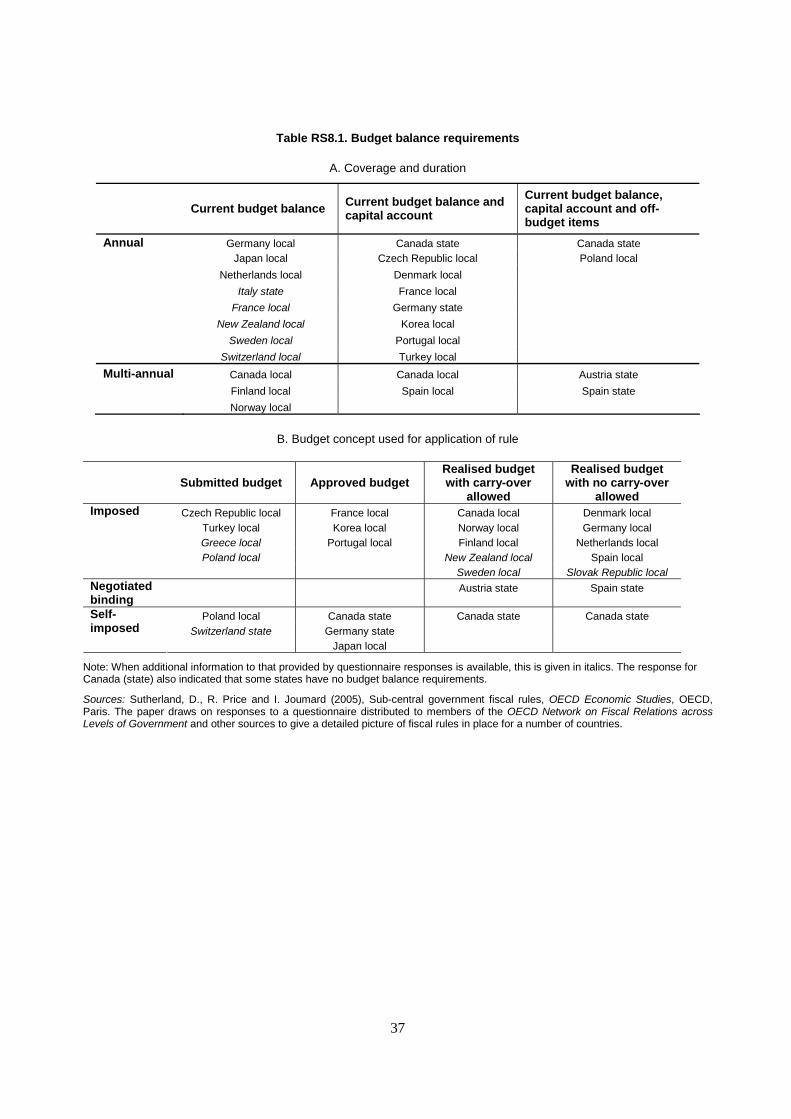
37
Table RS8.1. Budget balance requirements
A. Coverage and duration
Current budget balance Current budget balance and capital account
Current budget balance, capital account and off-budget items
Annual Germany local Canada state Canada state Japan local Czech Republic local Poland local
Netherlands local Denmark local
Italy state France local
France local Germany state
New Zealand local Korea local
Sweden local Portugal local
Switzerland local Turkey local
Multi-annual Canada local Canada local Austria state
Finland local Spain local Spain state
Norway local
B. Budget concept used for application of rule
Submitted budget Approved budget Realised budget with carry-over
allowed
Realised budget with no carry-over
allowed Imposed Czech Republic local France local Canada local Denmark local Turkey local Korea local Norway local Germany local Greece local Portugal local Finland local Netherlands local Poland local New Zealand local Spain local Sweden local Slovak Republic local Negotiated binding
Austria state Spain state
Poland local Canada state Canada state Canada state Switzerland state Germany state
Self-imposed
Japan local
Note: When additional information to that provided by questionnaire responses is available, this is given in italics. The response for Canada (state) also indicated that some states have no budget balance requirements.
Sources: Sutherland, D., R. Price and I. Joumard (2005), Sub-central government fiscal rules, OECD Economic Studies, OECD, Paris. The paper draws on responses to a questionnaire distributed to members of the OECD Network on Fiscal Relations across Levels of Government and other sources to give a detailed picture of fiscal rules in place for a number of countries.
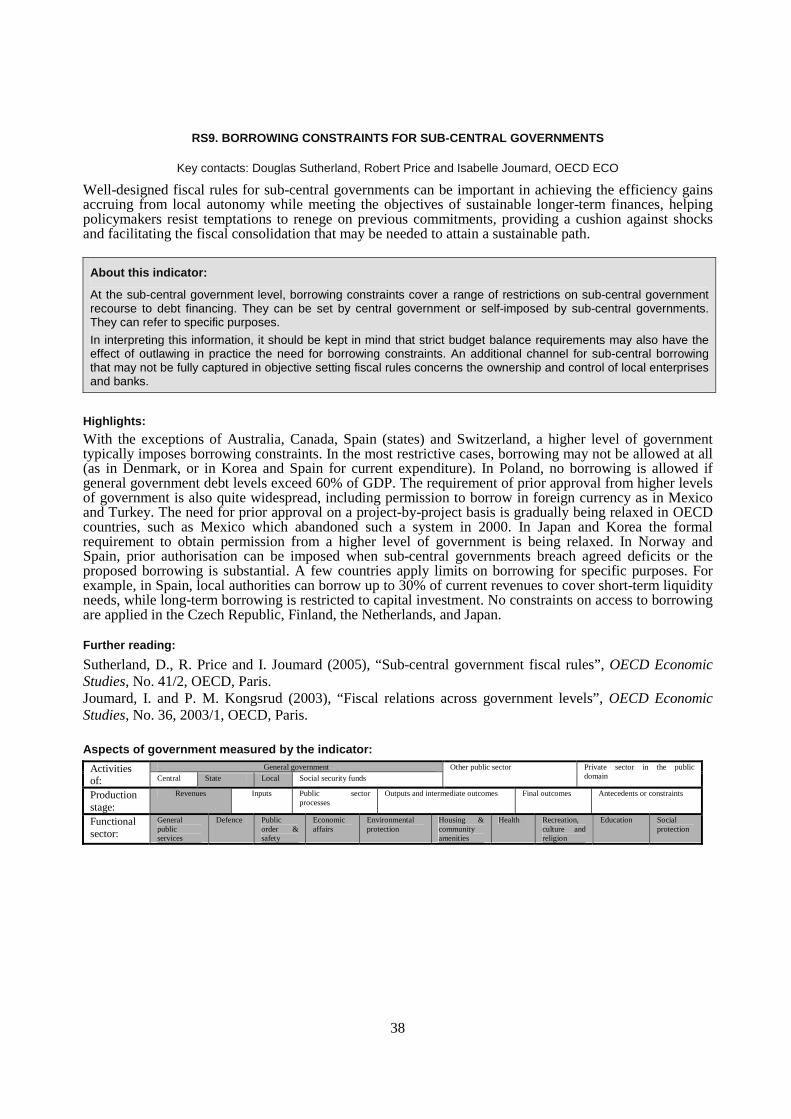
38
RS9. BORROWING CONSTRAINTS FOR SUB-CENTRAL GOVERNMENTS
Key contacts: Douglas Sutherland, Robert Price and Isabelle Joumard, OECD ECO
Well-designed fiscal rules for sub-central governments can be important in achieving the efficiency gains accruing from local autonomy while meeting the objectives of sustainable longer-term finances, helping policymakers resist temptations to renege on previous commitments, providing a cushion against shocks and facilitating the fiscal consolidation that may be needed to attain a sustainable path.
About this indicator:
At the sub-central government level, borrowing constraints cover a range of restrictions on sub-central government recourse to debt financing. They can be set by central government or self-imposed by sub-central governments. They can refer to specific purposes.
In interpreting this information, it should be kept in mind that strict budget balance requirements may also have the effect of outlawing in practice the need for borrowing constraints. An additional channel for sub-central borrowing that may not be fully captured in objective setting fiscal rules concerns the ownership and control of local enterprises and banks.
Highlights:
With the exceptions of Australia, Canada, Spain (states) and Switzerland, a higher level of government typically imposes borrowing constraints. In the most restrictive cases, borrowing may not be allowed at all (as in Denmark, or in Korea and Spain for current expenditure). In Poland, no borrowing is allowed if general government debt levels exceed 60% of GDP. The requirement of prior approval from higher levels of government is also quite widespread, including permission to borrow in foreign currency as in Mexico and Turkey. The need for prior approval on a project-by-project basis is gradually being relaxed in OECD countries, such as Mexico which abandoned such a system in 2000. In Japan and Korea the formal requirement to obtain permission from a higher level of government is being relaxed. In Norway and Spain, prior authorisation can be imposed when sub-central governments breach agreed deficits or the proposed borrowing is substantial. A few countries apply limits on borrowing for specific purposes. For example, in Spain, local authorities can borrow up to 30% of current revenues to cover short-term liquidity needs, while long-term borrowing is restricted to capital investment. No constraints on access to borrowing are applied in the Czech Republic, Finland, the Netherlands, and Japan.
Further reading:
Sutherland, D., R. Price and I. Joumard (2005), “Sub-central government fiscal rules”, OECD Economic Studies, No. 41/2, OECD, Paris. Joumard, I. and P. M. Kongsrud (2003), “Fiscal relations across government levels”, OECD Economic Studies, No. 36, 2003/1, OECD, Paris. Aspects of government measured by the indicator:
General government Activities of: Central State Local Social security funds
Other public sector Private sector in the public domain
Production stage:
Revenues Inputs Public sector processes
Outputs and intermediate outcomes Final outcomes Antecedents or constraints
Functional sector:
General public services
Defence Public order & safety
Economic affairs
Environmental protection
Housing & community amenities
Health Recreation, culture and religion
Education Social protection
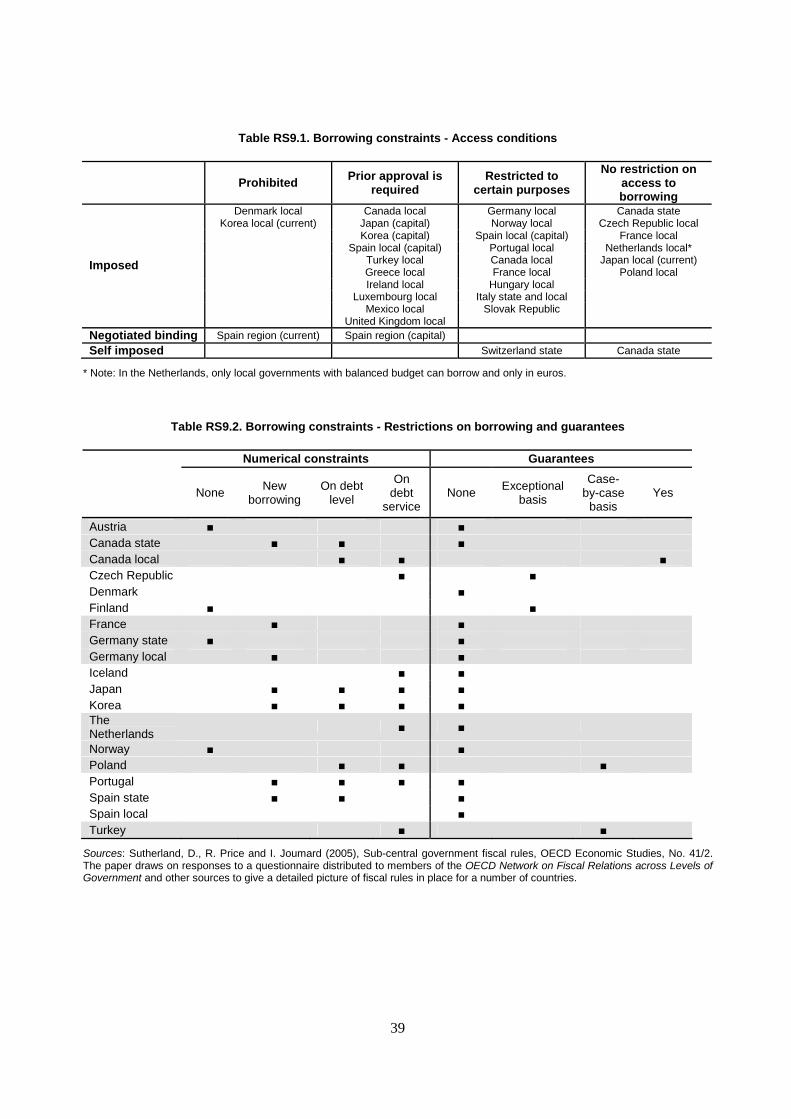
39
Table RS9.1. Borrowing constraints - Access conditions
Prohibited Prior approval is required
Restricted to certain purposes
No restriction on access to borrowing
Denmark local Canada local Germany local Canada state Korea local (current) Japan (capital) Norway local Czech Republic local
Korea (capital) Spain local (capital) France local Spain local (capital) Portugal local Netherlands local* Turkey local Canada local Japan local (current) Greece local France local Poland local Ireland local Hungary local Luxembourg local Italy state and local Mexico local Slovak Republic
Imposed
United Kingdom local Negotiated binding Spain region (current) Spain region (capital)
Self imposed Switzerland state Canada state
* Note: In the Netherlands, only local governments with balanced budget can borrow and only in euros.
Table RS9.2. Borrowing constraints - Restrictions on borrowing and guarantees
Numerical constraints Guarantees
None New
borrowing On debt
level
On debt
service None Exceptional
basis
Case-by-case
basis Yes
Austria ■ ■ Canada state ■ ■ ■ Canada local ■ ■ ■ Czech Republic ■ ■ Denmark ■ Finland ■ ■ France ■ ■ Germany state ■ ■ Germany local ■ ■ Iceland ■ ■ Japan ■ ■ ■ ■ Korea ■ ■ ■ ■ The Netherlands
■ ■
Norway ■ ■ Poland ■ ■ ■ Portugal ■ ■ ■ ■ Spain state ■ ■ ■ Spain local ■ Turkey ■ ■
Sources: Sutherland, D., R. Price and I. Joumard (2005), Sub-central government fiscal rules, OECD Economic Studies, No. 41/2. The paper draws on responses to a questionnaire distributed to members of the OECD Network on Fiscal Relations across Levels of Government and other sources to give a detailed picture of fiscal rules in place for a number of countries.
40
RS10. TAX AND EXPENDITURE LIMITS FOR SUB-CENTRAL GOVERNMENTS
Key contacts: Douglas Sutherland, Robert Price and Isabelle Joumard, OECD ECO
Well-designed fiscal rules for sub-central governments can be important in achieving the efficiency gains accruing from local autonomy while meeting the objectives of sustainable longer-term finances, helping policymakers resist temptations to renege on previous commitments, providing a cushion against shocks and facilitating the fiscal consolidation that may be needed to attain a sustainable path.
About this indicator:
Although tax and expenditure limits (TELs) have a long history in public finance, dating from the late nineteenth century, they regained popularity relatively recently with the rapid expansion in their use during the “tax revolt” across the United States that followed a referendum in California in 1978 (Proposition 13) on property tax rates. Most US states now have some form of TEL, mainly on property taxes. In most countries, central governments impose limits on tax rates or reliefs that can be set by sub-central governments. Explicit restraints on expenditures are less common.
Highlights:
In most OECD countries the form of the tax limit is in the form of an explicit limit on tax autonomy. In Denmark, Japan and Mexico, implicit sanctions on sub-central governments serve to restrain increases in tax rates. In contrast to limits on rates or reliefs, the tax limits imposed in some US states and also the United Kingdom target the revenue raised from a specific tax base or the annual increase in revenue from a given tax base. Expenditure increase limits are often linked to income, inflation or population growth (or to a needs-based criterion), or some combination of these (such as in Korea). Limits can also be set in terms of ceilings on expenditures. Furthermore, they can be set for annual or multi-annual periods. One of the possibly most restrictive rules is the requirement to hold referenda for expenditure above a given threshold (in some cantons in Switzerland).
Further reading:
Sutherland, D., R. Price and I. Joumard (2005), “Sub-central government fiscal rules”, OECD Economic Studies, No. 41/2, OECD, Paris. Joumard, I. and P. M. Kongsrud (2003), “Fiscal relations across government levels”, OECD Economic Studies, No. 36, 2003/1, OECD, Paris.
Aspects of government measured by the indicator:
General government Activities of: Central State Local Social security funds
Other public sector Private sector in the public domain
Production stage:
Revenues Inputs Public sector processes
Outputs and intermediate outcomes Final outcomes Antecedents or constraints
Functional sector:
General public services
Defence Public order & safety
Economic affairs
Environmental protection
Housing & community amenities
Health Recreation, culture and religion
Education Social protection
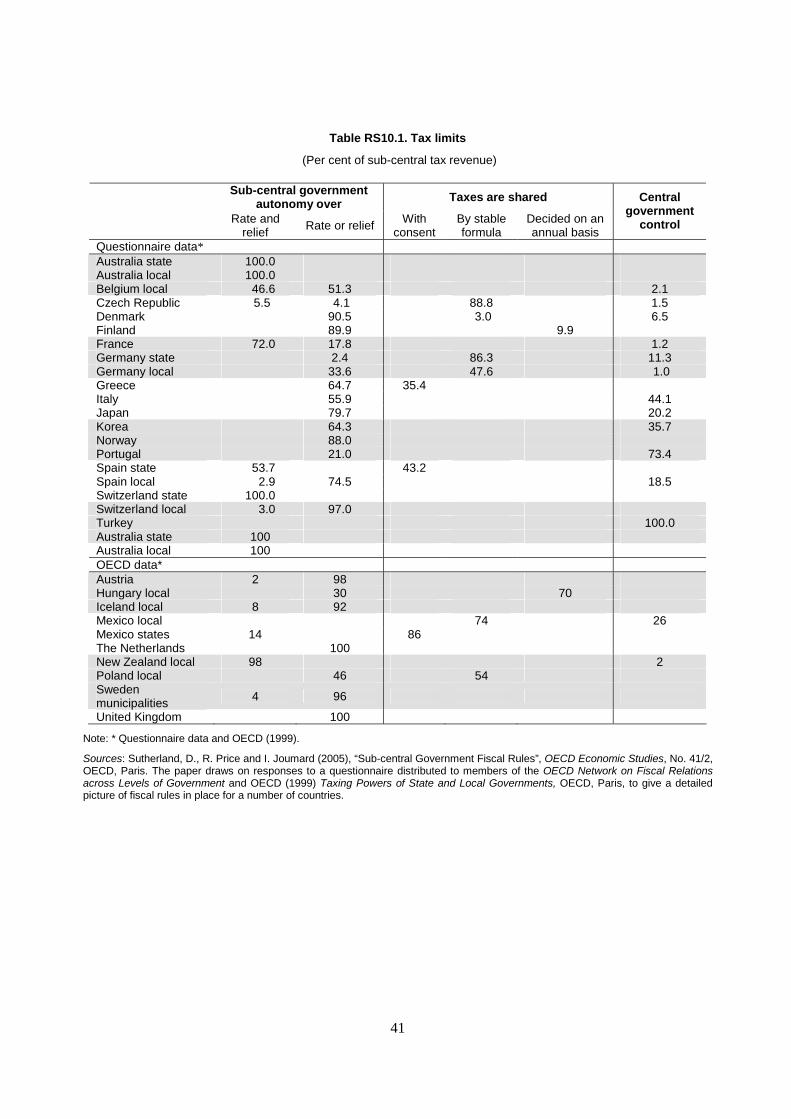
41
Table RS10.1. Tax limits
(Per cent of sub-central tax revenue)
Sub-central government autonomy over Taxes are shared
Rate and
relief Rate or relief With consent
By stable formula
Decided on an annual basis
Central government
control
Questionnaire data* Australia state 100.0 Australia local 100.0 Belgium local 46.6 51.3 2.1 Czech Republic 5.5 4.1 88.8 1.5 Denmark 90.5 3.0 6.5 Finland 89.9 9.9 France 72.0 17.8 1.2 Germany state 2.4 86.3 11.3 Germany local 33.6 47.6 1.0 Greece 64.7 35.4 Italy 55.9 44.1 Japan 79.7 20.2 Korea 64.3 35.7 Norway 88.0 Portugal 21.0 73.4 Spain state 53.7 43.2 Spain local 2.9 74.5 18.5 Switzerland state 100.0 Switzerland local 3.0 97.0 Turkey 100.0 Australia state 100 Australia local 100 OECD data* Austria 2 98 Hungary local 30 70 Iceland local 8 92 Mexico local 74 26 Mexico states 14 86 The Netherlands 100 New Zealand local 98 2 Poland local 46 54 Sweden municipalities 4 96
United Kingdom 100
Note: * Questionnaire data and OECD (1999).
Sources: Sutherland, D., R. Price and I. Joumard (2005), “Sub-central Government Fiscal Rules”, OECD Economic Studies, No. 41/2, OECD, Paris. The paper draws on responses to a questionnaire distributed to members of the OECD Network on Fiscal Relations across Levels of Government and OECD (1999) Taxing Powers of State and Local Governments, OECD, Paris, to give a detailed picture of fiscal rules in place for a number of countries.
42
RS11. PROCESS RULES AND RULE IMPLEMENTATION REQUIREMENTS FOR SUB-CENTRAL GOVERNMENTS
Key contacts: Douglas Sutherland, Robert Price and Isabelle Joumard, OECD ECO
Well-designed fiscal rules for sub-central governments can be important in achieving the efficiency gains accruing from local autonomy while meeting the objectives of sustainable longer-term finances, helping policymakers resist temptations to renege on previous commitments, providing a cushion against shocks and facilitating the fiscal consolidation that may be needed to attain a sustainable path.
About this indicator:
Fiscal rules include setting requirements for budget balances, constraints on debt accumulation, and limits on the ability to increase spending or the tax burden (these are often referred to collectively as tax and expenditure limits or TELs).
The degree of commitment to abiding by fiscal rules largely depends on the impact of process rules that govern implementation. This type of rule includes the obligation to produce financial accounts (transparency); monitoring and reporting whether rules are being upheld; the sanctions levied on sub-central governments and officials in the case of violation; the difficulty in evading the rule’s constraint by simply changing the rule, and special procedures that permit some flexibility in fiscal policy.
Highlights:
The responses from a questionnaire used in Sutherland, D., R. Price and I. Joumard (2005) gave the following main results. The transparency of accountancy reporting standards varies considerably across the OECD. In most countries there were requirements for independent auditing of accounts, though in some cases without apparent deadlines for submission. Sub-central governments report on implicit liabilities in only a handful of countries. Several countries have largely independent bodies that monitor, audit, and report on sub-central government budgetary actions. Monitoring most often involves reporting to a higher level of government. Sanctions may be necessary to complement other process rules in ensuring compliance. Financial sanctions were reported in eight cases, though breach of fiscal rules can also have repercussions for eligibility for grants. With the exception of sub-central governments in Austria, some Canadian states, Finland, and Spanish states, administrative sanctions can be applied when fiscal rules are breached. Permitting some closely-circumscribed flexibility in implementation eases some of the problems associated with coping with unanticipated economic shocks. Of particular importance are mechanisms that allow sub-central governments to deal with cyclical pressures on their budgets.
Further reading:
Sutherland, D., R. Price and I. Joumard (2005), “Sub-central government fiscal rules”, OECD Economic Studies, No. 41/2, OECD, Paris. Joumard, I. and P. M. Kongsrud (2003), “Fiscal relations across government levels”, OECD Economic Studies No. 36, 2003/1, OECD, Paris. Aspects of government measured by the indicator:
General government Activities of: Central State Local Social security funds
Other public sector Private sector in the public domain
Production stage:
Revenues Inputs Public sector processes
Outputs and intermediate outcomes Final outcomes Antecedents or constraints
Functional sector:
General public services
Defence Public order & safety
Economic affairs
Environmental protection
Housing & community amenities
Health Recreation, culture and religion
Education Social protection
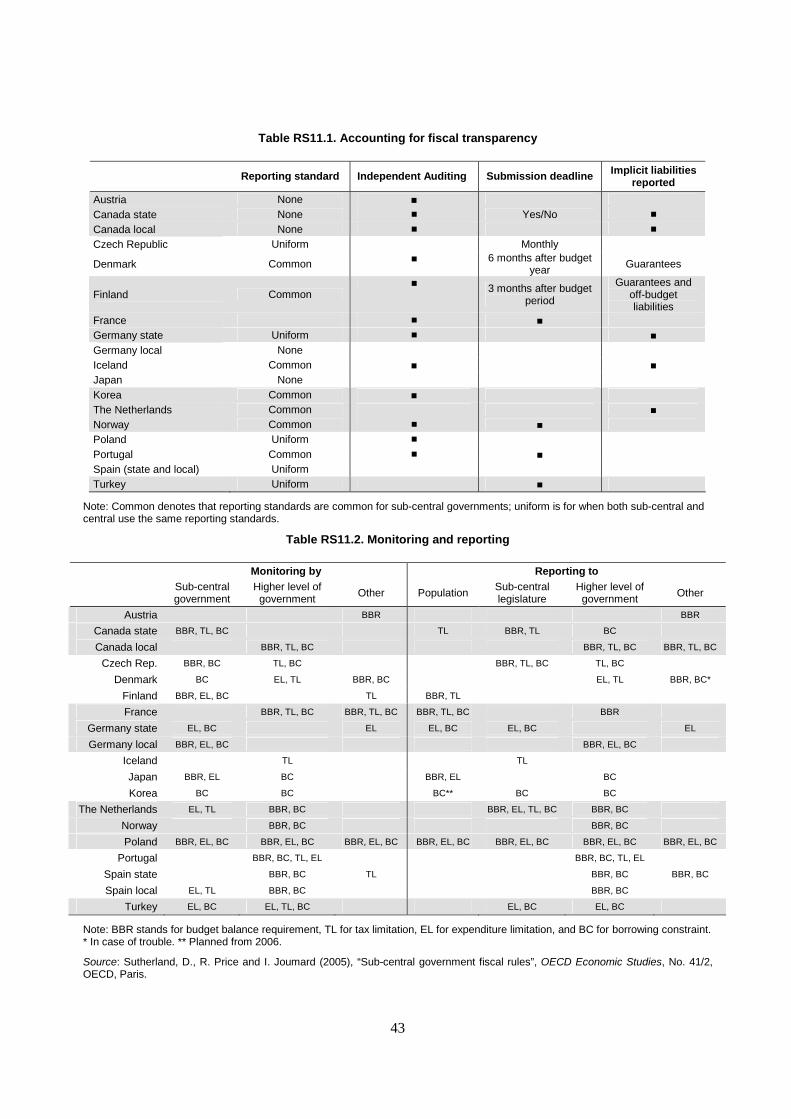
43
Table RS11.1. Accounting for fiscal transparency
Reporting standard Independent Auditing Submission deadline Implicit liabilities reported
Austria None ■ Canada state None ■ Yes/No ■
Canada local None ■ ■
Czech Republic Uniform Monthly
Denmark Common ■ 6 months after budget year Guarantees
Finland Common ■ 3 months after budget
period
Guarantees and off-budget liabilities
France ■ ■ Germany state Uniform ■ ■ Germany local None Iceland Common ■ ■ Japan None Korea Common ■ The Netherlands Common ■ Norway Common ■ ■ Poland Uniform ■ Portugal Common ■ ■ Spain (state and local) Uniform Turkey Uniform ■
Note: Common denotes that reporting standards are common for sub-central governments; uniform is for when both sub-central and central use the same reporting standards.
Table RS11.2. Monitoring and reporting
Monitoring by Reporting to Sub-central
government Higher level of government Other Population
Sub-central legislature
Higher level of government Other
Austria BBR BBR
Canada state BBR, TL, BC TL BBR, TL BC
Canada local BBR, TL, BC BBR, TL, BC BBR, TL, BC
Czech Rep. BBR, BC TL, BC BBR, TL, BC TL, BC
Denmark BC EL, TL BBR, BC EL, TL BBR, BC*
Finland BBR, EL, BC TL BBR, TL
France BBR, TL, BC BBR, TL, BC BBR, TL, BC BBR
Germany state EL, BC EL EL, BC EL, BC EL
Germany local BBR, EL, BC BBR, EL, BC
Iceland TL TL
Japan BBR, EL BC BBR, EL BC
Korea BC BC BC** BC BC
The Netherlands EL, TL BBR, BC BBR, EL, TL, BC BBR, BC
Norway BBR, BC BBR, BC
Poland BBR, EL, BC BBR, EL, BC BBR, EL, BC BBR, EL, BC BBR, EL, BC BBR, EL, BC BBR, EL, BC
Portugal BBR, BC, TL, EL BBR, BC, TL, EL
Spain state BBR, BC TL BBR, BC BBR, BC
Spain local EL, TL BBR, BC BBR, BC
Turkey EL, BC EL, TL, BC EL, BC EL, BC
Note: BBR stands for budget balance requirement, TL for tax limitation, EL for expenditure limitation, and BC for borrowing constraint. * In case of trouble. ** Planned from 2006.
Source: Sutherland, D., R. Price and I. Joumard (2005), “Sub-central government fiscal rules”, OECD Economic Studies, No. 41/2, OECD, Paris.
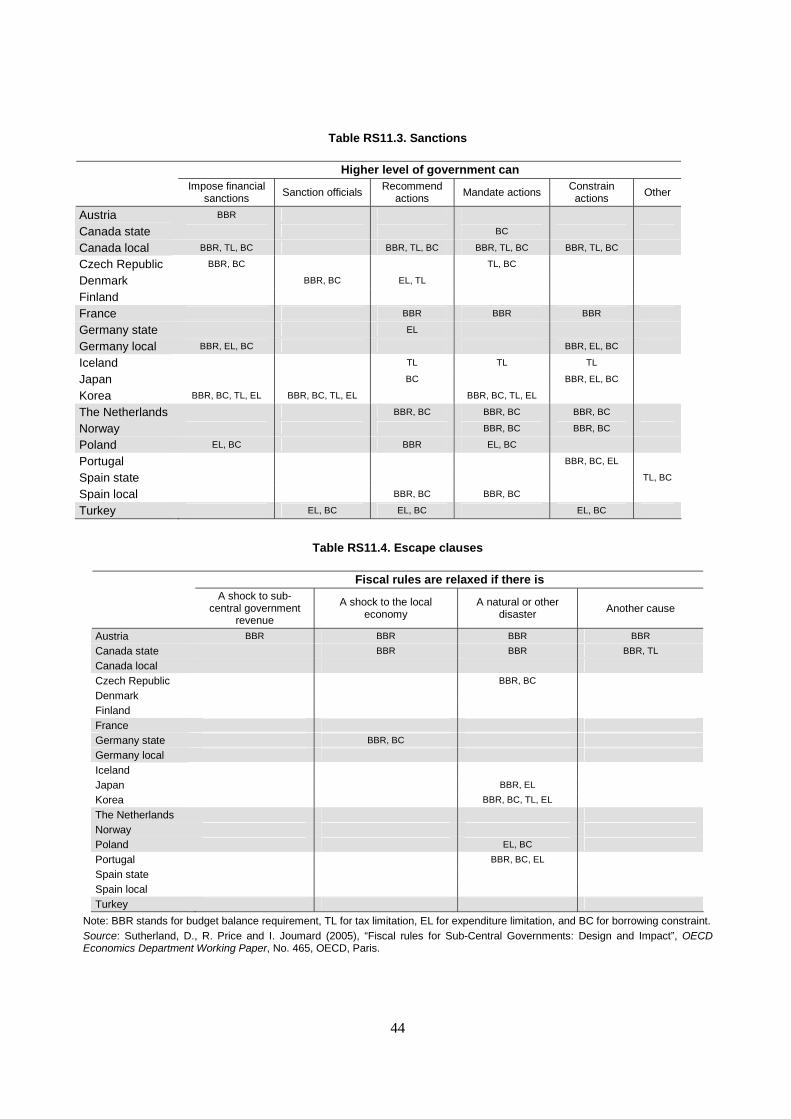
44
Table RS11.3. Sanctions
Higher level of government can Impose financial
sanctions Sanction officials Recommend
actions Mandate actions Constrain actions Other
Austria BBR
Canada state BC
Canada local BBR, TL, BC BBR, TL, BC BBR, TL, BC BBR, TL, BC
Czech Republic BBR, BC TL, BC
Denmark BBR, BC EL, TL
Finland
France BBR BBR BBR
Germany state EL
Germany local BBR, EL, BC BBR, EL, BC
Iceland TL TL TL
Japan BC BBR, EL, BC
Korea BBR, BC, TL, EL BBR, BC, TL, EL BBR, BC, TL, EL
The Netherlands BBR, BC BBR, BC BBR, BC
Norway BBR, BC BBR, BC
Poland EL, BC BBR EL, BC
Portugal BBR, BC, EL
Spain state TL, BC
Spain local BBR, BC BBR, BC
Turkey EL, BC EL, BC EL, BC
Table RS11.4. Escape clauses
Fiscal rules are relaxed if there is
A shock to sub-central government
revenue
A shock to the local economy
A natural or other disaster Another cause
Austria BBR BBR BBR BBR
Canada state BBR BBR BBR, TL
Canada local
Czech Republic BBR, BC
Denmark
Finland
France
Germany state BBR, BC
Germany local
Iceland
Japan BBR, EL
Korea BBR, BC, TL, EL
The Netherlands
Norway
Poland EL, BC
Portugal BBR, BC, EL
Spain state
Spain local
Turkey
Note: BBR stands for budget balance requirement, TL for tax limitation, EL for expenditure limitation, and BC for borrowing constraint. Source: Sutherland, D., R. Price and I. Joumard (2005), “Fiscal rules for Sub-Central Governments: Design and Impact”, OECD Economics Department Working Paper, No. 465, OECD, Paris.
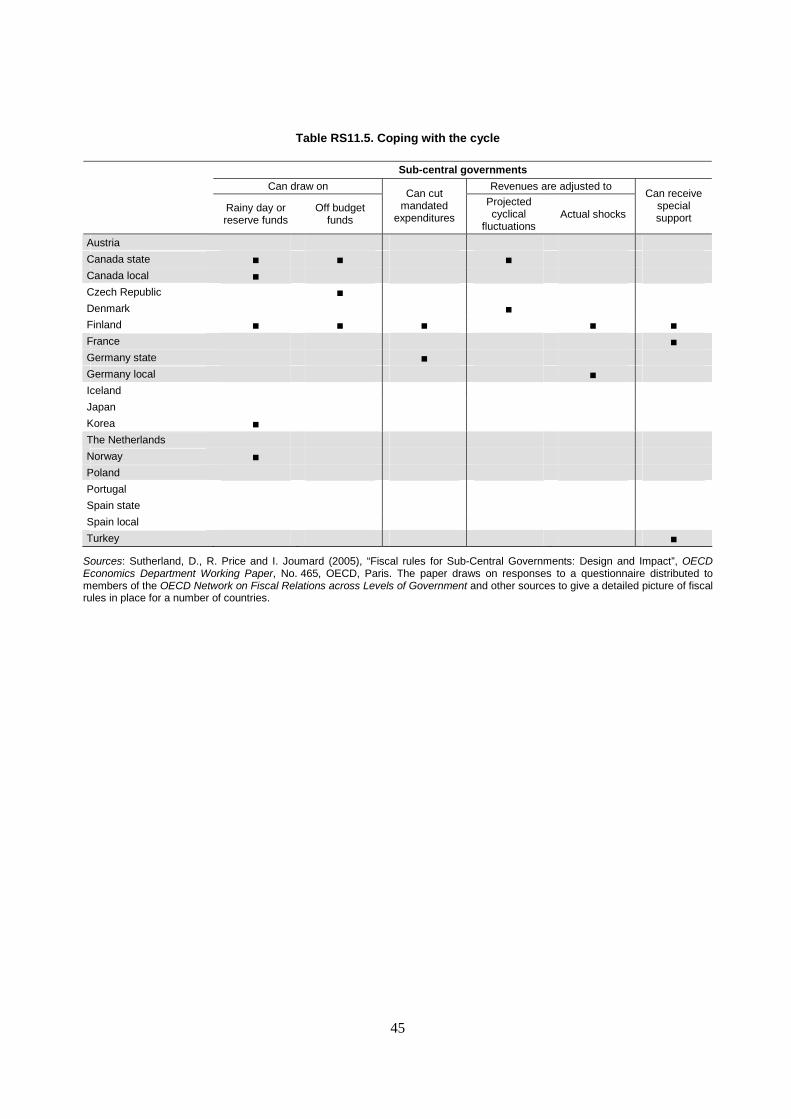
45
Table RS11.5. Coping with the cycle
Sub-central governments
Can draw on Revenues are adjusted to
Rainy day or reserve funds
Off budget funds
Can cut mandated
expenditures
Projected cyclical
fluctuations Actual shocks
Can receive special support
Austria Canada state ■ ■ ■ Canada local ■ Czech Republic ■ Denmark ■ Finland ■ ■ ■ ■ ■ France ■ Germany state ■ Germany local ■ Iceland Japan Korea ■ The Netherlands Norway ■ Poland Portugal Spain state Spain local Turkey ■
Sources: Sutherland, D., R. Price and I. Joumard (2005), “Fiscal rules for Sub-Central Governments: Design and Impact”, OECD Economics Department Working Paper, No. 465, OECD, Paris. The paper draws on responses to a questionnaire distributed to members of the OECD Network on Fiscal Relations across Levels of Government and other sources to give a detailed picture of fiscal rules in place for a number of countries.
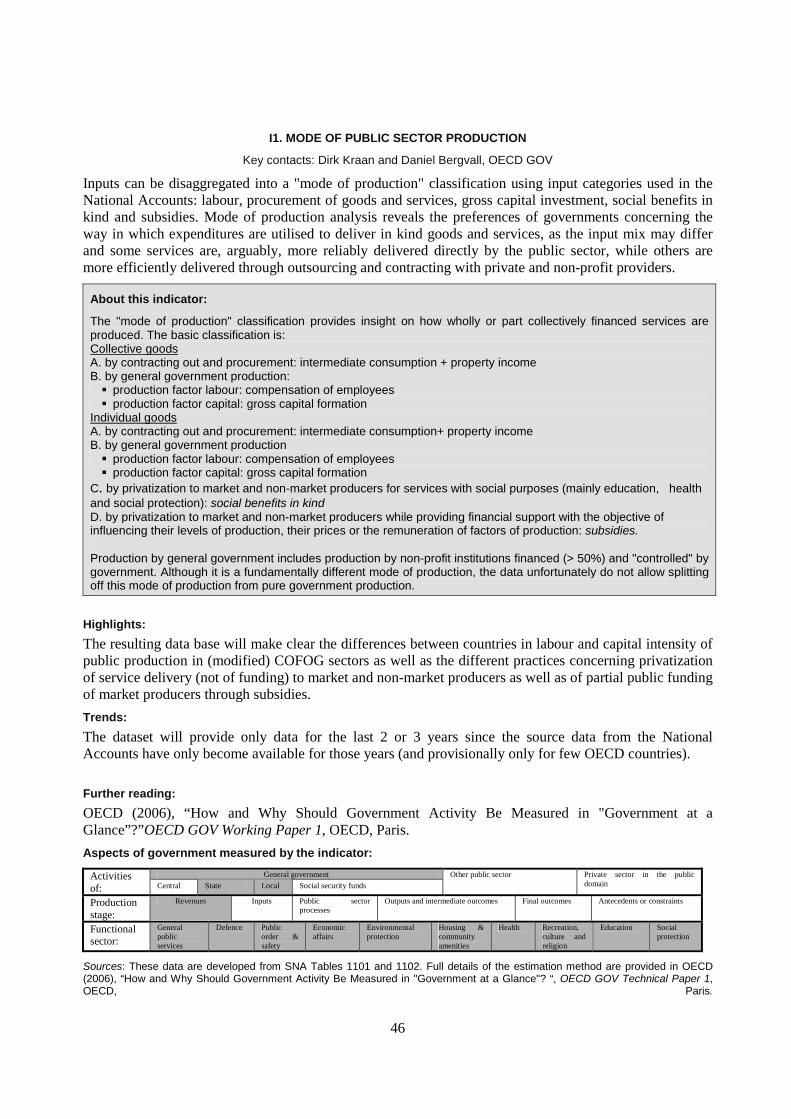
46
I1. MODE OF PUBLIC SECTOR PRODUCTION
Key contacts: Dirk Kraan and Daniel Bergvall, OECD GOV
Inputs can be disaggregated into a "mode of production" classification using input categories used in the National Accounts: labour, procurement of goods and services, gross capital investment, social benefits in kind and subsidies. Mode of production analysis reveals the preferences of governments concerning the way in which expenditures are utilised to deliver in kind goods and services, as the input mix may differ and some services are, arguably, more reliably delivered directly by the public sector, while others are more efficiently delivered through outsourcing and contracting with private and non-profit providers.
About this indicator:
The "mode of production" classification provides insight on how wholly or part collectively financed services are produced. The basic classification is: Collective goods A. by contracting out and procurement: intermediate consumption + property income B. by general government production:
production factor labour: compensation of employees production factor capital: gross capital formation
Individual goods A. by contracting out and procurement: intermediate consumption+ property income B. by general government production
production factor labour: compensation of employees production factor capital: gross capital formation
C. by privatization to market and non-market producers for services with social purposes (mainly education, health and social protection): social benefits in kind D. by privatization to market and non-market producers while providing financial support with the objective of influencing their levels of production, their prices or the remuneration of factors of production: subsidies. Production by general government includes production by non-profit institutions financed (> 50%) and "controlled" by government. Although it is a fundamentally different mode of production, the data unfortunately do not allow splitting off this mode of production from pure government production.
Highlights:
The resulting data base will make clear the differences between countries in labour and capital intensity of public production in (modified) COFOG sectors as well as the different practices concerning privatization of service delivery (not of funding) to market and non-market producers as well as of partial public funding of market producers through subsidies.
Trends:
The dataset will provide only data for the last 2 or 3 years since the source data from the National Accounts have only become available for those years (and provisionally only for few OECD countries).
Further reading:
OECD (2006), “How and Why Should Government Activity Be Measured in "Government at a Glance”?”OECD GOV Working Paper 1, OECD, Paris.
Aspects of government measured by the indicator:
General government Activities of: Central State Local Social security funds
Other public sector Private sector in the public domain
Production stage:
Revenues Inputs Public sector processes
Outputs and intermediate outcomes Final outcomes Antecedents or constraints
Functional sector:
General public services
Defence Public order & safety
Economic affairs
Environmental protection
Housing & community amenities
Health Recreation, culture and religion
Education Social protection
Sources: These data are developed from SNA Tables 1101 and 1102. Full details of the estimation method are provided in OECD (2006), “How and Why Should Government Activity Be Measured in "Government at a Glance"? “, OECD GOV Technical Paper 1, OECD, Paris.

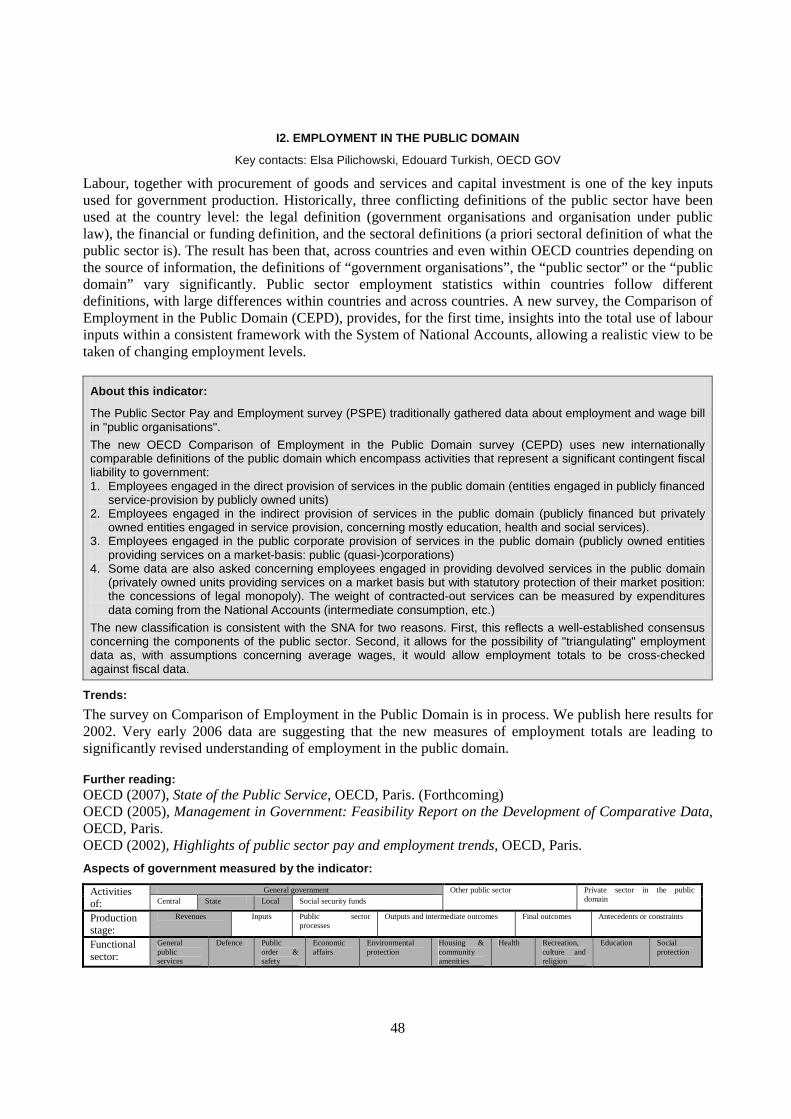
48
I2. EMPLOYMENT IN THE PUBLIC DOMAIN
Key contacts: Elsa Pilichowski, Edouard Turkish, OECD GOV
Labour, together with procurement of goods and services and capital investment is one of the key inputs used for government production. Historically, three conflicting definitions of the public sector have been used at the country level: the legal definition (government organisations and organisation under public law), the financial or funding definition, and the sectoral definitions (a priori sectoral definition of what the public sector is). The result has been that, across countries and even within OECD countries depending on the source of information, the definitions of “government organisations”, the “public sector” or the “public domain” vary significantly. Public sector employment statistics within countries follow different definitions, with large differences within countries and across countries. A new survey, the Comparison of Employment in the Public Domain (CEPD), provides, for the first time, insights into the total use of labour inputs within a consistent framework with the System of National Accounts, allowing a realistic view to be taken of changing employment levels.
About this indicator:
The Public Sector Pay and Employment survey (PSPE) traditionally gathered data about employment and wage bill in "public organisations".
The new OECD Comparison of Employment in the Public Domain survey (CEPD) uses new internationally comparable definitions of the public domain which encompass activities that represent a significant contingent fiscal liability to government: 1. Employees engaged in the direct provision of services in the public domain (entities engaged in publicly financed
service-provision by publicly owned units) 2. Employees engaged in the indirect provision of services in the public domain (publicly financed but privately
owned entities engaged in service provision, concerning mostly education, health and social services). 3. Employees engaged in the public corporate provision of services in the public domain (publicly owned entities
providing services on a market-basis: public (quasi-)corporations) 4. Some data are also asked concerning employees engaged in providing devolved services in the public domain
(privately owned units providing services on a market basis but with statutory protection of their market position: the concessions of legal monopoly). The weight of contracted-out services can be measured by expenditures data coming from the National Accounts (intermediate consumption, etc.)
The new classification is consistent with the SNA for two reasons. First, this reflects a well-established consensus concerning the components of the public sector. Second, it allows for the possibility of "triangulating" employment data as, with assumptions concerning average wages, it would allow employment totals to be cross-checked against fiscal data.
Trends:
The survey on Comparison of Employment in the Public Domain is in process. We publish here results for 2002. Very early 2006 data are suggesting that the new measures of employment totals are leading to significantly revised understanding of employment in the public domain.
Further reading: OECD (2007), State of the Public Service, OECD, Paris. (Forthcoming) OECD (2005), Management in Government: Feasibility Report on the Development of Comparative Data, OECD, Paris. OECD (2002), Highlights of public sector pay and employment trends, OECD, Paris.
Aspects of government measured by the indicator:
General government Activities of: Central State Local Social security funds
Other public sector Private sector in the public domain
Production stage:
Revenues Inputs Public sector processes
Outputs and intermediate outcomes Final outcomes Antecedents or constraints
Functional sector:
General public services
Defence Public order & safety
Economic affairs
Environmental protection
Housing & community amenities
Health Recreation, culture and religion
Education Social protection
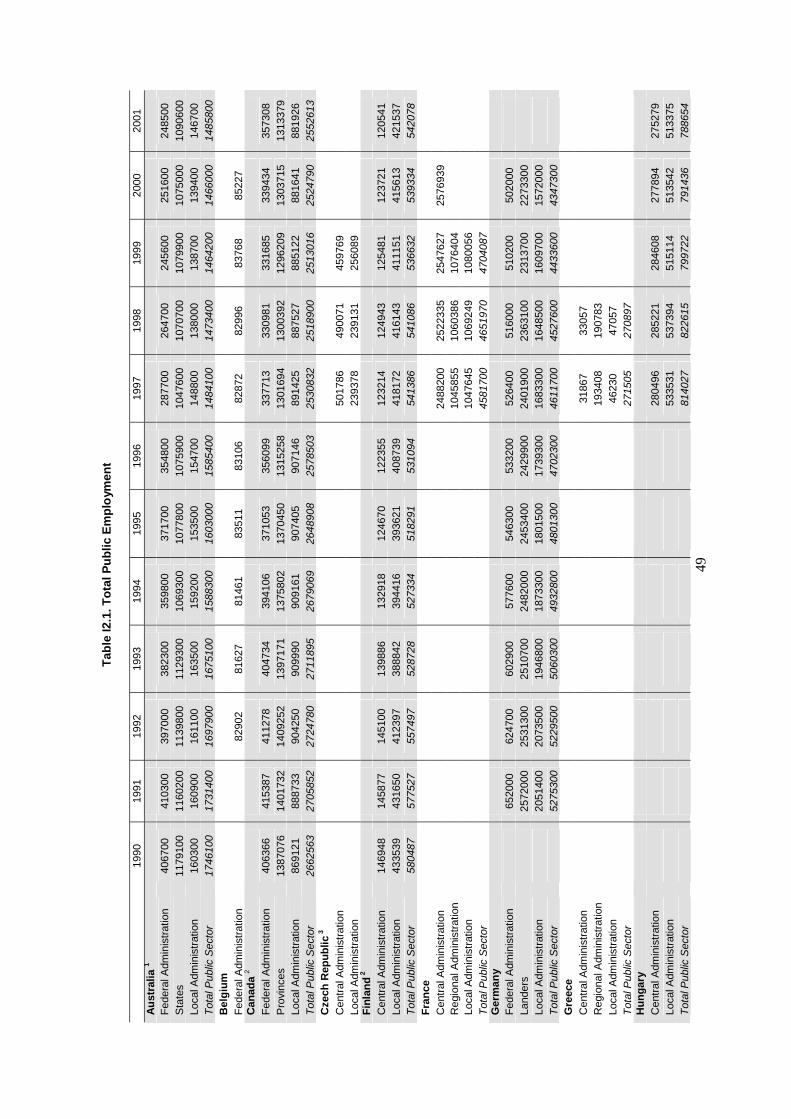
49
Tab
le I2
.1. T
ota
l Pu
blic
Em
plo
ymen
t
19
90
1991
19
92
1993
19
94
1995
19
96
1997
19
98
1999
20
00
2001
A
ust
ralia
1
F
eder
al A
dmin
istr
atio
n 40
6700
41
0300
39
7000
38
2300
35
9800
37
1700
35
4800
28
7700
26
4700
24
5600
25
1600
24
8500
S
tate
s 11
7910
0 11
6020
0 11
3980
0 11
2930
0 10
6930
0 10
7780
0 10
7590
0 10
4760
0 10
7070
0 10
7990
0 10
7500
0 10
9060
0 Lo
cal A
dmin
istr
atio
n 16
0300
16
0900
16
1100
16
3500
15
9200
15
3500
15
4700
14
8800
13
8000
13
8700
13
9400
14
6700
T
otal
Pub
lic S
ecto
r 17
4610
0 17
3140
0 16
9790
0 16
7510
0 15
8830
0 16
0300
0 15
8540
0 14
8410
0 14
7340
0 14
6420
0 14
6600
0 14
8580
0 B
elg
ium
F
eder
al A
dmin
istr
atio
n
82
902
8162
7 81
461
8351
1 83
106
8287
2 82
996
8376
8 85
227
C
anad
a 2
Fed
eral
Adm
inis
trat
ion
4063
66
4153
87
4112
78
4047
34
3941
06
3710
53
3560
99
3377
13
3309
81
3316
85
3394
34
3573
08
Pro
vinc
es
1387
076
1401
732
1409
252
1397
171
1375
802
1370
450
1315
258
1301
694
1300
392
1296
209
1303
715
1313
379
Loca
l Adm
inis
trat
ion
8691
21
8887
33
9042
50
9099
90
9091
61
9074
05
9071
46
8914
25
8875
27
8851
22
8816
41
8819
26
Tot
al P
ublic
Sec
tor
2662
563
2705
852
2724
780
2711
895
2679
069
2648
908
2578
503
2530
832
2518
900
2513
016
2524
790
2552
613
Cze
ch R
epu
blic
3
Cen
tral
Adm
inis
trat
ion
50
1786
49
0071
45
9769
Lo
cal A
dmin
istr
atio
n
2393
78
2391
31
2560
89
Fin
lan
d 2
Cen
tral
Adm
inis
trat
ion
1469
48
1458
77
1451
00
1398
86
1329
18
1246
70
1223
55
1232
14
1249
43
1254
81
1237
21
1205
41
Loca
l Adm
inis
trat
ion
4335
39
4316
50
4123
97
3888
42
3944
16
3936
21
4087
39
4181
72
4161
43
4111
51
4156
13
4215
37
Tot
al P
ublic
Sec
tor
5804
87
5775
27
5574
97
5287
28
5273
34
5182
91
5310
94
5413
86
5410
86
5366
32
5393
34
5420
78
Fra
nce
C
entr
al A
dmin
istr
atio
n
2488
200
2522
335
2547
627
2576
939
R
egio
nal A
dmin
istr
atio
n
1045
855
1060
386
1076
404
Loca
l Adm
inis
trat
ion
10
4764
5 10
6924
9 10
8005
6
T
otal
Pub
lic S
ecto
r
4581
700
4651
970
4704
087
Ger
man
y
F
eder
al A
dmin
istr
atio
n
6520
00
6247
00
6029
00
5776
00
5463
00
5332
00
5264
00
5160
00
5102
00
5020
00
La
nder
s
2572
000
2531
300
2510
700
2482
000
2453
400
2429
900
2401
900
2363
100
2313
700
2273
300
Lo
cal A
dmin
istr
atio
n
2051
400
2073
500
1946
800
1873
300
1801
500
1739
300
1683
300
1648
500
1609
700
1572
000
T
otal
Pub
lic S
ecto
r
5275
300
5229
500
5060
300
4932
800
4801
300
4702
300
4611
700
4527
600
4433
600
4347
300
G
reec
e
C
entr
al A
dmin
istr
atio
n
3186
7 33
057
R
egio
nal A
dmin
istr
atio
n
1934
08
1907
83
Lo
cal A
dmin
istr
atio
n
4623
0 47
057
T
otal
Pub
lic S
ecto
r
2715
05
2708
97
H
un
gar
y
C
entr
al A
dmin
istr
atio
n
2804
96
2852
21
2846
08
2778
94
2752
79
Loca
l Adm
inis
trat
ion
53
3531
53
7394
51
5114
51
3542
51
3375
T
otal
Pub
lic S
ecto
r
8140
27
8226
15
7997
22
7914
36
7886
54
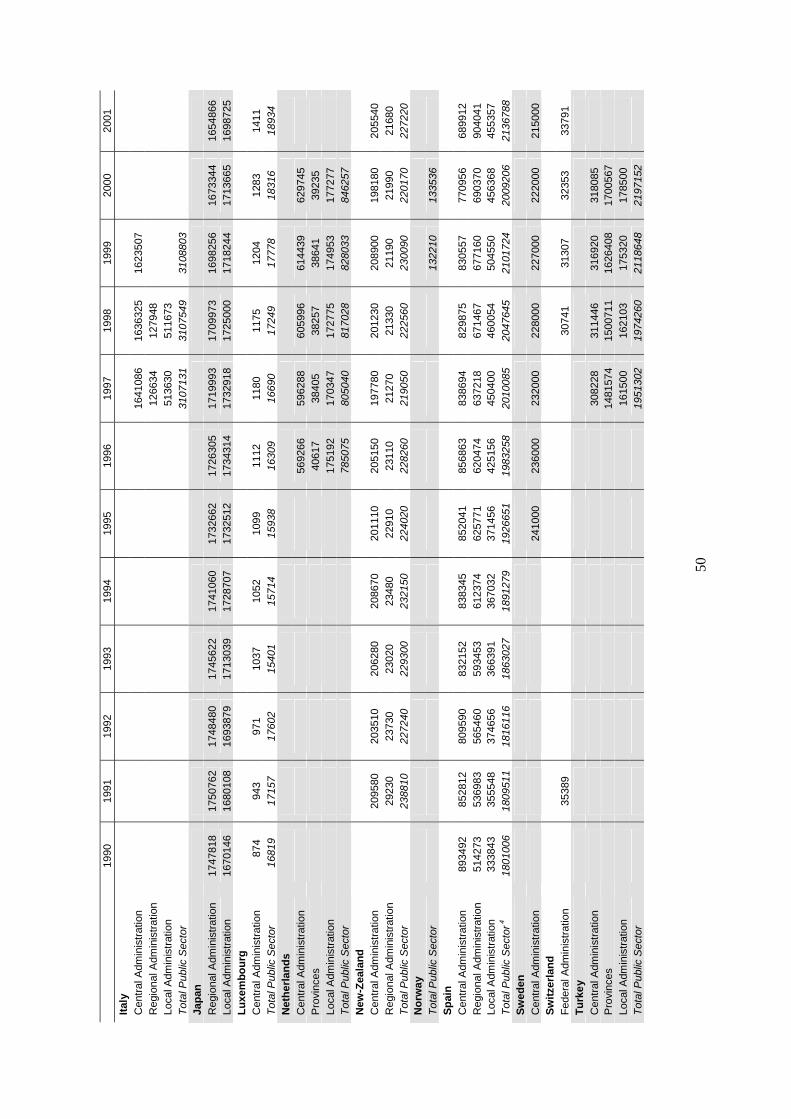
50
19
90
1991
19
92
1993
19
94
1995
19
96
1997
19
98
1999
20
00
2001
Ital
y
C
entr
al A
dmin
istr
atio
n
1641
086
1636
325
1623
507
Reg
iona
l Adm
inis
trat
ion
12
6634
12
7948
Loca
l Adm
inis
trat
ion
51
3630
51
1673
Tot
al P
ublic
Sec
tor
31
0713
1 31
0754
9 31
0880
3
Ja
pan
R
egio
nal A
dmin
istr
atio
n 17
4781
8 17
5076
2 17
4848
0 17
4562
2 17
4106
0 17
3266
2 17
2630
5 17
1999
3 17
0997
3 16
9825
6 16
7334
4 16
5486
6 Lo
cal A
dmin
istr
atio
n 16
7014
6 16
8010
8 16
9387
9 17
1303
9 17
2870
7 17
3251
2 17
3431
4 17
3291
8 17
2500
0 17
1824
4 17
1366
5 16
9872
5 L
uxe
mb
ou
rg
Cen
tral
Adm
inis
trat
ion
8
74
943
971
1037
10
52
1099
11
12
1180
11
75
1204
12
83
1411
T
otal
Pub
lic S
ecto
r 1
6819
17
157
1760
2 15
401
1571
4 15
938
1630
9 16
690
1724
9 17
778
1831
6 18
934
Net
her
lan
ds
Cen
tral
Adm
inis
trat
ion
5692
66
5962
88
6059
96
6144
39
6297
45
P
rovi
nces
40
617
3840
5 38
257
3864
1 39
235
Lo
cal A
dmin
istr
atio
n
17
5192
17
0347
17
2775
17
4953
17
7277
Tot
al P
ublic
Sec
tor
7850
75
8050
40
8170
28
8280
33
8462
57
N
ew-Z
eala
nd
C
entr
al A
dmin
istr
atio
n
2095
80
2035
10
2062
80
2086
70
2011
10
2051
50
1977
80
2012
30
2089
00
1981
80
2055
40
Reg
iona
l Adm
inis
trat
ion
29
230
2373
0 23
020
2348
0 22
910
2311
0 21
270
2133
0 21
190
2199
0 21
680
Tot
al P
ublic
Sec
tor
23
8810
22
7240
22
9300
23
2150
22
4020
22
8260
21
9050
22
2560
23
0090
22
0170
22
7220
N
orw
ay
Tot
al P
ublic
Sec
tor
13
2210
13
3536
Sp
ain
C
entr
al A
dmin
istr
atio
n 8
9349
2 8
5281
2 80
9590
83
2152
83
8345
85
2041
85
6863
83
8694
82
9875
83
0557
77
0956
68
9912
R
egio
nal A
dmin
istr
atio
n 5
1427
3 5
3698
3 56
5460
59
3453
61
2374
62
5771
62
0474
63
7218
67
1467
67
7160
69
0370
90
4041
Lo
cal A
dmin
istr
atio
n 3
3384
3 3
5554
8 37
4656
36
6391
36
7032
37
1456
42
5156
45
0400
46
0054
50
4550
45
6368
45
5357
T
otal
Pub
lic S
ecto
r 4
1801
006
1809
511
1816
116
1863
027
1891
279
1926
651
1983
258
2010
085
2047
645
2101
724
2009
206
2136
788
Sw
eden
C
entr
al A
dmin
istr
atio
n
2410
00
2360
00
2320
00
2280
00
2270
00
2220
00
2150
00
Sw
itze
rlan
d
Fed
eral
Adm
inis
trat
ion
35
389
3074
1 31
307
3235
3 33
791
Tu
rkey
C
entr
al A
dmin
istr
atio
n
3082
28
3114
46
3169
20
3180
85
P
rovi
nces
1481
574
1500
711
1626
408
1700
567
Lo
cal A
dmin
istr
atio
n
1615
00
1621
03
1753
20
1785
00
T
otal
Pub
lic S
ecto
r
1951
302
1974
260
2118
648
2197
152
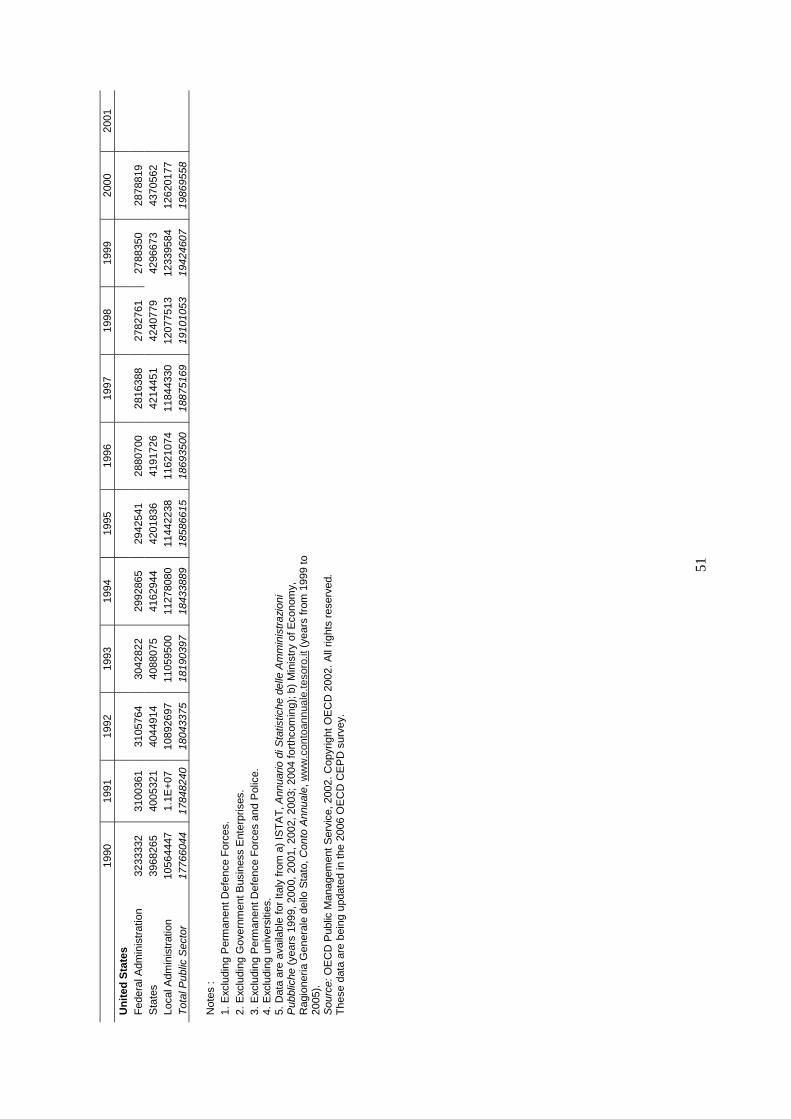
51
19
90
1991
19
92
1993
19
94
1995
19
96
1997
19
98
1999
20
00
2001
Un
ited
Sta
tes
Fed
eral
Adm
inis
trat
ion
3233
332
3100
361
3105
764
3042
822
2992
865
2942
541
2880
700
2816
388
2782
761
2788
350
2878
819
S
tate
s 39
6826
5 40
0532
1 40
4491
4 40
8807
5 41
6294
4 42
0183
6 41
9172
6 42
1445
1 42
4077
9 42
9667
3 43
7056
2
Loca
l Adm
inis
trat
ion
1056
4447
1.
1E+
07
1089
2697
11
0595
00
1127
8080
11
4422
38
1162
1074
11
8443
30
1207
7513
12
3395
84
1262
0177
Tot
al P
ublic
Sec
tor
1776
6044
17
8482
40
1804
3375
18
1903
97
1843
3889
18
5866
15
1869
3500
18
8751
69
1910
1053
19
4246
07
1986
9558
N
otes
:
1.
Exc
ludi
ng P
erm
anen
t Def
ence
For
ces.
2.
Exc
ludi
ng G
over
nmen
t Bus
ines
s E
nter
pris
es.
3. E
xclu
ding
Per
man
ent D
efen
ce F
orce
s an
d P
olic
e.
4.
Exc
ludi
ng u
nive
rsiti
es.
5. D
ata
are
avai
labl
e fo
r Ita
ly fr
om a
) IS
TA
T, A
nnua
rio d
i Sta
tistic
he d
elle
Am
min
istr
azio
ni
Pub
blic
he (
year
s 19
99, 2
000,
200
1, 2
002,
200
3; 2
004
fort
hcom
ing)
; b)
Min
istr
y of
Eco
nom
y,
Rag
ione
ria G
ener
ale
dello
Sta
to, C
onto
Ann
uale
, ww
w.c
onto
annu
ale.
teso
ro.it
(ye
ars
from
199
9 to
20
05).
Sou
rce:
OE
CD
Pub
lic M
anag
emen
t Ser
vice
, 200
2. C
opyr
ight
OE
CD
200
2. A
ll rig
hts
rese
rved
. T
hese
dat
a ar
e be
ing
upda
ted
in th
e 20
06 O
EC
D C
EP
D s
urve
y.
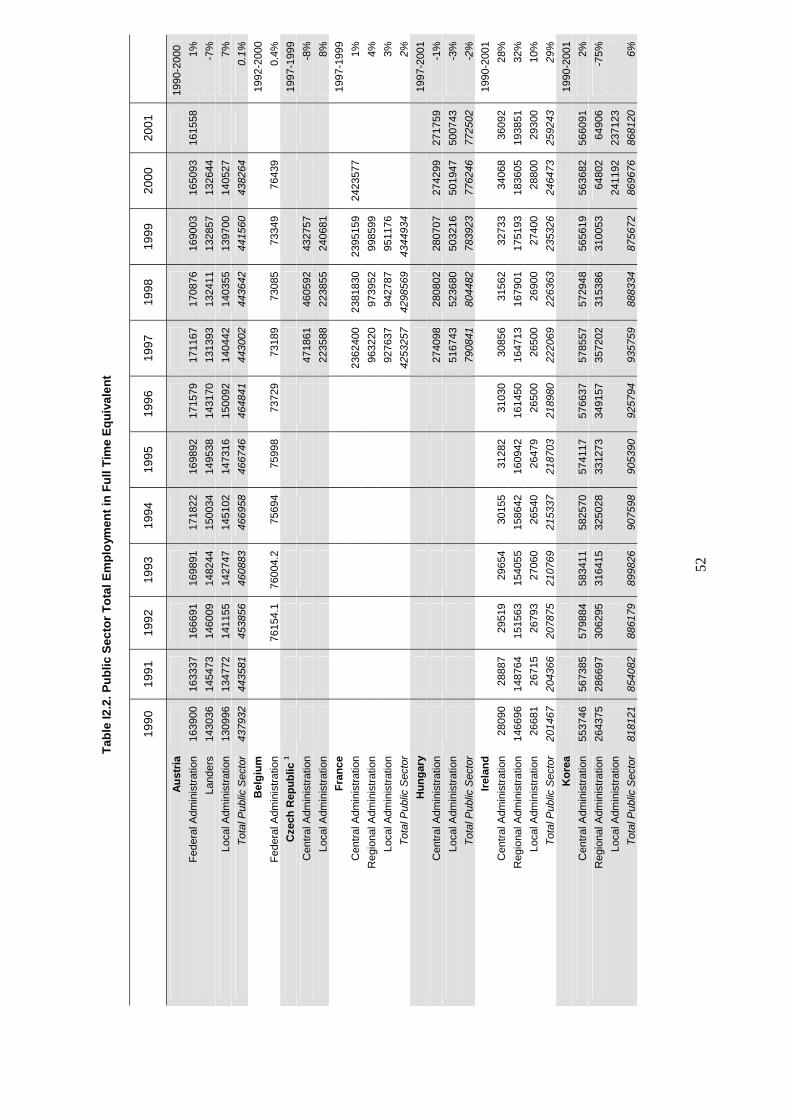
52
Tab
le I2
.2. P
ub
lic S
ecto
r T
ota
l Em
plo
ymen
t in
Fu
ll T
ime
Eq
uiv
alen
t
19
90
1991
19
92
1993
19
94
1995
19
96
1997
19
98
1999
20
00
2001
Au
stri
a
19
90-2
000
Fed
eral
Adm
inis
trat
ion
16
3900
16
3337
16
6691
16
9891
17
1822
16
9892
17
1579
17
1167
17
0876
16
9003
16
5093
16
1558
1%
Land
ers
1430
36
1454
73
1460
09
1482
44
1500
34
1495
38
1431
70
1313
93
1324
11
1328
57
1326
44
-7
%
Loca
l Adm
inis
trat
ion
1309
96
1347
72
1411
55
1427
47
1451
02
1473
16
1500
92
1404
42
1403
55
1397
00
1405
27
7%
Tot
al P
ublic
Sec
tor
4379
32
4435
81
4538
56
4608
83
4669
58
4667
46
4648
41
4430
02
4436
42
4415
60
4382
64
0.
1%
Bel
giu
m
1992
-200
0
Fed
eral
Adm
inis
trat
ion
7615
4.1
7600
4.2
7569
4 75
998
7372
9 73
189
7308
5 73
349
7643
9
0.4%
Cze
ch R
epu
blic
1
19
97-1
999
Cen
tral
Adm
inis
trat
ion
4718
61
4605
92
4327
57
-8%
Loca
l Adm
inis
trat
ion
22
3588
22
3855
24
0681
8%
Fra
nce
19
97-1
999
Cen
tral
Adm
inis
trat
ion
2362
400
2381
830
2395
159
2423
577
1%
Reg
iona
l Adm
inis
trat
ion
96
3220
97
3952
99
8599
4%
Loca
l Adm
inis
trat
ion
92
7637
94
2787
95
1176
3%
Tot
al P
ublic
Sec
tor
42
5325
7 42
9856
9 43
4493
4
2%
Hu
ng
ary
1997
-200
1
Cen
tral
Adm
inis
trat
ion
2740
98
2808
02
2807
07
2742
99
2717
59
-1%
Loca
l Adm
inis
trat
ion
51
6743
52
3680
50
3216
50
1947
50
0743
-3
%
Tot
al P
ublic
Sec
tor
79
0841
80
4482
78
3923
77
6246
77
2502
-2
%
Irel
and
19
90-2
001
Cen
tral
Adm
inis
trat
ion
28
090
2888
7 29
519
2965
4 30
155
3128
2 31
030
3085
6 31
562
3273
3 34
068
3609
2 28
%
Reg
iona
l Adm
inis
trat
ion
1466
96
1487
64
1515
63
1540
55
1586
42
1609
42
1614
50
1647
13
1679
01
1751
93
1836
05
1938
51
32%
Loca
l Adm
inis
trat
ion
2668
1 26
715
2679
3 27
060
2654
0 26
479
2650
0 26
500
2690
0 27
400
2880
0 29
300
10%
Tot
al P
ublic
Sec
tor
2014
67
2043
66
2078
75
2107
69
2153
37
2187
03
2189
80
2220
69
2263
63
2353
26
2464
73
2592
43
29%
Ko
rea
1990
-200
1
Cen
tral
Adm
inis
trat
ion
55
3746
56
7385
57
9884
58
3411
58
2570
57
4117
57
6637
57
8557
57
2948
56
5619
56
3682
56
6091
2%
Reg
iona
l Adm
inis
trat
ion
2643
75
2866
97
3062
95
3164
15
3250
28
3312
73
3491
57
3572
02
3153
86
3100
53
6480
2 64
906
-75%
Loca
l Adm
inis
trat
ion
2411
92
2371
23
Tot
al P
ublic
Sec
tor
8181
21
8540
82
8861
79
8998
26
9075
98
9053
90
9257
94
9357
59
8883
34
8756
72
8696
76
8681
20
6%
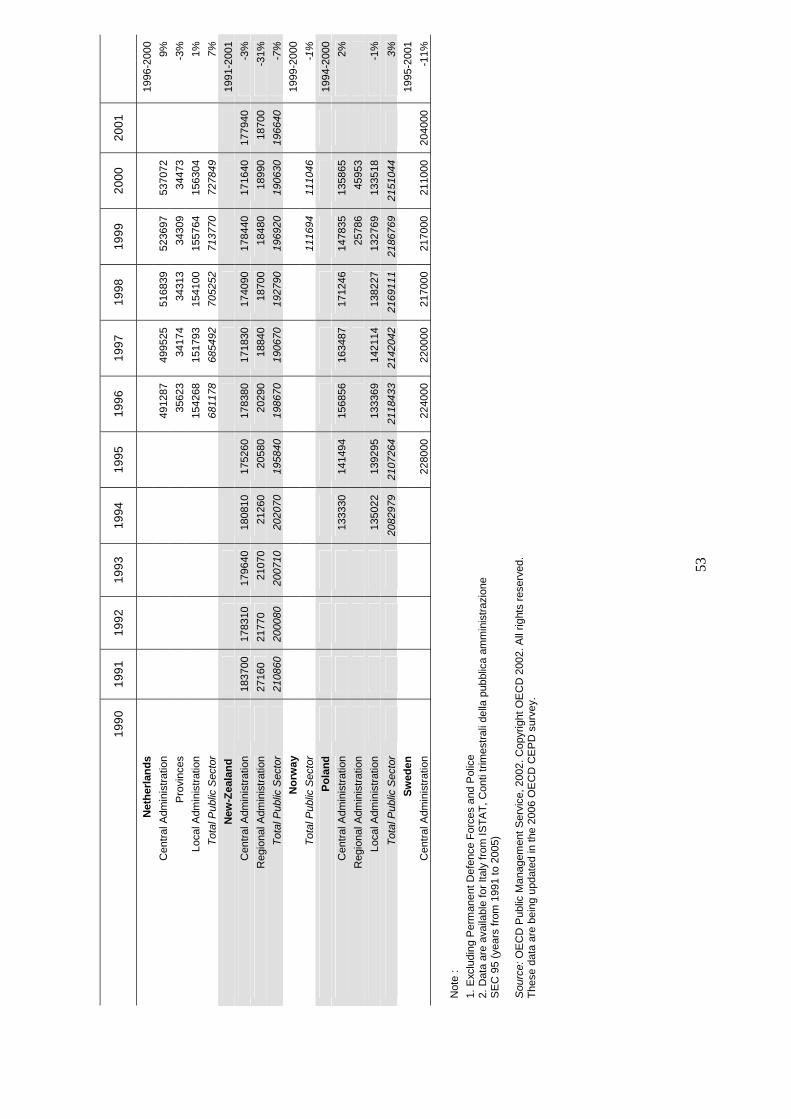
53
19
90
1991
19
92
1993
19
94
1995
19
96
1997
19
98
1999
20
00
2001
Net
her
lan
ds
1996
-200
0
Cen
tral
Adm
inis
trat
ion
49
1287
49
9525
51
6839
52
3697
53
7072
9%
Pro
vinc
es
3562
3 34
174
3431
3 34
309
3447
3
-3%
Loca
l Adm
inis
trat
ion
1542
68
1517
93
1541
00
1557
64
1563
04
1%
Tot
al P
ublic
Sec
tor
6811
78
6854
92
7052
52
7137
70
7278
49
7%
N
ew-Z
eala
nd
1991
-200
1
Cen
tral
Adm
inis
trat
ion
1837
00
1783
10
1796
40
1808
10
1752
60
1783
80
1718
30
1740
90
1784
40
1716
40
1779
40
-3%
Reg
iona
l Adm
inis
trat
ion
27
160
2177
0 21
070
2126
0 20
580
2029
0 18
840
1870
0 18
480
1899
0 18
700
-31%
Tot
al P
ublic
Sec
tor
21
0860
20
0080
20
0710
20
2070
19
5840
19
8670
19
0670
19
2790
19
6920
19
0630
19
6640
-7
%
No
rway
19
99-2
000
Tot
al P
ublic
Sec
tor
11
1694
11
1046
-1%
Po
lan
d
1994
-200
0
Cen
tral
Adm
inis
trat
ion
13
3330
14
1494
15
6856
16
3487
17
1246
14
7835
13
5865
2%
Reg
iona
l Adm
inis
trat
ion
25
786
4595
3
Loca
l Adm
inis
trat
ion
1350
22
1392
95
1333
69
1421
14
1382
27
1327
69
1335
18
-1
%
Tot
al P
ublic
Sec
tor
2082
979
2107
264
2118
433
2142
042
2169
111
2186
769
2151
044
3%
Sw
eden
19
95-2
001
Cen
tral
Adm
inis
trat
ion
2280
00
2240
00
2200
00
2170
00
2170
00
2110
00
2040
00
-11%
Not
e :
1. E
xclu
ding
Per
man
ent D
efen
ce F
orce
s an
d P
olic
e
2.
Dat
a ar
e av
aila
ble
for
Italy
from
IST
AT
, Con
ti tr
imes
tral
i del
la p
ubbl
ica
amm
inis
traz
ione
S
EC
95
(yea
rs fr
om 1
991
to 2
005)
S
ourc
e: O
EC
D P
ublic
Man
agem
ent S
ervi
ce, 2
002.
Cop
yrig
ht O
EC
D 2
002.
All
right
s re
serv
ed.
The
se d
ata
are
bein
g up
date
d in
the
2006
OE
CD
CE
PD
sur
vey.
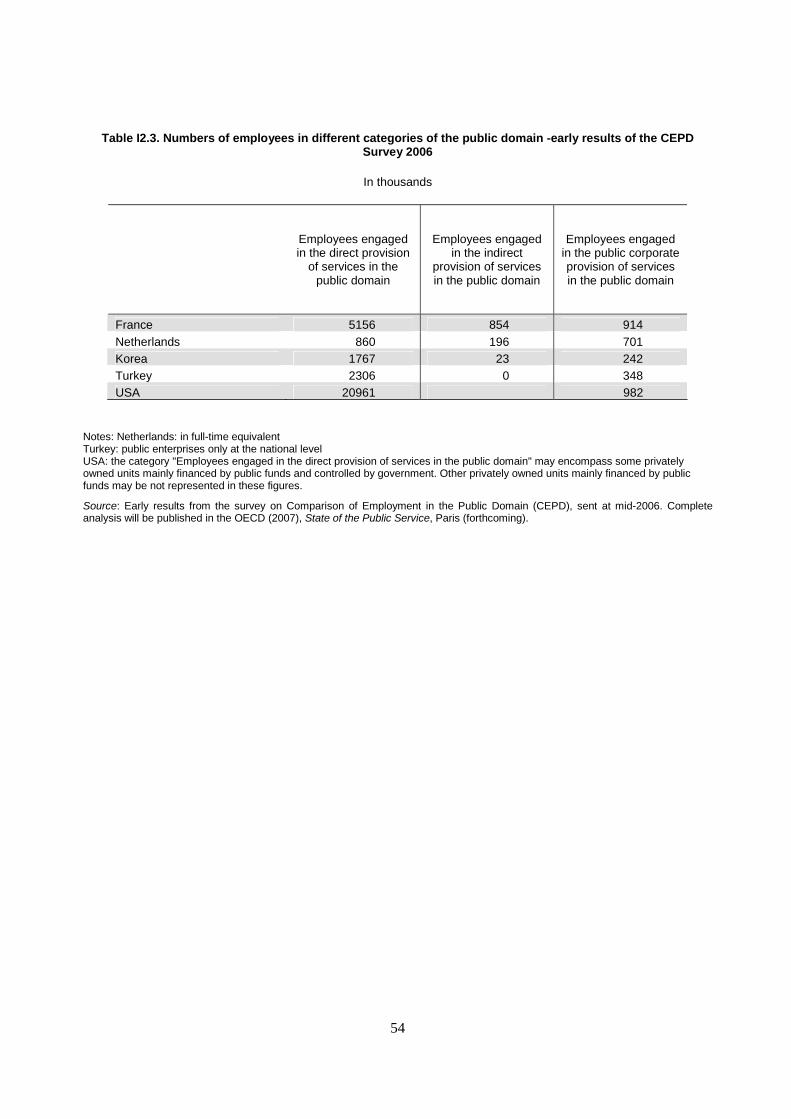
54
Table I2.3. Numbers of employees in different categories of the public domain -early results of the CEPD Survey 2006
In thousands
Employees engaged in the direct provision
of services in the public domain
Employees engaged in the indirect
provision of services in the public domain
Employees engaged in the public corporate provision of services in the public domain
France 5156 854 914 Netherlands 860 196 701 Korea 1767 23 242 Turkey 2306 0 348 USA 20961 982
Notes: Netherlands: in full-time equivalent Turkey: public enterprises only at the national level USA: the category "Employees engaged in the direct provision of services in the public domain" may encompass some privately owned units mainly financed by public funds and controlled by government. Other privately owned units mainly financed by public funds may be not represented in these figures.
Source: Early results from the survey on Comparison of Employment in the Public Domain (CEPD), sent at mid-2006. Complete analysis will be published in the OECD (2007), State of the Public Service, Paris (forthcoming).

55

56
I3. EMPLOYMENT IN THE PUBLIC DOMAIN WITHIN THE TOTAL LABOUR FORCE
Key contacts: Elsa Pilichowski, Edouard Turkish, OECD GOV
Employment within the public domain relative to the total labour force provides a headline estimate of the size of the public domain, and the influence of changes of public employment levels on the flexibility of the wider labour market. The data also provide an entry point into productivity means in the public sector compared to the private sector.
About this indicator:
The latest OECD Comparison of Employment in the Public Domain survey uses new internationally comparable definitions of the "public domain" which encompass all activities that represent a significant contingent fiscal liability to government.
The total labour force represents the number of people available for work. This is affected by many factors. The population of working age is affected by the school-leaving age and the size of the further and higher education system, which keeps down the number of young workers, and the retirement age and pension system, which keeps down the number of older workers. Among the population of working age, the participation rate is affected by the social security system, which determines how much income is available without working and how easy is to qualify for it. The labour force is also affected by a country’s immigration policy and the degree of effort put into actually enforcing it.
Further reading:
OECD (2007), State of the Public Service, Paris. (Forthcoming) OECD (2005), Management in Government: Feasibility Report on the Development of Comparative Data, Paris. OECD (2002), Highlights of public sector pay and employment trends, Paris.
Aspects of government measured by the indicator:
General government Activities of: Central State Local Social security funds
Other public sector Private sector in the public domain
Production stage:
Revenues Inputs Public sector processes
Outputs and intermediate outcomes Final outcomes Antecedents or constraints
Functional sector:
General public services
Defence Public order & safety
Economic affairs
Environmental protection
Housing & community amenities
Health Recreation, culture and religion
Education Social protection
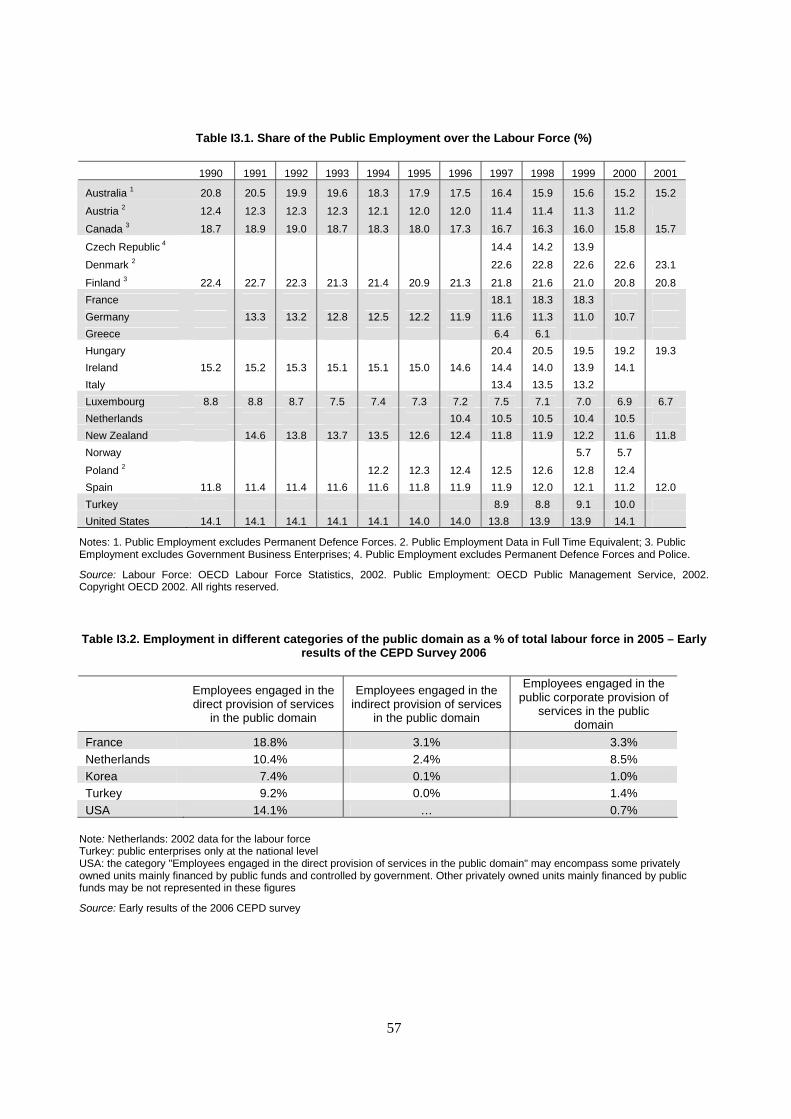
57
Table I3.1. Share of the Public Employment over the Labour Force (%)
1990 1991 1992 1993 1994 1995 1996 1997 1998 1999 2000 2001
Australia 1 20.8 20.5 19.9 19.6 18.3 17.9 17.5 16.4 15.9 15.6 15.2 15.2
Austria 2 12.4 12.3 12.3 12.3 12.1 12.0 12.0 11.4 11.4 11.3 11.2
Canada 3 18.7 18.9 19.0 18.7 18.3 18.0 17.3 16.7 16.3 16.0 15.8 15.7
Czech Republic 4 14.4 14.2 13.9
Denmark 2 22.6 22.8 22.6 22.6 23.1
Finland 3 22.4 22.7 22.3 21.3 21.4 20.9 21.3 21.8 21.6 21.0 20.8 20.8
France 18.1 18.3 18.3
Germany 13.3 13.2 12.8 12.5 12.2 11.9 11.6 11.3 11.0 10.7
Greece 6.4 6.1
Hungary 20.4 20.5 19.5 19.2 19.3
Ireland 15.2 15.2 15.3 15.1 15.1 15.0 14.6 14.4 14.0 13.9 14.1
Italy 13.4 13.5 13.2
Luxembourg 8.8 8.8 8.7 7.5 7.4 7.3 7.2 7.5 7.1 7.0 6.9 6.7
Netherlands 10.4 10.5 10.5 10.4 10.5
New Zealand 14.6 13.8 13.7 13.5 12.6 12.4 11.8 11.9 12.2 11.6 11.8
Norway 5.7 5.7
Poland 2 12.2 12.3 12.4 12.5 12.6 12.8 12.4
Spain 11.8 11.4 11.4 11.6 11.6 11.8 11.9 11.9 12.0 12.1 11.2 12.0
Turkey 8.9 8.8 9.1 10.0
United States 14.1 14.1 14.1 14.1 14.1 14.0 14.0 13.8 13.9 13.9 14.1
Notes: 1. Public Employment excludes Permanent Defence Forces. 2. Public Employment Data in Full Time Equivalent; 3. Public Employment excludes Government Business Enterprises; 4. Public Employment excludes Permanent Defence Forces and Police.
Source: Labour Force: OECD Labour Force Statistics, 2002. Public Employment: OECD Public Management Service, 2002. Copyright OECD 2002. All rights reserved.
Table I3.2. Employment in different categories of the public domain as a % of total labour force in 2005 – Early
results of the CEPD Survey 2006
Employees engaged in the direct provision of services
in the public domain
Employees engaged in the indirect provision of services
in the public domain
Employees engaged in the public corporate provision of
services in the public domain
France 18.8% 3.1% 3.3% Netherlands 10.4% 2.4% 8.5% Korea 7.4% 0.1% 1.0% Turkey 9.2% 0.0% 1.4% USA 14.1% … 0.7%
Note: Netherlands: 2002 data for the labour force Turkey: public enterprises only at the national level USA: the category "Employees engaged in the direct provision of services in the public domain" may encompass some privately owned units mainly financed by public funds and controlled by government. Other privately owned units mainly financed by public funds may be not represented in these figures
Source: Early results of the 2006 CEPD survey
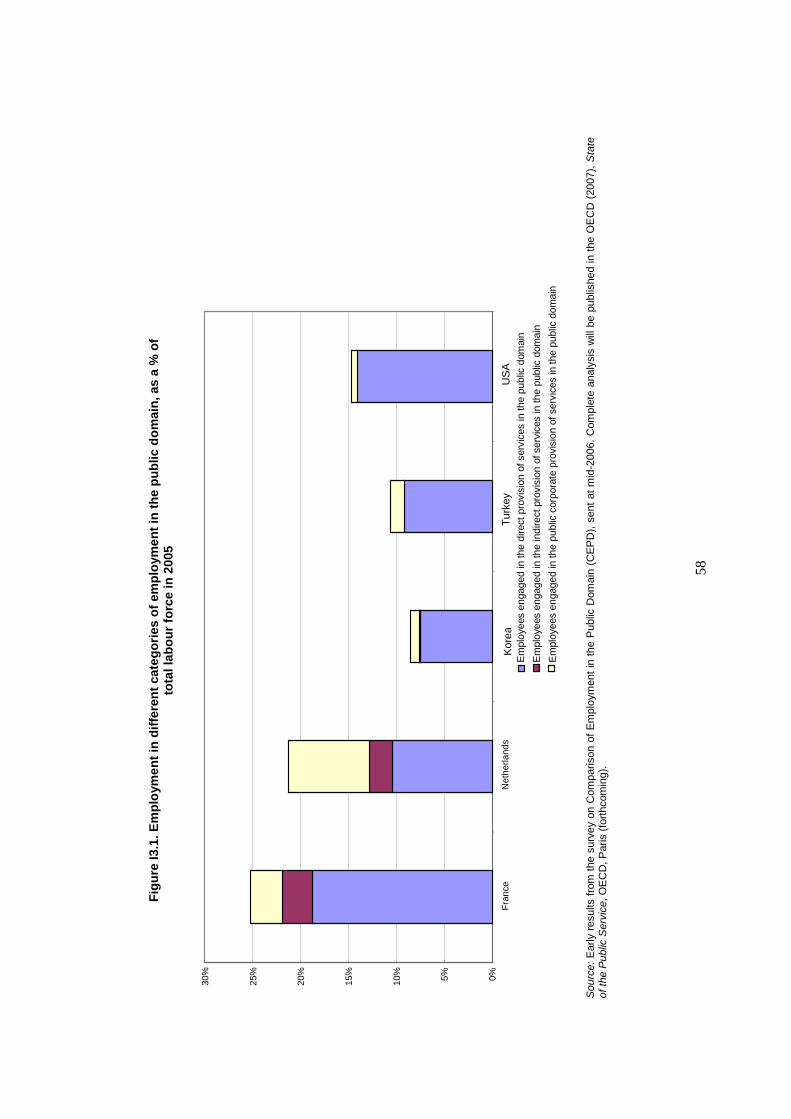
58
S
ourc
e: E
arly
res
ults
fro
m t
he s
urve
y on
Com
paris
on o
f E
mpl
oym
ent
in t
he P
ublic
Dom
ain
(CE
PD
), s
ent
at m
id-2
006.
Com
plet
e an
alys
is w
ill b
e pu
blis
hed
in t
he O
EC
D (
2007
), S
tate
of
the
Pub
lic S
ervi
ce, O
EC
D, P
aris
(fo
rthc
omin
g).
Fig
ure
I3.1
. Em
plo
ymen
t in
dif
fere
nt
cate
go
ries
of
emp
loym
ent
in t
he
pu
blic
do
mai
n, a
s a
% o
f to
tal l
abo
ur
forc
e in
200
5
0%
5%
10%
15%
20%
25%
30%
Fra
nce
Net
herla
nds
Kor
ea
Tur
key
US
A
Em
ploy
ees
enga
ged
in th
e di
rect
pro
visi
on o
f ser
vice
s in
the
publ
ic d
omai
n
Em
ploy
ees
enga
ged
in th
e in
dire
ct p
rovi
sion
of s
ervi
ces
in th
e pu
blic
dom
ain
Em
ploy
ees
enga
ged
in th
e pu
blic
cor
pora
te p
rovi
sion
of s
ervi
ces
in th
e pu
blic
dom
ain

59
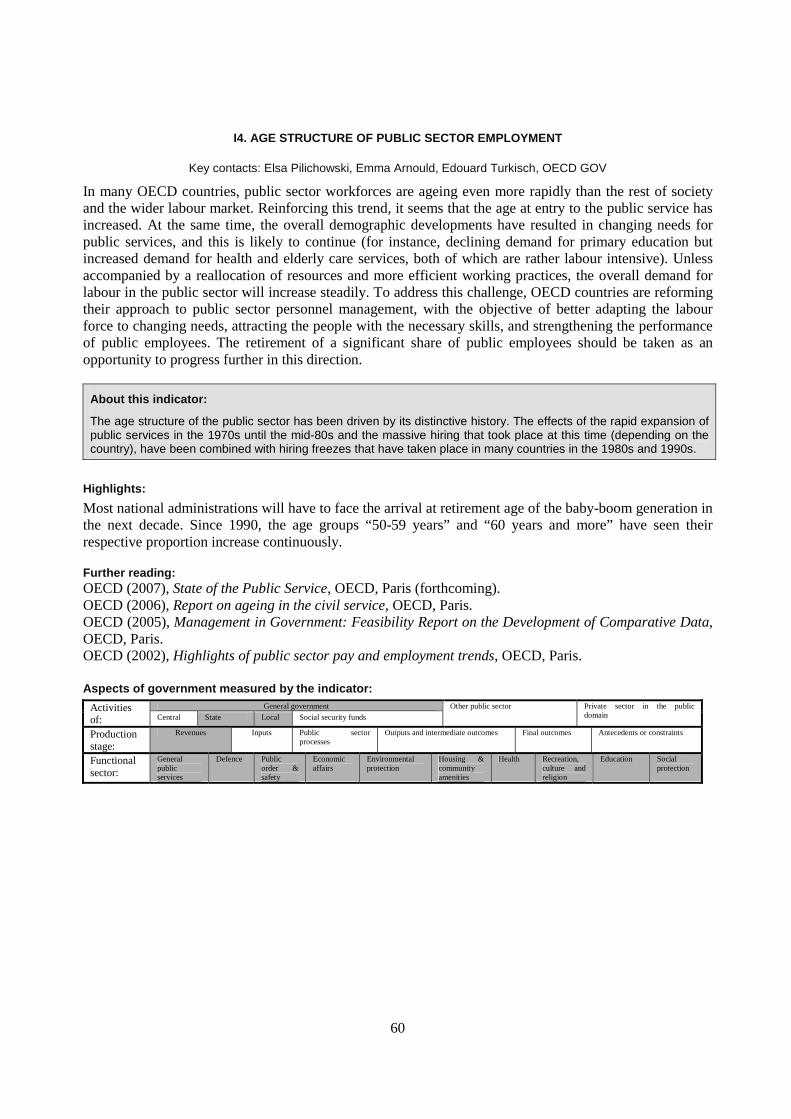
60
I4. AGE STRUCTURE OF PUBLIC SECTOR EMPLOYMENT
Key contacts: Elsa Pilichowski, Emma Arnould, Edouard Turkisch, OECD GOV
In many OECD countries, public sector workforces are ageing even more rapidly than the rest of society and the wider labour market. Reinforcing this trend, it seems that the age at entry to the public service has increased. At the same time, the overall demographic developments have resulted in changing needs for public services, and this is likely to continue (for instance, declining demand for primary education but increased demand for health and elderly care services, both of which are rather labour intensive). Unless accompanied by a reallocation of resources and more efficient working practices, the overall demand for labour in the public sector will increase steadily. To address this challenge, OECD countries are reforming their approach to public sector personnel management, with the objective of better adapting the labour force to changing needs, attracting the people with the necessary skills, and strengthening the performance of public employees. The retirement of a significant share of public employees should be taken as an opportunity to progress further in this direction.
About this indicator:
The age structure of the public sector has been driven by its distinctive history. The effects of the rapid expansion of public services in the 1970s until the mid-80s and the massive hiring that took place at this time (depending on the country), have been combined with hiring freezes that have taken place in many countries in the 1980s and 1990s.
Highlights:
Most national administrations will have to face the arrival at retirement age of the baby-boom generation in the next decade. Since 1990, the age groups “50-59 years” and “60 years and more” have seen their respective proportion increase continuously.
Further reading: OECD (2007), State of the Public Service, OECD, Paris (forthcoming). OECD (2006), Report on ageing in the civil service, OECD, Paris. OECD (2005), Management in Government: Feasibility Report on the Development of Comparative Data, OECD, Paris. OECD (2002), Highlights of public sector pay and employment trends, OECD, Paris.
Aspects of government measured by the indicator: General government Activities
of: Central State Local Social security funds
Other public sector Private sector in the public domain
Production stage:
Revenues Inputs Public sector processes
Outputs and intermediate outcomes Final outcomes Antecedents or constraints
Functional sector:
General public services
Defence Public order & safety
Economic affairs
Environmental protection
Housing & community amenities
Health Recreation, culture and religion
Education Social protection
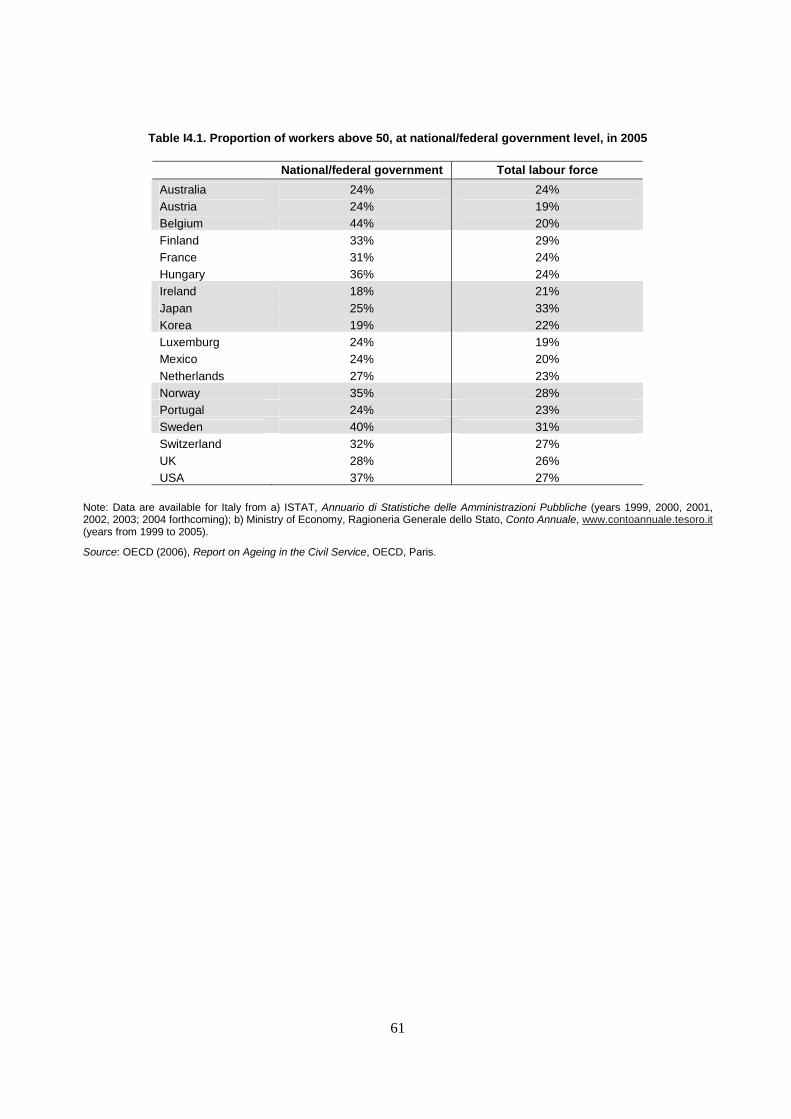
61
Table I4.1. Proportion of workers above 50, at national/federal government level, in 2005
National/federal government Total labour force
Australia 24% 24% Austria 24% 19% Belgium 44% 20% Finland 33% 29% France 31% 24% Hungary 36% 24% Ireland 18% 21% Japan 25% 33% Korea 19% 22% Luxemburg 24% 19% Mexico 24% 20% Netherlands 27% 23% Norway 35% 28% Portugal 24% 23% Sweden 40% 31% Switzerland 32% 27% UK 28% 26% USA 37% 27%
Note: Data are available for Italy from a) ISTAT, Annuario di Statistiche delle Amministrazioni Pubbliche (years 1999, 2000, 2001, 2002, 2003; 2004 forthcoming); b) Ministry of Economy, Ragioneria Generale dello Stato, Conto Annuale, www.contoannuale.tesoro.it (years from 1999 to 2005).
Source: OECD (2006), Report on Ageing in the Civil Service, OECD, Paris.
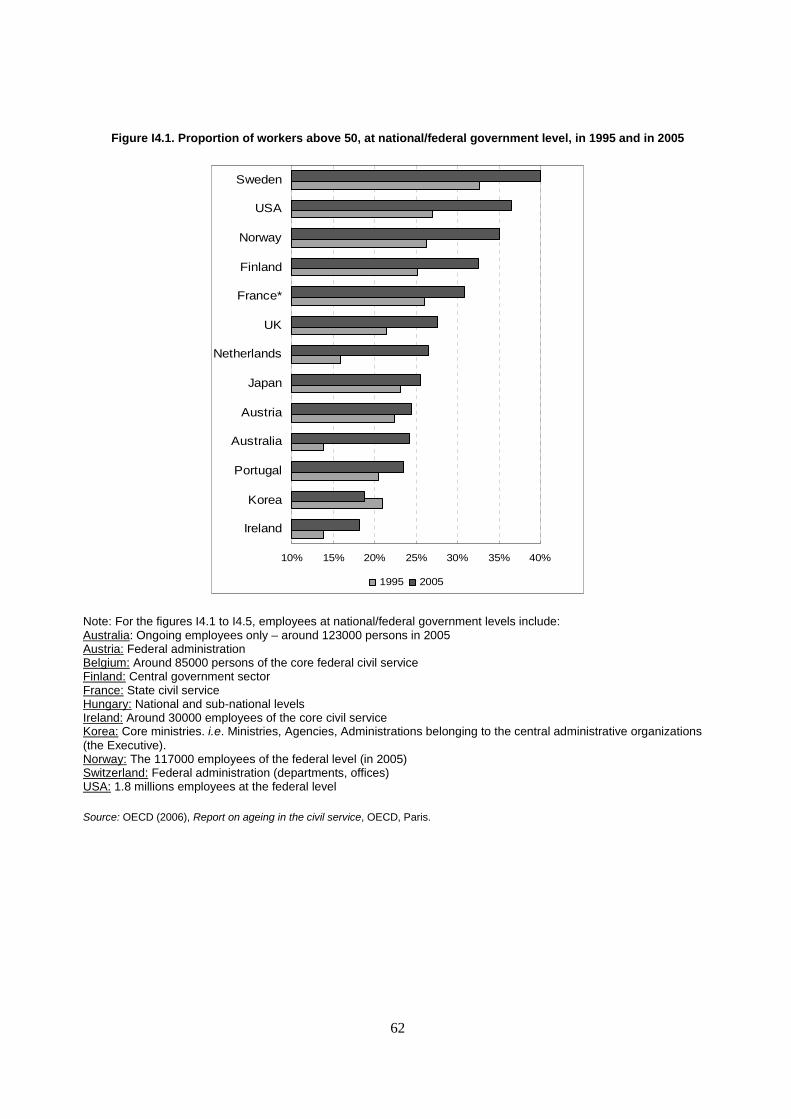
62
Figure I4.1. Proportion of workers above 50, at national/federal government level, in 1995 and in 2005
10% 15% 20% 25% 30% 35% 40%
Ireland
Korea
Portugal
Australia
Austria
Japan
Netherlands
UK
France*
Finland
Norway
USA
Sweden
1995 2005
Note: For the figures I4.1 to I4.5, employees at national/federal government levels include: Australia: Ongoing employees only – around 123000 persons in 2005 Austria: Federal administration Belgium: Around 85000 persons of the core federal civil service Finland: Central government sector France: State civil service Hungary: National and sub-national levels Ireland: Around 30000 employees of the core civil service Korea: Core ministries. i.e. Ministries, Agencies, Administrations belonging to the central administrative organizations (the Executive). Norway: The 117000 employees of the federal level (in 2005) Switzerland: Federal administration (departments, offices) USA: 1.8 millions employees at the federal level Source: OECD (2006), Report on ageing in the civil service, OECD, Paris.
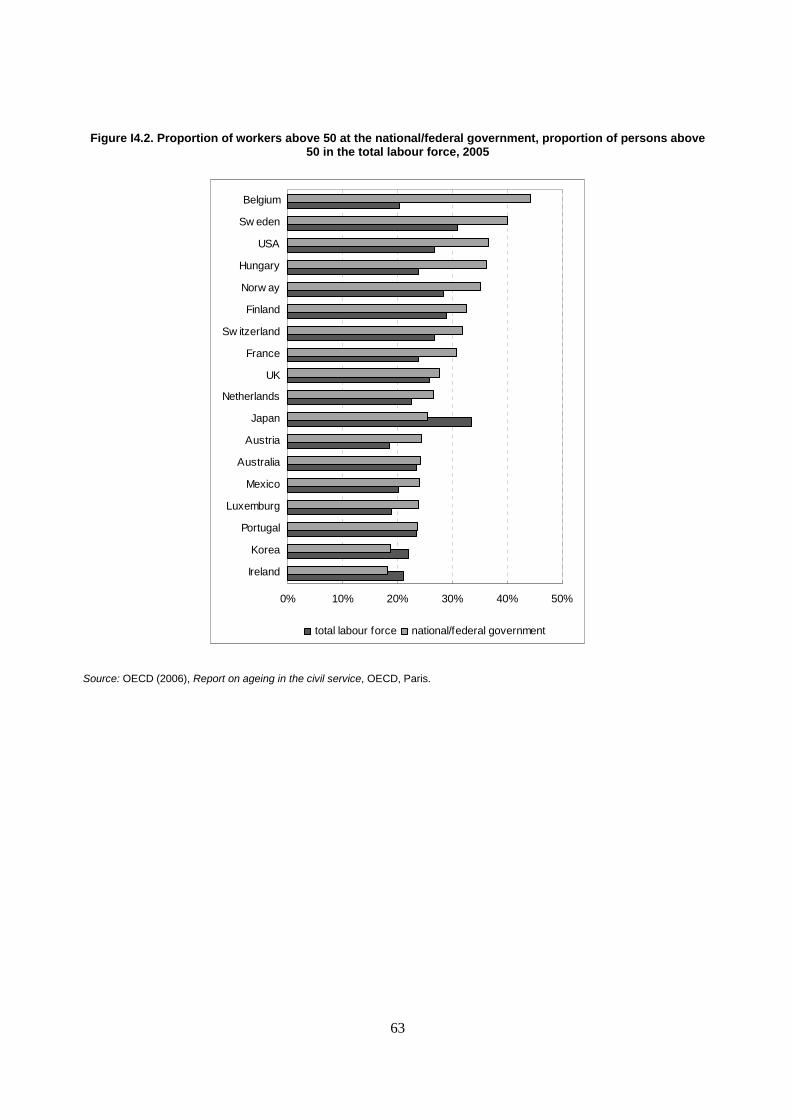
63
Figure I4.2. Proportion of workers above 50 at the national/federal government, proportion of persons above 50 in the total labour force, 2005
0% 10% 20% 30% 40% 50%
Ireland
Korea
Portugal
Luxemburg
Mexico
Australia
Austria
Japan
Netherlands
UK
France
Sw itzerland
Finland
Norw ay
Hungary
USA
Sw eden
Belgium
total labour force national/federal government
Source: OECD (2006), Report on ageing in the civil service, OECD, Paris.
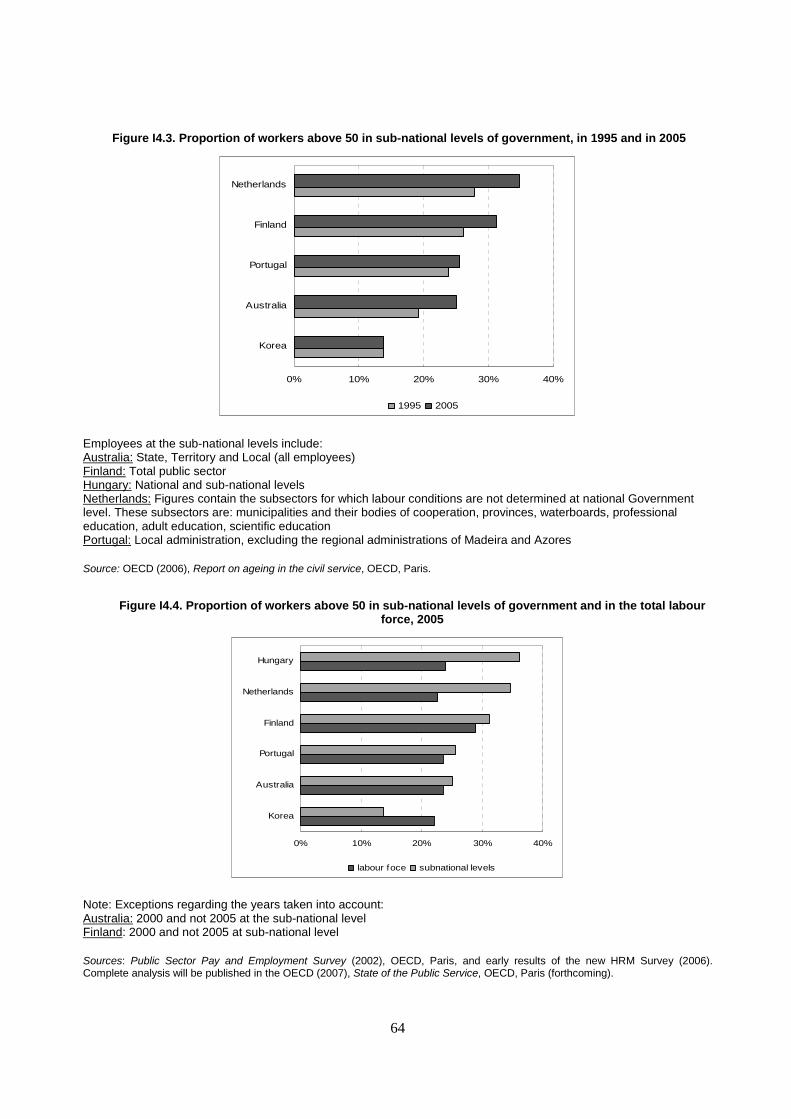
64
Figure I4.3. Proportion of workers above 50 in sub-national levels of government, in 1995 and in 2005
0% 10% 20% 30% 40%
Korea
Australia
Portugal
Finland
Netherlands
1995 2005
Employees at the sub-national levels include: Australia: State, Territory and Local (all employees) Finland: Total public sector Hungary: National and sub-national levels Netherlands: Figures contain the subsectors for which labour conditions are not determined at national Government level. These subsectors are: municipalities and their bodies of cooperation, provinces, waterboards, professional education, adult education, scientific education Portugal: Local administration, excluding the regional administrations of Madeira and Azores
Source: OECD (2006), Report on ageing in the civil service, OECD, Paris.
Figure I4.4. Proportion of workers above 50 in sub-national levels of government and in the total labour force, 2005
0% 10% 20% 30% 40%
Korea
Australia
Portugal
Finland
Netherlands
Hungary
labour foce subnational levels
Note: Exceptions regarding the years taken into account: Australia: 2000 and not 2005 at the sub-national level Finland: 2000 and not 2005 at sub-national level
Sources: Public Sector Pay and Employment Survey (2002), OECD, Paris, and early results of the new HRM Survey (2006). Complete analysis will be published in the OECD (2007), State of the Public Service, OECD, Paris (forthcoming).
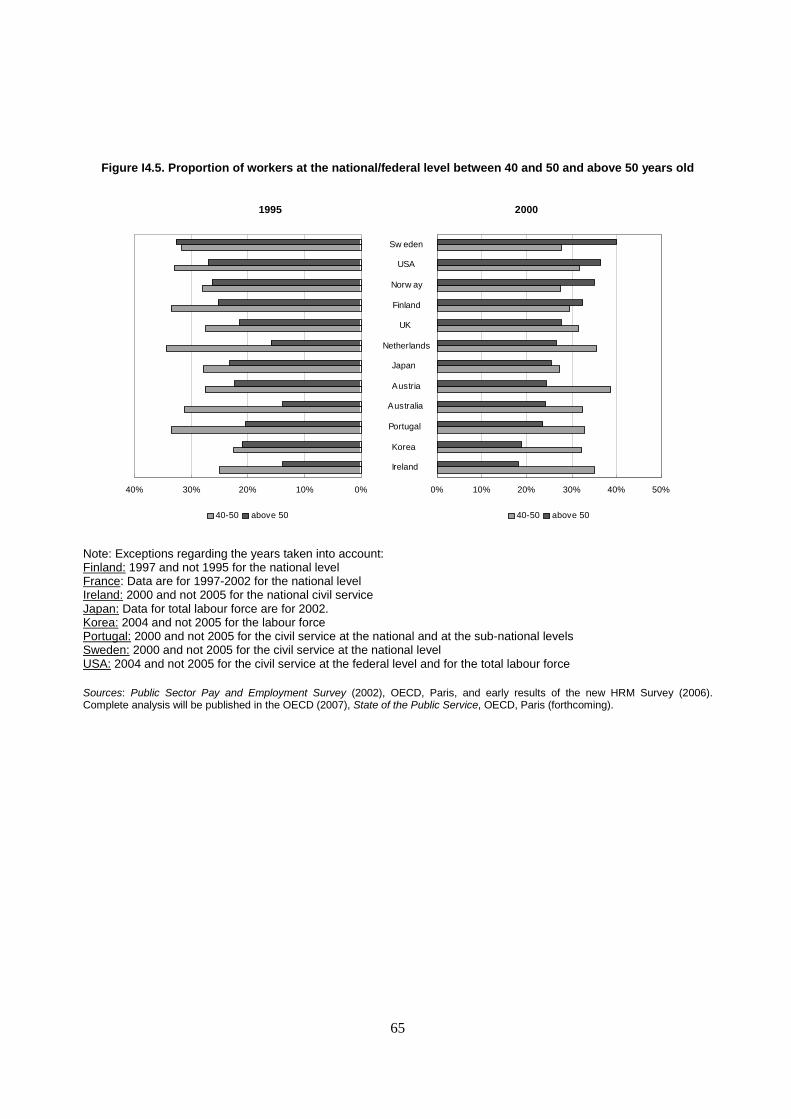
65
Figure I4.5. Proportion of workers at the national/federal level between 40 and 50 and above 50 years old
1995
0%10%20%30%40%
Ireland
Korea
Portugal
Australia
Austria
Japan
Netherlands
UK
Finland
Norw ay
USA
Sw eden
40-50 above 50
2000
0% 10% 20% 30% 40% 50%
Ireland
Korea
Portugal
Australia
Austria
Japan
Netherlands
UK
Finland
Norw ay
USA
Sw eden
40-50 above 50
Note: Exceptions regarding the years taken into account: Finland: 1997 and not 1995 for the national level France: Data are for 1997-2002 for the national level Ireland: 2000 and not 2005 for the national civil service Japan: Data for total labour force are for 2002. Korea: 2004 and not 2005 for the labour force Portugal: 2000 and not 2005 for the civil service at the national and at the sub-national levels Sweden: 2000 and not 2005 for the civil service at the national level USA: 2004 and not 2005 for the civil service at the federal level and for the total labour force
Sources: Public Sector Pay and Employment Survey (2002), OECD, Paris, and early results of the new HRM Survey (2006). Complete analysis will be published in the OECD (2007), State of the Public Service, OECD, Paris (forthcoming).
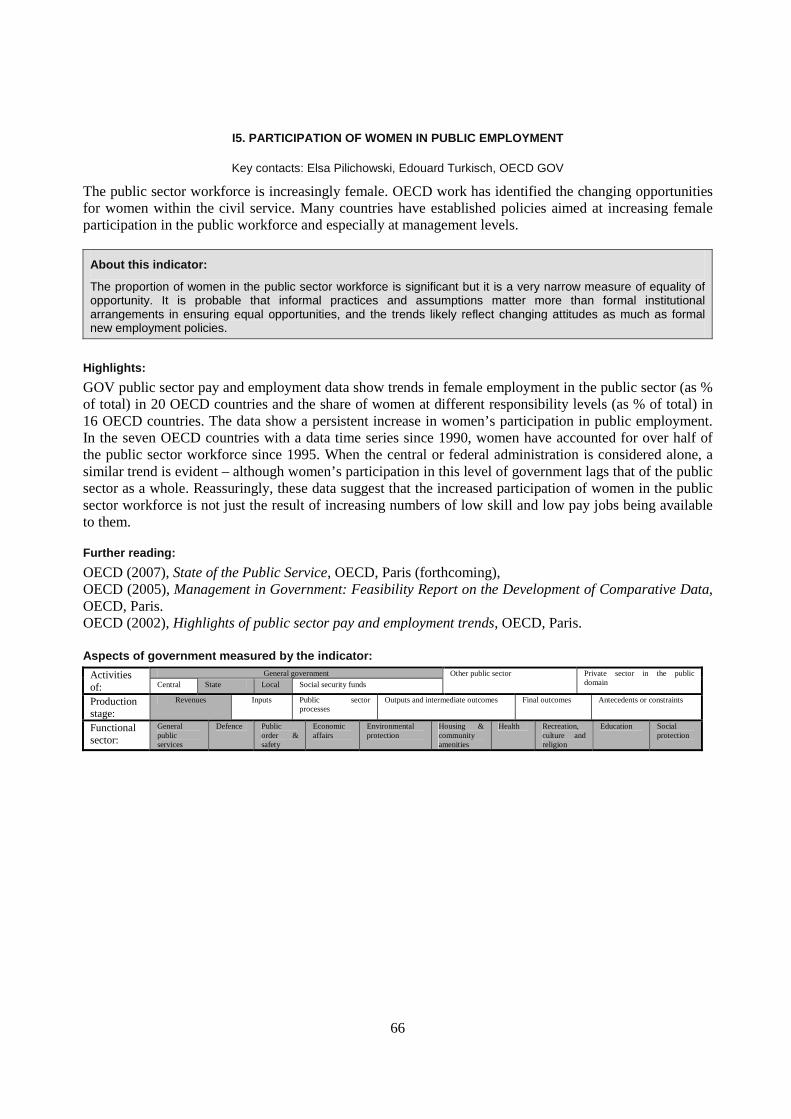
66
I5. PARTICIPATION OF WOMEN IN PUBLIC EMPLOYMENT
Key contacts: Elsa Pilichowski, Edouard Turkisch, OECD GOV
The public sector workforce is increasingly female. OECD work has identified the changing opportunities for women within the civil service. Many countries have established policies aimed at increasing female participation in the public workforce and especially at management levels.
About this indicator:
The proportion of women in the public sector workforce is significant but it is a very narrow measure of equality of opportunity. It is probable that informal practices and assumptions matter more than formal institutional arrangements in ensuring equal opportunities, and the trends likely reflect changing attitudes as much as formal new employment policies.
Highlights:
GOV public sector pay and employment data show trends in female employment in the public sector (as % of total) in 20 OECD countries and the share of women at different responsibility levels (as % of total) in 16 OECD countries. The data show a persistent increase in women’s participation in public employment. In the seven OECD countries with a data time series since 1990, women have accounted for over half of the public sector workforce since 1995. When the central or federal administration is considered alone, a similar trend is evident – although women’s participation in this level of government lags that of the public sector as a whole. Reassuringly, these data suggest that the increased participation of women in the public sector workforce is not just the result of increasing numbers of low skill and low pay jobs being available to them.
Further reading:
OECD (2007), State of the Public Service, OECD, Paris (forthcoming), OECD (2005), Management in Government: Feasibility Report on the Development of Comparative Data, OECD, Paris. OECD (2002), Highlights of public sector pay and employment trends, OECD, Paris.
Aspects of government measured by the indicator: General government Activities
of: Central State Local Social security funds
Other public sector Private sector in the public domain
Production stage:
Revenues Inputs Public sector processes
Outputs and intermediate outcomes Final outcomes Antecedents or constraints
Functional sector:
General public services
Defence Public order & safety
Economic affairs
Environmental protection
Housing & community amenities
Health Recreation, culture and religion
Education Social protection
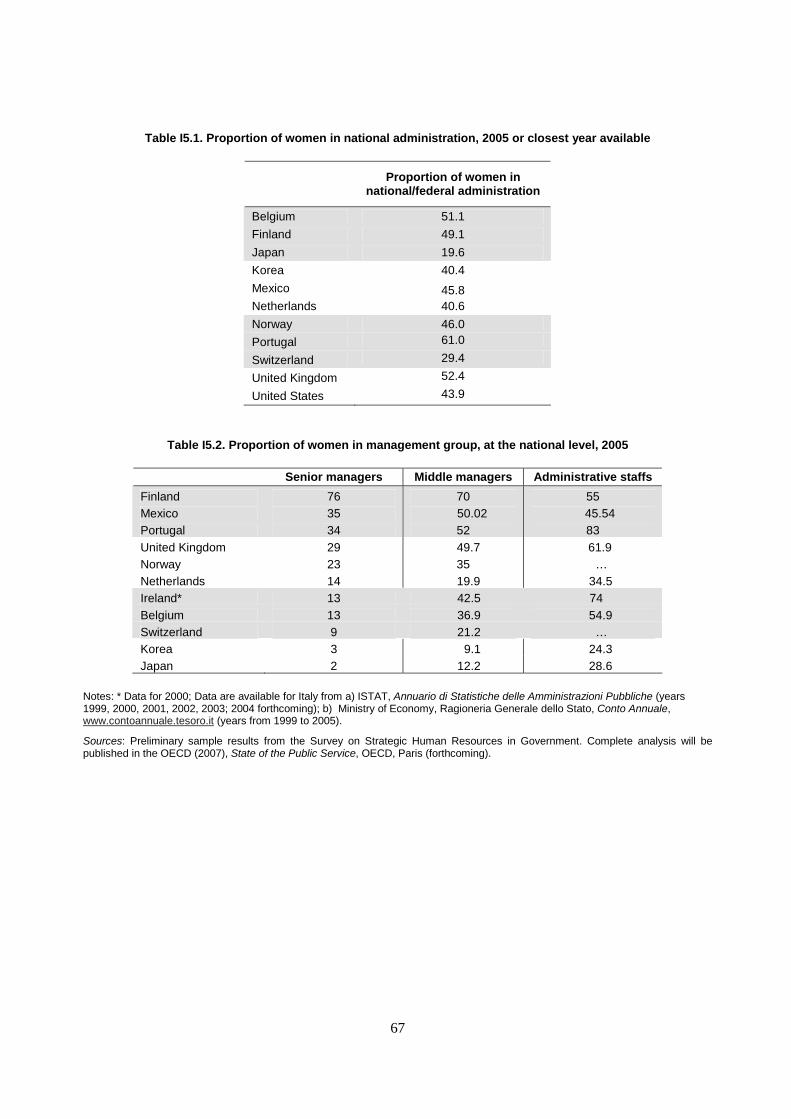
67
Table I5.1. Proportion of women in national administration, 2005 or closest year available
Proportion of women in national/federal administration
Belgium 51.1
Finland 49.1
Japan 19.6
Korea 40.4
Mexico 45.8 Netherlands 40.6
Norway 46.0
Portugal 61.0
Switzerland 29.4
United Kingdom 52.4
United States 43.9
Table I5.2. Proportion of women in management group, at the national level, 2005
Senior managers Middle managers Administrative staffs
Finland 76 70 55 Mexico 35 50.02 45.54 Portugal 34 52 83 United Kingdom 29 49.7 61.9 Norway 23 35 … Netherlands 14 19.9 34.5 Ireland* 13 42.5 74 Belgium 13 36.9 54.9 Switzerland 9 21.2 … Korea 3 9.1 24.3 Japan 2 12.2 28.6
Notes: * Data for 2000; Data are available for Italy from a) ISTAT, Annuario di Statistiche delle Amministrazioni Pubbliche (years 1999, 2000, 2001, 2002, 2003; 2004 forthcoming); b) Ministry of Economy, Ragioneria Generale dello Stato, Conto Annuale, www.contoannuale.tesoro.it (years from 1999 to 2005).
Sources: Preliminary sample results from the Survey on Strategic Human Resources in Government. Complete analysis will be published in the OECD (2007), State of the Public Service, OECD, Paris (forthcoming).
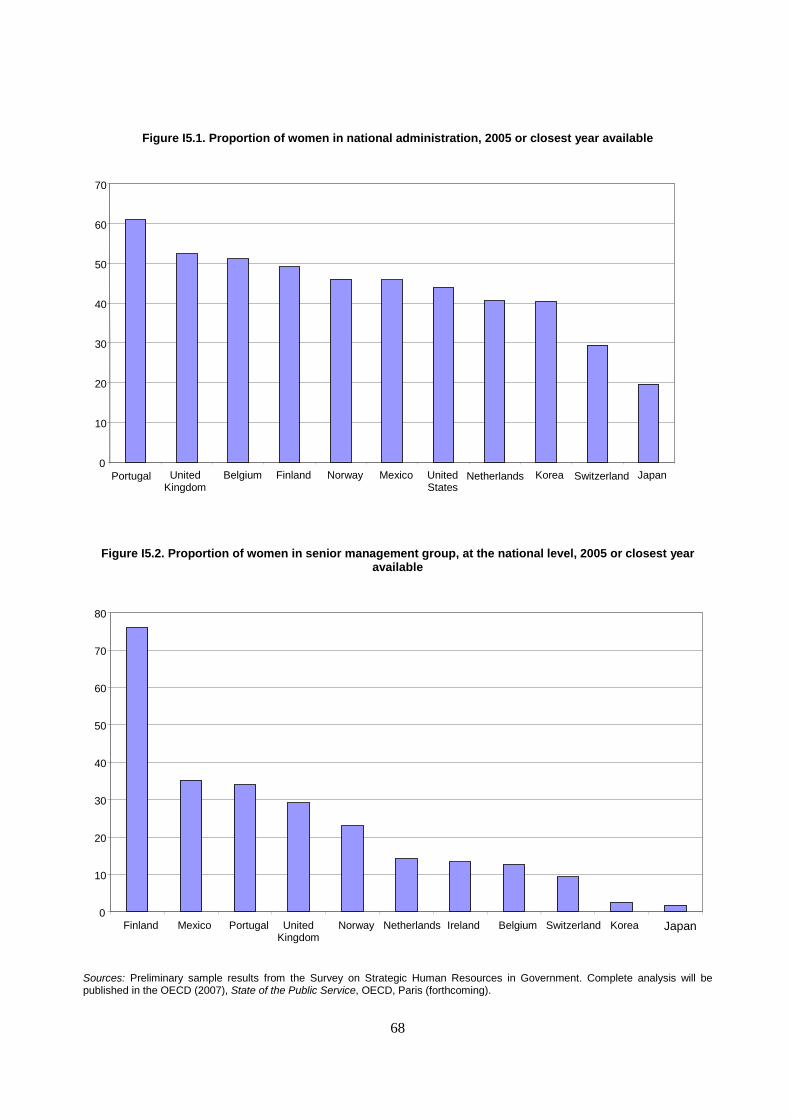
68
Figure I5.1. Proportion of women in national administration, 2005 or closest year available
Figure I5.2. Proportion of women in senior management group, at the national level, 2005 or closest year available
Sources: Preliminary sample results from the Survey on Strategic Human Resources in Government. Complete analysis will be published in the OECD (2007), State of the Public Service, OECD, Paris (forthcoming).
0
10
20
30
40
50
60
70
Portugal United Kingdom
Belgium Finland Norway Mexico United States
Netherlands Korea Switzerland Japan
0
10
20
30
40
50
60
70
80
Finland Mexico Portugal United Kingdom
Norway Netherlands Ireland Belgium Switzerland Korea Japan
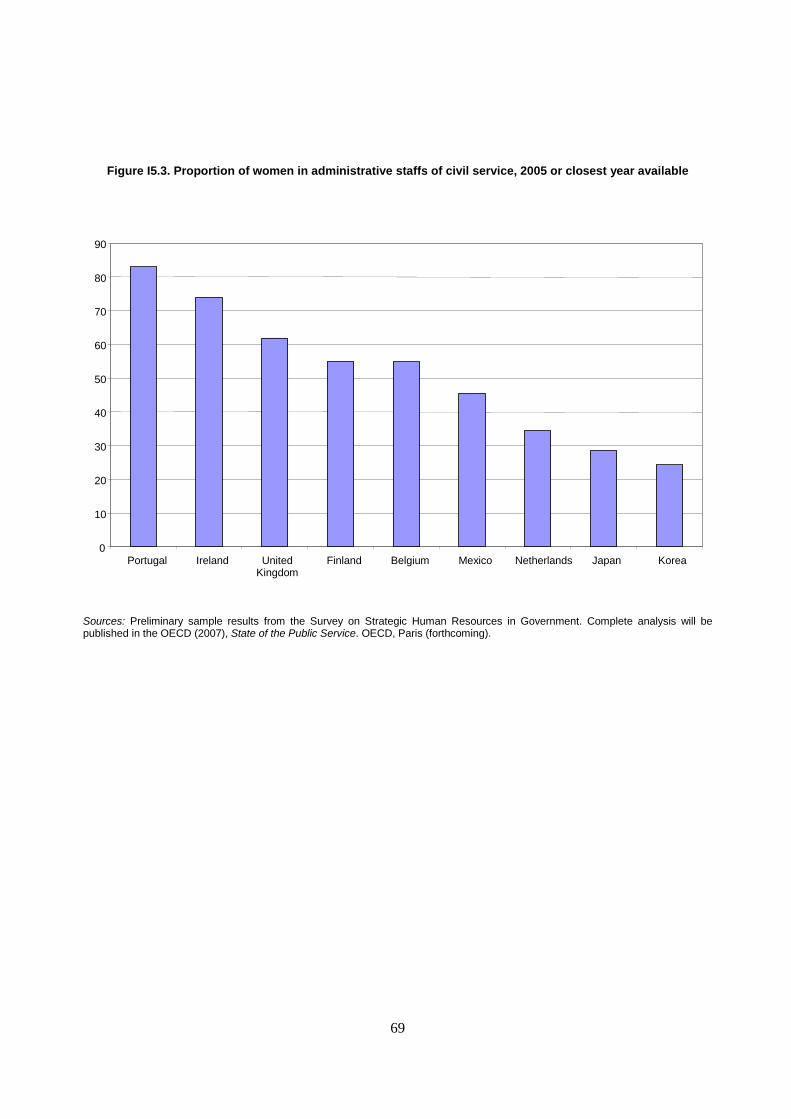
69
Figure I5.3. Proportion of women in administrative staffs of civil service, 2005 or closest year available
Sources: Preliminary sample results from the Survey on Strategic Human Resources in Government. Complete analysis will be published in the OECD (2007), State of the Public Service. OECD, Paris (forthcoming).
0
10
20
30
40
50
60
70
80
90
Portugal Ireland United Kingdom
Finland Belgium Mexico Netherlands Japan Korea
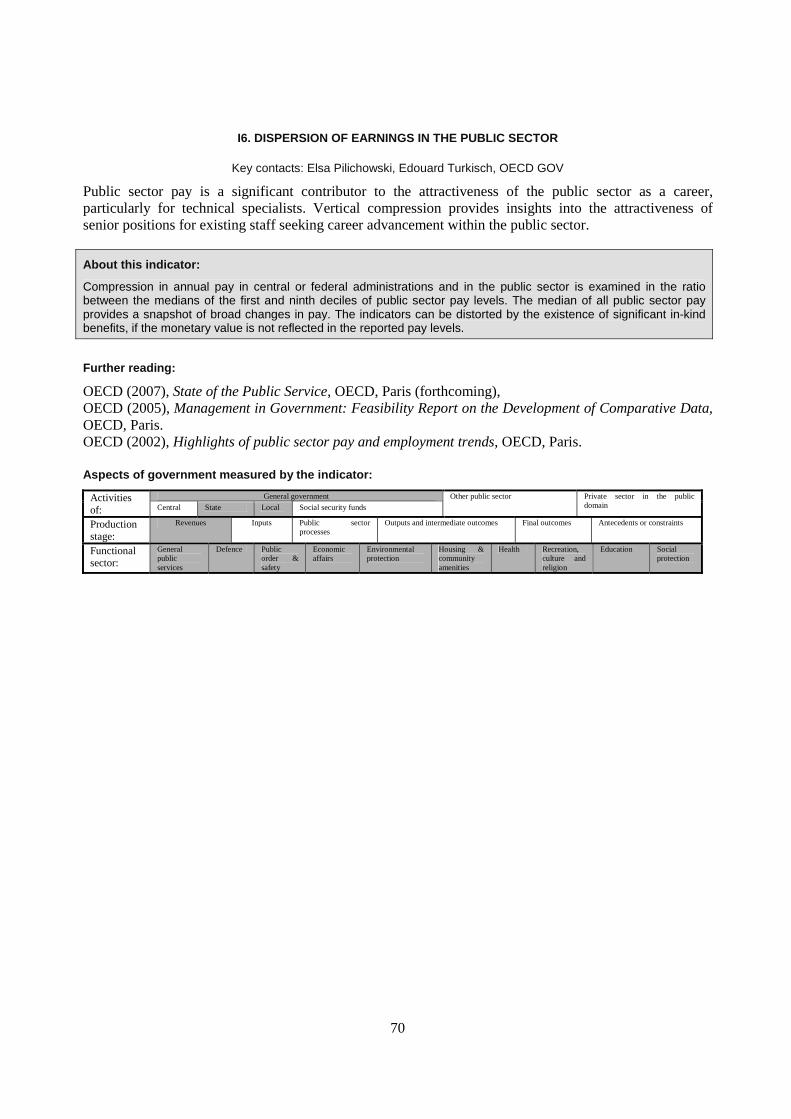
70
I6. DISPERSION OF EARNINGS IN THE PUBLIC SECTOR
Key contacts: Elsa Pilichowski, Edouard Turkisch, OECD GOV
Public sector pay is a significant contributor to the attractiveness of the public sector as a career, particularly for technical specialists. Vertical compression provides insights into the attractiveness of senior positions for existing staff seeking career advancement within the public sector.
About this indicator:
Compression in annual pay in central or federal administrations and in the public sector is examined in the ratio between the medians of the first and ninth deciles of public sector pay levels. The median of all public sector pay provides a snapshot of broad changes in pay. The indicators can be distorted by the existence of significant in-kind benefits, if the monetary value is not reflected in the reported pay levels.
Further reading:
OECD (2007), State of the Public Service, OECD, Paris (forthcoming), OECD (2005), Management in Government: Feasibility Report on the Development of Comparative Data, OECD, Paris. OECD (2002), Highlights of public sector pay and employment trends, OECD, Paris.
Aspects of government measured by the indicator:
General government Activities of: Central State Local Social security funds
Other public sector Private sector in the public domain
Production stage:
Revenues Inputs Public sector processes
Outputs and intermediate outcomes Final outcomes Antecedents or constraints
Functional sector:
General public services
Defence Public order & safety
Economic affairs
Environmental protection
Housing & community amenities
Health Recreation, culture and religion
Education Social protection
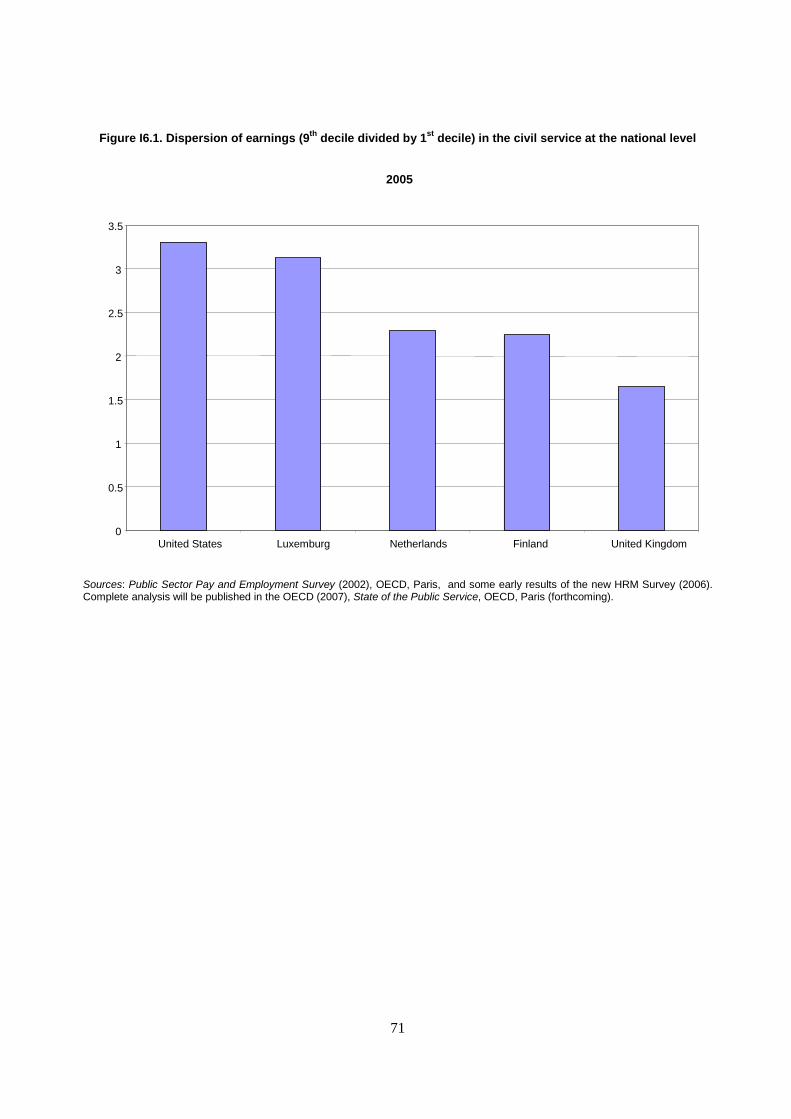
71
Figure I6.1. Dispersion of earnings (9th decile divided by 1st decile) in the civil service at the national level
2005
Sources: Public Sector Pay and Employment Survey (2002), OECD, Paris, and some early results of the new HRM Survey (2006). Complete analysis will be published in the OECD (2007), State of the Public Service, OECD, Paris (forthcoming).
0
0.5
1
1.5
2
2.5
3
3.5
United States Luxemburg Netherlands Finland United Kingdom
72
I7. PUBLIC SECTOR PENSION RIGHTS
Key contacts: Elsa Pilichowski, Edouard Turkisch, OECD GOV
Public sector pensions are a significant component of total compensation, and so contribute to the attractiveness of the public sector as a career, particularly for technical specialists. The way in which pensions are structured has implications for the attraction of senior positions, both for external applicants and for existing staff seeking career advancement within the public sector. Pensions also constitute a significant and often unknown fiscal liability.
About this indicator:
Pension rights are determined by reference to a series of parameters related to age and by the way in which the pension is calculated. Age need not be a decisive element in calculating pensions, especially in countries where there are general rules for access to the basic scheme. These latter include length of residence requirements and a single retirement age. The pension, either a fixed amount or an amount that varies according to resources, is mainly financed out of income tax. In principle, the makeup of the household is taken into account for payment of incremental pensions. Some laws or company statutes do not allow people to be kept on in employment after a certain age. Different ages can be set for the supplementary retirement pension. This difference in age is an incentive to employees to stay until they reach the retirement age laid down in the basic scheme. In supplementary schemes, the social partners often play a major role in determining the retirement age.
There are three key variables: 1. The minimum retirement age is the age at which civil servants can ask for the liquidation of rights on retirement and receive a pension immediately. 2. The maximum retirement age means the age when civil servants must leave their posts and liquidate their pensions. 3. The replacement rate is the relationship between the average pension of a given individual or population and average earnings at a certain date.
Highlights:
Public sector pension schemes in OECD member countries vary substantially. The legal age of retirement is a decisive factor in calculating the old age pensions of workers in certain member countries of the OECD. It is between 60 and 65 for public sector employees. Other member countries have decided not to set a legal age (New Zealand, Japan and Australia).Two countries (Portugal and France) make derogations, in terms of age, for politicians. In most member countries of the OECD, the age for retirement is identical for men and women. The trend in member countries of the European Union is to bring the age of retirement of women into line with that for men. In countries where special schemes exist for public sector employees, the replacement rate is higher than in other countries. In practice, it varies between 70 and 100% .The replacement rate is lower, if not very low, in countries where defined contribution schemes play a large part and where the pay of public sector employees is similar to that in the private sector. The rates vary between 40 and 60%.
Further reading:
OECD (2005), “Public Sector Pension Schemes in OECD Member Countries: Preliminary Findings”, presented at the Human Resources Management (HRM) Working Party, OECD Headquarters, Paris, 10-11 October 2005.
Aspects of government measured by the indicator:
General government Activities of: Central State Local Social security funds
Other public sector Private sector in the public domain
Production stage:
Revenues Inputs Public sector processes
Outputs and intermediate outcomes Final outcomes Antecedents or constraints
Functional sector:
General public services
Defence Public order & safety
Economic affairs
Environmental protection
Housing & community amenities
Health Recreation, culture and religion
Education Social protection
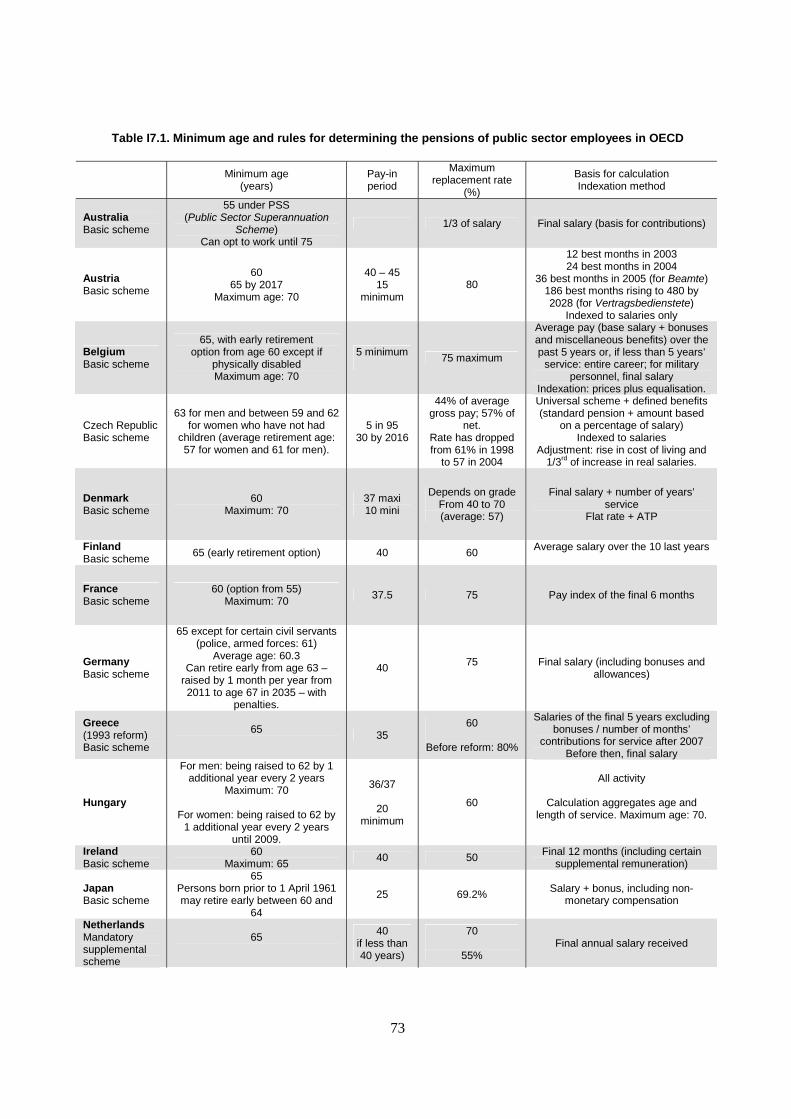
73
Table I7.1. Minimum age and rules for determining the pensions of public sector employees in OECD
Minimum age (years)
Pay-in period
Maximum replacement rate
(%)
Basis for calculation Indexation method
Australia Basic scheme
55 under PSS (Public Sector Superannuation
Scheme) Can opt to work until 75
1/3 of salary Final salary (basis for contributions)
Austria Basic scheme
60 65 by 2017
Maximum age: 70
40 – 45 15
minimum 80
12 best months in 2003 24 best months in 2004
36 best months in 2005 (for Beamte) 186 best months rising to 480 by 2028 (for Vertragsbedienstete)
Indexed to salaries only
Belgium Basic scheme
65, with early retirement option from age 60 except if
physically disabled Maximum age: 70
5 minimum
75 maximum
Average pay (base salary + bonuses and miscellaneous benefits) over the past 5 years or, if less than 5 years’
service: entire career; for military personnel, final salary
Indexation: prices plus equalisation.
Czech Republic Basic scheme
63 for men and between 59 and 62 for women who have not had
children (average retirement age: 57 for women and 61 for men).
5 in 95 30 by 2016
44% of average gross pay; 57% of
net. Rate has dropped from 61% in 1998
to 57 in 2004
Universal scheme + defined benefits (standard pension + amount based
on a percentage of salary) Indexed to salaries
Adjustment: rise in cost of living and 1/3rd of increase in real salaries.
Denmark Basic scheme
60 Maximum: 70
37 maxi 10 mini
Depends on grade From 40 to 70 (average: 57)
Final salary + number of years’ service
Flat rate + ATP
Finland Basic scheme
65 (early retirement option) 40 60 Average salary over the 10 last years
France Basic scheme
60 (option from 55) Maximum: 70 37.5 75 Pay index of the final 6 months
Germany Basic scheme
65 except for certain civil servants (police, armed forces: 61)
Average age: 60.3 Can retire early from age 63 –
raised by 1 month per year from 2011 to age 67 in 2035 – with
penalties.
40 75
Final salary (including bonuses and allowances)
Greece (1993 reform) Basic scheme
65 35
60
Before reform: 80%
Salaries of the final 5 years excluding bonuses / number of months’
contributions for service after 2007 Before then, final salary
Hungary
For men: being raised to 62 by 1 additional year every 2 years
Maximum: 70
For women: being raised to 62 by 1 additional year every 2 years
until 2009.
36/37
20 minimum
60
All activity
Calculation aggregates age and length of service. Maximum age: 70.
Ireland Basic scheme
60 Maximum: 65 40 50 Final 12 months (including certain
supplemental remuneration)
Japan Basic scheme
65 Persons born prior to 1 April 1961 may retire early between 60 and
64
25 69.2% Salary + bonus, including non-monetary compensation
Netherlands Mandatory supplemental scheme
65
40 if less than 40 years)
70
55% Final annual salary received
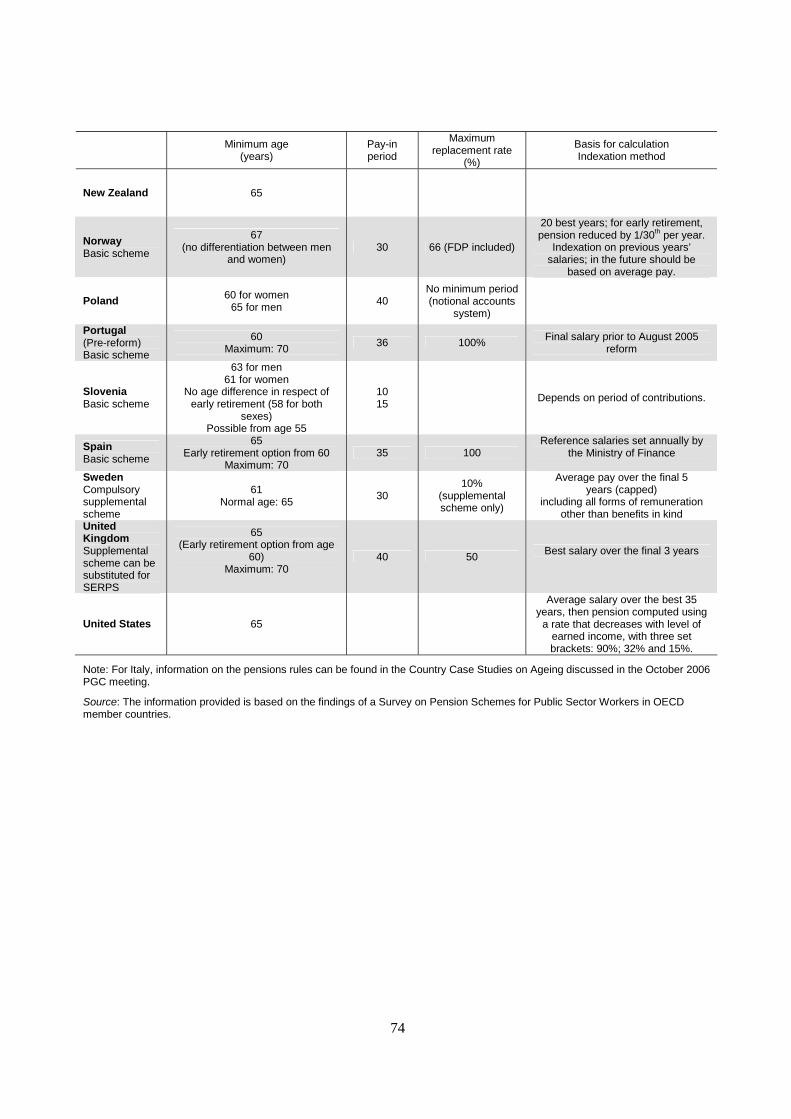
74
Minimum age (years)
Pay-in period
Maximum replacement rate
(%)
Basis for calculation Indexation method
New Zealand 65
Norway Basic scheme
67 (no differentiation between men
and women) 30 66 (FDP included)
20 best years; for early retirement, pension reduced by 1/30th per year.
Indexation on previous years’ salaries; in the future should be
based on average pay.
Poland 60 for women 65 for men 40
No minimum period (notional accounts
system)
Portugal (Pre-reform) Basic scheme
60 Maximum: 70 36 100% Final salary prior to August 2005
reform
Slovenia Basic scheme
63 for men 61 for women
No age difference in respect of early retirement (58 for both
sexes) Possible from age 55
10 15
Depends on period of contributions.
Spain Basic scheme
65 Early retirement option from 60
Maximum: 70 35 100
Reference salaries set annually by the Ministry of Finance
Sweden Compulsory supplemental scheme
61 Normal age: 65
30 10%
(supplemental scheme only)
Average pay over the final 5 years (capped)
including all forms of remuneration other than benefits in kind
United Kingdom Supplemental scheme can be substituted for SERPS
65 (Early retirement option from age
60) Maximum: 70
40 50 Best salary over the final 3 years
United States 65
Average salary over the best 35 years, then pension computed using
a rate that decreases with level of earned income, with three set brackets: 90%; 32% and 15%.
Note: For Italy, information on the pensions rules can be found in the Country Case Studies on Ageing discussed in the October 2006 PGC meeting.
Source: The information provided is based on the findings of a Survey on Pension Schemes for Public Sector Workers in OECD member countries.

75
76
I8. TYPES OF PUBLIC SECTOR PENSION SCHEMES
Key contacts: Elsa Pilichowski, Edouard Turkish, OECD GOV
Public sector pension schemes in OECD Member countries vary substantially. Public sector pensions are a significant component of total compensation, and so contribute to the attractiveness of the public sector as a career, particularly for technical specialists. The way in which pensions are structured has implications for the attraction of senior positions, both for external applicants and for existing staff seeking career advancement within the public sector. Pensions also constitute a significant and often unknown fiscal liability.
About this indicator:
There are contributory and non contributory pension schemes. A contributory pension scheme is the one in which scheme members are required to contribute to the scheme’s funds, usually by deduction of a percentage of their pay. This is contrasted with a non-contributory pension scheme, where the entire cost is borne by the employer. In a contributory pension scheme the employer normally also bears part of the cost.
Defined benefit schemes show a characteristically high level of interdependence between the generations, but also between the members and the employers. These latter, in general, bear the risks of managing the scheme and paying the benefits. Benefits are calculated on the basis of a reference salary based on a certain period of activity that varies according to the number of years of contributions and the category of the workers.
In defined contribution plans, pension rights are personalized, meaning that the pension received is based on the contributions paid throughout the person’s working life. The final salary is not considered. The amount of the final benefit depends on a number of factors such as the financial performance of the funds invested, the level of administrative and management costs, the capacity of the fund managers or even the efficiency of the control and supervisory organs, the amount paid in contributions, etc.
Highlights:
In the member countries of the OECD, the pension schemes in existence for employees, taking all sectors together, work by distribution or capitalization, either with defined benefits or defined contributions. The financial balance of the defined contribution schemes is sensitive, and is the product of various factors such as the number of active employees, the number of pensioners, the amount of the contributions or also of the pensions. Defined contribution schemes do not depend on intergenerational solidarity. They are based on the financial effort of the individual. Risks are generally either shared between the employer and the employee (Sweden), or it is the employee alone who bears the risk of receiving a low pension (Slovenia, France). The employer can also be alone in bearing the risk of bad management (Norway). Reserves can be built up to protect against future financial difficulties. They can be built in a particular institution either separate from the business (United Kingdom and Germany), or within the business itself, by constituting accounting reserves or taking out a policy with an insurance company (New Zealand). Defined contribution schemes are more commonly found in supplementary or "pension fund" schemes. Recent pension systems, such as the ones set up in Eastern European countries, have shown a tendency to choose defined contribution plans. The pension funds existing in nearly all the OECD countries operate in this way.
Further reading:
OECD (2005), “Public Sector Pension Schemes in OECD Member Countries: Preliminary Findings”, presented at the HRM Working Party, OECD Headquarters, Paris, 10-11 October 2005.
Aspects of government measured by the indicator: General government Activities
of: Central State Local Social security funds
Other public sector Private sector in the public domain
Production stage:
Revenues Inputs Public sector processes
Outputs and intermediate outcomes Final outcomes Antecedents or constraints
Functional sector:
General public services
Defence Public order & safety
Economic affairs
Environmental protection
Housing & community amenities
Health Recreation, culture and religion
Education Social protection
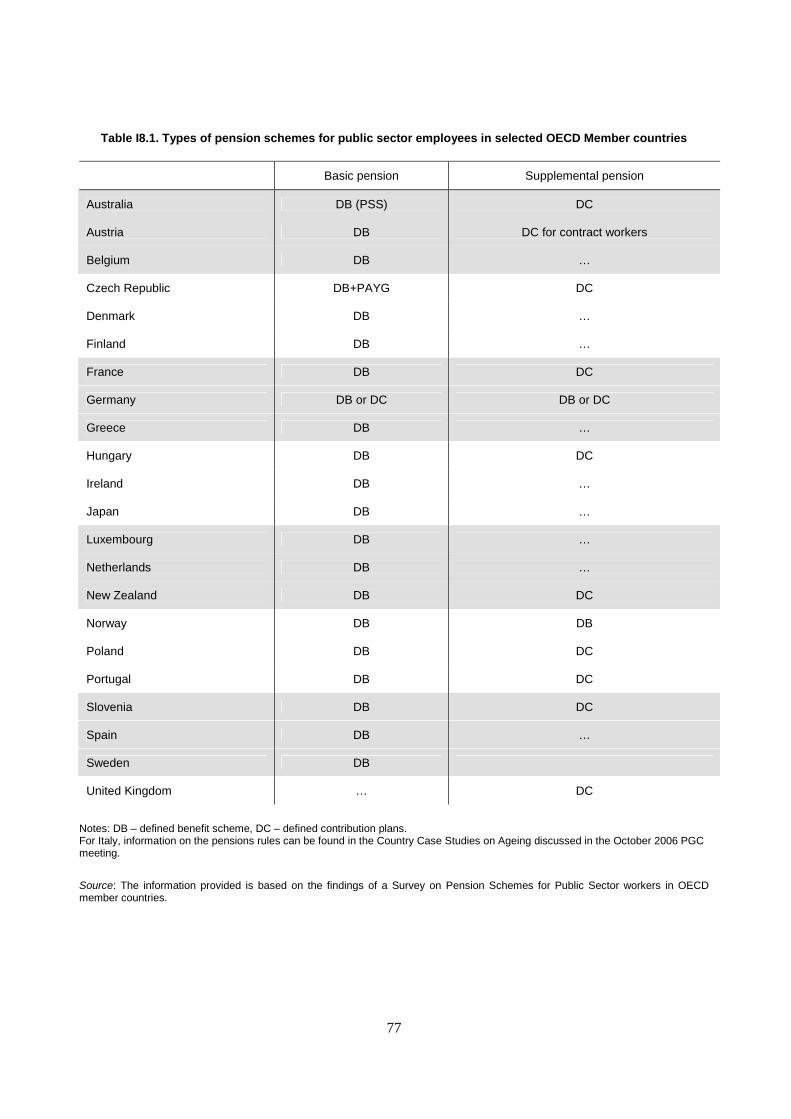
77
Table I8.1. Types of pension schemes for public sector employees in selected OECD Member countries
Basic pension Supplemental pension
Australia DB (PSS) DC
Austria DB DC for contract workers
Belgium DB …
Czech Republic DB+PAYG DC
Denmark DB …
Finland DB …
France DB DC
Germany DB or DC DB or DC
Greece DB …
Hungary DB DC
Ireland DB …
Japan DB …
Luxembourg DB …
Netherlands DB …
New Zealand DB DC
Norway DB DB
Poland DB DC
Portugal DB DC
Slovenia DB DC
Spain DB …
Sweden DB
United Kingdom … DC
Notes: DB – defined benefit scheme, DC – defined contribution plans. For Italy, information on the pensions rules can be found in the Country Case Studies on Ageing discussed in the October 2006 PGC meeting.
Source: The information provided is based on the findings of a Survey on Pension Schemes for Public Sector workers in OECD member countries.

78
P1. CREDIBILITY OF THE ECONOMIC ASSUMPTIONS
Key contact: Ian Hawkesworth, OECD GOV
Economic assumptions underpinning the budget gain credibility both by the technical expertise with which they are prepared, and by the degree to which there is expert and public review. The credibility of these assumptions is significant because variations can represent a major fiscal risk which should be identified and quantified where possible. The fiscal effects of variations in key assumptions underpinning the macroeconomic forecasts (e.g., the effect on the fiscal deficit of a 1 percent increase or decrease in GDP growth, inflation, interest rates, or the exchange rate from the central rate assumed in the budget forecast) can be very large.
About this indicator:
The economic assumptions used in the budget are generally undertaken in: • The Finance Ministry (Treasury) – either in the central budget authority (if indeed that is part of the Finance
Ministry, or elsewhere • The Economics Ministry • An independent body • In principle, the legislature could undertake this work. Review of the assumptions can be undertaken: • By an independent expert body • By making them widely available for scrutiny.
Highlights:
Unsurprisingly, the Ministry of Finance is generally responsible for the assumptions. More surprisingly, the majority of OECD countries have no arrangement for independent review – but they are almost universally available to the public and the legislature as part of the budget documentation.
Further reading: OECD (2002), Overview of Results-Focused Management and Budgeting in OECD Member Countries, OECD, Paris. OECD (2001), OECD Best Practices for Budget Transparency, OECD, Paris. Blondal, J.R. (2001), “Budget Reform in OECD Member Countries: Common Trends”, OECD Journal on Budgeting, Vol. 2, No. 4, OECD, Paris. OECD (2001), “Models of Public Budgeting and Accounting Reform”, OECD Journal on Budgeting, Vol. 2, supp. 1, OECD, Paris. OECD (1998), “Role of the legislature”, PUMA, OECD, Paris. Aspects of government measured by the indicator:
General government Activities of: Central State Local Social security funds
Other public sector Private sector in the public domain
Production stage:
Revenues Inputs Public sector processes
Outputs and intermediate outcomes Final outcomes Antecedents or constraints
Functional sector:
General public services
Defence Public order & safety
Economic affairs
Environmental protection
Housing & community amenities
Health Recreation, culture and religion
Education Social protection
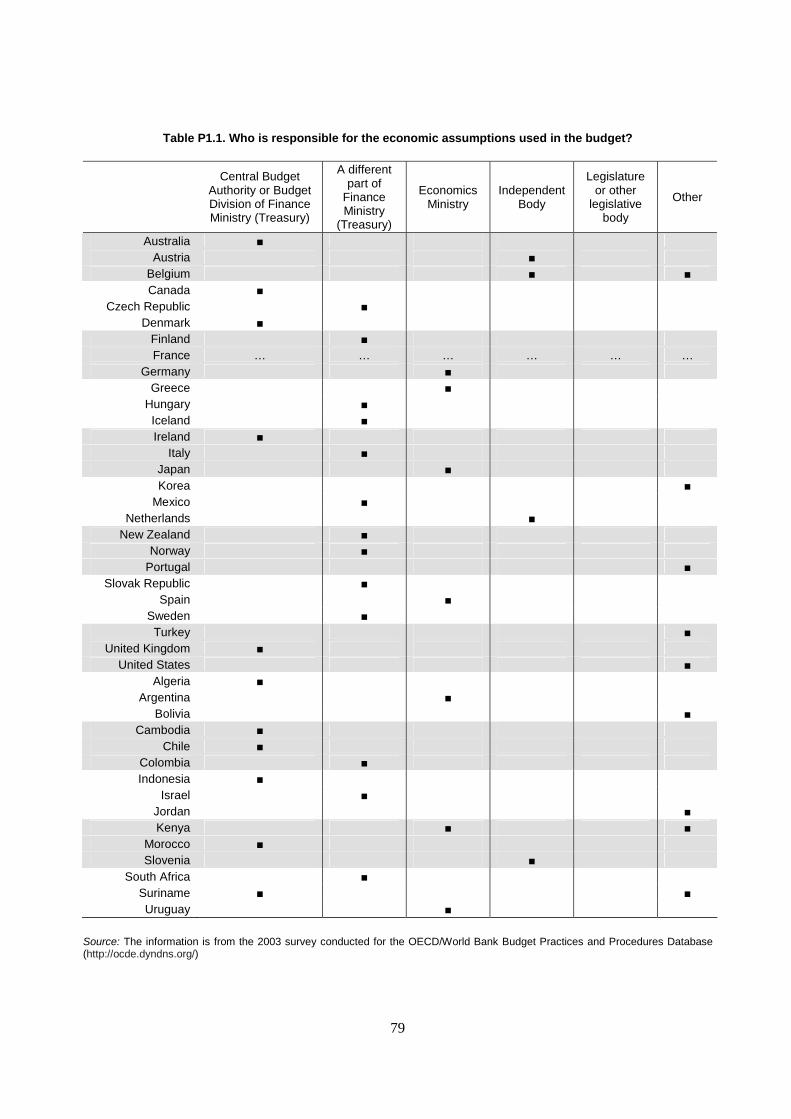
79
Table P1.1. Who is responsible for the economic assumptions used in the budget?
Central Budget Authority or Budget Division of Finance Ministry (Treasury)
A different part of
Finance Ministry
(Treasury)
Economics Ministry
Independent Body
Legislature or other
legislative body
Other
Australia ■ Austria ■
Belgium ■ ■ Canada ■
Czech Republic ■ Denmark ■
Finland ■ France … … … … … …
Germany ■ Greece ■
Hungary ■ Iceland ■ Ireland ■
Italy ■ Japan ■ Korea ■
Mexico ■ Netherlands ■
New Zealand ■ Norway ■
Portugal ■ Slovak Republic ■
Spain ■ Sweden ■
Turkey ■ United Kingdom ■
United States ■ Algeria ■
Argentina ■ Bolivia ■
Cambodia ■ Chile ■
Colombia ■ Indonesia ■
Israel ■ Jordan ■ Kenya ■ ■
Morocco ■ Slovenia ■
South Africa ■ Suriname ■ ■ Uruguay ■
Source: The information is from the 2003 survey conducted for the OECD/World Bank Budget Practices and Procedures Database (http://ocde.dyndns.org/)
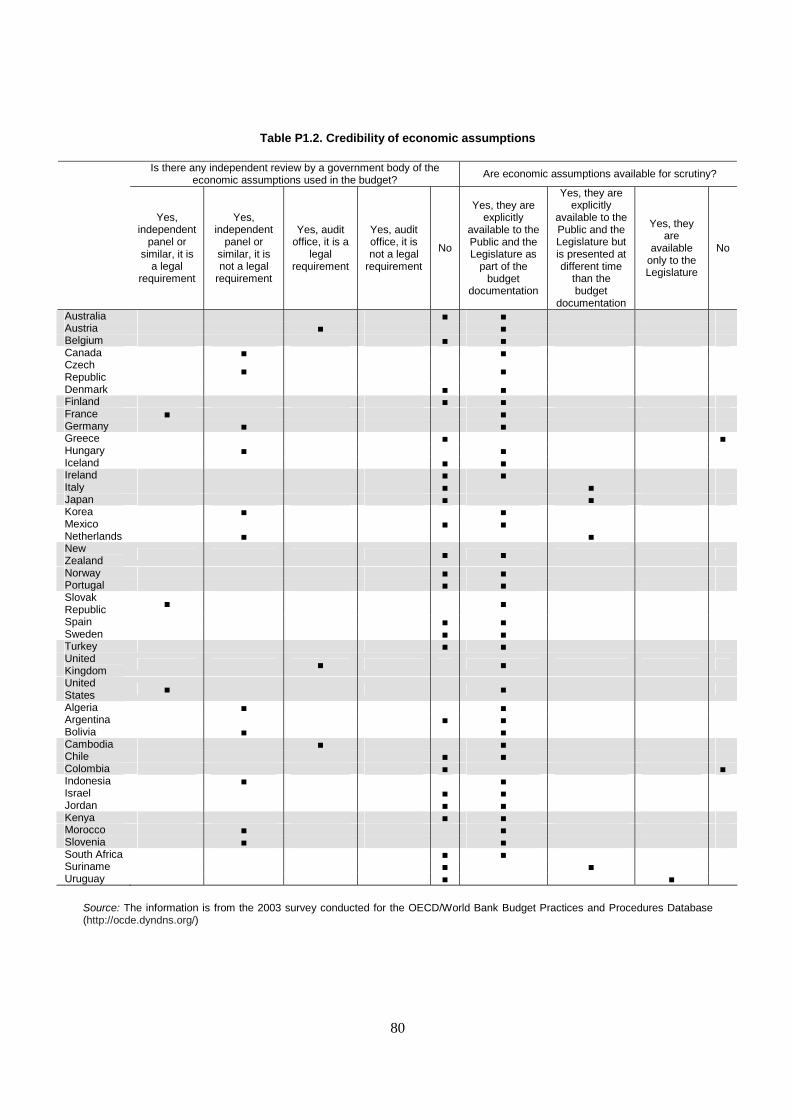
80
Table P1.2. Credibility of economic assumptions
Is there any independent review by a government body of the economic assumptions used in the budget?
Are economic assumptions available for scrutiny?
Yes, independent
panel or similar, it is
a legal requirement
Yes, independent
panel or similar, it is not a legal
requirement
Yes, audit office, it is a
legal requirement
Yes, audit office, it is not a legal
requirement
No
Yes, they are explicitly
available to the Public and the Legislature as
part of the budget
documentation
Yes, they are explicitly
available to the Public and the Legislature but is presented at different time
than the budget
documentation
Yes, they are
available only to the Legislature
No
Australia ■ ■ Austria ■ ■ Belgium ■ ■ Canada ■ ■ Czech Republic
■ ■
Denmark ■ ■ Finland ■ ■ France ■ ■ Germany ■ ■ Greece ■ ■ Hungary ■ ■ Iceland ■ ■ Ireland ■ ■ Italy ■ ■ Japan ■ ■ Korea ■ ■ Mexico ■ ■ Netherlands ■ ■ New Zealand
■ ■
Norway ■ ■ Portugal ■ ■ Slovak Republic
■ ■
Spain ■ ■ Sweden ■ ■ Turkey ■ ■ United Kingdom
■ ■
United States
■ ■
Algeria ■ ■ Argentina ■ ■ Bolivia ■ ■ Cambodia ■ ■ Chile ■ ■ Colombia ■ ■ Indonesia ■ ■ Israel ■ ■ Jordan ■ ■ Kenya ■ ■ Morocco ■ ■ Slovenia ■ ■ South Africa ■ ■ Suriname ■ ■ Uruguay ■ ■
Source: The information is from the 2003 survey conducted for the OECD/World Bank Budget Practices and Procedures Database (http://ocde.dyndns.org/)


82
P2. MEDIUM TERM FISCAL FRAMEWORK
Key contact: Ian Hawkesworth, OECD GOV
A Medium Term Fiscal Framework (MTEF) is an arrangement in which annual budget decisions are made in terms of aggregate or sectoral limits on expenditures for each of the next three to five years. Australia led the way in the MTEF movement during the 1980s by expanding its forward estimates into multi-year targets that rapidly gained standing as the basis on which spending departments bid for resources and the annual budget is compiled. The key objective of the MTEF is to extend the budget’s horizon beyond a single fiscal year. Doing so depends on reliable projections of macroeconomic conditions, future revenue and spending if current policies were continued, and the impact of policy changes on future budgets. The conventional method for making these projections is to construct a baseline budget and to measure policy changes against the baseline. In the MTEF, the baseline is used both to establish the fiscal framework and to determine whether expenditure changes are consistent with the framework. Inasmuch as future conditions are not yet known, the baseline and estimates of policy change are grounded on assumptions concerning economic performance, the behavioural responses of persons affected by policy changes and other variables. Countries which use baselines to establish and enforce expenditure frameworks should have rules for how the projections are made and how policy changes are measured as well as procedures for dealing with deviations from the baseline. They should also assign responsibility for maintaining the baseline and assuring that policy changes are accurately measured against it.
About this indicator:
The key dimensions of a MTEF providing targets or ceilings for expenditures concern whether or not it states targets/ceilings for each budget year or just for the medium term, and how many years the medium-term fiscal framework covers. Highlights:
Most OECD countries have an MTEF in place, with targets stated for each year. Most frameworks cover 3-5 years.
Further reading: OECD (2002), Overview of Results-Focused Management and Budgeting in OECD Member Countries, OECD, Paris. OECD (2001), OECD Best Practices for Budget Transparency, OECD, Paris. Blondal, J.R. (2001), “Budget Reform in OECD Member Countries: Common Trends”, OECD Journal on Budgeting, Vol. 2, No. 4, OECD, Paris. OECD (2001), “Models of Public Budgeting and Accounting Reform”, OECD Journal on Budgeting, Vol. 2, No. 1, OECD, Paris. OECD (1998), Role of the Legislature, PUMA, OECD, Paris. Aspects of government measured by the indicator:
General government Activities of: Central State Local Social security funds
Other public sector Private sector in the public domain
Production stage:
Revenues Inputs Public sector processes
Outputs and intermediate outcomes Final outcomes Antecedents or constraints
Functional sector:
General public services
Defence Public order & safety
Economic affairs
Environmental protection
Housing & community amenities
Health Recreation, culture and religion
Education Social protection
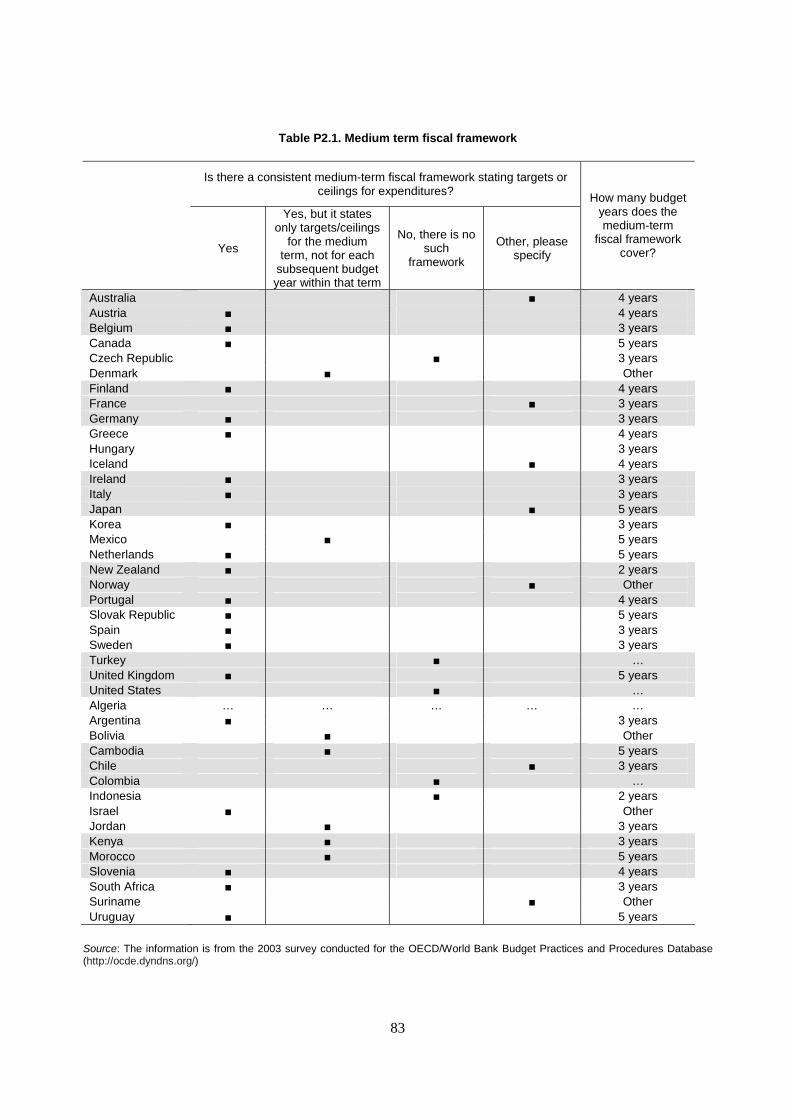
83
Table P2.1. Medium term fiscal framework
Is there a consistent medium-term fiscal framework stating targets or ceilings for expenditures?
Yes
Yes, but it states only targets/ceilings
for the medium term, not for each
subsequent budget year within that term
No, there is no such
framework
Other, please specify
How many budget years does the medium-term
fiscal framework cover?
Australia ■ 4 years Austria ■ 4 years Belgium ■ 3 years Canada ■ 5 years Czech Republic ■ 3 years Denmark ■ Other Finland ■ 4 years France ■ 3 years Germany ■ 3 years Greece ■ 4 years Hungary 3 years Iceland ■ 4 years Ireland ■ 3 years Italy ■ 3 years Japan ■ 5 years Korea ■ 3 years Mexico ■ 5 years Netherlands ■ 5 years New Zealand ■ 2 years Norway ■ Other Portugal ■ 4 years Slovak Republic ■ 5 years Spain ■ 3 years Sweden ■ 3 years Turkey ■ … United Kingdom ■ 5 years United States ■ … Algeria … … … … … Argentina ■ 3 years Bolivia ■ Other Cambodia ■ 5 years Chile ■ 3 years Colombia ■ … Indonesia ■ 2 years Israel ■ Other Jordan ■ 3 years Kenya ■ 3 years Morocco ■ 5 years Slovenia ■ 4 years South Africa ■ 3 years Suriname ■ Other Uruguay ■ 5 years
Source: The information is from the 2003 survey conducted for the OECD/World Bank Budget Practices and Procedures Database (http://ocde.dyndns.org/)

84
P3. RESOLVING DISPUTES BETWEEN MINISTRIES AND THE CENTRAL BUDGET AUTHORITY
Key contact: Ian Hawkesworth, OECD GOV
The arrangements for resolving disputes between ministries and the central budget authority are significant as they contribute to the strength (or otherwise) of the budget authority in managing the fiscal aggregates, and can lead to delays in budget formulation. In the end the Prime Minister or President formally has the last word. This does not mean however that this is what generally happens.
About this indicator:
Who has the last word? Disputes between Ministries and the central budget authority can be resolved in various ways: • The Minister of Finance can make a final decisions • The issues can be resolved by the head of government • The issue can be referred to a full meeting of the government/cabinet – or a ministerial committee.
Highlights:
The results of the survey show the distinctively strong role of the Minister of Finance (Chancellor) in the UK, and the role of the head of government in Canada, France, Italy, Korea, Mexico, Spain, Sweden, Turkey and the United States. Cabinet remains an important decision-making body in Australia, Austria, Belgium, Czech Republic, Finland, Germany, Hungary, Ireland, Netherlands, New Zealand, and Norway. Further reading: OECD (2002), Overview of Results-Focused Management and Budgeting in OECD Member Countries, OECD, Paris. OECD (2001), OECD Best Practices for Budget Transparency, OECD,Paris. Blondal, J.R. (2001), “Budget Reform in OECD Member Countries: Common Trends”, OECD Journal on Budgeting, Vol. 2, No. 4, OECD, Paris. OECD (2001), Models of Public Budgeting and Accounting Reform, OECD Journal on Budgeting, Vol. 2, supp. 1, OECD, Paris. OECD (1998), Role of the Legislature, PUMA, OECD, Paris. Aspects of government measured by the indicator:
General government Activities of: Central State Local Social security funds
Other public sector Private sector in the public domain
Production stage:
Revenues Inputs Public sector processes
Outputs and intermediate outcomes Final outcomes Antecedents or constraints
Functional sector:
General public services
Defence Public order & safety
Economic affairs
Environmental protection
Housing & community amenities
Health Recreation, culture and religion
Education Social protection
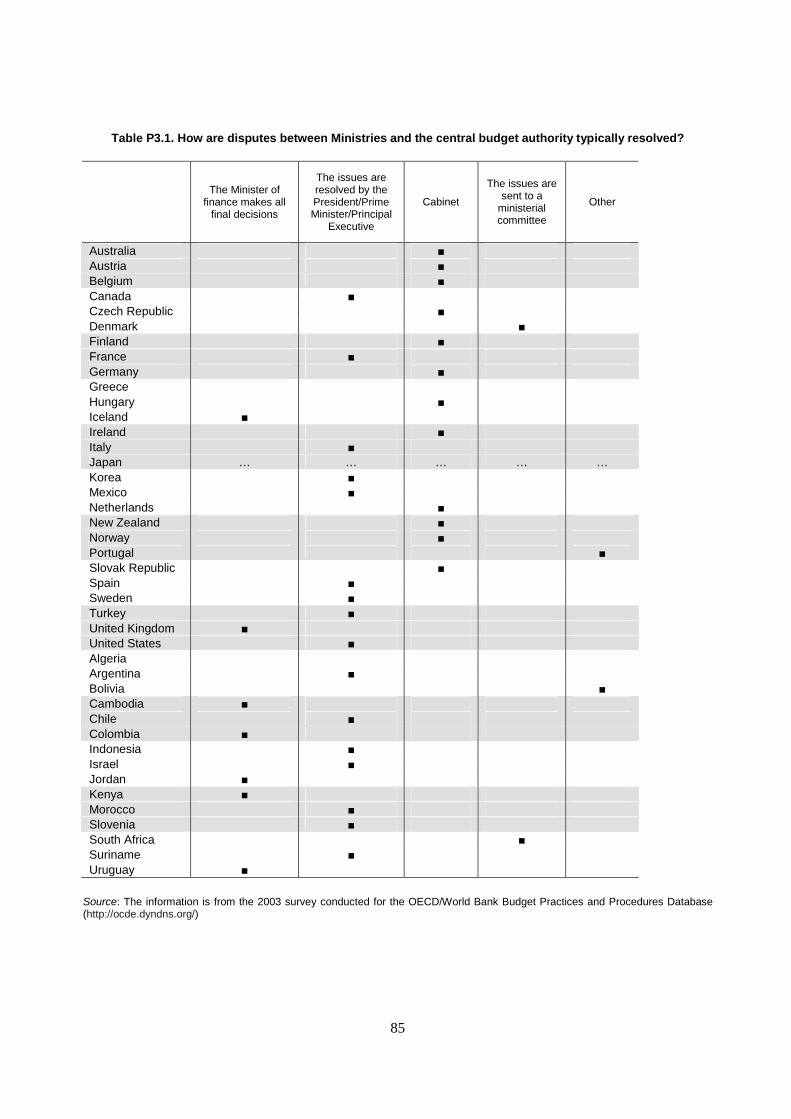
85
Table P3.1. How are disputes between Ministries and the central budget authority typically resolved?
The Minister of
finance makes all final decisions
The issues are resolved by the President/Prime Minister/Principal
Executive
Cabinet
The issues are sent to a
ministerial committee
Other
Australia ■ Austria ■ Belgium ■ Canada ■ Czech Republic ■ Denmark ■ Finland ■ France ■ Germany ■ Greece Hungary ■ Iceland ■ Ireland ■ Italy ■ Japan … … … … … Korea ■ Mexico ■ Netherlands ■ New Zealand ■ Norway ■ Portugal ■ Slovak Republic ■ Spain ■ Sweden ■ Turkey ■ United Kingdom ■ United States ■ Algeria Argentina ■ Bolivia ■ Cambodia ■ Chile ■ Colombia ■ Indonesia ■ Israel ■ Jordan ■ Kenya ■ Morocco ■ Slovenia ■ South Africa ■ Suriname ■ Uruguay ■
Source: The information is from the 2003 survey conducted for the OECD/World Bank Budget Practices and Procedures Database (http://ocde.dyndns.org/)

86
P4. ROLE OF THE LEGISLATURE
Key contact: Ian Hawkesworth, OECD GOV
The power of the purse is one of parliament’s fundamental attributes. But it can be constrained in several dimensions. It can be constrained by a previous commitment that the parliament has made (such as the Maastricht Treaty), and constitutionally by the nature of the amendments that are possible. The latter include constitutional requirements that any increases in expenditures must be off-set by an equal and opposite reduction; that it cannot increase overall spending or the deficit; or that it cannot increase spending or deficit above a certain limit. Where it does not have the power to amend, it can place pressure on the executive by delaying the passing of the budget - even if this might force a shutdown in the executive. However, it must also balance this against the possibility that rejecting the budget proposal can result in dissolution of the legislature.
About this indicator:
This indicator opens up questions concerning • The existence of restrictions on the right of the legislature to modify the detailed budget proposed by the
executive • Whether a vote on the budget is considered a vote of confidence in the government and therefore the
government would resign if any changes are approved to its budget proposal?
Highlights:
The results of the survey show four groups of countries. In some the legislature faces no restrictions on its right to amend the proposals (Austria, Czech Republic, Finland, Germany, Hungary, Iceland, Italy, Netherlands, Norway, Portugal, Sweden, and United States). In others there are also no restrictions but amending the budget proposals would be a vote of confidence on the government (Belgium, Denmark). In a third group there are restrictions without risks of resigning (Australia, France, Ireland, Korea, Mexico, Slovak Republic, Spain, and Turkey). In the final group, legislatures are both restricted and face some risks of government resigning (Canada, Greece, and New Zealand).
Further reading:
OECD (2002), Overview of Results-Focused Management and Budgeting in OECD Member Countries, OECD, Paris. OECD (2001), OECD Best Practices for Budget Transparency, OECD, Paris. Blondal, J.R. (2001), “Budget Reform in OECD Member Countries: Common Trends”, OECD Journal on Budgeting, Vol. 2, No. 4, OECD, Paris. OECD (2001), “Models of Public Budgeting and Accounting Reform”, OECD Journal on Budgeting, Vol. 2, supp. 1, OECD, Paris. OECD (1998), Role of the Legislature, PUMA, OECD, Paris. Aspects of government measured by the indicator:
General government Activities of: Central State Local Social security funds
Other public sector Private sector in the public domain
Production stage:
Revenues Inputs Public sector processes
Outputs and intermediate outcomes Final outcomes Antecedents or constraints
Functional sector:
General public services
Defence Public order & safety
Economic affairs
Environmental protection
Housing & community amenities
Health Recreation, culture and religion
Education Social protection
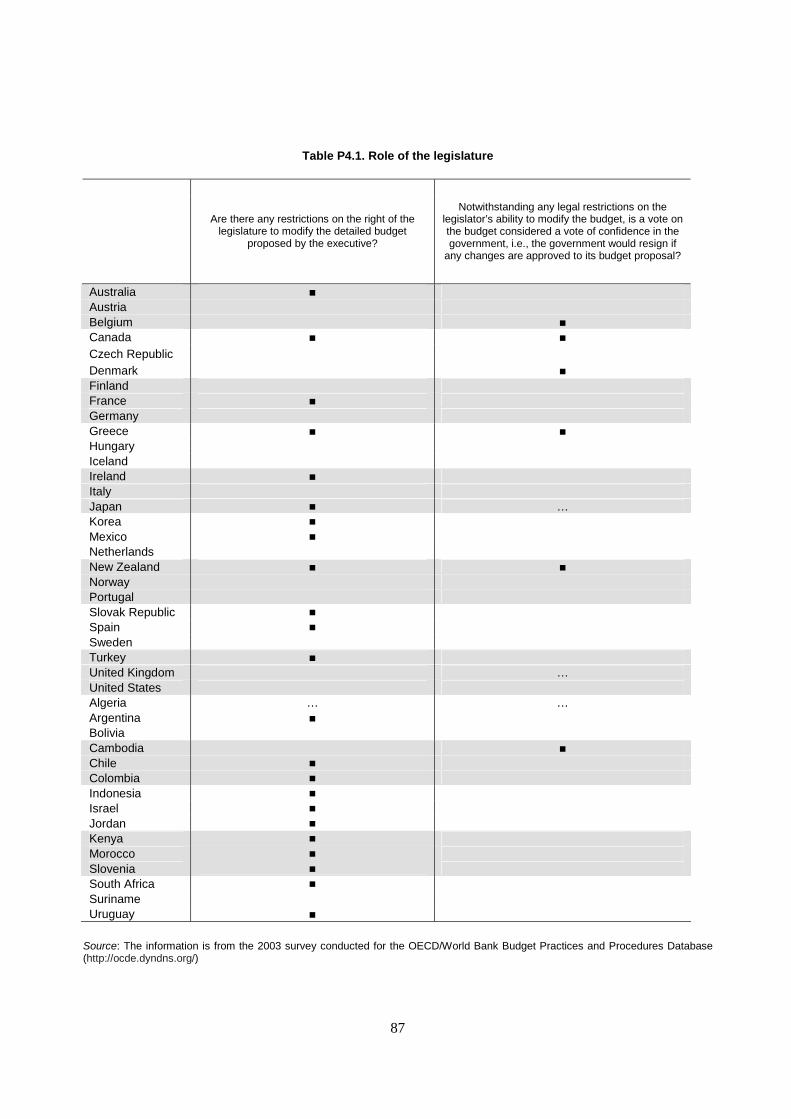
87
Table P4.1. Role of the legislature
Are there any restrictions on the right of the
legislature to modify the detailed budget proposed by the executive?
Notwithstanding any legal restrictions on the legislator’s ability to modify the budget, is a vote on the budget considered a vote of confidence in the government, i.e., the government would resign if
any changes are approved to its budget proposal?
Australia ■ Austria Belgium ■ Canada ■ ■ Czech Republic Denmark ■ Finland France ■ Germany Greece ■ ■ Hungary Iceland Ireland ■ Italy Japan ■ … Korea ■ Mexico ■ Netherlands New Zealand ■ ■ Norway Portugal Slovak Republic ■ Spain ■ Sweden Turkey ■ United Kingdom … United States Algeria … … Argentina ■ Bolivia Cambodia ■ Chile ■ Colombia ■ Indonesia ■ Israel ■ Jordan ■ Kenya ■ Morocco ■ Slovenia ■ South Africa ■ Suriname Uruguay ■
Source: The information is from the 2003 survey conducted for the OECD/World Bank Budget Practices and Procedures Database (http://ocde.dyndns.org/)

88
P5. AGENCY FLEXIBILITY IN BUDGET EXECUTION
Key contact: Ian Hawkesworth, OECD GOV
The nature of budget appropriations has changed in recent years. The traditional budget which leaves agencies with limited flexibility in budget execution due to highly detailed appropriations is giving way to arrangements in which Ministers and ministries have greater budgetary flexibility to re-allocate expenditure within the overall agency appropriation - but also within a hard budget constraint. It is widely held that this budget devolution or flexibility to and within spending ministries may increase efficiency.
About this indicator:
Government organisations can face various constraints on their ability to transfer funds between operating expenditures, investments and programme funds: • They may have to require the approval of the Ministry of Finance/Central Budget Authority • They may have to require the approval of the legislature • They may have to notify legislature of the transfer • There can be no such transfers
Highlights:
The survey results highlight the power of the central budget authority in some countries (Austria, Belgium, Czech Republic, France, Germany, Ireland, Netherlands, Slovak Republic, Turkey, United Kingdom) and the very tight restrictions on such transfers in others (Finland, Greece, Iceland, Italy, Spain).
Further reading:
OECD (2002), Overview of Results-Focused Management and Budgeting in OECD Member Countries, OECD, Paris. OECD (2001), OECD Best Practices for Budget Transparency, OECD, Paris. Blondal, J.R. (2001), “Budget Reform in OECD Member Countries: Common Trends”, OECD Journal on Budgeting, Vol. 2, No. 4, OECD, Paris. OECD (2001), “Models of Public Budgeting and Accounting Reform”, OECD Journal on Budgeting, Vol. 2, supp. 1, OECD, Paris. OECD (1998), Role of the Legislature, PUMA, OECD, Paris.
Aspects of government measured by the indicator:
General government Activities of: Central State Local Social security funds
Other public sector Private sector in the public domain
Production stage:
Revenues Inputs Public sector processes
Outputs and intermediate outcomes Final outcomes Antecedents or constraints
Functional sector:
General public services
Defence Public order & safety
Economic affairs
Environmental protection
Housing & community amenities
Health Recreation, culture and religion
Education Social protection
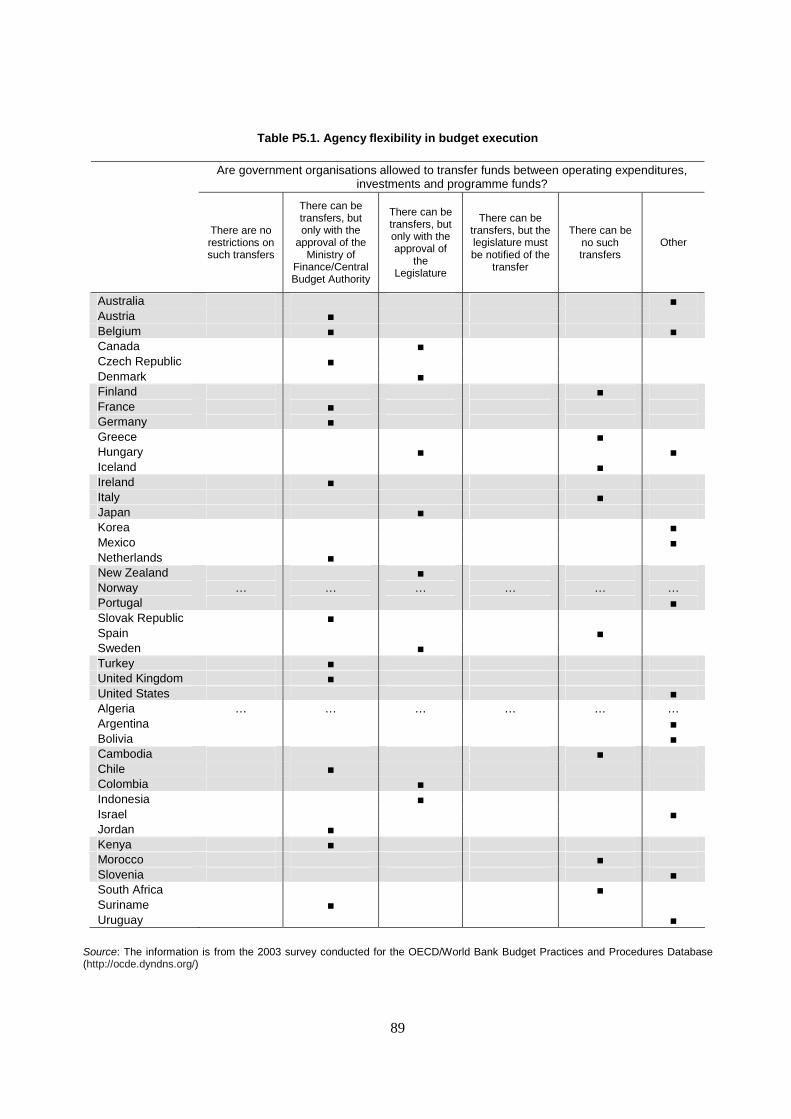
89
Table P5.1. Agency flexibility in budget execution
Source: The information is from the 2003 survey conducted for the OECD/World Bank Budget Practices and Procedures Database (http://ocde.dyndns.org/)
Are government organisations allowed to transfer funds between operating expenditures, investments and programme funds?
There are no restrictions on such transfers
There can be transfers, but only with the
approval of the Ministry of
Finance/Central Budget Authority
There can be transfers, but only with the approval of
the Legislature
There can be transfers, but the legislature must be notified of the
transfer
There can be no such transfers
Other
Australia ■ Austria ■ Belgium ■ ■ Canada ■ Czech Republic ■ Denmark ■ Finland ■ France ■ Germany ■ Greece ■ Hungary ■ ■ Iceland ■ Ireland ■ Italy ■ Japan ■ Korea ■ Mexico ■ Netherlands ■ New Zealand ■ Norway … … … … … … Portugal ■ Slovak Republic ■ Spain ■ Sweden ■ Turkey ■ United Kingdom ■ United States ■ Algeria … … … … … … Argentina ■ Bolivia ■ Cambodia ■ Chile ■ Colombia ■ Indonesia ■ Israel ■ Jordan ■ Kenya ■ Morocco ■ Slovenia ■ South Africa ■ Suriname ■ Uruguay ■

90
P6. SCOPE AND FOCUS OF AUDIT
Key contact: Ian Hawkesworth, OECD GOV
All public spending should be subjected to independent scrutiny. It is generally accepted that a national audit body or equivalent organization, which is independent of the executive, should provide timely reports for the legislature and public on the financial integrity of government accounts.
About this indicator:
Assuming the existence of a central Supreme or National Audit Office, the indicator asks whether it reports to: • the executive • the legislature • the judiciary branch • individual Ministries.
It also identifies how audit subjects are generally determined: • by request of the legislature • within the Supreme or National Audit Office • by request from the executive • by request from the public or other civil society actor
Highlights:
The survey results highlight that the overwhelming majority of Supreme or National Audit Offices report to the legislature, and that they derive most of their work programmes internally.
Further reading:
OECD (2002), Overview of Results-Focused Management and Budgeting in OECD Member Countries, OECD, Paris. OECD (2001), OECD Best Practices for Budget Transparency, OECD, Paris. Blondal, J.R. (2001), “Budget Reform in OECD Member Countries: Common Trends”, OECD Journal on Budgeting, Vol. 2, No. 4, OECD, Paris. OECD (2001), “Models of Public Budgeting and Accounting Reform”, OECD Journal on Budgeting, Vol. 2, supp. 1, OECD, Paris. OECD (1998), Role of the Legislature, PUMA, OECD, Paris.
Aspects of government measured by the indicator:
General government Activities of: Central State Local Social security funds
Other public sector Private sector in the public domain
Production stage:
Revenues Inputs Public sector processes
Outputs and intermediate outcomes Final outcomes Antecedents or constraints
Functional sector:
General public services
Defence Public order & safety
Economic affairs
Environmental protection
Housing & community amenities
Health Recreation, culture and religion
Education Social protection
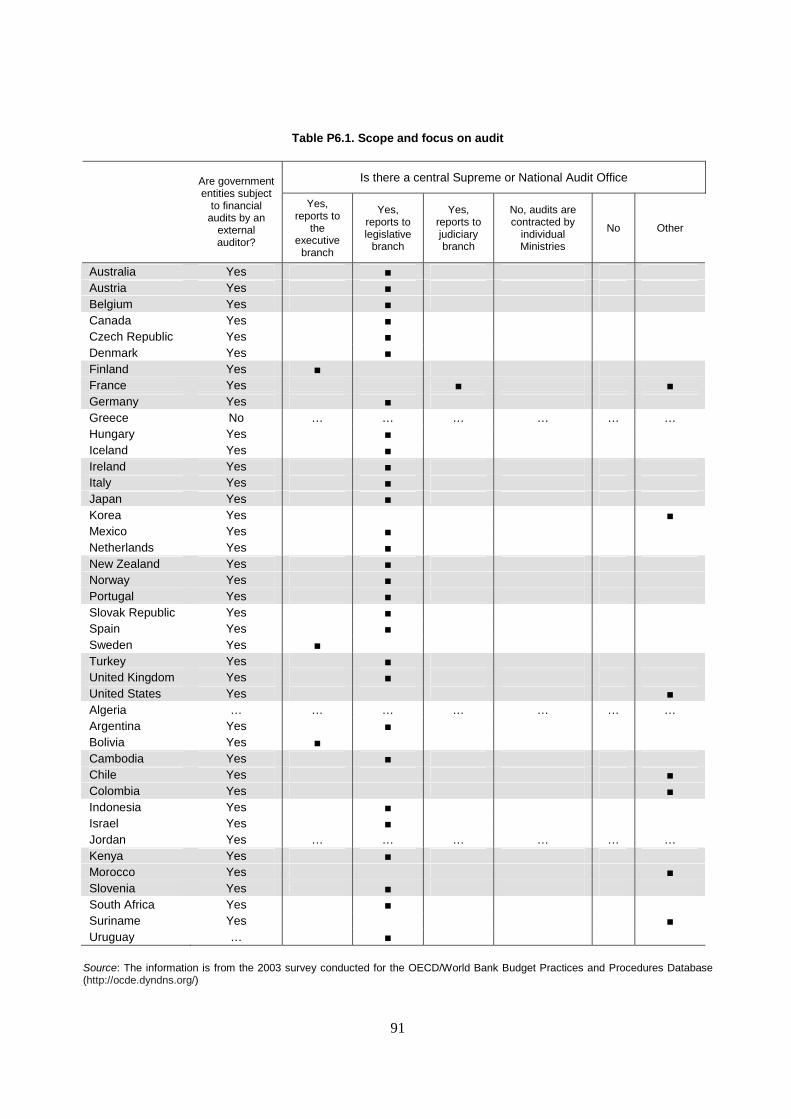
91
Table P6.1. Scope and focus on audit
Is there a central Supreme or National Audit Office
Are government entities subject
to financial audits by an
external auditor?
Yes, reports to
the executive
branch
Yes, reports to legislative
branch
Yes, reports to judiciary branch
No, audits are contracted by
individual Ministries
No Other
Australia Yes ■ Austria Yes ■ Belgium Yes ■ Canada Yes ■ Czech Republic Yes ■ Denmark Yes ■ Finland Yes ■ France Yes ■ ■ Germany Yes ■ Greece No … … … … … … Hungary Yes ■ Iceland Yes ■ Ireland Yes ■ Italy Yes ■ Japan Yes ■ Korea Yes ■ Mexico Yes ■ Netherlands Yes ■ New Zealand Yes ■ Norway Yes ■ Portugal Yes ■ Slovak Republic Yes ■ Spain Yes ■ Sweden Yes ■ Turkey Yes ■ United Kingdom Yes ■ United States Yes ■ Algeria … … … … … … … Argentina Yes ■ Bolivia Yes ■ Cambodia Yes ■ Chile Yes ■ Colombia Yes ■ Indonesia Yes ■ Israel Yes ■ Jordan Yes … … … … … … Kenya Yes ■ Morocco Yes ■ Slovenia Yes ■ South Africa Yes ■ Suriname Yes ■ Uruguay … ■
Source: The information is from the 2003 survey conducted for the OECD/World Bank Budget Practices and Procedures Database (http://ocde.dyndns.org/)
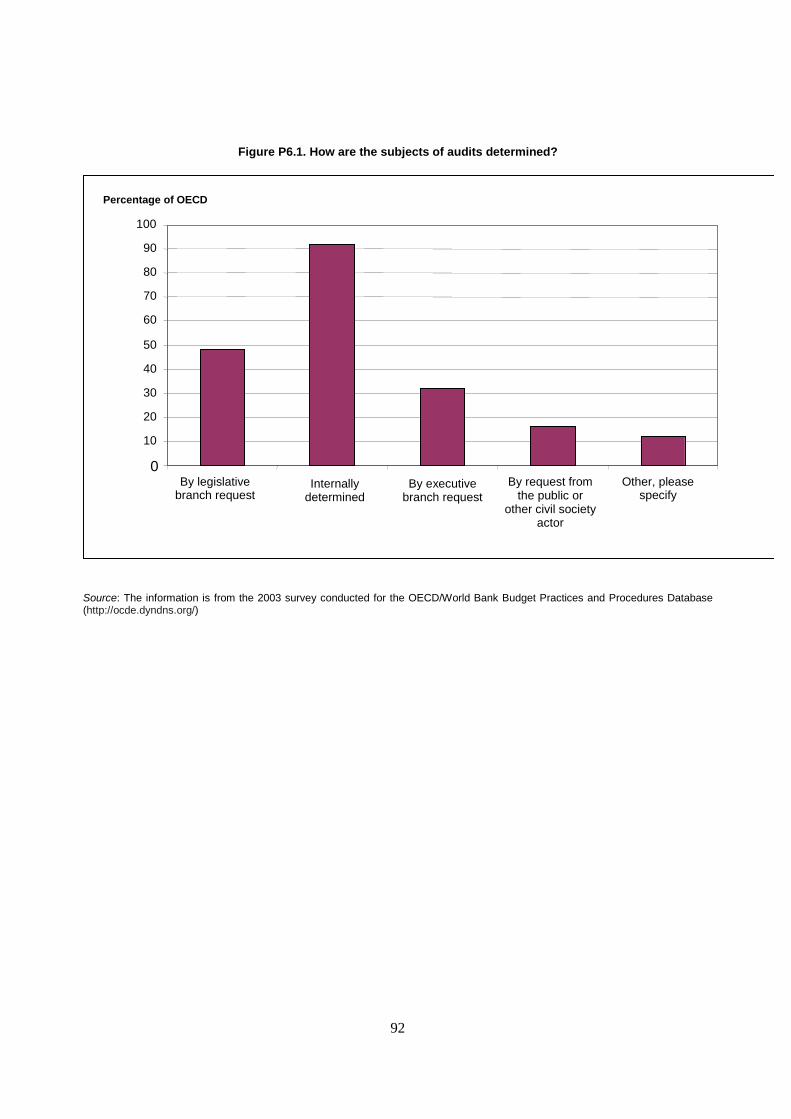
92
Figure P6.1. How are the subjects of audits determined?
Source: The information is from the 2003 survey conducted for the OECD/World Bank Budget Practices and Procedures Database (http://ocde.dyndns.org/)
0
10
20
30
40
50
60
70
80
90
100
By legislative branch request
Internally determined
By executive branch request
By request from the public or
other civil society actor
Other, please specify
Percentage of OECD

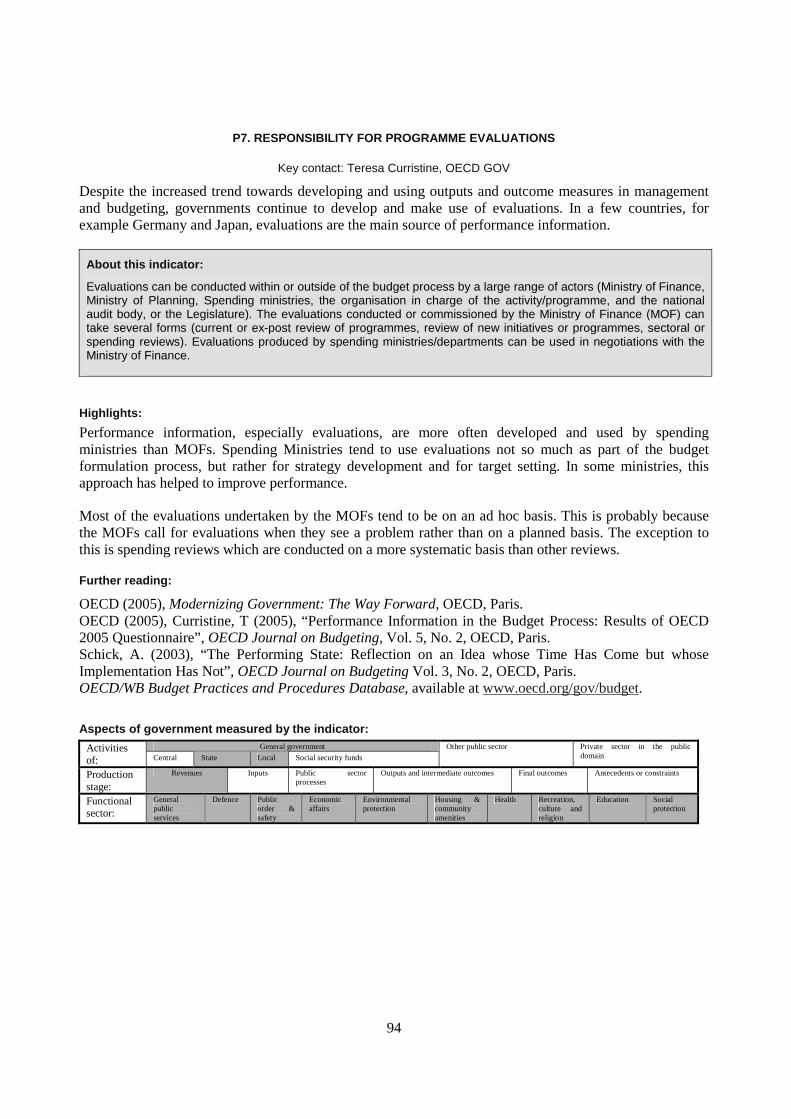
94
P7. RESPONSIBILITY FOR PROGRAMME EVALUATIONS
Key contact: Teresa Curristine, OECD GOV
Despite the increased trend towards developing and using outputs and outcome measures in management and budgeting, governments continue to develop and make use of evaluations. In a few countries, for example Germany and Japan, evaluations are the main source of performance information.
About this indicator:
Evaluations can be conducted within or outside of the budget process by a large range of actors (Ministry of Finance, Ministry of Planning, Spending ministries, the organisation in charge of the activity/programme, and the national audit body, or the Legislature). The evaluations conducted or commissioned by the Ministry of Finance (MOF) can take several forms (current or ex-post review of programmes, review of new initiatives or programmes, sectoral or spending reviews). Evaluations produced by spending ministries/departments can be used in negotiations with the Ministry of Finance.
Highlights:
Performance information, especially evaluations, are more often developed and used by spending ministries than MOFs. Spending Ministries tend to use evaluations not so much as part of the budget formulation process, but rather for strategy development and for target setting. In some ministries, this approach has helped to improve performance.
Most of the evaluations undertaken by the MOFs tend to be on an ad hoc basis. This is probably because the MOFs call for evaluations when they see a problem rather than on a planned basis. The exception to this is spending reviews which are conducted on a more systematic basis than other reviews.
Further reading:
OECD (2005), Modernizing Government: The Way Forward, OECD, Paris. OECD (2005), Curristine, T (2005), “Performance Information in the Budget Process: Results of OECD 2005 Questionnaire”, OECD Journal on Budgeting, Vol. 5, No. 2, OECD, Paris. Schick, A. (2003), “The Performing State: Reflection on an Idea whose Time Has Come but whose Implementation Has Not”, OECD Journal on Budgeting Vol. 3, No. 2, OECD, Paris. OECD/WB Budget Practices and Procedures Database, available at www.oecd.org/gov/budget.
Aspects of government measured by the indicator:
General government Activities of: Central State Local Social security funds
Other public sector Private sector in the public domain
Production stage:
Revenues Inputs Public sector processes
Outputs and intermediate outcomes Final outcomes Antecedents or constraints
Functional sector:
General public services
Defence Public order & safety
Economic affairs
Environmental protection
Housing & community amenities
Health Recreation, culture and religion
Education Social protection
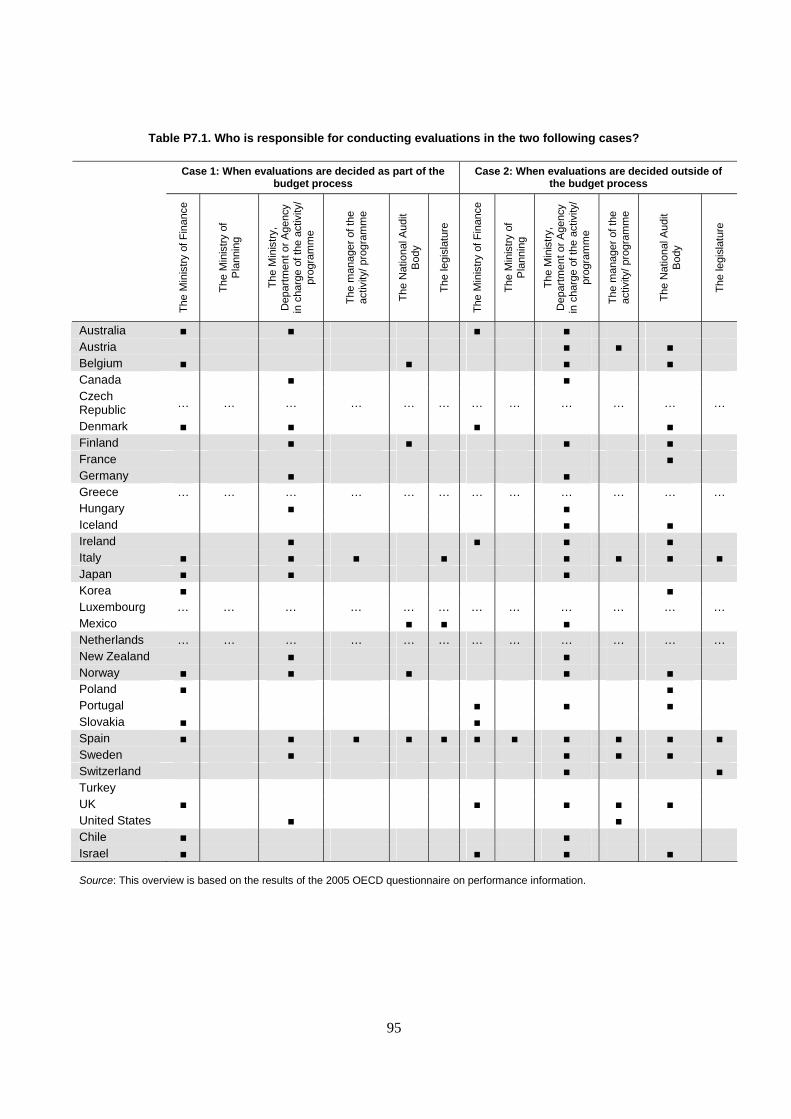
95
Table P7.1. Who is responsible for conducting evaluations in the two following cases?
Case 1: When evaluations are decided as part of the budget process
Case 2: When evaluations are decided outside of the budget process
The
Min
istr
y of
Fin
ance
The
Min
istr
y of
P
lann
ing
The
Min
istr
y,
Dep
artm
ent o
r A
genc
y in
cha
rge
of th
e ac
tivity
/ pr
ogra
mm
e
The
man
ager
of t
he
activ
ity/ p
rogr
amm
e
The
Nat
iona
l Aud
it B
ody
The
legi
slat
ure
The
Min
istr
y of
Fin
ance
The
Min
istr
y of
P
lann
ing
The
Min
istr
y,
Dep
artm
ent o
r A
genc
y in
cha
rge
of th
e ac
tivity
/ pr
ogra
mm
e
The
man
ager
of t
he
activ
ity/ p
rogr
amm
e
The
Nat
iona
l Aud
it B
ody
The
legi
slat
ure
Australia ■ ■ ■ ■ Austria ■ ■ ■ Belgium ■ ■ ■ ■ Canada ■ ■ Czech Republic … … … … … … … … … … … …
Denmark ■ ■ ■ ■ Finland ■ ■ ■ ■ France ■ Germany ■ ■ Greece … … … … … … … … … … … … Hungary ■ ■ Iceland ■ ■ Ireland ■ ■ ■ ■ Italy ■ ■ ■ ■ ■ ■ ■ ■ Japan ■ ■ ■ Korea ■ ■ Luxembourg … … … … … … … … … … … … Mexico ■ ■ ■ Netherlands … … … … … … … … … … … … New Zealand ■ ■ Norway ■ ■ ■ ■ ■ Poland ■ ■ Portugal ■ ■ ■ Slovakia ■ ■ Spain ■ ■ ■ ■ ■ ■ ■ ■ ■ ■ ■ Sweden ■ ■ ■ ■ Switzerland ■ ■ Turkey UK ■ ■ ■ ■ ■ United States ■ ■ Chile ■ ■ Israel ■ ■ ■ ■
Source: This overview is based on the results of the 2005 OECD questionnaire on performance information.
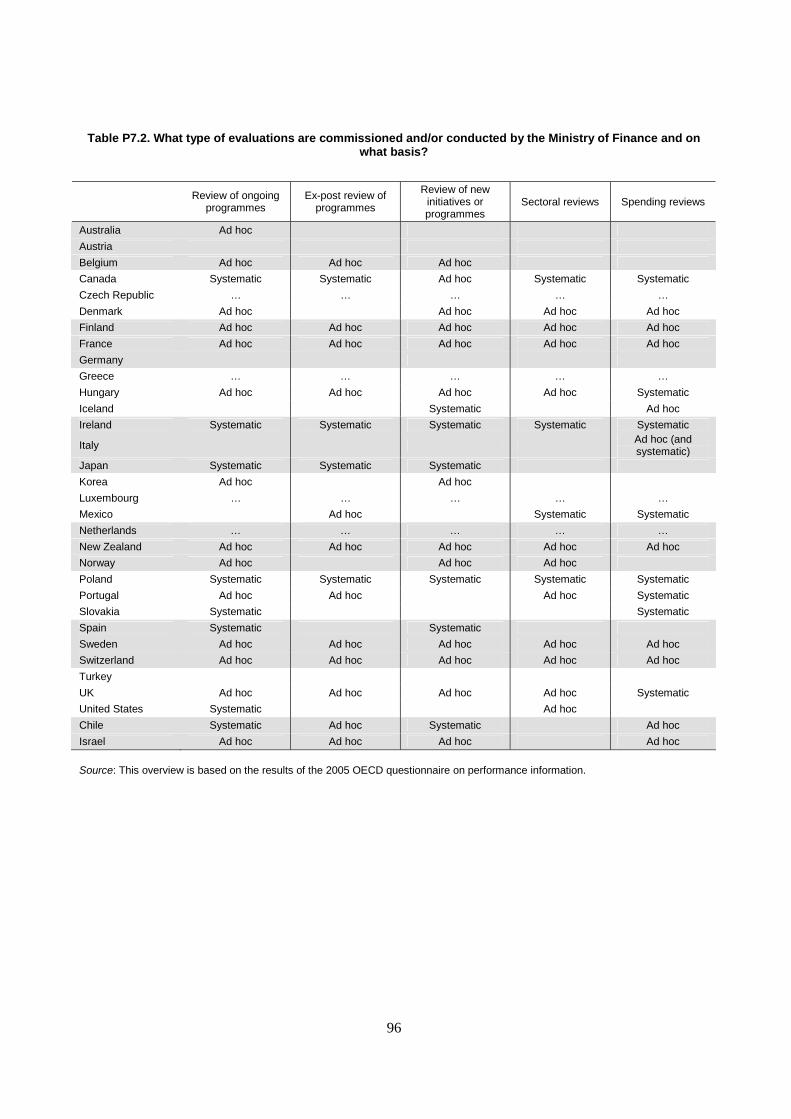
96
Table P7.2. What type of evaluations are commissioned and/or conducted by the Ministry of Finance and on what basis?
Source: This overview is based on the results of the 2005 OECD questionnaire on performance information.
Review of ongoing
programmes Ex-post review of
programmes
Review of new initiatives or programmes
Sectoral reviews Spending reviews
Australia Ad hoc
Austria
Belgium Ad hoc Ad hoc Ad hoc
Canada Systematic Systematic Ad hoc Systematic Systematic
Czech Republic … … … … …
Denmark Ad hoc Ad hoc Ad hoc Ad hoc
Finland Ad hoc Ad hoc Ad hoc Ad hoc Ad hoc
France Ad hoc Ad hoc Ad hoc Ad hoc Ad hoc
Germany
Greece … … … … …
Hungary Ad hoc Ad hoc Ad hoc Ad hoc Systematic
Iceland Systematic Ad hoc
Ireland Systematic Systematic Systematic Systematic Systematic
Italy Ad hoc (and systematic)
Japan Systematic Systematic Systematic
Korea Ad hoc Ad hoc
Luxembourg … … … … …
Mexico Ad hoc Systematic Systematic
Netherlands … … … … …
New Zealand Ad hoc Ad hoc Ad hoc Ad hoc Ad hoc
Norway Ad hoc Ad hoc Ad hoc
Poland Systematic Systematic Systematic Systematic Systematic
Portugal Ad hoc Ad hoc Ad hoc Systematic
Slovakia Systematic Systematic
Spain Systematic Systematic
Sweden Ad hoc Ad hoc Ad hoc Ad hoc Ad hoc
Switzerland Ad hoc Ad hoc Ad hoc Ad hoc Ad hoc
Turkey
UK Ad hoc Ad hoc Ad hoc Ad hoc Systematic
United States Systematic Ad hoc
Chile Systematic Ad hoc Systematic Ad hoc
Israel Ad hoc Ad hoc Ad hoc Ad hoc
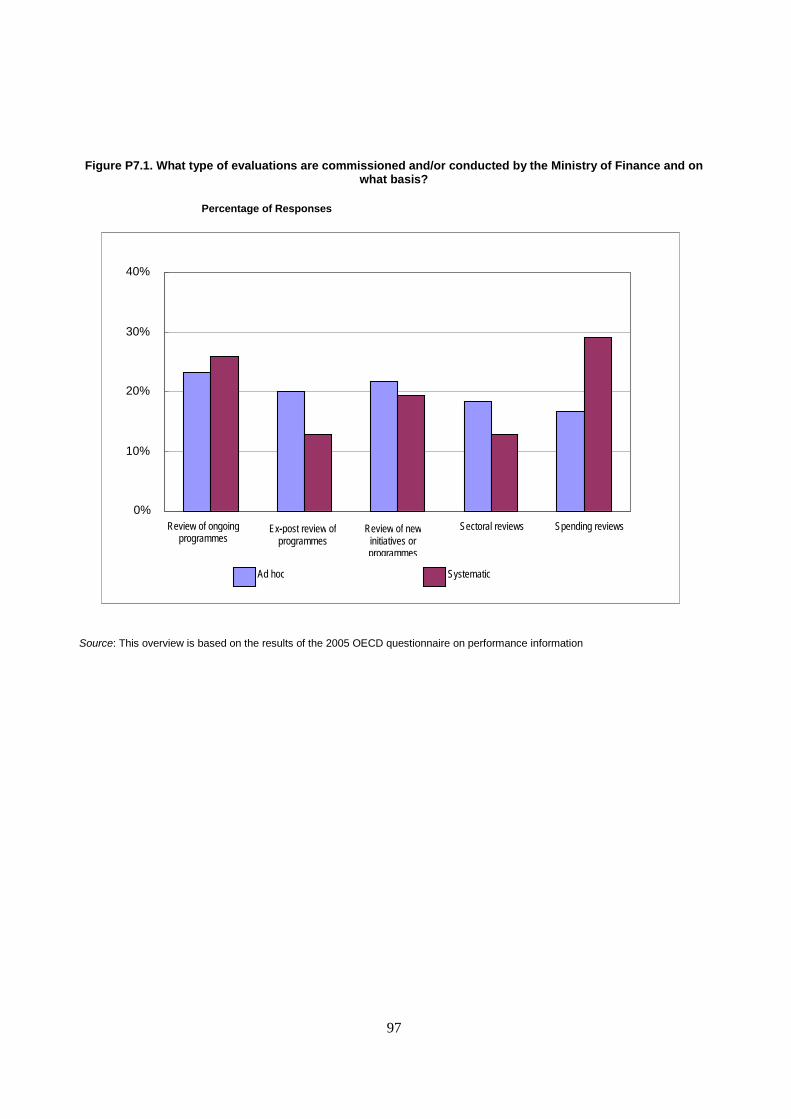
97
Figure P7.1. What type of evaluations are commissioned and/or conducted by the Ministry of Finance and on what basis?
Source: This overview is based on the results of the 2005 OECD questionnaire on performance information
0%
10%
20%
30%
40%
Review of ongoing programmes
Ex-post review of programmes
Review of new
initiatives or programmes
Sectoral reviews Spending reviews
Percentage of Responses
Ad hoc
Systematic
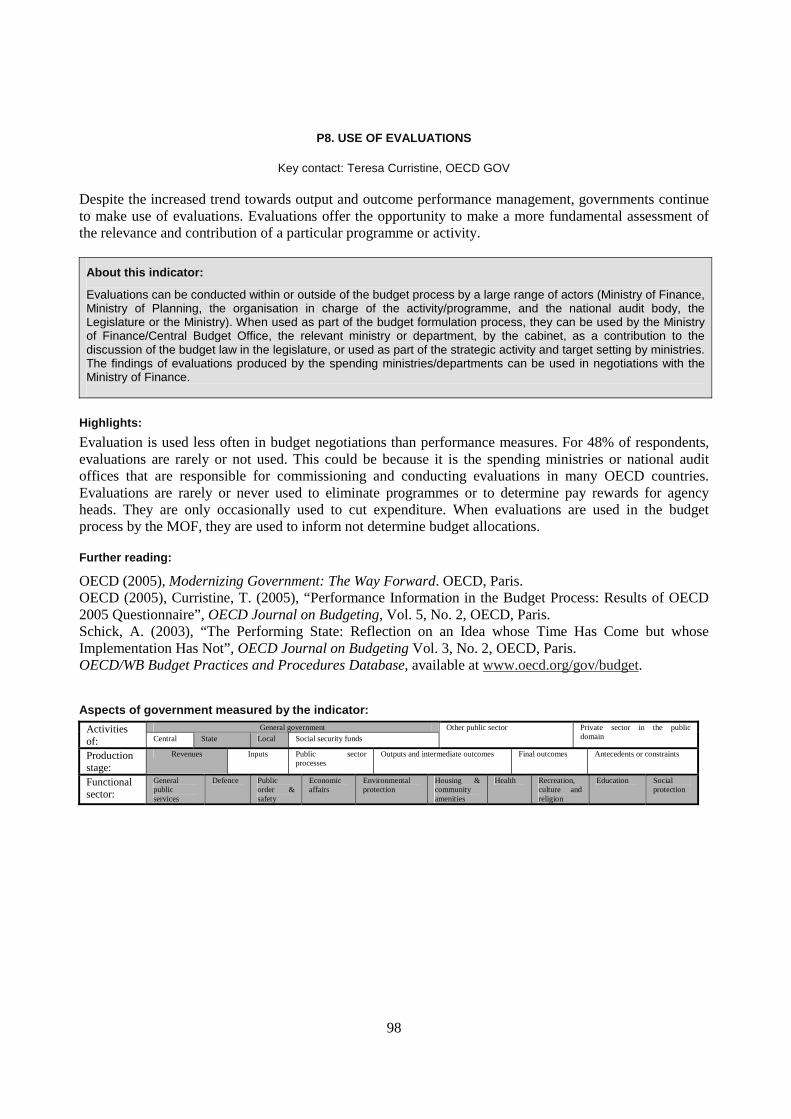
98
P8. USE OF EVALUATIONS
Key contact: Teresa Curristine, OECD GOV
Despite the increased trend towards output and outcome performance management, governments continue to make use of evaluations. Evaluations offer the opportunity to make a more fundamental assessment of the relevance and contribution of a particular programme or activity.
About this indicator:
Evaluations can be conducted within or outside of the budget process by a large range of actors (Ministry of Finance, Ministry of Planning, the organisation in charge of the activity/programme, and the national audit body, the Legislature or the Ministry). When used as part of the budget formulation process, they can be used by the Ministry of Finance/Central Budget Office, the relevant ministry or department, by the cabinet, as a contribution to the discussion of the budget law in the legislature, or used as part of the strategic activity and target setting by ministries. The findings of evaluations produced by the spending ministries/departments can be used in negotiations with the Ministry of Finance.
Highlights:
Evaluation is used less often in budget negotiations than performance measures. For 48% of respondents, evaluations are rarely or not used. This could be because it is the spending ministries or national audit offices that are responsible for commissioning and conducting evaluations in many OECD countries. Evaluations are rarely or never used to eliminate programmes or to determine pay rewards for agency heads. They are only occasionally used to cut expenditure. When evaluations are used in the budget process by the MOF, they are used to inform not determine budget allocations.
Further reading:
OECD (2005), Modernizing Government: The Way Forward. OECD, Paris. OECD (2005), Curristine, T. (2005), “Performance Information in the Budget Process: Results of OECD 2005 Questionnaire”, OECD Journal on Budgeting, Vol. 5, No. 2, OECD, Paris. Schick, A. (2003), “The Performing State: Reflection on an Idea whose Time Has Come but whose Implementation Has Not”, OECD Journal on Budgeting Vol. 3, No. 2, OECD, Paris. OECD/WB Budget Practices and Procedures Database, available at www.oecd.org/gov/budget.
Aspects of government measured by the indicator:
General government Activities of: Central State Local Social security funds
Other public sector Private sector in the public domain
Production stage:
Revenues Inputs Public sector processes
Outputs and intermediate outcomes Final outcomes Antecedents or constraints
Functional sector:
General public services
Defence Public order & safety
Economic affairs
Environmental protection
Housing & community amenities
Health Recreation, culture and religion
Education Social protection
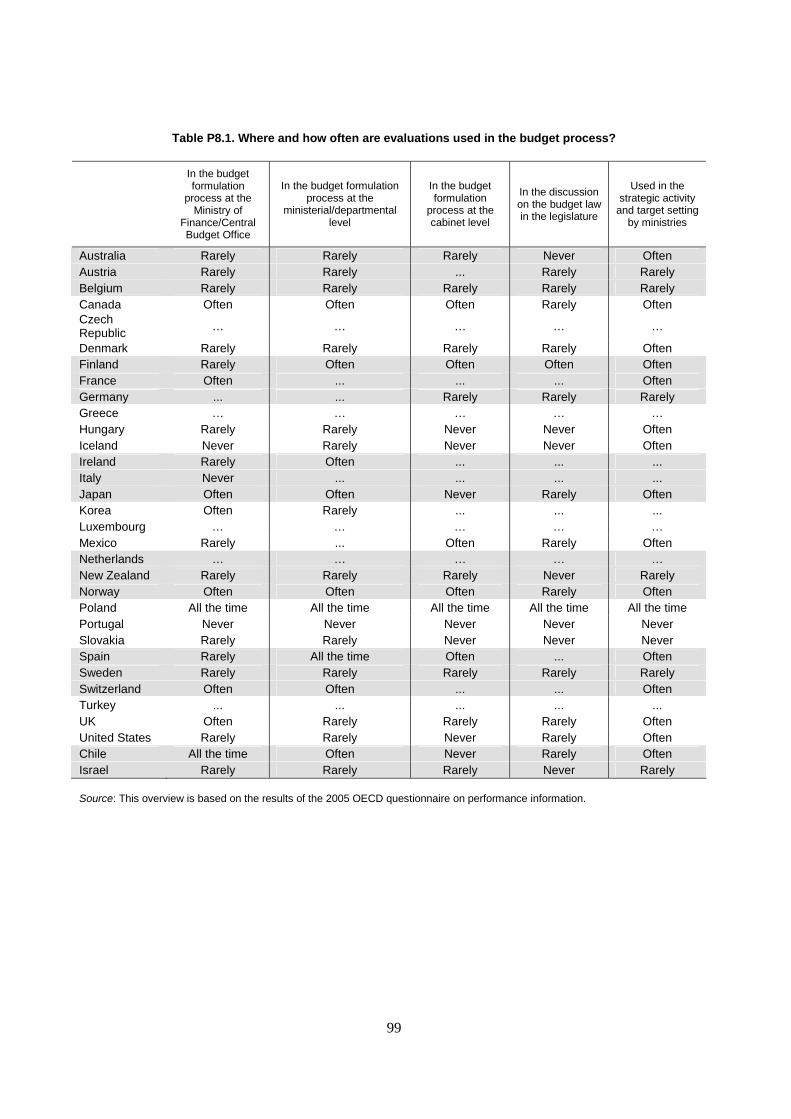
99
Table P8.1. Where and how often are evaluations used in the budget process?
In the budget formulation
process at the Ministry of
Finance/Central Budget Office
In the budget formulation process at the
ministerial/departmental level
In the budget formulation
process at the cabinet level
In the discussion on the budget law in the legislature
Used in the strategic activity
and target setting by ministries
Australia Rarely Rarely Rarely Never Often Austria Rarely Rarely ... Rarely Rarely Belgium Rarely Rarely Rarely Rarely Rarely Canada Often Often Often Rarely Often Czech Republic … … … … …
Denmark Rarely Rarely Rarely Rarely Often Finland Rarely Often Often Often Often France Often ... ... ... Often Germany ... ... Rarely Rarely Rarely Greece … … … … … Hungary Rarely Rarely Never Never Often Iceland Never Rarely Never Never Often Ireland Rarely Often ... ... ... Italy Never ... ... ... ... Japan Often Often Never Rarely Often Korea Often Rarely ... ... ... Luxembourg … … … … … Mexico Rarely ... Often Rarely Often Netherlands … … … … … New Zealand Rarely Rarely Rarely Never Rarely Norway Often Often Often Rarely Often Poland All the time All the time All the time All the time All the time Portugal Never Never Never Never Never Slovakia Rarely Rarely Never Never Never Spain Rarely All the time Often ... Often Sweden Rarely Rarely Rarely Rarely Rarely Switzerland Often Often ... ... Often Turkey ... ... ... ... ... UK Often Rarely Rarely Rarely Often United States Rarely Rarely Never Rarely Often Chile All the time Often Never Rarely Often Israel Rarely Rarely Rarely Never Rarely
Source: This overview is based on the results of the 2005 OECD questionnaire on performance information.
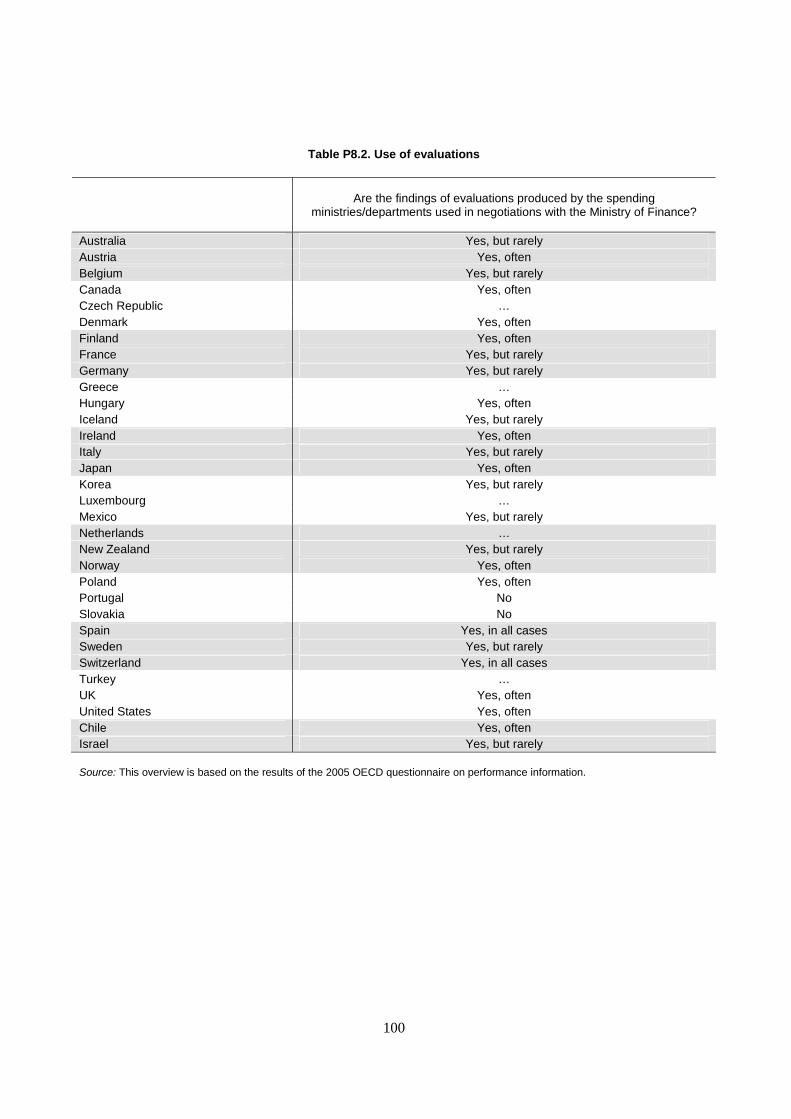
100
Table P8.2. Use of evaluations
Are the findings of evaluations produced by the spending ministries/departments used in negotiations with the Ministry of Finance?
Australia Yes, but rarely Austria Yes, often Belgium Yes, but rarely Canada Yes, often Czech Republic … Denmark Yes, often Finland Yes, often France Yes, but rarely Germany Yes, but rarely Greece … Hungary Yes, often Iceland Yes, but rarely Ireland Yes, often Italy Yes, but rarely Japan Yes, often Korea Yes, but rarely Luxembourg … Mexico Yes, but rarely Netherlands … New Zealand Yes, but rarely Norway Yes, often Poland Yes, often Portugal No Slovakia No Spain Yes, in all cases Sweden Yes, but rarely Switzerland Yes, in all cases Turkey … UK Yes, often United States Yes, often Chile Yes, often Israel Yes, but rarely Source: This overview is based on the results of the 2005 OECD questionnaire on performance information.
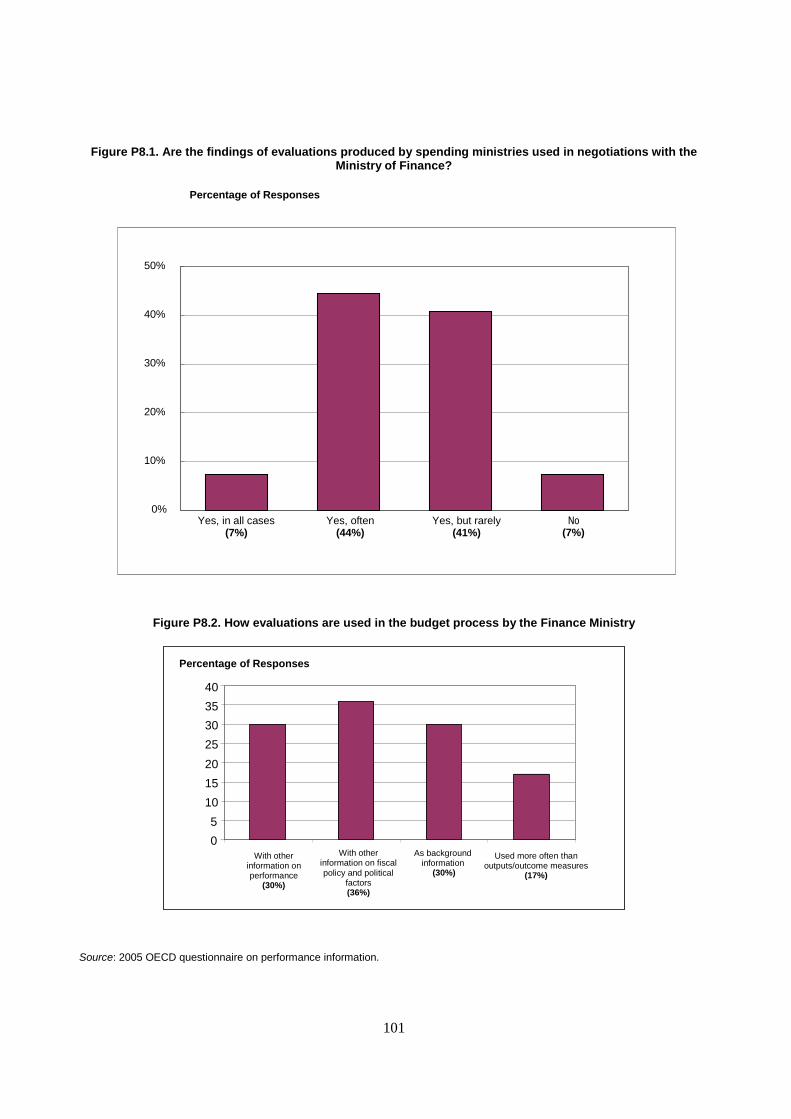
101
Figure P8.1. Are the findings of evaluations produced by spending ministries used in negotiations with the
Ministry of Finance?
Figure P8.2. How evaluations are used in the budget process by the Finance Ministry
Source: 2005 OECD questionnaire on performance information.
0%
10%
20%
30%
40%
50%
Yes, in all cases (7%)
Yes, often (44%)
Yes, but rarely (41%)
No (7%)
Percentage of Responses
0
5
10
15
20
25
30
35
40
With other information on performance
(30%)
With other information on fiscal policy and political
factors (36%)
As background information
(30%)
Used more often than outputs/outcome measures
(17%)
Percentage of Responses
102
P9. FOLLOW-UP ON EVALUATIONS
Key contact: Teresa Curristine, OECD GOV
Unlike performance measures, evaluation reports – depending on the type of evaluation – can provide explanations for success or failure of programmes and also make recommendations for future action. Therefore, the production of these reports is only one stage in the evaluation process. If they are to be taken seriously, it is important that there be monitoring or follow-up to see if accepted recommendations are implemented.
About this indicator:
Evaluations can be conducted within or outside of the budget process by a large range of actors (Ministry of Finance, Ministry of Planning, the organisation in charge of the activity/programme, and the national audit body, the Legislature or the Ministry). To ensure that recommendations have been carried out, it is important for them to be used as part of the budget formulation process. Evaluations can be used by the Ministry of Finance/Central Budget Office, the relevant ministry or department, by the cabinet, as a contribution to the discussion of the budget law in the legislature, or used as part of the strategic activity and target setting by ministries. The findings of evaluations produced by the spending ministries/departments can also be used in negotiations with the Ministry of Finance.
Highlights:
In 67% of cases there is a follow-up process. When evaluations are conducted outside of the budget process, the spending ministry in charge of the programme is responsible for monitoring the follow up in 51% of cases. When it is decided as part of the budget process, both the MOF (32%) and the relevant ministry (32%) can be responsible for the follow up process.
Regarding consequences of not following recommendations in the majority of cases, there are never or rarely consequences if recommendations are not followed. If there are consequences, the most common case is more control on the programme. While the majority of countries have adopted some type of follow-up process for monitoring the implementation of recommendation from evaluations, in many cases, it is the responsibility of the ministry in charge of the programme being evaluated. Similar to the failure to meet performance targets, sanctions do not typically apply for non-compliance with recommendations of evaluations.
Further reading:
OECD (2005), Modernizing Government: The Way Forward, OECD, Paris. OECD (2005), Curristine, T (2005) “Performance Information in the Budget Process: Results of OECD 2005 Questionnaire”, OECD Journal on Budgeting, Vol. 5, No. 2, OECD, Paris. Schick, A. (2003), “The Performing State: Reflection on an Idea whose Time Has Come but whose Implementation Has Not”, OECD Journal on Budgeting Vol. 3, No. 2, OECD, Paris. OECD/WB Budget Practices and Procedures Database, available at www.oecd.org/gov/budget. Aspects of government measured by the indicator:
General government Activities of: Central State Local Social security funds
Other public sector Private sector in the public domain
Production stage:
Revenues Inputs Public sector processes
Outputs and intermediate outcomes Final outcomes Antecedents or constraints
Functional sector:
General public services
Defence Public order & safety
Economic affairs
Environmental protection
Housing & community amenities
Health Recreation, culture and religion
Education Social protection
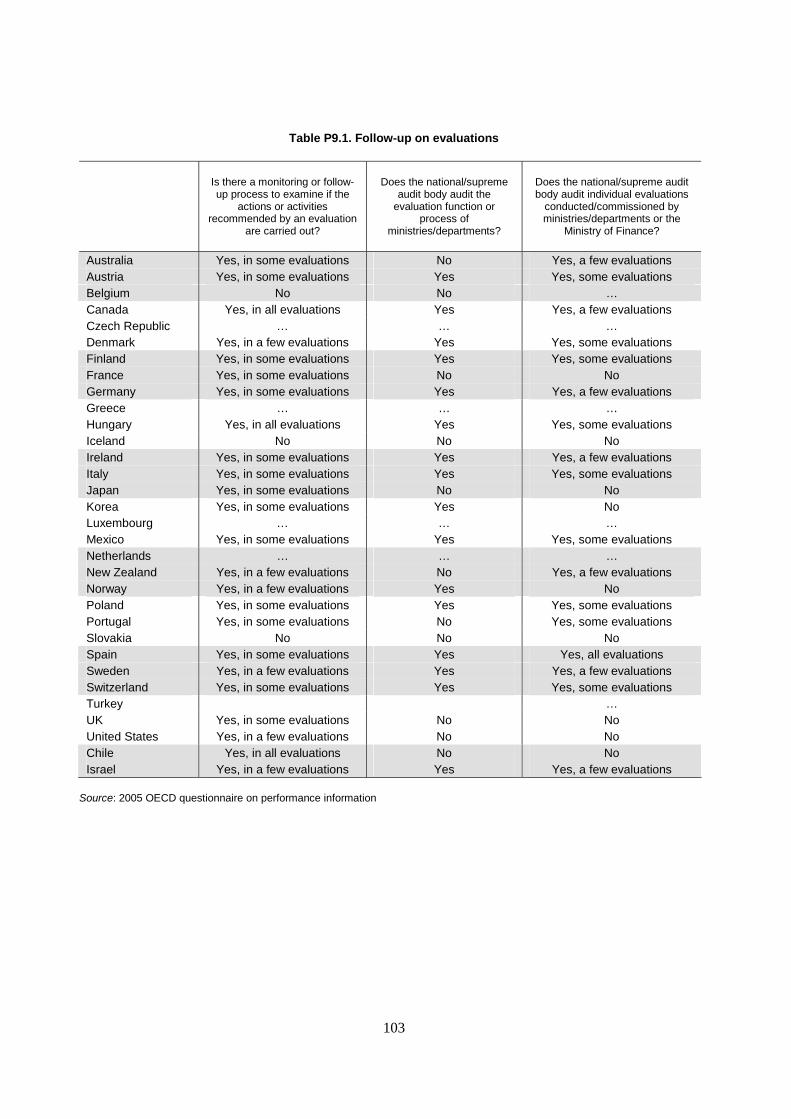
103
Table P9.1. Follow-up on evaluations
Is there a monitoring or follow-up process to examine if the
actions or activities recommended by an evaluation
are carried out?
Does the national/supreme audit body audit the
evaluation function or process of
ministries/departments?
Does the national/supreme audit body audit individual evaluations
conducted/commissioned by ministries/departments or the
Ministry of Finance?
Australia Yes, in some evaluations No Yes, a few evaluations Austria Yes, in some evaluations Yes Yes, some evaluations Belgium No No … Canada Yes, in all evaluations Yes Yes, a few evaluations Czech Republic … … … Denmark Yes, in a few evaluations Yes Yes, some evaluations Finland Yes, in some evaluations Yes Yes, some evaluations France Yes, in some evaluations No No Germany Yes, in some evaluations Yes Yes, a few evaluations Greece … … … Hungary Yes, in all evaluations Yes Yes, some evaluations Iceland No No No Ireland Yes, in some evaluations Yes Yes, a few evaluations Italy Yes, in some evaluations Yes Yes, some evaluations Japan Yes, in some evaluations No No Korea Yes, in some evaluations Yes No Luxembourg … … … Mexico Yes, in some evaluations Yes Yes, some evaluations Netherlands … … … New Zealand Yes, in a few evaluations No Yes, a few evaluations Norway Yes, in a few evaluations Yes No Poland Yes, in some evaluations Yes Yes, some evaluations Portugal Yes, in some evaluations No Yes, some evaluations Slovakia No No No Spain Yes, in some evaluations Yes Yes, all evaluations Sweden Yes, in a few evaluations Yes Yes, a few evaluations Switzerland Yes, in some evaluations Yes Yes, some evaluations Turkey … UK Yes, in some evaluations No No United States Yes, in a few evaluations No No Chile Yes, in all evaluations No No Israel Yes, in a few evaluations Yes Yes, a few evaluations
Source: 2005 OECD questionnaire on performance information
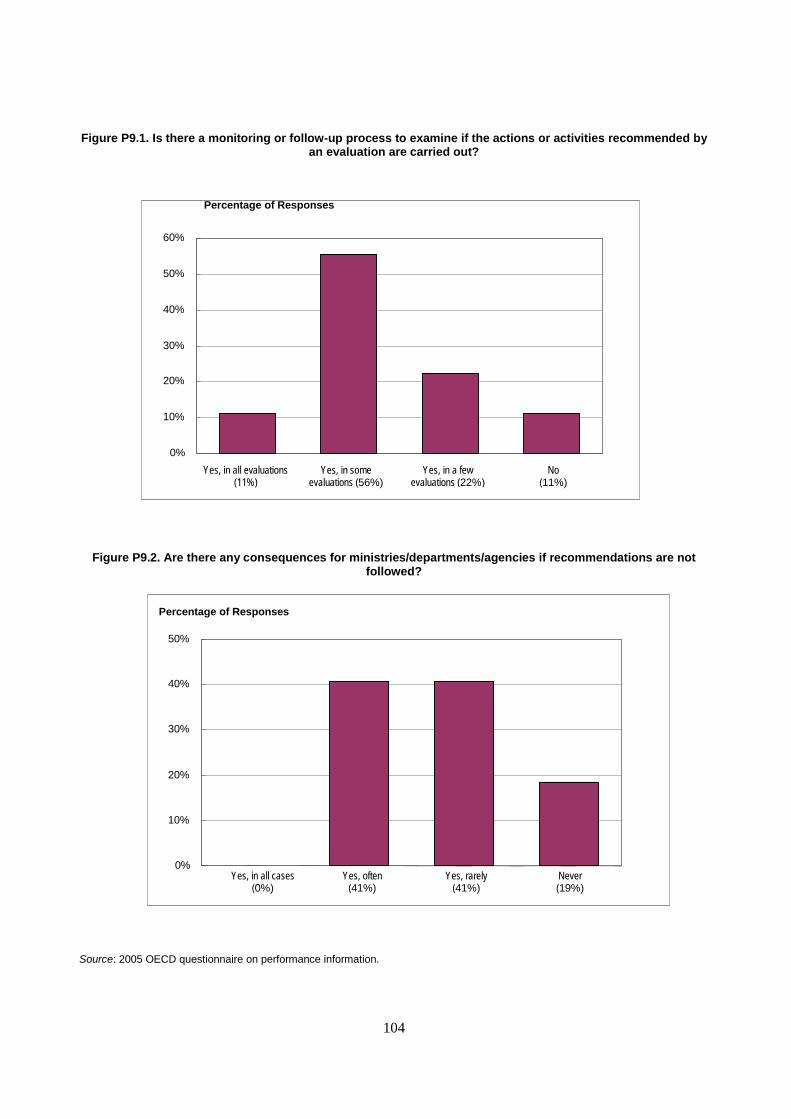
104
Figure P9.1. Is there a monitoring or follow-up process to examine if the actions or activities recommended by an evaluation are carried out?
Figure P9.2. Are there any consequences for ministries/departments/agencies if recommendations are not
followed?
Source: 2005 OECD questionnaire on performance information.
0%
10%
20%
30%
40%
50%
60%
Yes, in all evaluations (11%)
Yes, in some evaluations (56%)
Yes, in a few evaluations (22%)
No (11%)
Percentage of Responses
0%
10%
20%
30%
40%
50%
Yes, in all cases (0%)
Yes, often (41%)
Yes, rarely (41%)
Never (19%)
Percentage of Responses
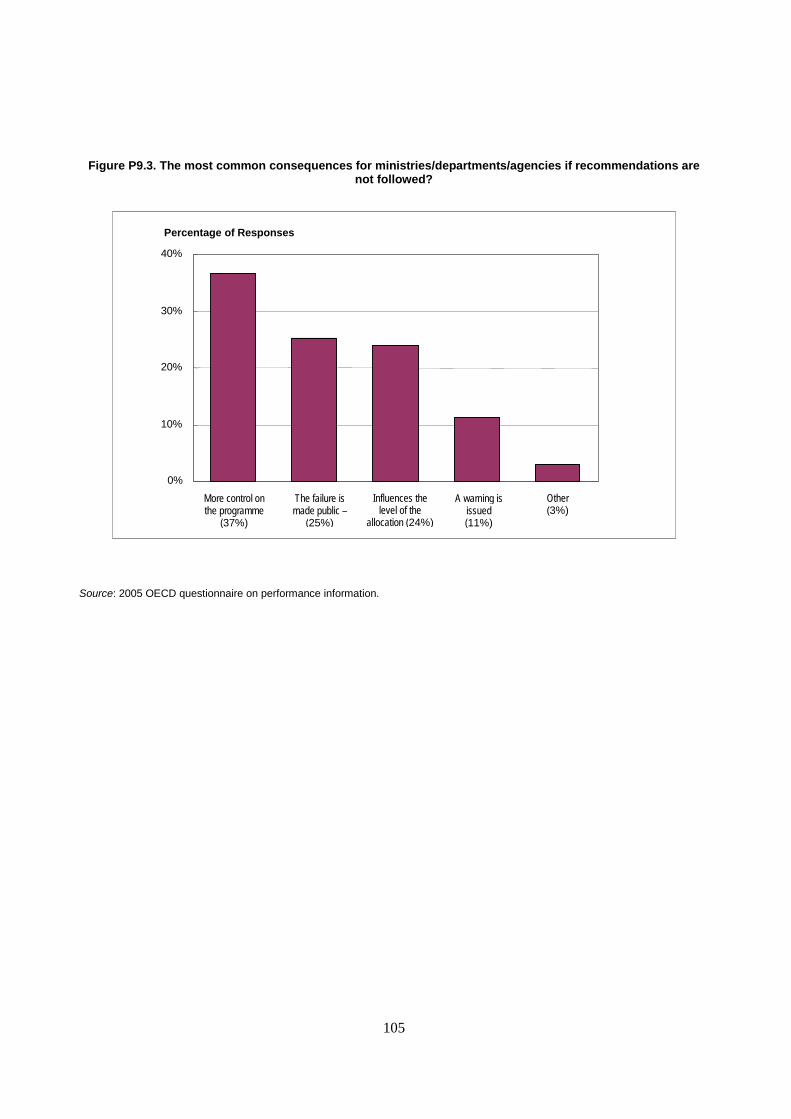
105
Figure P9.3. The most common consequences for ministries/departments/agencies if recommendations are not followed?
Source: 2005 OECD questionnaire on performance information.
0%
10%
20%
30%
40%
More control on the programme
(37%)
The failure is made public –
(25%)
Influences the level of the
allocation (24%)
A warning is issued (11%)
Other (3%)
Percentage of Responses
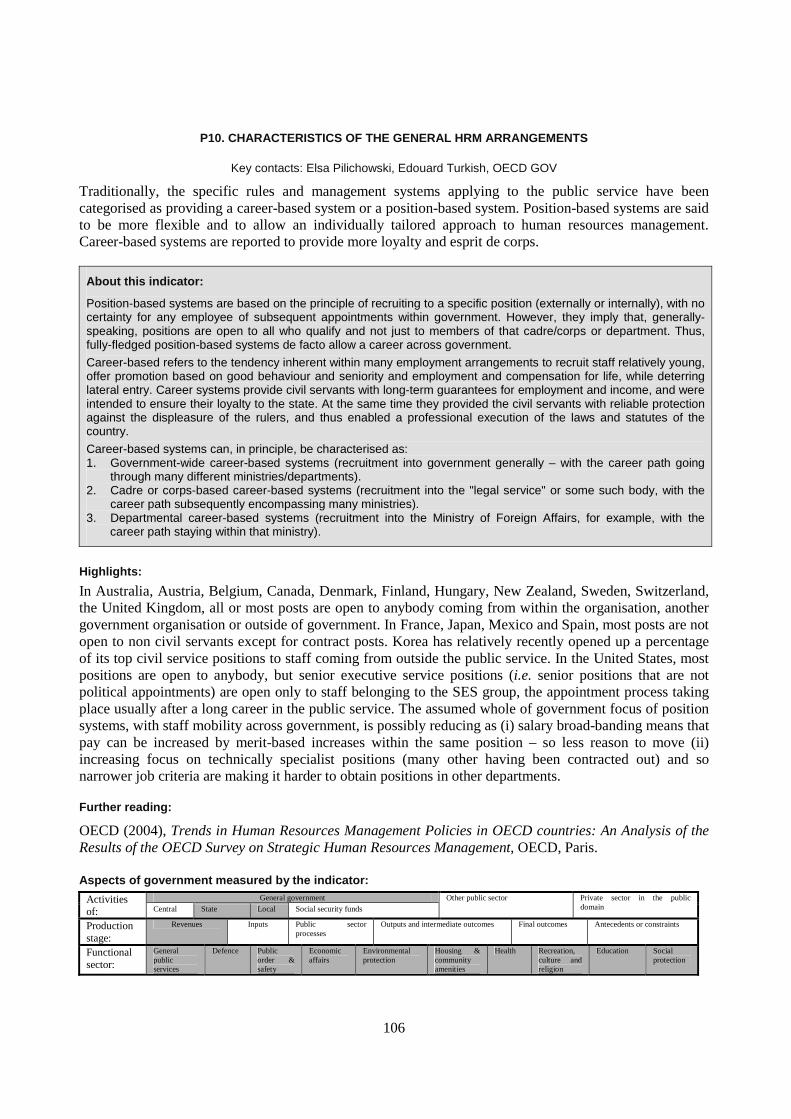
106
P10. CHARACTERISTICS OF THE GENERAL HRM ARRANGEMENTS
Key contacts: Elsa Pilichowski, Edouard Turkish, OECD GOV
Traditionally, the specific rules and management systems applying to the public service have been categorised as providing a career-based system or a position-based system. Position-based systems are said to be more flexible and to allow an individually tailored approach to human resources management. Career-based systems are reported to provide more loyalty and esprit de corps.
About this indicator:
Position-based systems are based on the principle of recruiting to a specific position (externally or internally), with no certainty for any employee of subsequent appointments within government. However, they imply that, generally-speaking, positions are open to all who qualify and not just to members of that cadre/corps or department. Thus, fully-fledged position-based systems de facto allow a career across government.
Career-based refers to the tendency inherent within many employment arrangements to recruit staff relatively young, offer promotion based on good behaviour and seniority and employment and compensation for life, while deterring lateral entry. Career systems provide civil servants with long-term guarantees for employment and income, and were intended to ensure their loyalty to the state. At the same time they provided the civil servants with reliable protection against the displeasure of the rulers, and thus enabled a professional execution of the laws and statutes of the country.
Career-based systems can, in principle, be characterised as: 1. Government-wide career-based systems (recruitment into government generally – with the career path going
through many different ministries/departments). 2. Cadre or corps-based career-based systems (recruitment into the "legal service" or some such body, with the
career path subsequently encompassing many ministries). 3. Departmental career-based systems (recruitment into the Ministry of Foreign Affairs, for example, with the
career path staying within that ministry).
Highlights:
In Australia, Austria, Belgium, Canada, Denmark, Finland, Hungary, New Zealand, Sweden, Switzerland, the United Kingdom, all or most posts are open to anybody coming from within the organisation, another government organisation or outside of government. In France, Japan, Mexico and Spain, most posts are not open to non civil servants except for contract posts. Korea has relatively recently opened up a percentage of its top civil service positions to staff coming from outside the public service. In the United States, most positions are open to anybody, but senior executive service positions (i.e. senior positions that are not political appointments) are open only to staff belonging to the SES group, the appointment process taking place usually after a long career in the public service. The assumed whole of government focus of position systems, with staff mobility across government, is possibly reducing as (i) salary broad-banding means that pay can be increased by merit-based increases within the same position – so less reason to move (ii) increasing focus on technically specialist positions (many other having been contracted out) and so narrower job criteria are making it harder to obtain positions in other departments.
Further reading:
OECD (2004), Trends in Human Resources Management Policies in OECD countries: An Analysis of the Results of the OECD Survey on Strategic Human Resources Management, OECD, Paris. Aspects of government measured by the indicator:
General government Activities of: Central State Local Social security funds
Other public sector Private sector in the public domain
Production stage:
Revenues Inputs Public sector processes
Outputs and intermediate outcomes Final outcomes Antecedents or constraints
Functional sector:
General public services
Defence Public order & safety
Economic affairs
Environmental protection
Housing & community amenities
Health Recreation, culture and religion
Education Social protection
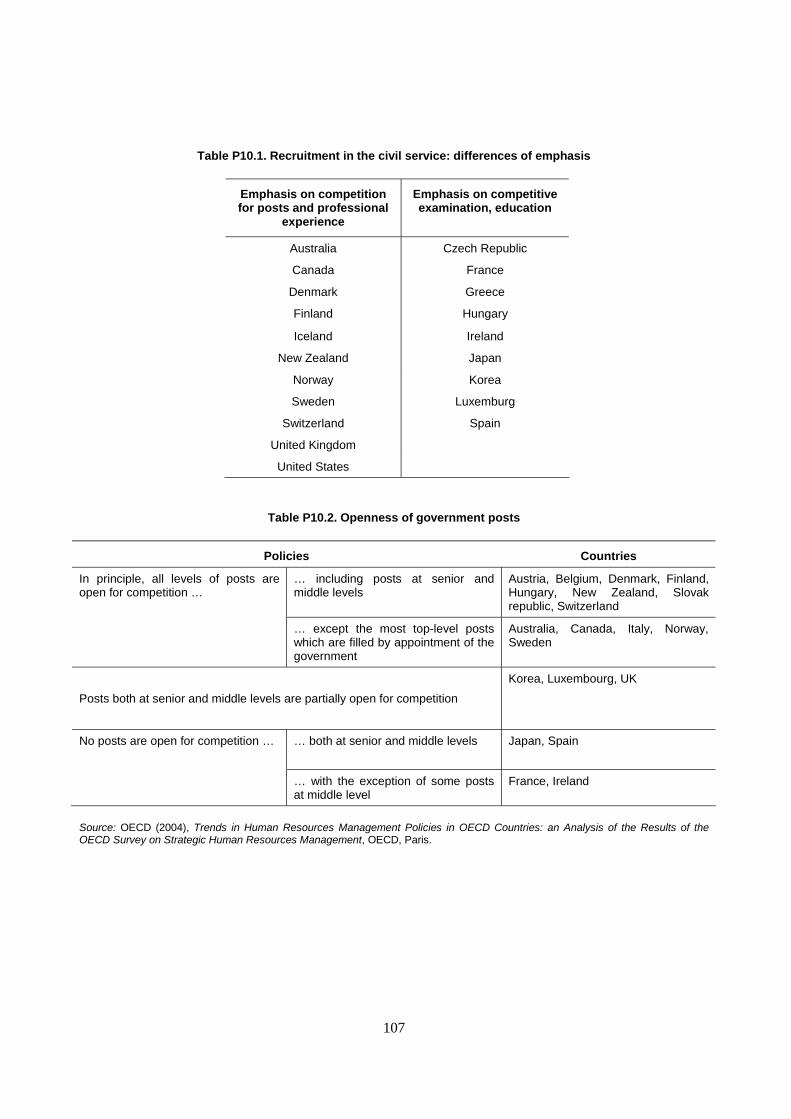
107
Table P10.1. Recruitment in the civil service: differences of emphasis
Emphasis on competition for posts and professional
experience
Emphasis on competitive examination, education
Australia Czech Republic
Canada France
Denmark Greece
Finland Hungary
Iceland Ireland
New Zealand Japan
Norway Korea
Sweden Luxemburg
Switzerland Spain
United Kingdom
United States
Table P10.2. Openness of government posts
Policies Countries
In principle, all levels of posts are open for competition …
… including posts at senior and middle levels
Austria, Belgium, Denmark, Finland, Hungary, New Zealand, Slovak republic, Switzerland
… except the most top-level posts which are filled by appointment of the government
Australia, Canada, Italy, Norway, Sweden
Posts both at senior and middle levels are partially open for competition
Korea, Luxembourg, UK
No posts are open for competition … … both at senior and middle levels
Japan, Spain
… with the exception of some posts at middle level
France, Ireland
Source: OECD (2004), Trends in Human Resources Management Policies in OECD Countries: an Analysis of the Results of the OECD Survey on Strategic Human Resources Management, OECD, Paris.
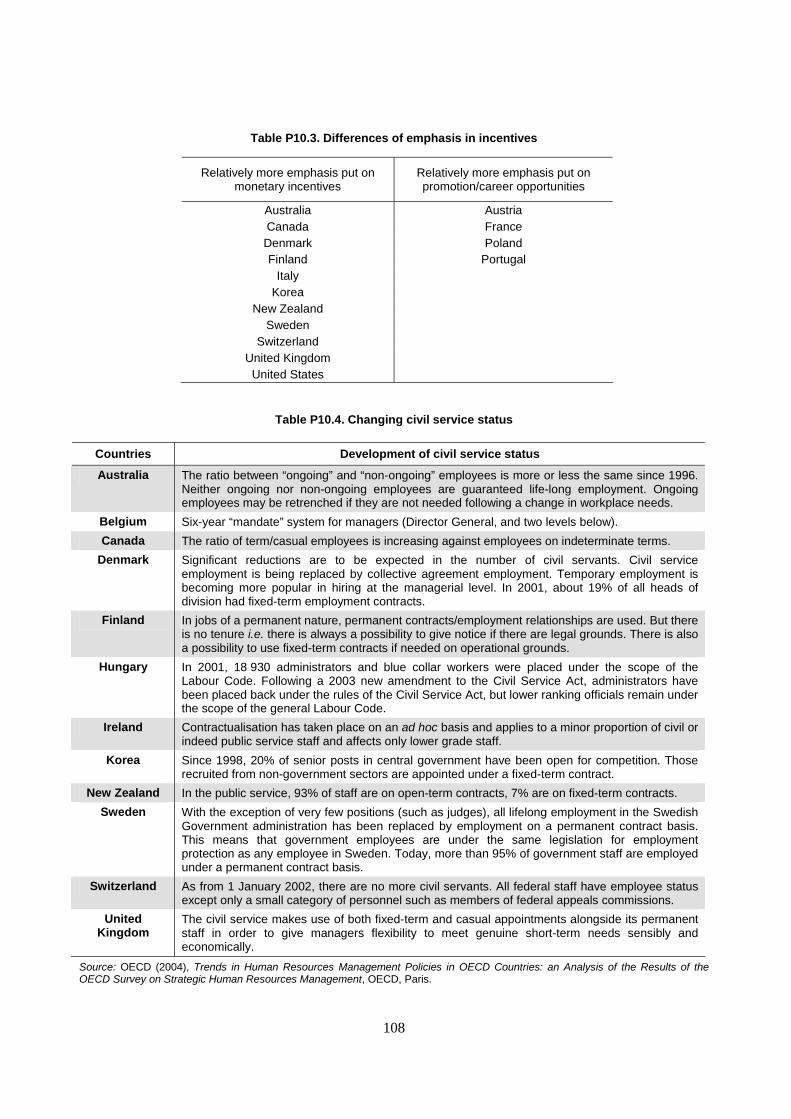
108
Table P10.3. Differences of emphasis in incentives
Relatively more emphasis put on monetary incentives
Relatively more emphasis put on promotion/career opportunities
Australia Austria Canada France Denmark Poland Finland Portugal
Italy Korea
New Zealand Sweden
Switzerland United Kingdom
United States
Table P10.4. Changing civil service status
Countries Development of civil service status
Australia The ratio between “ongoing” and “non-ongoing” employees is more or less the same since 1996. Neither ongoing nor non-ongoing employees are guaranteed life-long employment. Ongoing employees may be retrenched if they are not needed following a change in workplace needs.
Belgium Six-year “mandate” system for managers (Director General, and two levels below).
Canada The ratio of term/casual employees is increasing against employees on indeterminate terms.
Denmark Significant reductions are to be expected in the number of civil servants. Civil service employment is being replaced by collective agreement employment. Temporary employment is becoming more popular in hiring at the managerial level. In 2001, about 19% of all heads of division had fixed-term employment contracts.
Finland In jobs of a permanent nature, permanent contracts/employment relationships are used. But there is no tenure i.e. there is always a possibility to give notice if there are legal grounds. There is also a possibility to use fixed-term contracts if needed on operational grounds.
Hungary In 2001, 18 930 administrators and blue collar workers were placed under the scope of the Labour Code. Following a 2003 new amendment to the Civil Service Act, administrators have been placed back under the rules of the Civil Service Act, but lower ranking officials remain under the scope of the general Labour Code.
Ireland Contractualisation has taken place on an ad hoc basis and applies to a minor proportion of civil or indeed public service staff and affects only lower grade staff.
Korea Since 1998, 20% of senior posts in central government have been open for competition. Those recruited from non-government sectors are appointed under a fixed-term contract.
New Zealand In the public service, 93% of staff are on open-term contracts, 7% are on fixed-term contracts.
Sweden With the exception of very few positions (such as judges), all lifelong employment in the Swedish Government administration has been replaced by employment on a permanent contract basis. This means that government employees are under the same legislation for employment protection as any employee in Sweden. Today, more than 95% of government staff are employed under a permanent contract basis.
Switzerland As from 1 January 2002, there are no more civil servants. All federal staff have employee status except only a small category of personnel such as members of federal appeals commissions.
United Kingdom
The civil service makes use of both fixed-term and casual appointments alongside its permanent staff in order to give managers flexibility to meet genuine short-term needs sensibly and economically.
Source: OECD (2004), Trends in Human Resources Management Policies in OECD Countries: an Analysis of the Results of the OECD Survey on Strategic Human Resources Management, OECD, Paris.
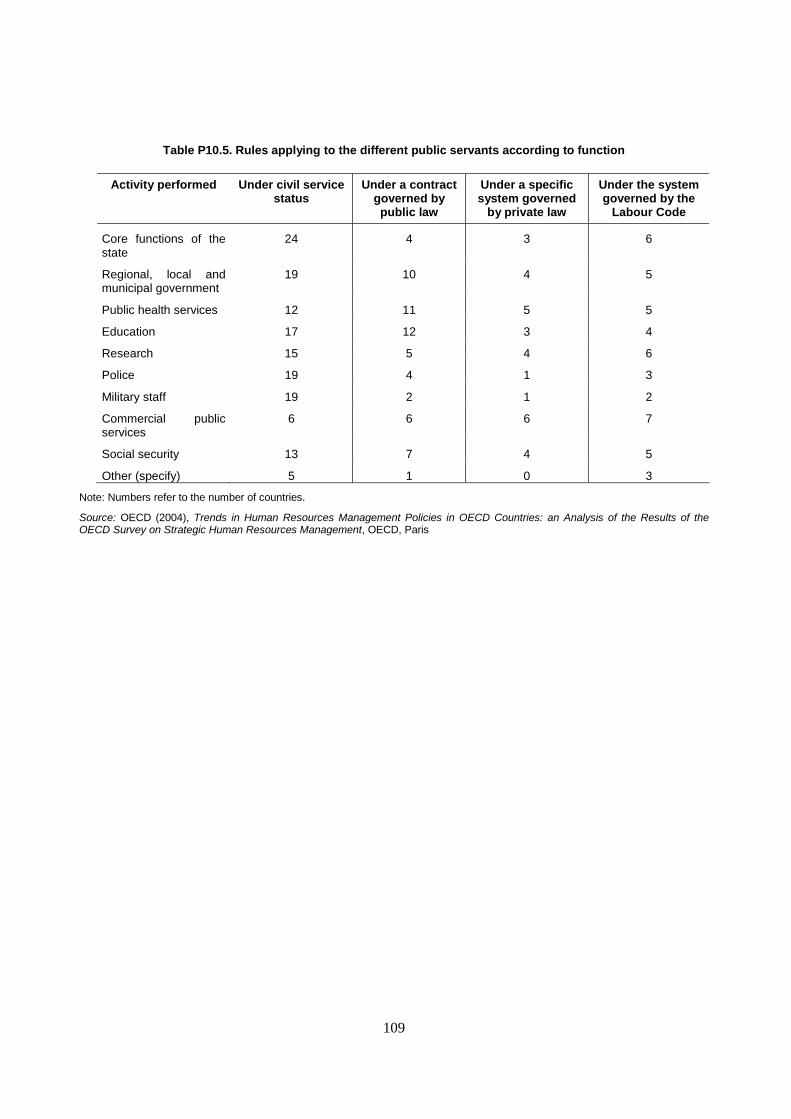
109
Table P10.5. Rules applying to the different public servants according to function
Activity performed Under civil service status
Under a contract governed by public law
Under a specific system governed
by private law
Under the system governed by the
Labour Code
Core functions of the state
24 4 3 6
Regional, local and municipal government
19 10 4 5
Public health services 12 11 5 5
Education 17 12 3 4
Research 15 5 4 6
Police 19 4 1 3
Military staff 19 2 1 2
Commercial public services
6 6 6 7
Social security 13 7 4 5
Other (specify) 5 1 0 3
Note: Numbers refer to the number of countries.
Source: OECD (2004), Trends in Human Resources Management Policies in OECD Countries: an Analysis of the Results of the OECD Survey on Strategic Human Resources Management, OECD, Paris
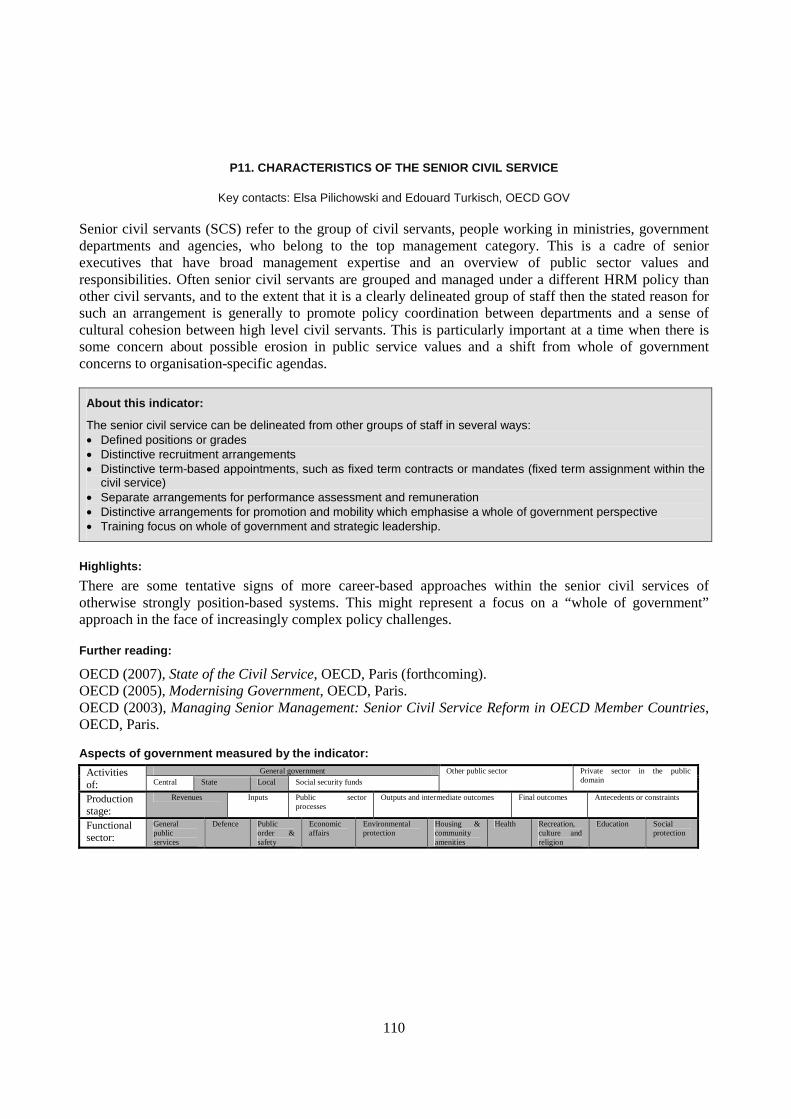
110
P11. CHARACTERISTICS OF THE SENIOR CIVIL SERVICE
Key contacts: Elsa Pilichowski and Edouard Turkisch, OECD GOV
Senior civil servants (SCS) refer to the group of civil servants, people working in ministries, government departments and agencies, who belong to the top management category. This is a cadre of senior executives that have broad management expertise and an overview of public sector values and responsibilities. Often senior civil servants are grouped and managed under a different HRM policy than other civil servants, and to the extent that it is a clearly delineated group of staff then the stated reason for such an arrangement is generally to promote policy coordination between departments and a sense of cultural cohesion between high level civil servants. This is particularly important at a time when there is some concern about possible erosion in public service values and a shift from whole of government concerns to organisation-specific agendas.
About this indicator:
The senior civil service can be delineated from other groups of staff in several ways: • Defined positions or grades • Distinctive recruitment arrangements • Distinctive term-based appointments, such as fixed term contracts or mandates (fixed term assignment within the
civil service) • Separate arrangements for performance assessment and remuneration • Distinctive arrangements for promotion and mobility which emphasise a whole of government perspective • Training focus on whole of government and strategic leadership.
Highlights:
There are some tentative signs of more career-based approaches within the senior civil services of otherwise strongly position-based systems. This might represent a focus on a “whole of government” approach in the face of increasingly complex policy challenges.
Further reading:
OECD (2007), State of the Civil Service, OECD, Paris (forthcoming). OECD (2005), Modernising Government, OECD, Paris. OECD (2003), Managing Senior Management: Senior Civil Service Reform in OECD Member Countries, OECD, Paris. Aspects of government measured by the indicator:
General government Activities of: Central State Local Social security funds
Other public sector Private sector in the public domain
Production stage:
Revenues Inputs Public sector processes
Outputs and intermediate outcomes Final outcomes Antecedents or constraints
Functional sector:
General public services
Defence Public order & safety
Economic affairs
Environmental protection
Housing & community amenities
Health Recreation, culture and religion
Education Social protection
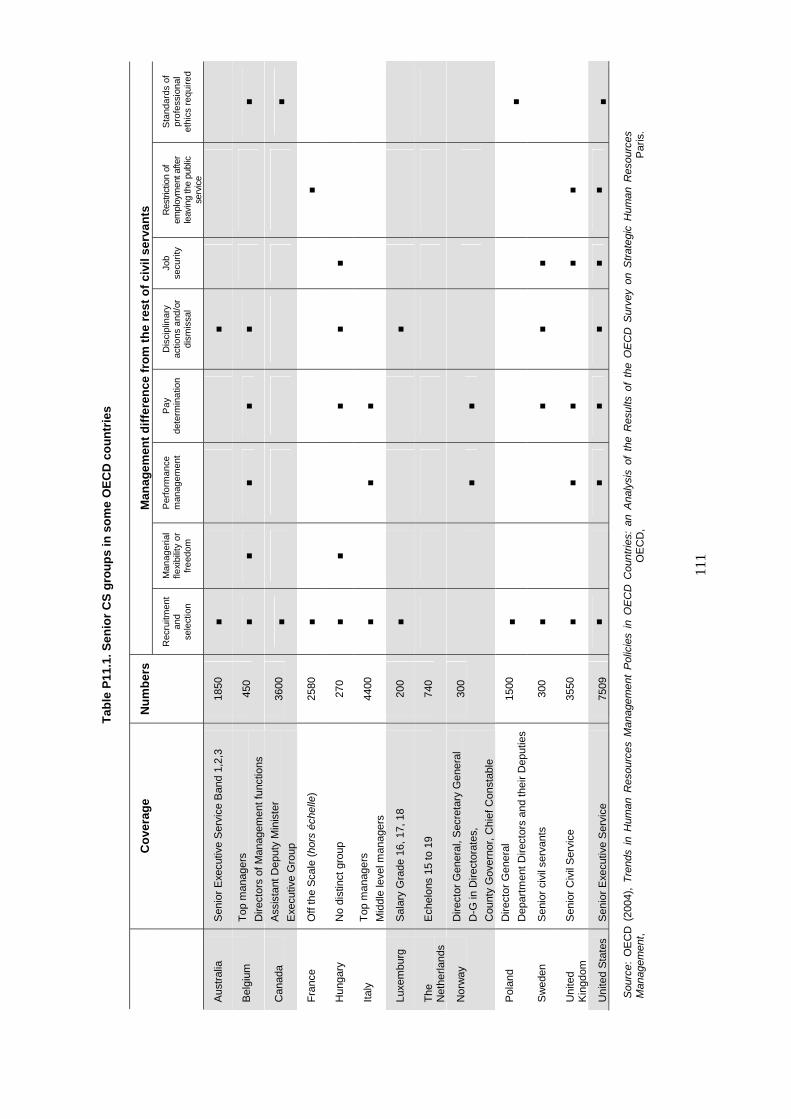
11
1
Tab
le P
11.1
. Sen
ior
CS
gro
up
s in
so
me
OE
CD
co
un
trie
s
Man
agem
ent
dif
fere
nce
fro
m t
he
rest
of
civi
l ser
van
ts
C
ove
rag
e N
um
ber
s
Rec
ruitm
ent
and
sele
ctio
n
Man
ager
ial
flexi
bilit
y or
fr
eedo
m
Per
form
ance
m
anag
emen
t P
ay
dete
rmin
atio
n D
isci
plin
ary
actio
ns a
nd/o
r di
smis
sal
Job
secu
rity
Res
trict
ion
of
empl
oym
ent a
fter
leav
ing
the
publ
ic
serv
ice
Sta
ndar
ds o
f pr
ofes
sion
al
ethi
cs r
equi
red
Aus
tral
ia
Sen
ior
Exe
cutiv
e S
ervi
ce B
and
1,2,
3 18
50
■
■
Bel
gium
T
op m
anag
ers
Dire
ctor
s of
Man
agem
ent f
unct
ions
45
0 ■
■ ■
■ ■
■
Can
ada
Ass
ista
nt D
eput
y M
inis
ter
Exe
cutiv
e G
roup
36
00
■
■
Fra
nce
Off
the
Sca
le (
hors
éch
elle
) 25
80
■
■
Hun
gary
N
o di
stin
ct g
roup
27
0 ■
■
■ ■
■
Italy
T
op m
anag
ers
Mid
dle
leve
l man
ager
s 44
00
■
■ ■
Luxe
mbu
rg
Sal
ary
Gra
de 1
6, 1
7, 1
8 20
0 ■
■
The
N
ethe
rland
s E
chel
ons
15 to
19
740
Nor
way
D
irect
or G
ener
al, S
ecre
tary
Gen
eral
D-G
in D
irect
orat
es,
Cou
nty
Gov
erno
r, C
hief
Con
stab
le
300
■ ■
Pol
and
Dire
ctor
Gen
eral
Dep
artm
ent D
irect
ors
and
thei
r D
eput
ies
1500
■
■
Sw
eden
S
enio
r ci
vil s
erva
nts
300
■
■
■ ■
Uni
ted
Kin
gdom
S
enio
r C
ivil
Ser
vice
35
50
■
■ ■
■
■
Uni
ted
Sta
tes
Sen
ior
Exe
cutiv
e S
ervi
ce
7509
■
■
■ ■
■ ■
■ S
ourc
e: O
EC
D (
2004
), T
rend
s in
Hum
an R
esou
rces
Man
agem
ent
Pol
icie
s in
OE
CD
Cou
ntrie
s: a
n A
naly
sis
of t
he R
esul
ts o
f th
e O
EC
D S
urve
y on
Str
ateg
ic H
uman
Res
ourc
es
Man
agem
ent,
OE
CD
, P
aris
.
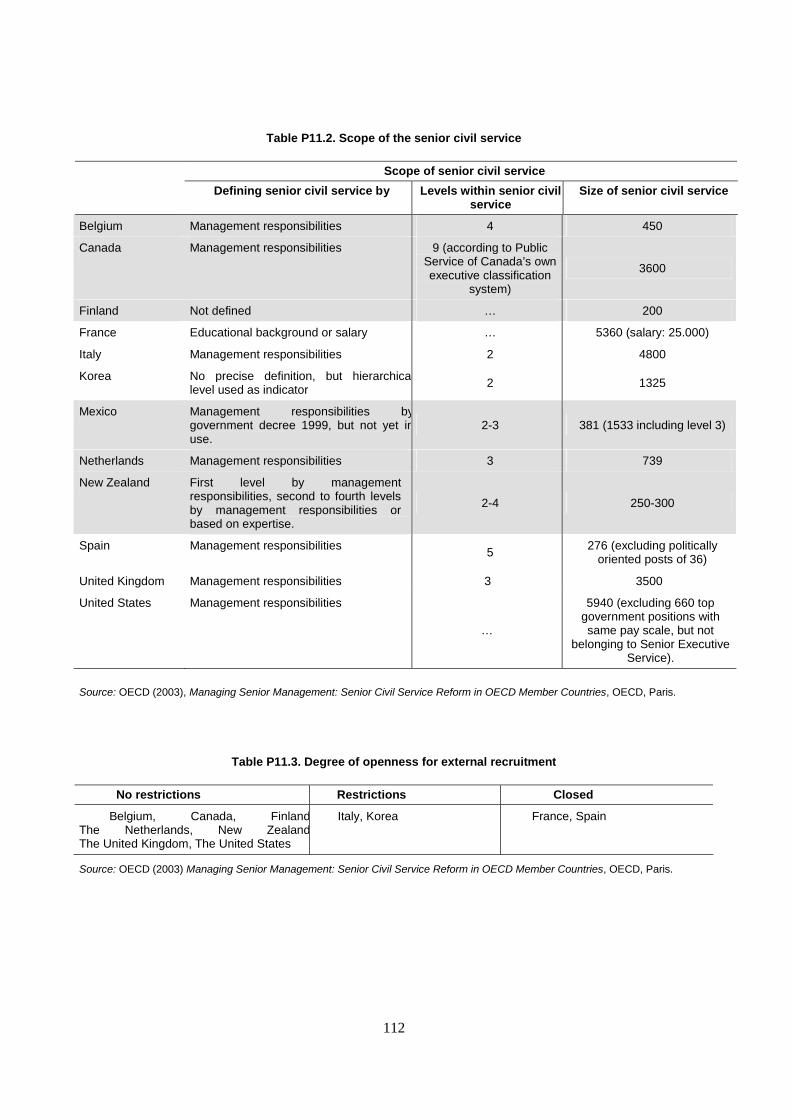
112
Table P11.2. Scope of the senior civil service
Scope of senior civil service Defining senior civil service by Levels within senior civil
service Size of senior civil service
Belgium Management responsibilities 4 450
Canada Management responsibilities 9 (according to Public Service of Canada’s own executive classification
system)
3600
Finland Not defined … 200
France Educational background or salary … 5360 (salary: 25.000)
Italy Management responsibilities 2 4800
Korea No precise definition, but hierarchicallevel used as indicator 2 1325
Mexico Management responsibilities bygovernment decree 1999, but not yet inuse.
2-3 381 (1533 including level 3)
Netherlands Management responsibilities 3 739
New Zealand First level by management responsibilities, second to fourth levels by management responsibilities or based on expertise.
2-4 250-300
Spain Management responsibilities 5 276 (excluding politically oriented posts of 36)
United Kingdom Management responsibilities 3 3500
United States Management responsibilities
…
5940 (excluding 660 top government positions with same pay scale, but not
belonging to Senior Executive Service).
Source: OECD (2003), Managing Senior Management: Senior Civil Service Reform in OECD Member Countries, OECD, Paris.
Table P11.3. Degree of openness for external recruitment
No restrictions Restrictions Closed
Belgium, Canada, Finland,The Netherlands, New Zealand,The United Kingdom, The United States
Italy, Korea France, Spain
Source: OECD (2003) Managing Senior Management: Senior Civil Service Reform in OECD Member Countries, OECD, Paris.
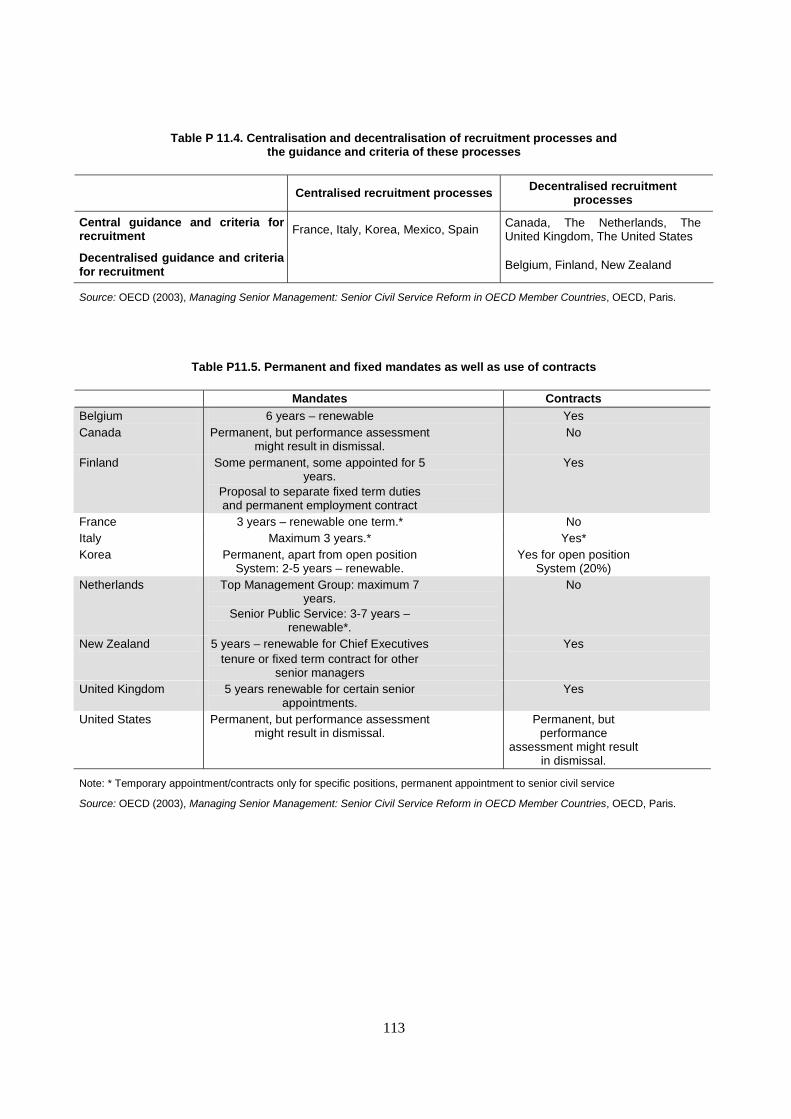
113
Table P 11.4. Centralisation and decentralisation of recruitment processes and the guidance and criteria of these processes
Centralised recruitment processes Decentralised recruitment processes
Central guidance and criteria for recruitment France, Italy, Korea, Mexico, Spain Canada, The Netherlands, The
United Kingdom, The United States
Decentralised guidance and criteria for recruitment Belgium, Finland, New Zealand
Source: OECD (2003), Managing Senior Management: Senior Civil Service Reform in OECD Member Countries, OECD, Paris.
Table P11.5. Permanent and fixed mandates as well as use of contracts
Mandates Contracts Belgium 6 years – renewable Yes Canada Permanent, but performance assessment
might result in dismissal. No
Finland Some permanent, some appointed for 5 years.
Proposal to separate fixed term duties and permanent employment contract
Yes
France 3 years – renewable one term.* No Italy Maximum 3 years.* Yes* Korea Permanent, apart from open position
System: 2-5 years – renewable. Yes for open position
System (20%) Netherlands Top Management Group: maximum 7
years. Senior Public Service: 3-7 years –
renewable*.
No
New Zealand 5 years – renewable for Chief Executives tenure or fixed term contract for other
senior managers
Yes
United Kingdom 5 years renewable for certain senior appointments.
Yes
United States Permanent, but performance assessment might result in dismissal.
Permanent, but performance
assessment might result in dismissal.
Note: * Temporary appointment/contracts only for specific positions, permanent appointment to senior civil service
Source: OECD (2003), Managing Senior Management: Senior Civil Service Reform in OECD Member Countries, OECD, Paris.
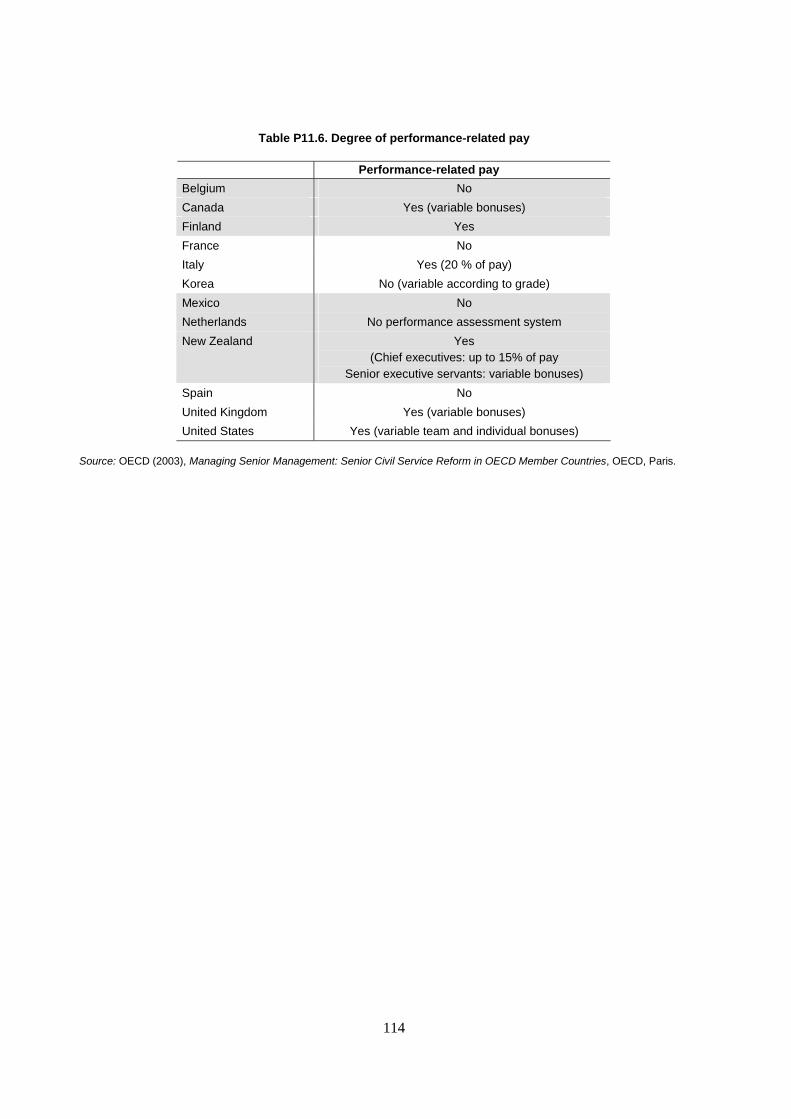
114
Table P11.6. Degree of performance-related pay
Performance-related pay
Belgium No
Canada Yes (variable bonuses)
Finland Yes
France No
Italy Yes (20 % of pay)
Korea No (variable according to grade)
Mexico No
Netherlands No performance assessment system
New Zealand Yes (Chief executives: up to 15% of pay
Senior executive servants: variable bonuses)
Spain No
United Kingdom Yes (variable bonuses)
United States Yes (variable team and individual bonuses)
Source: OECD (2003), Managing Senior Management: Senior Civil Service Reform in OECD Member Countries, OECD, Paris.

115
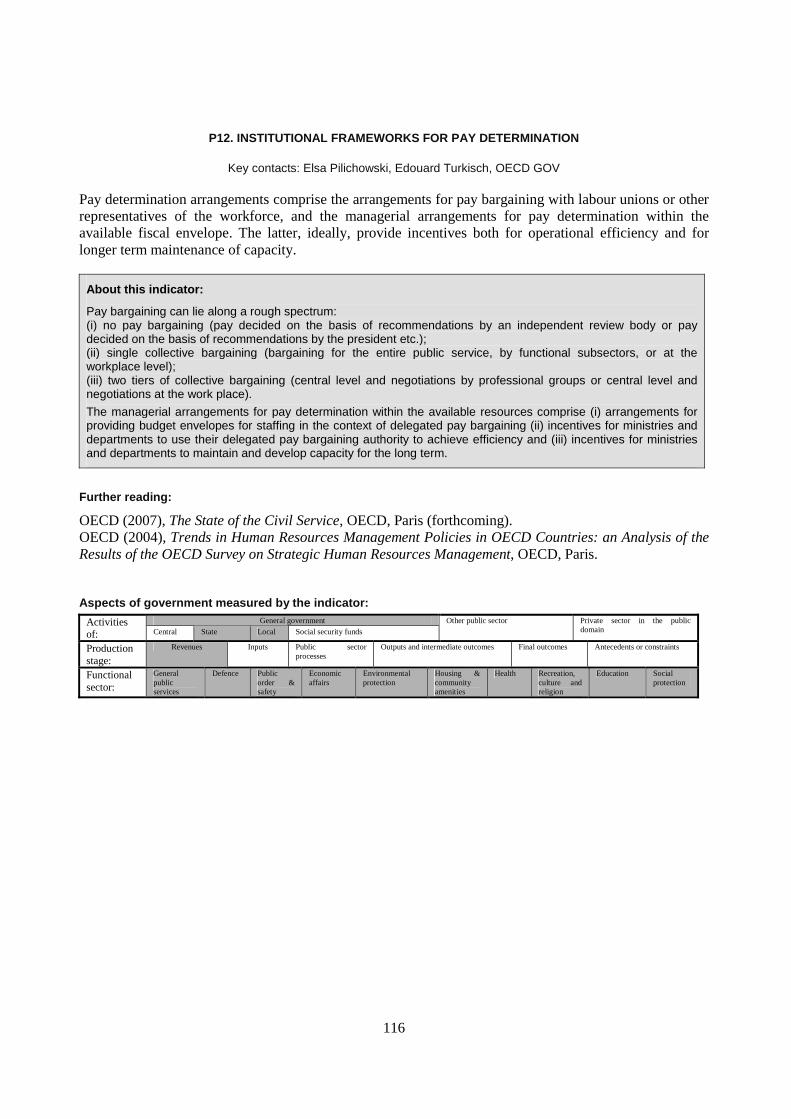
116
P12. INSTITUTIONAL FRAMEWORKS FOR PAY DETERMINATION
Key contacts: Elsa Pilichowski, Edouard Turkisch, OECD GOV
Pay determination arrangements comprise the arrangements for pay bargaining with labour unions or other representatives of the workforce, and the managerial arrangements for pay determination within the available fiscal envelope. The latter, ideally, provide incentives both for operational efficiency and for longer term maintenance of capacity.
About this indicator:
Pay bargaining can lie along a rough spectrum: (i) no pay bargaining (pay decided on the basis of recommendations by an independent review body or pay decided on the basis of recommendations by the president etc.); (ii) single collective bargaining (bargaining for the entire public service, by functional subsectors, or at the workplace level); (iii) two tiers of collective bargaining (central level and negotiations by professional groups or central level and negotiations at the work place).
The managerial arrangements for pay determination within the available resources comprise (i) arrangements for providing budget envelopes for staffing in the context of delegated pay bargaining (ii) incentives for ministries and departments to use their delegated pay bargaining authority to achieve efficiency and (iii) incentives for ministries and departments to maintain and develop capacity for the long term.
Further reading:
OECD (2007), The State of the Civil Service, OECD, Paris (forthcoming). OECD (2004), Trends in Human Resources Management Policies in OECD Countries: an Analysis of the Results of the OECD Survey on Strategic Human Resources Management, OECD, Paris.
Aspects of government measured by the indicator:
General government Activities of: Central State Local Social security funds
Other public sector Private sector in the public domain
Production stage:
Revenues Inputs Public sector processes
Outputs and intermediate outcomes Final outcomes Antecedents or constraints
Functional sector:
General public services
Defence Public order & safety
Economic affairs
Environmental protection
Housing & community amenities
Health Recreation, culture and religion
Education Social protection
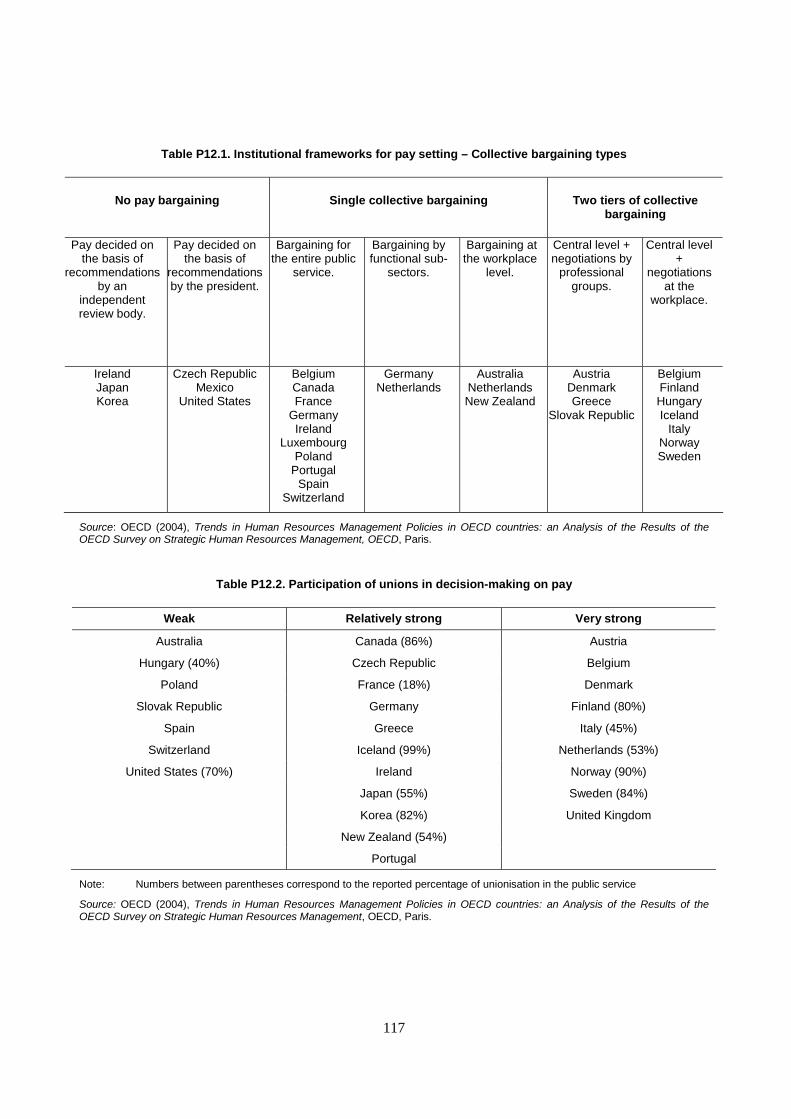
117
Table P12.1. Institutional frameworks for pay setting – Collective bargaining types
No pay bargaining Single collective bargaining Two tiers of collective bargaining
Pay decided on the basis of
recommendations by an
independent review body.
Pay decided on the basis of
recommendations by the president.
Bargaining for the entire public
service.
Bargaining by functional sub-
sectors.
Bargaining at the workplace
level.
Central level + negotiations by
professional groups.
Central level +
negotiations at the
workplace.
Ireland Japan Korea
Czech Republic Mexico
United States
Belgium Canada France
Germany Ireland
Luxembourg Poland
Portugal Spain
Switzerland
Germany Netherlands
Australia Netherlands New Zealand
Austria Denmark Greece
Slovak Republic
Belgium Finland Hungary Iceland
Italy Norway Sweden
Source: OECD (2004), Trends in Human Resources Management Policies in OECD countries: an Analysis of the Results of the OECD Survey on Strategic Human Resources Management, OECD, Paris.
Table P12.2. Participation of unions in decision-making on pay
Weak Relatively strong Very strong
Australia Canada (86%) Austria
Hungary (40%) Czech Republic Belgium
Poland France (18%) Denmark
Slovak Republic Germany Finland (80%)
Spain Greece Italy (45%)
Switzerland Iceland (99%) Netherlands (53%)
United States (70%) Ireland Norway (90%)
Japan (55%) Sweden (84%)
Korea (82%) United Kingdom
New Zealand (54%)
Portugal
Note: Numbers between parentheses correspond to the reported percentage of unionisation in the public service
Source: OECD (2004), Trends in Human Resources Management Policies in OECD countries: an Analysis of the Results of the OECD Survey on Strategic Human Resources Management, OECD, Paris.
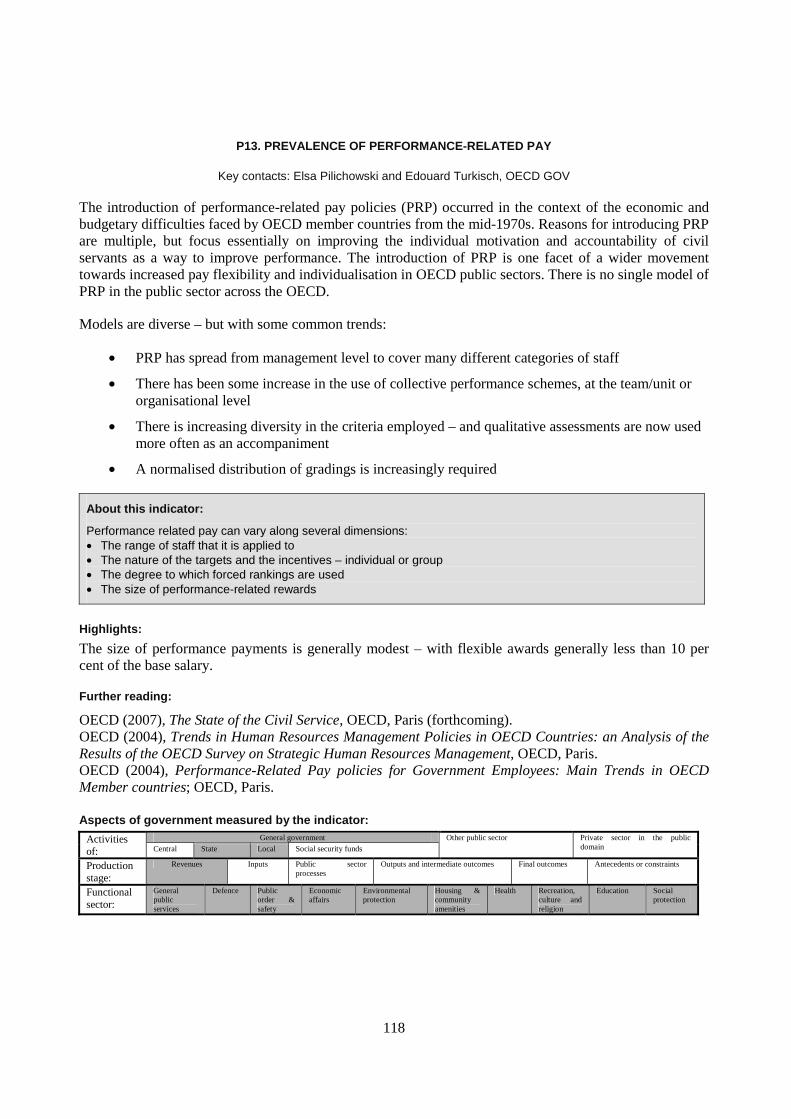
118
P13. PREVALENCE OF PERFORMANCE-RELATED PAY
Key contacts: Elsa Pilichowski and Edouard Turkisch, OECD GOV
The introduction of performance-related pay policies (PRP) occurred in the context of the economic and budgetary difficulties faced by OECD member countries from the mid-1970s. Reasons for introducing PRP are multiple, but focus essentially on improving the individual motivation and accountability of civil servants as a way to improve performance. The introduction of PRP is one facet of a wider movement towards increased pay flexibility and individualisation in OECD public sectors. There is no single model of PRP in the public sector across the OECD.
Models are diverse – but with some common trends:
• PRP has spread from management level to cover many different categories of staff
• There has been some increase in the use of collective performance schemes, at the team/unit or organisational level
• There is increasing diversity in the criteria employed – and qualitative assessments are now used more often as an accompaniment
• A normalised distribution of gradings is increasingly required
About this indicator:
Performance related pay can vary along several dimensions: • The range of staff that it is applied to • The nature of the targets and the incentives – individual or group • The degree to which forced rankings are used • The size of performance-related rewards
Highlights:
The size of performance payments is generally modest – with flexible awards generally less than 10 per cent of the base salary.
Further reading:
OECD (2007), The State of the Civil Service, OECD, Paris (forthcoming). OECD (2004), Trends in Human Resources Management Policies in OECD Countries: an Analysis of the Results of the OECD Survey on Strategic Human Resources Management, OECD, Paris. OECD (2004), Performance-Related Pay policies for Government Employees: Main Trends in OECD Member countries; OECD, Paris. Aspects of government measured by the indicator:
General government Activities of: Central State Local Social security funds
Other public sector Private sector in the public domain
Production stage:
Revenues Inputs Public sector processes
Outputs and intermediate outcomes Final outcomes Antecedents or constraints
Functional sector:
General public services
Defence Public order & safety
Economic affairs
Environmental protection
Housing & community amenities
Health Recreation, culture and religion
Education Social protection
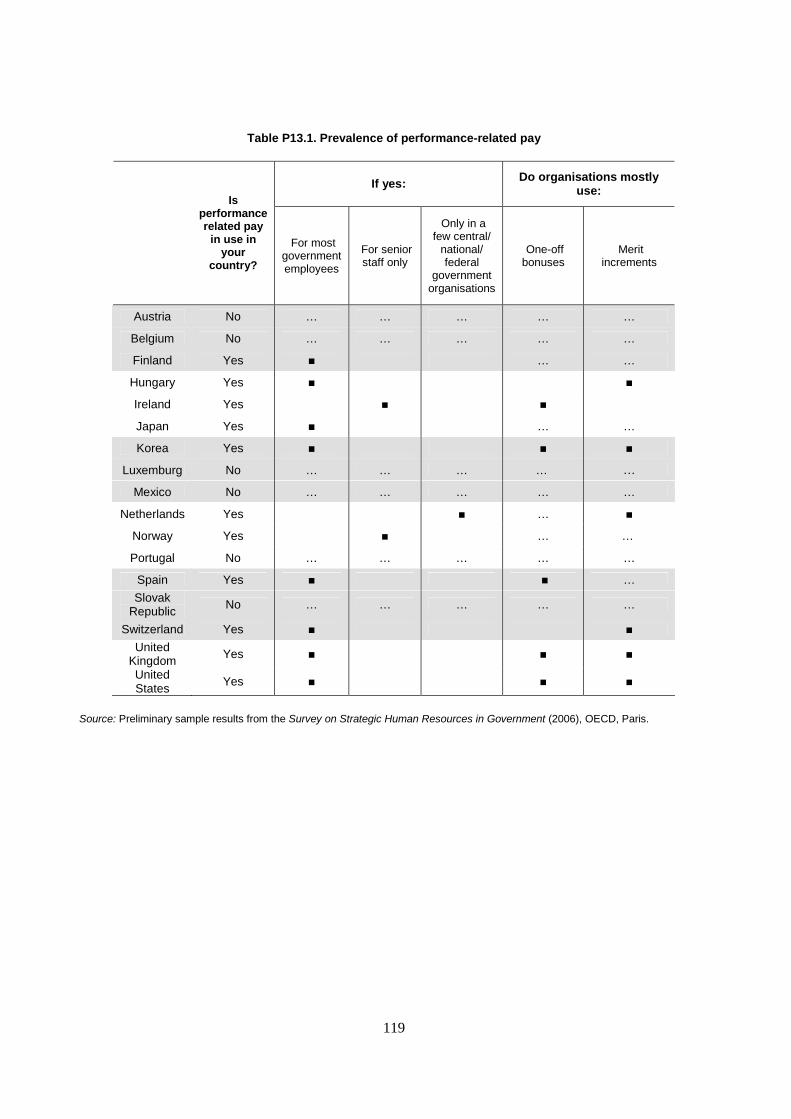
119
Table P13.1. Prevalence of performance-related pay
If yes: Do organisations mostly use:
Is performance related pay
in use in your
country?
For most government employees
For senior staff only
Only in a few central/
national/ federal
government organisations
One-off bonuses
Merit increments
Austria No … … … … …
Belgium No … … … … …
Finland Yes ■ … …
Hungary Yes ■ ■
Ireland Yes ■ ■
Japan Yes ■ … …
Korea Yes ■ ■ ■
Luxemburg No … … … … …
Mexico No … … … … …
Netherlands Yes ■ … ■
Norway Yes ■ … …
Portugal No … … … … …
Spain Yes ■ ■ …
Slovak Republic No … … … … …
Switzerland Yes ■ ■
United Kingdom Yes ■ ■ ■
United States
Yes ■ ■ ■
Source: Preliminary sample results from the Survey on Strategic Human Resources in Government (2006), OECD, Paris.
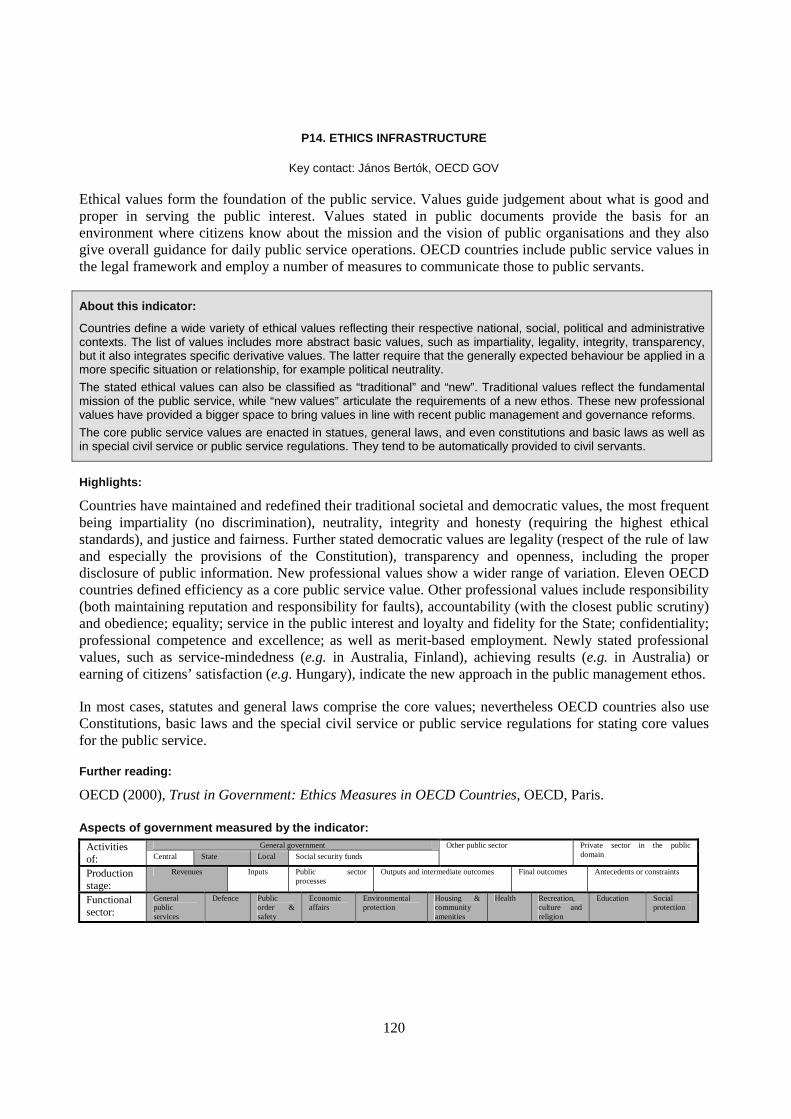
120
P14. ETHICS INFRASTRUCTURE
Key contact: János Bertók, OECD GOV
Ethical values form the foundation of the public service. Values guide judgement about what is good and proper in serving the public interest. Values stated in public documents provide the basis for an environment where citizens know about the mission and the vision of public organisations and they also give overall guidance for daily public service operations. OECD countries include public service values in the legal framework and employ a number of measures to communicate those to public servants.
About this indicator:
Countries define a wide variety of ethical values reflecting their respective national, social, political and administrative contexts. The list of values includes more abstract basic values, such as impartiality, legality, integrity, transparency, but it also integrates specific derivative values. The latter require that the generally expected behaviour be applied in a more specific situation or relationship, for example political neutrality.
The stated ethical values can also be classified as “traditional” and “new”. Traditional values reflect the fundamental mission of the public service, while “new values” articulate the requirements of a new ethos. These new professional values have provided a bigger space to bring values in line with recent public management and governance reforms.
The core public service values are enacted in statues, general laws, and even constitutions and basic laws as well as in special civil service or public service regulations. They tend to be automatically provided to civil servants.
Highlights:
Countries have maintained and redefined their traditional societal and democratic values, the most frequent being impartiality (no discrimination), neutrality, integrity and honesty (requiring the highest ethical standards), and justice and fairness. Further stated democratic values are legality (respect of the rule of law and especially the provisions of the Constitution), transparency and openness, including the proper disclosure of public information. New professional values show a wider range of variation. Eleven OECD countries defined efficiency as a core public service value. Other professional values include responsibility (both maintaining reputation and responsibility for faults), accountability (with the closest public scrutiny) and obedience; equality; service in the public interest and loyalty and fidelity for the State; confidentiality; professional competence and excellence; as well as merit-based employment. Newly stated professional values, such as service-mindedness (e.g. in Australia, Finland), achieving results (e.g. in Australia) or earning of citizens’ satisfaction (e.g. Hungary), indicate the new approach in the public management ethos.
In most cases, statutes and general laws comprise the core values; nevertheless OECD countries also use Constitutions, basic laws and the special civil service or public service regulations for stating core values for the public service.
Further reading:
OECD (2000), Trust in Government: Ethics Measures in OECD Countries, OECD, Paris. Aspects of government measured by the indicator:
General government Activities of: Central State Local Social security funds
Other public sector Private sector in the public domain
Production stage:
Revenues Inputs Public sector processes
Outputs and intermediate outcomes Final outcomes Antecedents or constraints
Functional sector:
General public services
Defence Public order & safety
Economic affairs
Environmental protection
Housing & community amenities
Health Recreation, culture and religion
Education Social protection
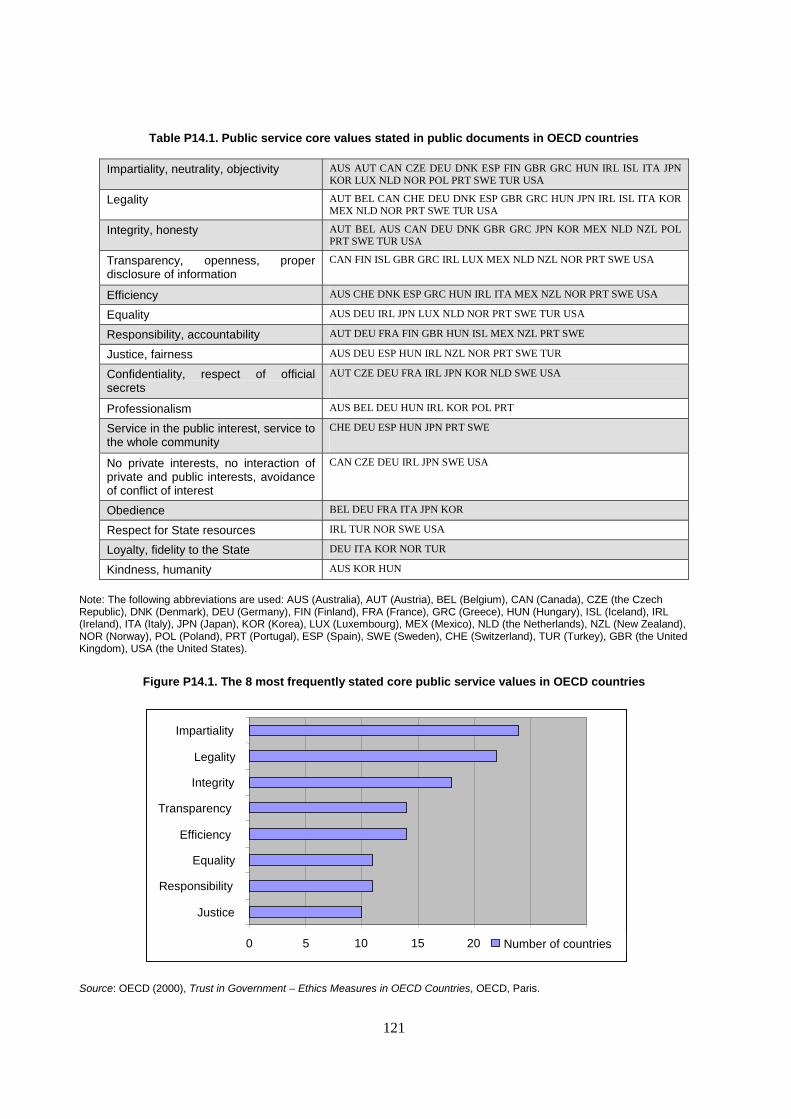
121
Table P14.1. Public service core values stated in public documents in OECD countries
Impartiality, neutrality, objectivity AUS AUT CAN CZE DEU DNK ESP FIN GBR GRC HUN IRL ISL ITA JPN KOR LUX NLD NOR POL PRT SWE TUR USA
Legality AUT BEL CAN CHE DEU DNK ESP GBR GRC HUN JPN IRL ISL ITA KOR MEX NLD NOR PRT SWE TUR USA
Integrity, honesty AUT BEL AUS CAN DEU DNK GBR GRC JPN KOR MEX NLD NZL POL PRT SWE TUR USA
Transparency, openness, proper disclosure of information
CAN FIN ISL GBR GRC IRL LUX MEX NLD NZL NOR PRT SWE USA
Efficiency AUS CHE DNK ESP GRC HUN IRL ITA MEX NZL NOR PRT SWE USA
Equality AUS DEU IRL JPN LUX NLD NOR PRT SWE TUR USA
Responsibility, accountability AUT DEU FRA FIN GBR HUN ISL MEX NZL PRT SWE
Justice, fairness AUS DEU ESP HUN IRL NZL NOR PRT SWE TUR
Confidentiality, respect of official secrets
AUT CZE DEU FRA IRL JPN KOR NLD SWE USA
Professionalism AUS BEL DEU HUN IRL KOR POL PRT
Service in the public interest, service to the whole community
CHE DEU ESP HUN JPN PRT SWE
No private interests, no interaction of private and public interests, avoidance of conflict of interest
CAN CZE DEU IRL JPN SWE USA
Obedience BEL DEU FRA ITA JPN KOR
Respect for State resources IRL TUR NOR SWE USA
Loyalty, fidelity to the State DEU ITA KOR NOR TUR
Kindness, humanity AUS KOR HUN
Note: The following abbreviations are used: AUS (Australia), AUT (Austria), BEL (Belgium), CAN (Canada), CZE (the Czech Republic), DNK (Denmark), DEU (Germany), FIN (Finland), FRA (France), GRC (Greece), HUN (Hungary), ISL (Iceland), IRL (Ireland), ITA (Italy), JPN (Japan), KOR (Korea), LUX (Luxembourg), MEX (Mexico), NLD (the Netherlands), NZL (New Zealand), NOR (Norway), POL (Poland), PRT (Portugal), ESP (Spain), SWE (Sweden), CHE (Switzerland), TUR (Turkey), GBR (the United Kingdom), USA (the United States).
Figure P14.1. The 8 most frequently stated core public service values in OECD countries
Source: OECD (2000), Trust in Government – Ethics Measures in OECD Countries, OECD, Paris.
0 5 10 15 20 25 30
Justice
Responsibility
Equality
Efficiency
Transparency
Integrity
Legality
Impartiality
Number of countries
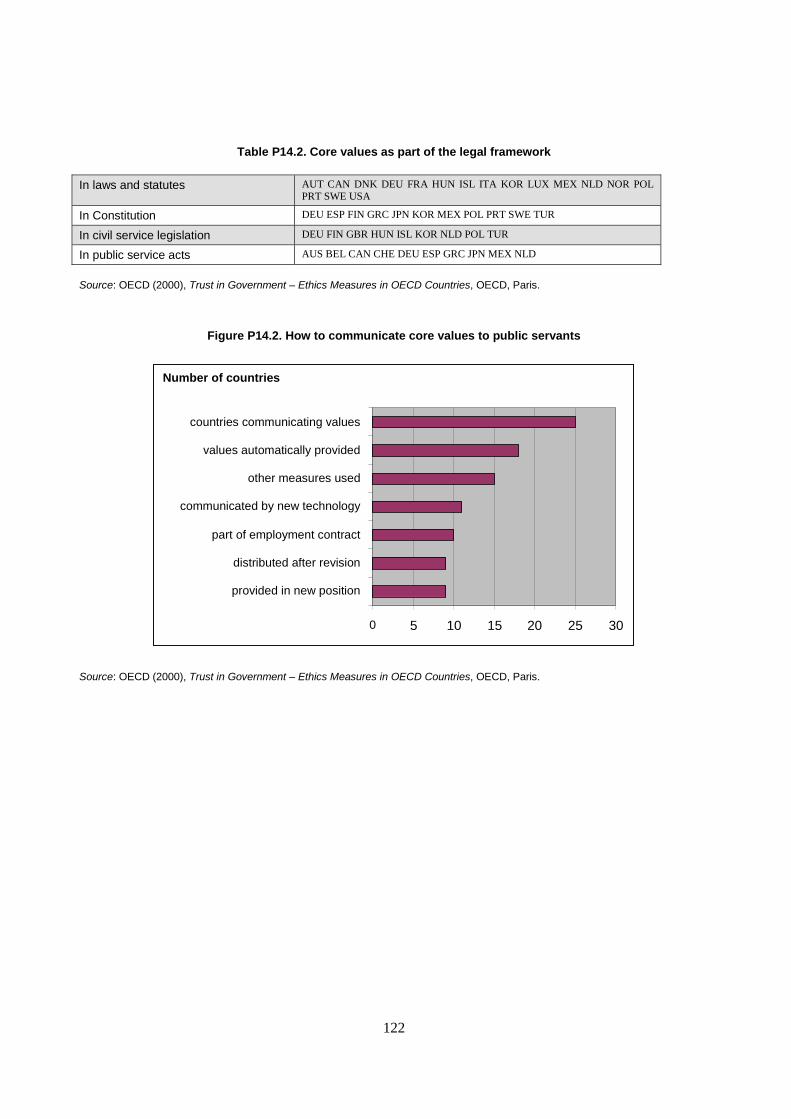
122
Table P14.2. Core values as part of the legal framework
In laws and statutes AUT CAN DNK DEU FRA HUN ISL ITA KOR LUX MEX NLD NOR POL PRT SWE USA
In Constitution DEU ESP FIN GRC JPN KOR MEX POL PRT SWE TUR
In civil service legislation DEU FIN GBR HUN ISL KOR NLD POL TUR
In public service acts AUS BEL CAN CHE DEU ESP GRC JPN MEX NLD
Source: OECD (2000), Trust in Government – Ethics Measures in OECD Countries, OECD, Paris.
Figure P14.2. How to communicate core values to public servants
Source: OECD (2000), Trust in Government – Ethics Measures in OECD Countries, OECD, Paris.
Number of countries
0 5 10 15 20 25 30
provided in new position
distributed after revision
part of employment contract
communicated by new technology
other measures used
values automatically provided
countries communicating values
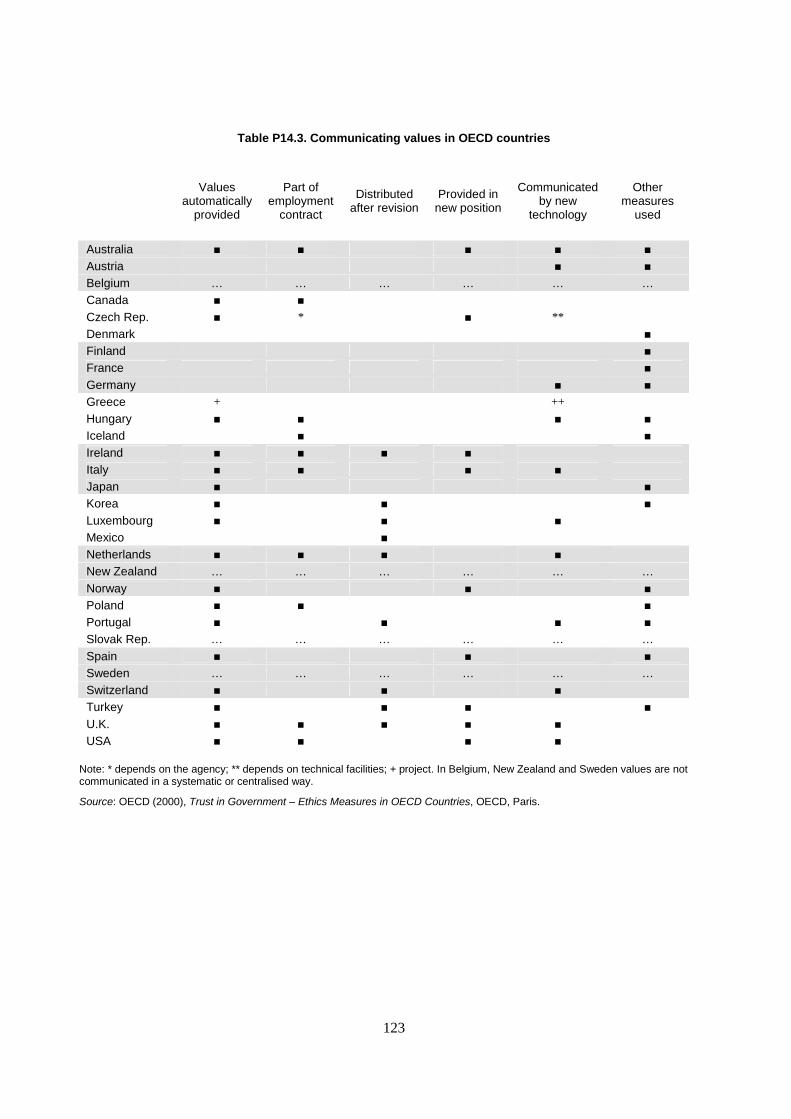
123
Table P14.3. Communicating values in OECD countries
Values
automatically provided
Part of employment
contract
Distributed after revision
Provided in new position
Communicated by new
technology
Other measures
used
Australia ■ ■ ■ ■ ■
Austria ■ ■
Belgium … … … … … … Canada ■ ■ Czech Rep. ■ * ■ ** Denmark ■
Finland ■
France ■
Germany ■ ■
Greece + ++ Hungary ■ ■ ■ ■
Iceland ■ ■
Ireland ■ ■ ■ ■ Italy ■ ■ ■ ■ Japan ■ ■
Korea ■ ■ ■
Luxembourg ■ ■ ■ Mexico ■ Netherlands ■ ■ ■ ■ New Zealand … … … … … … Norway ■ ■ ■
Poland ■ ■ ■
Portugal ■ ■ ■ ■
Slovak Rep. … … … … … … Spain ■ ■ ■
Sweden … … … … … … Switzerland ■ ■ ■ Turkey ■ ■ ■ ■
U.K. ■ ■ ■ ■ ■ USA ■ ■ ■ ■
Note: * depends on the agency; ** depends on technical facilities; + project. In Belgium, New Zealand and Sweden values are not communicated in a systematic or centralised way.
Source: OECD (2000), Trust in Government – Ethics Measures in OECD Countries, OECD, Paris.
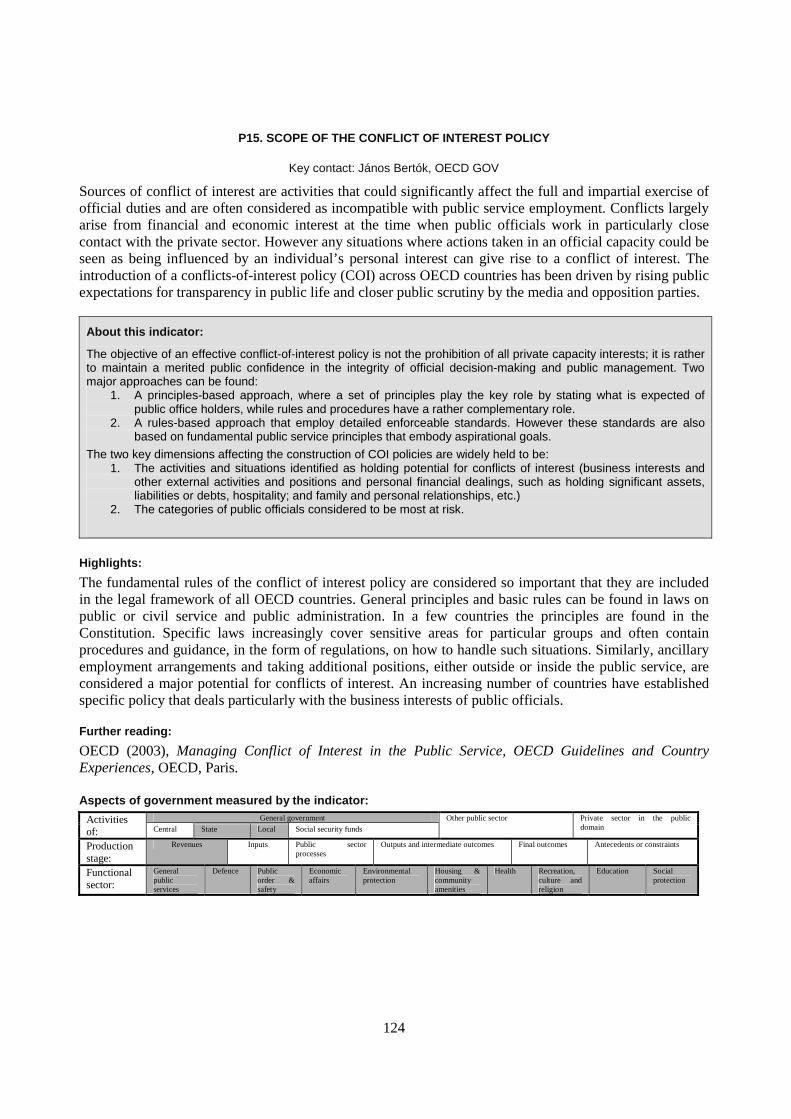
124
P15. SCOPE OF THE CONFLICT OF INTEREST POLICY
Key contact: János Bertók, OECD GOV
Sources of conflict of interest are activities that could significantly affect the full and impartial exercise of official duties and are often considered as incompatible with public service employment. Conflicts largely arise from financial and economic interest at the time when public officials work in particularly close contact with the private sector. However any situations where actions taken in an official capacity could be seen as being influenced by an individual’s personal interest can give rise to a conflict of interest. The introduction of a conflicts-of-interest policy (COI) across OECD countries has been driven by rising public expectations for transparency in public life and closer public scrutiny by the media and opposition parties.
About this indicator:
The objective of an effective conflict-of-interest policy is not the prohibition of all private capacity interests; it is rather to maintain a merited public confidence in the integrity of official decision-making and public management. Two major approaches can be found:
1. A principles-based approach, where a set of principles play the key role by stating what is expected of public office holders, while rules and procedures have a rather complementary role.
2. A rules-based approach that employ detailed enforceable standards. However these standards are also based on fundamental public service principles that embody aspirational goals.
The two key dimensions affecting the construction of COI policies are widely held to be: 1. The activities and situations identified as holding potential for conflicts of interest (business interests and
other external activities and positions and personal financial dealings, such as holding significant assets, liabilities or debts, hospitality; and family and personal relationships, etc.)
2. The categories of public officials considered to be most at risk.
Highlights:
The fundamental rules of the conflict of interest policy are considered so important that they are included in the legal framework of all OECD countries. General principles and basic rules can be found in laws on public or civil service and public administration. In a few countries the principles are found in the Constitution. Specific laws increasingly cover sensitive areas for particular groups and often contain procedures and guidance, in the form of regulations, on how to handle such situations. Similarly, ancillary employment arrangements and taking additional positions, either outside or inside the public service, are considered a major potential for conflicts of interest. An increasing number of countries have established specific policy that deals particularly with the business interests of public officials.
Further reading:
OECD (2003), Managing Conflict of Interest in the Public Service, OECD Guidelines and Country Experiences, OECD, Paris. Aspects of government measured by the indicator:
General government Activities of: Central State Local Social security funds
Other public sector Private sector in the public domain
Production stage:
Revenues Inputs Public sector processes
Outputs and intermediate outcomes Final outcomes Antecedents or constraints
Functional sector:
General public services
Defence Public order & safety
Economic affairs
Environmental protection
Housing & community amenities
Health Recreation, culture and religion
Education Social protection
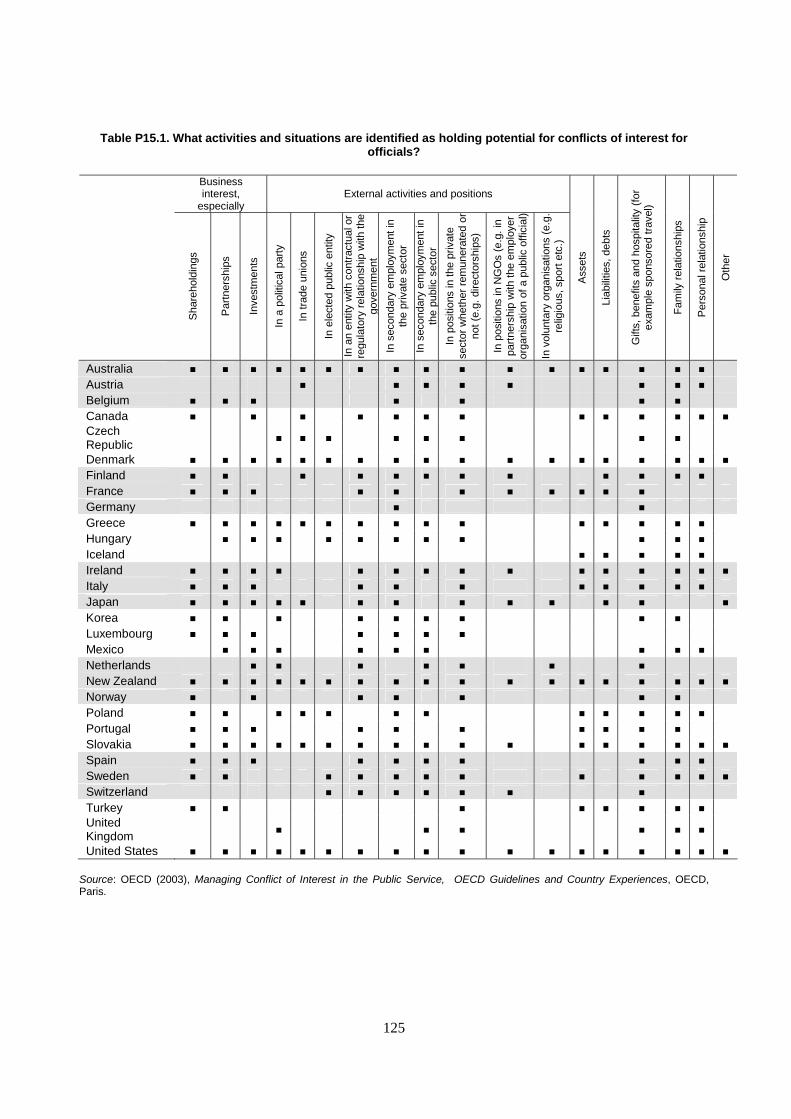
125
Table P15.1. What activities and situations are identified as holding potential for conflicts of interest for officials?
Business interest,
especially External activities and positions
Sha
reho
ldin
gs
Par
tner
ship
s
Inve
stm
ents
In a
pol
itica
l par
ty
In tr
ade
unio
ns
In e
lect
ed p
ublic
ent
ity
In a
n en
tity
with
con
trac
tual
or
regu
lato
ry r
elat
ions
hip
with
the
gove
rnm
ent
In s
econ
dary
em
ploy
men
t in
the
priv
ate
sect
or
In s
econ
dary
em
ploy
men
t in
the
publ
ic s
ecto
r
In p
ositi
ons
in th
e pr
ivat
e se
ctor
whe
ther
rem
uner
ated
or
not (
e.g.
dire
ctor
ship
s)
In p
ositi
ons
in N
GO
s (e
.g. i
n pa
rtne
rshi
p w
ith th
e em
ploy
er
orga
nisa
tion
of a
pub
lic o
ffici
al)
In v
olun
tary
org
anis
atio
ns (
e.g.
re
ligio
us, s
port
etc
.)
Ass
ets
Liab
ilitie
s, d
ebts
Gift
s, b
enef
its a
nd h
ospi
talit
y (f
or
exam
ple
spon
sore
d tr
avel
)
Fam
ily r
elat
ions
hips
Per
sona
l rel
atio
nshi
p
Oth
er
Australia ■ ■ ■ ■ ■ ■ ■ ■ ■ ■ ■ ■ ■ ■ ■ ■ ■
Austria ■ ■ ■ ■ ■ ■ ■ ■
Belgium ■ ■ ■ ■ ■ ■ ■
Canada ■ ■ ■ ■ ■ ■ ■ ■ ■ ■ ■ ■ ■
Czech Republic
■ ■ ■ ■ ■ ■ ■ ■
Denmark ■ ■ ■ ■ ■ ■ ■ ■ ■ ■ ■ ■ ■ ■ ■ ■ ■ ■
Finland ■ ■ ■ ■ ■ ■ ■ ■ ■ ■ ■ ■
France ■ ■ ■ ■ ■ ■ ■ ■ ■ ■ ■
Germany ■ ■
Greece ■ ■ ■ ■ ■ ■ ■ ■ ■ ■ ■ ■ ■ ■ ■
Hungary ■ ■ ■ ■ ■ ■ ■ ■ ■ ■ ■
Iceland ■ ■ ■ ■ ■
Ireland ■ ■ ■ ■ ■ ■ ■ ■ ■ ■ ■ ■ ■ ■ ■
Italy ■ ■ ■ ■ ■ ■ ■ ■ ■ ■ ■
Japan ■ ■ ■ ■ ■ ■ ■ ■ ■ ■ ■ ■ ■
Korea ■ ■ ■ ■ ■ ■ ■ ■ ■
Luxembourg ■ ■ ■ ■ ■ ■ ■
Mexico ■ ■ ■ ■ ■ ■ ■ ■ ■
Netherlands ■ ■ ■ ■ ■ ■ ■
New Zealand ■ ■ ■ ■ ■ ■ ■ ■ ■ ■ ■ ■ ■ ■ ■ ■ ■ ■
Norway ■ ■ ■ ■ ■ ■ ■
Poland ■ ■ ■ ■ ■ ■ ■ ■ ■ ■ ■ ■
Portugal ■ ■ ■ ■ ■ ■ ■ ■ ■ ■
Slovakia ■ ■ ■ ■ ■ ■ ■ ■ ■ ■ ■ ■ ■ ■ ■ ■ ■
Spain ■ ■ ■ ■ ■ ■ ■ ■ ■ ■
Sweden ■ ■ ■ ■ ■ ■ ■ ■ ■ ■ ■ ■
Switzerland ■ ■ ■ ■ ■ ■ ■
Turkey ■ ■ ■ ■ ■ ■ ■ ■
United Kingdom
■ ■ ■ ■ ■ ■
United States ■ ■ ■ ■ ■ ■ ■ ■ ■ ■ ■ ■ ■ ■ ■ ■ ■ ■
Source: OECD (2003), Managing Conflict of Interest in the Public Service, OECD Guidelines and Country Experiences, OECD, Paris.
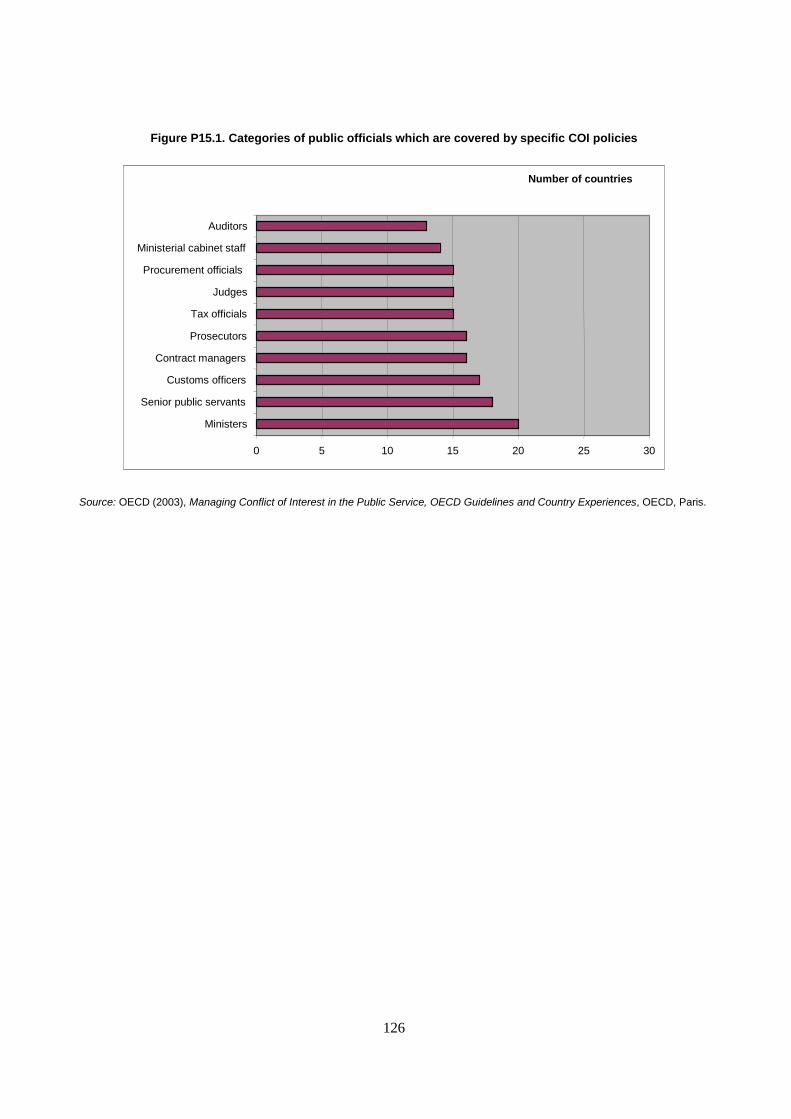
126
Figure P15.1. Categories of public officials which are covered by specific COI policies
Source: OECD (2003), Managing Conflict of Interest in the Public Service, OECD Guidelines and Country Experiences, OECD, Paris.
0 5 10 15 20 25 30
Ministers
Senior public servants
Customs officers
Contract managers
Prosecutors
Tax officials
Judges
Procurement officials
Ministerial cabinet staff
Auditors
Number of countries

127
128
P16. ENFORCING THE CONFLICT OF INTEREST POLICY
Key contact: János Bertók, OECD GOV
Consequences for breaching a COI Policy are either personal, including disciplinary actions and criminal prosecution or managerial, including the cancellation of an affected decision or contract. However, prevention is better than cure, in which measures such as effective provision of information and timely guidance for uncertain situations play key part.
About this indicator:
The key drivers of effective implementation and enforcement of a COI policy are widely held to be: 1. Comprehensive information on the policy 2. Ready access to guidance and consultation if in doubt 3. Explicit measures to resolve conflict-of-interest situations 4. Effective and credible sanction for breaching the conflict-of-interest policy.
Highlights:
In regard to the provision of information, common practice is to provide training and briefing public officials on existing regulations and policies in place. Induction training for new entrants is accompanied by in-service training in some countries. Countries also seek to institutionalise the provision of information on the COI policy by, for instance, including relevant standards in appointment contracts. While training and distribution of policy documents are the principal measures for awareness-raising, managers play a crucial role in creating a working environment with open communication between the employer and employees where the actual difficulties of implementation and COI policy can be openly raised and discussed. Managers also play a key role in monitoring compliance of staff with rules. Government organisations (for example the civil service department) and even external institutions (commissions, Auditor General, Ombudsman and even the Constitutional Court) take an overall interest in monitoring the implementation of conflict-of-interest policy and the compliance of the most senior officials. OECD countries mainly employ disciplinary actions and criminal prosecution along with the cancellation of affected decisions and contracts. Non-disclosure of conflict of interest is generally considered a serious breach, and it results in disciplinary action or even criminal penalties depending on the circumstances of the case. In specific cases, when political or senior post holders do not disclose their relevant personal interests, it may interrupt their career (loss of mandate for elected officials and resignation in case of appointed positions). Ministerial advisors, in addition to losing office, may also have to reimburse the remuneration they have received.
Further reading:
OECD (2003), Managing Conflict of Interest in the Public Service, OECD Guidelines and Country Experiences, OECD, Paris. Aspects of government measured by the indicator:
General government Activities of: Central State Local Social security funds
Other public sector Private sector in the public domain
Production stage:
Revenues Inputs Public sector processes
Outputs and intermediate outcomes Final outcomes Antecedents or constraints
Functional sector:
General public services
Defence Public order & safety
Economic affairs
Environmental protection
Housing & community amenities
Health Recreation, culture and religion
Education Social protection
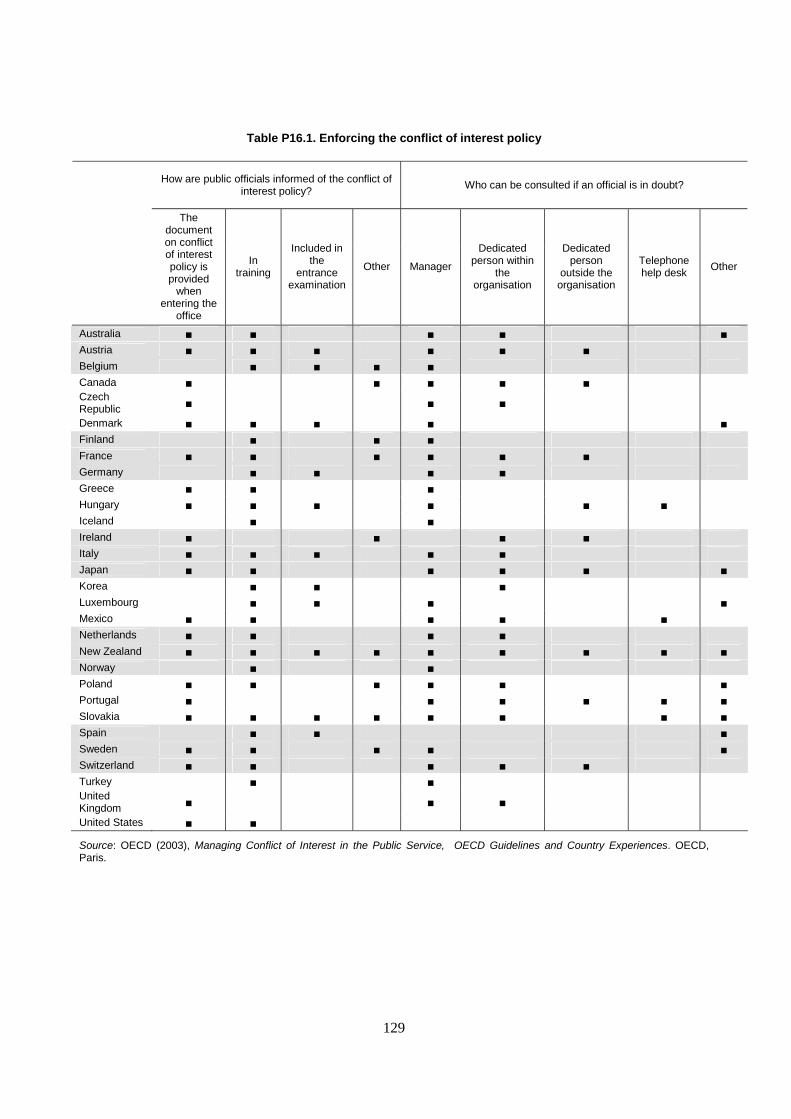
129
Table P16.1. Enforcing the conflict of interest policy
How are public officials informed of the conflict of interest policy?
Who can be consulted if an official is in doubt?
The document on conflict of interest policy is provided
when entering the
office
In training
Included in the
entrance examination
Other Manager
Dedicated person within
the organisation
Dedicated person
outside the organisation
Telephone help desk
Other
Australia ■ ■ ■ ■ ■ Austria ■ ■ ■ ■ ■ ■ Belgium ■ ■ ■ ■ Canada ■ ■ ■ ■ ■ Czech Republic ■ ■ ■
Denmark ■ ■ ■ ■ ■ Finland ■ ■ ■ France ■ ■ ■ ■ ■ ■ Germany ■ ■ ■ ■ Greece ■ ■ ■ Hungary ■ ■ ■ ■ ■ ■ Iceland ■ ■ Ireland ■ ■ ■ ■ Italy ■ ■ ■ ■ ■ Japan ■ ■ ■ ■ ■ ■ Korea ■ ■ ■ Luxembourg ■ ■ ■ ■ Mexico ■ ■ ■ ■ ■ Netherlands ■ ■ ■ ■ New Zealand ■ ■ ■ ■ ■ ■ ■ ■ ■ Norway ■ ■ Poland ■ ■ ■ ■ ■ ■ Portugal ■ ■ ■ ■ ■ ■ Slovakia ■ ■ ■ ■ ■ ■ ■ ■ Spain ■ ■ ■ Sweden ■ ■ ■ ■ ■ Switzerland ■ ■ ■ ■ ■ Turkey ■ ■ United Kingdom ■ ■ ■
United States ■ ■
Source: OECD (2003), Managing Conflict of Interest in the Public Service, OECD Guidelines and Country Experiences. OECD, Paris.
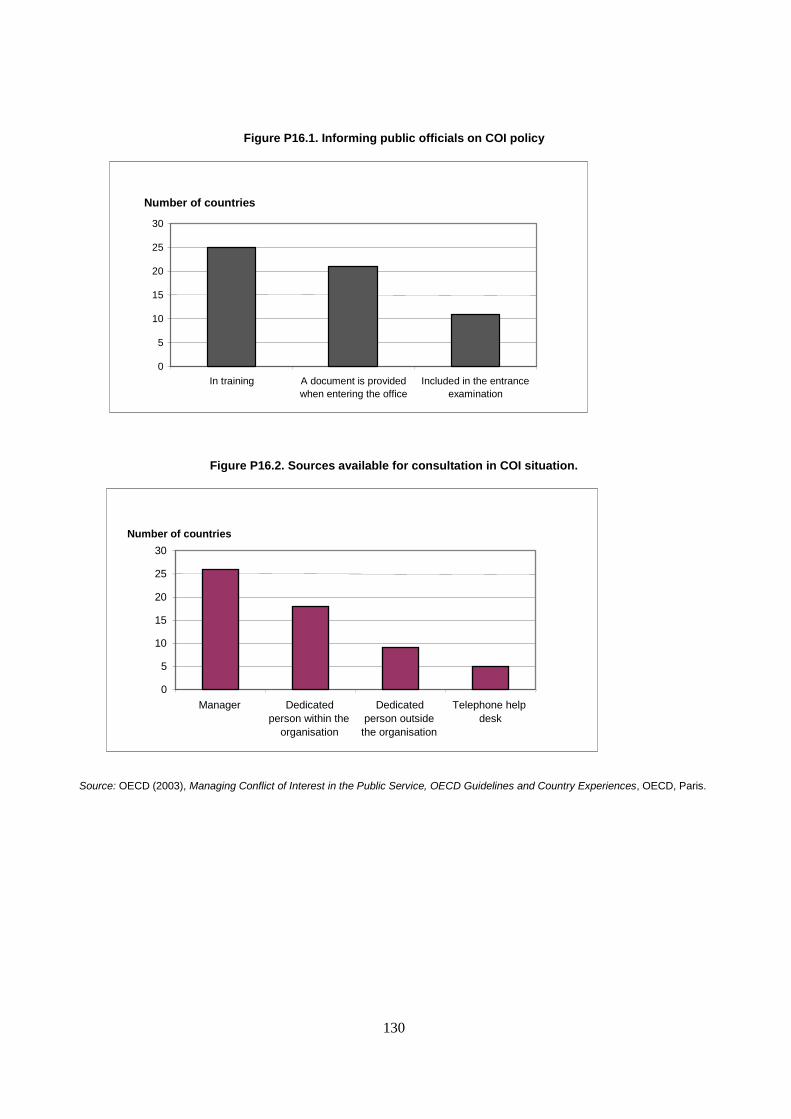
130
Figure P16.1. Informing public officials on COI policy
0
5
10
15
20
25
30
In training A document is provided when entering the office
Included in the entrance examination
Number of countries
Figure P16.2. Sources available for consultation in COI situation.
Source: OECD (2003), Managing Conflict of Interest in the Public Service, OECD Guidelines and Country Experiences, OECD, Paris.
0
5
10
15
20
25
30
Manager Dedicated person within the
organisation
Dedicated person outside
the organisation
Telephone help desk
Number of countries
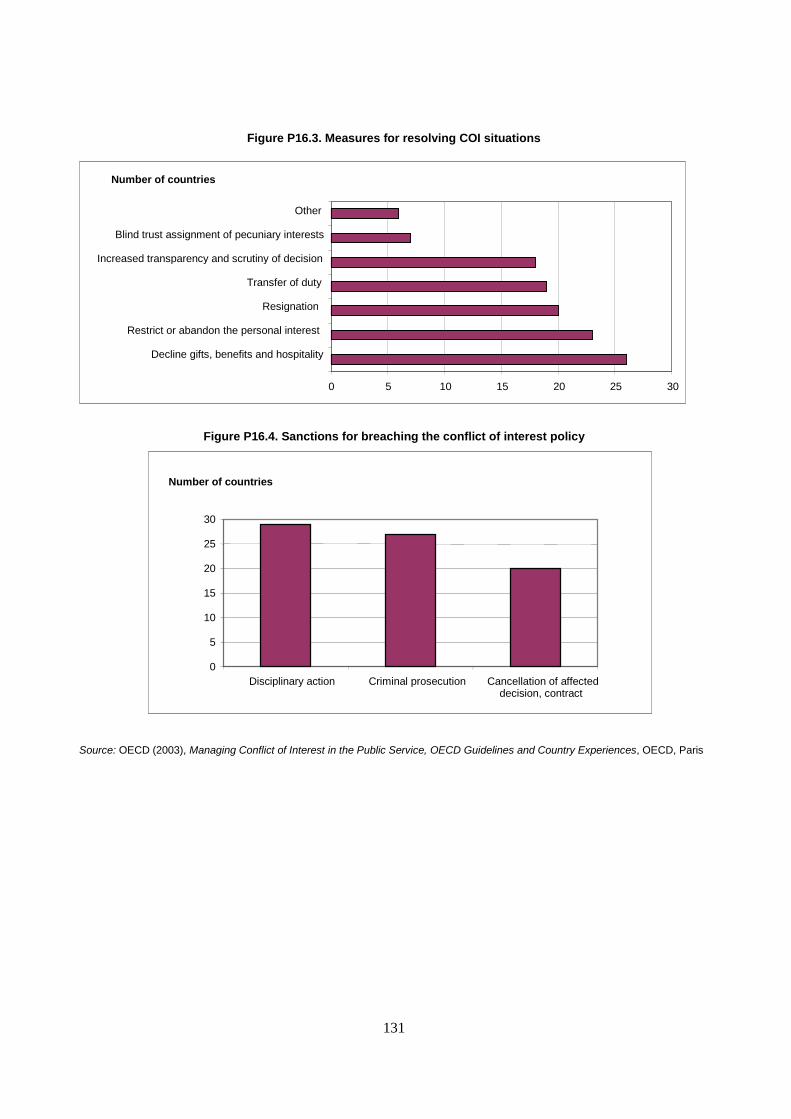
131
Figure P16.3. Measures for resolving COI situations
Figure P16.4. Sanctions for breaching the conflict of interest policy
Source: OECD (2003), Managing Conflict of Interest in the Public Service, OECD Guidelines and Country Experiences, OECD, Paris
0 5 10 15 20 25 30
Decline gifts, benefits and hospitality
Restrict or abandon the personal interest
Resignation
Transfer of duty
Increased transparency and scrutiny of decision
Blind trust assignment of pecuniary interests
Other
Number of countries
0
5
10
15
20
25
30
Disciplinary action Criminal prosecution Cancellation of affected decision, contract
Number of countries
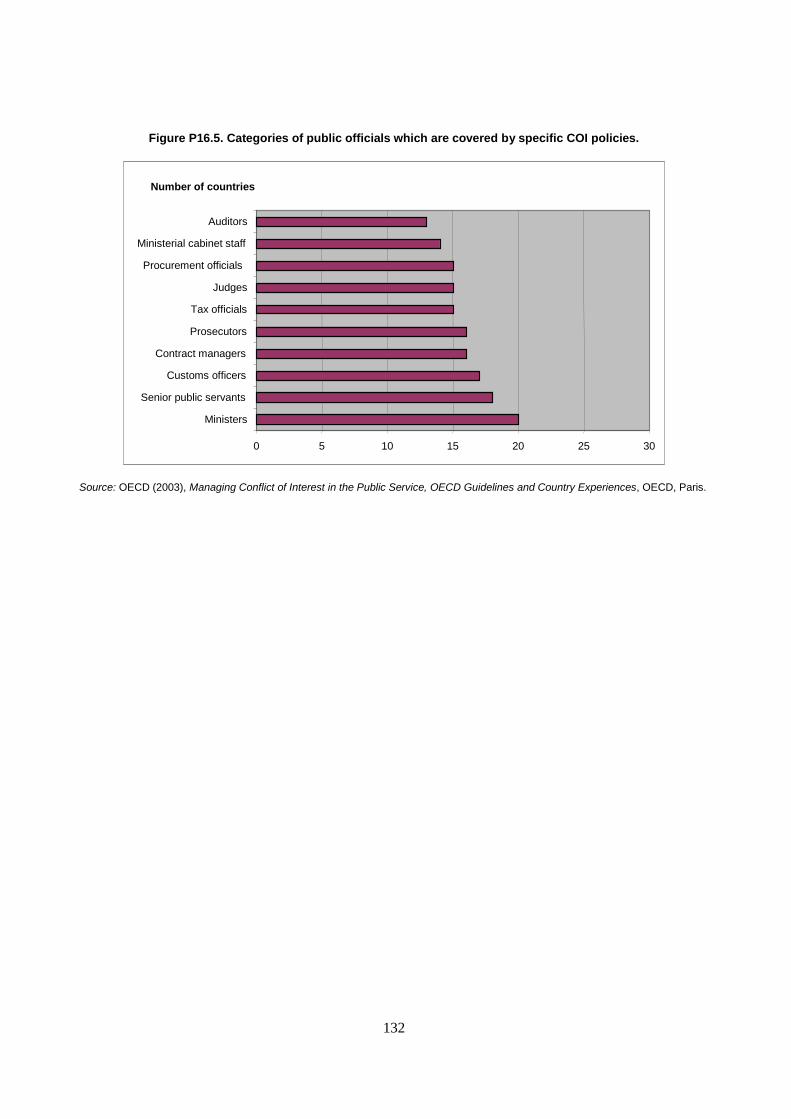
132
Figure P16.5. Categories of public officials which are covered by specific COI policies.
Source: OECD (2003), Managing Conflict of Interest in the Public Service, OECD Guidelines and Country Experiences, OECD, Paris.
0 5 10 15 20 25 30
Ministers
Senior public servants
Customs officers
Contract managers
Prosecutors
Tax officials
Judges
Procurement officials
Ministerial cabinet staff
Auditors
Number of countries

133
134
P17. CONFLICT OF INTEREST POLICIES FOR POST-PUBLIC EMPLOYMENT
Key contact: János Bertók, OECD GOV
Recent scandals have drawn attention to the importance of avoiding conflicts of interest which can arise when a public official leaves office for employment in the business or NGO sectors. The purpose is to ensure that former public office holders do not take improper advantage by misusing “insider information”, influence peddling or being rewarded for past decisions.
About this indicator:
The key drivers of an effective enforcement of a COI policy are widely held to be: 1. Clear specification of general prohibitions and restrictions of activities and situations holding potential for
conflicts of interest post employment for all public officials and specific prohibitions for risk areas. 2. Flexibility for tailored application of prohibitions (e.g. applying specified time limits) 3. Support measures for tracking and ensuring implementation.
Highlights:
83% of OECD countries set rules – principally in legislation – for avoiding conflict of interest in post-public employment. The general approach is to focus on public officials rather than on prospective employers (however France and the United States impose restrictions in the criminal code for the potential or new employer of former public officials) and set general prohibitions that are applicable to all public officials. Requesting information on post-public employment arrangements is an emerging trend in the OECD area. A quarter of countries requests information on proposed post-public employment arrangements on leaving public office. In addition, there is a “cooling-off” period on taking employment with any organisation with which the post-office holders had direct and significant official dealings during their last year in public office. In Poland it is up to one year, while in Canada a bill currently before the Senate proposes a five year period for public office holders in case of lobbying back their former organisation. The average time interval for a “cooling-off” period is one year, however some countries expand this period to two years (e.g. Greece) or even five years (e.g. France, Germany and Turkey). Prohibitions principally related to accepting future employment or appointment (e.g. to board of directors, advisory or supervisory bodies, etc.) and misusing “insider information”. Only a few countries have established procedures for facilitating the application of prohibitions and restrictions. For example Canada, Ireland, Portugal and Spain request officials to disclose future employment and require approval before taking up a new outside appointment. Countries exceptionally employ support measures for tracking and ensuring implementation of decisions, such as recording approval-decisions on individual cases, for example in Canada, France, Japan, Norway and the United Kingdom; making available past decisions for benchmarking, for example in Canada, France and Japan, and informing prospective employers of imposed restrictions and conditions, for example in Germany and the United Kingdom. Imposing suitable sanctions remain a key challenge for many countries
Further reading:
OECD (2006), Avoiding Conflict of Interest in Post-Public Employment: Comparative Overview of Prohibitions, Restrictions and Implementing Measures in OECD Countries, OECD, Paris. Aspects of government measured by the indicator:
General government Activities of: Central State Local Social security funds
Other public sector Private sector in the public domain
Production stage:
Revenues Inputs Public sector processes
Outputs and intermediate outcomes Final outcomes Antecedents or constraints
Functional sector:
General public services
Defence Public order & safety
Economic affairs
Environmental protection
Housing & community amenities
Health Recreation, culture and religion
Education Social protection
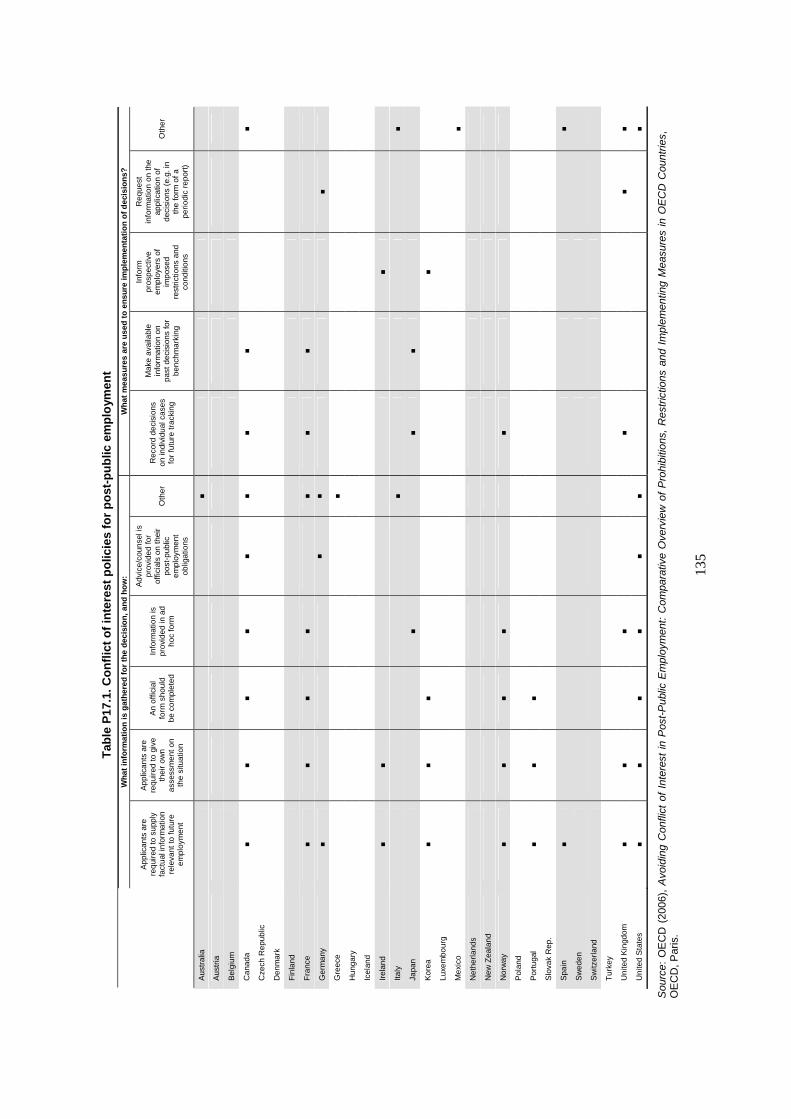
13
5
Tab
le P
17.1
. Co
nfl
ict
of
inte
rest
po
licie
s fo
r p
ost
-pu
blic
em
plo
ymen
t W
hat
info
rmat
ion
is g
ath
ered
fo
r th
e d
ecis
ion
, an
d h
ow
: W
hat
mea
sure
s ar
e u
sed
to
en
sure
imp
lem
enta
tio
n o
f d
ecis
ion
s?
App
lican
ts a
re
requ
ired
to s
uppl
y fa
ctua
l inf
orm
atio
n re
leva
nt to
futu
re
empl
oym
ent
App
lican
ts a
re
requ
ired
to g
ive
thei
r ow
n as
sess
men
t on
the
situ
atio
n
An
offic
ial
form
sho
uld
be c
ompl
eted
Info
rmat
ion
is
prov
ided
in a
d ho
c fo
rm
Adv
ice/
coun
sel i
s pr
ovid
ed fo
r of
ficia
ls o
n th
eir
post
-pub
lic
empl
oym
ent
oblig
atio
ns
Oth
er
Rec
ord
deci
sion
s on
indi
vidu
al c
ases
fo
r fu
ture
trac
king
Mak
e av
aila
ble
info
rmat
ion
on
past
dec
isio
ns fo
r be
nchm
arki
ng
Info
rm
pros
pect
ive
empl
oyer
s of
im
pose
d re
stric
tions
and
co
nditi
ons
Req
uest
in
form
atio
n on
the
appl
icat
ion
of
deci
sion
s (e
.g. i
n th
e fo
rm o
f a
perio
dic
repo
rt)
Oth
er
Aus
tral
ia
■
Aus
tria
Bel
gium
Can
ada
■ ■
■ ■
■ ■
■ ■
■
Cze
ch R
epub
lic
Den
mar
k
Fin
land
Fra
nce
■ ■
■ ■
■
■ ■
Ger
man
y ■
■
■
■
Gre
ece
■
Hun
gary
Icel
and
Irel
and
■ ■
■
Italy
■
■
Japa
n
■
■
■
Kor
ea
■ ■
■
■
Luxe
mbo
urg
Mex
ico
■
Net
herla
nds
New
Zea
land
Nor
way
■
■ ■
■
■
Pol
and
Por
tuga
l ■
■ ■
Slo
vak
Rep
.
Spa
in
■
■
Sw
eden
Sw
itzer
land
Tur
key
Uni
ted
Kin
gdom
■
■
■
■
■ ■
Uni
ted
Sta
tes
■ ■
■ ■
■ ■
■
Sou
rce:
OE
CD
(20
06),
Avo
idin
g C
onfli
ct o
f In
tere
st i
n P
ost-
Pub
lic E
mpl
oym
ent:
Com
para
tive
Ove
rvie
w o
f P
rohi
bitio
ns,
Res
tric
tions
and
Im
plem
entin
g M
easu
res
in O
EC
D C
ount
ries,
O
EC
D, P
aris
.
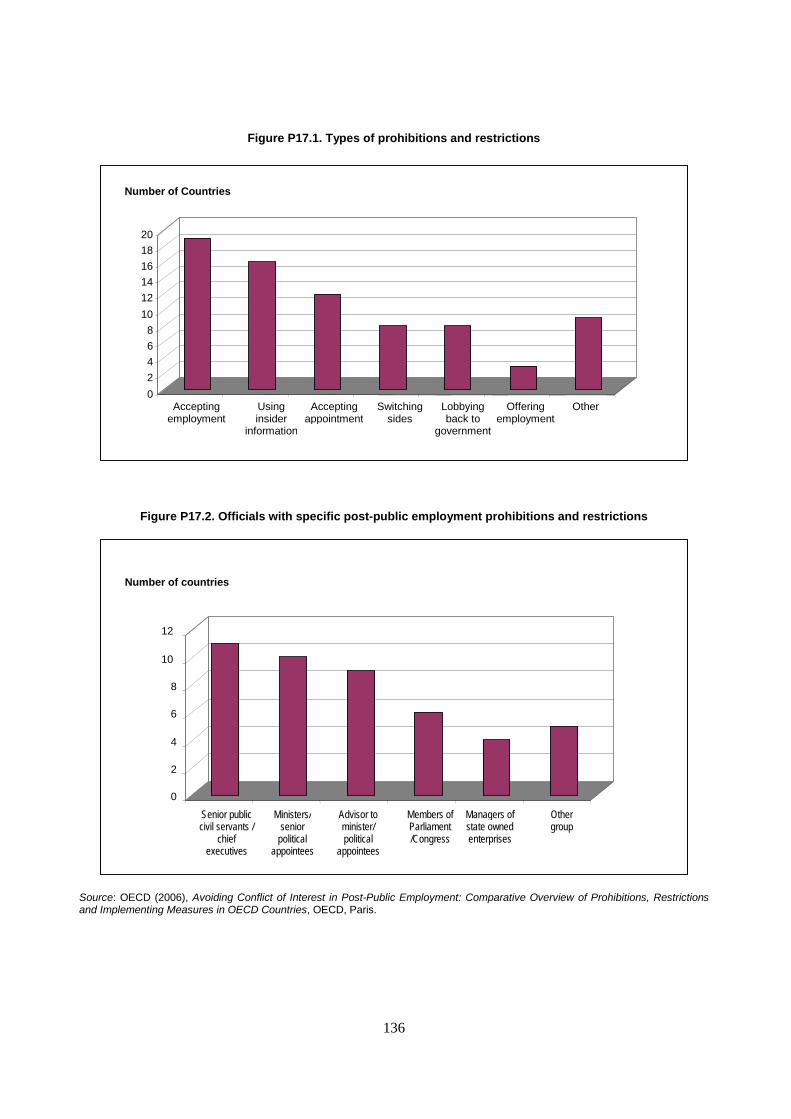
136
Figure P17.1. Types of prohibitions and restrictions
Figure P17.2. Officials with specific post-public employment prohibitions and restrictions
Source: OECD (2006), Avoiding Conflict of Interest in Post-Public Employment: Comparative Overview of Prohibitions, Restrictions and Implementing Measures in OECD Countries, OECD, Paris.
0
2
4
6
8
10
12
14
16
18
20
Number of Countries
Accepting employment
Using insider
information
Accepting appointment
Switching sides
Lobbying back to
government
Offering employment
Other
0
2
4
6
8
10
12
Number of countries
Senior public civil servants /
chief executives
Ministers/ senior
political appointees
Advisor to minister/ political
appointees
Members of Parliament /Congress
Managers of state owned enterprises
Other group
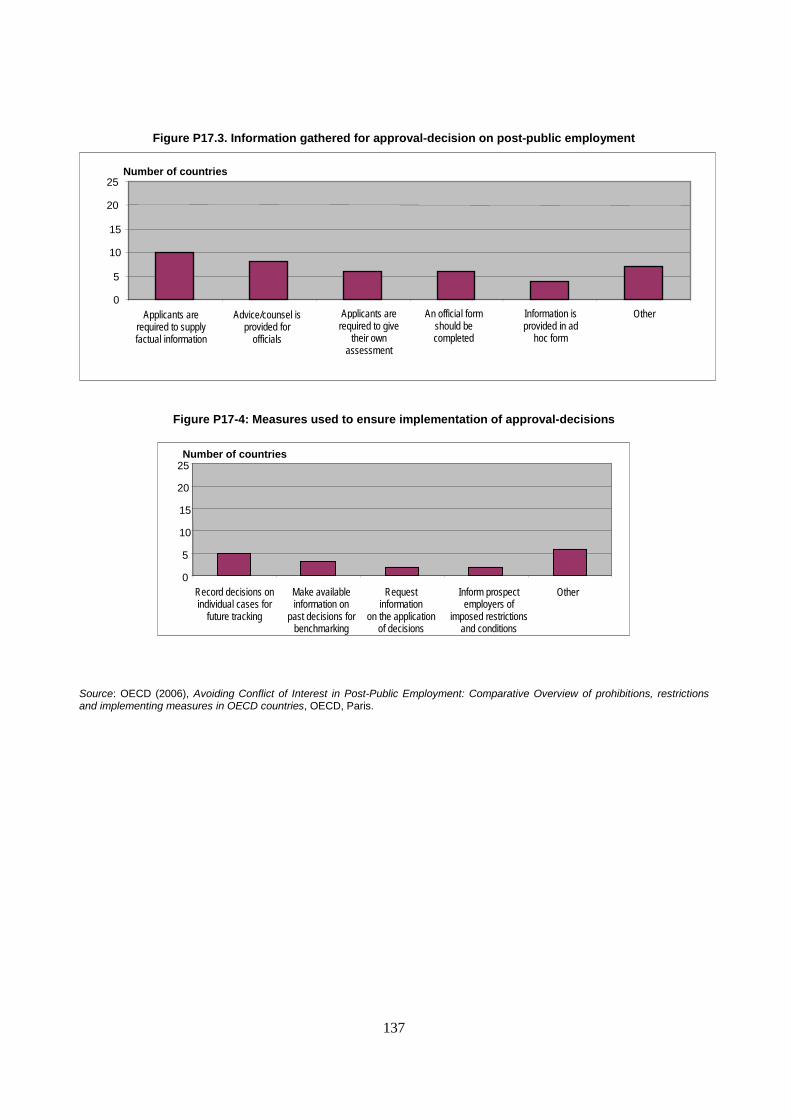
137
Figure P17.3. Information gathered for approval-decision on post-public employment
Figure P17-4: Measures used to ensure implementation of approval-decisions
Source: OECD (2006), Avoiding Conflict of Interest in Post-Public Employment: Comparative Overview of prohibitions, restrictions and implementing measures in OECD countries, OECD, Paris.
0
5
10
15
20
25
Applicants are required to supply factual information
Advice/counsel is provided for
officials
Applicants are required to give
their own assessment
An official form should be completed
Information is provided in ad
hoc form
Other
Number of countries
0
5
10
15
20
25
Record decisions on individual cases for
future tracking
Make available information on
past decisions for benchmarking
Request information
on the application of decisions
Inform prospect employers of
imposed restrictions and conditions
Other
Number of countries
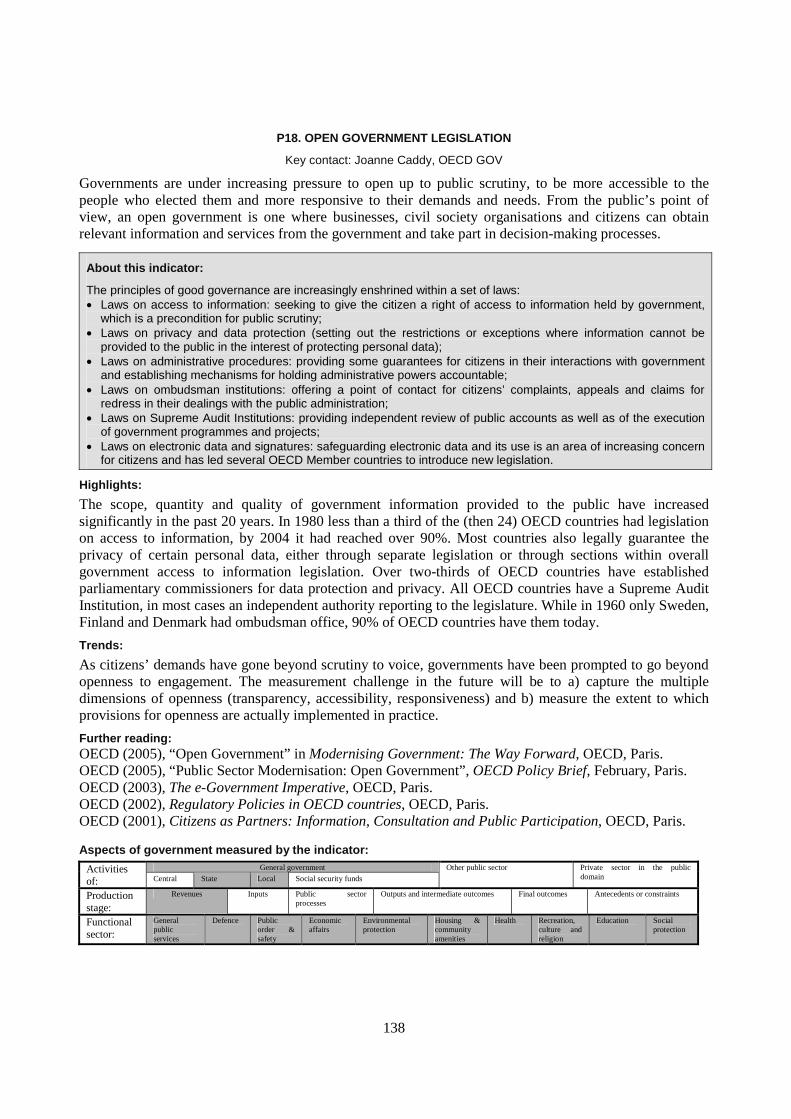
138
P18. OPEN GOVERNMENT LEGISLATION
Key contact: Joanne Caddy, OECD GOV
Governments are under increasing pressure to open up to public scrutiny, to be more accessible to the people who elected them and more responsive to their demands and needs. From the public’s point of view, an open government is one where businesses, civil society organisations and citizens can obtain relevant information and services from the government and take part in decision-making processes.
About this indicator:
The principles of good governance are increasingly enshrined within a set of laws: • Laws on access to information: seeking to give the citizen a right of access to information held by government,
which is a precondition for public scrutiny; • Laws on privacy and data protection (setting out the restrictions or exceptions where information cannot be
provided to the public in the interest of protecting personal data); • Laws on administrative procedures: providing some guarantees for citizens in their interactions with government
and establishing mechanisms for holding administrative powers accountable; • Laws on ombudsman institutions: offering a point of contact for citizens’ complaints, appeals and claims for
redress in their dealings with the public administration; • Laws on Supreme Audit Institutions: providing independent review of public accounts as well as of the execution
of government programmes and projects; • Laws on electronic data and signatures: safeguarding electronic data and its use is an area of increasing concern
for citizens and has led several OECD Member countries to introduce new legislation.
Highlights:
The scope, quantity and quality of government information provided to the public have increased significantly in the past 20 years. In 1980 less than a third of the (then 24) OECD countries had legislation on access to information, by 2004 it had reached over 90%. Most countries also legally guarantee the privacy of certain personal data, either through separate legislation or through sections within overall government access to information legislation. Over two-thirds of OECD countries have established parliamentary commissioners for data protection and privacy. All OECD countries have a Supreme Audit Institution, in most cases an independent authority reporting to the legislature. While in 1960 only Sweden, Finland and Denmark had ombudsman office, 90% of OECD countries have them today.
Trends:
As citizens’ demands have gone beyond scrutiny to voice, governments have been prompted to go beyond openness to engagement. The measurement challenge in the future will be to a) capture the multiple dimensions of openness (transparency, accessibility, responsiveness) and b) measure the extent to which provisions for openness are actually implemented in practice.
Further reading: OECD (2005), “Open Government” in Modernising Government: The Way Forward, OECD, Paris. OECD (2005), “Public Sector Modernisation: Open Government”, OECD Policy Brief, February, Paris. OECD (2003), The e-Government Imperative, OECD, Paris. OECD (2002), Regulatory Policies in OECD countries, OECD, Paris. OECD (2001), Citizens as Partners: Information, Consultation and Public Participation, OECD, Paris. Aspects of government measured by the indicator:
General government Activities of: Central State Local Social security funds
Other public sector Private sector in the public domain
Production stage:
Revenues Inputs Public sector processes
Outputs and intermediate outcomes Final outcomes Antecedents or constraints
Functional sector:
General public services
Defence Public order & safety
Economic affairs
Environmental protection
Housing & community amenities
Health Recreation, culture and religion
Education Social protection
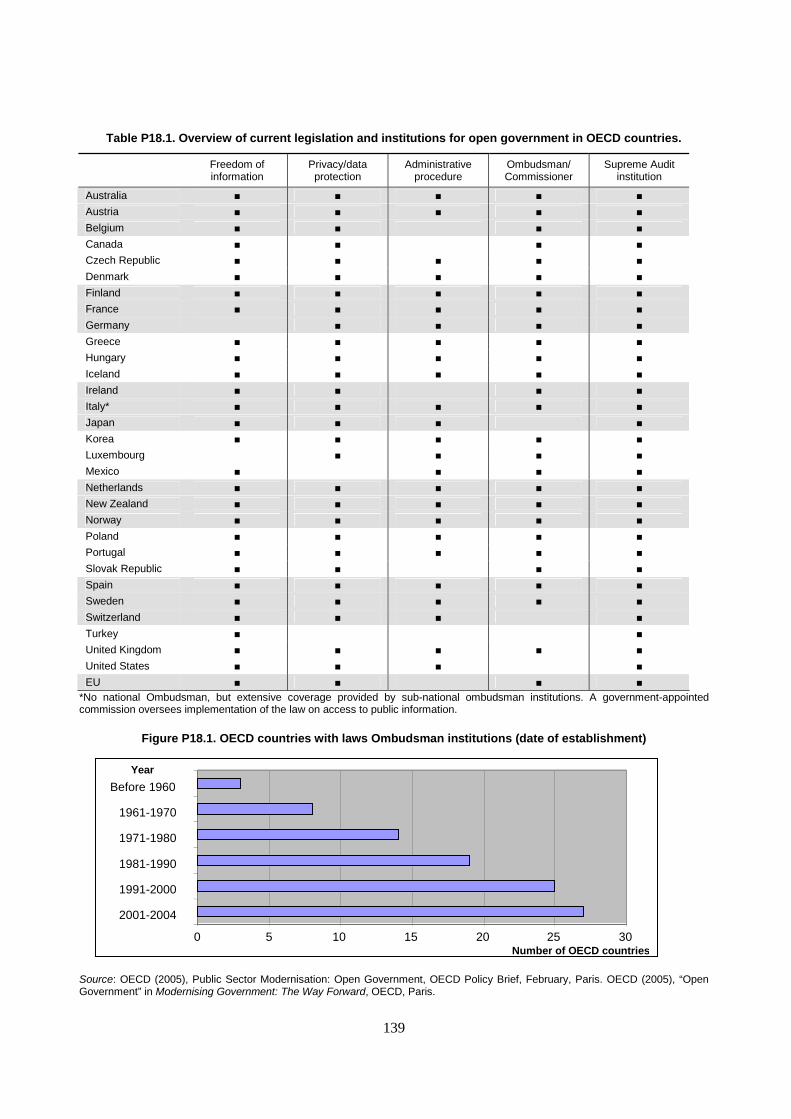
139
Table P18.1. Overview of current legislation and institutions for open government in OECD countries.
Freedom of information
Privacy/data protection
Administrative procedure
Ombudsman/ Commissioner
Supreme Audit institution
Australia ■ ■ ■ ■ ■
Austria ■ ■ ■ ■ ■
Belgium ■ ■ ■ ■
Canada ■ ■ ■ ■
Czech Republic ■ ■ ■ ■ ■
Denmark ■ ■ ■ ■ ■
Finland ■ ■ ■ ■ ■
France ■ ■ ■ ■ ■
Germany ■ ■ ■ ■
Greece ■ ■ ■ ■ ■
Hungary ■ ■ ■ ■ ■
Iceland ■ ■ ■ ■ ■
Ireland ■ ■ ■ ■
Italy* ■ ■ ■ ■ ■
Japan ■ ■ ■ ■
Korea ■ ■ ■ ■ ■
Luxembourg ■ ■ ■ ■
Mexico ■ ■ ■ ■
Netherlands ■ ■ ■ ■ ■
New Zealand ■ ■ ■ ■ ■
Norway ■ ■ ■ ■ ■
Poland ■ ■ ■ ■ ■
Portugal ■ ■ ■ ■ ■
Slovak Republic ■ ■ ■ ■
Spain ■ ■ ■ ■ ■
Sweden ■ ■ ■ ■ ■
Switzerland ■ ■ ■ ■
Turkey ■ ■
United Kingdom ■ ■ ■ ■ ■
United States ■ ■ ■ ■
EU ■ ■ ■ ■ *No national Ombudsman, but extensive coverage provided by sub-national ombudsman institutions. A government-appointed commission oversees implementation of the law on access to public information.
Figure P18.1. OECD countries with laws Ombudsman institutions (date of establishment)
Source: OECD (2005), Public Sector Modernisation: Open Government, OECD Policy Brief, February, Paris. OECD (2005), “Open Government” in Modernising Government: The Way Forward, OECD, Paris.
0 5 10 15 20 25 30
2001-2004
1991-2000
1981-1990
1971-1980
1961-1970
Before 1960
Year
Number of OECD countries
140
P19. TYPES OF PERFORMANCE MEASURES USED
Key contact: Teresa Curristine, OECD GOV
Performance – assessing it and improving it – has pre-occupied governments for at least half a century. Over the past two decades, public sector performance has taken on special urgency as OECD countries have faced recessions, mounting demands for more and better public services, and in some countries, citizens increasingly unwilling to pay higher taxes. Accompanying these pressures have been demands for more public accountability.
About this indicator:
Public sector performance reforms focus on government results, defined as outputs and outcomes of their activities. They aim at improving the efficiency, effectiveness and value for money of public activities. The evidence about performance that is collected and used systematically – called performance information - may be quantitative (numerical) or qualitative (descriptive). The usefulness of performance information is enhanced by applying standards and other types of comparison (for example, with past performance, other lines of business, or level of need) which allow judgments to be made about the extent to which interventions are achieving desired results: • Performance measures and indicators are particular values or characteristic used to measure output or outcomes. • Evaluations also provide information on performance but often include a more detailed review of attributes and
causality issues. Evaluations typically include recommendations on changes to activities or programmes, to improve performance.
• Benchmarking making comparisons within carefully selected parameters can sustain a productive debate about how and why things differ between settings and options for reform
Highlights:
Over the past two decades, there has been a renewed emphasis on performance measures (principally of outputs and outcomes) in budgeting and management. Countries appear to have recognised the dangers of concentrating only on outputs. It can give rise to goal displacement as agencies risk losing sight of the intended impact of their programmes on wider society, and concentrate on quantifiable activities at the expense of those that are less measurable. It can also result in less attention being paid to cross-cutting issues. While outcomes incorporate a wider focus on the impact of programmes on society and have greater appeal to politicians and the public, some are difficult to measure. Of the countries that developed performance measures, the majority produce a combination of outputs and outcomes.
Trends:
An increasing number of OECD countries are developing performance measures and of those that have already developed performance measures more are moving towards the development of outcomes.
Further reading:
OECD (2005), Modernizing Government: The way forward, OECD, Paris. Curristine, T (2005) “Performance Information in the Budget process: Results of OECD 2005 Questionnaire”, OECD Journal on Budgeting, Vol. 5, No. 2, OECD, Paris. Schick, A. (2003), “The Performing State: Reflection on an Idea whose Time Has Come but whose Implementation Has Not”, OECD Journal on Budgeting Vol. 3, No. 2, OECD, Paris. OECD/WB Budget Practices and Procedures Database, available at www.oecd.org/gov/budget. Aspects of government measured by the indicator:
General government Activities of: Central State Local Social security funds
Other public sector Private sector in the public domain
Production stage:
Revenues Inputs Public sector processes
Outputs and intermediate outcomes
Final outcomes
Antecedents or constraints
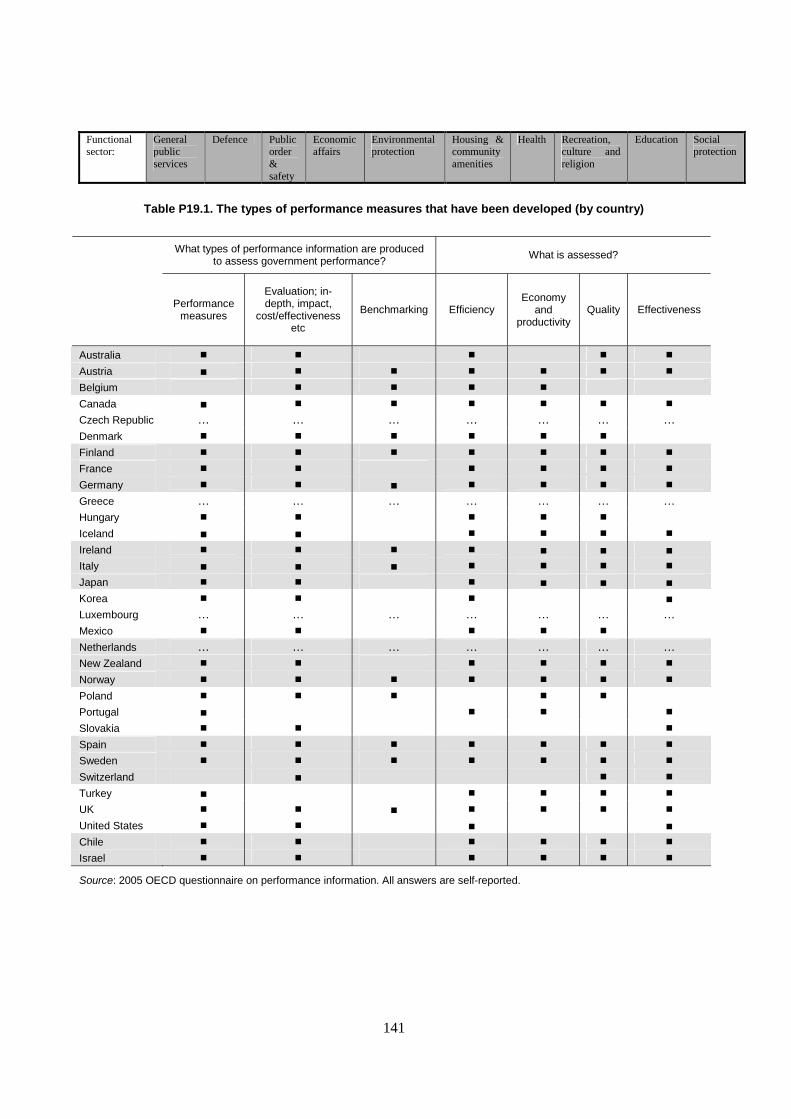
141
Functional sector:
General public services
Defence Public order & safety
Economic affairs
Environmental protection
Housing & community amenities
Health Recreation, culture and religion
Education Social protection
Table P19.1. The types of performance measures that have been developed (by country)
Source: 2005 OECD questionnaire on performance information. All answers are self-reported.
What types of performance information are produced to assess government performance?
What is assessed?
Performance
measures
Evaluation; in-depth, impact,
cost/effectiveness etc
Benchmarking Efficiency Economy
and productivity
Quality Effectiveness
Australia ■ ■ ■ ■ ■
Austria ■ ■ ■ ■ ■ ■ ■
Belgium ■ ■ ■ ■ Canada ■ ■ ■ ■ ■ ■ ■
Czech Republic … … … … … … … Denmark ■ ■ ■ ■ ■ ■ Finland ■ ■ ■ ■ ■ ■ ■
France ■ ■ ■ ■ ■ ■
Germany ■ ■ ■ ■ ■ ■ ■
Greece … … … … … … … Hungary ■ ■ ■ ■ ■ Iceland ■ ■ ■ ■ ■ ■
Ireland ■ ■ ■ ■ ■ ■ ■ Italy ■ ■ ■ ■ ■ ■ ■
Japan ■ ■ ■ ■ ■ ■ Korea ■ ■ ■ ■ Luxembourg … … … … … … … Mexico ■ ■ ■ ■ ■ Netherlands … … … … … … … New Zealand ■ ■ ■ ■ ■ ■
Norway ■ ■ ■ ■ ■ ■ ■
Poland ■ ■ ■ ■ ■ Portugal ■ ■ ■ ■
Slovakia ■ ■ ■
Spain ■ ■ ■ ■ ■ ■ ■
Sweden ■ ■ ■ ■ ■ ■ ■
Switzerland ■ ■ ■
Turkey ■ ■ ■ ■ ■
UK ■ ■ ■ ■ ■ ■ ■
United States ■ ■ ■ ■ Chile ■ ■ ■ ■ ■ ■
Israel ■ ■ ■ ■ ■ ■
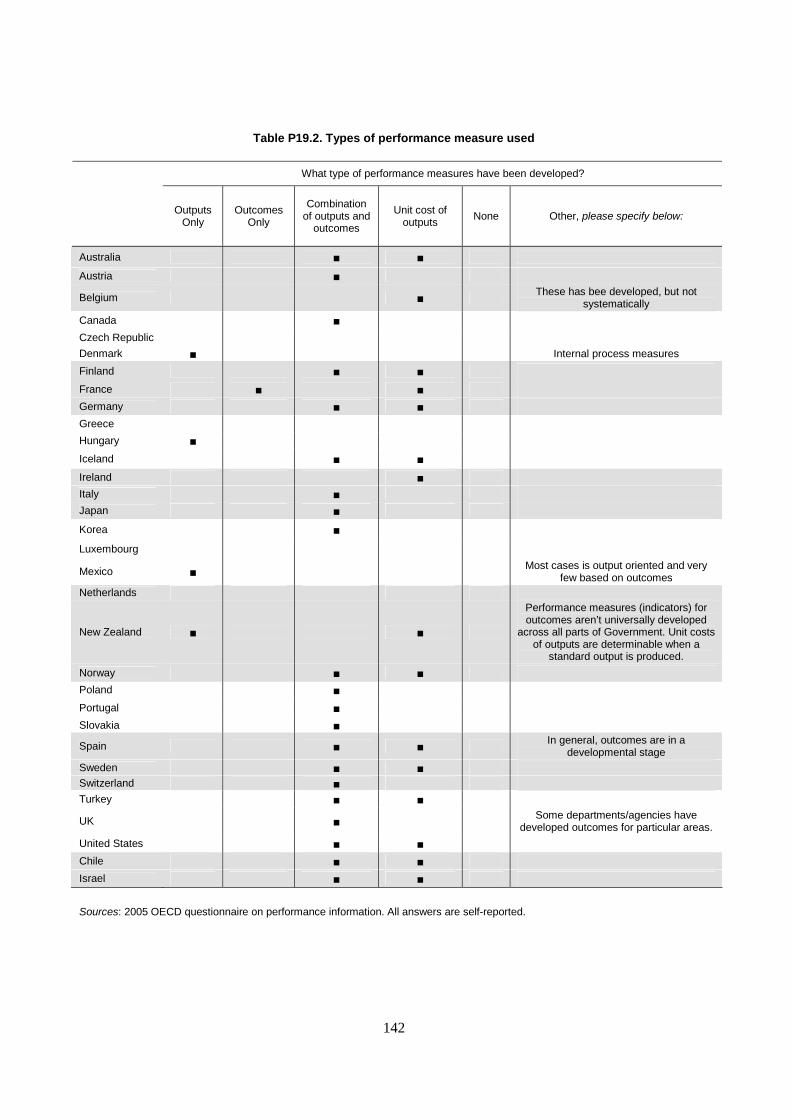
142
Table P19.2. Types of performance measure used
What type of performance measures have been developed?
Outputs
Only Outcomes
Only
Combination of outputs and
outcomes
Unit cost of outputs
None Other, please specify below:
Australia ■ ■
Austria ■
Belgium ■ These has bee developed, but not systematically
Canada ■
Czech Republic
Denmark ■ Internal process measures
Finland ■ ■
France ■ ■ Germany ■ ■ Greece Hungary ■
Iceland ■ ■
Ireland ■ Italy ■ Japan ■
Korea ■
Luxembourg
Mexico ■ Most cases is output oriented and very few based on outcomes
Netherlands
New Zealand ■ ■
Performance measures (indicators) for outcomes aren’t universally developed
across all parts of Government. Unit costs of outputs are determinable when a
standard output is produced.
Norway ■ ■
Poland ■
Portugal ■
Slovakia ■
Spain ■ ■ In general, outcomes are in a developmental stage
Sweden ■ ■ Switzerland ■
Turkey ■ ■
UK ■ Some departments/agencies have developed outcomes for particular areas.
United States ■ ■ Chile ■ ■ Israel ■ ■
Sources: 2005 OECD questionnaire on performance information. All answers are self-reported.
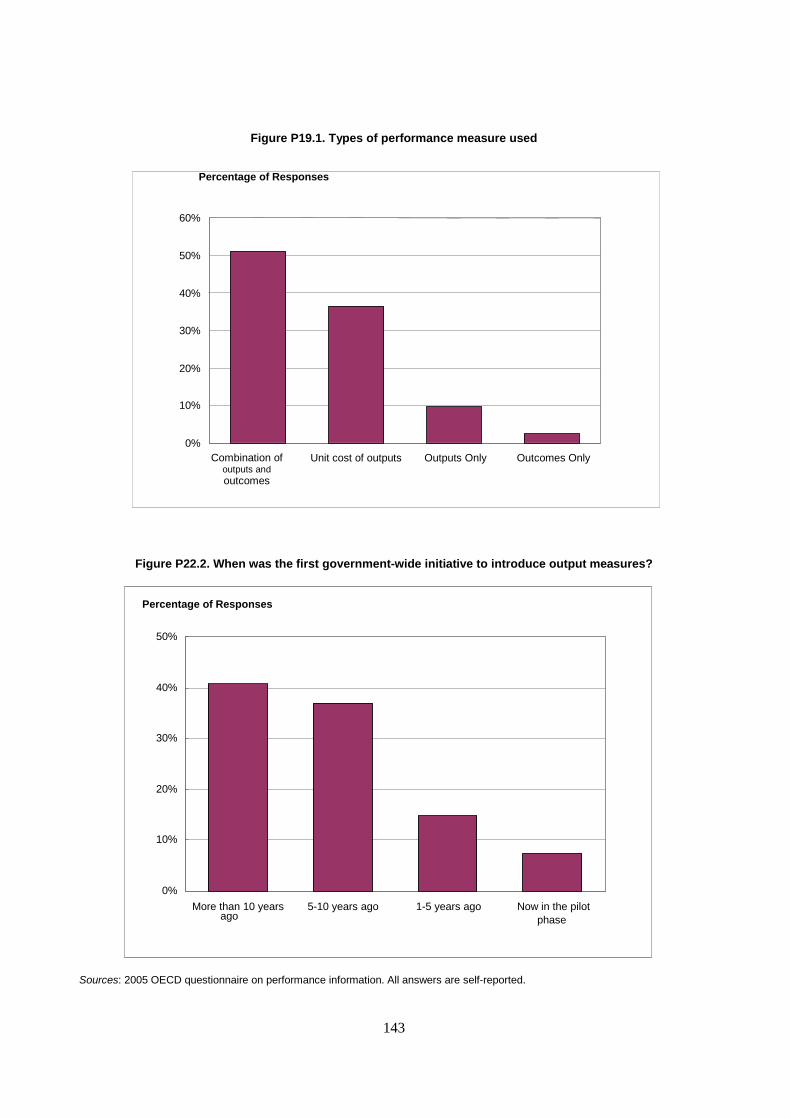
143
Figure P19.1. Types of performance measure used
Figure P22.2. When was the first government-wide initiative to introduce output measures?
Sources: 2005 OECD questionnaire on performance information. All answers are self-reported.
0%
10%
20%
30%
40%
50%
60%
Combination of outputs and outcomes
Unit cost of outputs Outputs Only Outcomes Only
Percentage of Responses
0%
10%
20%
30%
40%
50%
More than 10 years ago
5-10 years ago 1-5 years ago Now in the pilot phase
Percentage of Responses
144
P20. ROLES AND RESPONSIBILITIES IN PERFORMANCE MANAGEMENT SYSTEM
Key contacts: Teresa Curristine, OECD GOV
There is a wide variation in the formal role played by central agencies in OECD countries in the development and implementation of performance approaches to budgeting and management. This varies from countries where the Ministry of Finance (MOF) has no involvement to ones where it is the main designer and manager of the performance system. Some countries have combined introducing performance management with delegating responsibilities within ministries and to agencies on the theory that managers need more freedom to use resources if they are to achieve results.
About this indicator:
Performance management system covers corporate management based on performance information, performance evaluation, monitoring, assessment and performance reporting. In a stricter definition, it can be defined as such management cycle under which programme performance objectives and targets are determined, managers have flexibility to achieve them, actual performance is measured and reported, and this information feeds into decisions about programme funding, design, operations and rewards or penalties. Performance budgeting can be broadly defined as any budget that presents information on what agencies have done or expect to do with the money provided. A strict definition of performance budgeting, however, is a form of budgeting that relates funds allocated to measurable results.
Highlights:
The most common responsibility for the ministries of finance is providing horizontal support for developing performance measures. This is closely followed by their role of applying performance results in resource allocation and/or programme or policy decisions and the monitoring of progress against targets. Spending ministries have a strong role in developing and setting performance measures, monitoring progress and applying performance results in resource allocation and/or programme and policy decisions. The relevant spending ministry and the national audit body play the greatest role in commissioning evaluations. As the results show, in 32 % of countries spending ministries develop their own performance measures and set their own targets and there is no involvement of the MOF or other central agencies. In 48% of countries, the MOF agrees either the performance targets (16%) or both the targets and measures developed by spending ministries (32%). Moreover, neither do the majority of MOFs have a unit in charge of setting/monitoring performance measures of spending ministries. Only 37% of responding countries have a specific unit in their MOF.
Further reading:
OECD (2005), Modernizing Government: The Way Forward, OECD, Paris. OECD (2005), Curristine, T (2005), Performance Information in the Budget process: Results of OECD 2005 Questionnaire, OECD Journal on Budgeting, Vol. 5, No. 2, OECD, Paris. Schick, A. (2003), “The Performing State: Reflection on an Idea whose time has come but whose Implementation has not”, OECD Journal on Budgeting Vol. 3, No. 2, OECD, Paris. OECD/WB Budget Practices and Procedures Database, available at www.oecd.org/gov/budget. Aspects of government measured by the indicator:
General government Activities of: Central State Local Social security funds
Other public sector Private sector in the public domain
Production stage:
Revenues Inputs Public sector processes
Outputs and intermediate outcomes Final outcomes Antecedents or constraints
Functional sector:
General public services
Defence Public order & safety
Economic affairs
Environmental protection
Housing & community amenities
Health Recreation, culture and religion
Education Social protection
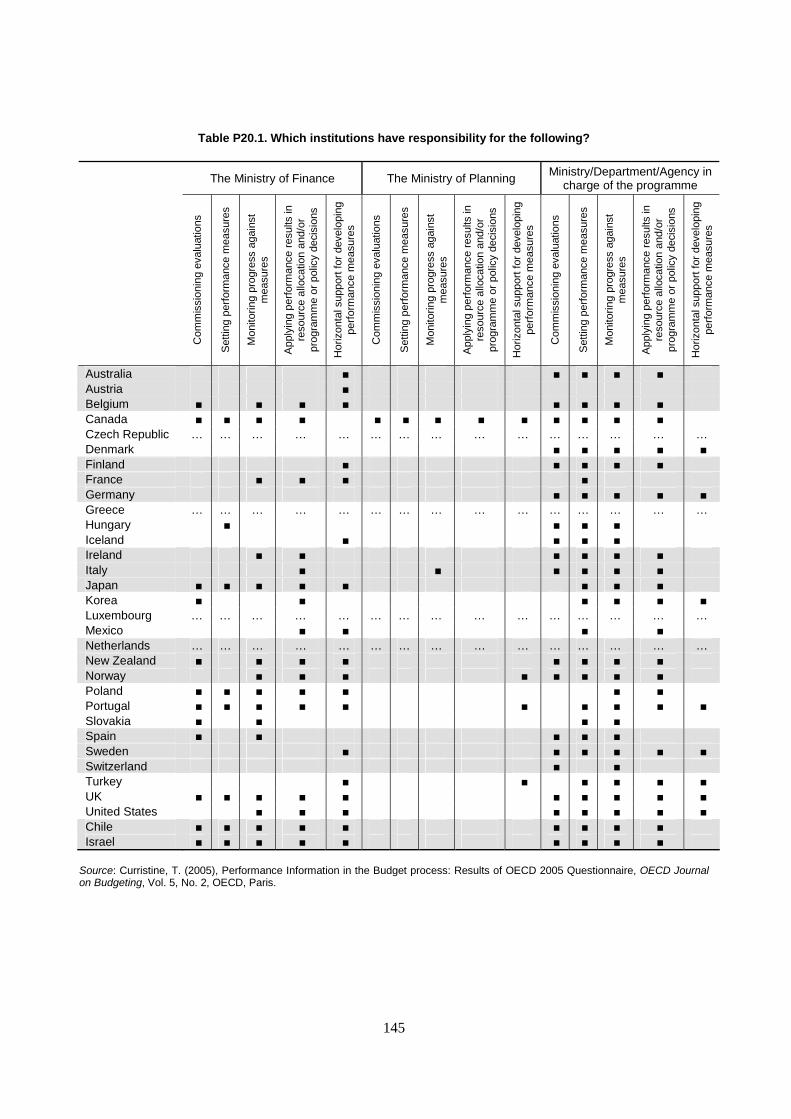
145
Table P20.1. Which institutions have responsibility for the following?
The Ministry of Finance The Ministry of Planning Ministry/Department/Agency in charge of the programme
Com
mis
sion
ing
eval
uatio
ns
Set
ting
perf
orm
ance
mea
sure
s
Mon
itorin
g pr
ogre
ss a
gain
st
mea
sure
s
App
lyin
g pe
rfor
man
ce r
esul
ts in
re
sour
ce a
lloca
tion
and/
or
prog
ram
me
or p
olic
y de
cisi
ons
Hor
izon
tal s
uppo
rt fo
r de
velo
ping
pe
rfor
man
ce m
easu
res
Com
mis
sion
ing
eval
uatio
ns
Set
ting
perf
orm
ance
mea
sure
s
Mon
itorin
g pr
ogre
ss a
gain
st
mea
sure
s
App
lyin
g pe
rfor
man
ce r
esul
ts in
re
sour
ce a
lloca
tion
and/
or
prog
ram
me
or p
olic
y de
cisi
ons
Hor
izon
tal s
uppo
rt fo
r de
velo
ping
pe
rfor
man
ce m
easu
res
Com
mis
sion
ing
eval
uatio
ns
Set
ting
perf
orm
ance
mea
sure
s
Mon
itorin
g pr
ogre
ss a
gain
st
mea
sure
s
App
lyin
g pe
rfor
man
ce r
esul
ts in
re
sour
ce a
lloca
tion
and/
or
prog
ram
me
or p
olic
y de
cisi
ons
Hor
izon
tal s
uppo
rt fo
r de
velo
ping
pe
rfor
man
ce m
easu
res
Australia ■ ■ ■ ■ ■ Austria ■ Belgium ■ ■ ■ ■ ■ ■ ■ ■ Canada ■ ■ ■ ■ ■ ■ ■ ■ ■ ■ ■ ■ ■ Czech Republic … … … … … … … … … … … … … … … Denmark ■ ■ ■ ■ ■ Finland ■ ■ ■ ■ ■ France ■ ■ ■ ■ Germany ■ ■ ■ ■ ■ Greece … … … … … … … … … … … … … … … Hungary ■ ■ ■ ■ Iceland ■ ■ ■ ■ Ireland ■ ■ ■ ■ ■ ■ Italy ■ ■ ■ ■ ■ ■ Japan ■ ■ ■ ■ ■ ■ ■ ■ Korea ■ ■ ■ ■ ■ ■ Luxembourg … … … … … … … … … … … … … … … Mexico ■ ■ ■ ■ Netherlands … … … … … … … … … … … … … … … New Zealand ■ ■ ■ ■ ■ ■ ■ ■ Norway ■ ■ ■ ■ ■ ■ ■ ■ Poland ■ ■ ■ ■ ■ ■ ■ Portugal ■ ■ ■ ■ ■ ■ ■ ■ ■ ■ Slovakia ■ ■ ■ ■ Spain ■ ■ ■ ■ ■ Sweden ■ ■ ■ ■ ■ ■ Switzerland ■ ■ Turkey ■ ■ ■ ■ ■ ■ UK ■ ■ ■ ■ ■ ■ ■ ■ ■ ■ United States ■ ■ ■ ■ ■ ■ ■ ■ Chile ■ ■ ■ ■ ■ ■ ■ ■ ■ Israel ■ ■ ■ ■ ■ ■ ■ ■ ■
Source: Curristine, T. (2005), Performance Information in the Budget process: Results of OECD 2005 Questionnaire, OECD Journal on Budgeting, Vol. 5, No. 2, OECD, Paris.
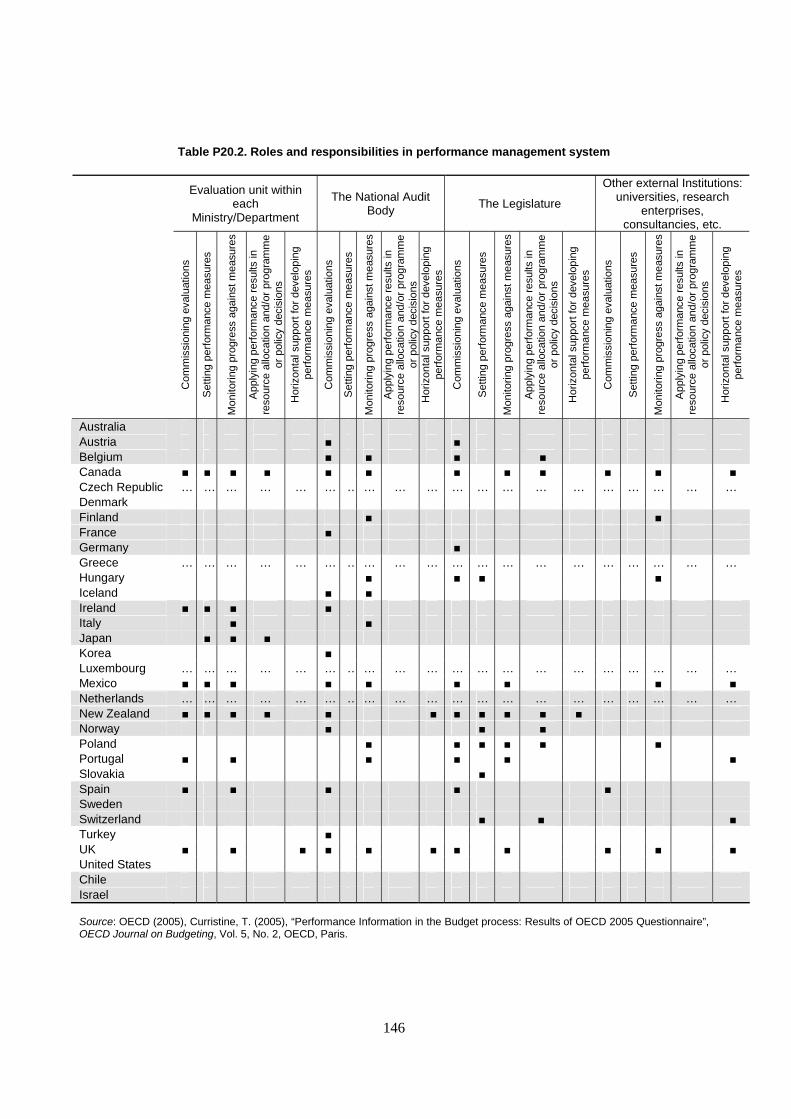
146
Table P20.2. Roles and responsibilities in performance management system
Evaluation unit within each
Ministry/Department
The National Audit Body The Legislature
Other external Institutions: universities, research
enterprises, consultancies, etc.
Com
mis
sion
ing
eval
uatio
ns
Set
ting
perf
orm
ance
mea
sure
s
Mon
itorin
g pr
ogre
ss a
gain
st m
easu
res
App
lyin
g pe
rfor
man
ce r
esul
ts in
re
sour
ce a
lloca
tion
and/
or p
rogr
amm
e or
pol
icy
deci
sion
s
Hor
izon
tal s
uppo
rt fo
r de
velo
ping
pe
rfor
man
ce m
easu
res
Com
mis
sion
ing
eval
uatio
ns
Set
ting
perf
orm
ance
mea
sure
s
Mon
itorin
g pr
ogre
ss a
gain
st m
easu
res
App
lyin
g pe
rfor
man
ce r
esul
ts in
re
sour
ce a
lloca
tion
and/
or p
rogr
amm
e or
pol
icy
deci
sion
s
Hor
izon
tal s
uppo
rt fo
r de
velo
ping
pe
rfor
man
ce m
easu
res
Com
mis
sion
ing
eval
uatio
ns
Set
ting
perf
orm
ance
mea
sure
s
Mon
itorin
g pr
ogre
ss a
gain
st m
easu
res
App
lyin
g pe
rfor
man
ce r
esul
ts in
re
sour
ce a
lloca
tion
and/
or p
rogr
amm
e or
pol
icy
deci
sion
s
Hor
izon
tal s
uppo
rt fo
r de
velo
ping
pe
rfor
man
ce m
easu
res
Com
mis
sion
ing
eval
uatio
ns
Set
ting
perf
orm
ance
mea
sure
s
Mon
itorin
g pr
ogre
ss a
gain
st m
easu
res
App
lyin
g pe
rfor
man
ce r
esul
ts in
re
sour
ce a
lloca
tion
and/
or p
rogr
amm
e or
pol
icy
deci
sion
s
Hor
izon
tal s
uppo
rt fo
r de
velo
ping
pe
rfor
man
ce m
easu
res
Australia Austria ■ ■ Belgium ■ ■ ■ ■ Canada ■ ■ ■ ■ ■ ■ ■ ■ ■ ■ ■ ■ Czech Republic … … … … … … … … … … … … … … … … … … … … Denmark Finland ■ ■ France ■ Germany ■ Greece … … … … … … … … … … … … … … … … … … … … Hungary ■ ■ ■ ■ Iceland ■ ■ Ireland ■ ■ ■ ■ Italy ■ ■ Japan ■ ■ ■ Korea ■ Luxembourg … … … … … … … … … … … … … … … … … … … … Mexico ■ ■ ■ ■ ■ ■ ■ ■ ■ Netherlands … … … … … … … … … … … … … … … … … … … … New Zealand ■ ■ ■ ■ ■ ■ ■ ■ ■ ■ ■ Norway ■ ■ ■ Poland ■ ■ ■ ■ ■ ■ Portugal ■ ■ ■ ■ ■ ■ Slovakia ■ Spain ■ ■ ■ ■ ■ Sweden Switzerland ■ ■ ■ Turkey ■ UK ■ ■ ■ ■ ■ ■ ■ ■ ■ ■ ■ United States Chile Israel Source: OECD (2005), Curristine, T. (2005), “Performance Information in the Budget process: Results of OECD 2005 Questionnaire”, OECD Journal on Budgeting, Vol. 5, No. 2, OECD, Paris.
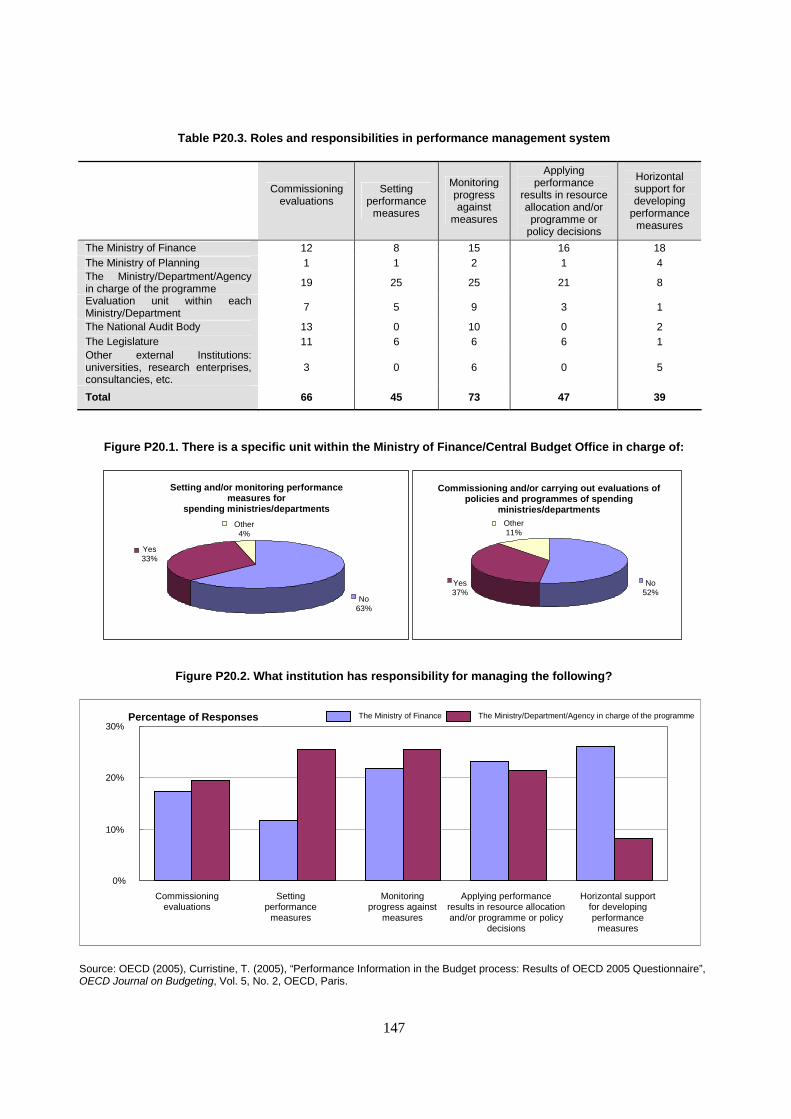
147
Table P20.3. Roles and responsibilities in performance management system
Commissioning
evaluations
Setting performance
measures
Monitoring progress against
measures
Applying performance
results in resource allocation and/or programme or
policy decisions
Horizontal support for developing
performance measures
The Ministry of Finance 12 8 15 16 18 The Ministry of Planning 1 1 2 1 4 The Ministry/Department/Agency in charge of the programme 19 25 25 21 8
Evaluation unit within each Ministry/Department 7 5 9 3 1
The National Audit Body 13 0 10 0 2 The Legislature 11 6 6 6 1 Other external Institutions: universities, research enterprises, consultancies, etc.
3 0 6 0 5
Total 66 45 73 47 39
Figure P20.1. There is a specific unit within the Ministry of Finance/Central Budget Office in charge of:
Figure P20.2. What institution has responsibility for managing the following?
Source: OECD (2005), Curristine, T. (2005), “Performance Information in the Budget process: Results of OECD 2005 Questionnaire”, OECD Journal on Budgeting, Vol. 5, No. 2, OECD, Paris.
No 63%
Yes 33%
Other 4%
Setting and/or monitoring performance measures for
spending ministries/departments
No 52% Yes
37%
Other 11%
Commissioning and/or carrying out evaluations of policies and programmes of spending
ministries/departments
0%
10%
20%
30%
Horizontal support for developing performance
measures
The Ministry of Finance The Ministry/Department/Agency in charge of the programme
Applying performance results in resource allocation and/or programme or policy
decisions
Setting performance
measures
Commissioning evaluations
Monitoring progress against
measures
Percentage of Responses
148
P21. USE OF PERFORMANCE MEASURES IN THE BUDGET PROCESS
Key contact: Teresa Curristine, OECD GOV
Since the key objective of the uses of performance measures in the budget process is to make government operations more efficient, a major issue is how this information is used in budgetary decision making to motivate agencies to improve performance. The MOF potentially has a variety of tools at its disposal, which includes the ability to confer money, freedom and recognition on spending ministries/agencies. While rewarding good performance is appealing, it does not take into account budgetary constraints and government priorities. Performance measures also only provide a snapshot of performance in time and do not explain the underlying causes of bad performance. In addition, there is always the danger that linking results to financial resources can create incentives to "game" in presenting performance information, particularly when performance information is not independently audited.
About this indicator:
Performance measures can contribute to budgetary decision-making in the budget process in different ways. Presentational: In this category performance information is included, at best, as background information only. It does not play a role in decision making on allocations nor is it necessarily intended to do so. Informed or indirect linkage: The second grouping is performance informed budgeting. This is a form of budgeting that relates resources to results in an indirect manner. Indirect linkage implies that results – along with other information on performance or other information pertaining to macro restrictions on fiscal policy and policy priorities – are being actively and systematically used to inform budget decisions. Performance information is important, but it is not absolute and does not have a predefined weight in the decisions. The final weightings will depend on the particular policy context. Direct linkage: The third category is direct performance budgeting. Direct linkage involves the allocation of resources directly and explicitly to units of performance. Appropriations can thus be based on a formula/contract with specific performance or activity indicators. Funding is directly based on results achieved. This form of performance budgeting is used only in specific sectors in a limited number of OECD countries.
Highlights:
In most sectors and cases, performance measures are loosely connected to decisions in the budget process. While performance targets are rarely or never used to determine budget allocations, they are, however, often used by the MOF in the budget process along with other information on performance and/or information on fiscal policy and political priorities to inform budget allocations. A direct linkage, where the results determine funding, creates a greater incentive for gaming. However, performance informed budgeting presents a danger that not enough weight will be given to performance information or that it can be sidelined, especially when other information is being considered. MoFs have taken a cautious approach to using performance information to financially punish or reward agencies or individuals. When programmes show poor performance, the most common course of action is that resources are held constant and the programme is reviewed during the course of the year.
Further reading:
OECD (2005), Modernizing Government: The way forward, OECD, Paris. OECD (2005), Curristine, T. (2005), “Performance Information in the Budget process: Results of OECD 2005 Questionnaire”, OECD Journal on Budgeting, Vol. 5, No. 2, OECD, Paris. Schick, A. (2003), “The Performing State: Reflection on an Idea Whose Time Has Come but Whose Implementation Has Not”, OECD Journal on Budgeting Vol. 3, No. 2, OECD, Paris. OECD/WB Budget Practices and Procedures Database, available at www.oecd.org/gov/budget.
Aspects of government measured by the indicator: General government Activities
of: Central State Local Social security funds
Other public sector Private sector in the public domain
Production stage:
Revenues Inputs Public sector processes
Outputs and intermediate outcomes Final outcomes Antecedents or constraints
Functional sector:
General public services
Defence Public order & safety
Economic affairs
Environmental protection
Housing & community amenities
Health Recreation, culture and religion
Education Social protection
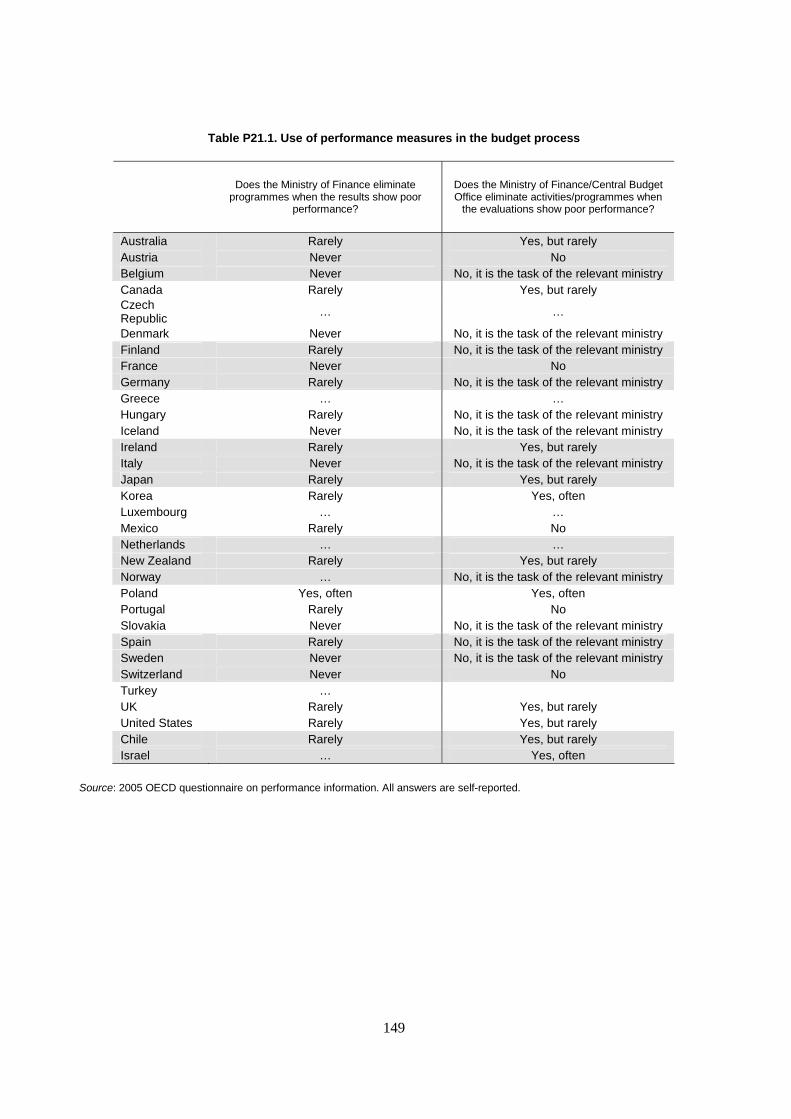
149
Table P21.1. Use of performance measures in the budget process
Does the Ministry of Finance eliminate
programmes when the results show poor performance?
Does the Ministry of Finance/Central Budget Office eliminate activities/programmes when
the evaluations show poor performance?
Australia Rarely Yes, but rarely Austria Never No Belgium Never No, it is the task of the relevant ministry Canada Rarely Yes, but rarely Czech Republic … …
Denmark Never No, it is the task of the relevant ministry Finland Rarely No, it is the task of the relevant ministry France Never No Germany Rarely No, it is the task of the relevant ministry Greece … … Hungary Rarely No, it is the task of the relevant ministry Iceland Never No, it is the task of the relevant ministry Ireland Rarely Yes, but rarely Italy Never No, it is the task of the relevant ministry Japan Rarely Yes, but rarely Korea Rarely Yes, often Luxembourg … … Mexico Rarely No Netherlands … … New Zealand Rarely Yes, but rarely Norway … No, it is the task of the relevant ministry Poland Yes, often Yes, often Portugal Rarely No Slovakia Never No, it is the task of the relevant ministry Spain Rarely No, it is the task of the relevant ministry Sweden Never No, it is the task of the relevant ministry Switzerland Never No Turkey … UK Rarely Yes, but rarely United States Rarely Yes, but rarely Chile Rarely Yes, but rarely Israel … Yes, often
Source: 2005 OECD questionnaire on performance information. All answers are self-reported.
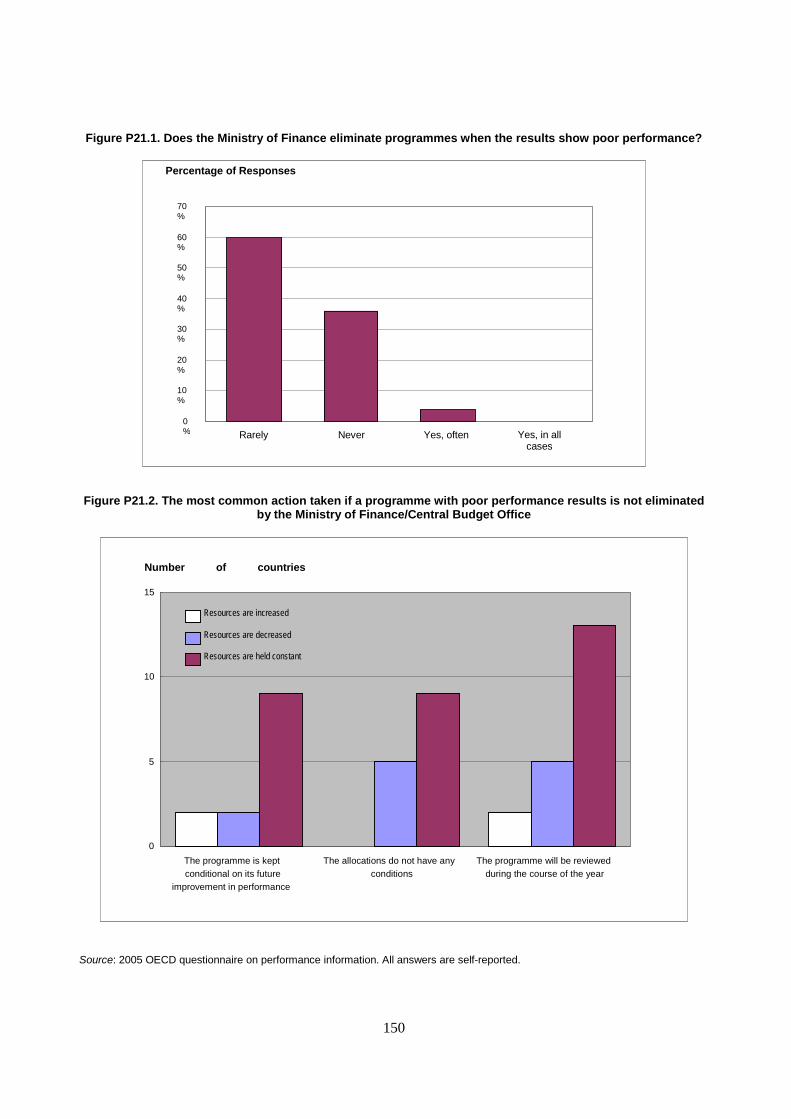
150
Figure P21.1. Does the Ministry of Finance eliminate programmes when the results show poor performance?
Figure P21.2. The most common action taken if a programme with poor performance results is not eliminated by the Ministry of Finance/Central Budget Office
Source: 2005 OECD questionnaire on performance information. All answers are self-reported.
0%
10%
20%
30%
40%
50%
60%
70%
Rarely Never Yes, often Yes, in all cases
Percentage of Responses
0
5
10
15
The programme is kept conditional on its future
improvement in performance
The allocations do not have any conditions
The programme will be reviewed during the course of the year
Number of countries
Resources are increased
Resources are decreased
Resources are held constant
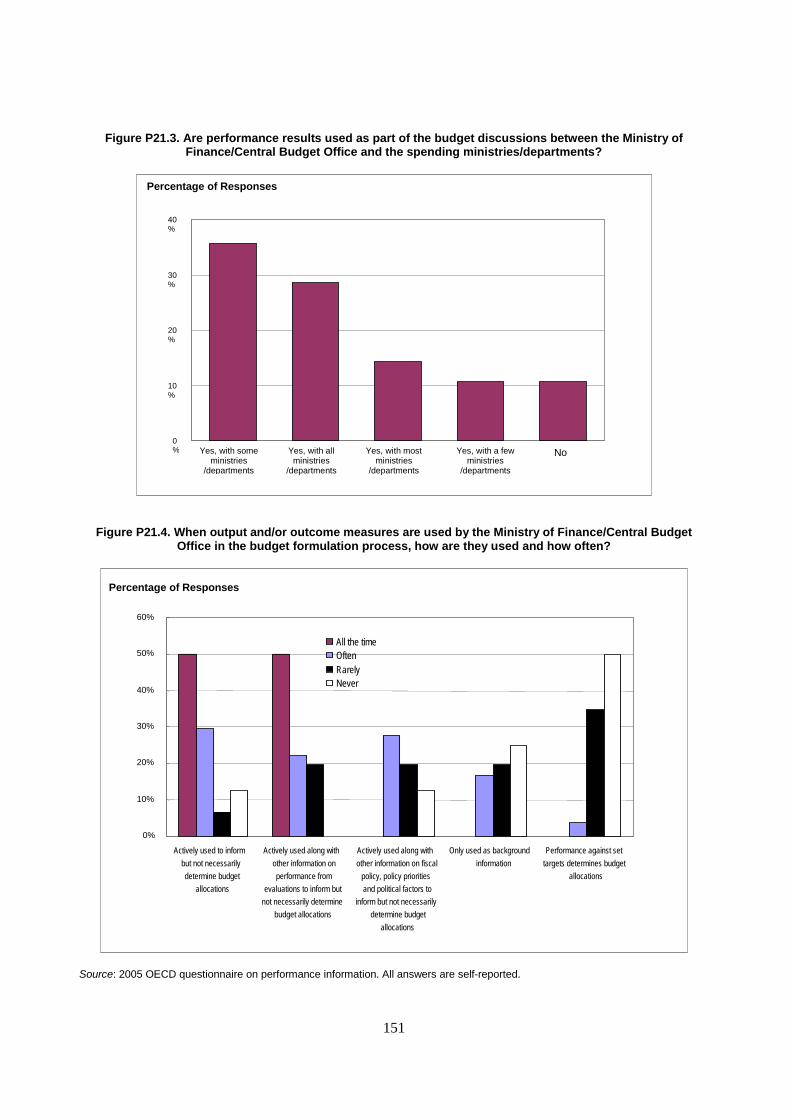
151
Figure P21.3. Are performance results used as part of the budget discussions between the Ministry of Finance/Central Budget Office and the spending ministries/departments?
Figure P21.4. When output and/or outcome measures are used by the Ministry of Finance/Central Budget
Office in the budget formulation process, how are they used and how often?
Source: 2005 OECD questionnaire on performance information. All answers are self-reported.
0%
10%
20%
30%
40%
Yes, with some ministries
/departments
Yes, with all ministries
/departments
Yes, with most
ministries /departments
Yes, with a few
ministries /departments
No
Percentage of Responses
0%
10%
20%
30%
40%
50%
60%
Actively used to inform but not necessarily determine budget
allocations
Actively used along with other information on performance from
evaluations to inform but not necessarily determine
budget allocations
Actively used along with other information on fiscal
policy, policy priorities and political factors to
inform but not necessarily determine budget
allocations
Only used as background information
Performance against set targets determines budget
allocations
All the time
Rarely Never
Often
Percentage of Responses
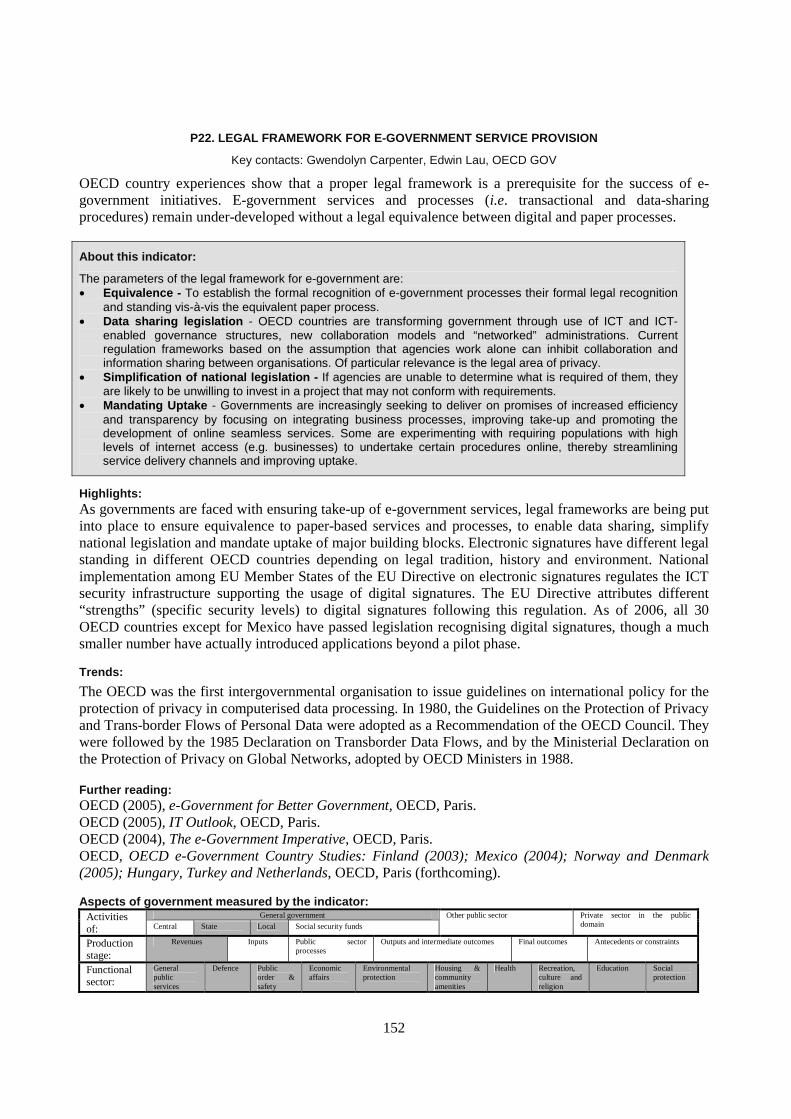
152
P22. LEGAL FRAMEWORK FOR E-GOVERNMENT SERVICE PROVISION
Key contacts: Gwendolyn Carpenter, Edwin Lau, OECD GOV
OECD country experiences show that a proper legal framework is a prerequisite for the success of e-government initiatives. E-government services and processes (i.e. transactional and data-sharing procedures) remain under-developed without a legal equivalence between digital and paper processes.
About this indicator:
The parameters of the legal framework for e-government are: • Equivalence - To establish the formal recognition of e-government processes their formal legal recognition
and standing vis-à-vis the equivalent paper process. • Data sharing legislation - OECD countries are transforming government through use of ICT and ICT-
enabled governance structures, new collaboration models and “networked” administrations. Current regulation frameworks based on the assumption that agencies work alone can inhibit collaboration and information sharing between organisations. Of particular relevance is the legal area of privacy.
• Simplification of national legislation - If agencies are unable to determine what is required of them, they are likely to be unwilling to invest in a project that may not conform with requirements.
• Mandating Uptake - Governments are increasingly seeking to deliver on promises of increased efficiency and transparency by focusing on integrating business processes, improving take-up and promoting the development of online seamless services. Some are experimenting with requiring populations with high levels of internet access (e.g. businesses) to undertake certain procedures online, thereby streamlining service delivery channels and improving uptake.
Highlights: As governments are faced with ensuring take-up of e-government services, legal frameworks are being put into place to ensure equivalence to paper-based services and processes, to enable data sharing, simplify national legislation and mandate uptake of major building blocks. Electronic signatures have different legal standing in different OECD countries depending on legal tradition, history and environment. National implementation among EU Member States of the EU Directive on electronic signatures regulates the ICT security infrastructure supporting the usage of digital signatures. The EU Directive attributes different “strengths” (specific security levels) to digital signatures following this regulation. As of 2006, all 30 OECD countries except for Mexico have passed legislation recognising digital signatures, though a much smaller number have actually introduced applications beyond a pilot phase.
Trends:
The OECD was the first intergovernmental organisation to issue guidelines on international policy for the protection of privacy in computerised data processing. In 1980, the Guidelines on the Protection of Privacy and Trans-border Flows of Personal Data were adopted as a Recommendation of the OECD Council. They were followed by the 1985 Declaration on Transborder Data Flows, and by the Ministerial Declaration on the Protection of Privacy on Global Networks, adopted by OECD Ministers in 1988.
Further reading: OECD (2005), e-Government for Better Government, OECD, Paris. OECD (2005), IT Outlook, OECD, Paris. OECD (2004), The e-Government Imperative, OECD, Paris. OECD, OECD e-Government Country Studies: Finland (2003); Mexico (2004); Norway and Denmark (2005); Hungary, Turkey and Netherlands, OECD, Paris (forthcoming). Aspects of government measured by the indicator:
General government Activities of: Central State Local Social security funds
Other public sector Private sector in the public domain
Production stage:
Revenues Inputs Public sector processes
Outputs and intermediate outcomes Final outcomes Antecedents or constraints
Functional sector:
General public services
Defence Public order & safety
Economic affairs
Environmental protection
Housing & community amenities
Health Recreation, culture and religion
Education Social protection
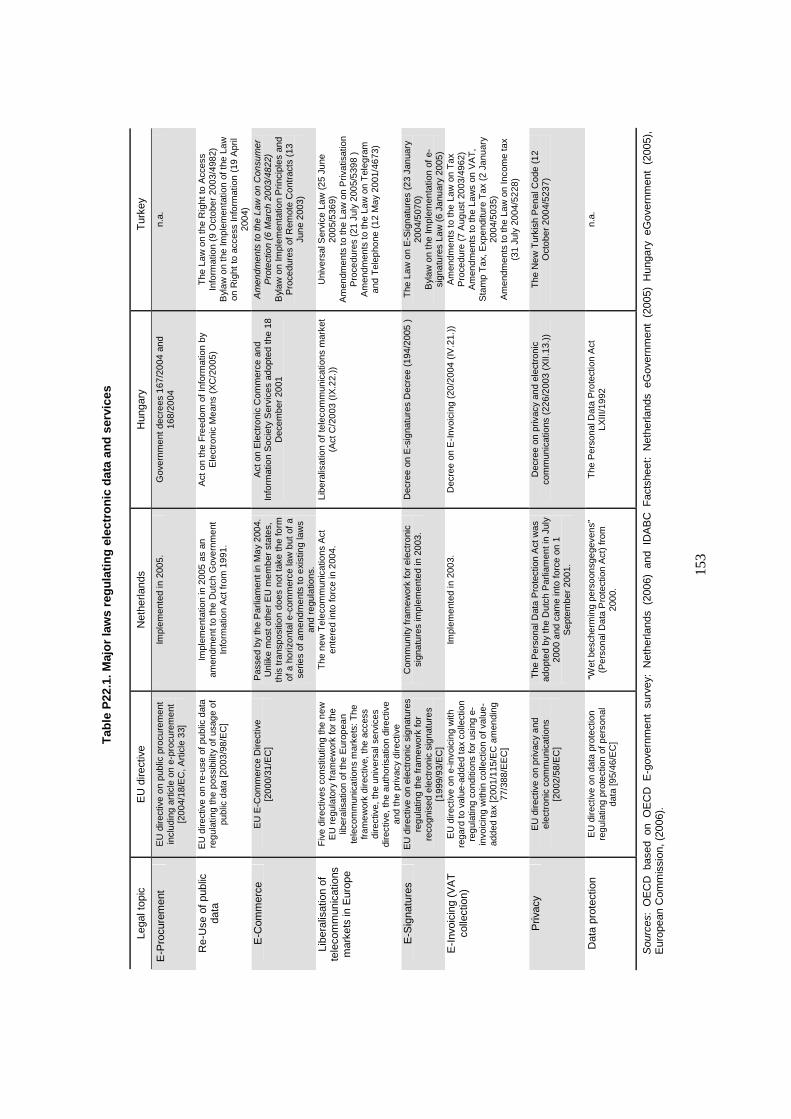
15
3
Tab
le P
22.1
. Maj
or
law
s re
gu
lati
ng
ele
ctro
nic
dat
a an
d s
ervi
ces
Lega
l top
ic
EU
dire
ctiv
e N
ethe
rland
s H
unga
ry
Tur
key
E-P
rocu
rem
ent
EU
dire
ctiv
e on
pub
lic p
rocu
rem
ent
incl
udin
g ar
ticle
on
e-pr
ocur
emen
t [2
004/
18/E
C, A
rtic
le 3
3]
Impl
emen
ted
in 2
005.
G
over
nmen
t dec
rees
167
/200
4 an
d 16
8/20
04
n.a.
Re-
Use
of p
ublic
da
ta
EU
dire
ctiv
e on
re-
use
of p
ublic
dat
a re
gula
ting
the
poss
ibili
ty o
f usa
ge o
f pu
blic
dat
a [2
003/
98/E
C]
Impl
emen
tatio
n in
200
5 as
an
amen
dmen
t to
the
Dut
ch G
over
nmen
t In
form
atio
n A
ct fr
om 1
991.
Act
on
the
Fre
edom
of I
nfor
mat
ion
by
Ele
ctro
nic
Mea
ns (
XC
/200
5)
The
Law
on
the
Rig
ht to
Acc
ess
Info
rmat
ion
(9 O
ctob
er 2
003/
4982
) B
ylaw
on
the
Impl
emen
tatio
n of
the
Law
on
Rig
ht to
acc
ess
Info
rmat
ion
(19
Apr
il 20
04)
E-C
omm
erce
E
U E
-Com
mer
ce D
irect
ive
[200
0/31
/EC
] P
asse
d by
the
Par
liam
ent i
n M
ay 2
004.
U
nlik
e m
ost o
ther
EU
mem
ber
stat
es,
this
tran
spos
ition
doe
s no
t tak
e th
e fo
rm
of a
hor
izon
tal e
-com
mer
ce la
w b
ut o
f a
serie
s of
am
endm
ents
to e
xist
ing
law
s an
d re
gula
tions
.
Act
on
Ele
ctro
nic
Com
mer
ce a
nd
Info
rmat
ion
Soc
iety
Ser
vice
s ad
opte
d th
e 18
D
ecem
ber
2001
Am
endm
ents
to th
e La
w o
n C
onsu
mer
P
rote
ctio
n (6
Mar
ch 2
003/
4822
) B
ylaw
on
Impl
emen
tatio
n P
rinci
ples
and
P
roce
dure
s of
Rem
ote
Con
trac
ts (
13
June
200
3)
Libe
ralis
atio
n of
te
leco
mm
unic
atio
ns
mar
kets
in E
urop
e
Fiv
e di
rect
ives
con
stitu
ting
the
new
E
U r
egul
ator
y fr
amew
ork
for
the
liber
alis
atio
n of
the
Eur
opea
n te
leco
mm
unic
atio
ns m
arke
ts: T
he
fram
ewor
k di
rect
ive,
the
acce
ss
dire
ctiv
e, th
e un
iver
sal s
ervi
ces
dire
ctiv
e, th
e au
thor
isat
ion
dire
ctiv
e an
d th
e pr
ivac
y di
rect
ive
The
new
Tel
ecom
mun
icat
ions
Act
en
tere
d in
to fo
rce
in 2
004.
Li
bera
lisat
ion
of te
leco
mm
unic
atio
ns m
arke
t (A
ct C
/200
3 (I
X.2
2.))
U
nive
rsal
Ser
vice
Law
(25
Jun
e 20
05/5
369)
A
men
dmen
ts to
the
Law
on
Priv
atis
atio
n P
roce
dure
s (2
1 Ju
ly 2
005/
5398
)
Am
endm
ents
to th
e La
w o
n T
eleg
ram
an
d T
elep
hone
(12
May
200
1/46
73)
E-S
igna
ture
s E
U d
irect
ive
on e
lect
roni
c si
gnat
ures
re
gula
ting
the
fram
ewor
k fo
r re
cogn
ised
ele
ctro
nic
sign
atur
es
[199
9/93
/EC
]
Com
mun
ity fr
amew
ork
for
elec
tron
ic
sign
atur
es im
plem
ente
d in
200
3.
Dec
ree
on E
-sig
natu
res
Dec
ree
(194
/200
5 )
The
Law
on
E-S
igna
ture
s (2
3 Ja
nuar
y 20
04/5
070)
B
ylaw
on
the
Impl
emen
tatio
n of
e-
sign
atur
es L
aw (
6 Ja
nuar
y 20
05)
E-I
nvoi
cing
(V
AT
co
llect
ion)
E
U d
irect
ive
on e
-invo
icin
g w
ith
rega
rd to
val
ue-a
dded
tax
colle
ctio
n re
gula
ting
cond
ition
s fo
r us
ing
e-in
voic
ing
with
in c
olle
ctio
n of
val
ue-
adde
d ta
x [2
001/
115/
EC
am
endi
ng
77/3
88/E
EC
]
Impl
emen
ted
in 2
003.
D
ecre
e on
E-I
nvoi
cing
(20
/200
4 (I
V.2
1.))
A
men
dmen
ts to
the
Law
on
Tax
P
roce
dure
(7
Aug
ust 2
003/
4962
) A
men
dmen
ts to
the
Law
s on
VA
T,
Sta
mp
Tax
, Exp
endi
ture
Tax
(2
Janu
ary
2004
/503
5)
Am
endm
ents
to th
e La
w o
n In
com
e ta
x (3
1 Ju
ly 2
004/
5228
)
Priv
acy
E
U d
irect
ive
on p
rivac
y an
d el
ectr
onic
com
mun
icat
ions
[2
002/
58/E
C]
The
Per
sona
l Dat
a P
rote
ctio
n A
ct w
as
adop
ted
by th
e D
utch
Par
liam
ent i
n Ju
ly
2000
and
cam
e in
to fo
rce
on 1
S
epte
mbe
r 20
01.
Dec
ree
on p
rivac
y an
d el
ectr
onic
co
mm
unic
atio
ns (
226/
2003
(X
II.13
.))
The
New
Tur
kish
Pen
al C
ode
(12
Oct
ober
200
4/52
37)
Dat
a pr
otec
tion
E
U d
irect
ive
on d
ata
prot
ectio
n re
gula
ting
prot
ectio
n of
per
sona
l da
ta [9
5/46
/EC
]
“Wet
bes
cher
min
g pe
rsoo
nsge
geve
ns”
(Per
sona
l Dat
a P
rote
ctio
n A
ct)
from
20
00.
The
Per
sona
l Dat
a P
rote
ctio
n A
ct
LXIII
/199
2
n.a.
Sou
rces
: O
EC
D b
ased
on
OE
CD
E-g
over
nmen
t su
rvey
: N
ethe
rland
s (2
006)
and
ID
AB
C F
acts
heet
: N
ethe
rland
s eG
over
nmen
t (2
005)
Hun
gary
eG
over
nmen
t (2
005)
, E
urop
ean
Com
mis
sion
, (20
06).
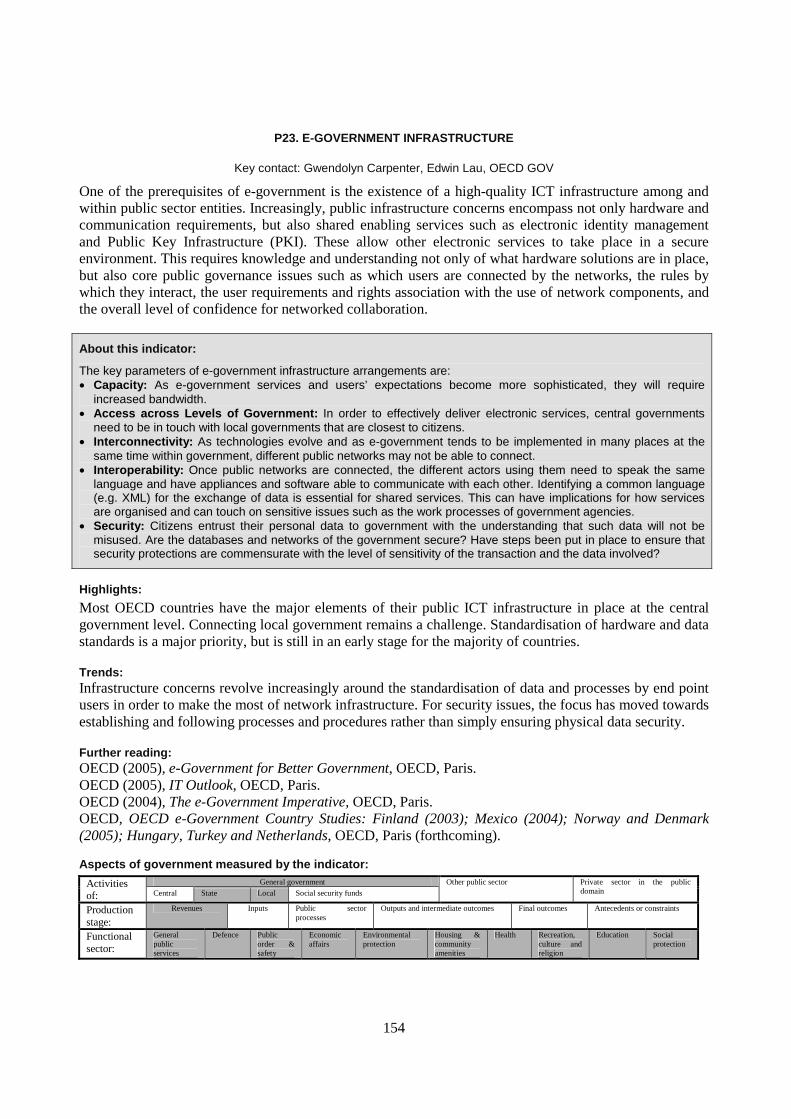
154
P23. E-GOVERNMENT INFRASTRUCTURE
Key contact: Gwendolyn Carpenter, Edwin Lau, OECD GOV
One of the prerequisites of e-government is the existence of a high-quality ICT infrastructure among and within public sector entities. Increasingly, public infrastructure concerns encompass not only hardware and communication requirements, but also shared enabling services such as electronic identity management and Public Key Infrastructure (PKI). These allow other electronic services to take place in a secure environment. This requires knowledge and understanding not only of what hardware solutions are in place, but also core public governance issues such as which users are connected by the networks, the rules by which they interact, the user requirements and rights association with the use of network components, and the overall level of confidence for networked collaboration.
About this indicator:
The key parameters of e-government infrastructure arrangements are: • Capacity: As e-government services and users’ expectations become more sophisticated, they will require
increased bandwidth. • Access across Levels of Government: In order to effectively deliver electronic services, central governments
need to be in touch with local governments that are closest to citizens. • Interconnectivity: As technologies evolve and as e-government tends to be implemented in many places at the
same time within government, different public networks may not be able to connect. • Interoperability: Once public networks are connected, the different actors using them need to speak the same
language and have appliances and software able to communicate with each other. Identifying a common language (e.g. XML) for the exchange of data is essential for shared services. This can have implications for how services are organised and can touch on sensitive issues such as the work processes of government agencies.
• Security: Citizens entrust their personal data to government with the understanding that such data will not be misused. Are the databases and networks of the government secure? Have steps been put in place to ensure that security protections are commensurate with the level of sensitivity of the transaction and the data involved?
Highlights:
Most OECD countries have the major elements of their public ICT infrastructure in place at the central government level. Connecting local government remains a challenge. Standardisation of hardware and data standards is a major priority, but is still in an early stage for the majority of countries.
Trends: Infrastructure concerns revolve increasingly around the standardisation of data and processes by end point users in order to make the most of network infrastructure. For security issues, the focus has moved towards establishing and following processes and procedures rather than simply ensuring physical data security.
Further reading: OECD (2005), e-Government for Better Government, OECD, Paris. OECD (2005), IT Outlook, OECD, Paris. OECD (2004), The e-Government Imperative, OECD, Paris. OECD, OECD e-Government Country Studies: Finland (2003); Mexico (2004); Norway and Denmark (2005); Hungary, Turkey and Netherlands, OECD, Paris (forthcoming). Aspects of government measured by the indicator:
General government Activities of: Central State Local Social security funds
Other public sector Private sector in the public domain
Production stage:
Revenues Inputs Public sector processes
Outputs and intermediate outcomes Final outcomes Antecedents or constraints
Functional sector:
General public services
Defence Public order & safety
Economic affairs
Environmental protection
Housing & community amenities
Health Recreation, culture and religion
Education Social protection
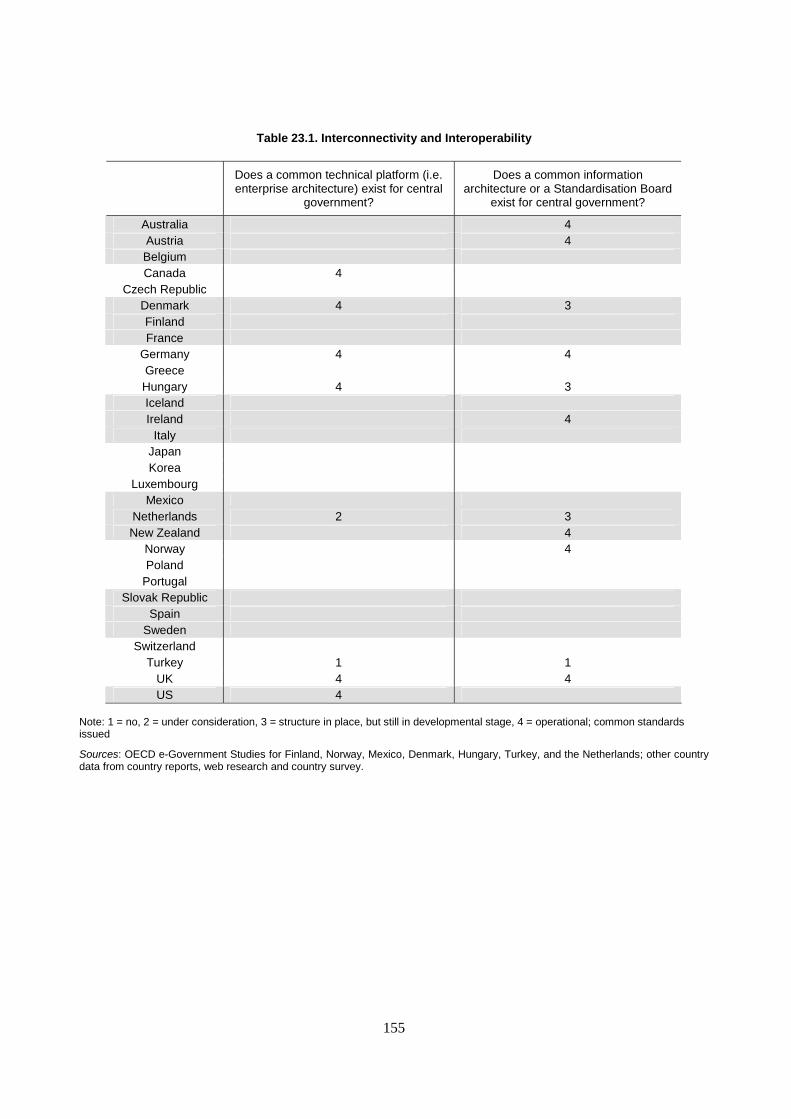
155
Table 23.1. Interconnectivity and Interoperability
Does a common technical platform (i.e. enterprise architecture) exist for central
government?
Does a common information architecture or a Standardisation Board
exist for central government?
Australia 4 Austria 4 Belgium Canada 4
Czech Republic Denmark 4 3 Finland France
Germany 4 4 Greece Hungary 4 3 Iceland Ireland 4
Italy Japan Korea
Luxembourg Mexico
Netherlands 2 3 New Zealand 4
Norway 4 Poland
Portugal Slovak Republic
Spain Sweden
Switzerland Turkey 1 1
UK 4 4 US 4
Note: 1 = no, 2 = under consideration, 3 = structure in place, but still in developmental stage, 4 = operational; common standards issued
Sources: OECD e-Government Studies for Finland, Norway, Mexico, Denmark, Hungary, Turkey, and the Netherlands; other country data from country reports, web research and country survey.

156
P24. E-GOVERNMENT BENEFITS EVALUATION METHODOLOGY
Key contacts: Gwendolyn Carpenter, Edwin Lau, OECD GOV
The objective of putting all public services online, as espoused by many OECD governments in the late 1990s, has given way to a concern that individual e-government projects should demonstrate their contribution to overall government objectives. Countries are using business case methodologies to demonstrate the costs, risks and expected returns – in terms of both savings to government and benefits to citizens and businesses – resulting from ICT investment. In order to measure the impact of e-government, it is first necessary to decide what type of costs and benefits to consider and the population to whom these costs and benefits will accrue.
About this indicator:
Government-wide approaches to e-government cost and benefit analysis vary along several dimensions: • The methodologies used in ICT cost and benefit analysis studies. • How results are analysed and applied. • How the methodology is developed. • Who are the stakeholders involved. • How the resulting methodology is applied. • How benefits realisation initiatives can best be guided in order to better help e-government projects achieve
overall programme objectives.
Highlights:
While the cost and benefit analysis methodologies in support of ICT business cases are not unique, they do have to take into account certain specificities related to both ICT spending and the horizontal nature of e-government. In a number of countries, governments have begun to establish clear guidelines or requirements for the way e-government projects should be evaluated. Such standard methodology promotes the diffusion of cost benefit analysis across government and promotes more standardised data about the costs and benefits of e-government investments for the public sector as a whole. The earlier OECD studies showed that only a few countries (Australia, Canada and the United States) were using more complex and costly value assessment methods. Ex ante business case information is mandated by many governments, but it is less common to verify, ex post, whether or not the expected benefits have been achieved.
Trends:
Countries are increasingly willing to mandate the use of business cases and of standard cost and benefit analysis methodologies in order to allow them to compare and prioritise investments and to capture all benefits resulting from ICT investments.
Further reading: OECD (2005), e-Government for Better Government, OECD, Paris. OECD (2005), IT Outlook, OECD, Paris. OECD (2004), The e-Government Imperative, OECD, Paris. OECD, OECD e-Government Country Studies: Finland (2003); Mexico (2004); Norway and Denmark (2005); Hungary, Turkey and Netherlands, OECD, Paris (forthcoming). Aspects of government measured by the indicator:
General government Activities of: Central State Local Social security funds
Other public sector Private sector in the public domain
Production stage:
Revenues Inputs Public sector processes
Outputs and intermediate outcomes Final outcomes Antecedents or constraints
Functional sector:
General public services
Defence Public order & safety
Economic affairs
Environmental protection
Housing & community amenities
Health Recreation, culture and religion
Education Social protection
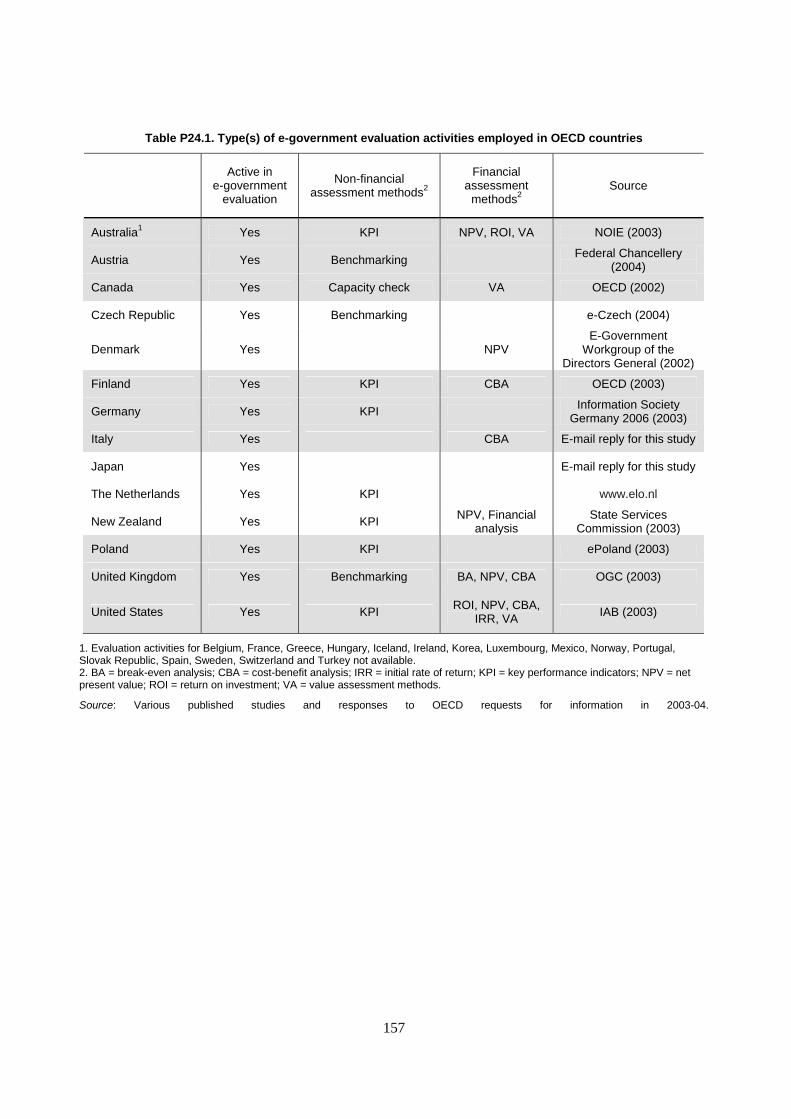
157
Table P24.1. Type(s) of e-government evaluation activities employed in OECD countries
Active in
e-government evaluation
Non-financial assessment methods2
Financial assessment
methods2 Source
Australia1 Yes KPI NPV, ROI, VA NOIE (2003)
Austria Yes Benchmarking Federal Chancellery (2004)
Canada Yes Capacity check VA OECD (2002)
Czech Republic Yes Benchmarking e-Czech (2004)
Denmark Yes NPV E-Government
Workgroup of the Directors General (2002)
Finland Yes KPI CBA OECD (2003)
Germany Yes KPI Information Society Germany 2006 (2003)
Italy Yes CBA E-mail reply for this study
Japan Yes E-mail reply for this study
The Netherlands Yes KPI www.elo.nl
New Zealand Yes KPI NPV, Financial analysis
State Services Commission (2003)
Poland Yes KPI ePoland (2003)
United Kingdom Yes Benchmarking BA, NPV, CBA OGC (2003)
United States Yes KPI ROI, NPV, CBA, IRR, VA IAB (2003)
1. Evaluation activities for Belgium, France, Greece, Hungary, Iceland, Ireland, Korea, Luxembourg, Mexico, Norway, Portugal, Slovak Republic, Spain, Sweden, Switzerland and Turkey not available. 2. BA = break-even analysis; CBA = cost-benefit analysis; IRR = initial rate of return; KPI = key performance indicators; NPV = net present value; ROI = return on investment; VA = value assessment methods.
Source: Various published studies and responses to OECD requests for information in 2003-04.
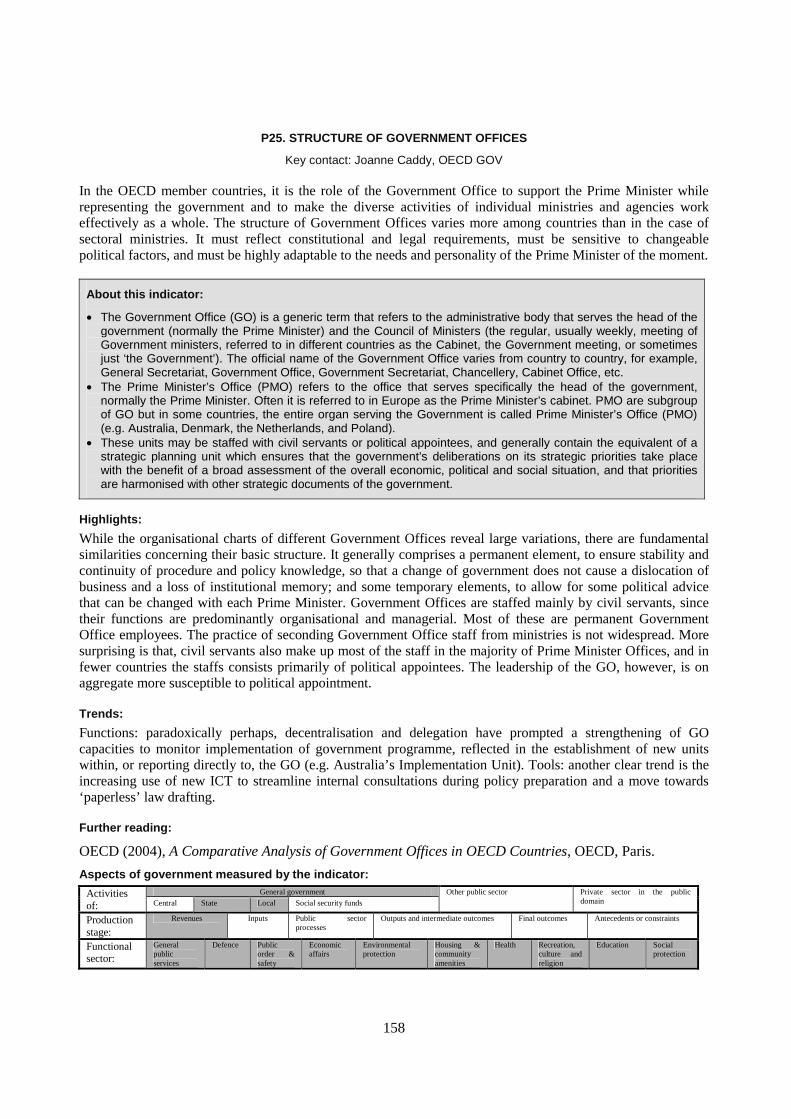
158
P25. STRUCTURE OF GOVERNMENT OFFICES
Key contact: Joanne Caddy, OECD GOV
In the OECD member countries, it is the role of the Government Office to support the Prime Minister while representing the government and to make the diverse activities of individual ministries and agencies work effectively as a whole. The structure of Government Offices varies more among countries than in the case of sectoral ministries. It must reflect constitutional and legal requirements, must be sensitive to changeable political factors, and must be highly adaptable to the needs and personality of the Prime Minister of the moment.
About this indicator:
• The Government Office (GO) is a generic term that refers to the administrative body that serves the head of the government (normally the Prime Minister) and the Council of Ministers (the regular, usually weekly, meeting of Government ministers, referred to in different countries as the Cabinet, the Government meeting, or sometimes just ‘the Government’). The official name of the Government Office varies from country to country, for example, General Secretariat, Government Office, Government Secretariat, Chancellery, Cabinet Office, etc.
• The Prime Minister’s Office (PMO) refers to the office that serves specifically the head of the government, normally the Prime Minister. Often it is referred to in Europe as the Prime Minister’s cabinet. PMO are subgroup of GO but in some countries, the entire organ serving the Government is called Prime Minister’s Office (PMO) (e.g. Australia, Denmark, the Netherlands, and Poland).
• These units may be staffed with civil servants or political appointees, and generally contain the equivalent of a strategic planning unit which ensures that the government’s deliberations on its strategic priorities take place with the benefit of a broad assessment of the overall economic, political and social situation, and that priorities are harmonised with other strategic documents of the government.
Highlights:
While the organisational charts of different Government Offices reveal large variations, there are fundamental similarities concerning their basic structure. It generally comprises a permanent element, to ensure stability and continuity of procedure and policy knowledge, so that a change of government does not cause a dislocation of business and a loss of institutional memory; and some temporary elements, to allow for some political advice that can be changed with each Prime Minister. Government Offices are staffed mainly by civil servants, since their functions are predominantly organisational and managerial. Most of these are permanent Government Office employees. The practice of seconding Government Office staff from ministries is not widespread. More surprising is that, civil servants also make up most of the staff in the majority of Prime Minister Offices, and in fewer countries the staffs consists primarily of political appointees. The leadership of the GO, however, is on aggregate more susceptible to political appointment.
Trends:
Functions: paradoxically perhaps, decentralisation and delegation have prompted a strengthening of GO capacities to monitor implementation of government programme, reflected in the establishment of new units within, or reporting directly to, the GO (e.g. Australia’s Implementation Unit). Tools: another clear trend is the increasing use of new ICT to streamline internal consultations during policy preparation and a move towards ‘paperless’ law drafting.
Further reading:
OECD (2004), A Comparative Analysis of Government Offices in OECD Countries, OECD, Paris.
Aspects of government measured by the indicator: General government Activities
of: Central State Local Social security funds
Other public sector Private sector in the public domain
Production stage:
Revenues Inputs Public sector processes
Outputs and intermediate outcomes Final outcomes Antecedents or constraints
Functional sector:
General public services
Defence Public order & safety
Economic affairs
Environmental protection
Housing & community amenities
Health Recreation, culture and religion
Education Social protection
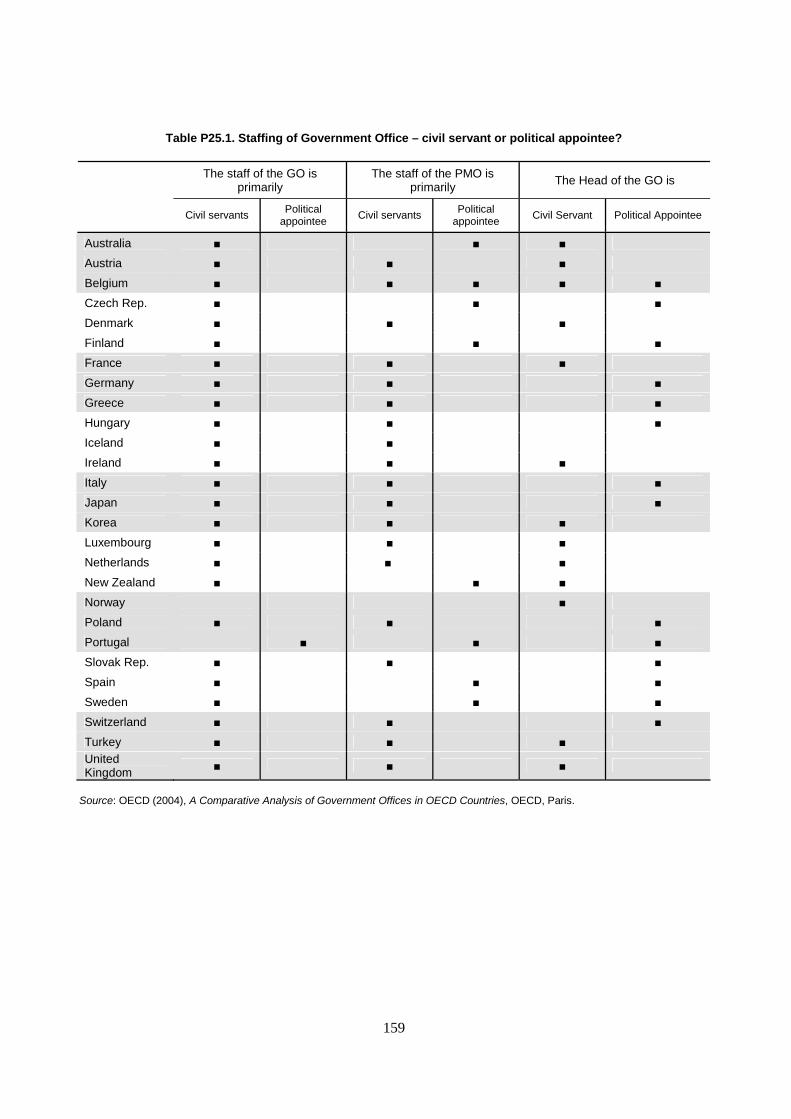
159
Table P25.1. Staffing of Government Office – civil servant or political appointee?
The staff of the GO is primarily
The staff of the PMO is primarily The Head of the GO is
Civil servants Political appointee
Civil servants Political appointee
Civil Servant Political Appointee
Australia ■ ■ ■
Austria ■ ■ ■
Belgium ■ ■ ■ ■ ■
Czech Rep. ■ ■ ■
Denmark ■ ■ ■
Finland ■ ■ ■
France ■ ■ ■
Germany ■ ■ ■
Greece ■ ■ ■
Hungary ■ ■ ■
Iceland ■ ■
Ireland ■ ■ ■
Italy ■ ■ ■
Japan ■ ■ ■
Korea ■ ■ ■
Luxembourg ■ ■ ■
Netherlands ■ ■ ■
New Zealand ■ ■ ■
Norway ■
Poland ■ ■ ■
Portugal ■ ■ ■
Slovak Rep. ■ ■ ■
Spain ■ ■ ■
Sweden ■ ■ ■
Switzerland ■ ■ ■
Turkey ■ ■ ■ United Kingdom ■ ■ ■
Source: OECD (2004), A Comparative Analysis of Government Offices in OECD Countries, OECD, Paris.
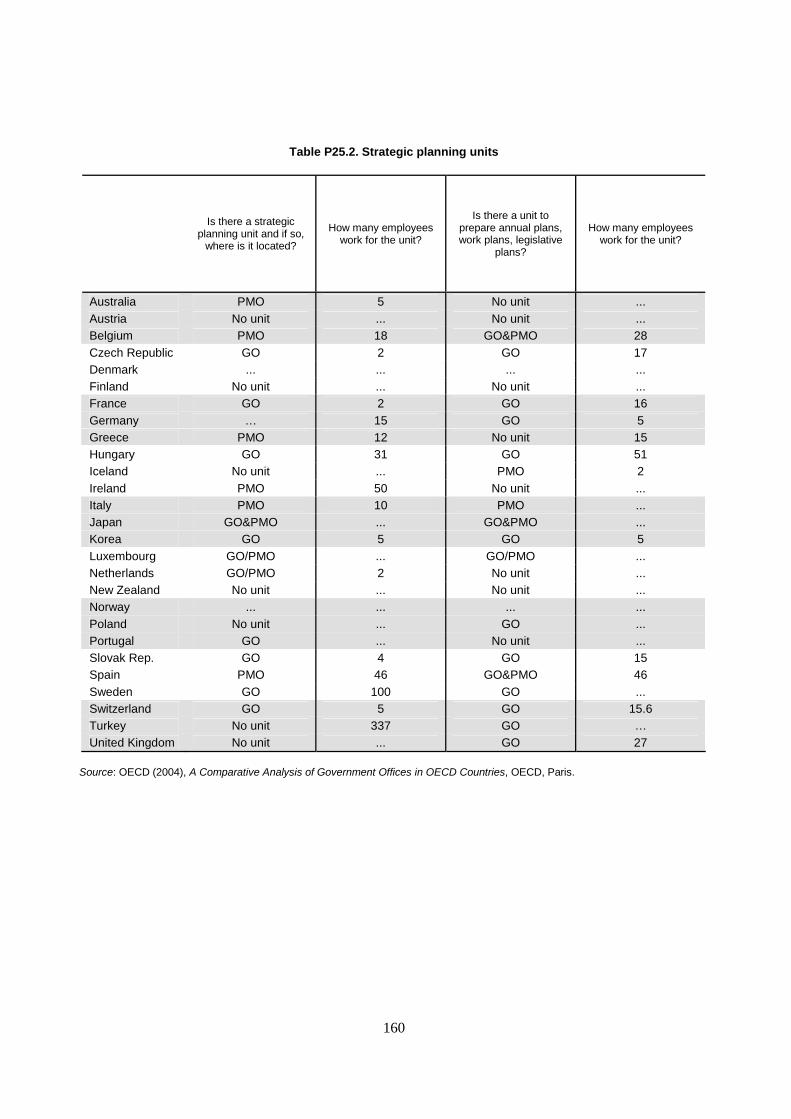
160
Table P25.2. Strategic planning units
Is there a strategic
planning unit and if so, where is it located?
How many employees work for the unit?
Is there a unit to prepare annual plans, work plans, legislative
plans?
How many employees work for the unit?
Australia PMO 5 No unit ... Austria No unit ... No unit ... Belgium PMO 18 GO&PMO 28 Czech Republic GO 2 GO 17 Denmark ... ... ... ... Finland No unit ... No unit ... France GO 2 GO 16 Germany … 15 GO 5 Greece PMO 12 No unit 15 Hungary GO 31 GO 51 Iceland No unit ... PMO 2 Ireland PMO 50 No unit ... Italy PMO 10 PMO ... Japan GO&PMO ... GO&PMO ... Korea GO 5 GO 5 Luxembourg GO/PMO ... GO/PMO ... Netherlands GO/PMO 2 No unit ... New Zealand No unit ... No unit ... Norway ... ... ... ... Poland No unit ... GO ... Portugal GO ... No unit ... Slovak Rep. GO 4 GO 15 Spain PMO 46 GO&PMO 46 Sweden GO 100 GO ... Switzerland GO 5 GO 15.6 Turkey No unit 337 GO … United Kingdom No unit ... GO 27
Source: OECD (2004), A Comparative Analysis of Government Offices in OECD Countries, OECD, Paris.
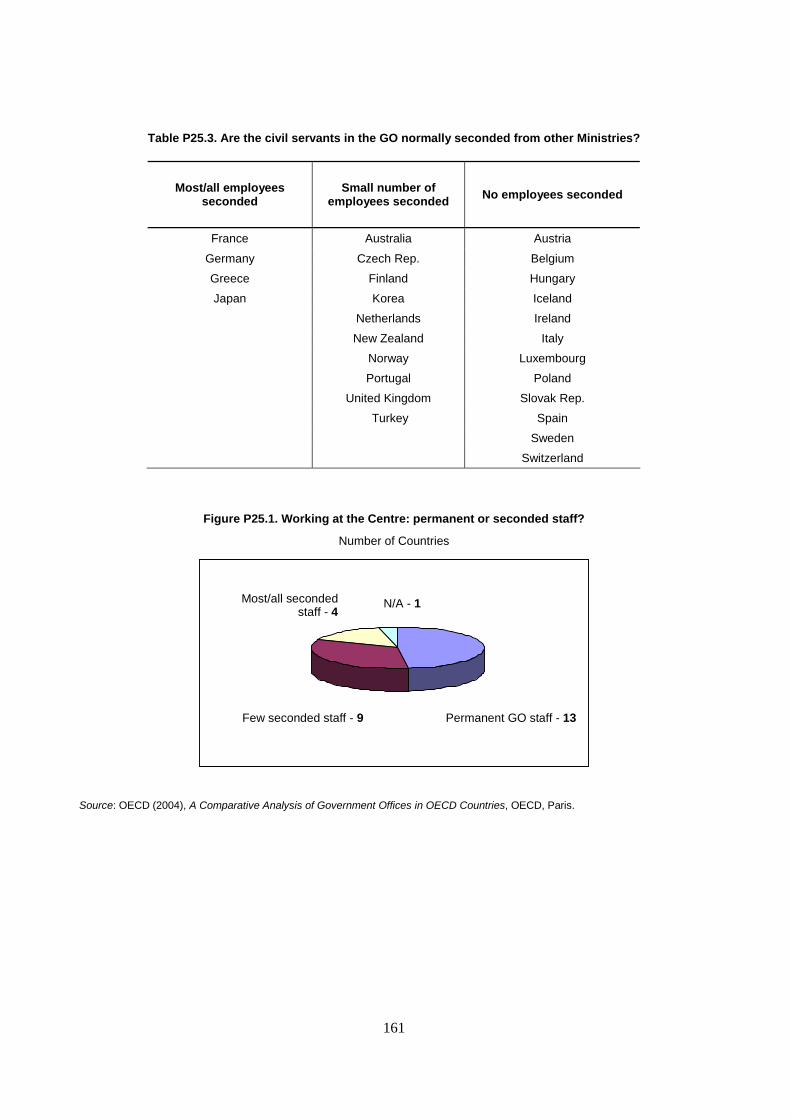
161
Table P25.3. Are the civil servants in the GO normally seconded from other Ministries?
Most/all employees seconded
Small number of employees seconded No employees seconded
France Australia Austria
Germany Czech Rep. Belgium
Greece Finland Hungary
Japan Korea Iceland
Netherlands Ireland
New Zealand Italy
Norway Luxembourg
Portugal Poland
United Kingdom Slovak Rep.
Turkey Spain
Sweden
Switzerland
Figure P25.1. Working at the Centre: permanent or seconded staff?
Number of Countries
Source: OECD (2004), A Comparative Analysis of Government Offices in OECD Countries, OECD, Paris.
N/A - 1 Most/all seconded
staff - 4
Few seconded staff - 9
Permanent GO staff - 13
162
P26. COMMUNICATION BY GOVERNMENT OFFICES
Key contact: Joanne Caddy, OECD GOV
It is an almost universal trend in democracies to strengthen the link between policy-making and public communication. While all ministers and ministries will insist on having their own communications capability, virtually all OECD governments also place an overall responsibility for communications at the Government Office.
About this indicator:
The Government Office has the overall responsibility for communications in order to: • Speak on behalf of the Government as a whole. • Support the Prime Ministers when speaking on behalf of the Government collectively. • Ensure that the information provided by one Ministry is consistent with information issued by others, that initiatives
are synchronized and that announcements are timed to maximize their impact.
Common mechanisms used for coordinating communications are: • a requirement that every proposal submitted to the Cabinet of Minister should include a section proposing how the
decision should be communicated to the public; • weekly meetings of the communications advisers of Ministers, chaired by the Government Spokesperson; • a weekly item on communications in the Cabinet of Minister meeting; and a system within the GO for strategic
communications planning.
Highlights:
All OECD countries place the responsibility for managing the communications units at the centre of Government, except Australia, Czech Republic and France. The number of staff employed in these units varies enormously: from a total of 100 staff in the Government Office and Prime Minister’s Office in the UK to 3 in the Prime Minister’s Office in Belgium and 3 in the Government Office in New Zealand.
Trends:
In an information age, the pressure on governments to meet rising public demands for timely, relevant and reliable information has led most OECD countries to strengthen the public communication functions of the Government Office and the Prime Minister’s Office. The rise of Internet and 24-hr TV coverage has plunged Government Offices into a global information marketplace where they must ‘compete’ with many other information sources. At the same time, new ICT have provided the tools for more direct communication between governments and their citizens.
Further reading:
OECD (2004), A Comparative Analysis of Government Offices in OECD Countries, OECD, Paris.
Aspects of government measured by the indicator: General government Activities
of: Central State Local Social security funds
Other public sector Private sector in the public domain
Production stage:
Revenues Inputs Public sector processes
Outputs and intermediate outcomes Final outcomes Antecedents or constraints
Functional sector:
General public services
Defence Public order & safety
Economic affairs
Environmental protection
Housing & community amenities
Health Recreation, culture and religion
Education Social protection
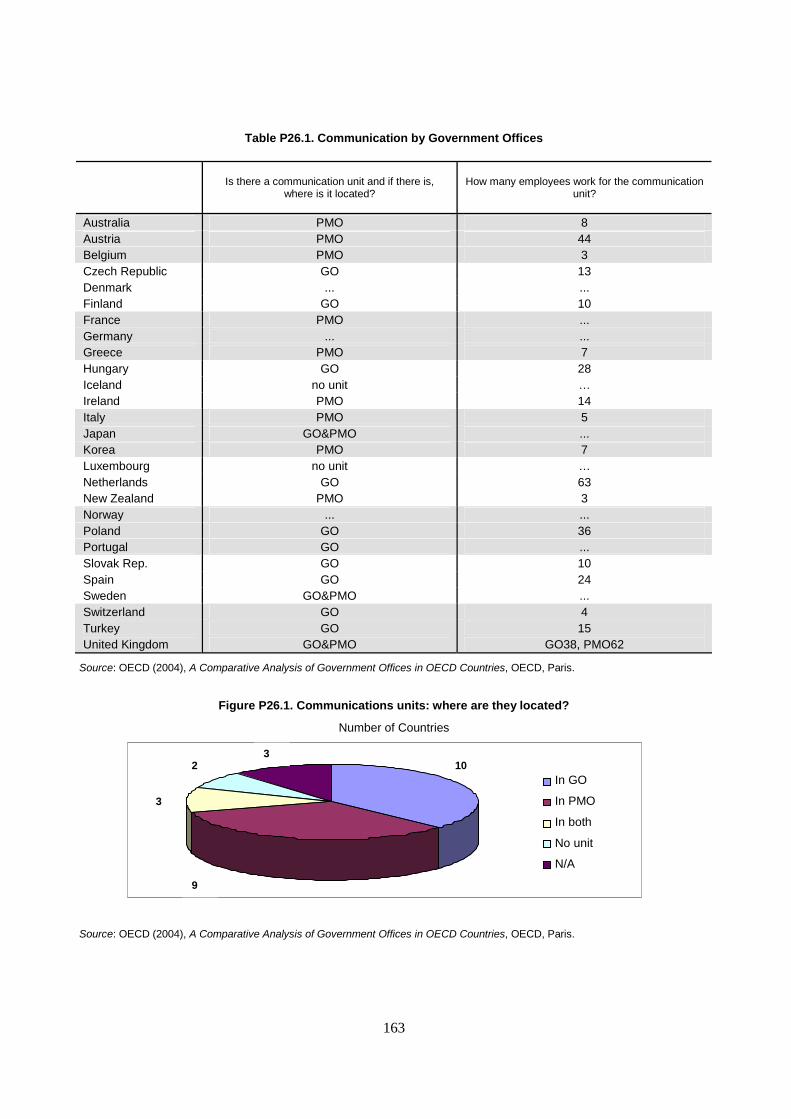
163
Table P26.1. Communication by Government Offices
Is there a communication unit and if there is, where is it located?
How many employees work for the communication unit?
Australia PMO 8 Austria PMO 44 Belgium PMO 3 Czech Republic GO 13 Denmark ... ... Finland GO 10 France PMO ... Germany ... ... Greece PMO 7 Hungary GO 28 Iceland no unit … Ireland PMO 14 Italy PMO 5 Japan GO&PMO ... Korea PMO 7 Luxembourg no unit … Netherlands GO 63 New Zealand PMO 3 Norway ... ... Poland GO 36 Portugal GO ... Slovak Rep. GO 10 Spain GO 24 Sweden GO&PMO ... Switzerland GO 4 Turkey GO 15 United Kingdom GO&PMO GO38, PMO62
Source: OECD (2004), A Comparative Analysis of Government Offices in OECD Countries, OECD, Paris.
Figure P26.1. Communications units: where are they located?
Number of Countries
Source: OECD (2004), A Comparative Analysis of Government Offices in OECD Countries, OECD, Paris.
In GO
In PMO
In both
No unit
N/A
10
9
3
2 3
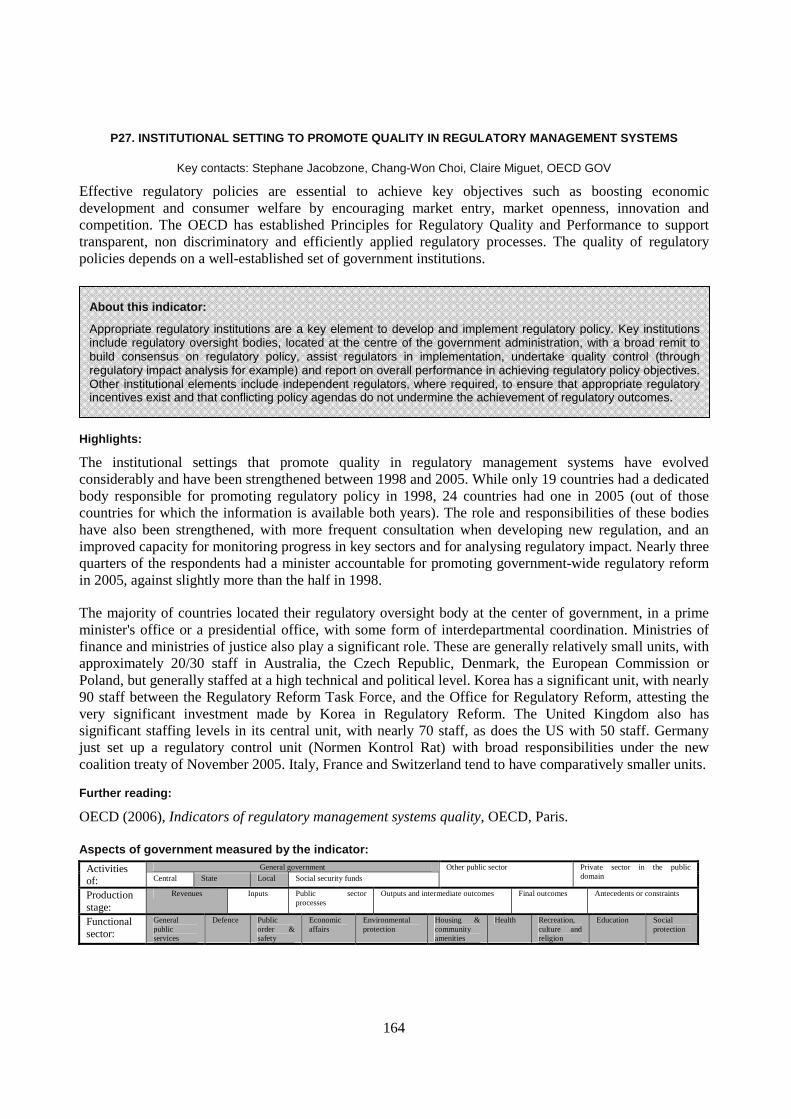
164
P27. INSTITUTIONAL SETTING TO PROMOTE QUALITY IN REGULATORY MANAGEMENT SYSTEMS
Key contacts: Stephane Jacobzone, Chang-Won Choi, Claire Miguet, OECD GOV
Effective regulatory policies are essential to achieve key objectives such as boosting economic development and consumer welfare by encouraging market entry, market openness, innovation and competition. The OECD has established Principles for Regulatory Quality and Performance to support transparent, non discriminatory and efficiently applied regulatory processes. The quality of regulatory policies depends on a well-established set of government institutions.
Highlights:
The institutional settings that promote quality in regulatory management systems have evolved considerably and have been strengthened between 1998 and 2005. While only 19 countries had a dedicated body responsible for promoting regulatory policy in 1998, 24 countries had one in 2005 (out of those countries for which the information is available both years). The role and responsibilities of these bodies have also been strengthened, with more frequent consultation when developing new regulation, and an improved capacity for monitoring progress in key sectors and for analysing regulatory impact. Nearly three quarters of the respondents had a minister accountable for promoting government-wide regulatory reform in 2005, against slightly more than the half in 1998.
The majority of countries located their regulatory oversight body at the center of government, in a prime minister's office or a presidential office, with some form of interdepartmental coordination. Ministries of finance and ministries of justice also play a significant role. These are generally relatively small units, with approximately 20/30 staff in Australia, the Czech Republic, Denmark, the European Commission or Poland, but generally staffed at a high technical and political level. Korea has a significant unit, with nearly 90 staff between the Regulatory Reform Task Force, and the Office for Regulatory Reform, attesting the very significant investment made by Korea in Regulatory Reform. The United Kingdom also has significant staffing levels in its central unit, with nearly 70 staff, as does the US with 50 staff. Germany just set up a regulatory control unit (Normen Kontrol Rat) with broad responsibilities under the new coalition treaty of November 2005. Italy, France and Switzerland tend to have comparatively smaller units. Further reading:
OECD (2006), Indicators of regulatory management systems quality, OECD, Paris. Aspects of government measured by the indicator:
General government Activities of: Central State Local Social security funds
Other public sector Private sector in the public domain
Production stage:
Revenues Inputs Public sector processes
Outputs and intermediate outcomes Final outcomes Antecedents or constraints
Functional sector:
General public services
Defence Public order & safety
Economic affairs
Environmental protection
Housing & community amenities
Health Recreation, culture and religion
Education Social protection
About this indicator:
Appropriate regulatory institutions are a key element to develop and implement regulatory policy. Key institutions include regulatory oversight bodies, located at the centre of the government administration, with a broad remit to build consensus on regulatory policy, assist regulators in implementation, undertake quality control (through regulatory impact analysis for example) and report on overall performance in achieving regulatory policy objectives. Other institutional elements include independent regulators, where required, to ensure that appropriate regulatory incentives exist and that conflicting policy agendas do not undermine the achievement of regulatory outcomes.
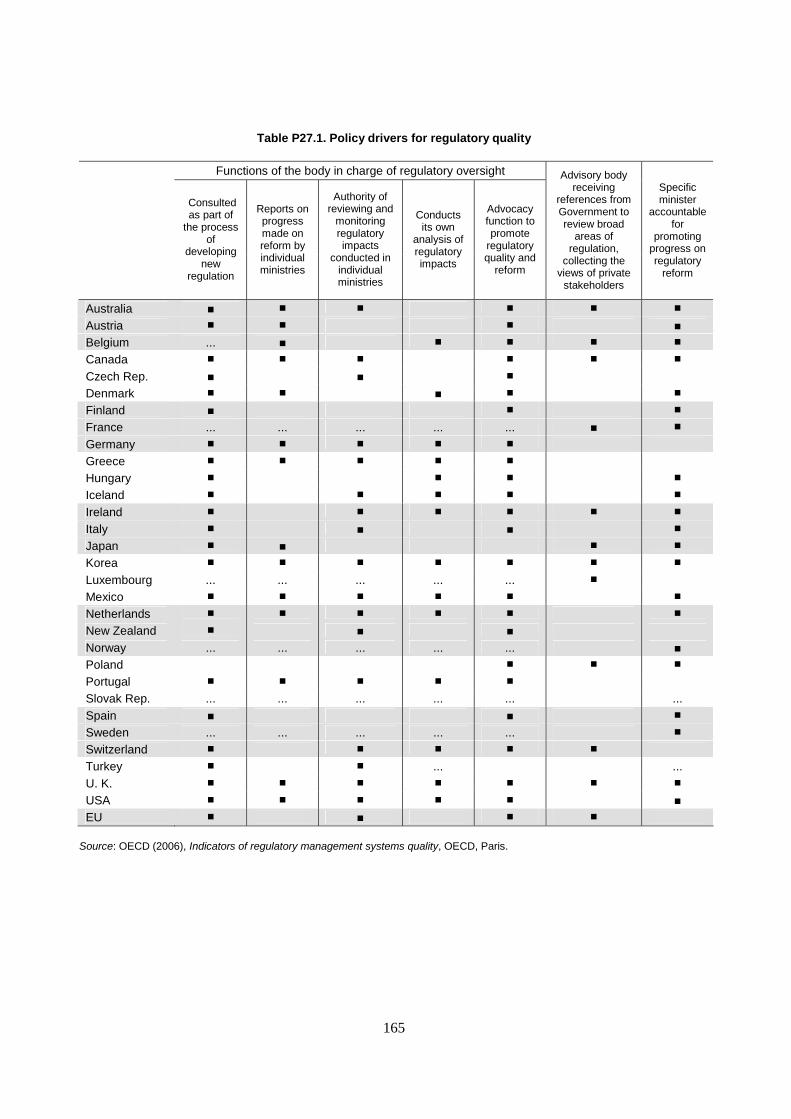
165
Table P27.1. Policy drivers for regulatory quality
Functions of the body in charge of regulatory oversight
Consulted as part of
the process of
developing new
regulation
Reports on progress made on reform by individual ministries
Authority of reviewing and
monitoring regulatory impacts
conducted in individual ministries
Conducts its own
analysis of regulatory impacts
Advocacy function to promote
regulatory quality and
reform
Advisory body receiving
references from Government to review broad
areas of regulation,
collecting the views of private
stakeholders
Specific minister
accountable for
promoting progress on regulatory
reform
Australia ■ ■ ■ ■ ■ ■ Austria ■ ■ ■ ■ Belgium ... ■ ■ ■ ■ ■ Canada ■ ■ ■ ■ ■ ■ Czech Rep. ■ ■ ■ Denmark ■ ■ ■ ■ ■ Finland ■ ■ ■ France ... ... ... ... ... ■ ■ Germany ■ ■ ■ ■ ■ Greece ■ ■ ■ ■ ■ Hungary ■ ■ ■ ■ Iceland ■ ■ ■ ■ ■ Ireland ■ ■ ■ ■ ■ ■ Italy ■ ■ ■ ■ Japan ■ ■ ■ ■ Korea ■ ■ ■ ■ ■ ■ ■ Luxembourg ... ... ... ... ... ■ Mexico ■ ■ ■ ■ ■ ■ Netherlands ■ ■ ■ ■ ■ ■ New Zealand ■ ■ ■ Norway ... ... ... ... ... ■ Poland ■ ■ ■ Portugal ■ ■ ■ ■ ■ Slovak Rep. ... ... ... ... ... ... Spain ■ ■ ■ Sweden ... ... ... ... ... ■ Switzerland ■ ■ ■ ■ ■ Turkey ■ ■ ... ... U. K. ■ ■ ■ ■ ■ ■ ■ USA ■ ■ ■ ■ ■ ■ EU ■ ■ ■ ■
Source: OECD (2006), Indicators of regulatory management systems quality, OECD, Paris.
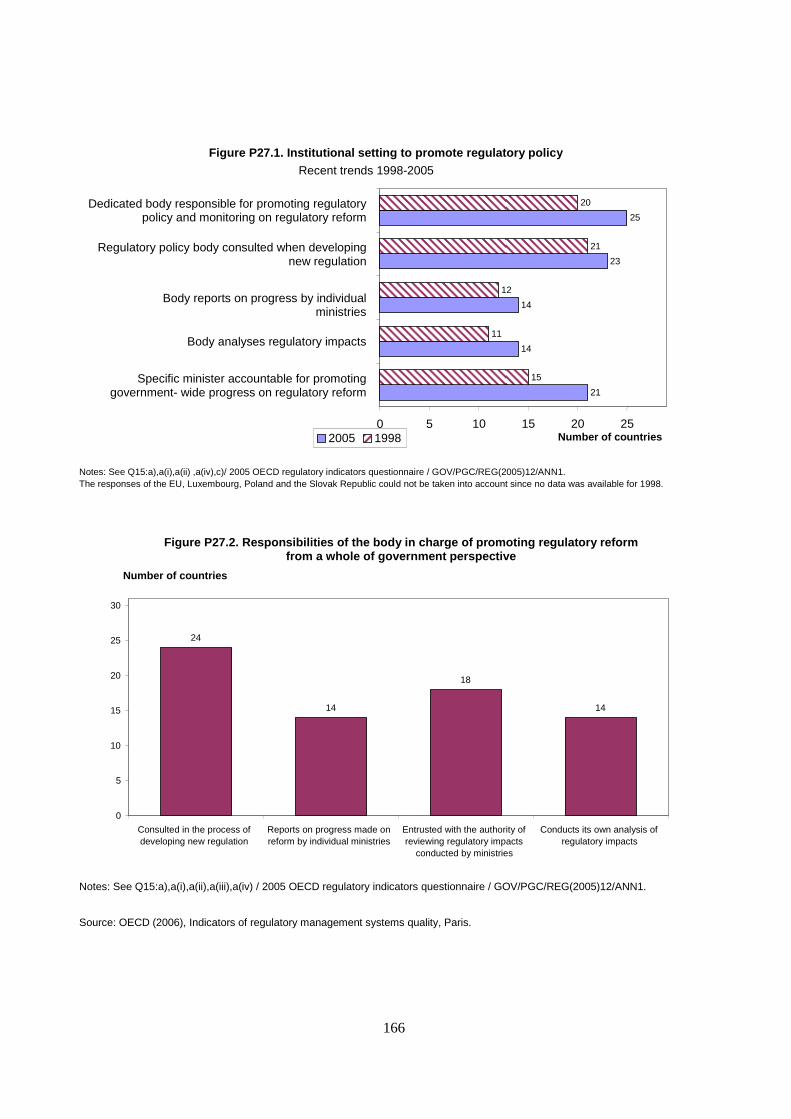
166
Source: OECD (2006), Indicators of regulatory management systems quality, Paris.
Figure P27.2. Responsibilities of the body in charge of promoting regulatory reform from a whole of government perspective
24
14
18
14
0
5
10
15
20
25
30
Consulted in the process of developing new regulation
Reports on progress made on reform by individual ministries
Entrusted with the authority of reviewing regulatory impacts
conducted by ministries
Conducts its own analysis of regulatory impacts
Number of countries
Notes: See Q15:a),a(i),a(ii),a(iii),a(iv) / 2005 OECD regulatory indicators questionnaire / GOV/PGC/REG(2005)12/ANN1.
Figure P27.1. Institutional setting to promote regulatory policy
Recent trends 1998-2005
21
14
14
23
25
15
11
12
21
20
0 5 10 15 20 25
Specific minister accountable for promoting government- wide progress on regulatory reform
Body analyses regulatory impacts
Body reports on progress by individual ministries
Regulatory policy body consulted when developing new regulation
Dedicated body responsible for promoting regulatory policy and monitoring on regulatory reform
Number of countries 2005 1998
Notes: See Q15:a),a(i),a(ii) ,a(iv),c)/ 2005 OECD regulatory indicators questionnaire / GOV/PGC/REG(2005)12/ANN1. The responses of the EU, Luxembourg, Poland and the Slovak Republic could not be taken into account since no data was available for 1998.

167
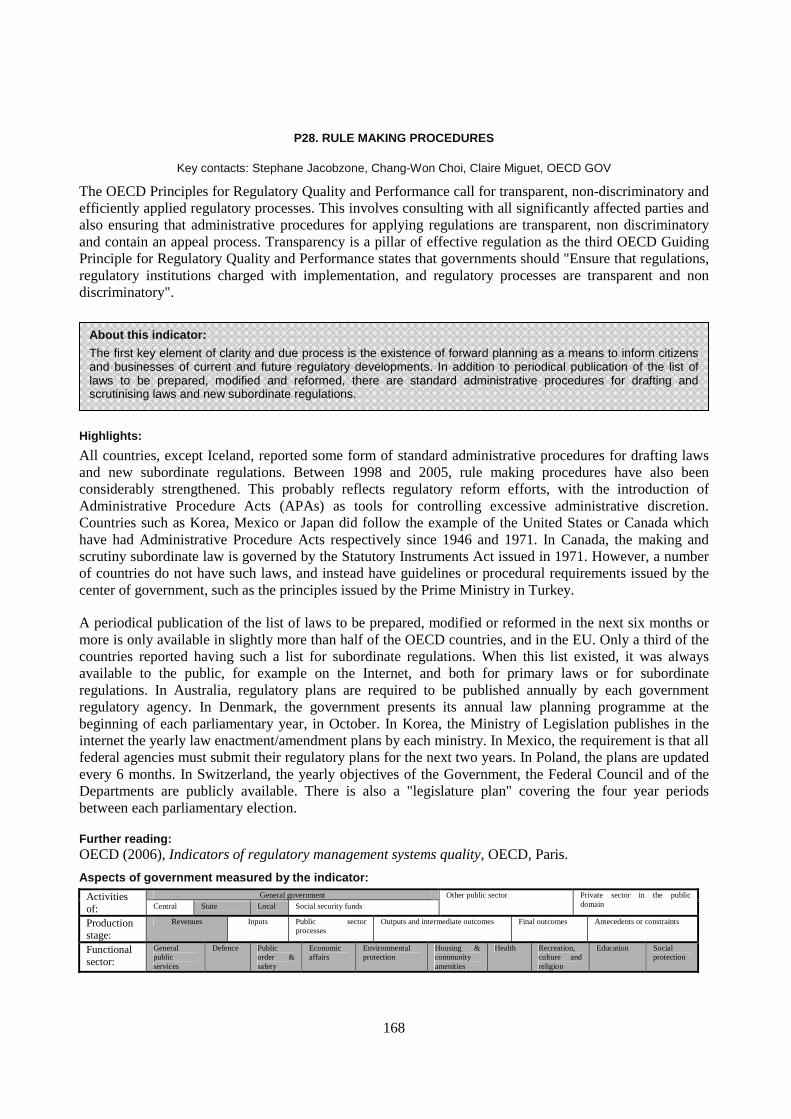
168
P28. RULE MAKING PROCEDURES
Key contacts: Stephane Jacobzone, Chang-Won Choi, Claire Miguet, OECD GOV
The OECD Principles for Regulatory Quality and Performance call for transparent, non-discriminatory and efficiently applied regulatory processes. This involves consulting with all significantly affected parties and also ensuring that administrative procedures for applying regulations are transparent, non discriminatory and contain an appeal process. Transparency is a pillar of effective regulation as the third OECD Guiding Principle for Regulatory Quality and Performance states that governments should "Ensure that regulations, regulatory institutions charged with implementation, and regulatory processes are transparent and non discriminatory".
Highlights:
All countries, except Iceland, reported some form of standard administrative procedures for drafting laws and new subordinate regulations. Between 1998 and 2005, rule making procedures have also been considerably strengthened. This probably reflects regulatory reform efforts, with the introduction of Administrative Procedure Acts (APAs) as tools for controlling excessive administrative discretion. Countries such as Korea, Mexico or Japan did follow the example of the United States or Canada which have had Administrative Procedure Acts respectively since 1946 and 1971. In Canada, the making and scrutiny subordinate law is governed by the Statutory Instruments Act issued in 1971. However, a number of countries do not have such laws, and instead have guidelines or procedural requirements issued by the center of government, such as the principles issued by the Prime Ministry in Turkey.
A periodical publication of the list of laws to be prepared, modified or reformed in the next six months or more is only available in slightly more than half of the OECD countries, and in the EU. Only a third of the countries reported having such a list for subordinate regulations. When this list existed, it was always available to the public, for example on the Internet, and both for primary laws or for subordinate regulations. In Australia, regulatory plans are required to be published annually by each government regulatory agency. In Denmark, the government presents its annual law planning programme at the beginning of each parliamentary year, in October. In Korea, the Ministry of Legislation publishes in the internet the yearly law enactment/amendment plans by each ministry. In Mexico, the requirement is that all federal agencies must submit their regulatory plans for the next two years. In Poland, the plans are updated every 6 months. In Switzerland, the yearly objectives of the Government, the Federal Council and of the Departments are publicly available. There is also a "legislature plan" covering the four year periods between each parliamentary election.
Further reading: OECD (2006), Indicators of regulatory management systems quality, OECD, Paris.
Aspects of government measured by the indicator: General government Activities
of: Central State Local Social security funds
Other public sector Private sector in the public domain
Production stage:
Revenues Inputs Public sector processes
Outputs and intermediate outcomes Final outcomes Antecedents or constraints
Functional sector:
General public services
Defence Public order & safety
Economic affairs
Environmental protection
Housing & community amenities
Health Recreation, culture and religion
Education Social protection
About this indicator:
The first key element of clarity and due process is the existence of forward planning as a means to inform citizens and businesses of current and future regulatory developments. In addition to periodical publication of the list of laws to be prepared, modified and reformed, there are standard administrative procedures for drafting and scrutinising laws and new subordinate regulations.
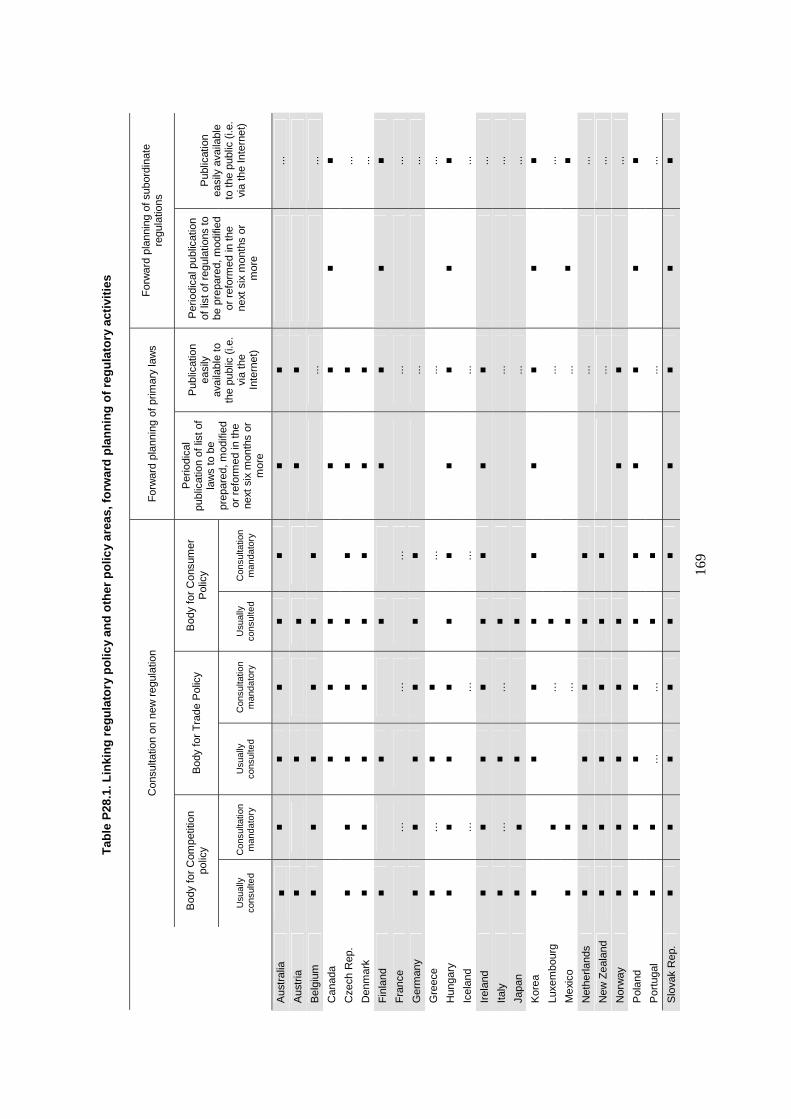
16
9
Tab
le P
28.1
. Lin
kin
g r
egu
lato
ry p
olic
y an
d o
ther
po
licy
area
s, f
orw
ard
pla
nn
ing
of
reg
ula
tory
act
ivit
ies
Con
sulta
tion
on n
ew r
egul
atio
n
For
war
d pl
anni
ng o
f prim
ary
law
s F
orw
ard
plan
ning
of s
ubor
dina
te
regu
latio
ns
Bod
y fo
r C
ompe
titio
n po
licy
B
ody
for
Tra
de P
olic
y B
ody
for
Con
sum
er
Pol
icy
Usu
ally
co
nsul
ted
Con
sulta
tion
man
dato
ry
Usu
ally
co
nsul
ted
Con
sulta
tion
man
dato
ry
Usu
ally
co
nsul
ted
Con
sulta
tion
man
dato
ry
Per
iodi
cal
publ
icat
ion
of li
st o
f la
ws
to b
e pr
epar
ed, m
odifi
ed
or r
efor
med
in th
e ne
xt s
ix m
onth
s or
m
ore
Pub
licat
ion
easi
ly
avai
labl
e to
th
e pu
blic
(i.e
. vi
a th
e In
tern
et)
Per
iodi
cal p
ublic
atio
n of
list
of r
egul
atio
ns to
be
pre
pare
d, m
odifi
ed
or r
efor
med
in th
e ne
xt s
ix m
onth
s or
m
ore
Pub
licat
ion
easi
ly a
vaila
ble
to th
e pu
blic
(i.e
. vi
a th
e In
tern
et)
Aus
tral
ia
■ ■
■ ■
■ ■
■ ■
...
Aus
tria
■
■
■
■
■
Bel
gium
■
■ ■
■ ■
■
...
...
Can
ada
■ ■
■
■ ■
■ ■
Cze
ch R
ep.
■ ■
■ ■
■ ■
■ ■
...
Den
mar
k ■
■ ■
■ ■
■ ■
■
...
Fin
land
■
■
■
■
■ ■
■ F
ranc
e
…
…
…
...
...
Ger
man
y ■
■ ■
■ ■
■
...
...
Gre
ece
■ …
■
■
…
...
...
Hun
gary
■
■ ■
■ ■
■ ■
■ ■
■ Ic
elan
d
…
…
…
...
...
Irel
and
■ ■
■ ■
■ ■
■ ■
...
Italy
■
…
■ …
■
...
...
Japa
n ■
■ ■
■
...
...
Kor
ea
■
■ ■
■ ■
■ ■
■ ■
Luxe
mbo
urg
■
…
■
...
...
Mex
ico
■ ■
…
■
...
■ ■
Net
herla
nds
■ ■
■ ■
■ ■
...
...
New
Zea
land
■
■ ■
■ ■
■
...
...
Nor
way
■
■ ■
■ ■
■
■
...
Pol
and
■ ■
■ ■
■ ■
■ ■
■ ■
Por
tuga
l ■
■ …
…
■
■
...
...
Slo
vak
Rep
. ■
■ ■
■ ■
■ ■
■ ■
■
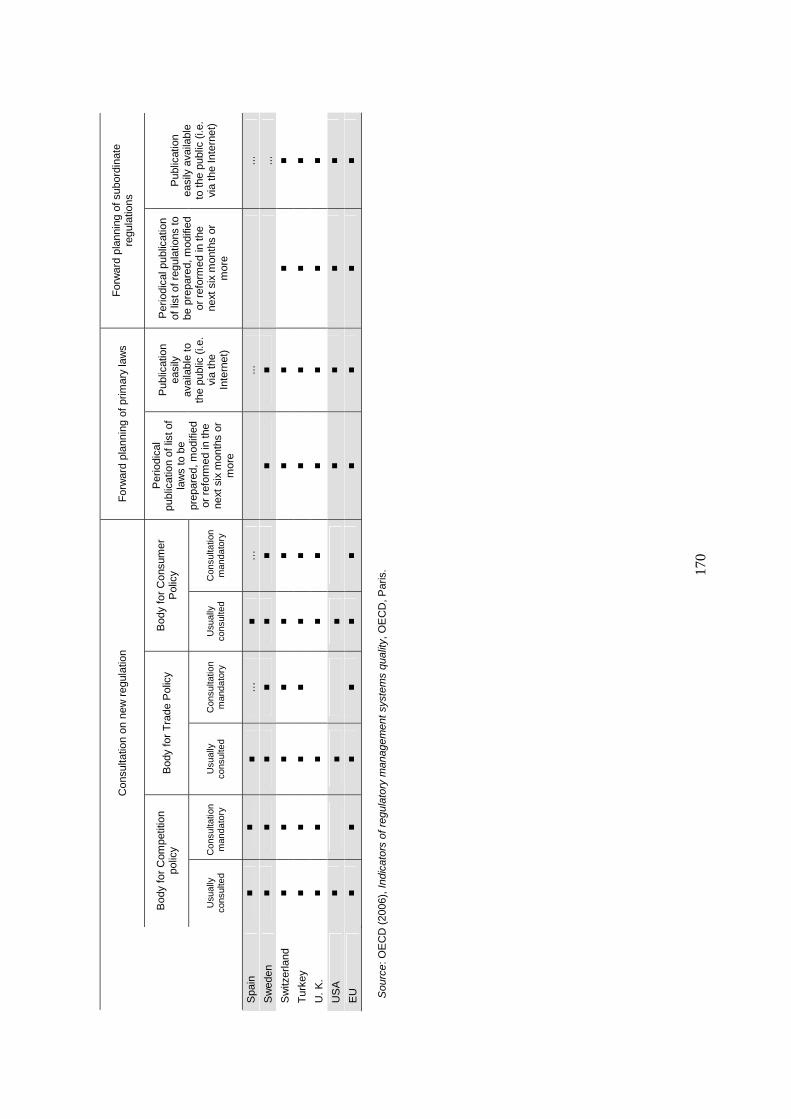
17
0
Con
sulta
tion
on n
ew r
egul
atio
n
For
war
d pl
anni
ng o
f prim
ary
law
s F
orw
ard
plan
ning
of s
ubor
dina
te
regu
latio
ns
Bod
y fo
r C
ompe
titio
n po
licy
B
ody
for
Tra
de P
olic
y B
ody
for
Con
sum
er
Pol
icy
Usu
ally
co
nsul
ted
Con
sulta
tion
man
dato
ry
Usu
ally
co
nsul
ted
Con
sulta
tion
man
dato
ry
Usu
ally
co
nsul
ted
Con
sulta
tion
man
dato
ry
Per
iodi
cal
publ
icat
ion
of li
st o
f la
ws
to b
e pr
epar
ed, m
odifi
ed
or r
efor
med
in th
e ne
xt s
ix m
onth
s or
m
ore
Pub
licat
ion
easi
ly
avai
labl
e to
th
e pu
blic
(i.e
. vi
a th
e In
tern
et)
Per
iodi
cal p
ublic
atio
n of
list
of r
egul
atio
ns to
be
pre
pare
d, m
odifi
ed
or r
efor
med
in th
e ne
xt s
ix m
onth
s or
m
ore
Pub
licat
ion
easi
ly a
vaila
ble
to th
e pu
blic
(i.e
. vi
a th
e In
tern
et)
Spa
in
■ ■
■ …
■
…
...
...
Sw
eden
■
■ ■
■ ■
■ ■
■
...
Sw
itzer
land
■
■ ■
■ ■
■ ■
■ ■
■ T
urke
y ■
■ ■
■ ■
■ ■
■ ■
■ U
. K.
■ ■
■
■ ■
■ ■
■ ■
US
A
■
■
■
■ ■
■ ■
EU
■
■ ■
■ ■
■ ■
■ ■
■
Sou
rce:
OE
CD
(20
06),
Indi
cato
rs o
f reg
ulat
ory
man
agem
ent s
yste
ms
qual
ity, O
EC
D, P
aris
.
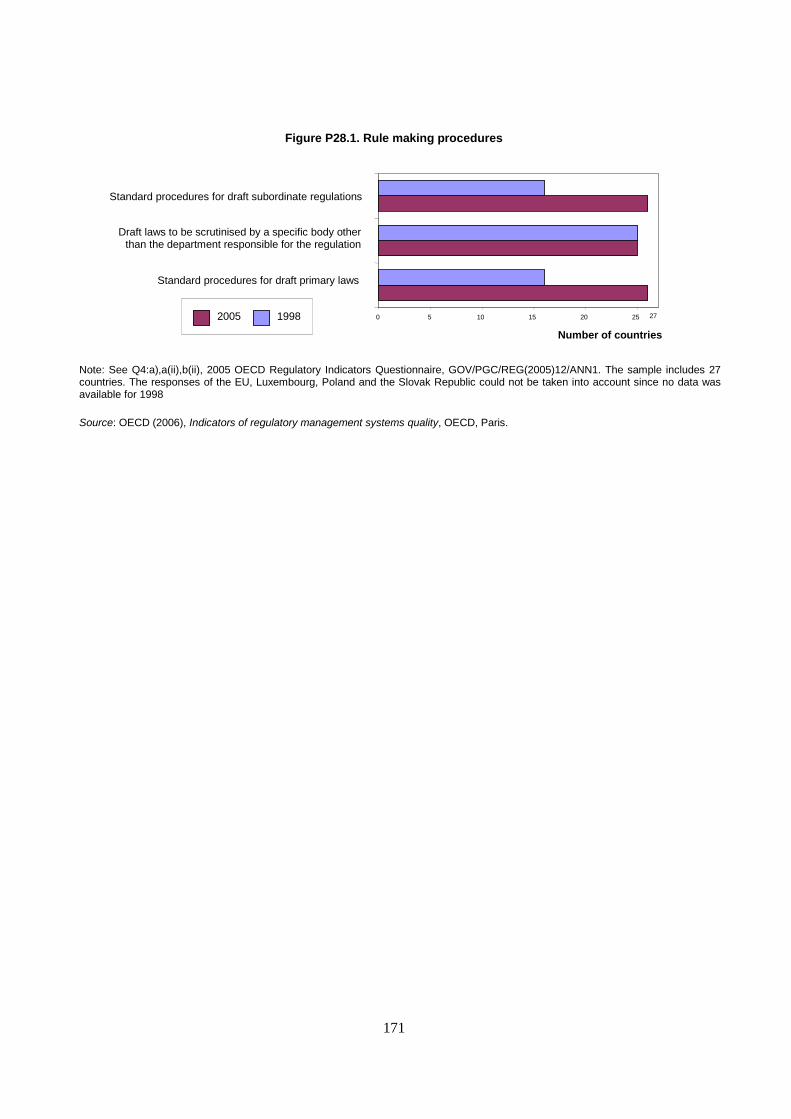
171
Figure P28.1. Rule making procedures
Source: OECD (2006), Indicators of regulatory management systems quality, OECD, Paris.
0 5 10 15 20 25
Standard procedures for draft primary laws
Draft laws to be scrutinised by a specific body other than the department responsible for the regulation
Standard procedures for draft subordinate regulations
Number of countries
2005 1998
Note: See Q4:a),a(ii),b(ii), 2005 OECD Regulatory Indicators Questionnaire, GOV/PGC/REG(2005)12/ANN1. The sample includes 27 countries. The responses of the EU, Luxembourg, Poland and the Slovak Republic could not be taken into account since no data was available for 1998
.
27
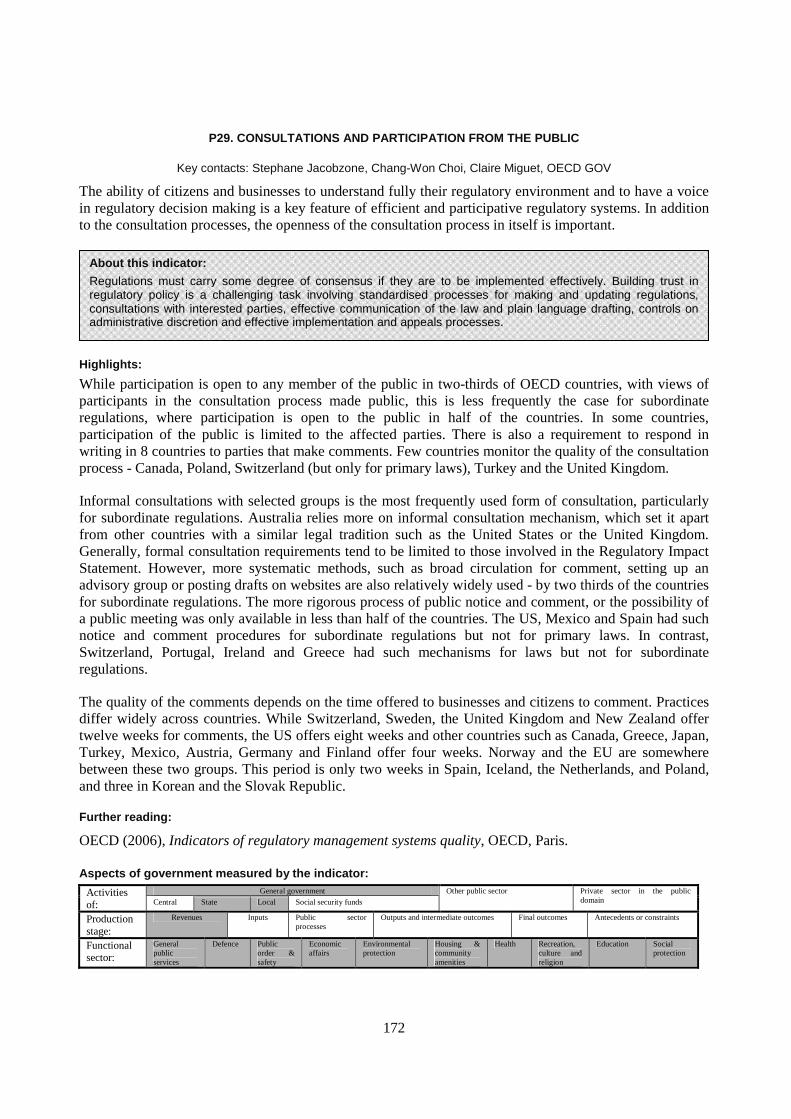
172
P29. CONSULTATIONS AND PARTICIPATION FROM THE PUBLIC
Key contacts: Stephane Jacobzone, Chang-Won Choi, Claire Miguet, OECD GOV
The ability of citizens and businesses to understand fully their regulatory environment and to have a voice in regulatory decision making is a key feature of efficient and participative regulatory systems. In addition to the consultation processes, the openness of the consultation process in itself is important.
Highlights:
While participation is open to any member of the public in two-thirds of OECD countries, with views of participants in the consultation process made public, this is less frequently the case for subordinate regulations, where participation is open to the public in half of the countries. In some countries, participation of the public is limited to the affected parties. There is also a requirement to respond in writing in 8 countries to parties that make comments. Few countries monitor the quality of the consultation process - Canada, Poland, Switzerland (but only for primary laws), Turkey and the United Kingdom.
Informal consultations with selected groups is the most frequently used form of consultation, particularly for subordinate regulations. Australia relies more on informal consultation mechanism, which set it apart from other countries with a similar legal tradition such as the United States or the United Kingdom. Generally, formal consultation requirements tend to be limited to those involved in the Regulatory Impact Statement. However, more systematic methods, such as broad circulation for comment, setting up an advisory group or posting drafts on websites are also relatively widely used - by two thirds of the countries for subordinate regulations. The more rigorous process of public notice and comment, or the possibility of a public meeting was only available in less than half of the countries. The US, Mexico and Spain had such notice and comment procedures for subordinate regulations but not for primary laws. In contrast, Switzerland, Portugal, Ireland and Greece had such mechanisms for laws but not for subordinate regulations.
The quality of the comments depends on the time offered to businesses and citizens to comment. Practices differ widely across countries. While Switzerland, Sweden, the United Kingdom and New Zealand offer twelve weeks for comments, the US offers eight weeks and other countries such as Canada, Greece, Japan, Turkey, Mexico, Austria, Germany and Finland offer four weeks. Norway and the EU are somewhere between these two groups. This period is only two weeks in Spain, Iceland, the Netherlands, and Poland, and three in Korean and the Slovak Republic.
Further reading:
OECD (2006), Indicators of regulatory management systems quality, OECD, Paris. Aspects of government measured by the indicator:
General government Activities of: Central State Local Social security funds
Other public sector Private sector in the public domain
Production stage:
Revenues Inputs Public sector processes
Outputs and intermediate outcomes Final outcomes Antecedents or constraints
Functional sector:
General public services
Defence Public order & safety
Economic affairs
Environmental protection
Housing & community amenities
Health Recreation, culture and religion
Education Social protection
About this indicator:
Regulations must carry some degree of consensus if they are to be implemented effectively. Building trust in regulatory policy is a challenging task involving standardised processes for making and updating regulations, consultations with interested parties, effective communication of the law and plain language drafting, controls on administrative discretion and effective implementation and appeals processes.
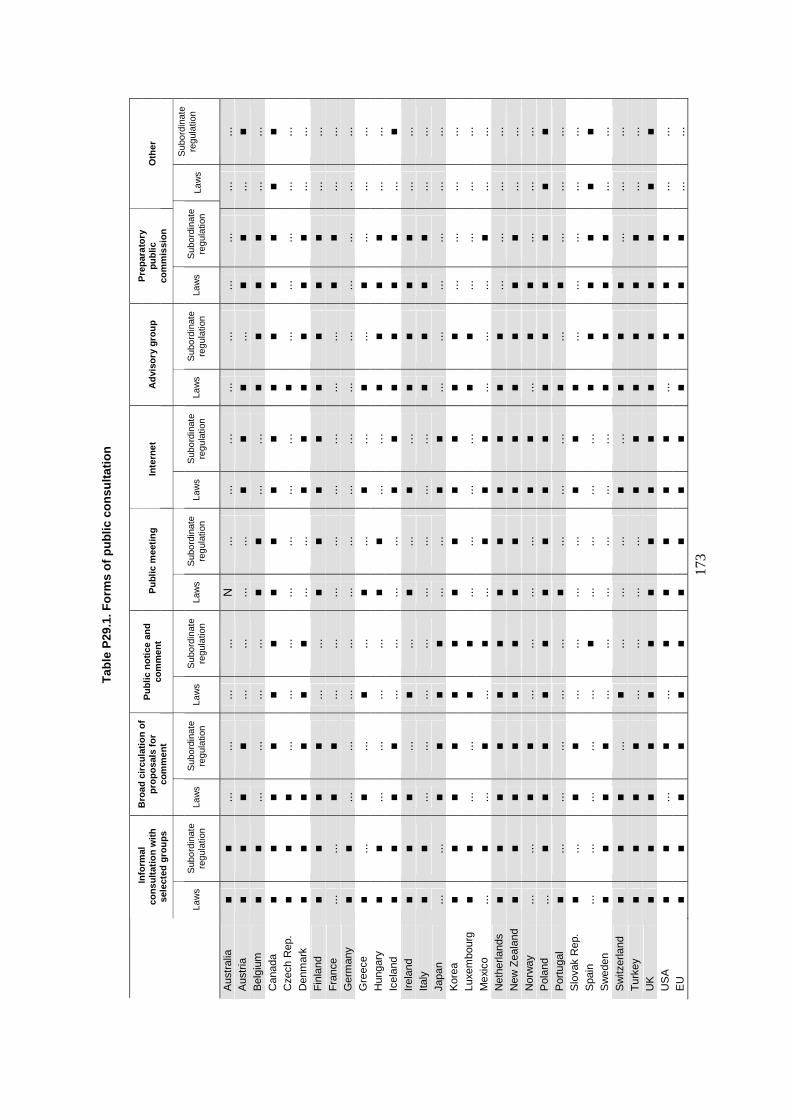
17
3
Tab
le P
29.1
. Fo
rms
of
pu
blic
co
nsu
ltat
ion
Info
rmal
co
nsu
ltat
ion
wit
h
sele
cted
gro
up
s
Bro
ad c
ircu
lati
on
of
pro
po
sals
fo
r co
mm
ent
Pu
blic
no
tice
an
d
com
men
t P
ub
lic m
eeti
ng
In
tern
et
Ad
viso
ry g
rou
p
Pre
par
ato
ry
pu
blic
co
mm
issi
on
O
ther
Law
s S
ubor
dina
te
regu
latio
n La
ws
Sub
ordi
nate
re
gula
tion
Law
s S
ubor
dina
te
regu
latio
n La
ws
Sub
ordi
nate
re
gula
tion
Law
s S
ubor
dina
te
regu
latio
n La
ws
Sub
ordi
nate
re
gula
tion
Law
s S
ubor
dina
te
regu
latio
n La
ws
Sub
ordi
nate
re
gula
tion
Aus
tral
ia
■ ■
...
...
...
...
N
...
...
…
...
...
...
...
...
...
Aus
tria
■
■ ■
■ ...
...
...
...
■
■ ■
...
■ ■
...
■ B
elgi
um
■ ■
...
...
...
...
■ ■
...
…
■ ■
■ ■
...
...
Can
ada
■ ■
■ ■
■ ■
■ ■
■ ■
■ ■
■ ■
■ ■
Cze
ch R
ep.
■ ■
■ ...
...
...
...
...
...
…
■
...
...
...
...
...
Den
mar
k ■
■ ■
■ ■
■ ...
...
■
■ ■
■ ■
■ ...
...
F
inla
nd
■ ■
■ ■
...
...
■ ■
■ ■
■ ■
■ ■
...
...
Fra
nce
...
...
■ ■
...
...
...
...
...
…
...
...
■ ■
...
...
Ger
man
y ■
■ ...
...
...
...
...
...
...
…
...
...
...
...
...
...
G
reec
e ■
...
■ ...
■
...
■ ...
■
…
■ ...
■
...
...
...
Hun
gary
■
■ ...
...
...
...
■
■ ...
…
■
■ ■
■ ...
...
Ic
elan
d ■
■ ■
■ ...
...
...
...
■
■ ■
■ ■
■ ...
■
Irel
and
■ ■
■ ...
■
...
■ ...
■
…
■ ■
■ ■
...
...
Italy
■
■ ...
...
...
...
...
...
...
…
■
■ ■
■ ...
...
Ja
pan
...
...
■ ■
■ ■
...
...
■ ■
...
...
...
...
...
...
Kor
ea
■ ■
■ ■
■ ■
■ ■
■ ■
■ ■
...
...
...
...
Luxe
mbo
urg
■ ■
...
...
■ ■
...
...
...
…
■ ■
...
...
...
...
Mex
ico
...
■ ...
■
...
■ ...
■
■ ■
...
...
...
■ ...
...
N
ethe
rland
s ■
■ ■
■ ■
■ ■
■ ■
■ ■
■ ...
...
...
...
N
ew Z
eala
nd
■ ■
■ ■
■ ■
■ ■
■ ■
■ ■
■ ■
...
...
Nor
way
...
...
■
■ ...
...
...
...
■
■ ...
■
■ ...
...
...
P
olan
d ...
■
■ ■
■ ■
■ ■
■ ■
■ ■
■ ■
■ ■
Por
tuga
l ■
...
...
...
...
...
■ ...
...
…
■
...
■ ...
...
...
S
lova
k R
ep.
■ ...
■
■ ...
...
...
...
■
■ ■
...
...
...
...
...
Spa
in
...
...
...
...
...
■ ...
...
...
…
■
■ ■
■ ■
■ S
wed
en
■ ■
■ ■
...
...
...
...
...
…
■ ■
■ ■
...
...
Sw
itzer
land
■
■ ■
...
■ ...
...
...
■
…
■ ■
■ ...
...
...
T
urke
y ■
■ ■
■ ...
...
...
...
■
■ ■
■ ■
■ ...
...
U
K
■ ■
■ ■
■ ■
■ ■
■ ■
■ ■
■ ■
■ ■
US
A
■ ■
...
■ ...
■
■ ■
■ ■
...
■ ■
■ ...
...
E
U
■ ■
■ ■
■ ■
■ ■
■ ■
■ ■
■ ■
...
...
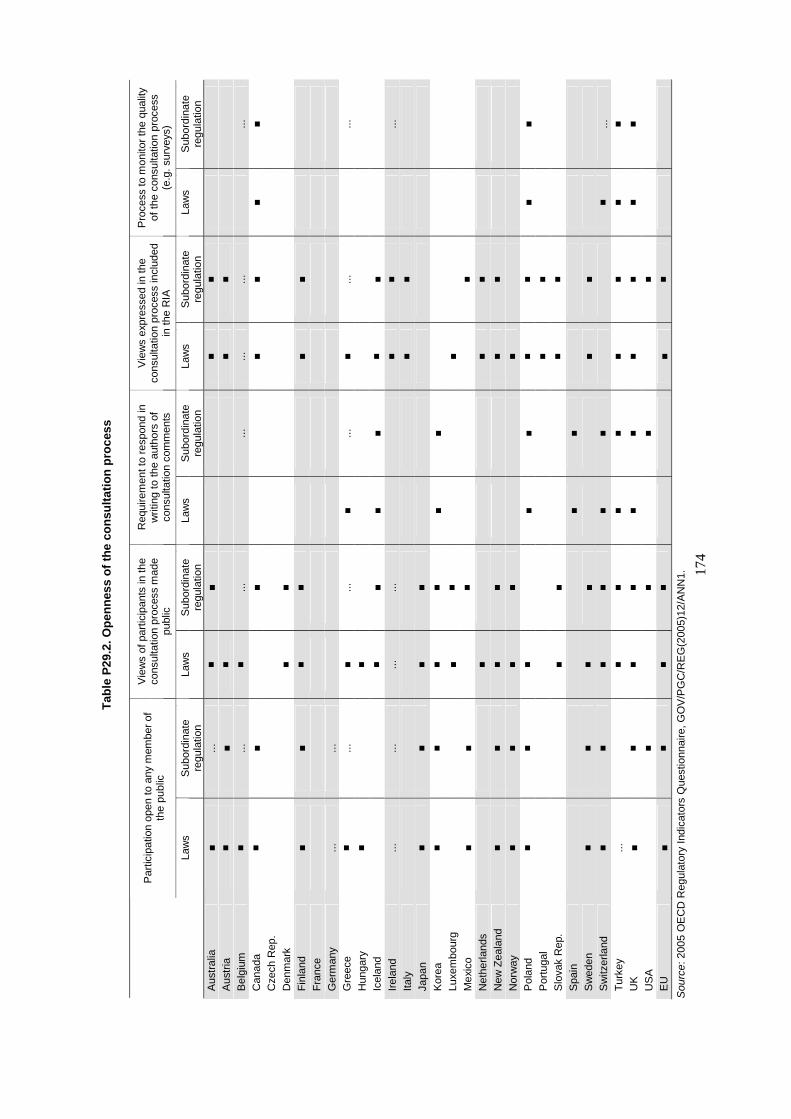
17
4
Tab
le P
29.2
. Op
enn
ess
of
the
con
sult
atio
n p
roce
ss
Par
ticip
atio
n op
en to
any
mem
ber
of
the
publ
ic
Vie
ws
of p
artic
ipan
ts in
the
cons
ulta
tion
proc
ess
mad
e pu
blic
Req
uire
men
t to
resp
ond
in
writ
ing
to th
e au
thor
s of
co
nsul
tatio
n co
mm
ents
Vie
ws
expr
esse
d in
the
cons
ulta
tion
proc
ess
incl
uded
in
the
RIA
Pro
cess
to m
onito
r th
e qu
ality
of
the
cons
ulta
tion
proc
ess
(e.g
. sur
veys
)
La
ws
Sub
ordi
nate
re
gula
tion
Law
s S
ubor
dina
te
regu
latio
n La
ws
Sub
ordi
nate
re
gula
tion
Law
s S
ubor
dina
te
regu
latio
n La
ws
Sub
ordi
nate
re
gula
tion
Aus
tral
ia
■ ...
■
■
■
■
A
ustr
ia
■ ■
■
■ ■
Bel
gium
■
...
■ ...
...
...
...
...
C
anad
a ■
■
■
■
■ ■
■ C
zech
Rep
.
D
enm
ark
■ ■
Fin
land
■
■ ■
■
■
■
F
ranc
e
G
erm
any
...
...
Gre
ece
■ ...
■
...
■ ...
■
...
...
H
unga
ry
■
■
Icel
and
■ ■
■ ■
■ ■
Irel
and
...
...
...
...
■ ■
...
Ita
ly
■ ■
Japa
n ■
■ ■
■
K
orea
■
■ ■
■ ■
■
Lu
xem
bour
g
■
■
■
M
exic
o ■
■
■
■
N
ethe
rland
s
■
■
■
N
ew Z
eala
nd
■ ■
■ ■
■ ■
Nor
way
■
■ ■
■
■
P
olan
d ■
■ ■
■
■ ■
■ ■
■ P
ortu
gal
■ ■
Slo
vak
Rep
.
■
■
■
■
S
pain
■
■
S
wed
en
■ ■
■ ■
■ ■
Sw
itzer
land
■
■ ■
■ ■
■
■
...
Tur
key
...
■
■ ■
■ ■
■ ■
■ U
K
■ ■
■ ■
■ ■
■ ■
■ ■
US
A
■
■
■
■
EU
■
■ ■
■
■
■
Sou
rce:
200
5 O
EC
D R
egul
ator
y In
dica
tors
Que
stio
nnai
re, G
OV
/PG
C/R
EG
(200
5)12
/AN
N1.
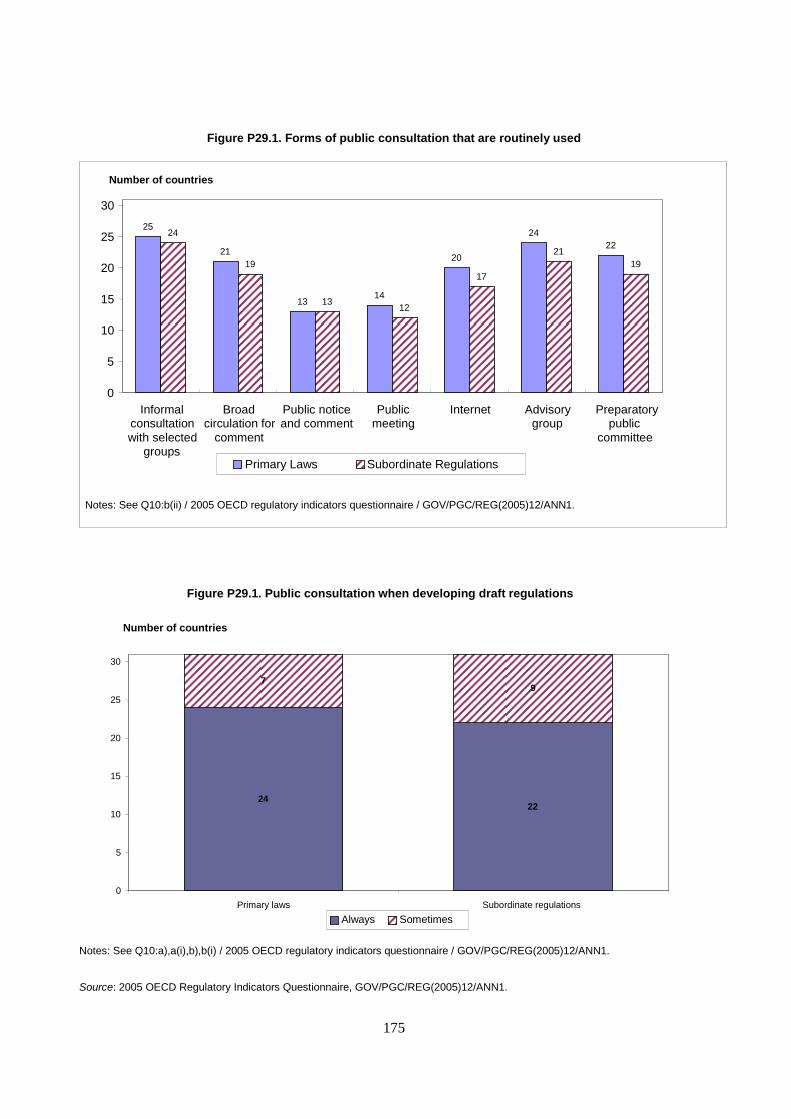
175
Figure P29.1. Forms of public consultation that are routinely used
Source: 2005 OECD Regulatory Indicators Questionnaire, GOV/PGC/REG(2005)12/ANN1.
25
21
13 14
20
24 22
24
19
13 12
17
21 19
0
5
10
15
20
25
30
Informal consultation with selected
groups
Broad circulation for
comment
Public notice and comment
Public meeting
Internet Advisory group
Preparatory public
committee
Number of countries
Primary Laws Subordinate Regulations
Notes: See Q10:b(ii) / 2005 OECD regulatory indicators questionnaire / GOV/PGC/REG(2005)12/ANN1.
24 22
7
9
0
5
10
15
20
25
30
Primary laws Subordinate regulations
Number of countries
Always Sometimes
Notes: See Q10:a),a(i),b),b(i) / 2005 OECD regulatory indicators questionnaire / GOV/PGC/REG(2005)12/ANN1.
Figure P29.1. Public consultation when developing draft regulations
176
P30. USE OF REGULATORY TOOLS AND PROCESSES
Key contacts: Stephane Jacobzone, Chang-Won Choi, Claire Miguet, OECD GOV
Regulatory practices have generated a range of tools to improve new and existing regulations. The current discussion distinguishes processes, which include transparency, consultation and communication, from regulatory quality tools, which include a range of available techniques that need to be deployed in a consistent and mutually supporting manner to reflect an integrated systemic quality assurance system.
Highlights
One striking feature is the increasing reliance on regulatory impact analysis as well as the systematic evaluation of regulatory programmes for specific sectors or policy areas – although this evaluation method tends to be less practiced from a government-wide perspective. The explicit assessment of regulatory alternatives existed either government-wide or for specific sectors in at least two thirds of the countries.
Further reading:
OECD (2006), Indicators of regulatory management systems quality, OECD, Paris. Aspects of government measured by the indicator:
General government Activities of: Central State Local Social security funds
Other public sector Private sector in the public domain
Production stage:
Revenues Inputs Public sector processes
Outputs and intermediate outcomes Final outcomes Antecedents or constraints
Functional sector:
General public services
Defence Public order & safety
Economic affairs
Environmental protection
Housing & community amenities
Health Recreation, culture and religion
Education Social protection
About the indicator:
The regulatory quality tools cover the whole life span of a given regulation. They include consideration of regulatory alternatives and provision of justification for regulatory actions, regulatory impact analysis, administrative simplification, reduction of administrative burdens and mechanisms for evaluation and update of regulations. They can be grouped into following categories:
Regulatory Impact Analysis Assessment of regulatory alternatives Consultation with affected parties Plain language drafting requirements Systematic evaluation of regulation programme
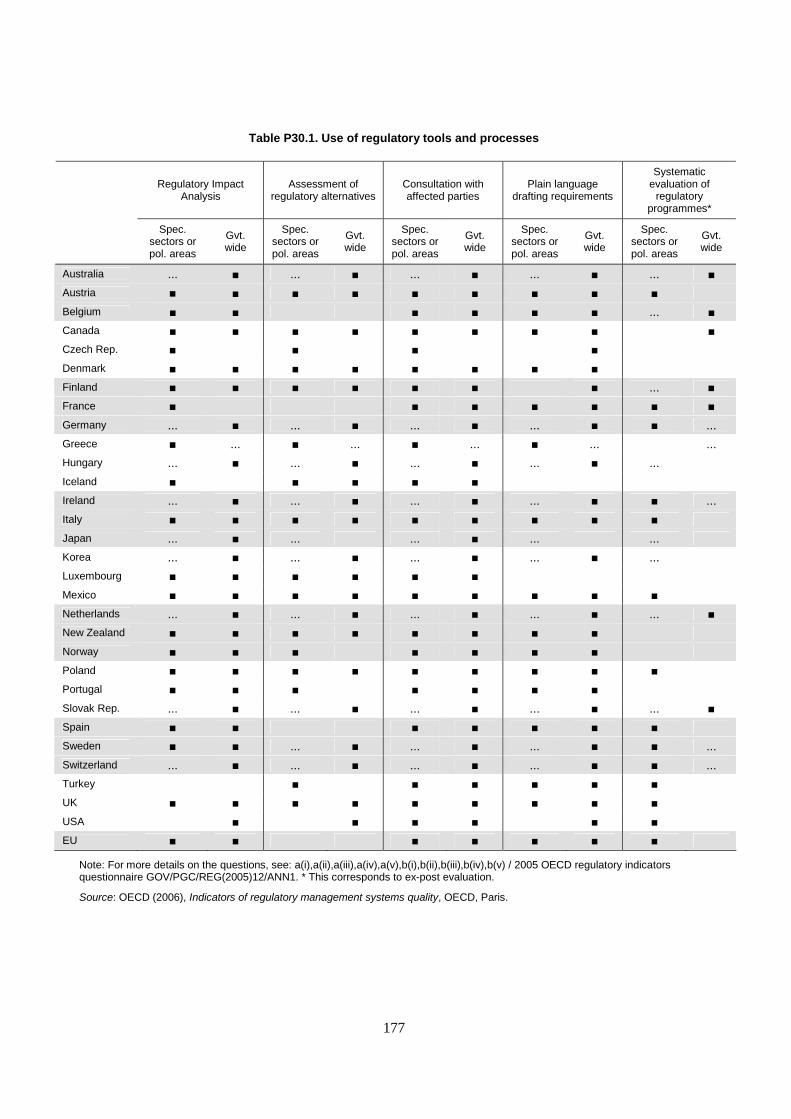
177
Table P30.1. Use of regulatory tools and processes
Regulatory Impact Analysis
Assessment of regulatory alternatives
Consultation with affected parties
Plain language drafting requirements
Systematic evaluation of
regulatory programmes*
Spec.
sectors or pol. areas
Gvt. wide
Spec. sectors or pol. areas
Gvt. wide
Spec. sectors or pol. areas
Gvt. wide
Spec. sectors or pol. areas
Gvt. wide
Spec. sectors or pol. areas
Gvt. wide
Australia ... ■ ... ■ ... ■ ... ■ ... ■
Austria ■ ■ ■ ■ ■ ■ ■ ■ ■
Belgium ■ ■ ■ ■ ■ ■ ... ■
Canada ■ ■ ■ ■ ■ ■ ■ ■ ■
Czech Rep. ■ ■ ■ ■
Denmark ■ ■ ■ ■ ■ ■ ■ ■
Finland ■ ■ ■ ■ ■ ■ ■ ... ■ France ■ ■ ■ ■ ■ ■ ■ Germany ... ■ ... ■ ... ■ ... ■ ■ ...
Greece ■ ... ■ ... ■ ... ■ ... ...
Hungary ... ■ ... ■ ... ■ ... ■ ...
Iceland ■ ■ ■ ■ ■
Ireland ... ■ ... ■ ... ■ ... ■ ■ ...
Italy ■ ■ ■ ■ ■ ■ ■ ■ ■
Japan ... ■ ... ... ■ ... ...
Korea ... ■ ... ■ ... ■ ... ■ ...
Luxembourg ■ ■ ■ ■ ■ ■
Mexico ■ ■ ■ ■ ■ ■ ■ ■ ■
Netherlands ... ■ ... ■ ... ■ ... ■ ... ■
New Zealand ■ ■ ■ ■ ■ ■ ■ ■
Norway ■ ■ ■ ■ ■ ■ ■
Poland ■ ■ ■ ■ ■ ■ ■ ■ ■
Portugal ■ ■ ■ ■ ■ ■ ■
Slovak Rep. ... ■ ... ■ ... ■ ... ■ ... ■
Spain ■ ■ ■ ■ ■ ■ ■
Sweden ■ ■ ... ■ ... ■ ... ■ ■ ...
Switzerland ... ■ ... ■ ... ■ ... ■ ■ ...
Turkey ■ ■ ■ ■ ■ ■
UK ■ ■ ■ ■ ■ ■ ■ ■ ■
USA ■ ■ ■ ■ ■ ■
EU ■ ■ ■ ■ ■ ■ ■
Note: For more details on the questions, see: a(i),a(ii),a(iii),a(iv),a(v),b(i),b(ii),b(iii),b(iv),b(v) / 2005 OECD regulatory indicators questionnaire GOV/PGC/REG(2005)12/ANN1. * This corresponds to ex-post evaluation.
Source: OECD (2006), Indicators of regulatory management systems quality, OECD, Paris.
178
P31. DIMENSIONS CONSIDERED IN REGULATORY IMPACT ANALYSIS
Key contacts: Stephane Jacobzone, Chang-Won Choi, Claire Miguet, OECD GOV
The use of Regulatory Impact Analysis (RIA) has spread across OECD countries. RIA represents a core tool for ensuring the quality of new regulations through a rigorous, evidence-based process for decision making. A number of policy impacts can be included in RIA, reflecting various policy agendas and concerns.
Highlights:
Over the period 1998-2005, requirements for RIA strengthened significantly with two thirds of the countries having established a formal requirement by law in 2005 against a third in 1998. There was also a significant increase of the number of countries requiring an assessment of the impact on small businesses and other social groups, from roughly half of the countries in 1998 up to over two thirds in 2005. A detailed overview of all the impacts required, together with the type of requirement show that all impacts do not receive equal priority. The budget impact is the most prevalent, and seems to be almost always required. Most countries would in any circumstances assess a budgetary impact, even those without a formal RIA system. The requirement for a competition and market openness assessment was always required in less than half of the countries, with another significant portion requiring it in other selected cases. The impact on small businesses was required in a slightly greater number of cases and countries, illustrating the historical role of RIA as a tool to minimise regulatory burdens, which fall disproportionately on small businesses. The impact on the public sector was similarly required in two thirds of the cases, which has significant implications for "regulation inside government". The UK has the most explicit public sector requirement, with an initial public sector RIA. If this initial RIA shows that the policy imposes a total of more than £5 million (7.5 million Euros), or would attract high levels of media or political interest, a more thorough Public Sector RIA is required. These trends show a broadening of potential impacts included in the RIA process and suggest the entrenchment of RIA as a tool for policy making, as many social groups and policy concerns request consideration in the RIA process. However, this may also lead to a dispersal of efforts. Risk assessment was much less prevalent, with only two countries, Iceland and the United Kingdom, reporting this requirement as being systematic, and the US and the EU Commission reporting such a requirement only for major regulations. Austria, Canada, Denmark, Germany, Korea, Mexico, New Zealand, Norway and Turkey required a risk assessment in other selected cases. Data was missing for a significant number of countries. Risk assessment was slightly more frequent for environmental issues or for health and safety, where half of the countries reported some form of a requirement.
Further reading:
OECD (2006), Indicators of regulatory management systems quality, OECD, Paris.
Aspects of government measured by the indicator: General government Activities
of: Central State Local Social security funds
Other public sector Private sector in the public domain
Production stage:
Revenues Inputs Public sector processes
Outputs and intermediate outcomes Final outcomes Antecedents or constraints
Functional sector:
General public services
Defence Public order & safety
Economic affairs
Environmental protection
Housing & community amenities
Health Recreation, culture and religion
Education Social protection
About this indicator:
Regulatory Impact Analysis is a tool used to assess the likely effects of a proposed new regulation or regulatory change. It involves a detailed analysis to ascertain whether or not the new regulation would have the desired impact. It helps to identify any possible side effects or hidden costs associated with regulation and to quantify the likely costs of compliance on the individual citizen or business. RIA also clarifies the desired outcomes of the proposed regulatory change and provides for consultation with stakeholders.
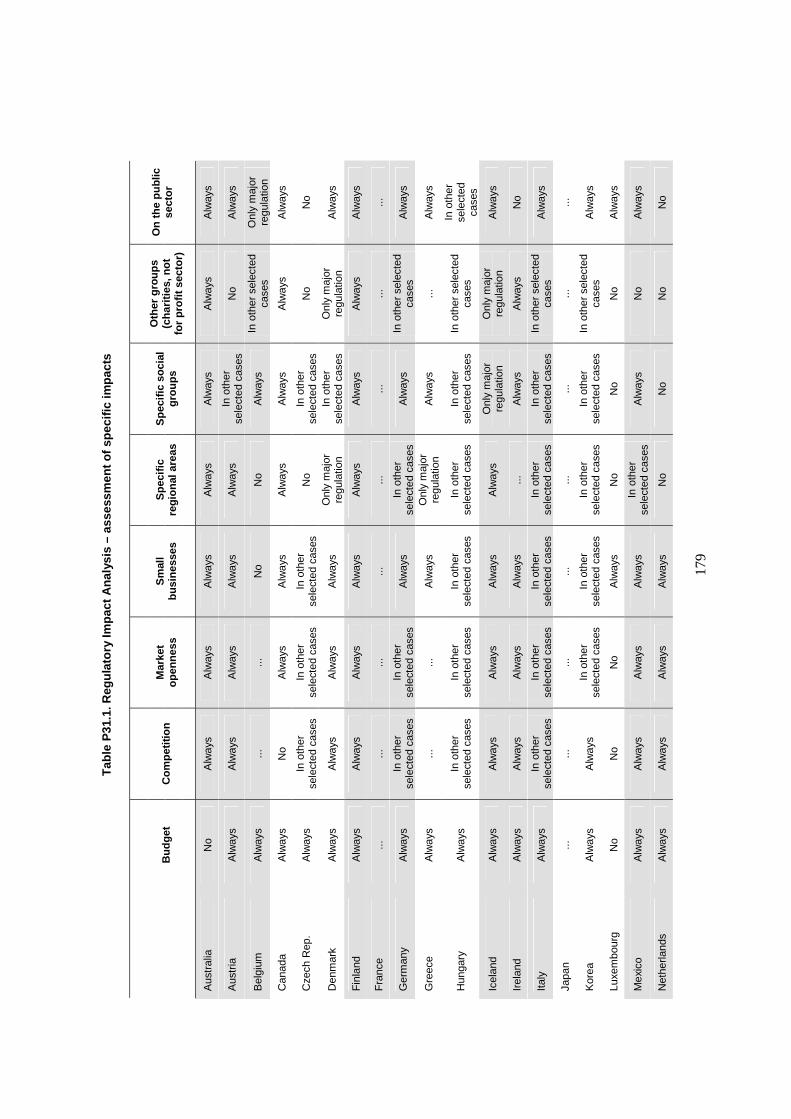
17
9
Tab
le P
31.1
. Reg
ula
tory
Imp
act
An
alys
is –
ass
essm
ent
of
spec
ific
imp
acts
B
ud
get
C
om
pet
itio
n
Mar
ket
op
enn
ess
Sm
all
bu
sin
esse
s S
pec
ific
re
gio
nal
are
as
Sp
ecif
ic s
oci
al
gro
up
s
Oth
er g
rou
ps
(ch
arit
ies,
no
t fo
r p
rofi
t se
cto
r)
On
th
e p
ub
lic
sect
or
Aus
tral
ia
No
Alw
ays
Alw
ays
Alw
ays
Alw
ays
Alw
ays
Alw
ays
Alw
ays
Aus
tria
A
lway
s A
lway
s A
lway
s A
lway
s A
lway
s In
oth
er
sele
cted
cas
es
No
Alw
ays
Bel
gium
A
lway
s ...
...
N
o N
o A
lway
s In
oth
er s
elec
ted
case
s O
nly
maj
or
regu
latio
n
Can
ada
Alw
ays
No
Alw
ays
Alw
ays
Alw
ays
Alw
ays
Alw
ays
Alw
ays
Cze
ch R
ep.
Alw
ays
In o
ther
se
lect
ed c
ases
In
oth
er
sele
cted
cas
es
In o
ther
se
lect
ed c
ases
N
o In
oth
er
sele
cted
cas
es
No
No
Den
mar
k A
lway
s A
lway
s A
lway
s A
lway
s O
nly
maj
or
regu
latio
n In
oth
er
sele
cted
cas
es
Onl
y m
ajor
re
gula
tion
Alw
ays
Fin
land
A
lway
s A
lway
s A
lway
s A
lway
s A
lway
s A
lway
s A
lway
s A
lway
s
Fra
nce
...
...
...
...
...
...
...
...
Ger
man
y A
lway
s In
oth
er
sele
cted
cas
es
In o
ther
se
lect
ed c
ases
A
lway
s In
oth
er
sele
cted
cas
es
Alw
ays
In o
ther
sel
ecte
d ca
ses
Alw
ays
Gre
ece
Alw
ays
...
...
Alw
ays
Onl
y m
ajor
re
gula
tion
Alw
ays
...
Alw
ays
Hun
gary
A
lway
s In
oth
er
sele
cted
cas
es
In o
ther
se
lect
ed c
ases
In
oth
er
sele
cted
cas
es
In o
ther
se
lect
ed c
ases
In
oth
er
sele
cted
cas
es
In o
ther
sel
ecte
d ca
ses
In o
ther
se
lect
ed
case
s
Icel
and
Alw
ays
Alw
ays
Alw
ays
Alw
ays
Alw
ays
Onl
y m
ajor
re
gula
tion
Onl
y m
ajor
re
gula
tion
Alw
ays
Irel
and
Alw
ays
Alw
ays
Alw
ays
Alw
ays
...
Alw
ays
Alw
ays
No
Italy
A
lway
s In
oth
er
sele
cted
cas
es
In o
ther
se
lect
ed c
ases
In
oth
er
sele
cted
cas
es
In o
ther
se
lect
ed c
ases
In
oth
er
sele
cted
cas
es
In o
ther
sel
ecte
d ca
ses
Alw
ays
Japa
n ...
...
...
...
...
...
...
...
Kor
ea
Alw
ays
Alw
ays
In o
ther
se
lect
ed c
ases
In
oth
er
sele
cted
cas
es
In o
ther
se
lect
ed c
ases
In
oth
er
sele
cted
cas
es
In o
ther
sel
ecte
d ca
ses
Alw
ays
Luxe
mbo
urg
No
No
No
Alw
ays
No
No
No
Alw
ays
Mex
ico
Alw
ays
Alw
ays
Alw
ays
Alw
ays
In o
ther
se
lect
ed c
ases
A
lway
s N
o A
lway
s
Net
herla
nds
Alw
ays
Alw
ays
Alw
ays
Alw
ays
No
No
No
No
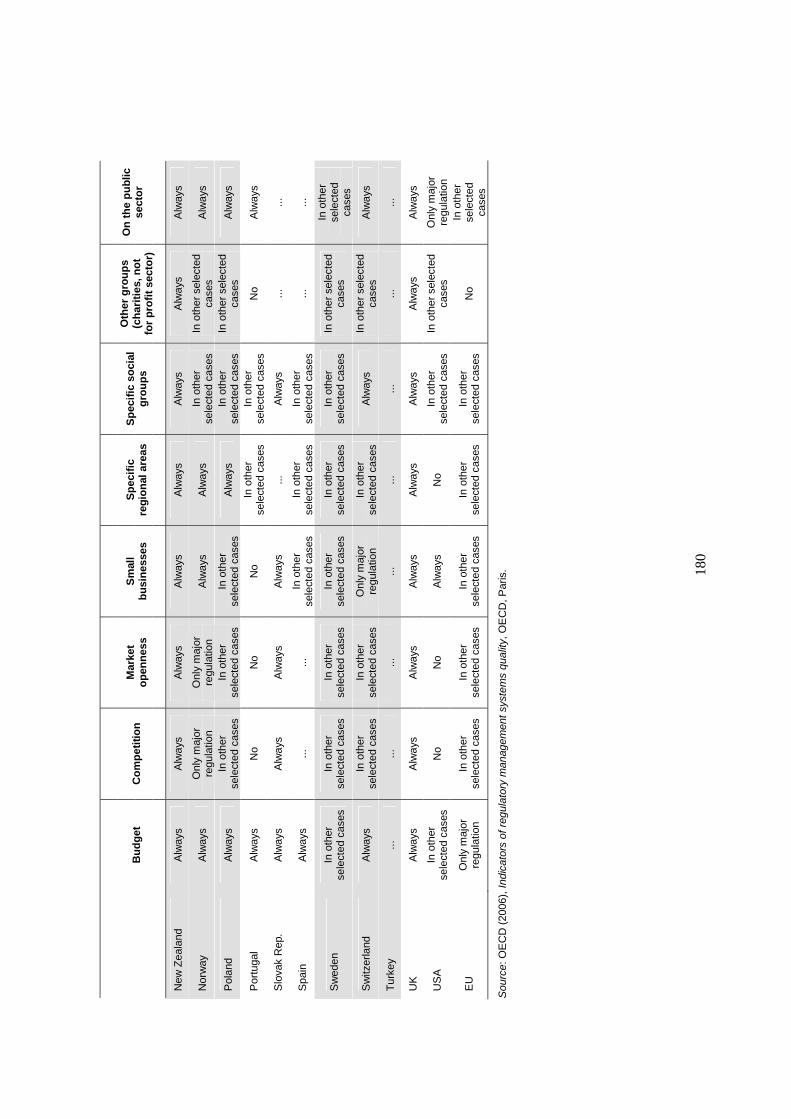
18
0
B
ud
get
C
om
pet
itio
n
Mar
ket
op
enn
ess
Sm
all
bu
sin
esse
s S
pec
ific
re
gio
nal
are
as
Sp
ecif
ic s
oci
al
gro
up
s
Oth
er g
rou
ps
(ch
arit
ies,
no
t fo
r p
rofi
t se
cto
r)
On
th
e p
ub
lic
sect
or
New
Zea
land
A
lway
s A
lway
s A
lway
s A
lway
s A
lway
s A
lway
s A
lway
s A
lway
s
Nor
way
A
lway
s O
nly
maj
or
regu
latio
n O
nly
maj
or
regu
latio
n A
lway
s A
lway
s In
oth
er
sele
cted
cas
es
In o
ther
sel
ecte
d ca
ses
Alw
ays
Pol
and
Alw
ays
In o
ther
se
lect
ed c
ases
In
oth
er
sele
cted
cas
es
In o
ther
se
lect
ed c
ases
A
lway
s In
oth
er
sele
cted
cas
es
In o
ther
sel
ecte
d ca
ses
Alw
ays
Por
tuga
l A
lway
s N
o N
o N
o In
oth
er
sele
cted
cas
es
In o
ther
se
lect
ed c
ases
N
o A
lway
s
Slo
vak
Rep
. A
lway
s A
lway
s A
lway
s A
lway
s ...
A
lway
s ...
...
Spa
in
Alw
ays
...
...
In o
ther
se
lect
ed c
ases
In
oth
er
sele
cted
cas
es
In o
ther
se
lect
ed c
ases
...
...
Sw
eden
In
oth
er
sele
cted
cas
es
In o
ther
se
lect
ed c
ases
In
oth
er
sele
cted
cas
es
In o
ther
se
lect
ed c
ases
In
oth
er
sele
cted
cas
es
In o
ther
se
lect
ed c
ases
In
oth
er s
elec
ted
case
s
In o
ther
se
lect
ed
case
s
Sw
itzer
land
A
lway
s In
oth
er
sele
cted
cas
es
In o
ther
se
lect
ed c
ases
O
nly
maj
or
regu
latio
n In
oth
er
sele
cted
cas
es
Alw
ays
In o
ther
sel
ecte
d ca
ses
Alw
ays
Tur
key
...
...
...
...
...
...
...
...
UK
A
lway
s A
lway
s A
lway
s A
lway
s A
lway
s A
lway
s A
lway
s A
lway
s
US
A
In o
ther
se
lect
ed c
ases
N
o N
o A
lway
s N
o In
oth
er
sele
cted
cas
es
In o
ther
sel
ecte
d ca
ses
Onl
y m
ajor
re
gula
tion
EU
O
nly
maj
or
regu
latio
n In
oth
er
sele
cted
cas
es
In o
ther
se
lect
ed c
ases
In
oth
er
sele
cted
cas
es
In o
ther
se
lect
ed c
ases
In
oth
er
sele
cted
cas
es
No
In o
ther
se
lect
ed
case
s
Sou
rce:
OE
CD
(20
06),
Indi
cato
rs o
f reg
ulat
ory
man
agem
ent s
yste
ms
qual
ity, O
EC
D, P
aris
.
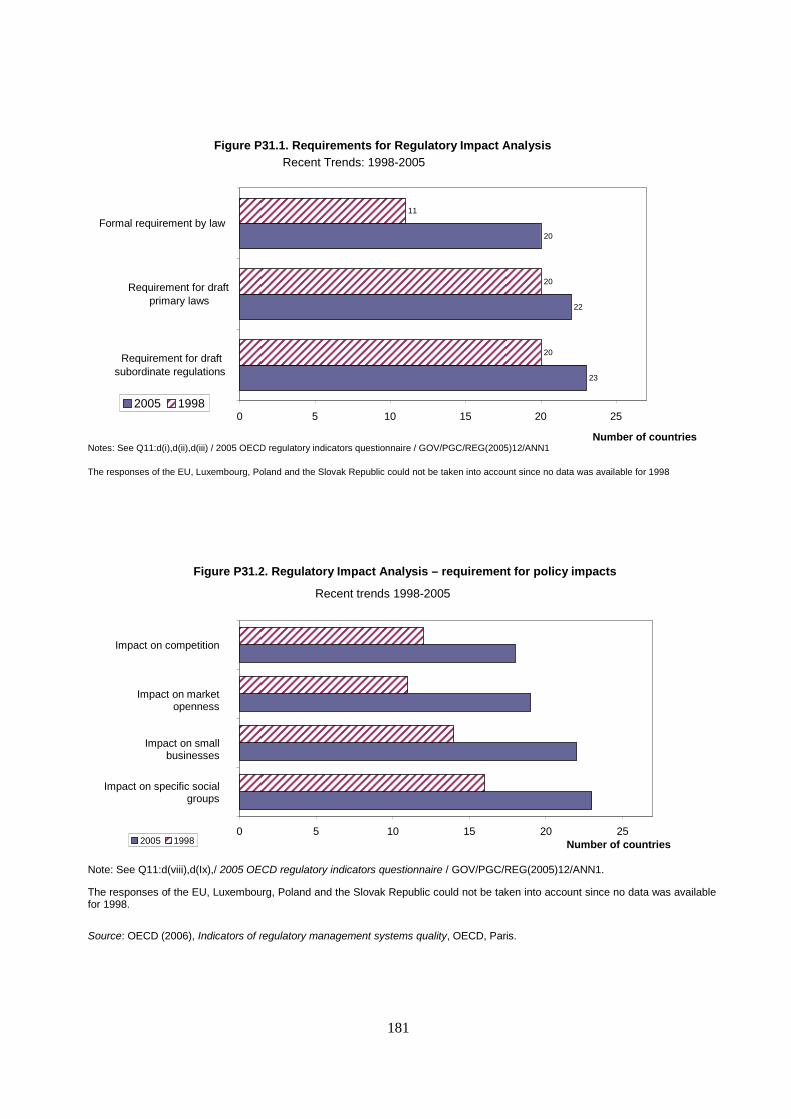
181
Source: OECD (2006), Indicators of regulatory management systems quality, OECD, Paris.
Figure P31.1. Requirements for Regulatory Impact Analysis
Recent Trends: 1998-2005
23
22
20
20
20
11
0 5 10 15 20 25
Requirement for draft subordinate regulations
Requirement for draft primary laws
Formal requirement by law
Number of countries
2005 1998
Notes: See Q11:d(i),d(ii),d(iii) / 2005 OECD regulatory indicators questionnaire / GOV/PGC/REG(2005)12/ANN1
The responses of the EU, Luxembourg, Poland and the Slovak Republic could not be taken into account since no data was available for 1998
Figure P31.2. Regulatory Impact Analysis – requirement for policy impacts
Recent trends 1998-2005
0 5 10 15 20 25
Impact on specific social groups
Impact on small businesses
Impact on market openness
Impact on competition
Number of countries 2005 1998
Note: See Q11:d(viii),d(Ix),/ 2005 OECD regulatory indicators questionnaire / GOV/PGC/REG(2005)12/ANN1.
The responses of the EU, Luxembourg, Poland and the Slovak Republic could not be taken into account since no data was available for 1998.
182
P32. REDUCING ADMINISTRATIVE BURDENS
Key contacts: Stephane Jacobzone, Chang-Won Choi, Claire Miguet, OECD GOV
Reducing regulatory burdens and the complexity of government formalities and paperwork is a high political priority for many countries. Cutting red tape is an almost inevitable accompaniment to regulatory reform. Burdens from government regulatory requirements have been expanding in most countries in recent years, due to more stringent requirements and the expansion of regulation in the environmental, safety and health areas. As a counterweight, governments have been seeking to simplify the way in which regulatory compliance can be achieved and demonstrated.
Highlights: Administrative simplification is becoming a permanent feature of regulatory quality management systems. 25 countries had an explicit programme to reduce administrative burdens in 2005 against 20 in 1998. Programmes to streamline government administrative procedures and use information and communication technologies existed in over two thirds of the countries in 2005. Programmes with explicit quantitative targets exist in only over a third of OECD countries. The gradual inclusion of quantitative targets reflects the impact of the diffusion of the standard cost model, with many countries following the example of the Netherlands and the Nordic European countries. Denmark, which had pioneered measurement efforts in Europe with an annual aggregate assessment of administrative burdens since 1999, is currently mapping all its legislation affecting businesses' administration and overhead costs using the Standard Cost Model. Similarly, in Norway, the target is to reduce the administrative burdens on businesses by 25% within the year 2012. In Sweden, the measurement of the tax area has been completed. In the Czech Republic, the administrative burdens should be reduced by 20%. Korea had a target of a 10% reduction of regulations that lag behind the market changes.
Over two thirds of the countries were modifying and streamlining existing laws, using information and communication technologies for regulatory administration together with other streamlining of government administrative procedures. Seventeen countries mentioned that they had a system for measuring administrative burdens, more than those which reported that they had a complete count of their business licences and permits. Many of these countries are developing or implementing a form of a Standard Cost Model. Only half of the countries were reallocating powers and responsibilities between government departments and/or levels of governments.
Further reading:
OECD (2006), Indicators of regulatory management systems quality, OECD, Paris. OECD (2006), Report on Administrative Simplification, OECD, Paris.
Aspects of government measured by the indicator: General government Activities
of: Central State Local Social security funds
Other public sector Private sector in the public domain
Production stage:
Revenues Inputs Public sector processes
Outputs and intermediate outcomes Final outcomes Antecedents or constraints
Functional sector:
General public services
Defence Public order & safety
Economic affairs
Environmental protection
Housing & community amenities
Health Recreation, culture and religion
Education Social protection
About this indicator:
There are various approaches grouped under administrative simplification and administrative burden reduction, which have been integrated in countries' broader regulatory quality systems. Countries modify and streamline existing rules, e.g. by applying silence is consent rule; take actions to reduce the number of administrative steps by consolidating services to one single window for end users; develop systems to monitor administrative burdens, and even redistribute competencies among government institutions. The impact of administrative simplification tools grew with increasing availability of e-Government services.
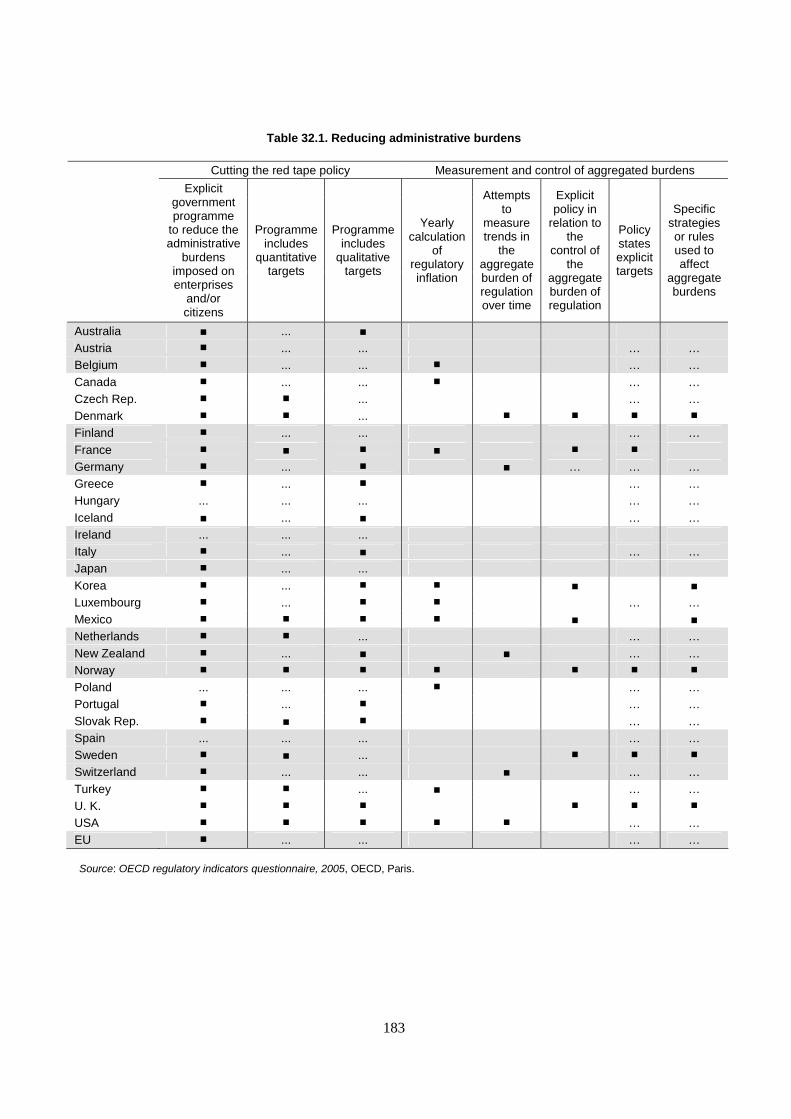
183
Table 32.1. Reducing administrative burdens
Cutting the red tape policy Measurement and control of aggregated burdens
Explicit government programme
to reduce the administrative
burdens imposed on enterprises
and/or citizens
Programme includes
quantitative targets
Programme includes
qualitative targets
Yearly calculation
of regulatory inflation
Attempts to
measure trends in
the aggregate burden of regulation over time
Explicit policy in
relation to the
control of the
aggregate burden of regulation
Policy states explicit targets
Specific strategies or rules used to affect
aggregate burdens
Australia ■ ... ■ Austria ■ ... ... … … Belgium ■ ... ... ■ … … Canada ■ ... ... ■ … … Czech Rep. ■ ■ ... … … Denmark ■ ■ ... ■ ■ ■ ■ Finland ■ ... ... … … France ■ ■ ■ ■ ■ ■ Germany ■ ... ■ ■ … … … Greece ■ ... ■ … … Hungary ... ... ... … … Iceland ■ ... ■ … … Ireland ... ... ... Italy ■ ... ■ … … Japan ■ ... ... Korea ■ ... ■ ■ ■ ■ Luxembourg ■ ... ■ ■ … … Mexico ■ ■ ■ ■ ■ ■ Netherlands ■ ■ ... … … New Zealand ■ ... ■ ■ … … Norway ■ ■ ■ ■ ■ ■ ■ Poland ... ... ... ■ … … Portugal ■ ... ■ … … Slovak Rep. ■ ■ ■ … … Spain ... ... ... … … Sweden ■ ■ ... ■ ■ ■ Switzerland ■ ... ... ■ … … Turkey ■ ■ ... ■ … … U. K. ■ ■ ■ ■ ■ ■ USA ■ ■ ■ ■ ■ … … EU ■ ... ... … …
Source: OECD regulatory indicators questionnaire, 2005, OECD, Paris.
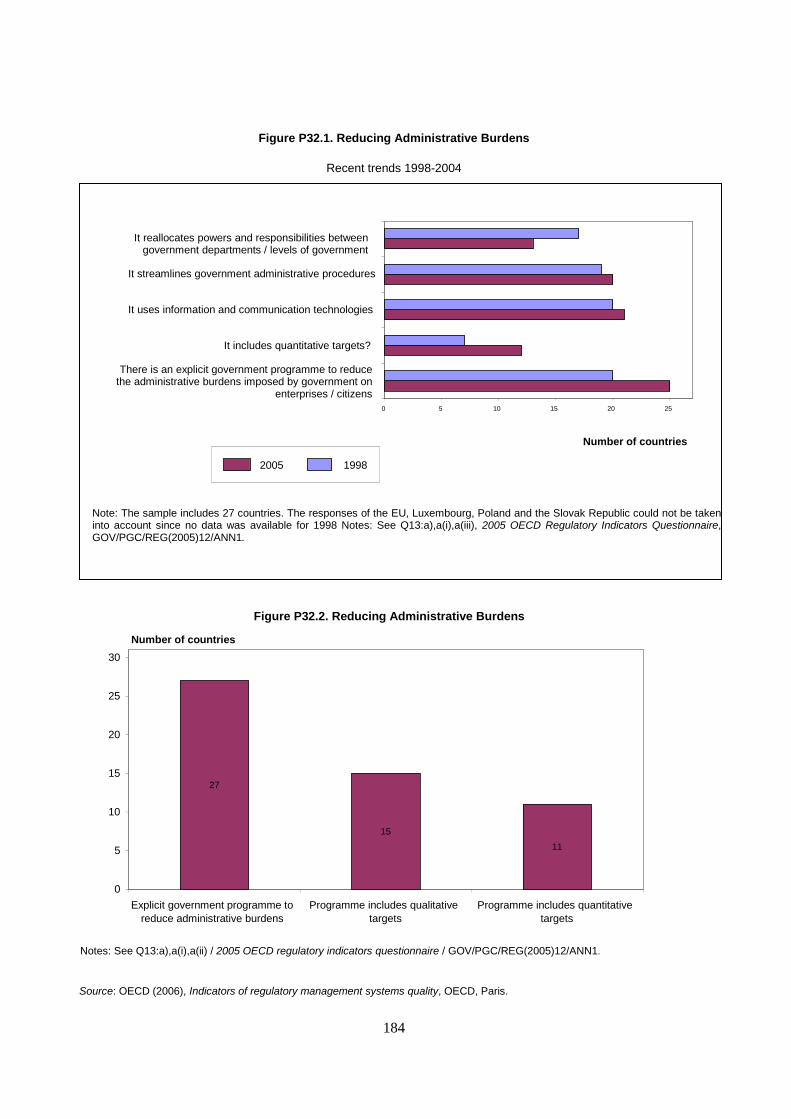
184
Figure P32.1. Reducing Administrative Burdens
Recent trends 1998-2004
Source: OECD (2006), Indicators of regulatory management systems quality, OECD, Paris.
0 5 10 15 20 25
There is an explicit government programme to reduce the administrative burdens imposed by government on
enterprises / citizens
It includes quantitative targets?
It uses information and communication technologies
It streamlines government administrative procedures
It reallocates powers and responsibilities between government departments / levels of government
Number of countries
2005 1998
Note: The sample includes 27 countries. The responses of the EU, Luxembourg, Poland and the Slovak Republic could not be taken into account since no data was available for 1998 Notes: See Q13:a),a(i),a(iii), 2005 OECD Regulatory Indicators Questionnaire, GOV/PGC/REG(2005)12/ANN1.
Figure P32.2. Reducing Administrative Burdens
27
15 11
0
5
10
15
20
25
30
Explicit government programme to reduce administrative burdens
Programme includes qualitative targets
Programme includes quantitative targets
Number of countries
Notes: See Q13:a),a(i),a(ii) / 2005 OECD regulatory indicators questionnaire / GOV/PGC/REG(2005)12/ANN1.
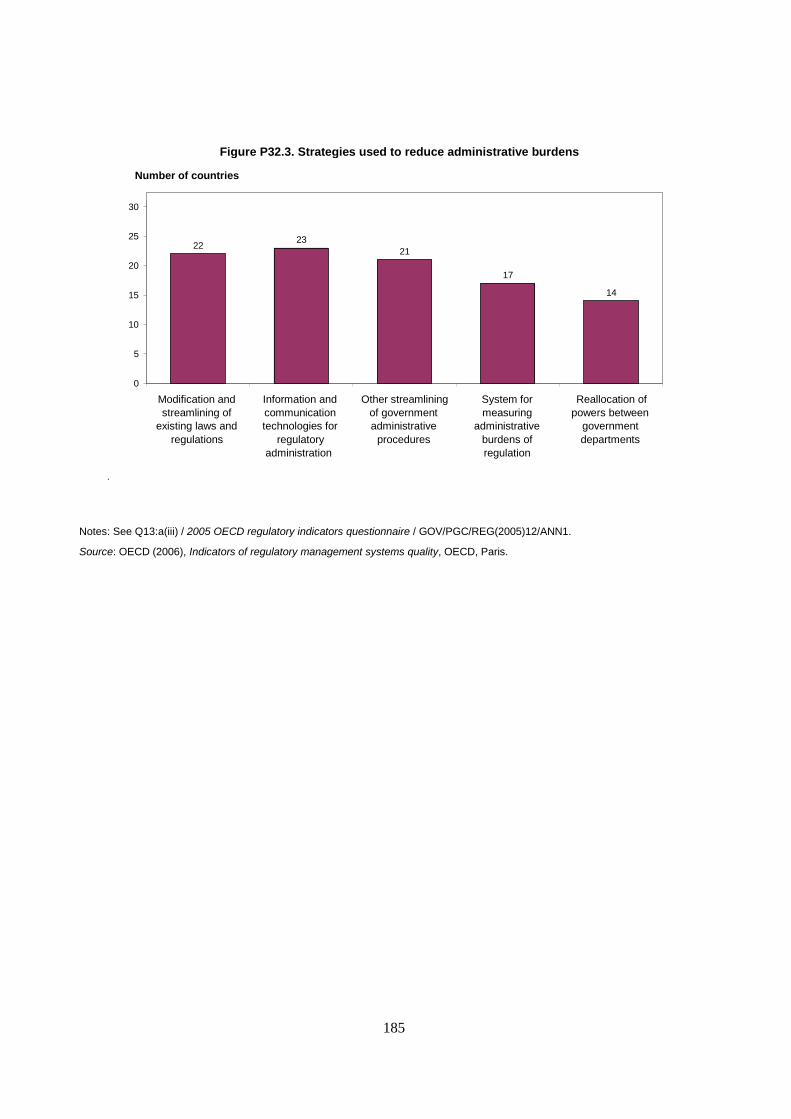
185
Notes: See Q13:a(iii) / 2005 OECD regulatory indicators questionnaire / GOV/PGC/REG(2005)12/ANN1.
Source: OECD (2006), Indicators of regulatory management systems quality, OECD, Paris.
Figure P32.3. Strategies used to reduce administrative burdens
22 23 21
17 14
0
5
10
15
20
25
30
Modification and streamlining of
existing laws and regulations
Information and communication technologies for
regulatory administration
Other streamlining of government administrative
procedures
System for measuring
administrative burdens of regulation
Reallocation of powers between
government departments
Number of countries
.
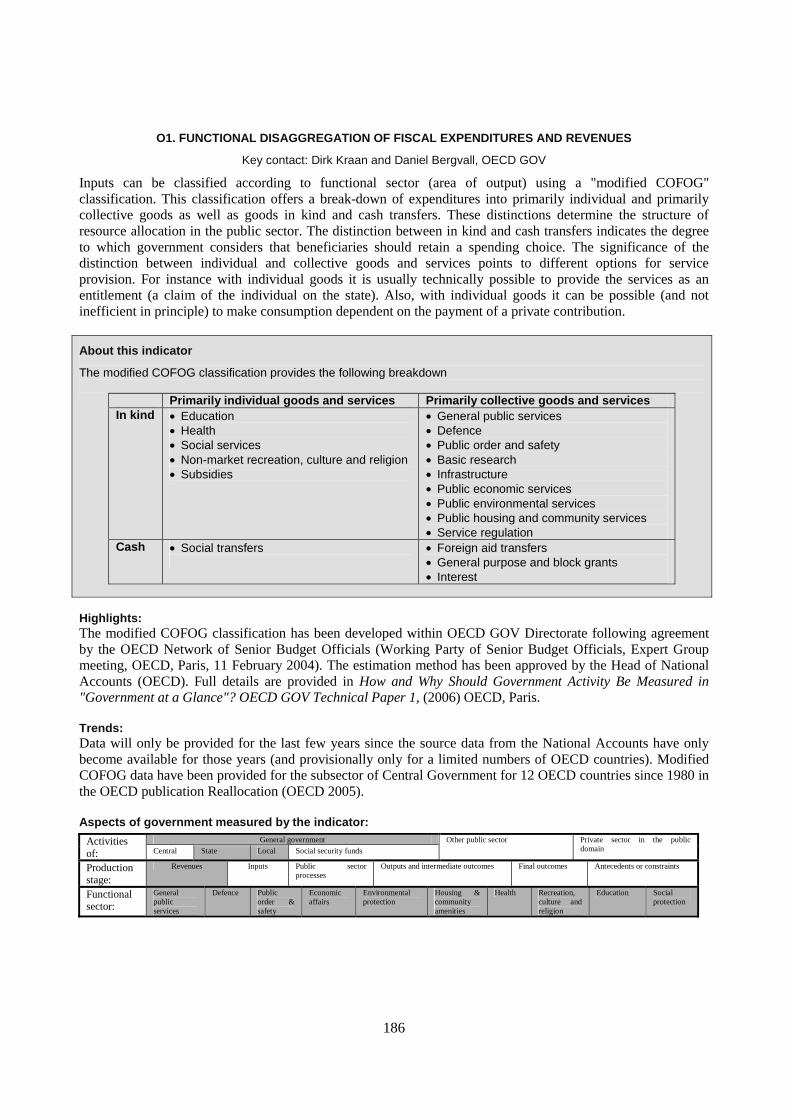
186
O1. FUNCTIONAL DISAGGREGATION OF FISCAL EXPENDITURES AND REVENUES
Key contact: Dirk Kraan and Daniel Bergvall, OECD GOV
Inputs can be classified according to functional sector (area of output) using a "modified COFOG" classification. This classification offers a break-down of expenditures into primarily individual and primarily collective goods as well as goods in kind and cash transfers. These distinctions determine the structure of resource allocation in the public sector. The distinction between in kind and cash transfers indicates the degree to which government considers that beneficiaries should retain a spending choice. The significance of the distinction between individual and collective goods and services points to different options for service provision. For instance with individual goods it is usually technically possible to provide the services as an entitlement (a claim of the individual on the state). Also, with individual goods it can be possible (and not inefficient in principle) to make consumption dependent on the payment of a private contribution.
About this indicator
The modified COFOG classification provides the following breakdown
Primarily individual goods and services Primarily collective goods and services In kind
• Education • Health • Social services • Non-market recreation, culture and religion • Subsidies
• General public services • Defence • Public order and safety • Basic research • Infrastructure • Public economic services • Public environmental services • Public housing and community services • Service regulation
Cash • Social transfers
• Foreign aid transfers • General purpose and block grants • Interest
Highlights: The modified COFOG classification has been developed within OECD GOV Directorate following agreement by the OECD Network of Senior Budget Officials (Working Party of Senior Budget Officials, Expert Group meeting, OECD, Paris, 11 February 2004). The estimation method has been approved by the Head of National Accounts (OECD). Full details are provided in How and Why Should Government Activity Be Measured in "Government at a Glance"? OECD GOV Technical Paper 1, (2006) OECD, Paris.
Trends: Data will only be provided for the last few years since the source data from the National Accounts have only become available for those years (and provisionally only for a limited numbers of OECD countries). Modified COFOG data have been provided for the subsector of Central Government for 12 OECD countries since 1980 in the OECD publication Reallocation (OECD 2005).
Aspects of government measured by the indicator: General government Activities
of: Central State Local Social security funds
Other public sector Private sector in the public domain
Production stage:
Revenues Inputs Public sector processes
Outputs and intermediate outcomes Final outcomes Antecedents or constraints
Functional sector:
General public services
Defence Public order & safety
Economic affairs
Environmental protection
Housing & community amenities
Health Recreation, culture and religion
Education Social protection