towards computerized typology and classification of ceramics
TRANSCRIPT

Towards computerized typology and classification of ceramics
Ayelet Gilboaa, Avshalom Karasikb,c*, Ilan Sharonc, Uzy Smilanskyb
aThe Zinman Institute of Archaeology, University of Haifa, Mount Carmel, Haifa 31905, IsraelbDepartment of Physics of Complex Systems, The Weizmann Institute of Science, Rehovot 76100, Israel
cInstitute of Archaeology, The Hebrew University, Jerusalem 91904, Israel
Received 28 July 2003; received in revised form 26 October 2003; accepted 29 October 2003
Abstract
We report on newly developed mathematical and computational tools for morphological description, classification and analysisof archaeological artifacts. The need for such tools is most acutely felt, due to two main factors: (1) The lack of objective,quantitative criteria for shape analysis, classification and comparanda; (2) The overwhelming abundance of data, which rendersimpossible any extensive comparative typological analysis using traditional methods. We shall describe the main ideas whichdistinguish our method, and demonstrate its applicability by presenting the analysis of two assemblages of Iron Age ceramics fromsites in Israel.� 2003 Elsevier Ltd. All rights reserved.
Keywords: Pottery; Typology and classification; Ceramic profiles; Curvature analysis; Near Eastern Iron Age archaeology; Phoenician pottery
1. Introduction
Artifacts are by definition the direct products ofhuman action. As such, they convey significant infor-mation regarding various cognitive and behavioral as-pects of both their producers and users. Archaeologistswho study assemblages of such artifacts seek to identifyin them distinctive patterns that can be used for drawinginferences regarding a plethora of issues, from straight-forward spatial and temporal settings, to higher-rangeissues such as technological and cognitive capabilities,motor skills, symbolic assertions and negotiations,social, ethnic and other identities, economic activities,and more.
There are two basic techniques by which archaeologi-cal research approaches artifacts analysis:
1. Typological classification, where the numerous arti-facts are clustered into discrete ‘types’, and theassemblage is sorted according to these pre-definedtypes. Underlying this approach is the assumptionthat artifacts were produced according to, and there-
fore can be classified into, discrete templates. Suchclassification raises serious issues—what is a ‘type’?Is there an objective way of classifying artifacts to‘types’? (For a pioneering concern with these ques-tions, see for example [22]) Is the choice of typesoptimal (keeping the number of types to a minimum,while losing minimal information).
2. An alternative approach is attribute analysis, inwhich artifacts are described according to a set ofselected attributes, and which seeks to establish adirect correlation between one (or arrays) of theseattributes and temporal sequences, spatial associ-ations, or cultural patterns. The main problem ofthis approach is how, among the myriad of at-tributes usually observed in a large assemblage ofartifacts, can one isolate a subset which variesintelligibly with the facets under study.
In practice, most archaeologists bring both of theseapproaches to bear, depending on the problem at hand.
In both approaches, shape attributes are among themost fundamental properties by which artifacts arecharacterized and studied. These include the descriptionof the general shape of the artifact, defined by its contour(the line which marks its boundary or cross section), as
* Corresponding author. Tel.: +972-8-93-44-987; fax: +972-8-93-44-109
E-mail address: [email protected] (A. Karasik).
Journal of Archaeological Science 31 (2004) 681–694
SCIENCE
Journal of
Archaeological
http://www.elsevier.com/locate/jas
SCIENCE
Journal of
Archaeological
http://www.elsevier.com/locate/jas
0305-4403/04/$ - see front matter � 2003 Elsevier Ltd. All rights reserved.doi:10.1016/j.jas.2003.10.013

well as the description of particular shape properties,considered to be significant for specific archaeologicalissues. Traditional shape descriptions and classifications,however, rely on intuitive, often vague characterizations,which are hard to quantify. Terms such as ‘everted/inverted rim’, ‘squat body’, ‘high carination’, or even‘elegant curves’, which do not have a unique interpret-ation, are commonly used. Early attempts to base theanalysis solely on measurable attributes have been con-strained to using a poor vocabulary of simple metrics(length, width, radius, etc.) or combinations thereof (see[38,46]). Most of the shape information is lost whenusing such extremely reductionist statistics, and themeaningful comparison of assemblages based on themmay be problematic.
More recent studies aimed at quantitative analysis ofceramic attributes describe the profiles as mathematicalcurves. One of the earliest methods is the ‘tangent-profile’ (TP) or its later development the ‘sampledtangent-profile’ (STP) technique [31]. The curve is de-scribed by providing the tangent as a function of thearc-length. (This is related to the method used here, sincethe curvature is the first derivative of the tangent angle.)A related method was used by Liming et al. [36], whoexpressed the shape by providing the distance of thepoints on the profile from the axis of revolution as afunction of the arc-length. Gero and Mazzullo [13] usedFourier series to describe archaeological artifacts, buttheir method can hardly be applied to the analysis ofceramic sherds. Hagstrum and Hildebrand [19] intro-duced the ‘two-curvature’ method by which vessels aredescribed by the curvature along two axes. They use thismethod to get an overall view of assemblages, such ase.g., the percentages of common shapes (open or closed)and to obtain approximate volumes. They did not usetheir tools for classification, typology or intensivecomparison of vessels shapes.
The GOAD project (Graphically Oriented Archaeo-logical Database) concentrated on the development ofarchaeological database, which enables a user-friendlysearch. To compare shapes they used the GeneralizedHough Transform (GHT) [10,33]. Several other tech-niques, which make use of the profiles of the vesselsas curves, are summarized in the book of Orton et al.[39, pp. 152–165]. A good summary of ‘line geometry’with some applications to surfaces of revolution, such asarchaeological vessels can be found in Pottmans et al.[41].
The use of powerful mathematical and computationalmethods in archaeological attribute analysis is steadilygrowing. Sablatnig and Menard [43], Adler et al. [1] andRazdan et al. [42] use digitized information as a con-venient access for extracting quantitative measures forvarious features of the profile, such as the location ofcorners or inflection points, rims and necks (see alsowebsites [23–25]). Kalvin et al. [29], Leitao and Stolfi [32]
and Leymarie et al. [34] concentrate on illustratingexcavated archaeological sites using virtual reality (web-sites [26–28]). The last two also deal with the problem of‘virtual mending’ of vessels, using the fragments out-lines’ curvature to match neighboring sherds. Again,they hardly apply their methods for typological analysis.
In typical excavations on tells in the Near East,pottery is found in huge quantities. The intuitive,manual clustering of thousands of artifacts (often, as inlarge stratigraphical excavations-millions) is a Sisypheanlabor at best, and the process of finding culturallymeaningful parallels for them among millions of illus-trations in published excavation reports is rapidly be-coming impossible. The traditional ‘hunt for parallels’ iscurrently carried out by spending months in specializedresearch libraries, checking out scores of excavationreports and leafing through thousands of pages, contain-ing uncountable illustrations. Still, the placing of a givenpottery assemblage in its proper spatial and temporalsetting is, and always will be, a mandatory process,without which higher-level meanings of the assemblagecannot be assessed. Reliable publications/studies oflarge artifactual assemblages are becoming rare, andseverely delay, often for decades, the publication of sitereports.
Moreover, due to the limitations imposed by thetraditional means of publication, only a fraction of theexcavated material appears in the reports of any butthe smallest excavations. The selection of the items toappear in print introduces a bias. The standard pro-cedure, especially in medium to large excavations, hasbeen to illustrate what the analyst considers a‘type’—and supplement this with quantitative dataregarding the distribution of the various types(usually—per temporal phase). Selection may be un-avoidable, but its outcome is that the reader may not beable to assess the defined ‘types’, as these are illustratedby very few examples, often just one. Sometimes the veryfact that quantitative data have been provided is per-ceived as legitimizing a reduction in the number of(costly) illustrations. Thus the quantitative data pro-vided is difficult to evaluate: how must one relate to astatement asserting that ‘Stratum X had 500 examples ofType Y’ if one has no clear idea of the variability withintype ‘Y’? Worse—what if, in one’s own typology, type‘Y’ is equivalent to either type ‘A’ or ‘B’ or partlytype ‘C’ (the other part of ‘C’ being type ‘Z’ in thecomparanda)?
Thus, one of the major problems faced by archaeolo-gists is to find optimal methods by which assemblagescan be presented, described and analyzed. Such amethod should be concise, yet as comprehensive aspossible, so as to encompass as much information aspossible about the studied objects. It should avoid thesubjectivity of traditional typologies. It must take ad-vantage of modern means for database construction, to
A. Gilboa et al. / Journal of Archaeological Science 31 (2004) 681–694682

enable exhaustive storage and systematic search andretrieval algorithms. Considering the aspects mentionedabove, computer-aided artifact analysis is naturallycalled for.
The work presented here pertains to typology andclassification which are confined to shape attributes.Extensions of the technique to include additionalattributes (size, decorations, ware, composition) areself-evident, but for the purpose of this exposition wechose to concentrate on shape (of cross-sections) alone.
The input consists of drawings of pottery in printedarchaeological reports, and the analysis is based on thecontour defined by the drawn cross-sections. We are wellaware of the problems inherent in using manual draw-ings as the basis for subsequent analysis [39, pp. 89–93;40]. However, the records of past (and most present)excavations are only accessible in this form, and thusanalyses based on such media are, and in the foreseeablefuture will be, unavoidable.
As will become clearer below, we do not restrict thecross sections to present whole vessels, nor do we assumethat the cross sections are simply connected (in otherwords, handles can form a part of the analyzed shape).On the other hand, the system is constrained to piecescontaining at least a fragment of the rim. We use the tipof the rim as the point of origin for comparisons and therim radius for size-standardization. As pointed outabove, most Near-Eastern and Mediterranean exca-vations suffer more from over-abundance of sherds thanfrom dearth. Thus reducing the sample to rims only, anddeleting body-sherds which are often only minimally
informative, is not too high a price. Restricting it tocomplete profiles only may well lead to sample-sizeproblems, as well as to over-representation of restrictedspatial locations or temporal episodes where completevessels happened to be better preserved.
We should emphasize that our aim at this point islimited to providing the archaeological research withdescriptive and analytical tools. The interpretationof these results, and their evaluation within thearchaeological/cultural context is definitely beyond ourscope here, though in the examples presented below theinterpretive potential is readily evident.
We shall proceed according to the following order:the next section is of a more mathematical nature. Itpresents our method for the analysis of ceramic cross-sections as planar curves. The section which follows isdedicated to shape analysis and typological study oftwo archaeological assemblages. These preliminarystudies demonstrate the potential stored in this line ofwork. The concluding section is a summary presentingvarious sources of inherent limitations and uncertain-ties, alongside further directions which are now beinginvestigated.
2. Computerized typological analysis of ceramic profilesand cross sections
2.1. Data acquisition
The first step in the analysis transforms the contoursto be analyzed in digital form. This is done by scanning
Fig. 1. The steps leading from a scanned drawing to the curvature function. a. A scanned drawing of a bowl. b. The pixelized profile. c. Enlargeddetail of the pixelized profile and the interpolated curve. d. The curvature function.
A. Gilboa et al. / Journal of Archaeological Science 31 (2004) 681–694 683

linear drawings, prevalent in archaeological reports andtransforming them to a standard form. Figure 1a–dillustrates the sequence of operations. A typical drawingfrom an archaeological report (Fig. 1a) is scanned, and aboundary identification procedure yields a pixelizedversion of the contour (Fig. 1b). In this form, it containsirrelevant ‘noise’, which is due to the finite resolutionof the scanning device, imperfections of the originaldrawings, etc. These features are filtered out to yieldthe smooth, yet accurate presentation of the originalboundary (Fig. 1c).
Technically, the smoothing is implemented by firstFourier transforming the vectors of the x and y co-ordinates along the curve. The irrelevant high-frequencyfluctuations are attenuated by a convenient filterfunction:
f�l��1
1�exp��l�l0��d�(1)
where l is the Fourier index, l0 is the filtering thresholdand d gives the width of the transition domain. Trans-forming back to real space, we get the smooth coordi-nate functions which are the basis of the subsequentanalysis.
2.2. The curvature function
Our analysis is based on the description of a planarcurve in terms of its curvature function [35,37]. Thecurvature at each point on the curve is defined byconstructing the circle, which osculates the curve at thepoint of interest. The curvature is the inverse of thecircle’s radius, and it is positive if the curve is convexat that point and negative if it is concave (Fig. 1d). Theposition of a point on the curve is specified by thedistance s along the curve (from an arbitrary referencepoint). The curvature function ��s� provides the curva-ture as a function of the arc length s.
An alternative definition of the curvature can beobtained by considering the vector t�s� which is thetangent to the curve at points. ��s� denotes the directionof the tangent. The curvature ��s� is defined as the rateof change of ��s� at s:
��s��d��s�
ds(2)
Clearly, the curvature vanishes for straight lines, and islargest at sharp angles.
Given the curvature function ��s�, the curve is com-pletely specified. This can be easily shown by integrating��s� once to obtain ��s�, from which another integrationprovides the coordinates of the curve. Gauss’ theoremstates that for a closed curve:
r��s� ds�2�. (3)
This follows immediately by integrating (2) along theclosed curve. This identity is valid independently of theshape of the curve (provided that it is connected and notself intersecting), and it is important for controllingerrors, which may arise in the numerical analysis.
We chose to represent the curves in terms of theircurvature function because this method has severalintrinsic advantages:
• Relevance—the curvature is most sensitive to thedistinctive features, which are most often used formorphological typologies, such as rims, carinationpoints, etc.
• Uniqueness—the original curve and its curvaturefunction are in one-to-one relation. Each canuniquely and accurately be reconstructed from theother.
• Efficiency—a single function of one variable,describes a two-dimensional line.
• Invariance—the curvature function does not changeunder translations and rotations of the frame ofreference.
The extraction of the curvature function from nu-merical data poses a few problems which are discussed inthe literature (see [11,30]). The main problem stems fromthe fact that the curvature involves the second derivativeof the contour, and numerical differentiation introduceslarge errors. However, the computation of the deriva-tives in Fourier space corresponds to a multiplication,which introduced no extra error, and the high fre-quencies are not sufficiently amplified to overcome theexponential filtering which was used. We checked thisnumerical scheme by comparing the original profile withthe one reconstructed from the numerically computedcurvature. The root mean square (RMS) deviationbetween the two is of an order of magnitude less than10�4 of the total length of the curve.
Features, which are significant for morphologicaldescription, classification and analysis, are expressednow in terms of the curvature function. Thus, the degreeof similarity between artifacts can be quantified bymeasuring the ‘distance’ between curvature functions.Mathematically, there is a considerable spectrum oflegitimate measures of this ‘distance’ and this is wherethe archaeological preference is injected into the analy-sis. This freedom allows attributing different weights todifferent kinds of features (e.g., emphasizing the rimmore than the shoulder in the analysis of pottery). Here,the dialogue between archaeology and mathematics iscrucial. Note that choosing one’s distance function and /or differentially weighting it to reflect what one judges tobe archaeologically significant features for the questionat hand in no way jeopardizes the objectivity ofthe method as long as one consistently uses the samefunction and parameters across the relevant samplingspace.
A. Gilboa et al. / Journal of Archaeological Science 31 (2004) 681–694684

2.3. Comparing profiles by comparing their curvaturefunctions
As noted above, the method we propose is designedto treat rim-sherds as well as complete profiles. Theformer present an added complication in that we have tocompare cross-sections which do not necessarily presentthe same fractions of the original whole vessels. Once weallow for that, whole vessels (or complete profiles) canbe included as special cases which do not need specialtreatment.
Two important assumptions have to be made in orderto proceed with the analysis: that the cross-sectionrepresents a surface of revolution and that the drawnsection is properly positioned relative to the axis ofrevolution. If these assumptions hold, the highest pointof the profile corresponds to the rim of the vessel. Itsdistance from the axis of revolution is the rim radius,which is the only length scale we can determine un-ambiguously from a drawing of a potsherd. We use thehighest point as a reference point from which distancesalong the curve are measured, and we use the rim radiusas the unit of length. Thus, the highest point occurs ats�0 where the tangent to the contour is perpendicular tothe symmetry axis, with ��0���. The scaling of arclength by the radius is very important, because it enablesthe comparison of vessels which are similar in all theirattributes, but for their absolute size. Moreover, in thisway, the curvatures of all the sherds to be analyzed arescaled, and their rim points appear at the same value ofs, namely at s�0. The end points of the smallestfragment in the assemblage, to be denoted by sminand smax, set the limits of the common s interval over
which the comparison between curvature functionswill be performed. Two unequal jars with their scaledand centered curvature functions are illustrated in(Fig. 2).
In order to compare two fragments (denoted by � and�) we have to define the ‘distance’ d�� between thecorresponding curvature functions ��(s) and ��(s) in thes interval �smin,smax�:
d���!smin
smax
(��(s)���(s))2�(s)ds (4)
In the definition above, we introduced the weight func-tion �(s) which is assumed to be non-negative in theinterval �smin,smax�. This function allows the archaeol-ogist to introduce her/his judgment concerning the rela-tive importance of the various features in the comparedfragments. For example, if the entire contour is of thesame relevance for the comparison, one would take�(s)�1. Another example: If the part of the contour,which belongs to the interior, is of less archaeologicalrelevance, a lower value of the weight function can beassigned to this part of the interval. To remove somefeatures altogether, �(s) is set to zero in the correspond-ing domains.
The scalar product of two curvature functions isdefined with a similar weight:
�����smin
smax
��(s)��(s)�(s)ds. (5)
Fig. 2. The profiles of two unequal sherds (left) and their curvature functions (right) centered at the common rim point.
A. Gilboa et al. / Journal of Archaeological Science 31 (2004) 681–694 685

The correlation between two curvatures functions is:
C�,������
��������. (6)
The distance between two curvature functions and theircorrelation are intimately connected, as can be seen fromthe identity:
(d��)2�����������2 ��������C�,� (7)
Clearly, C�,��1 if and only if the two curvature func-tions are identical, and the distance between them iszero. This is the maximum value of the correlation. Thesmaller C�,� is, the less similar the compared functionsare.
A possible weakness in the system proposed above isover-dependence on the axis origin (s=0). The highestpoint on the profile may not have been accuratelydetermined, especially when the shred is small, and/orthe rim is fairly flat. This is overcome by maximizing thecorrelation between any two curves with respect to asmall shift in the position of their maxima.
2.4. Prototype generation and shape interpolation
The implicit assumption behind typological analysisis that artifacts with similar attributes can be reduced toa single ‘ideal’ or ‘mean’ specimen, which represents theentire group. We shall refer to this representative sampleas ‘prototype’. Most often, a prototype is defined byselecting a few samples that manifest in the best way theattributes which distinguish the type. After defining theprototypes, each relevant specimen in the assemblage isto be assigned to the prototype to which it bearsmaximal affinity.
The representation of the profiles in terms of theircurvatures is particularly convenient for the generationof a prototype. Let ��(s) with ��1�NA be the curvaturesof NA sherds which define the type A. The meancurvature function,
�A(s)�1
NA���1
NA
��(s) (8)
provides the curvature of a virtual profile which picks upthe attributes which are common to the samples in thedefining set. (In the sequel, we shall use capital sub-scripts to denote prototypes.) Suppose that anotherprototype is similarly represented by a mean curvature�B(s). The distance dA,B between the two prototypesshould be sufficiently large to allow a meaningful sort-ing. (Formally, we must require that d�,A<<dA,B andd�,B<<dA,B for all the samples in the sets which define theprototypes.) If this condition is fulfilled, we can sort the
potsherds with respect to the distance from the proto-types, or equivalently define their correlations with theprototypes.
Assume that a given assemblage, which consists of Mprofiles (with curvature functions �m(s), m=1, . , M)are to be sorted according to their affinity to D pre-determined prototypes �A1
(s),�A2(s),�,�AD
(s). Going overall the assemblage, we find for each profile, say the �m(s),the ‘coordinates’ x1(m),x2(m),�,xD(m) such that:
�m(s)��i�1
D
xi(m)·�Ai(s)��m(s) (9)
The last term in (9) is necessary since the prototypes donot span the entire space of curvature functions. �m(s)stands for that component of �m(s) which is orthogonalto the subspace spanned by the prototypes. To obtainthe coordinates xi(m) we take the scalar product of �m(s)with each of the prototype curvatures. Since, by defi-nition, �m(s) is orthogonal to these functions, we obtaina set of D linear equations which is solved by invertingthe symmetric matrix A�Ai�Aj�.
3A1�A1� A1�A2� A1�A3� · · · A1�AD�
A2�A1� A2�A2� A2�A3� · · · A2�AD�
A3�A1� A3�A2� A3�A3� · · · A3�AD�
A A A 1 A
AD�A1� AD�A2� · · · · · · AD�AD�4·3
x1(m)
x2(m)
x3(m)
AxD(m)
4�3A1�m�
A2�m�
A3�m�
A
AD�m�4
(10)
(A solution of the equation exists only if detA|s0, that is,if the prototypes are linearly independent. This can betested in practice by ensuring that
DD
D!·
�det A�
!1�i�1
D F�i�1
D
Ai�Ai�2G2
.
is not too different from 1.) Each profile is now repre-sented by a point x(m) in a D-dimensional space. Oncethe coordinate vectors x(m) are known, we can easilycompute the magnitude of the vectors �m(s) which wedenote by ��m(s)�. The assumption that the assemblagecan be sorted by the prototypes �A1
,�A2,�,�AD
is justifiedonly if the ‘quality factors’
�m�i�mi2
m�m��1��
i�1
D
xi(m)m�Ai�
m�m�(11)
are small. Clearly, �m vanishes if �m(s) is indeed in thespace spanned by the prototypes, and it equals one(which is its maximal value) if �m(s) is orthogonal to allthe prototypes.
A. Gilboa et al. / Journal of Archaeological Science 31 (2004) 681–694686

The general formalism presented above takes a simpleand transparent form when only two prototypes areused (D=2).
x1�m�A1�A2�A2��m�A2�A2�A1�
A1�A1�A2�A2��A2�A1�2
x2�m�A2�A1�A1��m�A1�A1�A2�
A1�A1�A2�A2��A2�A1�2 (12)
Note that when �m(s) equals �A1(s), �x1,x2���1,0� and if it
equals �A2(s), �x1,x2���0,1�. We shall make use of (12) in
the analysis to be reported in the next section.After assigning to each fragment in the assemblage its
coordinates x1(m),x2(m),�,xD(m) and the quality factors�m, we can study the typology in greater detail. Theunderlying assumption, that the predetermined Dprototypes can indeed characterize the assemblage, istested by the values of the quality factors. If large values(�m>0.5) appear consistently, the corresponding frag-ments have features which are essentially orthogonal toall the prototypes, in other words—the set of prototypeis insufficient. Assuming that the quality factors aresmall, one can test the distribution of the points whichcorrespond to the fragments, in the D-dimensionalspace. If the choice of prototypes represents a truepartition of the assemblage, the points should concen-trate predominantly in the vicinity of the pure proto-types. However, clustering of points can occur also atother values, showing that the assemblage prefers typeswhich are intermediate between the original prototypes.This can happen, e.g., when the assemblage covers a fewperiods during which one could distinguish a gradualtypological variation. This possibility will be discussedbelow, and will be illustrated in the next section.
A frequent assumption is that ‘types’ graduallychange over time, space, or some other variable ofarchaeological interest. In such cases, it is convenient todemonstrate the transition between the types alonga linear axis. For this purpose, we can generate aninterpolating sequence of (again virtual) profiles, whichinterpolate between the two prototypes:
�(s)��A1(s)�(1�)�A2
(s) for any 0##1. (13)
We can also compute for each profile in the assemblagethe value of the interpolating parameter �m� once itscoordinates �x1(m),x2(m)� have been extracted. Specialcare must be taken when this parameter is derived, sincein contrast with the interpolation sequence (13), typicalprofiles in the assemblage possess a non-vanishing �mcomponent (see equation (9)), which is orthogonal to theprototypes. The expression we use for the interpolatingparameter is
(m)�x2(m)
x1(m)�x2(m)(14)
which, in most cases, takes values in the range �0,1� andassumes the extreme values when the profile is equal toone of the prototypes. Finally we should comment thatmuch of the present analysis would have taken a simplerform, if the prototype curvature functions were anorthonormal set. Since this is not the case, the treatmentpresented above is called for.
In the following two sections we shall show how theconcepts defined above are used to our advantage intypological analysis of assemblages from Iron Age sitesin the Southern Levant: Dor, Hazor and Tyre.
3. Applications of computerized shape analyses
The present section reports on two examples wherethe methods discussed above are applied to archaeologi-cal problems of current interest. The data-base for theanalysis consisted of drawings of vessels (or potsherds),and in each of the cases we had at our disposal approxi-mately eighty items. Thus, we could not aim at highstatistical significance. Our purpose was mainly to checkthe ability of the computerized analysis to emulate theskill and intuition of the ceramics experts, and to checkwhether we can possibly surpass them.
3.1. Shape development in early Iron Age bowls fromTel Dor
The early Iron Age ceramic sequence at Dor hasimportant bearing on issues of early Iron Agechronology and cultural interaction throughout theMediterranean [17,18,45]. The temporal evolution ofbowls was considered one of the most instrumentalchronological indexes for the early Iron there. Clearly, aheavy burden of proof rests on minute changes in exactrim shape and a precise and objective method fordescribing and comparing such stylistic developments iscalled for.
The assemblage consists of 86 bowls excavated fromstratified loci which are attributed to temporal horizonstermed (from early to late) late Ir1a, Ir1a|b, Ir1b,Ir1|2 and Ir2a. These horizons follow each other in arapid temporal sequence. These bowls were analyzed byGilboa [15,17], and an evolution of (mainly) rim shapewas identified. The samples shown in Fig. 3 represent thechange in the rim shape, from the ‘complex’ (C)—typicalof the late Ir1a horizon, to the ‘simple’ (S)—typical ofthe Ir1b, Ir1|2 and Ir2a horizons, via a transitional type(T), typifying the Ir1a|b. Employing visual judgmentonly, the three types were defined as follows: Thecomplex (C) type: carinated bowls with short upperwalls and thick molded rims with inner and outer
A. Gilboa et al. / Journal of Archaeological Science 31 (2004) 681–694 687
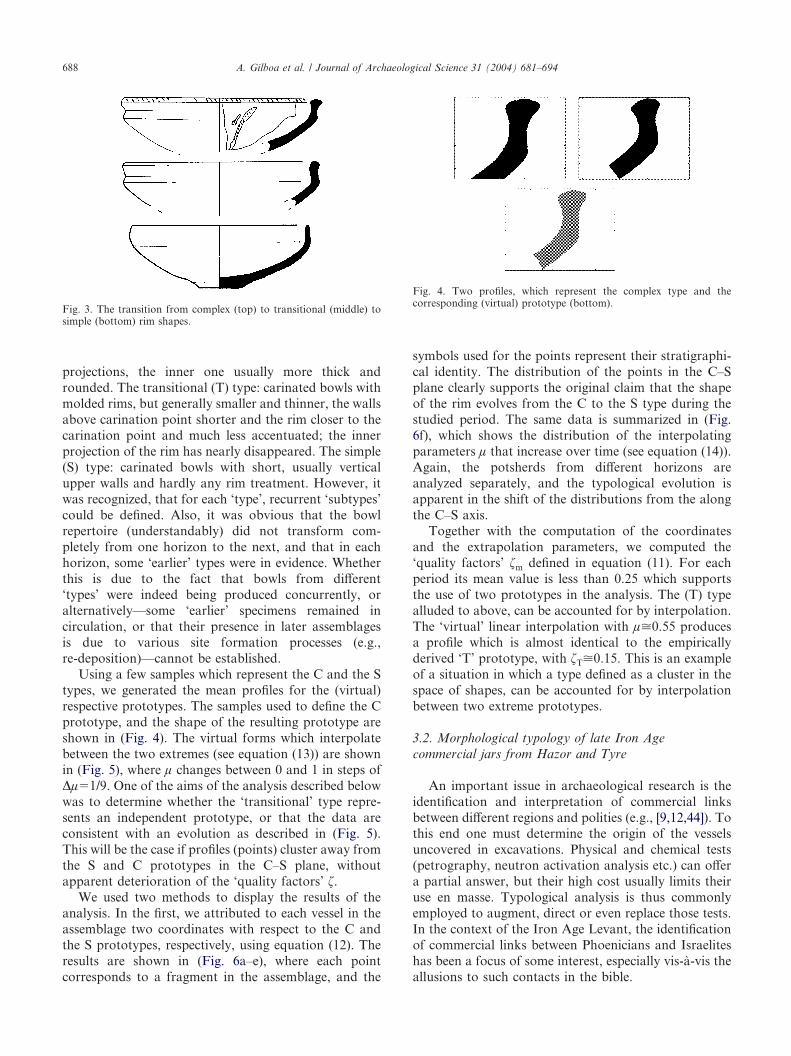
projections, the inner one usually more thick androunded. The transitional (T) type: carinated bowls withmolded rims, but generally smaller and thinner, the wallsabove carination point shorter and the rim closer to thecarination point and much less accentuated; the innerprojection of the rim has nearly disappeared. The simple(S) type: carinated bowls with short, usually verticalupper walls and hardly any rim treatment. However, itwas recognized, that for each ‘type’, recurrent ‘subtypes’could be defined. Also, it was obvious that the bowlrepertoire (understandably) did not transform com-pletely from one horizon to the next, and that in eachhorizon, some ‘earlier’ types were in evidence. Whetherthis is due to the fact that bowls from different‘types’ were indeed being produced concurrently, oralternatively—some ‘earlier’ specimens remained incirculation, or that their presence in later assemblagesis due to various site formation processes (e.g.,re-deposition)—cannot be established.
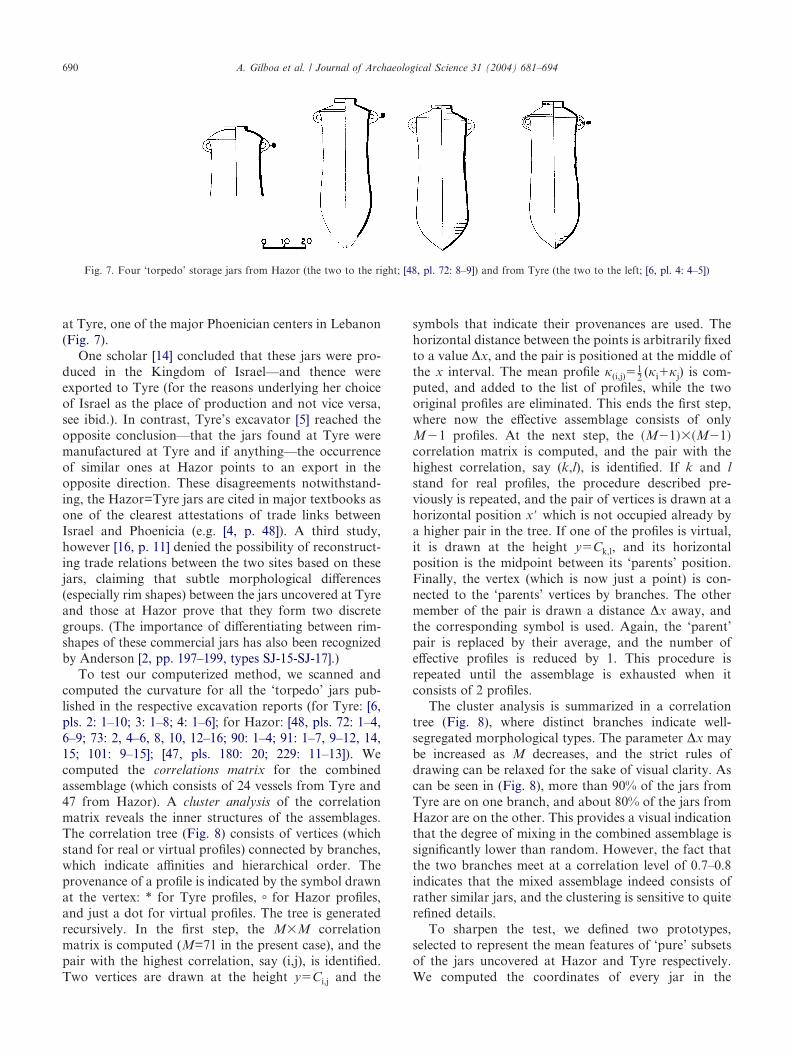
Using a few samples which represent the C and the Stypes, we generated the mean profiles for the (virtual)respective prototypes. The samples used to define the Cprototype, and the shape of the resulting prototype areshown in (Fig. 4). The virtual forms which interpolatebetween the two extremes (see equation (13)) are shownin (Fig. 5), where changes between 0 and 1 in steps of��1/9. One of the aims of the analysis described belowwas to determine whether the ‘transitional’ type repre-sents an independent prototype, or that the data areconsistent with an evolution as described in (Fig. 5).This will be the case if profiles (points) cluster away fromthe S and C prototypes in the C–S plane, withoutapparent deterioration of the ‘quality factors’ �.
We used two methods to display the results of theanalysis. In the first, we attributed to each vessel in theassemblage two coordinates with respect to the C andthe S prototypes, respectively, using equation (12). Theresults are shown in (Fig. 6a–e), where each pointcorresponds to a fragment in the assemblage, and the
symbols used for the points represent their stratigraphi-cal identity. The distribution of the points in the C–Splane clearly supports the original claim that the shapeof the rim evolves from the C to the S type during thestudied period. The same data is summarized in (Fig.6f), which shows the distribution of the interpolatingparameters that increase over time (see equation (14)).Again, the potsherds from different horizons areanalyzed separately, and the typological evolution isapparent in the shift of the distributions from the alongthe C–S axis.
Together with the computation of the coordinatesand the extrapolation parameters, we computed the‘quality factors’ �m defined in equation (11). For eachperiod its mean value is less than 0.25 which supportsthe use of two prototypes in the analysis. The (T) typealluded to above, can be accounted for by interpolation.The ‘virtual’ linear interpolation with >0.55 producesa profile which is almost identical to the empiricallyderived ‘T’ prototype, with �T>0.15. This is an exampleof a situation in which a type defined as a cluster in thespace of shapes, can be accounted for by interpolationbetween two extreme prototypes.
3.2. Morphological typology of late Iron Agecommercial jars from Hazor and Tyre
An important issue in archaeological research is theidentification and interpretation of commercial linksbetween different regions and polities (e.g., [9,12,44]). Tothis end one must determine the origin of the vesselsuncovered in excavations. Physical and chemical tests(petrography, neutron activation analysis etc.) can offera partial answer, but their high cost usually limits theiruse en masse. Typological analysis is thus commonlyemployed to augment, direct or even replace those tests.In the context of the Iron Age Levant, the identificationof commercial links between Phoenicians and Israeliteshas been a focus of some interest, especially vis-a-vis theallusions to such contacts in the bible.
Fig. 3. The transition from complex (top) to transitional (middle) tosimple (bottom) rim shapes.
Fig. 4. Two profiles, which represent the complex type and thecorresponding (virtual) prototype (bottom).
A. Gilboa et al. / Journal of Archaeological Science 31 (2004) 681–694688

Ninth and eighth century BCE cylindrical (so called‘torpedo’ or ‘crisp-ware’) commercial jars became firstknown from sites in Israel, especially its northernpart, in regions known to have formed part of the
northern Israelite Kingdom during the Iron Age IIb.The largest assemblage uncovered was that at Hazor,in the Huleh basin in Israel’s north. In the 1970ssimilar jars were uncovered in an excavation conducted
Fig. 5. Interpolating forms from ‘complex’ (upper left) to ‘simple’ (lower right).
Fig. 6. a. The distribution of the bowls in the C-S plane, denoted by the same stratigraphic symbols as used in b–e. b–e. The same as a. for eitherone or two horizons. f. The mean values and the standard deviations of and � for each period.
A. Gilboa et al. / Journal of Archaeological Science 31 (2004) 681–694 689
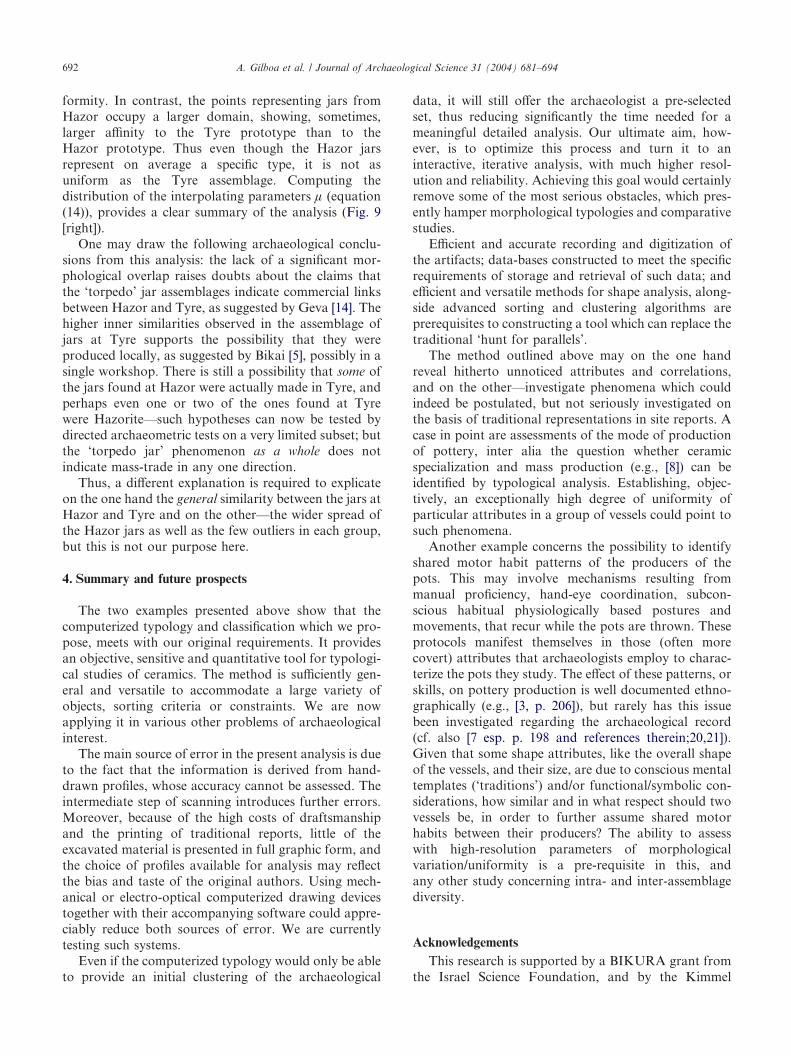
at Tyre, one of the major Phoenician centers in Lebanon(Fig. 7).
One scholar [14] concluded that these jars were pro-duced in the Kingdom of Israel—and thence wereexported to Tyre (for the reasons underlying her choiceof Israel as the place of production and not vice versa,see ibid.). In contrast, Tyre’s excavator [5] reached theopposite conclusion—that the jars found at Tyre weremanufactured at Tyre and if anything—the occurrenceof similar ones at Hazor points to an export in theopposite direction. These disagreements notwithstand-ing, the Hazor=Tyre jars are cited in major textbooks asone of the clearest attestations of trade links betweenIsrael and Phoenicia (e.g. [4, p. 48]). A third study,however [16, p. 11] denied the possibility of reconstruct-ing trade relations between the two sites based on thesejars, claiming that subtle morphological differences(especially rim shapes) between the jars uncovered at Tyreand those at Hazor prove that they form two discretegroups. (The importance of differentiating between rim-shapes of these commercial jars has also been recognizedby Anderson [2, pp. 197–199, types SJ-15-SJ-17].)
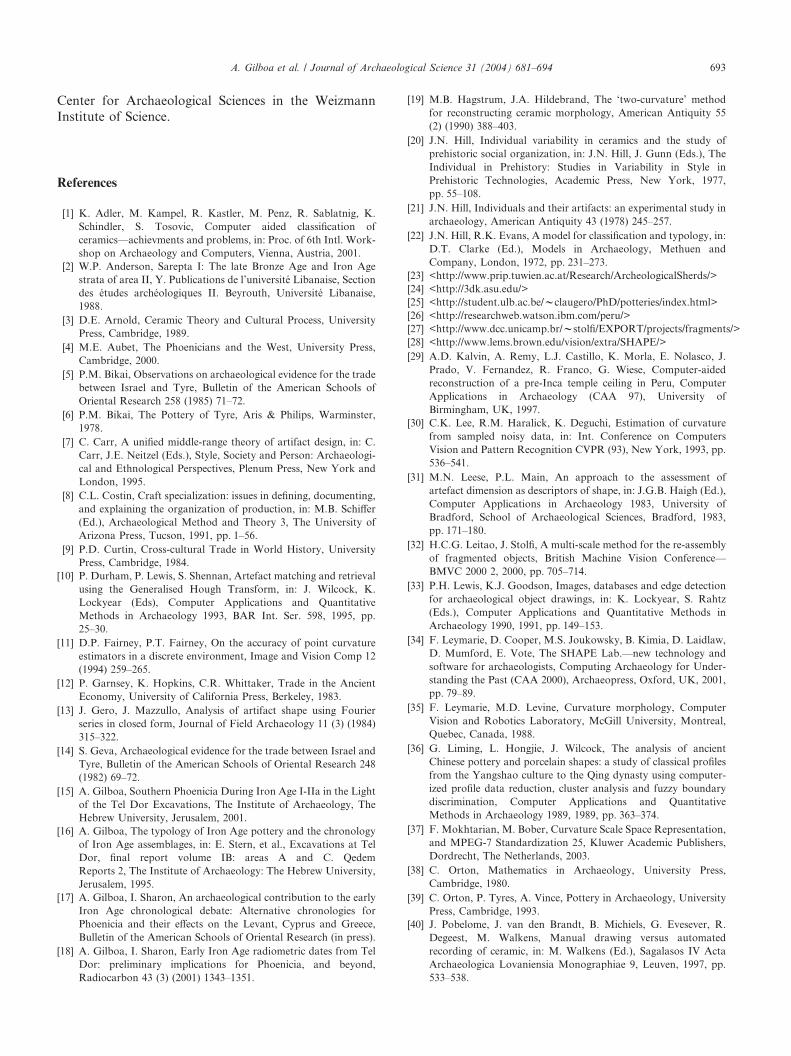
To test our computerized method, we scanned andcomputed the curvature for all the ‘torpedo’ jars pub-lished in the respective excavation reports (for Tyre: [6,pls. 2: 1–10; 3: 1–8; 4: 1–6]; for Hazor: [48, pls. 72: 1–4,6–9; 73: 2, 4–6, 8, 10, 12–16; 90: 1–4; 91: 1–7, 9–12, 14,15; 101: 9–15]; [47, pls. 180: 20; 229: 11–13]). Wecomputed the correlations matrix for the combinedassemblage (which consists of 24 vessels from Tyre and47 from Hazor). A cluster analysis of the correlationmatrix reveals the inner structures of the assemblages.The correlation tree (Fig. 8) consists of vertices (whichstand for real or virtual profiles) connected by branches,which indicate affinities and hierarchical order. Theprovenance of a profile is indicated by the symbol drawnat the vertex: * for Tyre profiles, + for Hazor profiles,and just a dot for virtual profiles. The tree is generatedrecursively. In the first step, the M�M correlationmatrix is computed (M=71 in the present case), and thepair with the highest correlation, say (i,j), is identified.Two vertices are drawn at the height y�Ci,j and the
symbols that indicate their provenances are used. Thehorizontal distance between the points is arbitrarily fixedto a value �x, and the pair is positioned at the middle ofthe x interval. The mean profile �(i,j)�
12 (�i��j) is com-
puted, and added to the list of profiles, while the twooriginal profiles are eliminated. This ends the first step,where now the effective assemblage consists of onlyM�1 profiles. At the next step, the �M�1���M�1�correlation matrix is computed, and the pair with thehighest correlation, say (k,l), is identified. If k and lstand for real profiles, the procedure described pre-viously is repeated, and the pair of vertices is drawn at ahorizontal position x# which is not occupied already bya higher pair in the tree. If one of the profiles is virtual,it is drawn at the height y�Ck,l, and its horizontalposition is the midpoint between its ‘parents’ position.Finally, the vertex (which is now just a point) is con-nected to the ‘parents’ vertices by branches. The othermember of the pair is drawn a distance �x away, andthe corresponding symbol is used. Again, the ‘parent’pair is replaced by their average, and the number ofeffective profiles is reduced by 1. This procedure isrepeated until the assemblage is exhausted when itconsists of 2 profiles.
The cluster analysis is summarized in a correlationtree (Fig. 8), where distinct branches indicate well-segregated morphological types. The parameter �x maybe increased as M decreases, and the strict rules ofdrawing can be relaxed for the sake of visual clarity. Ascan be seen in (Fig. 8), more than 90% of the jars fromTyre are on one branch, and about 80% of the jars fromHazor are on the other. This provides a visual indicationthat the degree of mixing in the combined assemblage issignificantly lower than random. However, the fact thatthe two branches meet at a correlation level of 0.7–0.8indicates that the mixed assemblage indeed consists ofrather similar jars, and the clustering is sensitive to quiterefined details.
To sharpen the test, we defined two prototypes,selected to represent the mean features of ‘pure’ subsetsof the jars uncovered at Hazor and Tyre respectively.We computed the coordinates of every jar in the
Fig. 7. Four ‘torpedo’ storage jars from Hazor (the two to the right; [48, pl. 72: 8–9]) and from Tyre (the two to the left; [6, pl. 4: 4–5])
A. Gilboa et al. / Journal of Archaeological Science 31 (2004) 681–694690

assemblage with respect to these two prototypes, againusing equation (12) and the results are presented ingraphical form in (Fig. 9 [left]). Again, the distributionof the ‘quality factors’ �m is centered at the value �0.3with a spread of �0.15 (FWHM—Full Width at Half
Maximum), supporting the use of only two prototypesin the analysis.
It is clear that most of the jars from Tyre demonstratelarge correlations with the Tyre prototype, and theirspread is rather low, indicating morphological uni-
Fig. 8. The correlation tree of the combined assemblage of Hazor and Tyre jars.
Fig. 9. The distribution of the whole assemblage in the prototypes plane (left) and along their axis (right).
A. Gilboa et al. / Journal of Archaeological Science 31 (2004) 681–694 691
formity. In contrast, the points representing jars fromHazor occupy a larger domain, showing, sometimes,larger affinity to the Tyre prototype than to theHazor prototype. Thus even though the Hazor jarsrepresent on average a specific type, it is not asuniform as the Tyre assemblage. Computing thedistribution of the interpolating parameters (equation(14)), provides a clear summary of the analysis (Fig. 9[right]).
One may draw the following archaeological conclu-sions from this analysis: the lack of a significant mor-phological overlap raises doubts about the claims thatthe ‘torpedo’ jar assemblages indicate commercial linksbetween Hazor and Tyre, as suggested by Geva [14]. Thehigher inner similarities observed in the assemblage ofjars at Tyre supports the possibility that they wereproduced locally, as suggested by Bikai [5], possibly in asingle workshop. There is still a possibility that some ofthe jars found at Hazor were actually made in Tyre, andperhaps even one or two of the ones found at Tyrewere Hazorite—such hypotheses can now be tested bydirected archaeometric tests on a very limited subset; butthe ‘torpedo jar’ phenomenon as a whole does notindicate mass-trade in any one direction.
Thus, a different explanation is required to explicateon the one hand the general similarity between the jars atHazor and Tyre and on the other—the wider spread ofthe Hazor jars as well as the few outliers in each group,but this is not our purpose here.
4. Summary and future prospects
The two examples presented above show that thecomputerized typology and classification which we pro-pose, meets with our original requirements. It providesan objective, sensitive and quantitative tool for typologi-cal studies of ceramics. The method is sufficiently gen-eral and versatile to accommodate a large variety ofobjects, sorting criteria or constraints. We are nowapplying it in various other problems of archaeologicalinterest.
The main source of error in the present analysis is dueto the fact that the information is derived from hand-drawn profiles, whose accuracy cannot be assessed. Theintermediate step of scanning introduces further errors.Moreover, because of the high costs of draftsmanshipand the printing of traditional reports, little of theexcavated material is presented in full graphic form, andthe choice of profiles available for analysis may reflectthe bias and taste of the original authors. Using mech-anical or electro-optical computerized drawing devicestogether with their accompanying software could appre-ciably reduce both sources of error. We are currentlytesting such systems.
Even if the computerized typology would only be ableto provide an initial clustering of the archaeological
data, it will still offer the archaeologist a pre-selectedset, thus reducing significantly the time needed for ameaningful detailed analysis. Our ultimate aim, how-ever, is to optimize this process and turn it to aninteractive, iterative analysis, with much higher resol-ution and reliability. Achieving this goal would certainlyremove some of the most serious obstacles, which pres-ently hamper morphological typologies and comparativestudies.
Efficient and accurate recording and digitization ofthe artifacts; data-bases constructed to meet the specificrequirements of storage and retrieval of such data; andefficient and versatile methods for shape analysis, along-side advanced sorting and clustering algorithms areprerequisites to constructing a tool which can replace thetraditional ‘hunt for parallels’.
The method outlined above may on the one handreveal hitherto unnoticed attributes and correlations,and on the other—investigate phenomena which couldindeed be postulated, but not seriously investigated onthe basis of traditional representations in site reports. Acase in point are assessments of the mode of productionof pottery, inter alia the question whether ceramicspecialization and mass production (e.g., [8]) can beidentified by typological analysis. Establishing, objec-tively, an exceptionally high degree of uniformity ofparticular attributes in a group of vessels could point tosuch phenomena.
Another example concerns the possibility to identifyshared motor habit patterns of the producers of thepots. This may involve mechanisms resulting frommanual proficiency, hand-eye coordination, subcon-scious habitual physiologically based postures andmovements, that recur while the pots are thrown. Theseprotocols manifest themselves in those (often morecovert) attributes that archaeologists employ to charac-terize the pots they study. The effect of these patterns, orskills, on pottery production is well documented ethno-graphically (e.g., [3, p. 206]), but rarely has this issuebeen investigated regarding the archaeological record(cf. also [7 esp. p. 198 and references therein;20,21]).Given that some shape attributes, like the overall shapeof the vessels, and their size, are due to conscious mentaltemplates (‘traditions’) and/or functional/symbolic con-siderations, how similar and in what respect should twovessels be, in order to further assume shared motorhabits between their producers? The ability to assesswith high-resolution parameters of morphologicalvariation/uniformity is a pre-requisite in this, andany other study concerning intra- and inter-assemblagediversity.
AcknowledgementsThis research is supported by a BIKURA grant from
the Israel Science Foundation, and by the Kimmel
A. Gilboa et al. / Journal of Archaeological Science 31 (2004) 681–694692
Center for Archaeological Sciences in the WeizmannInstitute of Science.
References
[1] K. Adler, M. Kampel, R. Kastler, M. Penz, R. Sablatnig, K.Schindler, S. Tosovic, Computer aided classification ofceramics—achievments and problems, in: Proc. of 6th Intl. Work-shop on Archaeology and Computers, Vienna, Austria, 2001.
[2] W.P. Anderson, Sarepta I: The late Bronze Age and Iron Agestrata of area II, Y. Publications de l’universite Libanaise, Sectiondes etudes archeologiques II. Beyrouth, Universite Libanaise,1988.
[3] D.E. Arnold, Ceramic Theory and Cultural Process, UniversityPress, Cambridge, 1989.
[4] M.E. Aubet, The Phoenicians and the West, University Press,Cambridge, 2000.
[5] P.M. Bikai, Observations on archaeological evidence for the tradebetween Israel and Tyre, Bulletin of the American Schools ofOriental Research 258 (1985) 71–72.
[6] P.M. Bikai, The Pottery of Tyre, Aris & Philips, Warminster,1978.
[7] C. Carr, A unified middle-range theory of artifact design, in: C.Carr, J.E. Neitzel (Eds.), Style, Society and Person: Archaeologi-cal and Ethnological Perspectives, Plenum Press, New York andLondon, 1995.
[8] C.L. Costin, Craft specialization: issues in defining, documenting,and explaining the organization of production, in: M.B. Schiffer(Ed.), Archaeological Method and Theory 3, The University ofArizona Press, Tucson, 1991, pp. 1–56.
[9] P.D. Curtin, Cross-cultural Trade in World History, UniversityPress, Cambridge, 1984.
[10] P. Durham, P. Lewis, S. Shennan, Artefact matching and retrievalusing the Generalised Hough Transform, in: J. Wilcock, K.Lockyear (Eds), Computer Applications and QuantitativeMethods in Archaeology 1993, BAR Int. Ser. 598, 1995, pp.25–30.
[11] D.P. Fairney, P.T. Fairney, On the accuracy of point curvatureestimators in a discrete environment, Image and Vision Comp 12(1994) 259–265.
[12] P. Garnsey, K. Hopkins, C.R. Whittaker, Trade in the AncientEconomy, University of California Press, Berkeley, 1983.
[13] J. Gero, J. Mazzullo, Analysis of artifact shape using Fourierseries in closed form, Journal of Field Archaeology 11 (3) (1984)315–322.
[14] S. Geva, Archaeological evidence for the trade between Israel andTyre, Bulletin of the American Schools of Oriental Research 248(1982) 69–72.
[15] A. Gilboa, Southern Phoenicia During Iron Age I-IIa in the Lightof the Tel Dor Excavations, The Institute of Archaeology, TheHebrew University, Jerusalem, 2001.
[16] A. Gilboa, The typology of Iron Age pottery and the chronologyof Iron Age assemblages, in: E. Stern, et al., Excavations at TelDor, final report volume IB: areas A and C. QedemReports 2, The Institute of Archaeology: The Hebrew University,Jerusalem, 1995.
[17] A. Gilboa, I. Sharon, An archaeological contribution to the earlyIron Age chronological debate: Alternative chronologies forPhoenicia and their effects on the Levant, Cyprus and Greece,Bulletin of the American Schools of Oriental Research (in press).
[18] A. Gilboa, I. Sharon, Early Iron Age radiometric dates from TelDor: preliminary implications for Phoenicia, and beyond,Radiocarbon 43 (3) (2001) 1343–1351.
[19] M.B. Hagstrum, J.A. Hildebrand, The ‘two-curvature’ methodfor reconstructing ceramic morphology, American Antiquity 55(2) (1990) 388–403.
[20] J.N. Hill, Individual variability in ceramics and the study ofprehistoric social organization, in: J.N. Hill, J. Gunn (Eds.), TheIndividual in Prehistory: Studies in Variability in Style inPrehistoric Technologies, Academic Press, New York, 1977,pp. 55–108.
[21] J.N. Hill, Individuals and their artifacts: an experimental study inarchaeology, American Antiquity 43 (1978) 245–257.
[22] J.N. Hill, R.K. Evans, A model for classification and typology, in:D.T. Clarke (Ed.), Models in Archaeology, Methuen andCompany, London, 1972, pp. 231–273.
[23] <http://www.prip.tuwien.ac.at/Research/ArcheologicalSherds/>[24] <http://3dk.asu.edu/>[25] <http://student.ulb.ac.be/wclaugero/PhD/potteries/index.html>[26] <http://researchweb.watson.ibm.com/peru/>[27] <http://www.dcc.unicamp.br/wstolfi/EXPORT/projects/fragments/>[28] <http://www.lems.brown.edu/vision/extra/SHAPE/>[29] A.D. Kalvin, A. Remy, L.J. Castillo, K. Morla, E. Nolasco, J.
Prado, V. Fernandez, R. Franco, G. Wiese, Computer-aidedreconstruction of a pre-Inca temple ceiling in Peru, ComputerApplications in Archaeology (CAA 97), University ofBirmingham, UK, 1997.
[30] C.K. Lee, R.M. Haralick, K. Deguchi, Estimation of curvaturefrom sampled noisy data, in: Int. Conference on ComputersVision and Pattern Recognition CVPR (93), New York, 1993, pp.536–541.
[31] M.N. Leese, P.L. Main, An approach to the assessment ofartefact dimension as descriptors of shape, in: J.G.B. Haigh (Ed.),Computer Applications in Archaeology 1983, University ofBradford, School of Archaeological Sciences, Bradford, 1983,pp. 171–180.
[32] H.C.G. Leitao, J. Stolfi, A multi-scale method for the re-assemblyof fragmented objects, British Machine Vision Conference—BMVC 2000 2, 2000, pp. 705–714.
[33] P.H. Lewis, K.J. Goodson, Images, databases and edge detectionfor archaeological object drawings, in: K. Lockyear, S. Rahtz(Eds.), Computer Applications and Quantitative Methods inArchaeology 1990, 1991, pp. 149–153.
[34] F. Leymarie, D. Cooper, M.S. Joukowsky, B. Kimia, D. Laidlaw,D. Mumford, E. Vote, The SHAPE Lab.—new technology andsoftware for archaeologists, Computing Archaeology for Under-standing the Past (CAA 2000), Archaeopress, Oxford, UK, 2001,pp. 79–89.
[35] F. Leymarie, M.D. Levine, Curvature morphology, ComputerVision and Robotics Laboratory, McGill University, Montreal,Quebec, Canada, 1988.
[36] G. Liming, L. Hongjie, J. Wilcock, The analysis of ancientChinese pottery and porcelain shapes: a study of classical profilesfrom the Yangshao culture to the Qing dynasty using computer-ized profile data reduction, cluster analysis and fuzzy boundarydiscrimination, Computer Applications and QuantitativeMethods in Archaeology 1989, 1989, pp. 363–374.
[37] F. Mokhtarian, M. Bober, Curvature Scale Space Representation,and MPEG-7 Standardization 25, Kluwer Academic Publishers,Dordrecht, The Netherlands, 2003.
[38] C. Orton, Mathematics in Archaeology, University Press,Cambridge, 1980.
[39] C. Orton, P. Tyres, A. Vince, Pottery in Archaeology, UniversityPress, Cambridge, 1993.
[40] J. Pobelome, J. van den Brandt, B. Michiels, G. Evesever, R.Degeest, M. Walkens, Manual drawing versus automatedrecording of ceramic, in: M. Walkens (Ed.), Sagalasos IV ActaArchaeologica Lovaniensia Monographiae 9, Leuven, 1997, pp.533–538.
A. Gilboa et al. / Journal of Archaeological Science 31 (2004) 681–694 693

[41] H. Pottmann, M. Peternell, B. Ravani, An introduction to linegeometry with applications, Computer Aided Design 31 (1999)3–16.
[42] A. Razdan, D. Liu, M. Bae, M. Zhu, G. Farin, Using geometricmodeling for archiving and searching 3D archaeological vessel, in:International Conference on Imaging Science, Systems, and Tech-nology CISST 2001, Las Vegas, 2001.
[43] R. Sablatnig, C. Menard, Computer based acquisition of archaeo-logical finds: the first step towards automatic classification, in: P.Moscati, S. Mariotti (Eds), The 3rd International Symposium onComputing and Archaeology, Vol. 1, Rome, 1996, pp. 429–446.
[44] J. Sabloff, C.C. Lamberg-Karlovsky (Eds.), Ancient Civilizationand Trade, University of New Mexico Press, Albuquerque, 1975.
[45] I. Sharon, A. Gilboa, The SKL Town: Dor in the Early Iron Age,in: M. Artzy, A.E. Killebrew, G. Lehmann (Eds), Philistines andOther Sea People, Brill, Leiden, in press.
[46] R. Whallon, J.A. Brown (Eds.), Essays on ArchaeologicalTypology, Center for American Archaeology Press, 1982.
[47] Y. Yadin, Y. Aharoni, R. Amiran, T. Dothan, M. Dothan, I.Dunayevsky, J. Perrot, Hazor III–IV: An Account of the Thirdand Fourth Seasons of Excavation, 1957–1958, The HebrewUniversity, Jerusalem, 1961.
[48] Y. Yadin, Y. Aharoni, R. Amiran, T. Dothan, I. Dunayevsky, J.Perrot, Hazor II: An Account of the Second Season ofExcavation, 1956, The Hebrew University, Jerusalem, 1960.
A. Gilboa et al. / Journal of Archaeological Science 31 (2004) 681–694694