towards ending child labour in zambia: an assessment of resource requirements€¦ · ·...
TRANSCRIPT

Inter-agency country report
September 2012
TOWARDS ENDING CHILD
LABOUR IN ZAMBIA:
An assessment of resource
requirements

Towards ending child labour in Zambia:
An assessment of resource requirements
Inter-agency country report
September 2012
Understanding Children’s Work (UCW) Project
Villa Aldobrandini
V. Panisperna 28
00184 Rome
Tel: +39 06.4341.2008
Fax: +39 06.2020.687
Email: [email protected]
As part of broader efforts towards durable solutions to child labour, the International
Labour Organization (ILO), the United Nations Children’s Fund (UNICEF), and the World
Bank initiated the interagency Understanding Children’s Work (UCW) project in
December 2000. The project is guided by the Oslo Agenda for Action, which laid out the
priorities for the international community in the fight against child labour. Through a
variety of data collection, research, and assessment activities, the UCW project is broadly
directed toward improving understanding of child labour, its causes and effects, how it can
be measured, and effective policies for addressing it. For further information, see the
project website at www.ucw-project.org.

Towards ending child labour in Zambia:
An assessment of resource requirements
CONTENTS
EXECUTIVE SUMMARY ............................................................................................................................... 6
Child labour situation in Zambia ................................................................................................................... 6
Resource implications of meeting national commitment to eliminating child labour .................................... 7
1. Introduction ................................................................................................................................................. 12
2. Country context ........................................................................................................................................... 15
3. National response to child labour: an overview of policy and programmes ................................................ 18
3.1 Policies and programmes directly addressing child labour .............................................................. 18
3.2 Education......................................................................................................................................... 20
3.3 Social protection .............................................................................................................................. 22
Transfer schemes ......................................................................................................................... 22
Public works ................................................................................................................................ 25
4. Children’s INVOLVEMENT in employment .................................................................................................... 26
4.1 Extent of children’s involvement in employment ............................................................................ 26
4.2 Characteristics of children’s work in employment .......................................................................... 29
4.3 Trends in children’s employment .................................................................................................... 30
4.4 Determinants of child labour ........................................................................................................... 31
5. Expected evolution of child labour population ............................................................................................ 35
5.1 Evolution of children in employment arising from demographic change ........................................ 35
5.2 Evolution of population of children in employment arising from economic and policy forecast .... 37
6. Policy options for addressing child labour: assessing resource requirements .............................................. 39
6.1 Child cash transfers ......................................................................................................................... 39
6.2 Package of additional prevention and withdrawal measures ........................................................... 43
7. Conclusion .................................................................................................................................................. 47
References ....................................................................................................................................................... 48
Annex 1. Social protection schemes in Zambia ............................................................................................... 49
Annex 2. Impact Pilot cash transfer schemes in Zambia ................................................................................. 55

TOWARDS ENDING CHILD LABOUR IN ZAMBIA | EXECUTIVE SUMMARY 4
ACRONYMS
AICA Agricultural inputs-for-assets programme
BESSIP Basic education sub-sector investment plan
CBT Community-based targeting
CCT Conditional child cash transfer
CRC UN Convention on the Rights of the Child
CWACs Community welfare assistance committees
EYPC Employment of Young Persons and Children Act (No.10 of 2004)
FBE Free basic education policy
FSP Food security pack
IEC Information, education and communication
ILO International Labour Organisation
IPEC ILO International Programme on the Elimination of Child labour
MDGs Millennium Development Goals
MCDSS Ministry of Community Development and Social Services
MLSS Ministry of Labour and Social Security
NAPSA National Pension Scheme Authority
ODI Overseas Development Institute
PAM Programme against malnutrition
PUSH Project urban self-help
PWA Public welfare assistance scheme
SFP School feeding programme
SCT Social cash transfers
SCTS Social cash transfer scheme
UCW Inter-agency Understanding Children’s Work Programme
ZFE Zambia Federation of Employers
ZLFS Zambia Labour Force Survey
ZMK Zambian Kwacha

TOWARDS ENDING CHILD LABOUR IN ZAMBIA | EXECUTIVE SUMMARY 5
LIST OF FIGURES
Figure 1. Predicted number of children in employment (,000), 7-15 years age group, considering demographic change and economic/policy forecast ................................................................................................................................ 8
Figure 2. Predicted number of children in employment (,000), 7-15 years age group, considering demographic
change, economic and policy forecast and impact of CCT................................................................................................. 9
Figure 3. Total children prevented and withdrawn from employment through TBP-SP and TACKLE interventions,
by programme year (a) ...................................................................................................................................................... 10
Figure 4. Allocation of cost of core intervention package, by intervention strategy and programme year ........................... 11
Figure 5. Distribution of children by activity category, 7-14 years and 15-17 years age groups .......................................... 26
Figure 6. Child employment and school attendance rates, 7-14 years age group, by province ............................................. 28
Figure 7. Children’s involvement in economic activity, by age, sex and residence(1)........................................................... 28
Figure 8. Employment sector, children in employment aged 7-14 years, by residence ........................................................ 29
Figure 9. Employment sector, children in employment aged 7-14 years, by residence ........................................................ 29
Figure 10. Changes in the composition of children’s activities, 7-14 years age group, 2002/03-2005/06 ............................ 31
Figure 11. Predicted number of children in employment (,000), 7-15 years age group, considering demographic
change ............................................................................................................................................................................. 36
Figure 12. Predicted number of children in employment (,000), 7-15 years age group, considering demographic change and economic/policy forecast .............................................................................................................................. 38
Figure 13. Post-intervention changes in children’s activity status, first year of CCT programme ........................................ 41
Figure 14. Predicted number of children in employment (,000), 7-15 years age group, considering demographic
change, economic and policy forecast and impact of CCT............................................................................................... 41
Figure 15. Change from employment exclusively resulting from CCT................................................................................ 42
Figure 16. Total children prevented and withdrawn from employment through TBP-SP and TACKLE interventions,
by programme year (a) ...................................................................................................................................................... 45
Figure 17. Allocation of cost of core intervention package, by intervention strategy and programme year ......................... 45
LIST OF TABLES
Table 1. Zambia and the Millennium Development Goals: an overview ......................................................... 16
Table 2. Social protection sector: Objectives, strategies and programmes during SNDP period ..................... 22
Table 3. Child activity status, by age group and sex, 2008 .............................................................................. 27
Table 4. Child activity status, by age group and place of residence, 2008....................................................... 27
Table 5. Average daily working hours, children aged 7-14 years, by sex, place of residence, status and
sector of employment .................................................................................................................................. 29
Table 6. Employment status of children, by age, sex and place of residence .................................................. 30
Table 7. Changes in child activity status, 7-14 years age group, by sex and residence, 2005 and 2008 .......... 30
Table 8. Descriptive statistics(a) ....................................................................................................................... 32
Table 9. Determinants of children’s time use .................................................................................................. 33
Table 10. Size of birth cohorts ......................................................................................................................... 36
Table 11. Conditional cash transfer scheme .................................................................................................... 40
Table 12. Monthly resource requirements for conditional cash transfer scheme – year 1 ............................... 43
Table 13. Annual unit costs for prevention and withdrawal interventions, IPEC TBP and TACKLE
Projects ........................................................................................................................................................ 44
Table 14. Estimated cost of core intervention package for eliminating child labour, by year(a) ..................... 46

TOWARDS ENDING CHILD LABOUR IN ZAMBIA | EXECUTIVE SUMMARY 6
EXECUTIVE SUMMARY
The current Inter-Agency Report provides an overview of the child labour
situation in the country and how it is changing over time, building on and updating
the results of the comprehensive Country Report on child labour published in
2009.1
With this overview as background, the Inter-Agency Report then analyses
the resource implications of meeting the national commitment to eliminating child
labour. Specifically in this context, the report assesses the economic costs over a
five-year period of (1) providing the poorest of the poor families with a minimum
degree of social protection and (2) providing a package of special, targeted
measures aimed at protecting and removing children from employment.
The report shows that while Zambia has witnessed a substantial reduction in the
incidence of child labour, this progress will not be enough to eliminate child
labour by 2015. Even under a best-case growth and policy scenario a substantial
number of children aged 7-15 years– just below one million – is expected to be
still in employment in 2015. This signifies that additional policy efforts will
therefore be necessary to eliminate child labour within this period.
The cost estimation results indicate that providing poorest of the poor with social
protection (through a conditional cash transfer scheme) would cost some $US80.4
million annually, and would help prevent or remove some 100,000 children from
child labour over a five-year period. A package of special prevention and
protection measures targeting the remaining child labourers would require an
additional average outlay of $USD26.3 annually over a five-year time horizon.
These costs are premised on a best-case economic and policy scenario. In a
context of slower household income growth and less progress in terms of
improving school quality, the target number of children in child labour would be
higher over the five-year period, in turn raising the cost of eliminating child
labour.
Child labour situation in Zambia
Child labour constitutes an important obstacle to achieving Universal Primary
Education and other Millennium Development Goals in Zambia. It not only harms
the welfare of individual children, but also slows broader national poverty
reduction and development efforts. Children forced out of school and into labour
to help their families to make ends meet are denied the opportunity to acquire the
knowledge and skills needed for gainful future employment, thereby perpetuating
the cycle of poverty. Moreover, child labour can lead to social vulnerability and
social marginalization, and can permanently impair the attainment of personal and
productive potential, in turn influencing lifetime patterns of employment and
earnings, and generating important constraints to national development goals.
Child involvement in employment remains very high in Zambia. More than one
out of every three children aged 7-14 years were at work in economic activity in
2008. A comparison of the results from the 2005 and 2008 labour force surveys
shows a dramatic decline in children’s employment of 14 percentage points during
this period (from 48% to 34%). In absolute terms, there were over 270,000 fewer
children in employment in 2008 than in 2005. The progress in reducing children’s
employment during this period extended to both boys and girls. The decline in
employment was not, however, accompanied by similar gains in children’s school
1 Government of Zambia and Understanding Children’s Work Programme (2009).Understanding
children’s work in Zambia. Country Report.

TOWARDS ENDING CHILD LABOUR IN ZAMBIA | EXECUTIVE SUMMARY 7
attendance: the proportion of children attending school rose by only about three
percentage points from 2005 to 2008.
There are several important characteristics of children’s employment in Zambia of
relevance for policy. First, children’s employment is mainly a rural phenomenon.
The share of rural children in employment was three times that of their urban
peers in 2008. Second, there are substantial regional differences, underscoring the
need for the geographic targeting of efforts against child labour. Sixteen percent
of children worked in employment in Lusaka in 2008, for example, against 55% in
Eastern province and 52 percent in Northern province. Third, child economic
activity rises sharply with age, but numbers of even very young working children
are far from negligible. Around 14% of seven year-olds and 22% of eight year-
olds are already at work in employment.
Children’s employment in Zambia is concentrated overwhelmingly in one sector –
agriculture. Nearly 92% of total 7-14 year-olds in employment work in
agriculture, against around four percent in services and three percent in trade. At
the same time, almost all children in employment (93%) work for their families as
unpaid labour. Only about four percent of children work as paid employees in
formal entities; this is important because children in the formal sector are the only
ones typically accessible to labour inspection regimes.
The report also looks at the factors associated with child labour in Zambia. Child
labour increases clearly with age, not surprising in that children are more
productive as they grow older. Parental education reduces the probability of
children working, at least in part the product of the fact more educated parents are
more aware of the benefits of schooling. Higher household earnings also reduce
child labour, underscoring the link between child labour and poverty. Improved
school quality, as proxied by the number of teachers relative to the child
population, makes it less likely that children work. Child labour is pro-cyclical,
increasing with overall increases in labour demand.
Resource implications of meeting national commitment to eliminating child labour
As we have seen, children’s involvement in employment in Zambia is still
relatively high, although it is trending downwards. Economic growth and
demographic evolution, coupled with a set of education policies already in place,
are likely to generate a further “spontaneous” reduction in children’s employment
even without new policy measures. In order to assess the costs of eliminating child
labour over a five-year time horizon, it is first necessary to know the size of this
spontaneous reduction, and, following from this, the size of the target population
of children remaining in child labour when this reduction is accounted for.
The projections of the number of children in employment up to 2015 in the
absence of specific additional interventions are undertaken in two steps. First, we
look at how the population of children in employment will evolve based only on
demographic change, utilizing information from Zambia LFS 2008 on the
dynamic of the previous population cohorts. Second, we also consider the impact
of the economic and policy outlook on the evolution of the population of children
in employment, using an econometric model of child labour determinants and a set
of economic growth and policy assumptions.

TOWARDS ENDING CHILD LABOUR IN ZAMBIA | EXECUTIVE SUMMARY 8
Figure 1. Predicted number of children in employment (,000), 7-15 years age group, considering demographic change and economic/policy forecast
Source: UCW calculations based on Zambia Labour Force Survey 2008
Figure 1 shows the projections of child labour both in percentage and in absolute
terms. The percentage of children in child labour will steadily fall from about
35% to 26% over the five-year period. However, due to demographic growth, the
reduction in the absolute number of children working will be more limited, and in
2015 still more than 900,000 children aged 7-15 years are still expected to be
working.
It is worth underlining that these projections are premised on a best-case economic
and policy scenario, and therefore constitute a lower-bound estimate of the likely
target population in child labour.2 In an unfavourable economic and policy
environment, the number of child labourers will be higher over the five-year
period.
We next look at the cost and impact of a specific social protection intervention -
child cash transfers – for addressing the target population in child labour. We
focus on simulating the impact of a conditional child cash transfer (CCT), where
eligibility is conditional on children’s school attendance. We consider eligible,
among poor households, only those in the bottom 20% in income and with
2 We assume that (1) the average income at district level increases by 10% every year; (2) absolute
poverty falls, such that households with income below half of the mean local income in year 0 earn half of the mean local income by year 5; and (3) the teacher/school-aged child ratio increases by 10% every year. This of course reflects an optimistic economic and policy scenario; should, for example, the repercussions of the renewed global financial turmoil impact significantly on Zambia, this scenario is unlikely to be realized.
1191
1,134
917
800
900
1000
1100
1200
1300
2010 2011 2012 2013 2014 2015
num
ber
(a) No. children in employment ('000)
Children in employment considering demographic change only
Children in employment also considering economic and policy forecast
33.7 35.0
25.9
20
22
24
26
28
30
32
34
36
38
2010 2011 2012 2013 2014 2015
perc
ent
(b) % children in employment

TOWARDS ENDING CHILD LABOUR IN ZAMBIA | EXECUTIVE SUMMARY 9
children aged 7-15 years. Each household receives a transfer differentiated by the
number of children living in each household.3 A total of 907,422 children are
targeted in the first year in accordance with these targeting criteria, at a total cost
of $US 80.4 million.
Figure 2 reports the simulated impact of the conditional cash transfer on children
in employment over the five-year period. The CCT scheme would lead to a
predicted further fall in children’s involvement in employment of about three
percentage points (translating to over 100,000 children in absolute terms) over the
target period. These results suggest that a CCT scheme is a potentially useful
policy tool against child labour, but not, in and of itself, sufficient for eliminating
child labour. But it is worth recalling in this context that conditionality in this
simulation did not include children’s absence from employment; adding this
condition would inevitably increase the impact of the scheme, although it would
also raise practical issues of implementation.
Figure 2. Predicted number of children in employment (,000), 7-15 years age group, considering demographic change, economic and policy forecast and impact of CCT
Source: UCW calculations based on Zambia Labour Force Survey 2008
We next look at the costs associated with an additional package of prevention and
withdrawal measures targeting children remaining in child labour even after the
spontaneous reduction and the reduction stemming from the CCT scheme are
taken into consideration. We consider an intervention package consisting of
prevention through formal education and of withdrawal measures through both
formal education and skills training. The intervention package is modelled on the
basis of the ILO Time-Bound Programme Support Project (TBP-SP) and the
TACKLE project in Zambia.
3 The amount of the transfer is differentiated by the number of children living in each household. It
decreases as the number of children per household increases, starting at 50,000 ZMK per child per month for a single child household and falling to 25,000 ZMK per child per month for households with five or more children.
1191
917
1134
813
700
800
900
1000
1100
1200
1300
2010 2011 2012 2013 2014 2015
num
ber
(a) No. children in employment ('000)
Children in employment considering demographic change only
Children in employment also considering economic/policy forecast
Children in employment also considering economic/policy forecast and impact of CCT
33.7
25.9
35.4
23
20
22
24
26
28
30
32
34
36
38
2010 2011 2012 2013 2014 2015
perc
ent
(b) % children in employment

TOWARDS ENDING CHILD LABOUR IN ZAMBIA | EXECUTIVE SUMMARY 10
We consider an implementation scheme involving a gradual three-year phase-in
period during which some children graduate into adulthood untreated. While other
implementation schemes are of course possible, e.g., 100% implementation from
the outset of the program (and therefore no capacity constraints), the gradual
phase-in scheme is deemed most realistic and therefore offers a valid basis for
benchmarking the costs of the core intervention package for child labour
elimination. 4
Figure 3 reports the total numbers of children prevented from entering and
withdrawn from child labour over the five-year period through the intervention
package. In all, some 1.3 million children are treated with either prevention (about
500,000 children) or withdrawal/second chance (some 800,000 children)
measures; efforts peak in year 2012 and diminish gradually thereafter.
Figure 3. Total children prevented and withdrawn from employment through TBP-SP and TACKLE interventions, by programme year (a)
Notes: (a) Phase-in coverage targets are set as follows: year 0 - 40%, year 1 - 60%, and year 2 and beyond - 100%. Source: UCW calculations based on Zambia Labour Force Survey 2008
Per unit cost calculations for the intervention package are based primarily on the
average budgeted costs (both direct and management and administrative costs)
associated with the intervention package when implemented through the TBP-SP
and the TACKLE Project. Annual costs are reported in Figure 4. Costs peak in
2012, when the largest number of children are provided with withdrawal and
second chance interventions. Costs decline thereafter as expanded prevention
coverage reduces the need for withdrawal/second chance interventions (and as
economic growth and other factors contribute to a “spontaneous” decline in the
target population).
4 The costs associated with two alternative implementation schemes are available upon request: the
first involves the withdrawal of all children already in child labour from the outset of the programme, and therefore assumes that there are no capacity constraints; the second involves a gradual phase-in, but does not allow any children to slip through the cracks, even during the initial phase-in period.
57,535 44,210
107,609 107,274 88,785 93,824
91,899
296,153
241,163
126,960
46,398 17,351
0
50,000
100,000
150,000
200,000
250,000
300,000
350,000
400,000
2010 2011 2012 2013 2014 2015
No.
of c
hild
ren
year
Children withdrawn from CL through TBP-SP and TACKLE interventions
Children prevented from entering CL through TBP-SP and TACKLE interventions
TOWARDS ENDING CHILD LABOUR IN ZAMBIA | EXECUTIVE SUMMARY 11
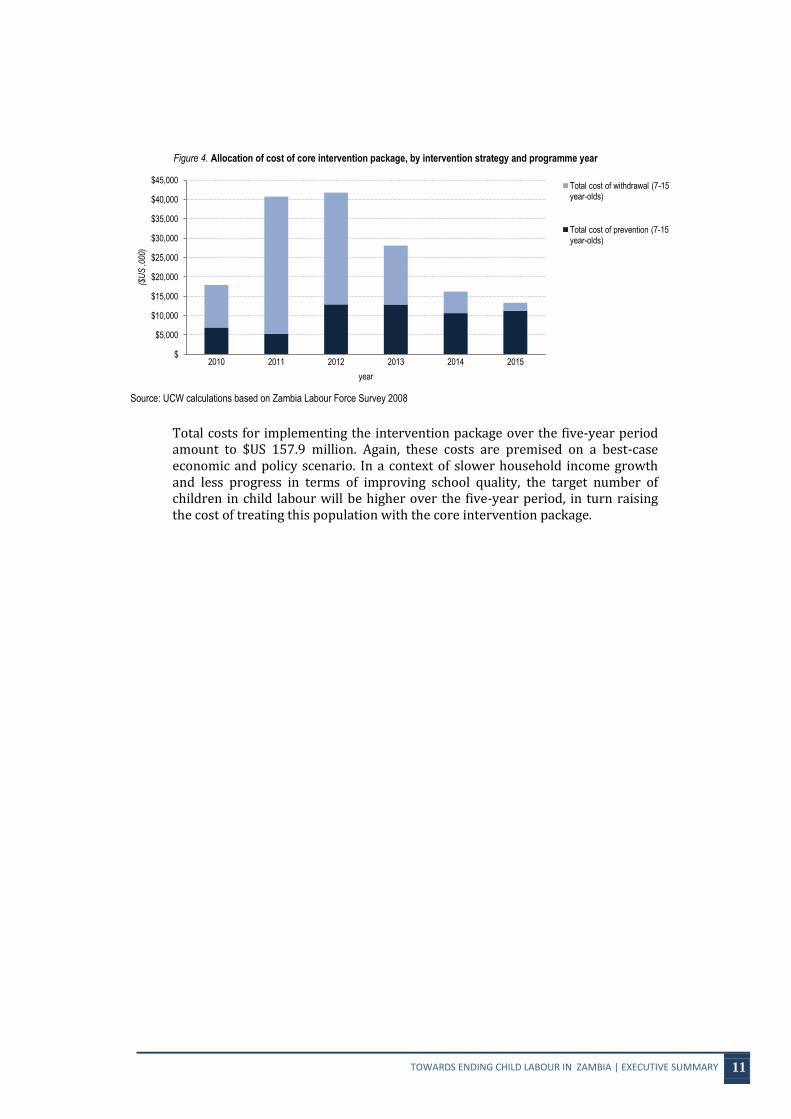
Figure 4. Allocation of cost of core intervention package, by intervention strategy and programme year
Source: UCW calculations based on Zambia Labour Force Survey 2008
Total costs for implementing the intervention package over the five-year period amount to $US 157.9 million. Again, these costs are premised on a best-case economic and policy scenario. In a context of slower household income growth and less progress in terms of improving school quality, the target number of children in child labour will be higher over the five-year period, in turn raising the cost of treating this population with the core intervention package.
$
$5,000
$10,000
$15,000
$20,000
$25,000
$30,000
$35,000
$40,000
$45,000
2010 2011 2012 2013 2014 2015
($U
S ,0
00)
year
Total cost of withdrawal (7-15 year-olds)
Total cost of prevention (7-15 year-olds)

TOWARDS ENDING CHILD LABOUR IN ZAMBIA | Introduction 12
1. INTRODUCTION
1. Zambia has made a number of important legal and political commitments to combating child labour. The Government signed the UN Convention on the
Rights of the Child in 1992, ratified the ILO Convention No. 138 (Minimum Age)
in 1976 and ILO Convention No. 182 (Worst Forms) in 2002. The Employment of
Young Persons and Children (EYPC) Act, which regulates the employment of
young persons and children, was amended in 2004 to bring it in line with these
international legal standards. The country’s Fifth National Development Plan
(2006-2010) and the National Employment and Labour Market Policy (2006) both
call for the elimination of child labour, while the follow-up Sixth National
Development Plan (2011-2015) emphasises elimination of gross human rights
violations such as the worst forms for child labour. The National Child Policy
(NCP) also proposes a number of measures aimed at stopping the child economic
exploitation in Zambia, while the National Child Labour Policy (NCLP) provides
the overarching framework for child labour programmes in the country.
2. Yet despite these important commitments, the challenge posed by child labour
remains very large in Zambia. As detailed further below, although there has been
recent progress in reducing child labour, over one-third of children aged 7-14
years, some 950,000 children in absolute terms, were at work in employment in
the 2008 reference year. Many of these children worked in hazardous conditions,
and experienced greater difficulties than non-working children in attending and
benefiting from school. Child labour not only constitutes a serious violation of the
rights of the children concerned, but also has clear broader consequences for
national social development. Children growing up compromised educationally and
developmentally by early involvement in work will be in a poor position to
contribute to Zambia’s growth as adults.
3. The current Inter-Agency Report provides an overview of the child labour
situation in the country and how it has been changing over time, building on and
updating the results of the comprehensive Country Report on child labour
published in 2009.5 With this overview as background, this Inter-Agency report
then analyses the resource implications of meeting the national commitment to
eliminating child labour. Specifically in this context, the report assesses the
economic costs over a five-year period, from 2010 to 2015, of (1) providing the
poorest of the poor families with a minimum degree of social protection and (2)
providing a package of special, targeted measures aimed at removing and
preventing children from employment.
4. The exercise does not extend to estimating the benefits of child labour
elimination and increased school enrolment, for several reasons. First, the benefits
of both are inherent, and a child’s rights to education and to protection from child
labour are enshrined in international legal standards. Whether or not to act against
child labour, therefore, is not a question requiring a cost-benefit analysis to
answer.
5. But there are also important technical reasons for not addressing the more
narrow economic benefits of child labour elimination. There are two main
potential economic benefits associated with children being in school rather than at
work: first, reduced poverty arising from the greater productive capacity of a more
educated population; and second, reduced poverty arising from the greater
productive capacity of a healthier population. With regards to the first, the extent
to which more human capital will reduce future poverty depends on what happens
5 Government of Zambia and Understanding Children’s Work Programme (2009).Understanding
children’s work in Zambia. Country Report.

TOWARDS ENDING CHILD LABOUR IN ZAMBIA | Introduction 13
to returns to human capital over time, in turn a complex, general equilibrium
question that is not possible to answer with the available data. With regard to the
second potential benefit, there is simply too little information in Zambia
concerning the immediate and long-term health effects of child labour to assess
the health-related economic benefits flowing from child labour elimination.
Panel 1. Child labour terminology and measures used in this report
Child labour is a legal rather than statistical concept, and the international legal standards that define it are therefore the
necessary frame of reference for child labour statistics. The three principal international conventions on child labour – ILO
Convention No. 138 (Minimum Age) (C138), United Nations Convention on the Rights of the Child (CRC), ILO Convention
No. 182 (Worst Forms) (C182) together set the legal boundaries for child labour, and provide the legal basis for national and
international actions against it.
But the translation of these broad legal norms into statistical terms for measurement purposes is by no means straightforward.
The international legal standards contain a number of flexibility clauses left to the discretion of the competent national authority
in consultation (where relevant) with employers’ and workers’ organizations (e.g., minimum ages, scope of application). This
means that there is no single legal definition of child labour across countries, and concomitantly, no single standard statistical
measure of child labour consistent with national legislation across countries.
It should be noted that the concept of child labour in the International legal standards extend up to the age of 17 years. However
data shortcomings in Zambia do not permit the identification for older 15 to 17 year old children.
With this limitation in mind, the current report looks primarily at children in employment below the general minimum working
age of 15 years as a proxy for child labour.
1.
CHILDREN IN
PRODUCTIVE
ACTIVITIES
1.1
Children in
employment
1.2
Children in other
productive activities
Market employmentActivities leading to production of goods and services that are primarily intended for sale or are sold on
the market
Non-market employmentActivities leading to production of goods primarily for own final consumption, including production of
agric. crops and their storage, wood-cutting and firewood collection, hunting, fishing; production of other
primary products such as mining salt, water supply; processing of agric. products; other kinds of
processing such as weaving cloth, tailoring, production of footwear, pottery, utensils other durables, etc.
Also including household activities such as replastering of walls, repairing of roofs, major renovations or
extensions to dwellings
Unpaid household services (household chores)Activities performed by a household member for consumption within their own household, such as
cooking/washing up, indoor cleaning and upkeep of abode, care of textiles, installation, servicing and
repair of personal and household goods, outdoor cleaning and upkeep of surroundings, minor home
improvements, maintenance and repair. Also includes care of family members and procurement of
household goods and services
2.
CHILDREN IN NON-
PRODUCTIVE
ACTIVITIES
Children in productive activities inside SNA production boundary
Children in productive activities outside SNA production boundary
Non-productive activitiesActivities whose performance cannot be delegated to another person with the same desired results
(e.g., education, training, study; leisure and culture; and personal care)
The definition of children in employment in turn derives from the System of National Accounts (SNA) (Rev. 1993), the
conceptual framework that sets the international statistical standards for the measurement of the market economy. It covers
children in all market production and in certain types of non-market production, including production of goods for own use. It
includes forms of work in both the formal and informal sectors, as well as forms of work both inside and outside family settings
(see diagram).
It is worth repeating that this child labour proxy is not necessarily consistent with child labour as defined in legal terms in
individual countries. In accordance with Convention No.138, for example, national authorities may specify temporarily a lower
general minimum age of 14 years. The Convention also states that national laws may permit the work of persons from age 12 or
13 years in “light” work that is not likely to be harmful to their health or development or to prejudice their attendance at school.
Using children in employment as a proxy for child labour may therefore overstate actual child labour in some national contexts
where a provision for light work exists.

TOWARDS ENDING CHILD LABOUR IN ZAMBIA | Introduction 14
6. The remainder of the report is structured as follows. Chapters 2 and 3 review
the macro-economic and policy context in which child labour elimination efforts
take place. Chapter 4 presents a descriptive overview of the nature and extent of
children’s involvement in employment, and how it has changed in recent years.
Chapter 5 assesses the future evolution of the target population of children in
employment under a set of economic and policy assumptions. Chapter 6 assesses
the resource implications of policy options for addressing child labour. The
chapter first simulates the cost and impact of providing one element of a needed
comprehensive social protection strategy - child cash transfers. It then estimates
the costs associated with a package of targeted interventions aimed at preventing
and withdrawing children from employment. Chapter 7 concludes.

TOWARDS ENDING CHILD LABOUR IN ZAMBIA | Country context 15
2. COUNTRY CONTEXT
7. Zambia is a landlocked country surrounded by eight neighbouring countries
(Congo DR, Tanzania, Malawi, Mozambique, Zimbabwe, Botswana, Namibia and
Angola). The country’s land surface area of 752,614 square kilometres is made up
of three main topographic features: a mountainous range, high plateau and low
valley areas. Zambia and Zimbabwe to the south share a man-made lake at Kariba
which was built to generate hydro-electric power. Along the border area with
Congo DR to the north lies a long mineral rich stretch especially of copper, cobalt
and emeralds called the Copperbelt. The country’s vegetation is mainly savannah
with areas of tropical grassland and woodland consisting of a variety of grass and
tree species. Several seasonal flood areas exist in flat swampy and marshy plains
such as the Kafue flats, the Bangweulu and Lukanga swamps.
8. Improved economic management has contributed to economic growth at an
annual average rate of over five percent since 20006
- the best sustained
performance in several decades. The economy proved resilient to the series of
shocks that hit the country in 2008, namely the sharp rise in food prices, the hike
in fuel prices and the deep global recession.7 Provided that sound economic
management is maintained, growth is expected to remain strong over the medium
term. In March 2005, Zambia was evaluated as having reached the completion
point under the enhanced Heavily Indebted Poor Countries (HIPC) Initiative,
triggering an external debt cancellation of $3.9 billion over a period extending to
2023. Zambia is also expected to be eligible for additional multilateral debt relief
as a result of having reached HIPC Completion. Considering that during most of
the 1990s interest payments on foreign debt service were higher than public
spending on human development, debt relief will have a potentially far-reaching
impact on the country’s development prospects. The World Bank reclassified
Zambia as a middle income country in 2011, reporting that foreign aid-driven
interventions and surging prices of copper in the last few decades resulted in the
upward adjustment in Zambia’s income growth.
9. Zambians on average have better access to health, education, and safe water
than many of their neighbours, but the country’s development challenges are
nonetheless daunting. Poverty is widespread (see paragraph 10 below), aggravated
by rapid population growth. At the same time, the income divide between urban
and rural areas remains large, and migration from rural areas to the cities is
increasing. Zambia’s life expectancy remains very low at 51 years. 8
This is
partially explained by the high prevalence of HIV (the HIV infection rate is 14%9)
combined with overall poor health indicators. Twelve percent of children die
before their fifth birthday and 15 percent of young children are underweight.10
Forty percent of the population live without sustainable access to an improved
water source and 36 percent without access to improved sanitation facilities.11
Zambia ranks 164th out of 187 countries on the United Nations Human
6 World Bank, World Development Indicators 2000-2010.
7 Government of Zambia, Zambia Millennium Development Goals Progress Report 2011, Ministry of
Finance and National Planning, Lusaka, Zambia. 8 Central Statistical Office, Zambia (2010). “2010 Census of Population and Housing Preliminary
Report”, CSO, Lusaka, Zambia 9 Government of Zambia, Zambia Millennium Development Goals Progress Report 2011, Ministry of
Finance and National Planning, Lusaka, Zambia. 10
Government of Zambia, Zambia Millennium Development Goals Progress Report 2011, Ministry of Finance and National Planning, Lusaka, Zambia. 11
Government of Zambia, Zambia Millennium Development Goals Progress Report 2011, Ministry of Finance and National Planning, Lusaka, Zambia.

TOWARDS ENDING CHILD LABOUR IN ZAMBIA | Country context 16
Development Index .12
While the country has made progress towards achieving
some of the Millennium Development Goals, attaining many of the specific targets
will be difficult (Table 1).
12
UNDP, 2011 (http://hdrstats.undp.org/en/countries/profiles/ZMB.html).
Table 1. Zambia and the Millennium Development Goals: an overview
Goal Indicator Latest Figure
2015 target
Will Target be Achieved under the Present Trend?
MDG 1: Eradicate Extreme Poverty and Hunger
Proportion of polulation in extreme poverty (%) 51 29 Significant reforms and
investments needed
Poverty Gap Rate (%) 34 31.1 Yes
Prevalence of underweight children U-5 (%) 14.6 12.5 Acceleration required
MDG 2: achieve universal Primary education
Primary school net enrolment rate (%) 102* 100 Yes
Pupils reaching Grade 7 (%) 91.7 100 Acceleration required
Literacy rates: 15-24 year olds (%
70 100 Acceleration required
MDG 3: Promote Gender equality
Ratio of girls to boys in primary education 0.96 1 Yes
Ratio of girls to boys in secondary education 0.88 1 Acceleration required
Ratio of girls to boys in tertiary education 0.74 1 Acceleration required
Ratio of literate women to men 15-24 years old 0.8 1 Acceleration required
Share of women in wage employment (%) 0.34 - -
Proportion of seats held by women in parliament (%) 14 30 Significant reforms and
investments needed
MDG 4: Reduce Child Mortality
U-5 mortality rate (deaths per 1,000 live births) 119 63.6 Acceleration required
Infant mortality rate (deaths per 1,000 live births) 70 35.7 Acceleration required
One-year olds immunized against measles (%)
84.9 100 Acceleration required
MDG 5: improve Maternal Health
Maternal mortality ratio per 100,000 live births 591.2 162.3 Significant reforms and
investments needed
Births attended by skilled personnel (%) 46.5 - -
Contraceptive prevalence rate (%
24.6 - -
MDG 6: Combat Hiv/aiDS, Malaria and other Major Disease
HIV prevalence rate (%) 14.3 <15.6 Yes
Proportion of population (15-24 years) with comprehensive, correct knowledge of HIV/AIDS (%)
48 - -
Ratio of school attendance of orphans to non-orphans (10-24 years) (%)
97 100 Yes
Proportion of population with advanced HIV infection with access to ARV
79 80 Yes
New malaria cases per 1,000 population
252 ≤255 Acceleration required
Malaria fatality rate per 1,000 population 39 11 Acceleration required
Households with ITNs (%) 64.3 - -
MDG 7: ensure environmental Sustainability
Land covered by forests (%) 45 - -
Land protected to maintain biological diversity (%) 41 - -
Carbon dioxide emissions (MT per capita) 0.22 - -
Proportion of population using solid fuels (%) 83.8 - -
Proportion of population without access to an improved drinking water source (%)
40 25.5 Acceleration required
Proportion of population without access to improved sanitation facilities (%)
36.1 13 Significant reforms and
investments needed
MDG 8: Develop a Global
Overseas development assistance (US$ m) 918.6 - -
Access to markets in developed countries - - -

TOWARDS ENDING CHILD LABOUR IN ZAMBIA | Country context 17
10. The latest evidence points to continued progress in reducing poverty in
Zambia, but poverty levels remain very high. According to the 2006 Living
Conditions Monitoring Survey (LCMS V), almost 64 percent of the population
lived below the “moderate” poverty line (i.e., unable to meeting the monthly cost
of all basic needs) and 51 percent lived below the “extreme” poverty line (i.e.,
unable to meet the cost of the monthly food basket) during the 2006 reference
year. The comparable levels in 1998 were 73 percent and 58 percent, respectively.
Poverty is increasingly a rural rather than urban phenomenon: in 2006, 80 percent
of rural residents lived below the moderate poverty line against only 34 percent of
urban residents.
11. Zambia is one of the countries worst-affected by the HIV/AIDS pandemic. An
estimated 14 percent of the population is HIV-positive, severely compromising the
country’s social and economic development prospects. A large proportion of
Zambian children must grow up in the absence of one or both birth parents. In all,
1.3 million children aged 0-17 years are orphans, of which some 690,000 are
orphans as a result of AIDS.13
Child labour is linked with the country’s
HIV/AIDS crisis. Many children orphaned by the disease must perform some form
of work to support themselves and/or their families, interfering with or precluding
schooling. The worst off are forced onto the street, where they become involved in
prostitution or other harmful and exploitative forms of work.
13
UNICEF 2009 (http://www.unicef.org/infobycountry/zambia_statistics.html).
Partnership for Development
Foreign direct investment (US$ m) 699.15 - -
Fixed telephone lines per 1,000 people 7 - -
Cellular subscribers per 1,000 people 322.8 - -
* NER cannot exceed 100%; however, it is based on demographic data, which does not include factors such as migration within Zambia.
Source: Zambia Millennium Development Goals Progress Report 2011, Ministry of Finance and National Planning, Lusaka, Zambia.

TOWARDS ENDING CHILD LABOUR IN ZAMBIA | Country context 18
3. NATIONAL RESPONSE TO CHILD LABOUR: AN OVERVIEW OF POLICY AND PROGRAMMES
12. This section outlines the strategic approach to child labour and the various
programmes and policies in place for eliminating child labour by 2016. For the
purpose of this report, programmes and policies are grouped in the following
categories: (i) those directly addressing child labour; (ii) education; (iii) social
protection; (iv) advocacy and awareness-raising. The legislative framework is not
addressed in the section, as it is discussed in the inter-agency report
Understanding Children’s Work in Zambia (2009).14
3.1 Policies and programmes directly addressing child labour
13. A National Child Policy (NCP) provides core guidelines for improving the
welfare and quality of life of children, as well as for protecting their survival and
developmental rights.15
The NCP aims to consolidate all existing and proposed
legislation pertaining to children into one easily accessible and comprehensive
statute, and also to update laws to incorporate the provisions of UN Convention on
the Rights of the Child. The NCP proposes a number of specific measures aimed
at stopping the child economic exploitation and child labour in Zambia in the
sphere of both prevention and protection.
14. In the specific context of child labour, a National Child Labour Policy (NCLP)
was adopted in 2010 and officially launched in 2011. Both District Child Labour
Committees and Community Child Labour Committees are in place to facilitate
implementation. The NCLP stems from the Government’s recognition that child
labour is harmful to the development of the child and has long term consequences
on the cultural, economic, social and political development of the country. It is the
product of extensive consultations and follows a multidimensional approach in the
fight against child labour.16
15. The NCLP recognizes education as the key to reducing children’s premature
entry into the labour market and contains a number of policy objectives relating to
improving the education system and children’s access to it.17
The NCLP
highlights the vulnerability of parents/guardians and the HIV and AIDS pandemic
as main determinants of child labour, and states the Government’s responsibility
(through the Ministry of Labour and Social Security) to empower vulnerable
parents/guardians through various social safety nets to enhance their ability to
support their children. The importance of awareness raising, sensitization, law
enforcement, and an improved labour inspection system is also stressed in the
NCLP.
16. Recognizing the need for filling the gap between Zambia’s international
obligations and national action, the Ministry of Labour and Social Security 14
UCW (2009). Understanding Children’s Work In Zambia. UCW Country Studies Series. 15
Initial Report to the Committee on the Rights of the Child, CRC/C/11/Add.25: para. 38 16
Consultations were undertaken by the Government with the Zambia Congress of Trade Unions (ZCTU), Zambia Federation of Employers (ZFE), the Federation of Free Trade Unions of Zambia faith based organizations (FBOs), non govermental organizations (NGOs) and concerned government ministries. 17
NCLP policy objectives relating to the education system include: ensuring free education for all children till completion of secondary school; ensuring free education to victims of child labour; developing a school system for reintegration of child labourers into the school system; supporting increased funding to the education sector; encouraging increased support to community schools; ensuring increased number of primary, basic and high schools to match the population growth; promoting a lower teacher-pupil ration by recruiting more teaching staff at all levels of education; formulating an appropriate policy on education of orphans and the vulnerable children which will increase their accessibility to such institutions; and reducing inequalities between the boy and girl child at all levels of education.

TOWARDS ENDING CHILD LABOUR IN ZAMBIA | Country context 19
developed the National Action Plan for the Elimination of the Worst Forms of
Child Labour (NAP) in 2009, which was validated in January 2010 and officially
launched in November 2011.18
The NAP recognizes the complex nature of child
labour. Indeed, its first guiding principle is that all activities in the NAP should be
imbedded and fully integrated into the national development process. This means
that all NAP activities are to be coordinated and linked with the National
Development Plan (NDP) and the various sectoral policies and programmes
approved by the Government (including the National Child Labour Policy,
Education Policy, the Health Policy for Disability, the National Gender policy,
National Child Policy, the National Agricultural Policy, and the Decentralization
Policy).
17. The NAP envisages the active involvement of government structures,
international organizations, NGOs, community-based organizations, faith-based
organizations, donors, the private sectors and media organizations. The NAP
identifies five strategic priorities to eliminate the WFCL: improved enforcement
of existing laws and policies on child labour and lobbying for review of such laws
where necessary; young persons (16-18 years) protected from hazardous forms of
child labour; strengthening the institutional and technical capacities, including
coordination and coalition building and monitoring and evaluation; awareness
raising on child labour issues; establishing of monitoring and evaluation systems
and maintenance of continuous flow of baseline information; and enhanced
prevention, withdrawal and social reintegration system.19
18. The ILO has implemented two projects towards the elimination of child labour
under Pillar III of its Zambia Decent Work Country Programme (Z-DWCP):20
the
first is the Time-Bound Programme Support Project (TBP-SP) funded by the US
Department of Labour (USDOL); the second is the Tackling Child Labour through
Education and Training (TACKLE) project funded by the European Union.
19. The Time-Bound Programme Support Project, which ran from 2006 to March
2010, was designed to support national partners in establishing and begin
implementation of the National Action Plan for the Elimination of the Worst
Forms of Child Labour (NAP). The project supported the strengthening of the
knowledge base on child labour, awareness raising activities, capacity
strengthening and mainstreaming child labour interventions into national and local
policies and programmes, and direct support to children and families at risk of or
in child labour.
20. The TACKLE project aims to contribute to poverty reduction by providing
equitable access to basic education and skills development to some of the most
disadvantaged segments of society. The project aims to strengthen the capacity of
national and local authorities in the formulation, implementation and enforcement
of policies to fight child labour in coordination with social partners and civil
society. Among its strategies is the strengthening of capacity among national
18
Ministry of Labour and Social Security (MLSS), National Action Plan for the Elimination of the Worst Forms of Child Labour 2010-2015, January 2010 19
Similarly, the National Plan of Action (NPA) for Children in Zambia for 2009-2010 by the Ministry of Sport, Youth and Child Development develops clear actions to be taken for the survival, growth, promotion, protection and development of the child. Six strategic priorities are outlined in the NPA: strengthening and support the capacity of families to protect and care for children; mobilize and strengthen community-based and government responses for the care, support and protection of children; ensure that the legislation, policy, strategies and programmes are in place to protect all children including the most vulnerable children; ensure access for all children including OVC to basic essential services; raise awareness and advocacy to create supportive environment for children; and engage the multi-sectoral community to play an active role in supporting the survival, protection and development of children. 20
The Zambia Decent Work Programme, revised in 2009, identifies three priorities for Zambia: i) job creation for women, young people and people with disabilities; ii) prevention and mitigation of HIV/AIDS in the world of work, and iii) elimination of child labour, particularly in its worst forms.

TOWARDS ENDING CHILD LABOUR IN ZAMBIA | Country context 20
partners to provide quality education and training to all children to prevent their
premature entry into work. Through its mandate, the TACKLE project partners
with Ministry of Labour and Social Security and the Ministry of Education. The
implementation of TACKLE started in 2008 and will run until 2012. The project is
engaged in both upstream work related to the policy and legal framework and
institutional capacity strengthening, and downstream work related to targeted
interventions, networking, advocacy, sensitization and enhanced information
sharing.
3.2 Education
21. Child labour and children’s education are closely linked. Evidence presented
in the inter-agency Understanding Children’s Work report (2009) shows that
school-related factors are particularly important in explaining the parents’
decisions to keep children from school. High schooling costs, lack of interest or
approval of schooling and long distance from school were cited by more than one
in three adult respondents in explaining why their children were absent from
school (UCW, 2009).
Panel 2. Education system in Zambia
The formal education system in Zambia is a 9-3-4+ structure (nine years of basic, three of high school and four years plus of university education). Zambia’s education system consists of a multi structure comprising pre schooling, basic, secondary and tertiary levels.
Historically, primary and secondary education was offered in separate institutions, but this changed with the development of basic schools, which provide the first nine years of schooling. This in itself has posed a challenge in that many pupils that make it to grade 9 have to be moved from the so called upper basic to high schools which offer Grades 10 to 12. However, following a recent directive, Zambia is now in the process of reverting back to the primary and secondary school structure.
Community schools play a central role in the Zambian education system: these schools are founded by communities to meet the basic education needs of those children who are not in formal schools. (see Annex I).
22. The Government of Zambia’s national policy on education, Educating Our
Future, was published in 1996 and focuses primarily on decentralization,
partnership, equity, efficiency, quality, democratization and effectiveness.21
Under
this policy, the Government aims to have every child access nine years basic
education by 2015. In 1997, the Government adopted the Education Sector
Investment Plan (ESIP). On this basis, the Government developed plans for two
subsectors, the Basic Education Sub-Sector Investment Plan (BESSIP, Ministry of
Education) and the Technical Education and Vocational and Entrepreneurship
Training plan (TEVET, Ministry of Science, Technology and Vocational
Training). A Free Basic Education policy (Grades 1-7) was announced in
February 2002 by the President of Zambia. The policy abolishes all user fees
while uniforms are no longer compulsory.
23. In the context of the above, the policy thrust of the Fifth National
Development Plan (2006-2010) operationalised by the education sector through
the National Implementation Framework was to contribute to the provision of
accessible quality and equitable education at all levels of the system. The Ministry
of Education integrated many project-based interventions directly into the Fifth
National Development Plan and in its annual work plan and budget. These project-
based activities are usually supported by key cooperating partners, but also include
21
The World Conference on Education for All in 1990 in Jomtien gave impetus to the education sector, although it took almost ten years before the plans were turned into concrete action. Indeed, as a result of the economic situation, the previous document by the MoE, Focus on Learning (1992), failed to mobilise resources needed to develop the formal education in schools.

TOWARDS ENDING CHILD LABOUR IN ZAMBIA | Country context 21
local and international NGOs. Projects collaborate with the Ministry by adhering
to sound operating principles for projects. The above has been carried on into the
development of the follow up Implementation Framework for the Sixth National
Development Plan.
Panel 3. Education and Vision 2030: Innovative and productive life-long education and training accessible to all by 2030
The policy of the Government for the education sector can be summarized as follows
The Government shall facilitate equitable access to education at all levels;
The Government is committed to delivery of quality and relevant education, which enhances knowledge skills, attitude, values and lifelong learning;
It is Government policy to improve policy formulation, planning and information management environment. Complementary to this is the provision of a sufficient, skilled and motivated human resource to manage the education system.
In its pursuit for quality in educational services delivery, the Government shall support an adequately-financed, professionally managed, accountable and cost effective decentralised education delivery system.
The Government shall support an education system that counters the HIV and AIDS pandemic and will continue to mitigate its adverse impact on education delivery, with particular attention paid to the needs of orphans.
Functional literacy education shall be promoted through non-formal education.
Effective partnerships with other stakeholders in educational services provision shall be developed, focusing on Faith-based Organizations and other religious bodies, the private sector, NGOs, community-based organizations, traditional leadership, Cooperating Partners/donors, and individuals.
The Government of Zambia target to 2030 are the following:
Put in place a comprehensive and diversified curricula that is responsive to the social and economic needs of the individual and the community by 2030;
Increase the literacy rates to 80% by 2015 and work towards eliminating illiteracy by 2030;
Increase Net Enrolment Rates to 96% by 2010 and to 99% by 2030 at basic school level (Grade 1-9);
Improve pupil/teacher ratio to 40:1 at basic school and 25:1 at High school by 2030;
Improve the pupil/text book ratio at basic school to 1:1 in all subjects by 2030 and 1:3 in all subjects at High School by 2030;
Reduce the average distance to basic schools to 5 km radius to 75% of the potential learners by 2030; and
Increase university and skills training output by 2% per annum, and increase equity of access while maintaining internationally recognised and locally validated standards of quality.
Source: Ministry of Education, National Implementation Framework 2008-2009, Lusaka, 2007
24. The Basic Education Sub-Sector Investment Plan (BESSIP) addressed the
issues of access and quality improvement at the basic education level. Strategies
and plans for BESSIP were developed over a three year period and then extended
until 2006. BESSIP sought to improve access to education through: constructing
new schools; reducing school cost for parents by providing grants to schools;
enrolling children who had dropped out or had never gone to school, and offering
more bursaries to vulnerable children. At the same time, the quality of education
was to be improved through: providing textbooks; more focused and decentralized
training; implementing a national assessment of the education system; revising the
basic school curriculum; and teaching initial literacy through familiar languages.
25. A Primary Reading Programme was set up in 1998 in order to enhance reading
and writing skills at the lower grades (grades 1-4) and middle (grades 5-7) basic
education levels. From its beginning in 1998 in 25 schools it was subsequently
expanded to cover the entire country. The progamme has become a key route to
literacy for all pupils from Grade 1 to Grade 7 in government and community
schools. The programme’s main purpose was to improve pupils’ literacy through

TOWARDS ENDING CHILD LABOUR IN ZAMBIA | Country context 22
the use of local languages: children in the first classes start to learn to read and
write in one of the seven main Zambian languages before moving to English.
26. A Free Primary Education (FPE) policy was announced and immediately
introduced in February 2002. Guidelines mandating the elimination of fees for
grades 1 to 7 were prepared by the Ministry of Education (MOE) and circulated to
schools. Studies suggest that the policy has had an important impact on enrolment
among disadvantaged groups.22
The Programme for the Advancement of Girls
Education and a re-entry policy for pregnant girls improved access to education
for girls, while the bursary schemes and the School Health and Nutrition
Programme improved access for the poor (Mwansa et. al. 2004).
3.3 Social protection
27. The empirical results cited in the inter-agency Understanding Children’s Work report (2009) indicated that children’s work frequently forms part of a household’s strategy for dealing with risk, making them less vulnerable to losses of income arising from individual or collective shocks. The Government recognises that reducing household vulnerability by expanding social protection is a critical priority in the country. In this context, the Sixth National Development Plan (SNDP 2011-2015) focuses on effectively coordinating and providing social protection through empowering low capacity households, providing social assistance to incapacitated households and supporting various vulnerable groups. The key objectives, strategies and programmes for the social protection sector during the SNDP period are summarised in Table 2 below. A more comprehensive list of Zambia social protection schemes is reported in the Annex 1.
Table 2. Social protection sector: Objectives, strategies and programmes during SNDP period
Objectives Strategies Programmes
1. Empower low capacity households (LCHs).
a) Provide access to finance, agricultural inputs and training to vulnerable groups; and b) Expand social security coverage to formal and informal sectors.
Empowerment of low capacity households
2. Provide social assistance to incapacitated households.
a) Provide regular, predictable transfers to the chronically poor to support basic needs and human development; and b) Provide discrete transfers in response to shocks to people at risk of rapid deterioration in economic and social wellbeing and security;
Social assistance to incapacitated households
3. To provide care and support to vulnerable children and youth.
a) Provide places of safety, vocational and life skills training to vulnerable children and youth; and b) Support school attendance of vulnerable children and youth‟.
Support for vulnerable children and youth
4. To ensure the protection of human rights and provision of services to vulnerable groups
a) Establish one stop centres and places of safety in all the Provincial centers; and b) Provide empowerment for survivors of violence & human trafficking through the provision of livelihood services.
Enhancement of access to justice for vulnerable groups
Source: Republic of Zambia, Sixth National Development Plan 2011-2015: Sustained Economic Growth and Poverty Reduction. January 2011.
Transfer schemes
28. The National Pension Scheme Authority (NAPSA) was established in 1996 and
became operational in 2000. It is a compulsory scheme that covers regularly
employed persons in the private, para-statal sectors and all employees who joined
the public Service and Local Authorities on or after 1 February 2000.23
NAPSA
was the largest pension scheme in Zambia with about 355,200 members at the end
of 2005. The minimum entry age into the scheme is 16 years and the worker needs
to be employed by a registered contributing employer. To qualify for retirement
22
Mwansa et al. (2004) 23
For a comprehensive list of members and exemptions, see ILO 2008

TOWARDS ENDING CHILD LABOUR IN ZAMBIA | Country context 23
benefits the member must have reached the retirement age (55 years) or five years
prior to retirement age but must have contributed to the scheme for a minimum
period specified by the Authority. The minimum pension is set at 20% of national
average earning which is determined by the Authority annually using the data
from Central Statistical Office.
29. The largest school feeding programme (SFP) currently operating began in
mid-2003 and is funded by the World Food Programme.24
The SFP seeks to
address the nutritional needs of children from poor households in food-insecure
areas while improving enrolment and attendance rates as well as children’s
performance at school. Targeted at orphans and other vulnerable children, it
combines the provision of on-site meals in primary schools with take-home rations
provided to children, particularly girls, from vulnerable households who are
otherwise unlikely to attend school. An additional component of the SFP consists
of monthly HIV and AIDS sensitization sessions conducted in the schools. In
addition to nutritional support, the programme facilitates basic health services for
school children such as de-worming and promotes the cultivation of school
gardens as a means of generating income for schools. In 2006 the SFP covered
526 community schools in 11 districts in four provinces. Around 140,000 children
benefited from on-site school feeding and close to 35,000 households from take-
home ration.
30. Implemented alongside the government policy of free primary education,
school feeding is said to have a generally positive impact on child education
through stabilized attendance rates at primary schools and improved academic
performance among child beneficiaries. At the same time, the take-home ration
provides a significant form of food and income support for the most vulnerable
household. However, the school feeding programme has been highlighted to be
too expensive, inefficient and donor dependent. There are also concerns relating to
its effectiveness, with increased primary-school enrolment rates attributed more to
the increase in the number of community schools rather than to programme
incentives. Food quality is another area of concern (ILO, 2008). However, more
systematic evaluations are needed before any concrete conclusions about the
effectiveness of school feeding can be drawn.
31. The Food Security Pack (FSP) is a country-wide public programme providing
basic agricultural inputs, technology transfers and training to vulnerable small-
scale farming households in the form of a low-interest loan. Established in 2000, it
is operated by Programme Against Malnutrition (PAM) and is targeted at small
agricultural households that face food insecurity as a result of endemic poverty
and/or insufficient seasonal rainfall. Every year 200,000 households are targeted at
community level by committees consisting of central and local government
officials, NGOs and local leaders. Each beneficiary household is entitled to a food
security pack consisting of basic agricultural inputs (seeds), training in
conservation farming and food-processing, technology transfers and marketing
assistance provided seasonally over a two-year period, with the average annual
benefit package valued at around USD 38 per household. Following the harvest,
beneficiaries are required to pay back a portion of their production (between 10
and 20% of the value of inputs provided) which is allocated to communal seed
reserves.
32. Out of the 300,000 households that benefited from the programme until 2006,
10% graduated, becoming self-sufficient in food production and able to gain
access independently to commercial agricultural services. At the same time, 70%
24
There have been a number of government-sponsored school-feeding programmes in Zambia since the 1970s.

TOWARDS ENDING CHILD LABOUR IN ZAMBIA | Country context 24
of the loans were reported as having been recovered from households having
graduated, with repayments used to support additional beneficiaries.
33. The FSP has led to some significant gains in food production at both
household and national level. At household level, those receiving the pack have
witnessed increased crop yields, leading to improved nutrition and additional
income from the sale of excess produce. Such households have therefore been able
to escape the worst forms of poverty and in some instances even invest in human
development. The programme has also contributed to greater food security at the
national level, stabilizing crop yields in poor-performing agricultural areas and
reducing the need for emergency assistance following adverse seasonal rains.
Rural areas have benefited from the growth of local markets, while urban areas
face a potential fall in food prices. Overall, the investment in national food
production represented by the programme has achieved annual returns of between
200 and 300%. However, a number of barriers have arisen and the programme is
suffering from poor and erratic funding. Moreover, external factors such as
unpredictable rains, a lack of interest in farming among some beneficiaries, and
confusion about the aims of government assistance among some communities
have also contributed to the relatively low graduation rates achieved by the
programme (ILO, 2008).
34. The Public Welfare Assistance Scheme (PWAS) reaches out to over 100,000
beneficiaries providing a range of benefits linked to better nutrition and health,
income support, child protection, education and occupational training. PWAS will
soon include elements of cash transfers. Established in the 1950s to provide
support to Zambian war veterans, PWAS was redesigned in the second half of the
1990s to decentralize its operation and include elements of community decision
making in welfare assistance.
35. PWAS aims to help the poorest and most vulnerable households throughout
the country to meet their basic needs. Targeted groups include: households where
the head is elderly, chronically ill, a disabled woman or a child; households with
no productive assets, relatives to provide assistance or adults capable of working;
victims of natural disasters, people with poor-quality housing, orphans and
children not at school, including street children. Assistance to a value of USD 2-
20 annually is provided in health, education and social support.
36. PWAS covers 6,500 communities, with 166,559 individuals receiving benefits
in 2006. However, the programme is operating below the target of 200,000
beneficiaries per year.
37. Since its last restructuring in 2000, the scheme received mixed reviews. On the
one hand, the identification of needy individuals and disbursement of benefits at
community level are considered innovative, cost efficient and empowering way of
delivering social assistance to the needy. On the other hand, the scheme is reported
to suffer from weak administrative capacity and from lack of funds. The
community-based targeting mechanism is also reported to be susceptible to
manipulation and not sustainable in the long run as the activities are carried out by
volunteers from the Community Welfare Assistance Committees (CWACs). (ILO,
2008)
38. A group of social cash transfer schemes are financed by international donors
and implemented under PWAS structures in a few districts of the country.
Implementation of pilot schemes started in 2003 as a pilot scheme in Kalomo
District of Southern Province, followed by one in Kazungula (2005), in Chipata
(2006) and in Monze and Katete (2007). In 2009 a decision was taken to rollout a
national social cash transfer scheme (SCTS) to cover the whole country by 2012.25
25
Dennis Kaputo Chiwele, Assessing Administrative Capacity and Costs of Cash Transfer Schemes in Zambia, International Policy Centre for Inclusive Growth, Country Study, February 2010

TOWARDS ENDING CHILD LABOUR IN ZAMBIA | Country context 25
These schemes pay out modest monthly cash benefits reaching close to 70,000
households. They have been implemented with some variation so that they
generate information on the feasibility, costs and benefits and negative impacts.
Public works
39. In the case of public works the objectives are usually two-fold: to provide
seasonal safety nets to address cyclical poverty and vulnerability at times of need
by offering employment; and to create community assets that are beneficial for
productive activities (ODI , 2008).
40. The Project Urban Self-Help (PUSH) is a government funded public works
programme that originated in the early 1990s. PUSH is a peri-urban self-
programme to develop urban infrastructure and mitigate the negative effects of
economic reform. In principle, linking income and consumption support to the
development of infrastructure combines protection and promotion. In practice,
however, the programme prioritises food transfers to areas affected by natural
disasters where vulnerability is acute and infrastructure development has remained
a secondary objective.
41. Beneficiaries were typically the extreme poor, whose family members had lost
jobs as a result of economic reform or were victims of natural disasters, such as
drought and floods, or were women and orphans. Beneficiaries of PUSH took part
in public-works projects aiming at the upgrading of infrastructure and public
services, in exchange for which they received food and other in-kind benefits such
as clothing and shelter. Although the in-kind benefits were assessed as below the
minimum formal sector wage, demand for participation has been consistently high
and has frequently outstripped the number of available places. Major reported
outputs in 2006 included the construction of 540 water wells in the Western
Province, two community markets in North-Western Province and three
community schools in Eastern Province. Nevertheless, monitoring of the
programme has also revealed that in several cases infrastructure improvements
were of poor quality, while the skills obtained by participants were put to little use
owing to poor macroeconomic conditions and a lack of access to capital (ILO,
2008)
42. There are many smaller, shorter-term public works programmes implemented
by NGOs. One example is CARE’s agricultural inputs-for-assets (AICA)
programme. In most cases, the primary objective is protection rather than
promotion and most programmes are short-term and part of a humanitarian
response (ODI, 2008)

TOWARDS ENDING CHILD LABOUR IN ZAMBIA | Children’s involvement in employment 26
4. CHILDREN’S INVOLVEMENT IN EMPLOYMENT
43. This section provides an overview of results from Zambia Labour Force
Survey conducted in 2008 (LFS 2008). It reports descriptive data from LFS 2008
on the extent and nature of children’s work in Zambia, disaggregated by child age,
sex and residence, and on how children’s involvement in work has been changing
over time.
4.1 Extent of children’s involvement in employment
44. Child involvement in employment26
remains very high in Zambia. More than
one out of every three children aged 7-14 years, some 950,000 children in absolute
terms, are at work in employment. About 28% of children under the age of 13
years are at work in employment, the absolute minimum age specified for light
work in the amended Employment of Young Persons and Children (EYPC) Act of
2004.27
A comparison with survey results from 2005, however, points to important
progress in reducing child labour. An estimated 48% of 7-14 year-olds, 1.2 million
children in absolute terms, were in employment in 2005. Trends in children’s
employment are discussed further in Section 4.3 of this report.
45. Most children at work in employment also attend school. Indeed, 81%
working children are also in school. This figure, however, should not be
interpreted as evidence that work and schooling are compatible. Indeed, evidence
presented in the inter-agency Understanding Children’s Work report (UCW, 2009)
indicated that work involvement is associated with higher levels of repetition,
slower grade progression and reduced school life expectancy, suggesting that
working students are disadvantaged in the classroom.
Figure 5. Distribution of children by activity category, 7-14 years and 15-17 years age groups
(a) 7-14 year-olds (b) 15-17 year-olds
Source: UCW calculations based on Zambia Labour Force Survey, 2008
46. Another way of viewing children’s involvement in work and schooling is by
disaggregating the child population into four non-overlapping activity groups –
26
In line with the definition of children in employment adopted by the 18th International Conference of Labour Statisticians, the threshold for classifying a person as employed is to have been engaged at least one hour in any activity during the reference period relating to the production of goods and services set by the 1993 UN System of National Accounts. Children seeking work are thus excluded. Employment covers all market production and certain nonmarket production, including production of goods for own use. It excludes unpaid household services (commonly called “household chores”)—that is, the production of domestic and personal services by household members for own-household consumption. 27
Zambia specified a general minimum working age of 15 years. The lower age limit of 13 years refers only to “light” work that (i) is not hazardous to their health and psychological development and (ii) will not affect their school attendance.
Economic activity
exclusively 7%
School exclusively
51%
Both activities
28%
Neither activity 14%
Economic activity
exclusively 21%
School exclusively
39%
Both activities
33% Neither activity
7%

TOWARDS ENDING CHILD LABOUR IN ZAMBIA | Children’s involvement in employment 27
children only engaged in employment, children only attending school, children
combining school and employment and children doing neither (Figure 5). This
disaggregation shows that 28% of all 7-14 year-olds work and attend school at the
same time, while only six percent work in employment without also going to
school. A further 51% of all children aged 7-14 attends school exclusively, while
the remaining 14% of 7-14 year-olds is “inactive”, i.e., not involved in
employment or in schooling. Activity patterns differ somewhat for older, 15-17
year-old children: a greater share is in employment exclusively and a smaller share
is in school exclusively or is inactive compared to the 7-14 years age group.
Table 3. Child activity status, by age group and sex, 2008
Activity status
Children aged 7-14 years Children aged 15-17 years
Male Female Total Male Female Total
No. % No. % No. % No. % No. % No. %
Employment exclusively 92233 6.7 84549 6.1 176782 6.4 100264 20.3 102792 22.4 203056 21.3
School exclusively 695813 50.3 725501 52.6 1421314 51.4 194787 39.4 177612 38.7 372399 39.1
Both activities 398643 28.8 376276 27.3 774919 28.0 175028 35.4 142475 31.0 317503 33.3
Neither activity 198128 14.3 193849 14.1 391977 14.2 24007 4.9 36247 7.9 60254 6.3
Total employment(a) 491780 35.4 461759 33.3 953539 34.4 275578 55.7 245786 53.4 521364 54.6
Total school(b) 1102770 78.9 1109458 79.7 2212228 79.3 371259 74.9 321695 69.8 692954 72.4
Notes: (a) Refers to all children in employment, regardless of school status; (b) Refers to all children attending school, regardless of work status.
Source: UCW calculation based on Zambia Labour Force Survey, 2008
Table 4. Child activity status, by age group and place of residence, 2008
Activity status
Children aged 7-14 years Children aged 15-17 years
Urban Rural Total Urban Rural Total
No. % No. % No. % No. % No. % No. %
Employment exclusively 13891 1.5 162891 8.8 176782 6.4 42508 11.5 160548 27.5 203056 21.3
School exclusively 684417 74.4 736899 40.0 1421316 51.4 215364 58.5 157036 26.9 372400 39.1
Both activities 124250 13.5 650670 35.3 774920 28.0 71193 19.3 246310 42.1 317503 33.3
Neither activity 97666 10.6 294311 16.0 391977 14.2 39216 10.7 21038 3.6 60254 6.3
Total employment(a) 138223 15.0 815316 44.0 953539 34.4 113884 30.9 407480 69.6 521364 54.6
Total school(b) 818806 87.7 1393421 75.1 2212227 79.3 288047 77.8 404907 69.0 692954 72.4
Notes: (a) Refers to all children in employment, regardless of school status; (b) Refers to all children attending school, regardless of work status.
Source: UCW calculation based on Zambia Labour Force Survey, 2008
47. Aggregate estimates of children’s activities mask important differences by
residence, region, age and sex. Table 3 and Table 4 illustrate the main patterns.
Residence. Children’s involvement in economic activity is largely a rural
(agriculture sector) phenomenon. Children living in cities and towns are
considerably less likely than their rural counterparts to engage in economic
activity, at every age and for both sexes. At the same time, urban children are
more likely to attend school generally (88% versus 75 percent), and much
more likely to attend school exclusive of work (74% versus 40 percent).
Region. Sub-national data point to large regional differences in children’s
work, underscoring the need for the geographic targeting of child labour
elimination efforts (Figure 6). In four provinces (Central, Eastern, Northern
and Western) around one-half of children work in employment. In Southern
province, by contrast, only about one in 20 children is in employment. There
is less geographic variation in school attendance; at least 70% of 7-14 year-
olds attend school in all but Eastern province.

TOWARDS ENDING CHILD LABOUR IN ZAMBIA | Children’s involvement in employment 28
Figure 6. Child employment and school attendance rates, 7-14 years age group, by province
Source: UCW calculation based on Zambia Labour Force Survey, 2008
Gender. There is surprisingly little difference in the time use patterns of
boys and girls in rural or urban areas in the 7-14 years age group. The
share of boys and girls aged 7-14 years in economic activity and in school
(or in both or in neither) are almost equal. Larger differences by sex
emerge among older, 15-17 year-old children. Boys are more likely than
girls to be in school and less likely to work exclusively (Table 3).
Age. Child economic activity rises sharply with age, but numbers of even
very young working children are far from negligible. Around 14% of
seven year-olds and 36% of 10 year-olds are already at work in economic
activity. These children, needless to say, are most vulnerable to workplace
abuse and injury, and are most likely to have their education
compromised. School attendance rises (i.e. entrants exceed early leavers)
until the age of 11 years and then begins to fall from the age of 13 years
onwards.
Figure 7. Children’s involvement in economic activity, by age, sex and residence(1)
Source: UCW calculation based on Zambia Labour Force Survey, 2008
48. The time-intensiveness of children’s work in employment is also a concern in
Zambia. Involvement in work per se is a relatively crude measure of the work
burden faced by children because it does not capture work intensity, i.e., the time
spent by children in work.28
As shown in Table 5, the intensity of children’s work
is high in Zambia. Working children aged 7-14 years work an average of 4.4 hours
per day, or almost 31 hours per week. Even those who are also students must put
28
In line with the international definition of employment, children classified as at work in employment can work as little as one hour per week.
50.6
20.6
54.9
42.1
15.5
51.8
27
6.5
47.3
81.1
88.3
65.3 70.1
85.9
77.1 77.3
84.7 78.7
0
10
20
30
40
50
60
70
80
90
100
Central Copperbelt Eastern Luapula Lusaka Northern Northwestern Southern Western
perc
ent
At work in employment
Attending school
0
10
20
30
40
50
60
70
80
90
100
5 6 7 8 9 10 11 12 13 14 15 16 17
perc
ent
age in years
At work in employment
Attending schooling

TOWARDS ENDING CHILD LABOUR IN ZAMBIA | Children’s involvement in employment 29
in 30 working hours per week, with obvious consequences on their time and
energy for study. Average weekly working hours rise further when the time these
children spend on household chores is also considered. As discussed in the inter-
agency Understanding Children’s Work report (UCW, 2009), three-quarters of all
children in employment also perform household chores in their own homes.
Table 5. Average daily working hours, children aged 7-14 years, by sex, place of residence, status and sector of employment
Characteristics All children in employment Children only in employment Children in employment and
schooling
Sex Male 4.4 5.0 4.2
Female 4.3 4.6 4.3
Residence Urban 4.5 5.0 4.5
Rural 4.3 4.8 4.2
Total 7-14 4.4 4.8 4.2
Source: UCW calculation based on Zambia Labour Force Survey, 2008
4.2 Characteristics of children’s work in employment
49. Children’s employment in Zambia is concentrated overwhelmingly in one
sector – agriculture. Almost 92% of total 7-14 year-olds in employment work in
agriculture, against around four percent in services and three percent in trade.
Differences by sex in terms of sector of employment are not large: girls are
slightly less likely than boys to be in agriculture, and more likely to be in services
and trade. There are larger differences in the nature of children’s employment by
place of residence. While agricultural work accounts for almost all children’s
employment in rural areas, their employment in urban areas is more varied.
Agricultural work still predominates, but trade and services sector work is also an
important proportion in urban areas.
Figure 8. Employment sector, children in employment aged 7-14 years, by residence
Source: UCW calculation based on Zambia Labour Force Survey, 2008
Figure 9. Employment sector, children in employment aged 7-14 years, by residence
Source: UCW calculation based on Zambia Labour Force Survey, 2008
Agriculture; 62.9
Agriculture; 96.5
Agriculture; 91.9
0 10 20 30 40 50 60 70 80 90 100
Urban
Rural
Total
percent
Agriculture Commerce Services Other(a)
Unpaid family worker; 90.7
Unpaid family worker; 93.5
Unpaid family worker; 93.1
0 10 20 30 40 50 60 70 80 90 100
Urban
Rural
Total
percent
Paid employee Self-employed Other

TOWARDS ENDING CHILD LABOUR IN ZAMBIA | Children’s involvement in employment 30
50. Almost all children in employment work for their families as unpaid labour,
with little variation by age, place of residence or sex (Table 6). In all, 93% of
children in employment work within the family. Only about four percent of
children work as paid employees. Again, there is very little variation by age and
sex, but some differences in work modality by rural or urban residence. Children
living in cities and towns are slightly less likely to work for their families, and
slightly more likely to be involved in waged work and self employment, compared
to their counterparts living in the peri-urban and rural areas.
Table 6. Employment status of children, by age, sex and place of residence
Background characteristic
Status in employment
Unpaid family worker
Paid employee Self-employed Other Total
Residence Urban 90.7 4.9 4.3 0.1 100
Rural 93.5 3.8 2.7 0.1 100
Total 7-14 Total 93.1 3.9 2.9 0.1 100
Source: UCW calculation based on Zambia Labour Force Survey, 2008
4.3 Trends in children’s employment
51. A previous labour force survey for the 2005 reference year permits a look at
how the level and composition of children’s activities, and particularly children’s
employment, has changed in recent years. A comparison of the results from the
2005 and 2008 labour force surveys shows a dramatic decline in children’s
employment of 14 percentage points during this period (from 48 percent to 34
percent). In absolute terms, there were over 270,000 fewer children in
employment in 2008 than in 2005. The progress in reducing children’s
employment during this period extended to both boys and girls is shown in Table
7. The decline in employment was not, however, accompanied by similar gains in
children’s school attendance: the proportion of children attending school rose by
only about three percentage points from 2005 to 2008.
Table 7. Changes in child activity status, 7-14 years age group, by sex and residence, 2005 and 2008
Activity status
Male Female Total
2005 2008 2005 2008 2005 2008
No. % No. % No. % No. % No. % No. %
Employment exclusively 172,600 13.3 92233 6.7 145,414 11.5 84,549 6.1 318,014 12.4 176,782 6.4
School exclusively 512,889 39.6 695813 50.3 517,416 41.0 725,501 52.6 1,030,305 40.3 1,421,314 51.4
Both activities 462,556 35.7 398643 28.8 446,202 35.3 376,276 27.3 908,758 35.5 774,919 28.0
Neither activity 147,196 11.4 198128 14.3 154,644 12.2 193,849 14.1 301,840 11.8 391,977 14.2
Total employment(a) 635,156 49.0 491,780 35.4 591,616 46.8 461,759 33.3 1,226,772 47.9 953,539 34.4
Total school(b) 975,445 75.3 1,102,770 78.9 963,618 76.3 1,109,458 79.7 1,939,063 75.8 2,212,228 79.3
Notes: (a) Refers to all children in employment, regardless of school status; (b) Refers to all children attending school, regardless of work status.
Source: UCW calculations based on Zambia Labour Force Survey, 2005 and 2008

TOWARDS ENDING CHILD LABOUR IN ZAMBIA | Children’s involvement in employment 31
Figure 10. Changes in the composition of children’s activities, 7-14 years age group, 2002/03-2005/06
Source: UCW calculations based on Zambia Labour Force Survey, 2005 and 2008
52. Figure 10 illustrates how the composition of children’s activities changed
over the 2005 to 2008 period. It shows that the measured reduction in children’s
employment came from both the group of children working exclusively
(decreasing by 6 percentage points) and from the group working and attending
school (decreasing by 7 percentage points). In other words, the changes reflected
more children choosing not to work in order to go to school full-time, as well as
more students choosing not to combine work with study. While overall school
attendance changed little during 2005-2008 period (3 percentage points), the
proportion of children attending school exclusively, unburdened by work
responsibilities, changed by much more (11 percentage points). This also
constitutes an important gain in educational terms, as the double burden of work
and schooling is associated with poorer educational outcomes.
4.4 Determinants of child labour
53. As most children (excluding those that live on their own) exercise little control
over their time allocations, determining why children work requires investigating
why parents choose to engage their children in work rather than sending them to
school or leaving them idle at home. In this section we estimated a model that
explains parental decisions concerning children’s participation in employment and
schooling as a function of a set of child, household and district variables:
Yid = 0 + Xi’ 1 + Zd’2 + uid
54. where i denotes an individual, d a district (there are 72 districts, most of which
spanning over both urban and rural areas. The Xi are individual characteristics and
the Zd are local characteristics.
55. Table 8 reports descriptive statistics (sample averages) for the set of child,
household and district variables used in the analysis.
56. The set of variables used in the analysis includes: the age of the child; a
dummy variable taking value 1 if the child is male (male); a set of dummy
variables describing the relationship to the household head (head/spouse,
grandchild, other relative, non relative); a dummy variable taking value 1 if the
mother/father deceased (mother/father deceased); a dummy variable taking value
1 if the child is not living with the mother/father (not living with mother/father); a
dummy variable taking value 1 is a child has disability (disability); a set of
dummies variable taking into account the level of education of the household head (primary, junior secondary, tertiary, being no education the reference group); a
dummy variable taking value 1 if the household head can read or write (head can
0 10 20 30 40 50 60 70 80 90 100
2005
2008
percent
refe
renc
e ye
ar
Employment exclusively Both activities School exclusively Neither activity

TOWARDS ENDING CHILD LABOUR IN ZAMBIA | Children’s involvement in employment 32
read/write); a dummy variable taking value 1 if the household is female headed
(female headed); a dummy variable taking value 1 if the household has a job (head
employed); the child to adult population ratio at the district level (child/adult
population); and the logarithm of the household size (household size (log)).
Table 8. Descriptive statistics, children aged 7-15(a)
Not in employment In employment All
Child characteristics Age 10.41 11.71 11.06
Male 0.49 0.52 0.50
Relationship to household head
Head/spouse 0.00 0.01 0.01
Child/stepchild 0.76 0.77 0.76
Grandchild 0.11 0.11 0.11
Other relative 0.12 0.11 0.11
Non relative 0.00 0.01 0.00
Mother deceased 0.09 0.10 0.10
Father deceased 0.21 0.20 0.20
Not living with mother 0.22 0.22 0.22
Not living with father 0.36 0.35 0.35
Disability 0.01 0.01 0.01
Household characteristics
Rural 0.56 0.85 0.71
Head age 43.49 44.78 44.14
Head Education Less than primary 0.10 0.15 0.13
Primary 0.38 0.49 0.44
Junior secondary 0.19 0.18 0.19
Senior secondary 0.25 0.15 0.2
Tertiary 0.08 0.03 0.05
Head can read/write 0.84 0.79 0.82
Female headed 0.23 0.22 0.23
Head employed 0.93 0.97 0.95
p.c. Earnings (ZMK) 88412.3 42238.61 65325.45
Household size 7.12 6.95 7.03
District characteristics Teacher/school population (x 100) 4.09 3.35 3.72
Employment rate prime age mean 0.82 0.92 0.87
Child/adult population (7-15/20-50) 0.97 1.01 0.99
Average local p.c. earnings (ZMK) 98806.4 49589.87 74198.13
Notes: (a) Sample averages of the set of child, household and district variables used in the analysis. Source: UCW calculations based on Zambia Labour Force Survey, 2008
57. School quality is taken into consideration using as a proxy the share of
teachers over the school population at the district level (teacher/school
population). Labour market characteristics are taken into account by including the
employment rate at district level (employment rate).
58. In order to analyze the role of living standards, we include both per capita
labour income as a fraction (or a multiple) of local average per capita income (p.c.
earnings/average) and the average local income (p.c. average earnings). Average
local income refers to the average across all households (whether with children or
not) in the same district and area (rural or urban). The coefficient on the first
variable measures the effect of being at different points along the income
distribution relative to the average household in the area of residence, while the
coefficient on the average local income measures generalized differences in living
standards, including those that generate variation in both the demand and the
supply of child labour. We transform both earnings variables using the square root
(that is akin to a log transformation but has the advantage of being defined for zero
earnings).

TOWARDS ENDING CHILD LABOUR IN ZAMBIA | Children’s involvement in employment 33
Table 9. Determinants of children’s time use (children aged 7-15 years)
(1)School (2)Work (3)Hours (4) Neither in school nor at work
Child characteristics
Age (a) 8 0.118***(0.004) 0.133***(0.012) 0.329***(0.046) -0.067***(0.002)
9 0.170***(0.003) 0.227***(0.013) 0.612***(0.049) -0.094***(0.002)
10 0.193***(0.003) 0.327***(0.012) 1.023***(0.046) -0.111***(0.002)
11 0.188***(0.003) 0.368***(0.012) 1.226***(0.050) -0.108***(0.002)
12 0.201***(0.003) 0.435***(0.010) 1.549***(0.047) -0.122***(0.002)
13 0.190***(0.003) 0.440***(0.011) 1.559***(0.050) -0.113***(0.002)
14 0.186***(0.003) 0.475***(0.010) 1.826***(0.049) -0.119***(0.002)
15 0.165***(0.003) 0.498***(0.010) 2.026***(0.049) -0.114***(0.002)
Male -0.006(0.004) 0.014***(0.005) 0.077***(0.022) 0.004(0.003)
Relationship to HH head
Head/spouse -0.123***(0.032) 0.091***(0.035) 0.518***(0.148) -0.010(0.019)
Grandchild -0.002(0.010) 0.009(0.013) 0.031(0.057) 0.006(0.007)
Other relative -0.040***(0.010) -0.002(0.013) 0.030(0.055) 0.018**(0.008)
Non relative -0.590***(0.040) 0.374***(0.047) 3.461***(0.204) -0.012(0.025)
Mother deceased -0.051***(0.010) 0.031***(0.012) 0.123**(0.051) 0.036***(0.008)
Father deceased 0.004(0.007) 0.011(0.009) 0.031 -0.003(0.005)
Not living with mother 0.010(0.008) -0.038***(0.011) -0.109** -0.006(0.006)
Not living with father -0.024***(0.008) -0.006(0.010) -0.026 0.006(0.006)
Disability -0.227***(0.025) -0.085***(0.022) -0.352***(0.109) 0.188***(0.022)
Household characteristics
Rural 0.048***(0.010) -0.053***(0.013) 0.032(0.054) -0.025***(0.008)
Head age 0.000(0.001) -0.002(0.001) -0.008(0.006) 0.001(0.001)
Head age squared 0.000(0.000) 0.000*(0.000) 0.000(0.000) -0.000*(0.000)
Head Education. (b)
Primary 0.058***(0.007) -0.002(0.010) -0.144***(0.045) -0.020***(0.005)
Junior sec 0.093***(0.006) -0.016(0.012) -0.248***(0.053) -0.036***(0.005)
Senior sec. 0.127***(0.006) -0.062***(0.012) -0.431***(0.054) -0.053***(0.005)
Tertiary 0.141***(0.005) -0.118***(0.014) -0.586***(0.067) -0.068***(0.004)
Head can read/write 0.065***(0.007) -0.002(0.009) -0.030(0.040) -0.026***(0.005)
Female headed 0.040***(0.006) -0.048***(0.009) -0.163***(0.038) -0.010**(0.005)
Head employed 0.034***(0.011) 0.102***(0.012) 0.426***(0.057) -0.050***(0.009)
p.c. earnings/average 0.056***(0.010) -0.040***(0.013) -0.281***(0.059) -0.044***(0.007)
Household size (log) 0.019***(0.006) -0.060***(0.008) -0.200***(0.036) 0.005(0.005)
District characteristics
Teacher/school age pop. 0.033*(0.000) -0.103***(0.000) -0.371***(0.001) -0.002(0.000)
p.c. average earnings 0.411***(0.040) -0.783***(0.053) -2.661***(0.231) -0.124***(0.029)
Child/adult population 0.126***(0.015) -0.473***(0.020) -1.801***(0.086) -0.054***(0.011)
Employment rate -0.145***(0.034) 1.167***(0.046) 3.256***(0.181) 0.012(0.024)
Note: (a) The reference category is 7 years; (b) Household head education – the reference category is No education Source: UCW calculations based on Zambia Labour Force Survey, 2008
59. Estimation results are presented in Table 9. Each column of Table 9 reports
coefficients from a number of regressions for children aged 7-15, each
corresponding to a different dependent variable. The first column of table 11
presents the result of the regression on children attending school (school), the
second column the result of the regression on children in employment (work), the
third column the result of the regression on working hours (hours), and the last
column the results of the regression on children neither working nor studying
(neither in school nor at work). With the exception of hours of work (for which
we use ordinary least squares), all other coefficients are obtained from probit
regressions and in the table we report marginal effects.
60. Focusing on child labour, it is worth emphasizing a few important results.
Child labour involvement increases clearly with age and decreases with parental
education. Children that have lost their mother are at greater risk of child labour
and of being denied schooling. Disabled children are less likely to be both
working and going to school and more likely to be neither working nor studying.

TOWARDS ENDING CHILD LABOUR IN ZAMBIA | Children’s involvement in employment 34
Higher household earnings reduce child labour as does a higher number of
teachers relative to the child population. Child labour is pro-cyclical, responding
positively to increase in adult employment and, consistent with a simple model of
the labour market with aggregate demand and supply, child labour is lower the
higher is the share of children in the population.

TOWARDS ENDING CHILD LABOUR IN ZAMBIA | Expected evolution of child labour population 35
5. EXPECTED EVOLUTION OF CHILD LABOUR POPULATION
61. In order to assess the costs of eliminating child labour by 2015, it is necessary
to know how the child labour population will evolve in the absence of specific
additional interventions. As we have seen, children’s involvement in employment
in Zambia is still relatively high, although it is trending downwards. Economic
growth and demographic evolution, coupled with a set of education policies
already in place, are likely to generate a further reduction in children’s
employment. This chapter is aimed at assessing this “spontaneous” reduction in
children’s employment over the period up to 2015, and, following from this, the
likely size of group “left behind” in employment that will need to be targeted with
special policy efforts.
62. The analysis builds on the baseline estimates for 2008 presented in the
previous chapter. It makes use of information from the 2008 Labour Force Survey
together with educational data from the 2008 Zambia Annual School Census. The
Zambia LFS 2008 constitutes the most recent source of data on children’s
involvement in employment and, combined with the 2008 Zambia school census,
allow consideration of the impact of economic growth outlook and educational
policies in assessing the spontaneous reduction of the population of children in
employment.
63. The projections of the number of children in employment up to 2015 in the
absence of specific additional interventions are undertaken in two steps. First, we
look at how the children in employment population will evolve based only on
demographic change, utilizing information from Zambia LFS 2008 on the
dynamic of the previous population cohorts. Second, we consider the impact of
the economic and policy outlook on the evolution of the population of children in
employment, using the model of child labour determinants estimated in the
previous chapter.
5.1 Evolution of children in employment arising from demographic change
64. The evolution of the overall population in the age range 7-15 is derived from
the dynamic of the previous cohorts. In particular, information on population
growth is obtained using the cohort information contained in the Zambia LFS
2008.
65. Conveniently, children aged seven years (the youngest age group of interest)
in the last year of observation (2015), are aged 0 in the first year of observation
(2008). Because of this, the 2008 data can be used to estimate both the size and the
characteristics of the group of interest in 2015 (and, a fortiori, in each year
between 2008 and 2015). Thus, as shown in Table 10, the population aged 15 at
year 2008 is estimated as the actual population aged 15 in 2008, and the
population at any age for the years 2009 to 2015 is computed using the population
of the younger cohorts (age 14, 13, ….., 0).

TOWARDS ENDING CHILD LABOUR IN ZAMBIA | Expected evolution of child labour population 36
Table 10. Size of birth cohorts
Cohort Size Age in
2008 2009 2010 2011 2012 2013 2014 2015
1993 329,976 15 16 17 18 19 20 21 22
1994 333,784 14 15 16 17 18 19 20 21
1995 299,396 13 14 15 16 17 18 19 20
1996 382,611 12 13 14 15 16 17 18 19
1997 286,848 11 12 13 14 15 16 17 18
1998 407,222 10 11 12 13 14 15 16 17
1999 322,124 9 10 11 12 13 14 15 16
2000 426,131 8 9 10 11 12 13 14 15
2001 346,315 7 8 9 10 11 12 13 14
2002 346,255 6 7 8 9 10 11 12 13
2003 386,019 5 6 7 8 9 10 11 12
2004 466,741 4 5 6 7 8 9 10 11
2005 407,857 3 4 5 6 7 8 9 10
2006 408,109 2 3 4 5 6 7 8 9
2007 335,706 1 2 3 4 5 6 7 8
2008 415,329 0 1 2 3 4 5 6 7
Total age 7-15 years 3,134,407 3,150,686 3,202,921 3,370,266 3,395,512 3,516,773 3,445,257 3,538,462
Source: UCW calculations based on Zambia Labour Force Survey, 2008
66. The projections of the population of children in employment based only on the
evolution of population are presented in panel (a) (absolute value) and panel (b)
(incidence rates) of Figure 11. One remarkable feature of the data is the trend in
population growth. While there are around 330,000 children born in 1993 (i.e.
aged 15 in 2008) there are about 415,000 children born in 2008 (i.e. aged 7 in
2015). Such trends in population growth imply that - everything else equal - the
number of children in employment is meant to grow in Zambia in the absence of
major macro-economic changes or policy interventions. In fact, while the
projection shows a slight reduction in the incidence of children in employment,
due to the sustained population growth, their absolute numbers increase.
Figure 11. Predicted number of children in employment (,000), 7-15 years age group, considering demographic change
Source: UCW calculations based on Zambia Labour Force Survey, 2008
1,134
1,170 1,165
1,205
1,177 1,191
1050
1100
1150
1200
1250
1300
2010 1011 2012 2013 2014 2015
num
ber
(a) No. children in employment ('000)
Children in employment considering demographic change only
35.4
34.7 34.3 34.3 34.2
33.7
32
33
34
35
36
37
38
2010 2011 2012 2013 2014 2015
perc
ent
(b) % children in employment

TOWARDS ENDING CHILD LABOUR IN ZAMBIA | Expected evolution of child labour population 37
5.2 Evolution of population of children in employment arising from economic and policy forecast
67. Projections of changes in the population of children in employment arising
from the economic and policy outlook first require a model of how these and other
factors influence involvement in child labour. In section 4.4 of this report, we
estimated a model that explains children’s participation in employment and
schooling as a function of a set of child, household and district variables:
Yid = 0 + Xi’ 1 + Zd’2 + uid
68. where i denotes an individual, d a district (there are 72 districts, most of which
spanning over both urban and rural areas. The Xi are individual characteristics and
the Zd are local characteristics.
69. The results of the estimation, reported in section 4.4, highlight the importance
of both economic and policy factors, and in particular the importance of household
income and education quality, on children’s involvement in child labour.
Improvements in household income, measured in both relative and generalised
terms, significantly reduce child labour. Likewise, improvements in school
quality, as proxied by the ratio of teachers to the school-aged population,
significantly lessen the likelihood of child labour.
70. Given the importance of household income and school quality as determinants
of child labour, we next need to make forecasts about how these factors will
change over the five-year study period. We assume that (1) the average income at
district level increases by 10% every year; (2) absolute poverty falls, such that
households with income below half of the mean local income in year 0 earn half of
the mean local income by year 5; and (3) the teacher/school-aged child ratio
increases by 10% every year. This of course reflects an optimistic economic and
policy scenario; should, for example, the repercussions of the renewed global
financial turmoil impact significantly on Zambia, this scenario is unlikely to be
realized.
71. On the basis of the estimation results and the forecasts concerning income
growth, poverty and the teacher/school-aged child ratio, the baseline projections of
the population of children in employment are reported in panel (a) (absolute value)
and panel (b) (incidence rates) of Figure 14. The projections indicate that the
incidence rate will steadily fall from about 34% to 26% over the five year period.
However, due to the population increase, the reduction in the absolute number of
children working will be more limited, and in year 5 still more than 900,000
children aged 7-15 years are expected to be working.

TOWARDS ENDING CHILD LABOUR IN ZAMBIA | Expected evolution of child labour population 38
Figure 12. Predicted number of children in employment (,000), 7-15 years age group, considering demographic change and economic/policy forecast
Source: UCW calculations based on Zambia Labour Force Survey, 2008
72. Obviously caution should be exercised in interpreting these results as, again,
they are based on a best-case economic and policy scenario – lesser progress in
terms of improving household incomes and school quality will mean a more
limited baseline decline in children’s employment over the study period.
Nonetheless, the analysis suggests clearly that even under this best-case scenario
current efforts will fall short of the goal of child labour elimination over the five-
year study period, and points to the need for significant additional policy efforts.
1191
1,134
917
800
900
1000
1100
1200
1300
2010 2011 2012 2013 2014 2015
num
ber
(a) No. children in employment ('000)
Children in employment considering demographic change only
Children in employment also considering economic and policy forecast
33.7 35.0
25.9
20
22
24
26
28
30
32
34
36
38
2010 2011 2012 2013 2014 2015
perc
ent
(b) % children in employment

TOWARDS ENDING CHILD LABOUR IN ZAMBIA | Policy options for addressing child labour: assessing resource requirements 39
6. POLICY OPTIONS FOR ADDRESSING CHILD LABOUR: ASSESSING RESOURCE REQUIREMENTS
73. The previous chapter highlighted the fact that even under a best-case growth
and policy scenario a substantial number of children – just below one million – are
expected to be still in employment at the end of the five year time horizon. An
additional policy response will therefore be necessary to eliminate child labour
within this period. What policy areas are most relevant in this context? A wide
body of research underscores the importance of expanding social protection:
households with adequate social protection do not have to resort to child labour as
a buffer against negative shocks and are in a better position to forego the
immediate returns to child labour in order to invest in their children’s education.
Beyond social protection, a range of additional prevention and withdrawal
measures are relevant to fully stemming the flow of children into child labour and
to reaching the large numbers of children already trapped in child labour. This
chapter assesses the cost implications (1) providing the poorest of the poor
families with a minimum degree of social protection through child cash transfers
and (2) providing a package of special, targeted measures aimed at removing and
preventing children from employment.
6.1 Child cash transfers
74. This section assesses the costs and impact of expanding social protection.
Attention focuses on one element in particular of a needed comprehensive social
protection strategy - child cash transfers.29
The rationale for transfers as a tool for
promoting schooling as an alternative to child labour is clear: not only do they
provide families with a cushion against shocks, but they also help families
overcome the economic costs associated with school attendance, both direct (fees,
uniforms, etc.) and indirect (foregone wages and production). The body of
evidence on existing pilot cash transfer schemes in Zambia, including one begun
in the Kalomo district and since expanded to additional districts, corroborates this
rationale: it suggests that cash transfers can significantly raise household welfare,
increase household education expenditures and increase school enrolment
(although none of the evaluations or reviews to date has looked at child labour as
an outcome variable).30
75. To measure the likely effect of cash transfer program on child labour and
human capital accumulation, we utilize an ex-ante micro simulation approach. Ex-
ante methods consist of simulating the effect of the program on the basis of some
model of the household. These models can vary widely in complexity and
coverage. Arithmetic simulation models simply apply official rules to determine
whether or not a household qualifies for the programme, and the amount of the
transfer to be made, on the basis of data commonly available in typical household
surveys. More sophisticated models include some behavioural response by
households.
76. The micro-simulation model applied here falls within the latter category. In
particular we make use of a variant of the model developed by Bourguignon,
Ferreira and Leite (2003). By estimating the occupational choice of children after
the cash transfers it yields predictions of the effect of a program on school and
work status of children. Of course, ex-ante analysis based on micro-simulation
models should be seen as only a component of a comprehensive evaluation
29
A detailed listing of social protection schemes in Zambia is provided in Annex 2. 30
See for example, Devereux S. and Wood D., Zambia’s Social Cash Transfer Pilot Schemes: A Review Report for the Technical Working Group on Social Assistance, September 2008.

TOWARDS ENDING CHILD LABOUR IN ZAMBIA | Policy options for addressing child labour: assessing resource requirements 40
package of a program, which includes ex-post assessments, program reviews,
performance monitoring and evaluation and process evaluations, among others.
77. We focus on simulating the impact of a conditional child cash transfer (CCT),
where eligibility is conditional on children’s school attendance (but not their
absence from employment). The CCT is targeted to the poorest of the poor with
school-aged children. Specifically we consider eligible, among poor households,
only those in the bottom 20% in income and with children aged 7-15 years. The
amount of the transfer is differentiated by the number of children living in each
household. It decreases as the number of children per household increases, starting
at 50,000 ZMK per child per month for a single child household and falling to
25,000 ZMK per child per month for households with five or more children (see
Table 11).
Table 11. Conditional cash transfer scheme
Number of children per household Amount of transfer (a)
1 50,000
2 45,000
3 40,000
4 30,000
5+ 25,000
Note: (a) Values indicate the monthly transfers in Zambian Kwacha payable to each eligible child conditional of being in school
78. A total of 907,422 children are targeted in the first year in accordance with the
targeting criteria described above31
, of whom almost half (47%) are in school
exclusively, 41% combine school and employment and 12% are in employment
exclusively. Figure 14 reports the simulated impact of the conditional cash transfer
on the latter two of these groups. As shown, a predicted total of 24,020 children
would move from a situation of exclusive employment to exclusive schooling, and
an additional predicted 41,511 children would move from a situation of combining
employment and schooling to a situation of schooling exclusively. Taken together,
then, a predicted total of 65,531 children would leave employment in the first year
of the CCT scheme.
31
The CCT is targeted to the poorest of the poor with school-aged children. Specifically we consider eligible, among poor households, only those in the bottom 20% in income and with children aged 7-15 years.

TOWARDS ENDING CHILD LABOUR IN ZAMBIA | Policy options for addressing child labour: assessing resource requirements 41
Figure 13. Post-intervention changes in children’s activity status, first year of CCT programme
Source: UCW calculations based on Zambia Labour Force Survey, 2008
79. Figure 14 reports the simulated impact of the conditional cash transfer on
children in employment over the five-year period. The CCT scheme would lead to
a predicted further fall in children’s involvement in employment of about three
percentage points (translating to over 100,000 children in absolute terms) over a
five year treatment period. At the same time, about 65% of children that were out
of school before the transfer will change status and go to school (not shown).
These results suggest that a CCT scheme is a potentially useful policy tool against
child labour, but not, in and of itself, sufficient for eliminating child labour. But it
is worth recalling in this context that conditionality in this simulation did not
include children’s absence from employment; adding this condition would
inevitably increase the impact of the scheme, although it would also raise practical
issues of verification.
Figure 14. Predicted number of children in employment (,000), 7-15 years age group, considering demographic change, economic and policy forecast and impact of CCT
115,901
84,534
403,712
7,347
362,201
24,020
41,511
0
50,000
100,000
150,000
200,000
250,000
300,000
350,000
400,000
Children in employment exclusively pre-treatment
Status post-treatment Children in employment and schooling pre-
treatment
Status post-treatment
No.
chi
ldre
n
Employment exclusively
Employment and schooling
Schooling exclusively
1191
917
1134
813
700
800
900
1000
1100
1200
1300
2010 2011 2012 2013 2014 2015
num
ber
(a) No. children in employment ('000)
Children in employment considering demographic change only
Children in employment also considering economic/policy forecast
Children in employment also considering economic/policy forecast and impact of CCT

TOWARDS ENDING CHILD LABOUR IN ZAMBIA | Policy options for addressing child labour: assessing resource requirements 42
Source: UCW calculations based on Zambia Labour Force Survey, 2008
80. Not shown in the Figure 14 is an important additional impact of the transfer –
the significant movement of children from a situation of exclusive work to a
situation of work in combination with schooling. In other words, the cash transfer
induces many additional households to enroll their children in school without fully
removing them from work, meaning the transfer has a larger impact in terms of
increasing school attendance than it has in terms of reducing children’s
employment. Figure 15 illustrates this point for the first year of the CCT. It shows
that of all 115,901 children in work exclusively in year 0, a total of 24,024 give up
work altogether to enter school but an additional 7,347 children enter schooling
without giving up work. While removal from work altogether is clearly the
ultimate policy goal – the group moving from exclusive work to work and
schooling likely spend less total time in work, arguably a step towards this goal.
Figure 15. Change from employment exclusively resulting from CCT
Source: UCW calculations based on Zambia Labour Force Survey, 2008
33.7
25.9
35.4
23
20
22
24
26
28
30
32
34
36
38
2010 2011 2012 2013 2014 2015
perc
ent
(b) % children in employment
Em
ploy
men
t exc
lusi
vely
11
5,90
1
Em
ploy
men
t exc
lusi
vely
84
,534
7,347
24,020
0
20000
40000
60000
80000
100000
120000
year 0 (before transfer) year 1 (after transfer)
No.
chi
ldre
n
Employment exclusively
Employment and schooling
Schooling exclusively
Decrease in child labour
Increase in school
attendance
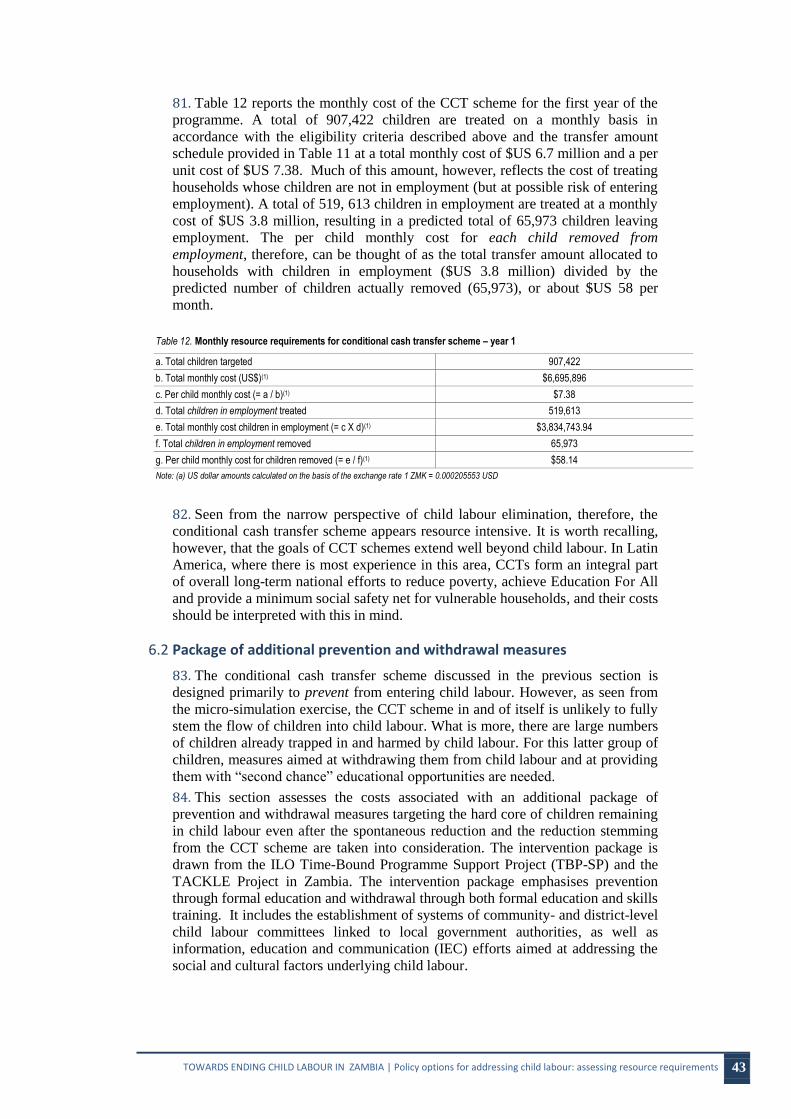
TOWARDS ENDING CHILD LABOUR IN ZAMBIA | Policy options for addressing child labour: assessing resource requirements 43
81. Table 12 reports the monthly cost of the CCT scheme for the first year of the
programme. A total of 907,422 children are treated on a monthly basis in
accordance with the eligibility criteria described above and the transfer amount
schedule provided in Table 11 at a total monthly cost of $US 6.7 million and a per
unit cost of $US 7.38. Much of this amount, however, reflects the cost of treating
households whose children are not in employment (but at possible risk of entering
employment). A total of 519, 613 children in employment are treated at a monthly
cost of $US 3.8 million, resulting in a predicted total of 65,973 children leaving
employment. The per child monthly cost for each child removed from
employment, therefore, can be thought of as the total transfer amount allocated to
households with children in employment ($US 3.8 million) divided by the
predicted number of children actually removed (65,973), or about $US 58 per
month.
Table 12. Monthly resource requirements for conditional cash transfer scheme – year 1
a. Total children targeted 907,422
b. Total monthly cost (US$)(1) $6,695,896
c. Per child monthly cost (= a / b)(1) $7.38
d. Total children in employment treated 519,613
e. Total monthly cost children in employment (= c X d)(1) $3,834,743.94
f. Total children in employment removed 65,973
g. Per child monthly cost for children removed (= e / f)(1) $58.14
Note: (a) US dollar amounts calculated on the basis of the exchange rate 1 ZMK = 0.000205553 USD
82. Seen from the narrow perspective of child labour elimination, therefore, the
conditional cash transfer scheme appears resource intensive. It is worth recalling,
however, that the goals of CCT schemes extend well beyond child labour. In Latin
America, where there is most experience in this area, CCTs form an integral part
of overall long-term national efforts to reduce poverty, achieve Education For All
and provide a minimum social safety net for vulnerable households, and their costs
should be interpreted with this in mind.
6.2 Package of additional prevention and withdrawal measures
83. The conditional cash transfer scheme discussed in the previous section is
designed primarily to prevent from entering child labour. However, as seen from
the micro-simulation exercise, the CCT scheme in and of itself is unlikely to fully
stem the flow of children into child labour. What is more, there are large numbers
of children already trapped in and harmed by child labour. For this latter group of
children, measures aimed at withdrawing them from child labour and at providing
them with “second chance” educational opportunities are needed.
84. This section assesses the costs associated with an additional package of
prevention and withdrawal measures targeting the hard core of children remaining
in child labour even after the spontaneous reduction and the reduction stemming
from the CCT scheme are taken into consideration. The intervention package is
drawn from the ILO Time-Bound Programme Support Project (TBP-SP) and the
TACKLE Project in Zambia. The intervention package emphasises prevention
through formal education and withdrawal through both formal education and skills
training. It includes the establishment of systems of community- and district-level
child labour committees linked to local government authorities, as well as
information, education and communication (IEC) efforts aimed at addressing the
social and cultural factors underlying child labour.

TOWARDS ENDING CHILD LABOUR IN ZAMBIA | Policy options for addressing child labour: assessing resource requirements 44
Table 13. Annual unit costs for prevention and withdrawal interventions, IPEC TBP and TACKLE Projects
Intervention Cost Coverage Cost/unit
Undifferent-iated costs(a)
Social mapping, identification & counselling 42,580.58 -- --
Capacity building/awareness raising in communities 122,353.15 -- --
Basic health services 10,593.86 -- --
Awareness raising among children/educators in schools 20,011.22 -- --
Training and inputs for parents/caregivers in IGAs 154,843.40 -- --
Monitoring of beneficiaries 44,725.00 -- --
Recreation centres/facilities 45,593.91 -- --
Total undifferentiated costs 440,701.12 -- --
Undifferentiated costs allocated to prevention 220,350.56 -- --
Undifferentiated costs allocated to withdrawal 220,350.56 -- --
Prevention Prevention through formal education 384,111.24 -- --
Total prevention 384,111.24 -- --
Undifferentiated cost component 220,350.56 -- --
Total prevention+ undifferentiated cost component 604,461.80 5,040 119.93
Withdrawal Withdrawal through formal education 137,077.30 -- --
Withdrawal through skills training 184,337.83 -- --
Total withdrawal 321,415.13 -- --
Undifferentiated costs component 220,350.56 -- --
Total withdrawal + undifferentiated cost component 541,765.69 5,430 99.77
Notes: (a) For purposes of the per unit cost calculations, undifferentiated costs are allocated equally between prevention and withdrawal interventions.
85. Per unit cost calculations for the intervention package are presented in Table
13. They are based primarily on the average budgeted costs associated with the
intervention package when implemented through the Time-Bound Programme
Support Project (TBP-SP) and the TACKLE Project. The cost estimates include
the direct costs budgeted for the targeted interventions in the core intervention
package, as well as the costs associated with associated with their management
and administration. Undifferentiated costs are divided equally between the
prevention and withdrawal components of the intervention package.
86. In order to offer an assessment of the likely cost of extending the core
intervention package to remaining children in child labour, we consider an
implementation scheme involving a gradual three-year phase-in period during
which some children graduate into adulthood without benefiting from the
interventions. Specifically, the phase-in schedule targets 40% of new entrants for
prevention in year 0, 60% in year 1, and 100% in year 2 and beyond. Withdrawal
measures follow a similar schedule. This phase-in is consistent with long term
elimination of child labour but with the cost of losing part of the “stock” of
children in employment in the first five years of intervention.
87. While other implementation schemes are of course possible, e.g., 100%
implementation from the outset of the program (and therefore no capacity
constraints), the gradual phase-in scheme is deemed most realistic and therefore
offers a valid basis for benchmarking the costs of the core intervention package for
child labour elimination. 32
It should be reiterated, however, that gradual phase-in
comes with an important social cost in the form of young persons entering
adulthood untreated and therefore lacking the basic skills needed for gainful
employment. Many of these persons will be in need of other, more costly,
remedial interventions later in life.
32
The costs associated with two alternative implementation schemes are available upon request: the first involves the withdrawal of all children already in child labour from the outset of the programme, and therefore assumes that there are no capacity constraints; the second involves a gradual phase-in, but does not allow any children to slip through the cracks, even during the initial phase-in period.

TOWARDS ENDING CHILD LABOUR IN ZAMBIA | Policy options for addressing child labour: assessing resource requirements 45
Figure 16. Total children prevented and withdrawn from employment through TBP-SP and TACKLE interventions, by programme year (a)
Notes: (a) Phase-in coverage targets are set as follows: year 0 - 40%, year 1 - 60%, and year 2 and beyond - 100%.
Source: UCW calculations based on Zambia Labour Force Survey, 2008
88. Figure 16 reports the total numbers of children prevented from entering and
withdrawn from child labour over the five-year period through the intervention
package based on the gradual three-year phase-in schedule. In all, some 1,319,161
children are provided with either prevention (499,237) or withdrawal/second
chance (819,924) measures; efforts peak in year 2 and diminish gradually
thereafter.
89. Figure 17 and Table 14 report the annual and total costs of reaching the
remaining population in child labour with the core implementation package over
the five-year programme period, based on the unit costs and the phase-in schedule
discussed above. It costs a total of $US 157.9 million to reach 1,319,161 children
with either prevention or withdrawal/second chance interventions over the five-
year period, or an average of $US26.3 million annually.
Figure 17. Allocation of cost of core intervention package, by intervention strategy and programme year
Source: UCW calculations based on Zambia Labour Force Survey 2008
57,535 44,210
107,609 107,274 88,785 93,824
91,899
296,153
241,163
126,960
46,398 17,351
0
50,000
100,000
150,000
200,000
250,000
300,000
350,000
400,000
2010 2011 2012 2013 2014 2015
No.
of c
hild
ren
Children withdrawn from CL through TBP-SP and TACKLE interventions
Children prevented from entering CL through TBP-SP and TACKLE interventions
$
$5,000
$10,000
$15,000
$20,000
$25,000
$30,000
$35,000
$40,000
$45,000
2010 2011 2012 2013 2014 2015
($U
S ,0
00)
Total cost of withdrawal (7-15 year-olds)
Total cost of prevention (7-15 year-olds)

TOWARDS ENDING CHILD LABOUR IN ZAMBIA | Policy options for addressing child labour: assessing resource requirements 46
Table 14. Estimated cost of core intervention package for eliminating child labour, by year(a)
2010 2011 2012 2013 2014 2015 Total
A. Total children prevented 57535 44210 107609 107274 88785 93824 499,237
Unit cost (US$) prevention $119.93 $119.93 $119.93 $119.93 $119.93 $119.93 --
B. Total cost of prevention (US$ ,000) $6,900 $5,302 $12,906 $12,865 $10,648 $11,252 $59,873
C. Total children withdrawn 91899 296153 241163 126960 46398 17351 819,924
Unit cost (US$) withdrawal $119.60 $119.60 $119.60 $119.60 $119.60 $119.60 --
D. Total cost of withdrawal (US$ ,000)
$10,991 $35,420 $28,843 $15,184 $5,549 $2,075 $98,062
Total children prevented or withdrawn (A+C)
149,434 340,364 348,772 234,234 135,183 111,175 1,319,161
Total cost prevention and withdrawal (US$ ,000) (B+D)
$17,891 $40,722 $41,749 $28,050 $16,197 $13,328 $157,937
Notes: (a) Fixed costs associated with building an enabling environment and management are allocated equally across the programme period.
90. Costs peak in year 2012, when the largest number of children are provided
with withdrawal and second chance interventions. Costs decline thereafter as
expanded prevention coverage reduces the need for withdrawal/second chance
interventions (and as economic growth and other factors contribute to a
“spontaneous” decline in the target population).
91. The conditional cash transfer scheme discussed in section 6 would cost an
additional amount of around $US 80.4 million annually to implement (see cost
calculations Table 12) 33
. A conditional cash transfer scheme targeting the poorest
of the poor would be a key element of an expanded social safety net for this group,
in turn critical to ensuring that the impact of the targeted package of prevention
and withdrawal measures discussed in this section are sustainable.
33
The annual cost of USD 80.4 is obtained by multiplying the “total monthly cost” reported in table 12 by 12

TOWARDS ENDING CHILD LABOUR IN ZAMBIA | Conclusion 47
7. CONCLUSION
92. While Zambia has witnessed a substantial reduction in the incidence of child
labour, this progress will not be enough to eliminate child labour by 2015. Even
under a best-case growth and policy scenario a substantial number of children
aged 7-15 years – just below one million – is expected to be still in employment in
2015. Significant additional policy measures will therefore be necessary to
eliminate child labour within this period.
93. The preceding chapters have assessed the resource implications of these
needed additional policy measures. Specifically the economic costs over a five-
year time horizon were assessed of (1) providing the poorest of the poor families
with a minimum degree of social protection through conditional child cash
transfers and (2) providing a package of special, targeted measures aimed at
removing and preventing children from employment.
94. The cost estimation results indicate that providing poorest of the poor with
conditional child cash transfer scheme would cost some $US80.4 million annually,
and would help prevent or remove some 100,000 children from child labour over a
five-year period. Seen from the narrow perspective of child labour elimination,
therefore, the conditional cash transfer scheme appears resource intensive. It is
worth recalling, however, that the goals of CCTs schemes extend well beyond
child labour. In Latin America, where there is most experience in this area, CCTs
form an integral part of overall long-term national efforts to reduce poverty,
achieve Education For All and provide a minimum social safety net for vulnerable
households, and their costs should be interpreted with this in mind.
95. Moreover, the body of evidence on existing pilot cash transfer schemes in
Zambia, including the one begun in the Kalomo district and since expanded to
additional districts, corroborates the rationale for child cash transfer: it suggests
that cash transfers can significantly raise household welfare, increase household
education expenditures and increase school enrolment (although none of the
evaluations or reviews to date has looked at child labour as an outcome variable).
96. An additional package of special prevention and protection measures targeting
the remaining child labourers would require an additional average outlay of $USD
26.3 annually over a five-year time horizon (see Table 14). These additional
measures are relevant in light of the evidence presented in the report indicating
that CCTs alone will be insufficient to meet the country’s child labour elimination
goals. Child labour is a complex phenomenon requiring comprehensive response
bridging a variety of policy sectors. The additional intervention package is
designed with this complexity in mind and consists of a wide array of measures,
including social mapping, counselling, community-level capacity building and
awareness raising, basic health services, awareness raising among children and
educators in schools, training and inputs for parents and caregivers in income
generating activities, recreation centres and facilities, and skills training.
97. The estimated costs for the conditional child cash transfer scheme and the
additional intervention package are premised on a best-case economic and policy
scenario. In a context of slower household income growth and less progress in
terms of improving school quality, the target number of children in child labour
would be higher over the five-year period, in turn raising the cost of eliminating
child labour.

TOWARDS ENDING CHILD LABOUR IN ZAMBIA | References 48
REFERENCES
Bourguignon, F., F. Ferreira and P. Leite (2003). “Ex-ante Evaluation of CCT
Programs: the Case of Bolsa Escola.” Policy Research Working Paper No. 2916.
The World Bank. Washington DC.
Central Statistical Office, Zambia (2010). “2010 Census of Population and
Housing Preliminary Report”, CSO, Lusaka, Zambia.
Dennis Kaputo Chiwele (2010). Assessing Administrative Capacity and Costs of
Cash Transfer Schemes in Zambia. International Policy Centre for Inclusive
Growth, Country Study, February 2010.
Devereux, S. and Wood, D. (2008). Zambia’s Social Cash Transfer Pilot
Schemes: A Review Report for the Technical Working Group on Social Assistance,
September 2008.
Goodson Sinyenga (2003). Statistical Analysis of Poor Households in Precarious
Circumstances in Zambia. MCDSS/GTZ, Lusaka, March 2003.
Government of Zambia (2011). Zambia Millennium Development Goals Progress
Report 2011. Ministry of Finance and National Planning, Lusaka, Zambia.
ILO (2008). Zambia –Social Protection Expenditure and Performance Review and
Social Budget. ILO Social Security Department (ILO), 2008 Geneva.
Mwansa, A. C., Kaba, A., Zulu, L., Kalokoni, J. and Nuirongo, Griffin K.(2004).
Free Basic Education (Grades 1–7) Policy Implementation Assessment. Lusaka:
MoE.
ODI (2008). Social Protection for low capacity households in Zambia. ODI
Project Briefings 11, May 2008. London, UK.
Understanding Children’s Work (UCW) Programme (2010). Joining forces
against child labour. Inter-agency report for The Hague Global Child Labour
Conference of 2010. International Labour Organization (ILO), Geneva.
UCW (2009). Understanding Children’s Work in Zambia – Report on Child
Labour. Inter-agency country report series.
World Development Indicators (from 2000 to 2010). The World Bank, Washington
DC.

TOWARDS ENDING CHILD LABOUR IN ZAMBIA | Annex 1. Social protection schemes in Zambia 49
ANNEX 1. SOCIAL PROTECTION SCHEMES IN ZAMBIA
Social protection schemes
Category Programme name
Year(s) operated
Main form of transfer
Objective(s) Implementing agencies
Spatial coverage
Target group Targeting method Condition of transfer
Direct Beneficiaries per year
Total cost per year
Transfer amount per beneficiary per year
Con
ditio
nal C
ash
Tra
nsfe
r
National Pension Scheme Authority (NAPSA)
Since 2000 Cash To respond to the risk of losing income due to retirement, disability/invalidity and survivorship
NAPSA National People in the formal sector
Mandatory scheme targeting people in the formal sector only
Based on contribution during working life
- - -
National Trust Fund for Disabled
Since 1994 Microfinance credit
To provide economic empowerment through microcredit and entrepreneurial skills to disabled poor people for sustainable employment
MCDSS 51 district Poor people with disabilities
Group lending approach, whereby small groups of 10-20 people are provided with microcredit based on a
business plan.
Loan must be repaid
120 (based on 2002-04 data)
K 378 (based on 2001 data)
< K 3.1 million
Con
ditio
nal F
ood
Tra
nsfe
r
School Feeding Programme
Since 2003 Food; also deworming, treatment and hygiene education, and establishments of school orchards and gardens
To increase enrolment, prevent drop-out and stabilize attendance at assisted primary schools; to improve the attention span by relieving short-term hunger; to contribute to nutrient intakes; to promote and incorporate public health interventions (Under the School Health and Nutrition Program) into SFP, reduce worm infestation and bilharzia in school age children, and to stimulate and enhance community/parents’ participation in education
GRZ through Min. of Education, WFP in collaboration with UNICEF, MCDSS and MACO
Selected schools in southern, Lusaka and Eastern Provinces
School districts that are food insecure with poor enrollment and attendance
Selection of schools based on: location in food insecure areas – drought affected, peri-urban area or outskirts of the districts, highly populated and low income townships; poor enrolment and high non-attendance; large numbers of OVCs; with adequate water and proper sanitation; adequate storage; demonstrated community links and willingness to manage the program; accessibility of the school throughout the year;
and number of vulnerable children, i.e. from households that are food insecure or orphans
Community require to provide storage room/kitchen/ feeding shelter; source of water and firewood; preparation of food
11,840 USD 422,315 USD 36

TOWARDS ENDING CHILD LABOUR IN ZAMBIA | Annex 1. Social protection schemes in Zambia 50
Social protection schemes
Category Programme name
Year(s) operated
Main form of transfer
Objective(s) Implementing agencies
Spatial coverage
Target group Targeting method Condition of transfer
Direct Beneficiaries per year
Total cost per year
Transfer amount per beneficiary per year
Con
ditio
nal
tran
sfer
s -
Far
m
inpu
ts
Targeted Food Security Packs and Programmes
2000-2005 Farming inputs (2kg maize, 1 kg legume seed, 15 kg fertilizers for 0.1 ha)
To empower vulnerable but viable households; to improve household
food security; to improve nutrition; to improve access to water through
small-scale irrigation
PAM, MCDSS and Oxfam GB
National Vulnerable but viable households
Community (CWAC) and NGO/CBO selection
payback 10% of pack value in maize crop
130,000 USD 4.9 million USD 38
Unc
ondi
tiona
l Cas
h T
rans
fers
Mongu and Kaoma Oxfam CT scheme
2005-06 Cash To cushion the impact of food insecurity as a result of the 2004/05 crop failure
Oxfam GB Mongu and Kaoma
Households that experienced 90% crop failure, child headed
households, the elderly, female headed households, households caring
for OVCs
Use the VAC and INGO VAA reports to targeting beneficiries.
Community and traditional setups are also used in targeting
86,000 USD 1.7 million USD 240
Pilot shceme, Kaloma District
Since 2004 Cash To reduce extreme poverty, hunger and starvation in the 10% most
destitute and incapacitated households in the covered region; and to
generate information on the feasibility, costs and benefits of SCTS as a
component of a SP strategy.
MCDSS, PWAS, CARE
Kaloma Community based targeting system. The entry criteria for the scheme
is that households have to be incapacitated, meaning that they do not
have any productive members or a dependency ratio of over 300.
Assets and support system are used to rank beneficiary households
1,200 USD 191,177 USD 133
Unc
ondi
tiona
l Foo
d
Tra
nsfe
rs
WFP Assistance for Refugees from Angola
2005-07 Food To provide secure access to food and to safeguard the nutritional status
of refugee beneficiaries until they attain food self sufficiency or are
repatriated to their country of origin
WFP, NGOs 5 refugee camps
Refugees from Angola, DRC, Rwanda and Burundi
UNHCR and government registers
82,000 USD 9.8 million USD 120

TOWARDS ENDING CHILD LABOUR IN ZAMBIA | Annex 1. Social protection schemes in Zambia 51
Social protection schemes
Category Programme name
Year(s) operated
Main form of transfer
Objective(s) Implementing agencies
Spatial coverage
Target group Targeting method Condition of transfer
Direct Beneficiaries per year
Total cost per year
Transfer amount per beneficiary per year
Unc
ondi
tiona
l Foo
d T
rans
fers
WFP country programme
2002-06 Food To improve the nutritional status of vulnerable groups; to increase
primary school enrolment & attendance; to create assets to improve
food security
WFP, MCDSS, MOE, PUSH, Lutheran World Federation, Harvest Help,
Community Home Based Care and Evangelical Fellowship of Zambia
National Malnourished under 5s, pregnant and lactating mothers, primary school
pupils, food insecure households
Community and household surveillance system, VAC reports and other
socio-economic indicators
506,800 USD 8.42 million USD 17
WFP Relief and Recovery and Operation
2005-07 Food To safeguard the nutritional wellbeing of vulnerable segments of the
population, including women and children affected by HIV/AIDS; to
increase access to education for OVC; and to preserve, build and
restore social structures, human and productive assets and community
safety nets
WFP, ADRA, Africare, World Vision, Care International, Zambia Relief
Foundation, Wild Conservation Society, PUSH, Project Concern
National OVCs in Kafue, Chongwe, Mongu and Lusaka, ARV patients
Community and household surveillance system, VAC reports and other
socio-economic indicators
1.1 million USD 51,796,000 USD 47
Unc
ondi
tiona
l Tra
nsfe
rs
- E
duca
tion
Free Basic Education
Since 2002 Education To give all children free and compulsory education
GRZ through the Ministry of Education
National Children attending primary education with particular focus on females and OVCs
Grants given to all schools and and amount based on the numbers of pupuls. In disbursements of bursaries, attention given to girl child
and OVCs.
2,370,425 - On average, k 3 million is allocated to each school

TOWARDS ENDING CHILD LABOUR IN ZAMBIA | Annex 1. Social protection schemes in Zambia 52
Social protection schemes
Category Programme name
Year(s) operated
Main form of transfer
Objective(s) Implementing agencies
Spatial coverage
Target group Targeting method Condition of transfer
Direct Beneficiaries per year
Total cost per year
Transfer amount per beneficiary per year
HIV
/AID
S a
wai
rene
ss
Community response to HIV/AIDS (CRAIDS)
Since 2003 Disseminating HIV/AIDS information
To mobilise and strengthen the capacity of communities to and the
private sector to respond to the HIV/AIDS epidemic
Zambia National Response to HIV/AIDS (ZANARA)
National Community-based programs and NGOs that aim at preventing and mitigatind the effect of HIV/AIDS
Demand-led self-targeting approach in allocation of funds to
beneficiaries
102 community projects
USD 1.075 million
USD 10,500 per project
Unc
ondi
tiona
l Tra
nsfe
rs –
Hou
sing
Habitat for Humanity (HfHz)
Since 1984 Houses To construct simple, decent and affordable houses and to sell them
interest-free at no profit, and use re-payments to build more houses
Habitat for Humanity Zambia
Lusaka, Central, Copperbelt, Northwestern, Southern and western
provinces
Households requiring housing (especially those with OVCs, children that
do not attend school, female-headed households and the elderly)
Use of community affiliates house provides own labour. Household services mortgage
by making payments calculated in bags of cement over a period of 10
years
150 households USD 375,000 USD 1,750
Unc
ondi
tiona
l T
rans
fers
– B
asic
need
s
Public Welfare Assistance Scheme (PWAS)
Since the 1950s
Food, clothes, repatriation, medical, education fees, shelter
To assist the most vulnerable to meet their basic needs, and to
promote community capacity for local initiatives to overcome poverty
MCDSS in collaboration with MoH, MoE, MACO, PAM, World Vision, GTZ
and Churches
National 2% of the poorest and most vulnerable households, those with
disabilities
Beneficiaries selected by CWAS & district social welfare officers
105,000 (40% male, 60% female)
USD 760,000 USD 7

TOWARDS ENDING CHILD LABOUR IN ZAMBIA | Annex 1. Social protection schemes in Zambia 53
Social protection schemes
Category Programme name
Year(s) operated
Main form of transfer
Objective(s) Implementing agencies
Spatial coverage
Target group Targeting method Condition of transfer
Direct Beneficiaries per year
Total cost per year
Transfer amount per beneficiary per year
Street children project in Zambia (STPZ)
Since 1991 Counselling, youth skill, temporary shelter, food, clothing, school fees, books, uniforms, business skills
To strengthen the capacity of street children centres; to support
children’s access to quality services in the community; to provide access to safe shelter for 48 vulnerable children living on the streets and support their re-integration into community life; to enhance children’s access to basic and higher education; to enhance the child’s well being through access to a nutritious diet; to provide children with clothing; and to enhance the children’s access to psychosocial support
Zambia Red Cross Society in collaboration with Youth Foundation,
YWCA, YMCA, Girl Guides, Scout, Red Crescent, International
Federation for Red Cross, DAPP, MCDSS and SCOPE-OVC
Mainly Lusaka city, copperbelt province also considered
Children on the streets and children from the streets aged 6-18 years;
women with, or potential to have, children on the streets; youths
without family support; mothers & households with potential
to
increase children on streets
Children visiting the centre; outreach through social workers; and
referrals from organisations dealing with vulnerable children
200 USD200,200
(USD130,000 for feeding, USD60,000 for microfinance,
USD10,200 for formal education)
-
Strengthening Community Participation for the
Empowerment of Orphans and Vulnerable Children
(SCOPE
OVC)
2000-2004 Resources for education interventions; food for insecure households;
psychosocial counselling
To mitigate the impact of HIV/AIDS on children and households
CARE international
Rural and peri-urbans of Chipata, Lundazi, Kabwe, Masaiti, Serenje,
Kitwe, Ndola, Mongu, Kalomo, Monze, Livingstone and Lusaka
OVCs Identification through Community and District Orphans and Vulnerable
Children Committees
523,166 over duration of project
USD 4.6 million over duration of project

TOWARDS ENDING CHILD LABOUR IN ZAMBIA | Annex 1. Social protection schemes in Zambia 54
Social protection schemes
Category Programme name
Year(s) operated
Main form of transfer
Objective(s) Implementing agencies
Spatial coverage
Target group Targeting method Condition of transfer
Direct Beneficiaries per year
Total cost per year
Transfer amount per beneficiary per year
Victim Support Unit (VSU)
Since 1994 Prosecuting offenders, sensitizing community members on their basic
human rights
To prevent crimes, to ensure effective investigations of crimes, and to
offer counselling to the victims of the family/domestic violence, crimes
against children and elderly persons and sexual offences
Zambia Police service
National All citizens Demand-driven and self-targeting
10,000
Source: Regional Hunger and Vulnerability Programme, Zambia: summary data on social protection schemes, January 2007

ANNEX 2. IMPACT PILOT CASH TRANSFER SCHEMES IN ZAMBIA
98. The Kalomo SCT was the first SCT pilot scheme in Zambia. It was tested from
November 2003 to April 2004, and rolled out to 1,027 households by December
2004. As of mid-2008, the Kalomo SCT delivers cash to 3,515 households every
second month. Households with children receive ZMK 50,000 (US$ 12.50),
households with no children receive ZMK 40,000 (US$ 10). Kalomo is generating
lessons about scaling up from a small pilot to a full district.
99. The Kazungula SCT started in August 2005 and reaches only 627 households.
Kazungula is testing the feasibility of delivering cash transfers in a remote, sparsely
populated and agriculturally marginal district. As in Kalomo, households without
children receive ZMK 40,000 and those with children receive ZMK 50,000.
100. The Monze SCT was launched in January 2007 and currently reaches 3,500 rural
households. Cash payments are the same as Kalomo and Kazungula: either ZMK
40,000 or ZMK 50,000 per month. Monze is pilot testing ‘soft’ conditionalities in
education and health (school and clinic attendance) for children. Households that fail
to meet project conditions will not be punished by having their cash transfers
withdrawn, but will be followed up with a ‘case management’ approach.
101. The Chipata SCT started in July 2006 and now reaches 1,190 households. It is
the only SCT operating in an urban area, and it also transfers more cash to households
with children: ZMK 40,000 plus ZMK 10,000 per primary school child and ZMK
20,000 per secondary school child, up to four children.
102. The Katete SCT started in August 2007 and reaches 4,706 individuals. Katete is
piloting a social pension – an unconditional cash grant that is not contingent on the
beneficiary’s retirement status and does not require contributions by either the
recipient or their employer (unlike private or public sector staff pension schemes).
103. Eligible household should be both destitute and incapacitated, where a destitute
household struggles to survive, adopts negative coping mechanisms, lacks decent
housing, has limited access to education and helath and insufficient support for
others. An incapacitated household has no working age members who are fit for
work, as well as a dependency ration of 3 or higher. Identification of eligible
households uses a form of community-based targeting (CBT). Community Welfare
Assistance Committees (CWACs) identify destitute and incapacitated community
members using participatory methods. But a 10% quota is applied in each
community, for pragmatic reasons (budget constraints) supported by an empirical
justification (surveys conducted by PWAS and GTZ found that approximately 10% of
Zambian households are destitute and incapacitated) (Republic of Zambia/GTZ,
2008: 15 16).
104. Apart from Katete, which has a different target group, all the SCTs are
variations on the original project design, as implemented in Kalomo. This model has
subsequently been ‘exported’ to Mchinji District in Malawi, where it is also in the
process of scaling up (UNICEF, 2007).
105. A review recently conducted for the Ministry of Community Development and Social Services (MCDSS) reports the evaluation results of the SCT mentioned above .
Food consumption. Food consumption by cash grant recipients in Kalomo
increased as a consequence of the incremental purchasing power provided by
social cash transfers. The Kalomo SCT evaluation survey found that reported
hunger decreased, while meals per day (for children but not for adults) and
dietary diversity both increased, as a direct result of receiving cash transfers
(Republic of Zambia/GTZ, 2007: 5). Positive results, in terms of increased
consumption spending, were found in Kazungula. On the other hand, average
total incomes were almost identical across the two household categories,

VOLUME 2 OF INTER-AGENCY REPORT ON CHILD LABOUR IN ZAMBIA| Annex 2. Impact Pilot cash transfer schemes in Zambia 56
suggesting that SCT households had few income-generating activities and
were allocating much of their cash transfers to buying food and other basic
necessities.
Livelihoods and assets. The impact of the SCTs on beneficiaries’ livelihood
among the districts is mixed. On the one hand, in all the districts CTs
protected households assets against ‘distress sales’ for food, enabled
accumulation of assets (especially of small livestock), and reduced average
levels of indebtedness. On the other hand, transfer income was not always
used to generate additional income.
Education. Cash transfers can contribute to improved education access, by
paying for some of the non-fee costs and reducing the need for children to
work. Education indicators (enrolment and absenteeism) generally improved
following the introduction of the SCTs in Kalomo and Kazungula, though
conditionalities relating to education were attached to this programme. The
Chipata SCT pays households extra cash for each school-going child, as an
incentive to educate children from poor families. The success of this feature
can be measured by increased spending on education (which was almost
double in SCT households compared to control group households), by
increased enrolment (as much as 60% among asset-poor SCT beneficiaries)
and by lower absenteeism rates (significant at 1%) (Tembo and Freeland,
2008: 32).
Health. The health status of SCT beneficiaries in Kalomo improved between
the baseline survey and the evaluation survey, probably as an indirect
consequence of receiving cash transfers, though attribution is difficult and
any linkages drawn from SCTs to improved health outcomes are speculative.
Self-reported illness in the month preceding each survey fell, possibly
because of improved disease resistance due to improved nutrition, and the
incidence of partial sightedness halved, possibly because beneficiaries spent
some of their cash transfers on eye surgery, but there are no data to confirm
either speculation (Republic of Zambia/GTZ, 2007: 5 6).
Community level impacts. Community-level impacts of SCTs can be positive
or negative, and Zambia’s cash transfer projects have reported both. Positive
impacts include reduced begging by the poorest and reduced dependency on
neighbours and relatives for support. Negative impacts can include social
tension related to envy and resentment by excluded households, or conflict
between genders or generations over the control of cash transfers.
Economic linkages. Social cash transfers stimulate local economies by being
spent in local markets and shops, and this creates a number of important
secondary benefits and ‘indirect beneficiaries’, beyond their primary benefits
in terms of enhanced income and consumption of direct beneficiaries. The
Kalomo SCT evaluation estimated that 81% of cash transfers disbursed were
spent locally, mostly on basic commodities such as food and groceries, but
also on agricultural inputs and small livestock. Cash recipients in rural areas
also buy produce and cooked food from their neighbors, so small farmers
enjoy more demand for their crops, which can stimulate investment in
agricultural production. Some beneficiaries hired neighbors as casual labour
for their farms (for pouching or weeding their fields), using cash transfers to
pay the wages.

This UCW publication has been produced with the support of ILO's International Programme on the Elimination of Child Labour (IPEC) trough its project "Tackling child labour through education" (TACKLE), founded by the European Union and supported by the African, Caribbean, and Pacific Group of States (ACP).