towards improving manure management in china
TRANSCRIPT

Towards improving manure management in China
Lin MaCenter for Agricultural Resources Research, Institute of Genetic
and Developmental Biology, Chinese Academy of Sciences
International Symposium on Agroecology for Sustainable Agriculture and Food Systems (ISASAF)
Kunming, Yunnan, China, 29th August - 31st September, 2016
Outlines
• Background
• Nutrient flows of manure chain
• Strategies for improving manure management

Booming development of animal husbandry in China in the past several decades
0
100
200
300
400
50019
6119
6419
6719
7019
7319
7619
7919
8219
8519
8819
9119
9419
9720
0020
0320
0620
09Live
stoc
k un
it (m
illio
n) Pig BeefBroiler LayerSheep and goat Dairy
DATASOURCE: FAO, 2013Dairy, 1.0; Beef cattle, 1.0; Pig, 0.3; Sheep and goat, 0.1; Layer, 0.014; Broiler, 0.007
The changes of livestock production in China (in LU)

China exceeded USA to be the world biggest livestock producer
0
20
40
60
80
100
120
0 100 200 300 400 500 600 700
Shar
e to
the
glob
le li
vest
ock
prot
ein
prod
uctio
n %
Productivity (kg protein per livestock unit)
Brazil
China
USA
India
Netherland
France
North Africa
20%
g
Bai et al., unpublished results

Livestock transition from 1980 to 2010
From mixed to landless system
0
100
200
300
400
500
600
1980 1990 2000 2010
Landless Grazing Mix
Live
stoc
k un
it (m
illio
n)
Strokal et al., 2016

N losses from food chain to water systems in China
0.0
5.0
10.0
15.0
20.0
1980 1990 2000 2010
Household Food processingLivestock Cropland
3.5
5.6
2.8
(Hou & Ma et al., 2013)
N losses(Tg)

Agriculture is the main non-point source of pollution
0%
20%
40%
60%
80%
100%
COD TN TP
Human Industry Agriculture
First National Pollution Source Survey Report of China, 2010
0%
20%
40%
60%
80%
100%
COD TN TP
AquacultureAnimal producitonCrop production

Manure losses contributed more than 44% TDN and 82% TDP in water systems in 2000s
Strokal et al., 2016
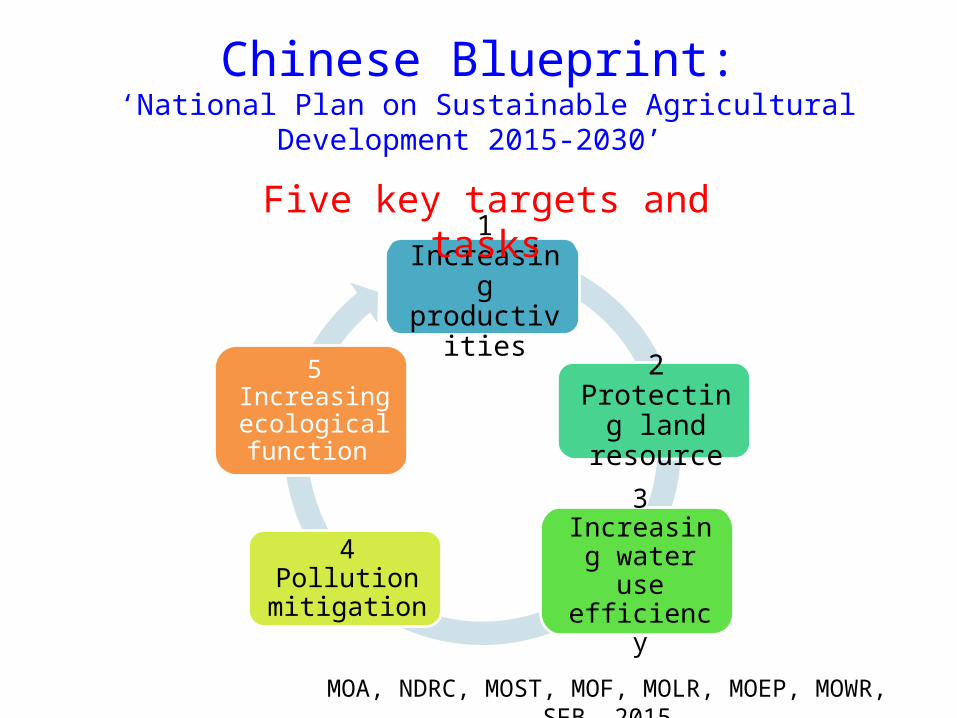
Chinese Blueprint: ‘National Plan on Sustainable Agricultural Development
2015-2030’
1 Increasing productivities
2 Protecting land resource
3 Increasing water use efficiency
4 Pollution mitigation
5 Increasing ecological function
MOA, NDRC, MOST, MOF, MOLR, MOEP, MOWR, SFB, 2015
Five key targets and tasks
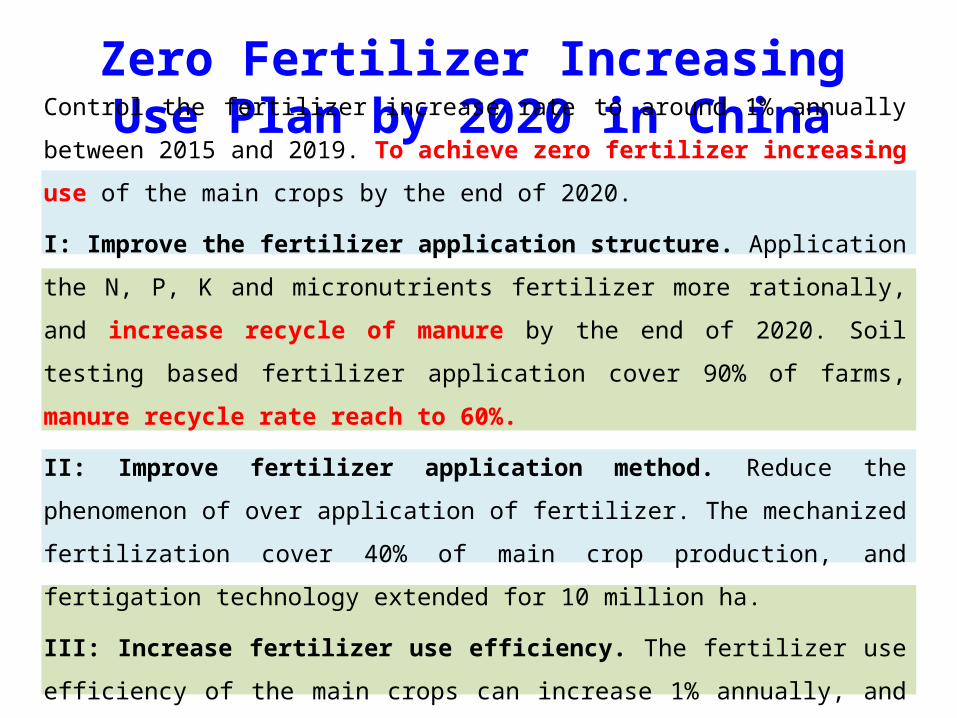
Zero Fertilizer Increasing Use Plan by 2020 in China
Control the fertilizer increase rate to around 1% annually between 2015 and
2019. To achieve zero fertilizer increasing use of the main crops by the end of
2020.
I: Improve the fertilizer application structure. Application the N, P, K and
micronutrients fertilizer more rationally, and increase recycle of manure by the
end of 2020. Soil testing based fertilizer application cover 90% of farms, manure
recycle rate reach to 60%.
II: Improve fertilizer application method. Reduce the phenomenon of over
application of fertilizer. The mechanized fertilization cover 40% of main crop
production, and fertigation technology extended for 10 million ha.
III: Increase fertilizer use efficiency. The fertilizer use efficiency of the main
crops can increase 1% annually, and increase the average fertilizer use efficiency
to more than 40% by the end of 2020.

NUFER model (NUtrient flows in Food chains, Environment and Resources use)
(Ma et al., JEQ 2010, Ma et al., 2012 STOTEN, Ma et al., EST 2013)
Atmosphere N2, NH3, N2O
Exports and losses
Surface watersGroundwater
Erosion and runoff
LeachingN
Crop production(soil accumulation)
P
Animal productionimports
Food processing
Humanconsumption
N N
BNF
Fertilizer
Import feed
Cropland Grassland
Water body
NH3
N2O N2
NO3-
Discharge
Animal products
Dead animal
Manure exportStorage
House
Runoff
Erosion
DroppedAppliedMain feed
By-productfeed
NH3 N2 N2O
Soil accumulation
6 animal category
20 production systems
(Bai et al., 2013, Bai et al., EST2014)

N flow of manure chain in 2010
Housing&Storage losses8.3 Tg
Excretion22.8 Tg
Housing19.3 Tg
Storage11.0 Tg
Treatment5.6 Tg
Discharge5.4 Tg
Cereals1.3 Tg
Cash crop2.7 Tg
Treatment losses1.6 Tg
Intake26.0 Tg
Products2.9 Tg
Dead animals0.3 Tg
P
Recycle losses2.5 Tg
Drop in the field3.5 Tg
Housing&Storage losses0 Tg
Excretion4.6 Tg
Housing4.1 Tg
Storage4.1 Tg
Treatment2.1 Tg
Discharge2.0 Tg
Cereals0.7 Tg
Cash crop1.3 Tg
Treatment losses0.1 Tg
Intake5.5 Tg
Products0.8 Tg
Dead animals<0.05 Tg
Recycle losses0.2 Tg
Drop in the field0.5 Tg
Housing&Storage losses0 Tg
Excretion16.2 Tg
Housing13.6 Tg
Storage13.6 Tg
Treatment8.0 Tg
Discharge5.6 Tg
Cereals3.7 Tg
Cash crop3.5 Tg
Treatment losses0.8 Tg
Intake16.7 Tg
Products0.4 Tg
Dead animals<0.05 Tg
Recycle losses0.7 Tg
Drop in the field2.6 Tg
K
N
N excretion, recycling & losses through the manure chain
• Most of the N losses during H&S sector.• 30% manure N recycled, but uneven distributed
between crops. Bai et al., unpublished results

Mixed systems, or pigs and beef production are important in N excretion, recycle and losses
Excretion Recycle Losses
22.8Tg
7.5Tg
17.8Tg
4.6Tg
2.5Tg
2.4Tg
16.2Tg
9.8Tg 7.2
Tg
Con
trib
utio
n to
man
ure
N
man
agem
ent
Con
trib
utio
n to
man
ure
P m
anag
emen
t C
ontr
ibut
ion
to m
anur
e K
man
agem
ent
Excretion Recycle Losses
22.8Tg
7.5Tg
17.8Tg
4.6Tg
2.5Tg
2.4Tg
16.2Tg
9.8Tg 7.2
Tg
Con
trib
utio
n to
man
ure
N
man
agem
ent
Con
trib
utio
n to
man
ure
P m
anag
emen
t C
ontr
ibut
ion
to m
anur
e K
man
agem
ent
0
2
4
6
8
10
Tota
l N lo
sses
(T
g)
GrazingMixedLandless
Excretion Recycle Losses
22.8Tg
7.5Tg
17.8Tg
4.6Tg
2.5Tg
2.4Tg
16.2Tg
9.8Tg 7.2
Tg
Con
trib
utio
n to
man
ure
N
man
agem
ent
Con
trib
utio
n to
man
ure
P m
anag
emen
t C
ontr
ibut
ion
to m
anur
e K
man
agem
ent
0
2
4
6
8
10
Tota
l N lo
sses
(T
g)
GrazingMixedLandless
0
2
4
6
8
10
Total N losses
(Tg)
PigsLayersBroilersDairy cattleOther cattleSheep&goat
Excretion Recycle Losses
22.8Tg
7.5Tg
17.8Tg
4.6Tg
2.5Tg
2.4Tg
16.2Tg
9.8Tg 7.2
Tg
Con
trib
utio
n to
man
ure
N
man
agem
ent
Con
trib
utio
n to
man
ure
P m
anag
emen
t C
ontr
ibut
ion
to m
anur
e K
man
agem
ent
0
2
4
6
8
10
Total N losses
(Tg)
PigsLayersBroilersDairy cattleOther cattleSheep&goat
Excretion Recycle Losses
Bai et al., unpublished results

Huge differences between animals & systems
0
10
20
30
40
50N P K
0
20
40
60
800
5
10
15
20
25
Mixed Grazing Landless Total
Feed
nut
rient
s us
e ef
ficie
ncie
s (%
)
0
20
40
60
80
100
Mixed Grazing Landless Total
Excr
etio
n N
,P a
nd K
re
cycl
e ra
tes
(%)
a b
c d
Gra
zing
Mix
ed
Land
less
Aver
age
Pigs
Laye
rs
Bro
ilers
Dai
ry
cattl
eO
ther
cattl
e
Shee
p&go
at
Bai et al., unpublished results

Most of N losses via NH3 and discharge of manure
0
2
4
6
8
10
NH3 N2O N2 L&R&E Discharge
Tota
l N lo
sses
(T
g)
Grazing Mixed Landless
0.0
0.5
1.0
1.5
2.0
2.5
L&R&E Discharge
Tota
l P lo
sses
(T
g)
Landless
Mixed
Grazing0.01.02.03.04.05.06.0
L&R&E Discharge
Tota
l K lo
sses
(Tg)
0.0
0.5
1.0
1.5
2.0
2.5
Leaching Discharge
Tota
l P lo
sses
(Tg)
Sheep andgoatBeef
Dairy
Broiler
Layer0
2
4
6
8
10
NH3 N2O N2 NO3- Discharge
Tota
l N lo
sses
(Tg)
Pigs Layers BroilersDairy cattle Other cattle Sheep&goat
0.01.02.03.04.05.06.0
Leaching Discharge
Tota
l K lo
sses
(Tg)
0.0
1.0
2.0
3.0
4.0
5.0
6.0
L&R&E Discharge
Aver
age
P lo
sses
(k
g P.
ha-1
)
0
5
10
15
20
NH3 N2O N2 L&R&E Discharge
Aver
age
N lo
sses
(k
g N
.ha
-1)
0
3
6
9
12
15
L&R&E DischargeAv
erag
e K
loss
es
(kg
K.h
a-1
)NH3 N2O N2
0
2
4
6
8
10
NH3 N2O N2 L&R&E Discharge
Total N
loss
es
(Tg)
Grazing Mixed Landless
0.0
0.5
1.0
1.5
2.0
2.5
L&R&E Discharge
Total P
loss
es
(Tg)
Landless
Mixed
Grazing0.01.02.03.04.05.06.0
L&R&E Discharge
Total K
loss
es(Tg)
0.0
0.5
1.0
1.5
2.0
2.5
Leaching Discharge
Total P
loss
es(Tg)
Sheep andgoatBeef
Dairy
Broiler
Layer0
2
4
6
8
10
NH3 N2O N2 NO3- Discharge
Total N
loss
es(Tg)
Pigs Layers BroilersDairy cattle Other cattle Sheep&goat
0.01.02.03.04.05.06.0
Leaching Discharge
Total K
loss
es(Tg)
0.0
1.0
2.0
3.0
4.0
5.0
6.0
L&R&E DischargeAv
erag
e P loss
es
(kg P.ha
-1)
0
5
10
15
20
NH3 N2O N2 L&R&E Discharge
Averag
e N lo
sses
(kg N.ha
-1)
0
3
6
9
12
15
L&R&E Discharge
Averag
e K lo
sses
(kg K.ha
-1)
NH3 N2O N2Bai et al., unpublished results

Scenarios in 2020Housing&Storage losses
7.7 Tg N
Excretion23.3 Tg N
Housing20.2 Tg N
Storage12.5 Tg N
Treatment5.3 Tg N
Discharge7.2 Tg N
Applied1.1 Tg N
Export3.0 Tg N
Treatment losses1.2 Tg N
Intake27.1 Tg N
Products3.5 Tg N
Dead animals0.3 Tg NN Recycle losses
2.3 Tg N
Drop in the field2.8 Tg N
0
5
10
15
20
25
Excretion N losses N recycled
Nitr
ogen
(Tg) 2010
S0 S0-BAU: Projections by
FAO, all the additional
products supply by
industrial farms
Bai et al., unpublished results

Scenarios in 2020Fertilizer replace rate (FRR)% = (Recycled manure * Fertilizer Value) / Chemical fertilizer * 100%
S0: BAU
S1: Ban discharge of manure
S2: Improve housing and
storage
S3: Improve of manure
application
S4: Combine of S1-S3.
0102030405060708090
100
S0 S1 S2 S3 S4
2010 2020
Che
mic
al fe
rtili
zer r
epla
ce
rate
by
man
ure
(%) N P Ka
0
5
10
15
20
25
S0 S1 S2 S3 S4
2010 2020
Nut
rient
s lo
sses
thro
ugh
the
m
anag
emen
t cha
in (T
g) b
Bai et al., unpublished results

Externalities
Traditional & mixed farming system
Input Output
Strategies 1: The role of animal manure in a farming systems / agro-ecosystems of China
Specialized & intensive farming system
InputOutput
Externalities
Sustainable & integrated Agro-ecosystem
Input
Externalities
Output
-200 1980s 2010sYear
Wastes Resources and pollutersResources
Learn from history

Strategies 2: Strict environmental policy and/or incentives for recycling manure
Crop production:- Crop type - Cropped area - Management
N outputs: milk, meat, egg
Groundwater & surface waters
N inputs:N fertilizer BNF, N deposition
Animal production:- Animal species - Animal number- Management
N outputs: harvested crop
NH4+ NO3
- DON Npart
NH3 N2O NOX N2
NH4+ NO3
- DON Npart
manure
NH3 N2O NOX N2
feed
Atmosphere
Agriculture
Air-related Policies
Water-related Policies
Agricultural Policies
Nature Policies
Oenema et al., 2009
Learn from EU

◄EU27
Fertilizer consumption (source EFMA 2009)
0.0
4.0
8.0
12.0
16.0
20.0
Milli
on to
nnes
N P2O5 K2O
Share of the different N inputs in total N
inputs, EU-27 average 2005-2008
Nutrient inputs of farming systems in EU

0.0
1.0
2.0
3.0
4.0
5.0
6.0
7.0
1950 1960 1970 1980 1990 2000 2010
Pho
spho
rus (T
g)
Mineral P fertilizer
Manure P fertilizer
P excretion
Rapid increasing of chemical fertilizer application changed the role of manure as a resource
Bai et al., 2015. Nutrient Cycling in Agroecosystems
29, 85%
5, 15%
Chemical N fertilizerManure N application
Unit: Tg Ton
2010

Strategies 3: Recycling techniques from the whole manure management chain
RumenDigestive tract
Kidney
Diets
Milk
Feces urine
Intake
Perfermance
Excretionof P, N
Low Pr low P Low Pr medium P
Low Pr high PHigh Pr high P
Digestibility Microbial protein
Rumen fermentation
Blood metabolism
Low protein & P feeding
Slurry acidification
Housing
Negative pressure
composting
N, P removal through struvite
Application
Slurry
Separation
StruviteMgNH4PO4·6H2O
“ Housing-storage” N, P loss
reduction
Struvite techniques to
recycle P
Negative pressure composting exhaust
gas recycling
Closed-lots slurry
injection
NH3 recycle
① ④③②
④
③
②Solid cover
storage
①
Housing Storage Treatment Application

To summeryNUFER model is a functional model helps to understanding nutrient flow through the whole manure management chain;
The current manure N recycle rate was 30% of total excretion, and uneven distributed between grazing, cash crop and cereals crop;
Great part of manure N losses during housing and storage (60% of the total excreted N). This indicated a strong need to improve manure management in these sections
Through integrated options can increase N fertilizer replace rate from 1% in 2010 to 20% in 2020, which is benefit for Zero Fertilizer Increasing Use Plan..
Strategies are to 1) change to role of manure as resources, 2) strict environmental policy and/or incentives for recycling manure, and 3) develop recycling techniques from the whole manure management chain.

Group of COupling of Food, Environmental protection and Resource use (COFER)
Thank you !E-mail: [email protected]
http://sourcedb.sjziam.cas.cn/yw/fy/pr/201407/t20140717_4160140.html