towards inclusion and equality in education? · bibliograpy 38 annexure 40. ... lorella terzi...
TRANSCRIPT

NATIONAL DISABILITY SURVEY IN AFGHANISTAN, 2005
TOWARDS INCLUSION AND EQUALITY IN EDUCATION?
FROM ASSUMPTIONS TO FACTS
Islamic Republic of Afghanistan
The National Disability Survey in Afghanistan was carried out in 2005. It is the fi rst such study that covered the entire territory. Based on the International Classifi cation of Functioning, Disability and Health of the World Health Organization, and the Capabilities Approach of Amartya Sen, the NDSA aims to provide insights into the living conditions, needs and hopes of Afghans with disability and their families. This document describes the situation of people with disability with regards to education: access, literacy, completion and dropout, as well as the perception of education value. A large majority of Afghans consider education useful; however school remains inaccessible for part of the population, mainly girls and even more so for girls with disability. Inaccessibility of school is not only due to diffi culty regarding physical access, but is more widely related to the prejudices from the community, from parents of children without disability, as well as lack of awareness and training of teachers. Mainstreaming children with disability systematically within the education system will require the overcoming of age-old beliefs and deep-rooted practices. This report hopes to contribute to fi nding the ways to achieve this.
United NationsEuropean Union
TOWARDS INCLUSION AND EQUALITY IN EDUCATION?
NATIONAL DISABILITY SURVEY IN AFGHANISTAN 2005


iIntroduction
TOWARDS INCLUSION AND
EQUALITY IN EDUCATION?
NATIONAL DISABILITY SURVEY IN AFGHANISTAN 2005
FROM ASSUMPTIONS TO FACTS
United NationsEuropean Union
Islamic Republic of Afghanistan

© Handicap International 2006
ISBN : 2-909064-75-1 AuthorsParul Bakhshi, [email protected]çois Trani, [email protected] Editing, design and printingNew Concept Information Systems Pvt. Ltd.New Delhi, India Published by Handicap International 14, Avenue Berthelot 69361 Lyon Cedex 07, France Tel +33 (0) 4 78 69 79 79 Fax +33 (0) 4 78 69 79 94 email: [email protected] www.handicap-international.org Photographs Handicap International Afghanistan Programme House No. 133 Qala-e-Fatullah, 5th street, Kabul, Afghanistan

Contents
Acknowledgements vi
Abbreviations vii
Preface viii
Introduction ix
Education and Disability Education and Disability in Formal Structures 1
Quality Education Process 2
Gender, Disability and Education 3
Education for Adults 4
Findings from Previous Surveys and Studies in Afghanistan 4
Overview of the Education Module Definitions 7
Obtaining the NDSA Data Regarding Education 8
Challenges and Limitations 9
Education of Afghans with Disability: Reasons for Concern? Comparing Various Household Surveys 11
Access to Education: the First Hurdle 12
Conclusions Regarding Access 24
Literacy-Transition-Completion: is Education Efficient for Afghans with Disability? 25
Conclusions and Recommendations Regarding Efficiency of Education 34
Challenges Ahead to Achieve Quality and Equality in Education Reduce Gaps between the Six Main Cities and the Rest of the Country 35
Focusing on the Quality, Relevance and Efficiency of Education 36
Girls with Disability: a Dual Challenge 36
Different Types of Disability, Different Access 36
Mainstreaming Disability: the Effective Way to Reduce Inequality in Education 37
Bibliograpy 38
Annexure 40

iv Towards Inclusion and Equality in Education?
List of TablesTable 1 : Education for Children between Ages of 7 and 14: Comparing Various
Household Surveys 11
Table 2 : Literacy Rates: Comparing Various Household Surveys 12
Table 3 : Access to Education according to Age Groups, Age of Disability and Urban/Regional Centres Compared to the Rest of the Country 20
Table 4 : Main Reasons for Lack of Access to Education according to Age Categories 20
Table 5 : Main Reasons for Lack of Access to Education for Males according to Age Categories 21
Table 6 : Main Reasons for Lack of Access to Education for Females according to Age Categories 21
Table 7 : Access to Education according to Different Types of School 40
Table 8 : Access to Education according to Age 40
Table 9 : Access to Education according to Age of Disability and Gender 41
Table 10 : Access to Education according to Age of Disability, Gender and Age Categories 41
Table 11 : Access to Education according to Gender and Type of Disability for Persons Aged 7 to 14 41
Table 12 : Access to Education according to Urban and Rural Areas 42
Table 13 : Access to Education according to Gender Differences in Urban and Rural Areas 42
Table 14 : Access to Education according to Age of Disability and Geographical Area 42
Table 15 : Access to Education according to Age of Disability, Gender and Geographical Area 43
Table 16 : Access to Education of Children with Disability and Non-Disabled Children Aged 7 to 17 according to the Level of Education of the Head of Household 43
Table 17 : Access to Education of Children with Disability and Non-Disabled Children Aged 7 to 17 according to the Level of Wealth of the Household Measured by Ownership of TV or Car, Animals and Land 44
Table 18 : Literacy Rates according to Gender for Persons Above Age 8 44
Table 19 : Literacy Rates according to Age of Disability and Type of School 45
Table 20 : Literacy Rates according to Age of Disability and Gender for Persons Who Accessed Public School 45
Table 21 : Literacy Rates according to Gender and Types of Disability for Persons Age Above 9 45
Table 22 : Literacy Rates for Urban/Rural Settings and Types of Disability for Persons Age Above 9 46
Table 23 : Attendance Rates according to Gender for Persons Aged 7 to 18 46
Table 24 : Attendance Rates according to Gender and Ages Groups for Persons Aged 7 to 18 46
Table 25 : Attendance Rates according to Age of Disability 47
Table 26 : Attendance Rates according to Types of Disability 47
Table 27 : Dropout According to Age of Disability for Persons Age Above 23 47
Table 28 : Dropout and Completion according to Type of Disability 48
Table 29 : Reason for Dropout for People who became Disabled Before Age 18 and After Age 18 and Non-Disabled 48
Table 30 : Why Education is Useful 49
Table 31 : Reasons that Prevent Persons Age Above 5 from Going (Back) to School (for Fig 27) 49
List of FiguresFigure 1 : Access to Education according to Different Types of Schools 12
Figure 2 : Access to Education according to Age 13
Figure 3 : Access to Education according to Age of Disability and Gender 13
Figure 4 : Access to Education according to Age of Disability, Gender and Age Categories 14
Figure 5 : Gap in Access to School according to Gender and Type of Disability for Persons Aged 7 to 14 15
Figure 6 : Access to Education according to Urban and Rural Areas 16
Figure 7 : Access to Education according to Gender Differences in Urban and Rural Areas 16
Figure 8 : Differences in Access to School according to Age of Disability and Major Geographical Areas 17
Figure 9 : Access to Education according to Age of Disability, Gender and Major Geographical Area 18
Figure 10 : Rate of Access to School by Province (trends) for all Persons Age Above 7 19
Figure 11 : Rate of Access to School by Province (trends) for Persons with Disability Aged Above 7 19
Figure 12 : Access to Education for Children Aged 7 to 17 and Level of Education of the Head of Household 23
Figure 13 : Access to Education for Children Aged 7 to 17, and Level of Wealth of the Household Assessed by Ownership of TV/Car and Ownership of Livestock/Land 23
Figure 14 : Literacy Rates according to Gender for Persons Age Above 8 25
Figure 15 : Literacy Rates according to Age of Disability and Type of Education received 26
Figure 16 : Literacy Rates according to Age of Disability and Gender for Persons who Accessed Public School 26
Figure 17 : Literacy Rates according to Type of Disability and Gender for All Ages Above 9 27
Figure 18 : Literacy Rates according to Type of Disability and Rural/Urban Settings for Persons Aged Above 9 27
Figure 19 : Attendance Rates by Sex for Persons with Disability and Non-Disabled Aged 7 to 18 28
Figure 20 : Attendance Rates by Sex and Age Groups for Persons with Disability and Non-Disabled 29
Figure 21 : Retention, Transition and Completion Rates for Persons having Accessed Education according to Age of Disability 30
Figure 22 : Retention, Transition and Completion Rates according to Different Types of Disability 30
Figure 23 : Dropout according to Age of Disability for Persons Age Above 23 31
Figure 24 : Dropout and Completion according to Type of Disability 31
Figure 25 : Reasons Identified for Dropping out of School 32
Figure 26 : Reasons Why Education is Considered Useful 33
Figure 27 : Reasons that Prevent Persons from Returning to School 33
Figure 28 : Summary of the Findings Regarding Persons Under the Age of 26 35
vContents

vi Towards Inclusion and Equality in Education?
Acknowledgements
We would like to thank the following people for their precious contribution to this project:
Firoz Ali Alizada (HI)Elena M. Andresen (University of Florida)Parween Azimi (NPAD)Tania Burchardt (London School of Economics)Alberto Cairo (ICRC)Heather Dawson (HI)Fiona Gall (SGAA)Thierry Gontier (STEP Consulting)Gulbadan Habibi (consultant for AREU)Elias Hameedi (Afghan Human Rights Commission)Susan Helseth (UNICEF)Chris Lang (NPAD)Ashraf Mashkoor (MoPH, HMIS)Sue MacKey (HI)Cécile Rolland (HI)Arnault Serra Horguelin (UNAMA)Lorella Terzi (University of London)Frederic Tissot (French Embassy)Peter Ventevogel (Health Net International)
Johns Hopkins Bloomberg School of Public Health Gilbert Burhnam,Ayan Ahmed NoorLakwinder P Singh Non Governmental Organisations Afghan National Association for the DeafAide Médicale InternationaleAfghan Research and Evaluation Unit
AgroactionCommunity Centre for DisabledCHA, Coordination of Humanitarian AssistanceHandicap International BelgiumHealthnet International IAM, International Assistance MissionICRC, International Committee of the Red CrossINTERSOS Humanitarian Aid OrganizationMADERA National Afghan Disabled Women AssociationNational Association for Disabled of AfghanistanNational Disability UnionNational Programme for Action on Disability People in NeedSandy Gall’s Afghanistan AppealSERVE, Serving Emergency Relief and Vocational EnterprisesSwedish Committee of AfghanistanUNICEFWorld Bank, Disability Unit
A special thanks to the Monitor and Master Trainers, the 200 surveyors without whom this survey would never have been carried out and to the 5250 families who accept to answer our questions.
NDSA team consists of Jean François Trani, NDSA Manager. Parul Bakhshi, Consultant. Layla Lavasani, Regional Manager. Steffen Schwarz, Regional Manager. Jean-Luc Dubois, Scientific Advisor. Dominique Lopez, Statistics Advisor.
The Government of AfghanistanMinistry of Martyrs and Disabled and Social AffairsMinistry of Public Health Central Statistics Office

Abbreviations
AFAs : Afghanis
CI : Confidence Interval
CSO : Central Statistics Office
DPO : Disabled Persons Organisation
EFA : Education For All
GMR : Global Monitoring Report
GoA : Government of Afghanistan
HDR : Human Development Report
Hrs : Hours
ICF : International Classification of Functioning, Disability and Health
IDPs : Internally Displaced Persons
IED : Improvised Explosive Device
ILO : International Labour Organization
MDGs : Millennium Development Goals
MICS : Multi Indicators Cluster Survey
Mins : Minutes
MMDSA : Ministry of Martyrs and Disabled and Social Affairs
MoE : Ministry of Education
MoWA : Ministry of Women’s Affairs
MoPH : Ministry of Public Health
ND : Non-Disabled
NDSA : National Disability Survey in Afghanistan
NGO : Non-Governmental Organisation
NER : Net Enrolment Ratio
NRVA : National Risk and Vulnerability Assessment
MTM : Master Trainer Monitor
NHSPA : National Health Services Performance Assessment
NPAD : National Policy for Actions on Disability
PPS : Probability Proportional to Size
PwD : Person with Disability
RTM : Regional Team Manager
SEN : Special Education Needs
UN : United Nations
UNDP : United Nations Development Programme
UNICEF : United Nations Children’s Fund
UXO : Unexploded Ordnance
WFP : World Food Programme
WHO : World Health Organization
viiAbbreviations

viii Towards Inclusion and Equality in Education?
Preface
Afghanistan is now at a time in its history where crucial choices need to be made. It is a time when we need to look at the lessons learnt from an often violent history and to define the shape that we want to give to the future. Although there is undeniable consensus over the importance of the role of education in designing the Afghanistan of tomorrow, the precise components that this role comprises of, are still a matter of discussion. However, the need to conciliate cultural values and adapt to a rapidly changing world, the need to embrace our past and improve our future have become very clear.
But before taking the steps that will take us to tomorrow, we also must ensure that no Afghan lags behind or is at the risk of being forgotten in the tremendous efforts being made at this very decisive period. Education must be for all Afghans. This means that the basis for a cohesive, compassionate and peaceful society is laid out at the very early stages of learning. Schools around the country need to be accessible, in physical terms but also socially; they must be sensitive and effective. The teaching–learning process needs to be of quality in order to build a solid foundation for the future generations of the country. All this cannot be achieved if vulnerable children are left out, or left behind.
The report on the education of persons with disability in Afghanistan presenting the results of the NDSA focuses specifically on the children with disability who are currently of school-going age. It sheds light on the difficulty in access, especially of girls with disability. It also looks at completion of education cycles for all children. Some results are promising; others give an idea of the considerable challenge that lies ahead. Quality education in Afghanistan can only become a reality if the learning process is made sensitive to the needs of children with disability at each and every step. Inclusion of children with various disabilities, wherever and whenever possible is the best way to promote education for all children. This does however mean tailoring the education system, training the teachers and facilitating access to schools. This also means working with the community to ensure that they are convinced of the importance of sending children, and especially girls with disability to school.
I sincerely believe that the conclusions and findings presented in this report provide precious knowledge in order to better understand how our resources can be used most efficiently for education of children with disability. I would like to congratulate the Ministry of Martyrs and Disabled and Social Affairs, as well as Handicap International Team for carrying out the National Disability Survey in Afghanistan. I hope close cooperation between Handicap International and the ministry of Education will work towards improving the lives of Afghans with disability.
Thierry Hergault Country Director
Handicap InternationalAfghanistan Programme

ixIntroduction
Introduction
1 MINISTRY OF EDUCATION (2004), National Report on the Development of Education in Afghanistan, 10 August 2004, Kabul, p. 17, section 2.2.
The elaboration of the tools and methodologies as well as the fieldwork for the National Disability Survey in Afghanistan (NDSA) was carried out between April 2004 and September 2005. This project was conducted by Handicap International, in close collaboration with the Ministry of Public Health (MoPH), the Ministry of Martyrs and Disabled and Social Affairs (MMDSA), and the Central Statistics Office (CSO) under the Ministry of Economics, in partnership with the Johns Hopkins Bloomberg School of Public Health in Baltimore, Maryland, USA.
The NDSA is a household survey that covered all 34 provinces of Afghanistan and surveyed 5130 households comprising 38,320 people. The survey was carried out in very hazardous security conditions and with considerable time constraints. However, the need to provide evidence-based information regarding persons with disability was essential in a context where crucial policy decisions were being taken. Basic knowledge and understanding of who the most vulnerable persons are was a prerequisite to defining priorities and designing efficient programmes for poverty reduction. As a result, the main goal of the NDSA was to provide relevant information regarding the living conditions of Afghans with disability, as well as help better understand their positions, functions and general role within the family, the community, and society. At the macro level the NDSA results provide: Information concerning the percentage of the Afghan population which represents persons with
disability; A general typology concerning this population in terms of the types of disability, means and level of
income, etc.; Knowledge about the services that are actually available to persons with disability, as well as the
difficulties they face to access these.
This report is the second volume in a series of documents that have been released regarding the results of the NDSA. It presents findings regarding education for persons with disability in the country. More specifically, it provides general profiles with regard to the situation of children with disability, and, to a lesser extent, that of adults. This report also gives interesting insights into the differences in educational opportunities according to the gender and age at which persons became disabled as well as urban–rural breakdowns.
This information can provide valuable support to the Afghan Ministry of Education which clearly states1 the extent of issues faced regarding the educational needs of children with disability:
“(…) The Ministry of Education should continuously adapt its educational system to the needs of school children including the handicaps. Some will need special facilities and special education on the basis of their needs and the Ministry of Education has the responsibility in accordance with the Constitution to take appropriate actions to this effect. This makes education expensive and friendly countries and organisations are invited to support the Ministry of Education with technical and financial support

x Towards Inclusion and Equality in Education?
for study and research, curriculum development and teacher education and needed facilities in this particular domain”.
To reach this objective of inclusion of children with disability adopted by the Ministry of Education, several difficulties must be addressed: accessibility, sensitisation of teachers, children and parents of students... Decisions will have to be taken regarding choices to be made. For instance, the question of whether to focus resources and efforts only on inclusive education for boys and girls with disability, or to also tackle the problem of special education are discussed in this report. Some suggestions are also made for a successful approach to fulfilling the national objective of “quality education for all, regardless of gender, ethnicity, language, religion or geographical ethnicity, language, religion or geographical location2” particularly for primary education.
Yet, since 2002, a considerable and historical effort has been made for educational provisions for disabled Afghans. The number of students has increased from 774,000 to 4,500,000 and 3000 schools have been rebuilt. Concurrently, 1,692 community-based schools for 76,998 out of school children have been established3.
To pursue and increase the current effort by mainstreaming children with disability, new steps forward will have to be taken. Precise knowledge is the first one in order to ensure that the necessary measures are taken to include persons with disability in the education process.
2 MINISTRY OF EDUCATION, PLANNING DEPARTMENT (2005), “Conducted Activity for EFA in Afghanistan” Prepared for EFA National Coordinators Meeting, 24-29 October 2005. Also see MINISTRY OF EDUCATION (2006), “National Strategic Plan for Education”, draft December 2006, Kabul. 3 MINISTRY OF EDUCATION, PLANNING DEPARTMENT (2005), op. cit.

1Education and Disability
There has been widespread debate regarding how to view education for persons with disability in general. At the initial stages of this worldwide discussion, the belief that special structures were the only solution was strong. For long, education for persons with disability was not always a major concern of governments and decisions-makers. However, over the last decades, a number of international frameworks have stressed and re-emphasised the right to Education For All (EFA). Moreover, experience has proved in a number of countries the limitations of ‘segregated’ systems for education based on structures where disabled children and young persons are often isolated and have very little contact with society.
Education most often refers to formal structures (schools within the public and private sectors). Increasingly it also refers to non-formal education structures such as community learning and vocational training. In the case of adults, functional literacy and lifelong learning have been effective tools in increasing opportunities for persons with disability in certain cases. Access and completion of education cycles by vulnerable groups in general, and persons with disability in particular, is a growing concern for governments. There is agreement among decision-makers that the needs of vulnerable groups require to be adequately addressed, but good intentions are often impeded by a knowledge gap regarding the specific profiles of persons with disability as well as their living conditions and requirements.
The following section briefly presents:• Some educational theories which have impacted the educational process of children with disability;• A few essential components of the educational process;• The main characteristics of the educational situation of persons with disability, the needs of girls with
disability and the specific requirements of disabled adults.
Education and Disability in Formal Structures4
There are number of issues that arise when considering education for persons with disability. One of the main challenges is the definition of disability itself, which may or may not include a wide array of impairments and conditions, ranging from the mild to the very severe. In addition, different types of disability have very different needs and requirements in terms of access to education as well as the quality of education delivered. Over the years, these considerations have been included in a number of frameworks, theories and definitions. A few of these have been listed and explained here.
Education for persons with disability has evolved along with the definition of disability as well as that the definition of education during the previous decades. For long, Special Education Needs (SEN) has been a major framework within which educational programmes for persons with disability were conceived and defined. This view was based on the belief that persons with disability, especially children, had very precise needs and that special educators and teachers needed to address these exclusively. This view most often led to the setting up of specialised structures. However, experience, in various countries has shown certain limitations of these separate structures for children with disability:• These structures are costly. Limited resources in many developing and transition countries make
their cost prohibitive and unsustainable in the long term, since they are continually dependent on the allocation of budgets and donor’s decisions and priorities.
Education and Disability
4 Here formal structures refer to schools, state run as well as private.

2 Towards Inclusion and Equality in Education?
• As priorities of decisions-makers change and other priorities are defined, specialised structures are the first to shut down when education policies and programmes are faced with cost-cutting measures.
• These structures are dependent on the number of persons with disability in a given area, as well as for a type of disability. This often leads to the denial of the right to education of children with disability, if the number of students is considered insufficient to justify the support to such structures, especially in a context where resources are limited.
• Such structures assume that disability is a ‘state’ that is permanent and does not account for the dynamics between the individual and society. As a result, there are practically no bridges between these structures and formal systems that could enable a child to make a transition as and when he/she can.
• Finally, these structures do not promote social coherence and do not contribute to fighting stigma and discrimination. On the contrary, they maintain the belief that children with disability should be kept away from the mainstream. As a result, social responsibility and awareness are not strengthened.
Inclusive education, which is promoted by a number of educational frameworks and programmes, is based on the belief that the integration of children with disability within existing structures is the means to achieving socially sustainable development and improving living conditions for vulnerable groups in the long term. Inclusive education is a major part of the Education For All (EFA)5 framework, which re-establishes education as a fundamental right and recognises the role of education ‘as a means to develop human capital, to improve economic performance, and to enhance people’s capabilities and choices’.6 Inclusive education, by definition is in opposition to exclusion and segregation of persons with disability and constitutes ‘a dynamic approach of responding positively to pupil diversity and of seeing individual differences not as problems, but as opportunities for enriching learning7.
Mainstreaming, as the term indicates, refers to bringing persons with disability into structures and services that are set up for societies and communities as a whole. This term, which has very often been used for referring to gender issues, is increasingly used with regard to other vulnerable groups. The main impetus behind mainstreaming, apart from the financial considerations, is that education should be aimed at encouraging children and youth with disability to learn together, alongside the non-disabled. Of course, this does not mean ignoring special needs of children with specific disabilities, especially mental and intellectual forms of disability. But the belief that special needs can be addressed within the existing structures through well-adapted measures (teacher training, for example) is widely accepted by experts. This contributes to ensuring the stability and sustainability of structures and programmes over time. ‘Within education, countries are increasingly realising the inefficiency of multiple systems of administration, organisational structures and services and the financially unrealistic options of special schools.’8 These views, although widely accepted and validated by experts and international frameworks, often take second stage at the implementation level. This is widely due to a lack of prioritisation, which is often linked to a knowledge gap regarding needs and aspirations of persons with disability, as well as a lack of realistic recommendations on how to achieve mainstreaming in education.
Quality Education Process Another notion that had gained importance within the education sector in recent years is quality education. More than just a theory, “quality (education) has become a dynamic concept that has constantly to adapt to a world whose societies are undergoing profound social and economic transformation. Encouragement for
5 This is stated in the Universal Declaration of Human Rights (1948), at the 1990 World Conference on Education For All held in Jomtien, Thailand and a decade later at the World Education Forum, Dakar, Senegal in 2000.6 7 UNESCO (2005) Contributing to a more Sustainable Future: Quality Education, Life Skills and Education for Sustainable Development, ED/PEQ/IQL/2005/PI/H/2, Paris. 8 PETERS. S. J. (2003) Report Inclusive Education: Achieving Education For All by Including those with Disabilities and Special Education Needs,” PH.D, Prepared for the Disability Group, The World Bank, 30 April 2003, (p.5).
3Education and Disability
future-oriented thinking and anticipation is gaining importance. Old notions of quality are no longer enough. Despite the different contexts there are many common elements in the pursuit of a quality education, which should equip all people, women and men, to be fully participating members of their own communities and also citizens of the world.9
The Convention on the Rights of the Child (1989) states that the education of the child should be directed towards “the development of the child’s personality, talents and mental and physical abilities to their fullest potential”. Education today claims not only to contribute to equipping people with the basic and minimal survival and income-generation skills, but also to enhancing abilities to reduce their vulnerability to risk and increase their potentiality in order to fight poverty in the long term. In order to achieve these objectives, education cannot merely be limited to access and completion, but has to look at content, delivery and quality. For this reason, any type of education needs to look at the development of individuals, their ability to think and reason, build self-respect as well as respect for others, be forward thinking and plan for their future. Within this perspective, quality education is based on the four pillars of education.10
• Learning to know: understanding the world (critical thinking skills, problem solving skills, decision-making skills, etc.).
• Learning to be: autonomy and judgment, personal responsibility for our collective destiny (skills for internal focus of control, Skills for managing stress, Skills for managing feelings, etc.).
• Learning to live together: participation of the learner in the wider environment (communication skills, Negotiation skills, Refusal skills, Assertiveness skills, Interpersonal skills, Cooperation skills, Empathy skills, etc.).
• Learning to do: turning knowledge and understanding into useful action (the manual skills needed to carry out the desired behaviour).
These four pillars of quality education need to be present throughout the various components and elements that constitute the education process: the learning contents and environment, the training and sensitisation of teachers, the relevance of policies and programmes and a monitoring of outcomes on a regular basis.
In a country like Afghanistan, these goals may still seem very far off. However, the first step towards achieving quality education remains ‘seeking out the learner’. For children with disability, this first step is of crucial importance, especially when they are faced with stigma and discrimination. A number of children with disability are hidden, and have no access to education, be it physical access or overcoming the social, cultural and religious beliefs and practices. The results presented in this report help answer some of the questions with regard to who and where these children and youth are, and the reasons that prevent them from having access to education.
Gender, Disability and EducationIn Afghanistan, gender roles are powerfully related to culture, customs, tradition and society; gender relations are what the social fabric is based on. Some studies have given an insight to the factors that define gender dynamics in this country. Although the gender factor is omnipresent throughout all the reports and analyses of the NDSA, it takes on utmost relevance when it comes to education. In a traditional society, affected by years of conflict, women with disability have to deal with the consequences of being female and being disabled. In this post-conflict phase, characterised by poverty, insecurity and political instability, there is a radicalisation of attitudes towards women.
When looking at education for girls and women with disability, the picture is always a complex one. A number of studies have shown the clear educational disadvantage that girls face, in developing countries in particular.
9 UNESCO (2005), Op. Cit.10 UNESCO (1996), “Learning The Treasure Within,” Report to UNESCO of the International Commission on Education for the Twenty-first Century, The Delors Commission, Paris.

4 Towards Inclusion and Equality in Education?
At a time when the focus is being placed on girls’ education, it is essential to ensure that all girls are getting access to the services that exist. The real risk then would be girls with disability getting left behind once more, this time because they are disabled.
Education for AdultsEducation policies and programmes focus primarily on children of school-going age and who can be integrated into the formal school system. For adults who are considered by the community and who often consider themselves as too old to go back to school, education takes on a different meaning.
The first major difference is that education for adults is mainly addressed by non-formal structures and non-governmental organisations (NGOs). This is partly because adults require a great deal of adaptability of methods, timings and teachers, they need to see a clear relevance to their everyday survival needs, particularly in developing and transition countries as well as cost-effective (free) access to these services. Any focus on education of (young) adults has to be in relation with income-generation activities that can be effective in the short and medium term.
For these reasons, very few programmes look at (quality) education for adults but focus on literacy skills as well as vocational training and income generation. Initiatives for adults talk about ‘functional’ literacy or reading skills applied to everyday lives of persons. Recently the importance of lifelong learning has also been stressed. But the question that remains within developing and transition countries that lack a stable state structure for adult education, how feasible is it to implement quality education programmes and lifelong learning? The situation is even more complex with regard to adults with disability who have often received limited or no education during their lives.
The belief that education for adults with disability will happen in the non-formal and non-governmental sector is not completely validated. If the government is to promote the inclusion of persons with disability in employment of civil servants for instance, then it will have to set up structures for training these persons. However, the reality is that the majority of programmes in this field that are addressing education of adults with disability are done through the informal sectors and with organisations that are working specifically with persons with disability. Disability concerns, unlike gender considerations, are not systematically ‘mainstreamed’ in these informal structures. This again is linked to a gap in knowledge about how to proceed and what needs to be done.
Findings from Previous Surveys and Studies in AfghanistanThe studies and surveys that exist in Afghanistan regarding the situation of persons with disability fall under two main categories. The first category consists of the national large-scale surveys, which look at the lives of Afghans in general and have a short set of questions with regard to disability and education. The second category includes a wide range of small-scale qualitative studies including case studies that provide precious insights into the lives of persons with disability in a given context and with a specific focus. The latter are most often carried out by local and international organisations and respond to specific programme needs. Very few studies try to provide the necessary links between education and disability which would help in the understanding of the underlying reasons behind the disparities observed.
The large-scale surveysThe two national scale household surveys that have been carried out in Afghanistan in 2003 are the Multiple Indicator Cluster Survey (MICS), and the National Risk and Vulnerability Assessment (NRVA). The findings of these can be found in two reports:• CENTRAL STATISTICS OFFICE (Afghanistan Transitional Authority) and UNICEF (2003), Moving beyond
two decades of war: Progress of provinces, Multiple Indicator Cluster Survey, Afghanistan.• WFP, APEP, USAID, SAVE THE CHILDREN (2005), Results and Discussion of Education Data collected in
Afghanistan, National Risk and Vulnerability Assessment 2003, draft April 2005.

5Education and Disability
Multiple Indicator Cluster Survey (MICS)
In the MICS the section on Disability and Impairment focuses on children with ‘Hearing/Vision’ impairment, ‘Hand/Leg’ disability, and ‘Speaking’ or ‘Mental’ retardation among 1 to 5 year olds and among 7 to 17 year olds.
This survey looks at two types of indicators with regard to disability:• Prevalence of Disability/Impairment among Children (both sexes);• Vitamin-A not given (6 months – 5 year olds) both sexes: proportion of children who did not receive
vitamin-A within last 6 months of interview among this age group.
With regard to education the report mainly presents:• Literacy Rate for persons over 15 years of age, the proportion of persons who can at least read or write
in their own language.• Proportion of children 7–13 years of age, who are not registered in school.
National Risk and Vulnerability Assessment (NRVA)
The education section of this survey focuses on three main domains:• Enrolment;• Access;• Literacy.
Results are presented with specific breakdowns for gender and urban–rural breakdowns for all indicators. In the present report on the findings of the NDSA, results will be systematically compared with these studies wherever possible. The results of the NDSA, focusing specifically on the situation of persons with disability, look at the specific situation of persons with disability pertaining to education, with specific focus on girls with disability in urban and rural settings, regional differences, etc.
Small-scale and/or Qualitative studiesA number of studies have specifically looked at the situation of persons with disability in Afghanistan and have presented some findings regarding education. However, these studies are limited to a region, or even city, and do not look at education for persons with disability at the national level.
Centre for Disease Control and Prevention: Focusing on Mental Health
A specific study on Mental Health, Social Functioning, and Disability in Post-war Afghanistan was carried out by the Centre of Disease Control and Prevention (CDC) in 2002, to “provide national estimates of mental health status of the disabled (any restriction or lack of ability to perform an activity in the manner considered normal for a human being) and non-disabled Afghan population aged at least 15 years”. Although the focus of this study is not on education, it briefly looks at the level achieved in primary, secondary and higher education for the sample of 799 respondents.
Altai Consulting for UNICEF (UNDP/NPAD): Afghan Perceptions on Disability
This study was carried out as ‘a research project on the perceptions and practices regarding disability in Afghanistan, to inform a communication strategy’ in the country. As a result it focuses on lay beliefs and stereotypes that are at the basis of prejudice and sometimes discrimination of certain categories of persons with disability. This formative research mainly used case studies and focus group discussions to gather data.
6 Towards Inclusion and Equality in Education?
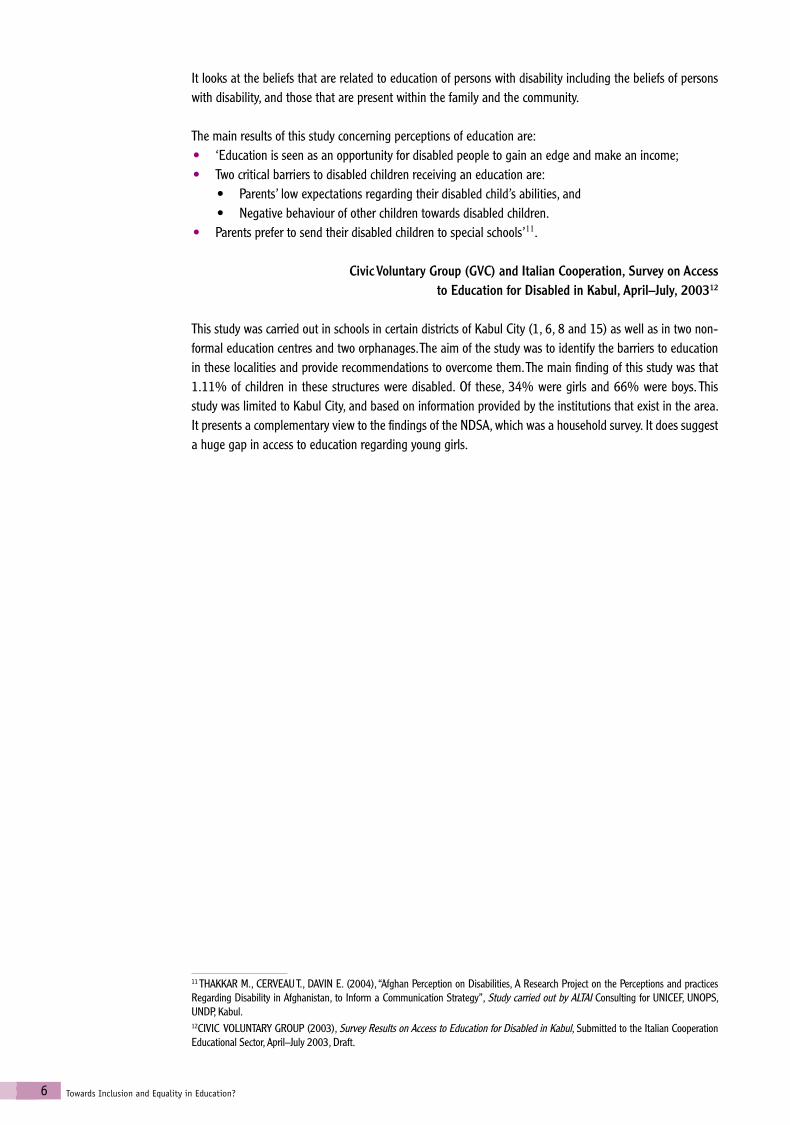
It looks at the beliefs that are related to education of persons with disability including the beliefs of persons with disability, and those that are present within the family and the community.
The main results of this study concerning perceptions of education are:• ‘Education is seen as an opportunity for disabled people to gain an edge and make an income;• Two critical barriers to disabled children receiving an education are:
• Parents’ low expectations regarding their disabled child’s abilities, and • Negative behaviour of other children towards disabled children.
• Parents prefer to send their disabled children to special schools’11.
Civic Voluntary Group (GVC) and Italian Cooperation, Survey on Access to Education for Disabled in Kabul, April–July, 200312
This study was carried out in schools in certain districts of Kabul City (1, 6, 8 and 15) as well as in two non-formal education centres and two orphanages. The aim of the study was to identify the barriers to education in these localities and provide recommendations to overcome them. The main finding of this study was that 1.11% of children in these structures were disabled. Of these, 34% were girls and 66% were boys. This study was limited to Kabul City, and based on information provided by the institutions that exist in the area. It presents a complementary view to the findings of the NDSA, which was a household survey. It does suggest a huge gap in access to education regarding young girls.
11 THAKKAR M., CERVEAU T., DAVIN E. (2004), “Afghan Perception on Disabilities, A Research Project on the Perceptions and practices Regarding Disability in Afghanistan, to Inform a Communication Strategy”, Study carried out by ALTAI Consulting for UNICEF, UNOPS, UNDP, Kabul. 12CIVIC VOLUNTARY GROUP (2003), Survey Results on Access to Education for Disabled in Kabul, Submitted to the Italian Cooperation Educational Sector, April–July 2003, Draft.

7Overview of the Education Module
Information concerning education of persons with disability in Afghanistan is obtained through a set of indicators. The findings are presented according to the key aspects of (formal) education: access, retention, transition and completion. This section of the report details what the different rates represent. It is important to clarify certain definitions that are used throughout this document, as well as to explain in what way the data regarding education was gathered. Finally, some of the challenges and limitations of the data obtained in the field are presented.
DefinitionsThe NDSA focuses mainly on education within the formal sector, including both public and private schools. The survey questions also look at informal and religious schooling, but to a lesser extent. This is in line with one of the main objectives of the survey, providing knowledge that will help define political guidelines and policies. Moreover, the large majority of persons who have access to education attend the formal schooling system.
Literacy, in its most basic definition, refers to the ability to read and write. “The most common understanding of literacy is that it is a set of tangible skills — particularly the cognitive skills of reading and writing — that are independent of the context in which they are acquired and the background of the person who acquires them.”13 However, there is debate worldwide over what the term ‘literacy’ should encompass. As a result, literacy can be considered as a set of skills, or can refer to the effective use of these skills within everyday life. With this latter aspect in mind, the term ‘functional literacy’ was also coined by experts within this domain: “a person is functionally literate who can engage in all those activities in which literacy is required for effective functioning of his group and community and also for enabling him to continue to use reading, writing and calculation for his own and the community’s development… Therefore, ‘literacy’ refers to a context-bound continuum of reading, writing and numeracy skills, acquired and developed through processes of learning and application, in schools and in other settings appropriate to youth and adults.”14 For the NDSA, literacy was understood in its basic definition: the ability to read and write a simple message in a person’s native language.
Literacy rate is the proportion of persons who are literate. However, in different countries, the means of assessing literacy vary from self-reporting to merely writing your own name. This often results in overestimations of the literacy rates and a lack of consensus. Bearing this in mind, the latest “Education for All Global Monitoring Report 2006: Literacy for Life” states that the global literacy rate is 81.9% (76.4% for developing countries and over 98% for developed and transition countries)15. The literacy rates for the NDSA, as in other surveys carried out in Afghanistan, are based on household data. All interviewees who were over the age of eight were asked whether they knew how to read and write. The response of the interviewee was taken down. If the answer was ‘Yes’, then he/she was asked to write a short sentence that was presented by the surveyor. If the interviewee was able to write the sentences without much hesitation and completely, he/she was considered to be literate by the surveyor.
Access to education represents access to some form of schooling, even if it is for a very limited period. The aim of this is to see whether persons have or had access to some education. This is
Overview of the Education Module
13 UNESCO (2006), EFA Global Monitoring Report, p. 149.14 UNESCO (2006), op. cit., p. 30.15 There is no data for Afghanistan regarding these rates in the Global Monitoring Report (GMR) 2006.
8 Towards Inclusion and Equality in Education?
different from the Net Enrolment Ratio (NER), which is the number of children who are enrolled in school as a proportion of the number of children in a particular group. For the NRVA and the MICS, for example, the NER for primary education would be calculated based on the total population of children between the ages of 7 and 13. The NDSA looks at the access, which encompasses not just the children enrolled in school but also those who were enrolled but dropped out. Access is thus calculated for the various age groups.
Primary Education refers to Classes (or Grades) one to five. Secondary Education refers to classes six to twelve. Tertiary Education is a term that is also used for Higher Education. For the NDSA the latter term was used, which seems to be more widely used and understood. Reference to any form of ‘university’ education or training is considered Higher Education.
Retention rates refer mainly to primary education. Here again, there is discussion regarding what should be considered as retention. Some countries consider the proportion of children who have access to the first year of primary education and who are still in school during the last year of primary education to estimate retention. Other countries require completion of primary school as a criterion for determining the retention. For the NDSA, the first definition of retention rates that was selected as data was based on the household level and reported information. The retention rates are thus based on the last grade of primary education.
Transition rates are calculated at two different levels. Basic transition to and participation in secondary education refer to the proportion of persons who completed primary school and have accessed secondary education. Higher transition rates refer to the proportion of persons who complete secondary education and access higher education. Worldwide indicators today show that transition rates globally tend to be high; the implication being that once a person finishes primary education there is a very high probability of his/her going to secondary school wherever these exist.
Completion rates, as the term indicates, refer to the completion of a cycle of education, be it primary, secondary or higher education. With household data and in the context of Afghanistan, it is difficult to get verifiable data regarding completion. For the NDSA, access to higher levels of education was considered as completion for primary education. Thus any person who reached Class 7 was considered to have finished primary education. For secondary education, calculating completion based on household data is even more complex as there is a very small proportion of persons that goes on to higher education in Afghanistan. There are only a few universities in the country and one polytechnic school. Therefore, the NDSA presents the proportion of individuals who reached Class 12 as completing secondary education.
Interruption of studies is important information with regard to the recent history of Afghanistan. This indicator also helps access the flexibility of the education system to re-integrate persons who, for diverse reasons (health, mobility, etc.) were forced to stop their education. The NDSA questionnaire looks at the proportion of people who had to temporarily stop their studies and who were able to resume them after a given period of time. It also looks at the reasons for this interruption.
Permanent dropout rates look at the proportion of persons who stopped their education permanently for a variety of reasons, without completing school or obtaining a certificate.
Obtaining the NDSA Data Regarding EducationThe present report presents the findings on education in two parts:• The overall indicators; • The specific profiles.
9Overview of the Education Module
The overall indicators present data that is obtained through the household file.16 This file is the first module of the questionnaire. This module is an assessment of the household structure and is essential for basic knowledge regarding the household of the interviewee. Knowledge about the household members is obtained from the head of the household or any other person who can provide information regarding him/her, as well as the other household members.
In the household file, 3 questions were asked for all members of the household:• Has the person (or is the person) received (receiving) some kind of education, even if this was (is) for a
very limited period of time?• If ‘No’, for what reason?• If ‘Yes’, which was (is) the level of the last class that he/she attended (or is attending)?
The household file was put to a total of 5130 households, a total population of 38,320 Afghans in all provinces of the country. All the results presented in the first section (regarding access, retention and completion) are calculated on this sample.
The specific profiles focus on the questions that are in the extensive questionnaire. The questions pertaining to education are exactly the same for children and adults. This section consists of 14 questions:1. Can you read and write? (Check the answer in case of ‘Yes’)2. What kind of education did you receive or are you mainly receiving?3. Why did you receive no formal education?4. Up to which class did you reach as a student?5. Did you ever have to interrupt your studies? 6. If ‘Yes’, from which year to which year?7. For what reason? 8. At what age did you stop/finish your education?9. Why did you stop your education? 10. Would you like to go (back) to school/university?11. What prevented or prevents you from going to school /university?12. Do you think education is useful?13. If you think education is useful, for what reason?14. If you think education is not useful, for what reason?
The answers to these questions are calculated on a smaller sample of persons who were interviewed: persons with disability, non-disabled persons for households that have a member with disability (these persons make up the in-household match group) and persons from households that do not have a person with disability (these persons make up the control group).17
Challenges and Limitations Definition of DisabilityThis first challenge for all surveys that aim to look at disability was discussed extensively in the first volume report regarding the prevalence, typology and health situation of persons with disability in Afghanistan. “Developed countries often show high prevalence rates for disability. This is partly explained by the inclusion of various forms of disability, as well as a large array of questions that relate to mental and psychological disabilities. The social beliefs and stereotypes related to disability also vary, not only in function of the culture but also depending on the level of awareness and visibility of different types of disability. Lastly, the
16 The household is a group of people who may or may not be related by blood or marriage, who live under the same roof or within a same compound, who take their meals together or in small groups (one kitchen in the house), who put together part or all of their income for the needs of the group and who are dependent on the authority of the head of the household for all the expenses entailed.17For more information about the procedure of selection of individuals for interview, see BAKHSHI P., TRANI J.F., ROLLAND C. (2006), Conducting Surveys on Disability: A Comprehensive Toolkit, Handicap International, Lyon.
10 Towards Inclusion and Equality in Education?
decision to include certain forms of disability is also closely linked to diverse aspects of policies that are being implemented. This impacts on non-physical types of problems such as dyslexia or haemophilia, which are considered as disabilities in these countries. As a result, some surveys find very high prevalence rates since they include various forms of chronic illness in the definition of disability. The NDSA screening was based on the International Classification of Functioning, Disability and Health (ICF) as well as the capability approach used by the UNDP Human Development Report (HDR). These frameworks help us to look at the impairments, but also at the activities and participation of individuals in order to understand the disabling situation. Thus narrowing the definition used in this context.”18
Results Regarding Education according to the Age at Which the Person Became DisabledThe main limitation with regard to the analysis of the education section of the NDSA, was related to the necessity of presenting the findings according to the age at which persons became disabled. For example, if a person became disabled at the age of thirty, then he/she would be considered as non-disabled pertaining to access to education at school-going age. When calculating the access to education it is imperative to take into account the situation of the individual at the time of starting school.
Large Categories for Certain Codes in the Household FileIt is also important to note that certain categories relating to the reasons for not going to school may be large and encompass a variety of different reasons. For example “absence of school” may mean that there is a total absence of access to a school building in that it was destroyed or closed down during troubled times. A “school not adapted to girls” may mean a lack of women teachers, lack of proper toilets and facilities or that the school was located too far for girls to access on their own. The NDSA results are based on the first response given by the interviewees and their point of view. Lastly, the time and security constraints made it difficult to spend a lot of time in a given cluster.
Differences between Overall Results and Specific ProfilesThese differences between results stem from the fact that the household file questions are answered by the head or by another person who is present. The questions of the household file represent a considerable amount of information regarding each and every member of the household. The questionnaire is answered by the interviewee or the main caregiver, whenever possible alone. The survey can be more precise about information related to just one person as opposed to the entire household.
In this report both the answers, the point of view of the household head or any other person in charge and the view of the interviewee about his/her own condition are presented. The differences between the information from these perspectives can provide useful insights into the lives of persons with disability and their families.
18 TRANI J.F., BAKHSHI P., NOOR A. H. (2006), Towards Well-Being for Afghans with Disability: the Health Challenge, Handicap International, Lyon.
11Education of Afghans with Disability: Reasons for Concern?
The results of the NDSA bring into light a multifaceted situation of education for persons with disability. The picture becomes even more complex when the age at which a person became disabled is taken into account.
The NDSA findings of the education section are explained in three parts:• First, a very brief comparison is made with the previous household surveys carried out in Afghanistan
since 2002.• The second section looks more closely at issues related to access to education. It presents the general
findings based on the analysis of data gathered through the household file module. • Finally, results concerning the efficiency of education are mainly by looking at literacy, transition and
completion. Dropout rates and reasons are also discussed in this sub-section.
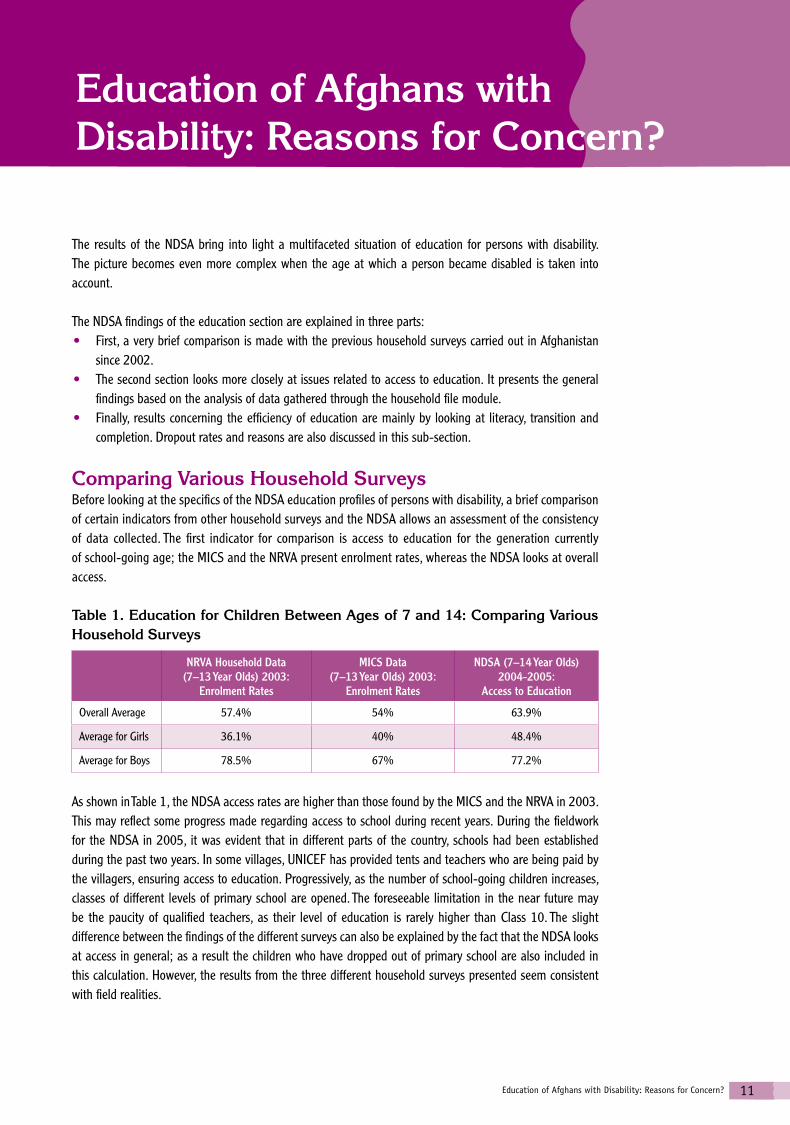
Comparing Various Household SurveysBefore looking at the specifics of the NDSA education profiles of persons with disability, a brief comparison of certain indicators from other household surveys and the NDSA allows an assessment of the consistency of data collected. The first indicator for comparison is access to education for the generation currently of school-going age; the MICS and the NRVA present enrolment rates, whereas the NDSA looks at overall access.
Table 1. Education for Children Between Ages of 7 and 14: Comparing Various Household Surveys
NRVA Household Data(7–13 Year Olds) 2003:
Enrolment Rates
MICS Data (7–13 Year Olds) 2003:
Enrolment Rates
NDSA (7–14 Year Olds) 2004-2005:
Access to Education
Overall Average 57.4% 54% 63.9%
Average for Girls 36.1% 40% 48.4%
Average for Boys 78.5% 67% 77.2%
As shown in Table 1, the NDSA access rates are higher than those found by the MICS and the NRVA in 2003. This may reflect some progress made regarding access to school during recent years. During the fieldwork for the NDSA in 2005, it was evident that in different parts of the country, schools had been established during the past two years. In some villages, UNICEF has provided tents and teachers who are being paid by the villagers, ensuring access to education. Progressively, as the number of school-going children increases, classes of different levels of primary school are opened. The foreseeable limitation in the near future may be the paucity of qualified teachers, as their level of education is rarely higher than Class 10. The slight difference between the findings of the different surveys can also be explained by the fact that the NDSA looks at access in general; as a result the children who have dropped out of primary school are also included in this calculation. However, the results from the three different household surveys presented seem consistent with field realities.
Education of Afghans with Disability: Reasons for Concern?

12 Towards Inclusion and Equality in Education?
Table 2. Literacy Rates: Comparing Various Household Surveys
NRVA Household Data (Persons Over Age of 6) 2003:
Literacy Rates
MICS Data (Persons Over Age of 15) 2003:
Literacy Rates
NDSA (Persons Over Age of 7) 2004-2005:
Literacy Rates
Overall Average 23.7% 22.2% 27.2%
Average for Females 10.3% 8.1% 15.1%
Average for Males 36.9% 36.1% 36.1%
The literacy rates for all persons above the age of 7 are presented in Table 2. Even if the age categories taken into account by the three surveys vary, the literacy rates found do show some consistency. The NDSA finds higher literacy rates for women than the other studies. This again might reflect progress made with regards to access of girls to school. At present, in many areas, with the exception of the southern provinces, schools for girls have (re)opened. This is even more visible in urban areas where women teachers can be found more easily.
Access to Education: the First HurdleAs stated earlier, the NDSA looked at access to any form of schooling, even if it was for a very limited period. The aim of this is to determine whether persons have received or are receiving some education, whatever form that may be in. “Assuring timely access of all children to the first grade is crucial if Universal Primary Education is to be achieved by 2015. Intake rates provide a measure of access.”19 This document presents results regarding these ‘intake rates’, keeping in mind the age at which persons became disabled. Persons who became disabled at an early age (before school-going age) may have serious difficulties in terms of access. On the other hand, if a child becomes disabled once in school, it is retention and completion of the education cycle that become the main challenges.
Type of Schooling that Persons Received The majority of the results presented deal with education in the formal school system or the government schools.
19 UNESCO (2006), op. cit., p 41.
As Figure 1 clearly shows, the proportion of persons who did not receive any form of education is very high.
Persons with Disability
Non-Disabled Difference PwDs/NDs
80
70
60
50
40
30
20
10
0Government
SchoolReligious School
(Madrasa)
Private School Training Centre No Education
Figure 1: Access to Education according to Different Types of Schools
-21.2
-0.3 0.3 -0.3
within the Family
-0.3
21.8
13Education of Afghans with Disability: Reasons for Concern?
However, when persons do have access to education, it is to a large extent in the formal school system. As a result, the findings and conclusions presented below relate to formal schooling and most often that means government schools.
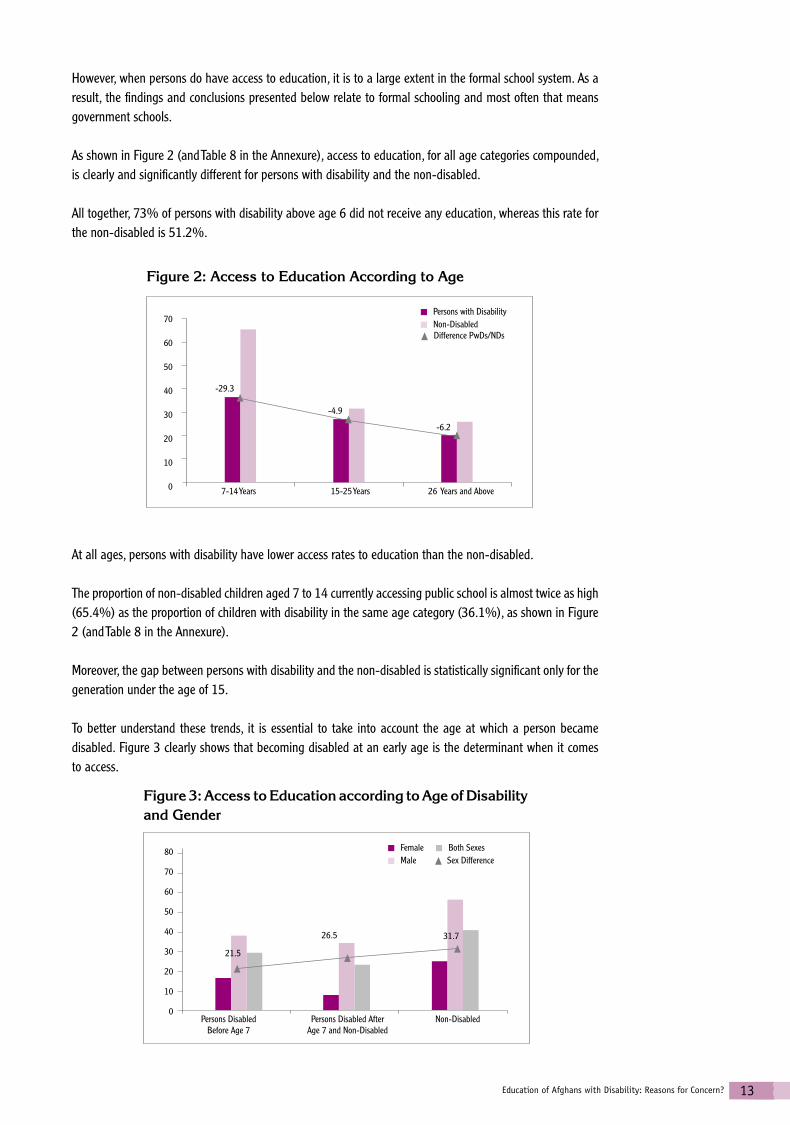
As shown in Figure 2 (and Table 8 in the Annexure), access to education, for all age categories compounded, is clearly and significantly different for persons with disability and the non-disabled.
All together, 73% of persons with disability above age 6 did not receive any education, whereas this rate for the non-disabled is 51.2%.
At all ages, persons with disability have lower access rates to education than the non-disabled.
The proportion of non-disabled children aged 7 to 14 currently accessing public school is almost twice as high (65.4%) as the proportion of children with disability in the same age category (36.1%), as shown in Figure 2 (and Table 8 in the Annexure).
Moreover, the gap between persons with disability and the non-disabled is statistically significant only for the generation under the age of 15.
To better understand these trends, it is essential to take into account the age at which a person became disabled. Figure 3 clearly shows that becoming disabled at an early age is the determinant when it comes to access.
Figure 3: Access to Education according to Age of Disability and Gender
80
70
60
50
40
30
20
10
0
21.5
26.5 31.7
Persons DisabledBefore Age 7
Persons Disabled After Age 7 and Non-Disabled
Non-Disabled
Female Both Sexes
Male Sex Difference
70
60
50
40
30
20
10
0 7-14 Years 15-25 Years 26 Years and Above
Persons with Disability
Non-Disabled Difference PwDs/NDs
Figure 2: Access to Education According to Age
-29.3
-4.9
-6.2
14 Towards Inclusion and Equality in Education?
Exclusion from education is slightly higher when the child becomes disabled before school-starting age than when the age is higher and for those who are non-disabled. According to the information in Figure 3 (and Table 9 in the Annexure), children who become disabled at an early stage in life are at a clear disadvantage for access to school, when compared to the non-disabled.
Three dimensions need to be taken into consideration to understand these trends. • The first is the impact of the age at which a person becomes disabled.• The second may be the effect of the increase in the number of schools and enrolment in Afghanistan. • The third explanation is the influence of gender.
Due to these reasons the proportion of persons disabled at an early age who access school is only 28.9% compared to more than 40.4% for the non-disabled (all age categories included). These disparities, statistically significant, can be explained by the impact of gender issues that are omnipresent in Afghan society. The case of women is particularly grim since only 7.4% of women who were disabled after the age of 7 accessed schools. This can further be explained by looking at the age of persons in Figure 4.
An explanation of a higher rate of access for children disabled before the age of 7 and aged 7 to 25 may lie with the considerable enrolment efforts made by the Government and other international agencies since 2002. These attempts are mainly benefiting non-disabled boys, who were consistently the group with the highest numbers regarding access.
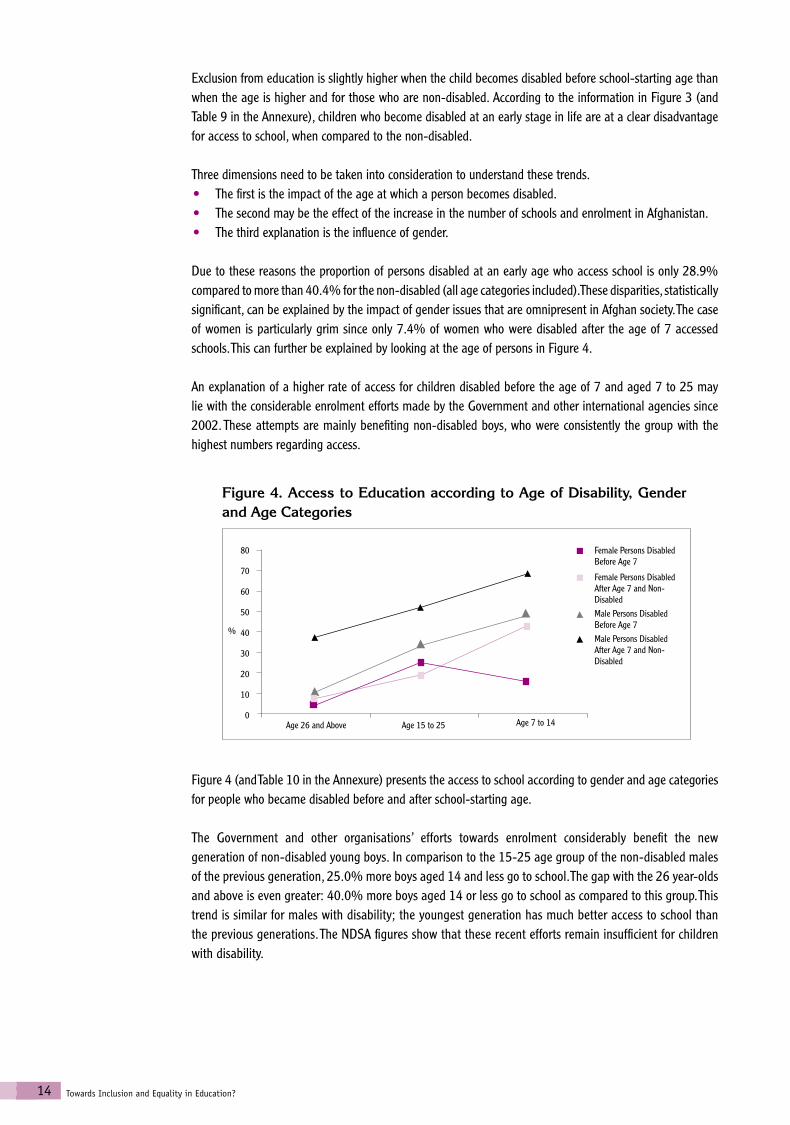
Figure 4 (and Table 10 in the Annexure) presents the access to school according to gender and age categories for people who became disabled before and after school-starting age.
The Government and other organisations’ efforts towards enrolment considerably benefit the new generation of non-disabled young boys. In comparison to the 15-25 age group of the non-disabled males of the previous generation, 25.0% more boys aged 14 and less go to school. The gap with the 26 year-olds and above is even greater: 40.0% more boys aged 14 or less go to school as compared to this group. This trend is similar for males with disability; the youngest generation has much better access to school than the previous generations. The NDSA figures show that these recent efforts remain insufficient for children with disability.
80
70
60
50
40
30
20
10
0Age 26 and Above Age 15 to 25 Age 7 to 14
Figure 4. Access to Education according to Age of Disability, Gender and Age Categories
Female Persons Disabled Before Age 7
Female Persons Disabled After Age 7 and Non-Disabled
Male Persons Disabled Before Age 7
Male Persons Disabled After Age 7 and Non-Disabled
%
15Education of Afghans with Disability: Reasons for Concern?
According to the National Human Development Report 2004, 3.7 million children were going to school, 30% of which were girls.20 In general, in all age categories, males have more access to school than females. This has been a consistent finding of all studies carried out on education in Afghanistan. If disability, or more specifically becoming disabled before school-starting age is taken into account, the disparity is even more noticeable. At all ages, women without disability have less access to school than men who become disabled before the age of 7.
The figures regarding girls disabled at an early age are even more worrying since the 7–14-year-olds seem to have even less access to education than the previous generation of girls. Only 16.5% of girls disabled before age 7 go to school compared to 24% for all age categories of non-disabled women. There has been an improvement for non-disabled women over recent years. Results show that about 19% of women aged 15 to 25 accessed education, whereas over 48% of 7 to 14 year old non-disabled girls have access today. However, in the same category, the situation of girls disabled before school-going age is extremely worrying: only 16.5% of young girls with disability go to school; this proportion is 23.5% for the previous generation. Whatever the type of disability a young Afghan girl may have, the probability of her accessing school still remains very low.
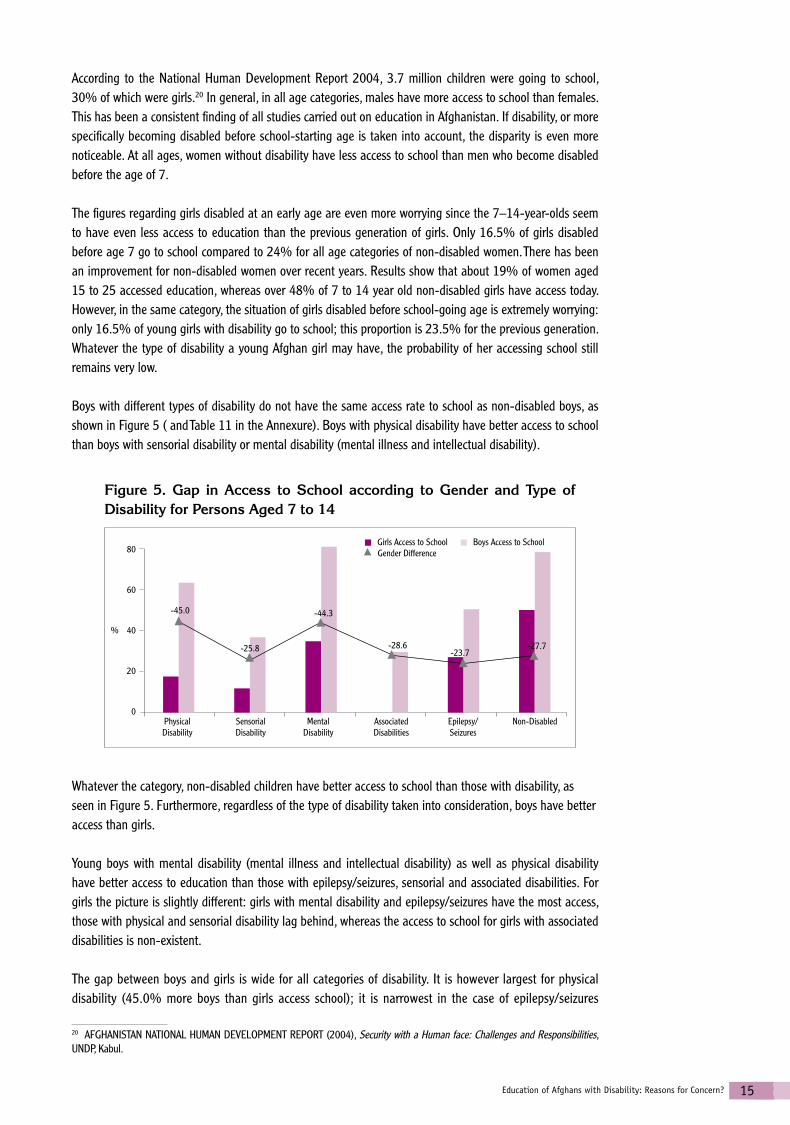
Boys with different types of disability do not have the same access rate to school as non-disabled boys, as shown in Figure 5 ( and Table 11 in the Annexure). Boys with physical disability have better access to school than boys with sensorial disability or mental disability (mental illness and intellectual disability).
20 AFGHANISTAN NATIONAL HUMAN DEVELOPMENT REPORT (2004), Security with a Human face: Challenges and Responsibilities, UNDP, Kabul.
Whatever the category, non-disabled children have better access to school than those with disability, as seen in Figure 5. Furthermore, regardless of the type of disability taken into consideration, boys have better access than girls.
Young boys with mental disability (mental illness and intellectual disability) as well as physical disability have better access to education than those with epilepsy/seizures, sensorial and associated disabilities. For girls the picture is slightly different: girls with mental disability and epilepsy/seizures have the most access, those with physical and sensorial disability lag behind, whereas the access to school for girls with associated disabilities is non-existent.
The gap between boys and girls is wide for all categories of disability. It is however largest for physical disability (45.0% more boys than girls access school); it is narrowest in the case of epilepsy/seizures
80
60
40
20
0Physical Disability
Figure 5. Gap in Access to School according to Gender and Type of Disability for Persons Aged 7 to 14
-45.0 -44.3
Sensorial Disability
Mental Disability
Associated Disabilities
Girls Access to School Boys Access to School Gender Difference
%
Epilepsy/Seizures
Non-Disabled
-25.8 -28.6-23.7
-27.7

16 Towards Inclusion and Equality in Education?
Figure 6 (and Table 12 in the Annexure) show that the difference in access to school, between persons with disability and the non-disabled is more prominent in cities and towns than in villages. In rural areas, both rates of access for persons with disability and non-disabled are far below the national average. Only 25.7% of the people who became disabled before school-starting age, and 33.1% for non-disabled and people who became disabled at a later age, are in school or have gone to school at some stage in their youth.
(23.7%). The disparity that is observed with regard to physical disability can be explained by easier access of boys with these disabilities due to social norms of acceptability and minimal effort required within classes in order to include them in the education process. The situation of children with sensorial disability can be explained by more complex and costly requirements pertaining to teacher training and materials. Finally, the fact that the NDSA did not find any case of a young girl with associated disabilities accessing school does suggest that once numerous disabilities are compounded with gender issues, the hurdles seem to become insurmountable.
Differences according to Rural and Urban Settings Urban and rural areas have different scenarios concerning access for a number of reasons: density of population in urban areas makes it easier to provide public services (not only in terms of better accessibility but also proximity and transport) and to ensure communication and power access in towns. Private companies find a better environment and the best-educated human resources in urban areas as opposed to the rural. These differences are also true for education in general.
80
70
60
50
40
30
20
10
0Access in Urban Areas Access in Rural Areas
Figure 6. Access to Education according to Urban and Rural Areas
Persons Disabled Before Age 7
Persons Disabled After Age 7 and Non-Disabled
Setting Difference in Access for PwDs and NDs
%
-21.0
-7.4
80
70
60
50
40
30
20
10
0Access of Females to School in Urban
Areas
Figure 7. Access to Education according to Gender Differences in Urban and Rural Areas
%
-13.0 -12.7
-31.6
Persons Disabled Before Age 7
Persons Disabled After Age 7 and Non-Disabled
Gender and Setting Difference in Access
-6.3
Access of Males to School in Urban
Areas
Access of Females to School in Rural
Areas
Access of Males to School in Rural
Areas
17Education of Afghans with Disability: Reasons for Concern?
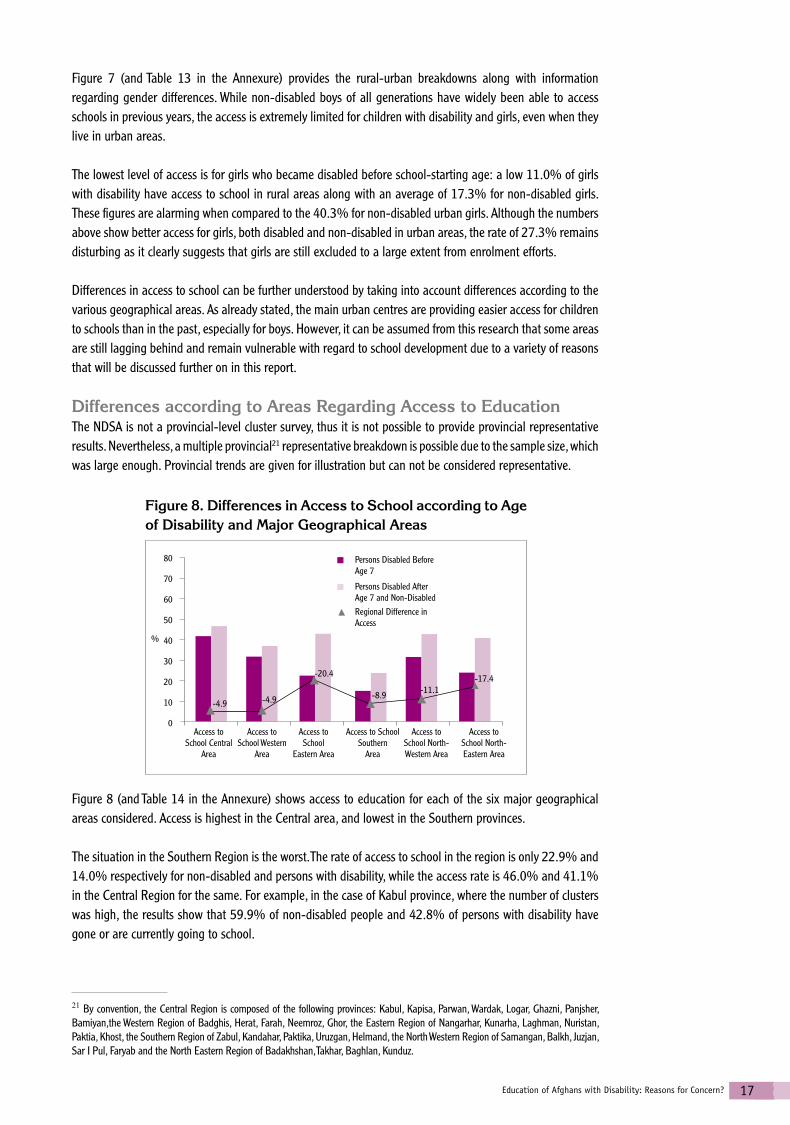
Figure 8 (and Table 14 in the Annexure) shows access to education for each of the six major geographical areas considered. Access is highest in the Central area, and lowest in the Southern provinces.
The situation in the Southern Region is the worst. The rate of access to school in the region is only 22.9% and 14.0% respectively for non-disabled and persons with disability, while the access rate is 46.0% and 41.1% in the Central Region for the same. For example, in the case of Kabul province, where the number of clusters was high, the results show that 59.9% of non-disabled people and 42.8% of persons with disability have gone or are currently going to school.
21 By convention, the Central Region is composed of the following provinces: Kabul, Kapisa, Parwan, Wardak, Logar, Ghazni, Panjsher, Bamiyan,the Western Region of Badghis, Herat, Farah, Neemroz, Ghor, the Eastern Region of Nangarhar, Kunarha, Laghman, Nuristan, Paktia, Khost, the Southern Region of Zabul, Kandahar, Paktika, Uruzgan, Helmand, the North Western Region of Samangan, Balkh, Juzjan, Sar I Pul, Faryab and the North Eastern Region of Badakhshan, Takhar, Baghlan, Kunduz.
Figure 7 (and Table 13 in the Annexure) provides the rural-urban breakdowns along with information regarding gender differences. While non-disabled boys of all generations have widely been able to access schools in previous years, the access is extremely limited for children with disability and girls, even when they live in urban areas.
The lowest level of access is for girls who became disabled before school-starting age: a low 11.0% of girls with disability have access to school in rural areas along with an average of 17.3% for non-disabled girls. These figures are alarming when compared to the 40.3% for non-disabled urban girls. Although the numbers above show better access for girls, both disabled and non-disabled in urban areas, the rate of 27.3% remains disturbing as it clearly suggests that girls are still excluded to a large extent from enrolment efforts.
Differences in access to school can be further understood by taking into account differences according to the various geographical areas. As already stated, the main urban centres are providing easier access for children to schools than in the past, especially for boys. However, it can be assumed from this research that some areas are still lagging behind and remain vulnerable with regard to school development due to a variety of reasons that will be discussed further on in this report.
Differences according to Areas Regarding Access to EducationThe NDSA is not a provincial-level cluster survey, thus it is not possible to provide provincial representative results. Nevertheless, a multiple provincial21 representative breakdown is possible due to the sample size, which was large enough. Provincial trends are given for illustration but can not be considered representative.
80
70
60
50
40
30
20
10
0Access to
School Central Area
Figure 8. Differences in Access to School according to Age of Disability and Major Geographical Areas
%
-4.9
-17.4
Persons Disabled Before Age 7
Persons Disabled After Age 7 and Non-Disabled
Regional Difference in Access
-20.4
-11.1
Access toSchool Western
Area
Access to School
Eastern Area
Access to School Southern
Area
-8.9-4.9
Access to School North-Western Area
Access to School North-Eastern Area
18 Towards Inclusion and Equality in Education?
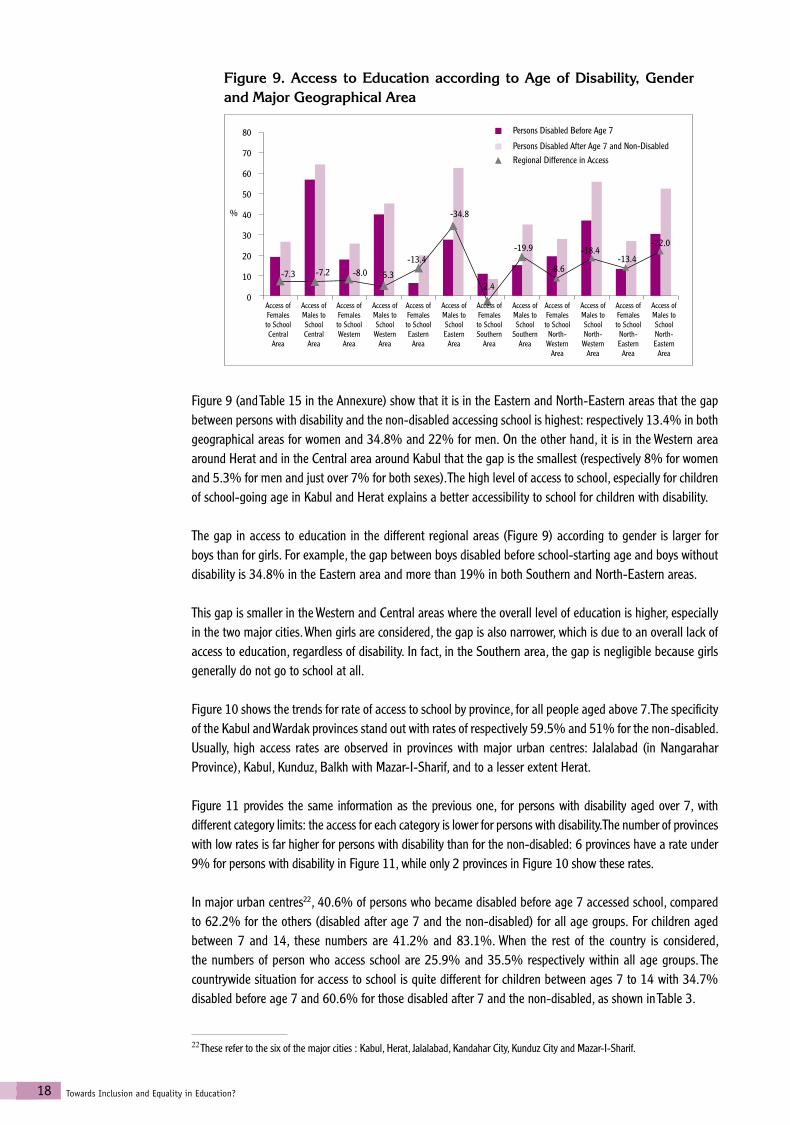
Figure 9 (and Table 15 in the Annexure) show that it is in the Eastern and North-Eastern areas that the gap between persons with disability and the non-disabled accessing school is highest: respectively 13.4% in both geographical areas for women and 34.8% and 22% for men. On the other hand, it is in the Western area around Herat and in the Central area around Kabul that the gap is the smallest (respectively 8% for women and 5.3% for men and just over 7% for both sexes). The high level of access to school, especially for children of school-going age in Kabul and Herat explains a better accessibility to school for children with disability.
The gap in access to education in the different regional areas (Figure 9) according to gender is larger for boys than for girls. For example, the gap between boys disabled before school-starting age and boys without disability is 34.8% in the Eastern area and more than 19% in both Southern and North-Eastern areas.
This gap is smaller in the Western and Central areas where the overall level of education is higher, especially in the two major cities. When girls are considered, the gap is also narrower, which is due to an overall lack of access to education, regardless of disability. In fact, in the Southern area, the gap is negligible because girls generally do not go to school at all.
Figure 10 shows the trends for rate of access to school by province, for all people aged above 7. The specificity of the Kabul and Wardak provinces stand out with rates of respectively 59.5% and 51% for the non-disabled. Usually, high access rates are observed in provinces with major urban centres: Jalalabad (in Nangarahar Province), Kabul, Kunduz, Balkh with Mazar-I-Sharif, and to a lesser extent Herat.
Figure 11 provides the same information as the previous one, for persons with disability aged over 7, with different category limits: the access for each category is lower for persons with disability. The number of provinces with low rates is far higher for persons with disability than for the non-disabled: 6 provinces have a rate under 9% for persons with disability in Figure 11, while only 2 provinces in Figure 10 show these rates.
In major urban centres22, 40.6% of persons who became disabled before age 7 accessed school, compared to 62.2% for the others (disabled after age 7 and the non-disabled) for all age groups. For children aged between 7 and 14, these numbers are 41.2% and 83.1%. When the rest of the country is considered, the numbers of person who access school are 25.9% and 35.5% respectively within all age groups. The countrywide situation for access to school is quite different for children between ages 7 to 14 with 34.7% disabled before age 7 and 60.6% for those disabled after 7 and the non-disabled, as shown in Table 3.
22 These refer to the six of the major cities : Kabul, Herat, Jalalabad, Kandahar City, Kunduz City and Mazar-I-Sharif.
Figure 9. Access to Education according to Age of Disability, Gender and Major Geographical Area
80
70
60
50
40
30
20
10
0Access of Females to School Central Area
%
-7.3 -5.3
Persons Disabled Before Age 7
Persons Disabled After Age 7 and Non-Disabled
Regional Difference in Access
2.4
-34.8
-7.2
Access of Males to School Central Area
Access of Females to School Western
Area
Access of Males to School
Western Area
Access of Females to School Eastern
Area
Access of Males to School Eastern
Area
Access of Females to School Southern
Area
Access of Males to School
Southern Area
Access of Females to School North-
Western Area
Access of Males to School North-
Western Area
Access of Females to School North-Eastern
Area
Access of Males to School North-Eastern
Area
-8.0-13.4
-19.9 -18.4-13.4
-22.0
-8.6
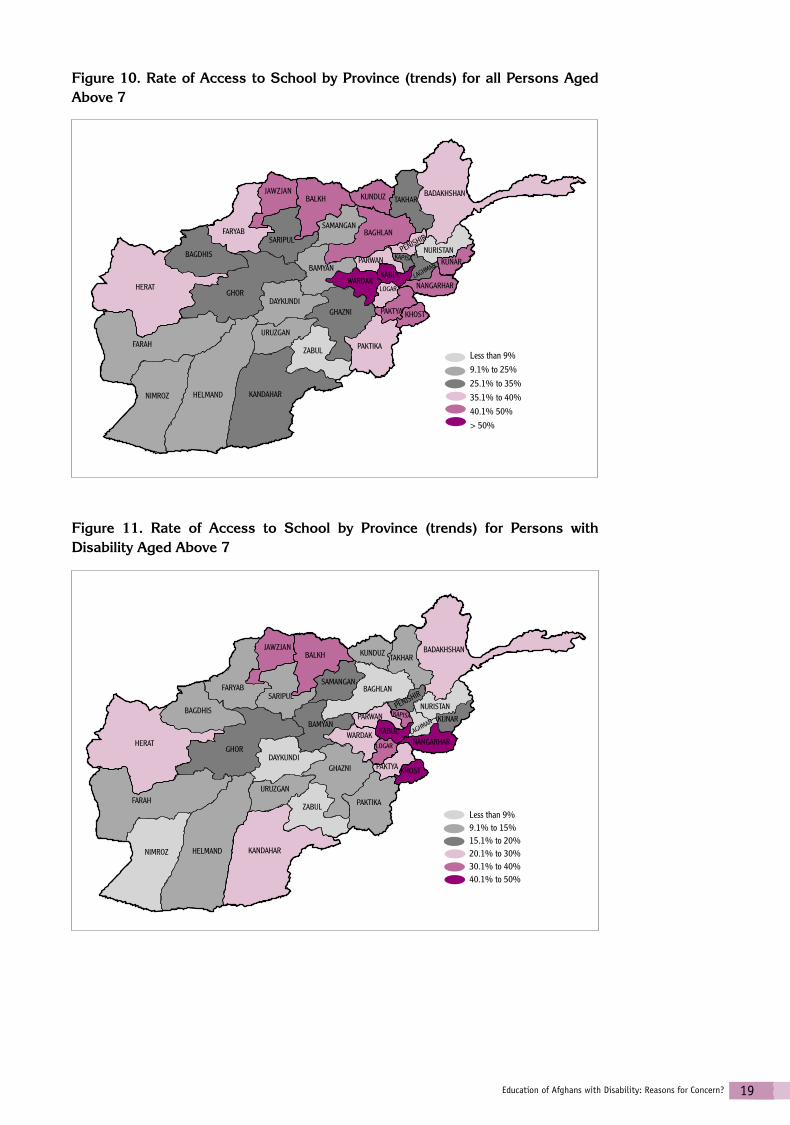
19Education of Afghans with Disability: Reasons for Concern?
Figure 10. Rate of Access to School by Province (trends) for all Persons Aged Above 7
HERAT
BAGDHIS
FARYAB
JAWZJANBALKH KUNDUZ TAKHAR
BADAKHSHAN
NURISTANKUNAR
NANGARHARLAGHMAN
KHOSTPAKTYA
LOGAR
GHAZNI
WARDAK
PARWAN
KABUL
KAPISA
BAGHLANSAMANGAN
BAMYAN
DAYKUNDI
URUZGAN
PAKTIKAZABUL
KANDAHARHELMANDNIMROZ
FARAH
GHOR
SARIPULPENJSHIR
Less than 9%9.1% to 25%25.1% to 35%35.1% to 40%40.1% 50%> 50%
Figure 11. Rate of Access to School by Province (trends) for Persons with Disability Aged Above 7
HERAT
BAGDHIS
FARYAB
JAWZJANBALKH KUNDUZ
TAKHARBADAKHSHAN
NURISTAN
KUNAR
NANGARHARLAGHMAN
KHOSTPAKTYA
LOGAR
GHAZNI
WARDAK
PARWAN
KABUL
KAPISA
BAGHLANSAMANGAN
BAMYAN
DAYKUNDI
URUZGAN
PAKTIKAZABUL
KANDAHARHELMANDNIMROZ
FARAH
GHOR
SARIPULPENJSHIR
Less than 9%9.1% to 15%15.1% to 20%20.1% to 30%30.1% to 40%40.1% to 50%
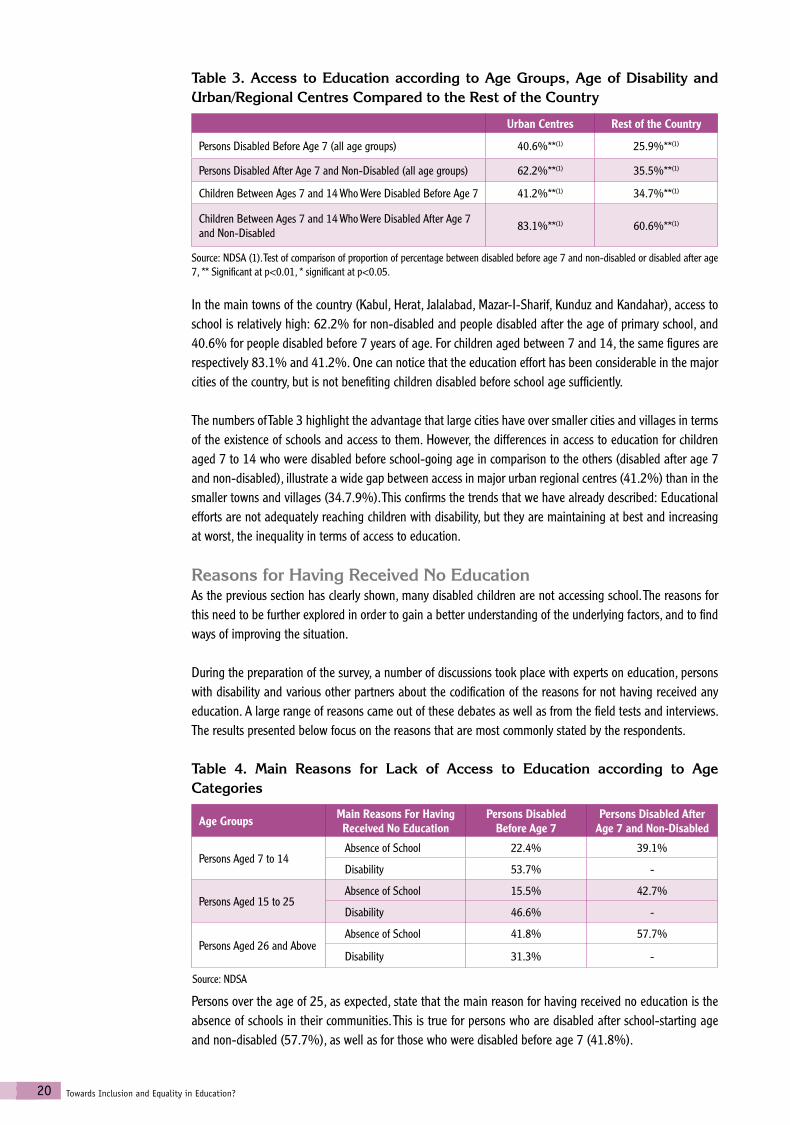
20 Towards Inclusion and Equality in Education?
Table 3. Access to Education according to Age Groups, Age of Disability and Urban/Regional Centres Compared to the Rest of the Country
Urban Centres Rest of the Country
Persons Disabled Before Age 7 (all age groups) 40.6%**(1) 25.9%**(1)
Persons Disabled After Age 7 and Non-Disabled (all age groups) 62.2%**(1) 35.5%**(1)
Children Between Ages 7 and 14 Who Were Disabled Before Age 7 41.2%**(1) 34.7%**(1)
Children Between Ages 7 and 14 Who Were Disabled After Age 7 and Non-Disabled 83.1%**(1) 60.6%**(1)
Source: NDSA (1). Test of comparison of proportion of percentage between disabled before age 7 and non-disabled or disabled after age 7, ** Significant at p<0.01, * significant at p<0.05.
In the main towns of the country (Kabul, Herat, Jalalabad, Mazar-I-Sharif, Kunduz and Kandahar), access to school is relatively high: 62.2% for non-disabled and people disabled after the age of primary school, and 40.6% for people disabled before 7 years of age. For children aged between 7 and 14, the same figures are respectively 83.1% and 41.2%. One can notice that the education effort has been considerable in the major cities of the country, but is not benefiting children disabled before school age sufficiently.
The numbers of Table 3 highlight the advantage that large cities have over smaller cities and villages in terms of the existence of schools and access to them. However, the differences in access to education for children aged 7 to 14 who were disabled before school-going age in comparison to the others (disabled after age 7 and non-disabled), illustrate a wide gap between access in major urban regional centres (41.2%) than in the smaller towns and villages (34.7.9%). This confirms the trends that we have already described: Educational efforts are not adequately reaching children with disability, but they are maintaining at best and increasing at worst, the inequality in terms of access to education.
Reasons for Having Received No EducationAs the previous section has clearly shown, many disabled children are not accessing school. The reasons for this need to be further explored in order to gain a better understanding of the underlying factors, and to find ways of improving the situation.
During the preparation of the survey, a number of discussions took place with experts on education, persons with disability and various other partners about the codification of the reasons for not having received any education. A large range of reasons came out of these debates as well as from the field tests and interviews. The results presented below focus on the reasons that are most commonly stated by the respondents.
Table 4. Main Reasons for Lack of Access to Education according to Age Categories
Age Groups Main Reasons For Having Received No Education
Persons Disabled Before Age 7
Persons Disabled After Age 7 and Non-Disabled
Persons Aged 7 to 14Absence of School 22.4% 39.1%
Disability 53.7% -
Persons Aged 15 to 25Absence of School 15.5% 42.7%
Disability 46.6% -
Persons Aged 26 and AboveAbsence of School 41.8% 57.7%
Disability 31.3% -
Persons over the age of 25, as expected, state that the main reason for having received no education is the absence of schools in their communities. This is true for persons who are disabled after school-starting age and non-disabled (57.7%), as well as for those who were disabled before age 7 (41.8%).
Source: NDSA
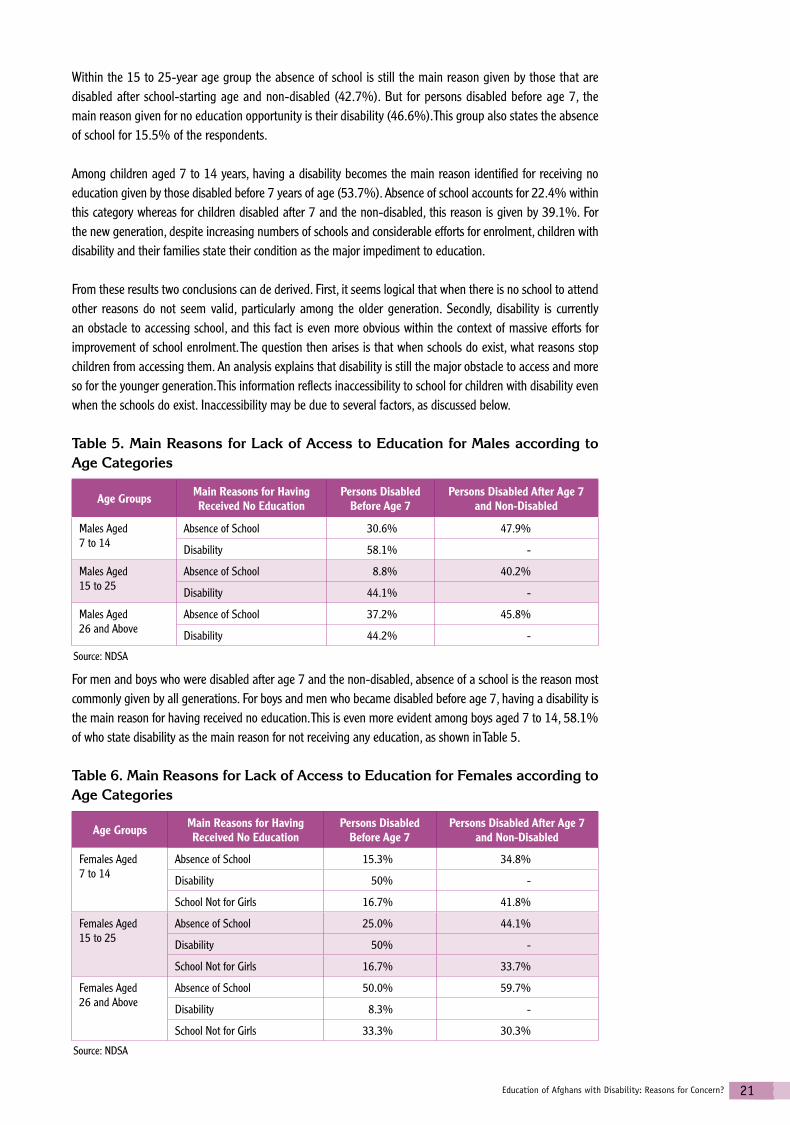
21Education of Afghans with Disability: Reasons for Concern?
Within the 15 to 25-year age group the absence of school is still the main reason given by those that are disabled after school-starting age and non-disabled (42.7%). But for persons disabled before age 7, the main reason given for no education opportunity is their disability (46.6%). This group also states the absence of school for 15.5% of the respondents.
Among children aged 7 to 14 years, having a disability becomes the main reason identified for receiving no education given by those disabled before 7 years of age (53.7%). Absence of school accounts for 22.4% within this category whereas for children disabled after 7 and the non-disabled, this reason is given by 39.1%. For the new generation, despite increasing numbers of schools and considerable efforts for enrolment, children with disability and their families state their condition as the major impediment to education.
From these results two conclusions can de derived. First, it seems logical that when there is no school to attend other reasons do not seem valid, particularly among the older generation. Secondly, disability is currently an obstacle to accessing school, and this fact is even more obvious within the context of massive efforts for improvement of school enrolment. The question then arises is that when schools do exist, what reasons stop children from accessing them. An analysis explains that disability is still the major obstacle to access and more so for the younger generation. This information reflects inaccessibility to school for children with disability even when the schools do exist. Inaccessibility may be due to several factors, as discussed below.
Table 5. Main Reasons for Lack of Access to Education for Males according to Age Categories
Age Groups Main Reasons for Having Received No Education
Persons Disabled Before Age 7
Persons Disabled After Age 7 and Non-Disabled
Males Aged7 to 14
Absence of School 30.6% 47.9%
Disability 58.1% -
Males Aged15 to 25
Absence of School 8.8% 40.2%
Disability 44.1% -
Males Aged26 and Above
Absence of School 37.2% 45.8%
Disability 44.2% -
For men and boys who were disabled after age 7 and the non-disabled, absence of a school is the reason most commonly given by all generations. For boys and men who became disabled before age 7, having a disability is the main reason for having received no education. This is even more evident among boys aged 7 to 14, 58.1% of who state disability as the main reason for not receiving any education, as shown in Table 5.
Table 6. Main Reasons for Lack of Access to Education for Females according to Age Categories
Age Groups Main Reasons for Having Received No Education
Persons Disabled Before Age 7
Persons Disabled After Age 7 and Non-Disabled
Females Aged7 to 14
Absence of School 15.3% 34.8%
Disability 50% -
School Not for Girls 16.7% 41.8%
Females Aged15 to 25
Absence of School 25.0% 44.1%
Disability 50% -
School Not for Girls 16.7% 33.7%
Females Aged26 and Above
Absence of School 50.0% 59.7%
Disability 8.3% -
School Not for Girls 33.3% 30.3%
Source: NDSA
Source: NDSA
22 Towards Inclusion and Equality in Education?
For girls and women, there is a third major reason for no access to schools: the gender factor. This reason includes both chief of family beliefs that either school is not adapted to girls or that school is not necessary for girls. Girls themselves indicated that the family considers school unnecessary for girls.
For women over 26 years of age, disabled after the age of 7 and non-disabled, the absence of school was the main reason given (59.7%) for no education. For the younger generations in this same category, this reason seems less obvious (44.1% for 15 to 25 and 34.8% for 7 to 14 year old girls). For the youngest generation, the fact that school is not necessary for girls is also stated frequently (41.8%) in comparison to the responses of older women (around 30%).
Comparing the above information with the answers, concerning girls and women who became disabled before age 7, the absence of school accounts for 50% of the reason for women over the age of 26, which is close to that of the same generation of women disabled after age 7 or the non-disabled. However, the numbers are substantially less for the 15 to 25-year-old women (25%) and for the younger generation (15.3%). For the younger generations disability is perceived as being a bigger impediment than the fact of being a girl, whereas this was not the case for women older than 25 years.
In general, when there is an absence of any form of school in the area, the other reasons for receiving no education (being disabled or being a girl) become secondary. However, when the structures do exist, the lack of access is attributed to the disability before being ascribed to gender. Efforts to improve access will invariably need to take into account these two dimensions simultaneously in order to ensure efficient and long-term results.
Impact of Disability on the Education of Non-Disabled Members of the Family Results regarding access to education do not show significant differences between the non-disabled members of the families of persons with disability (the match group) and those who belong to families where there is no person with disability (the control group). The similarities are further confirmed when the reasons given for no access to education are considered. The reasons given by the control group and the match group are very similar: the main reason remains absence of school (49% for the former and 44.6% for the latter). The second reason is the lack of money (16.2% for control group and 14.2% for the match group), and the third is the fact that school is not for girls (17.7% for control group and 12.5% for match group). Differences between groups are not significant.
Impact of Level of Education of the Head of the Household and Livelihood of the HouseholdEducation is often an important expense in the budget of the household and the head of family is responsible for providing the resources. Analysis of the data illustrates that attendance of school also depends on education level of the head of the household (Figure 12 and Table 16 in the Annexure), especially for children aged 7 to 17. If the head of family has not attended school, he/she is less convinced of the utility to send his/her children to school. The phenomenon is common for all children, but the probability of not going to school is far higher for children with disability (72.3% compared to 50.1% of non-disabled children not going to school). On the other hand, when the head of the household has reached Class 12 or higher education, the probability of the children accessing school increases considerably: 65.7% of children with disability access school in this case and 85% of non-disabled children.
The difference between the proportion of children with disability going to school if the head of family is uneducated, and the proportion of children with disability going to school in households with a highly educated head of family, is statistically significant.
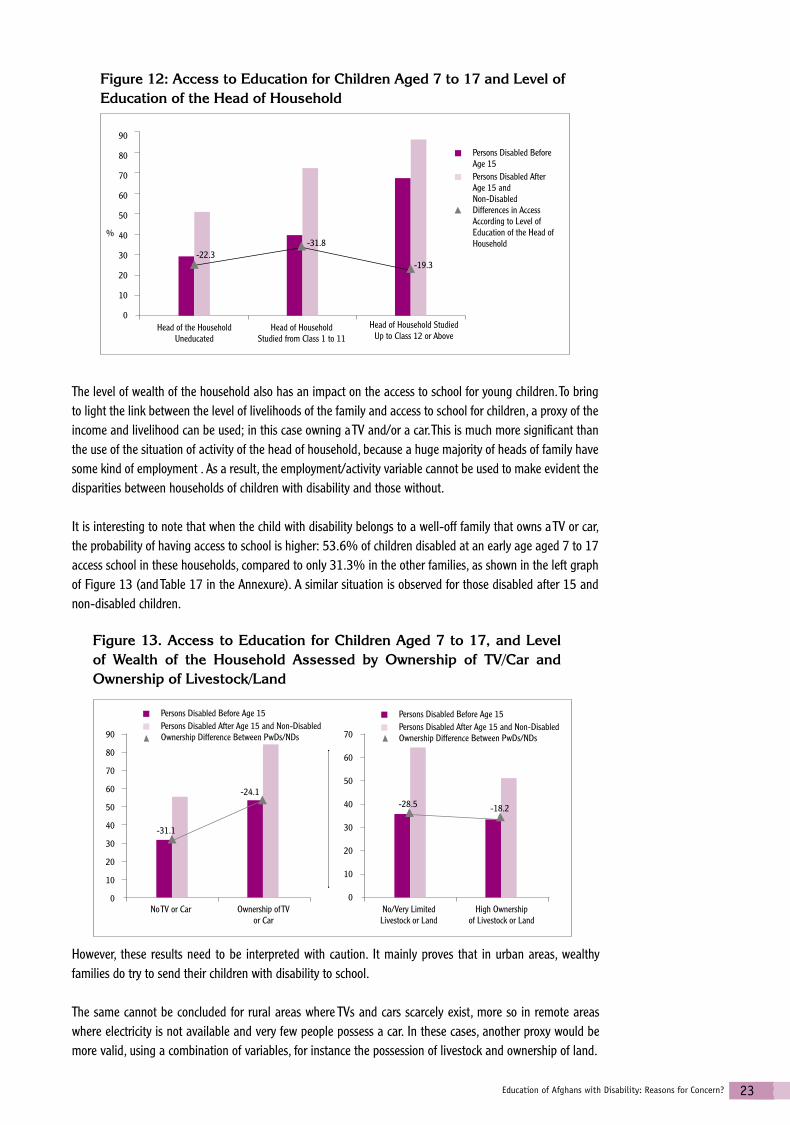
23Education of Afghans with Disability: Reasons for Concern?
The level of wealth of the household also has an impact on the access to school for young children. To bring to light the link between the level of livelihoods of the family and access to school for children, a proxy of the income and livelihood can be used; in this case owning a TV and/or a car. This is much more significant than the use of the situation of activity of the head of household, because a huge majority of heads of family have some kind of employment . As a result, the employment/activity variable cannot be used to make evident the disparities between households of children with disability and those without.
It is interesting to note that when the child with disability belongs to a well-off family that owns a TV or car, the probability of having access to school is higher: 53.6% of children disabled at an early age aged 7 to 17 access school in these households, compared to only 31.3% in the other families, as shown in the left graph of Figure 13 (and Table 17 in the Annexure). A similar situation is observed for those disabled after 15 and non-disabled children.
90
80
70
60
50
40
30
20
10
0No TV or Car Ownership of TV
or Car
Figure 13. Access to Education for Children Aged 7 to 17, and Level of Wealth of the Household Assessed by Ownership of TV/Car and Ownership of Livestock/Land
70
60
50
40
30
20
10
0No/Very Limited Livestock or Land
High Ownership of Livestock or Land
However, these results need to be interpreted with caution. It mainly proves that in urban areas, wealthy families do try to send their children with disability to school.
The same cannot be concluded for rural areas where TVs and cars scarcely exist, more so in remote areas where electricity is not available and very few people possess a car. In these cases, another proxy would be more valid, using a combination of variables, for instance the possession of livestock and ownership of land.
Figure 12: Access to Education for Children Aged 7 to 17 and Level of Education of the Head of Household
90
80
70
60
50
40
30
20
10
0Head of the Household
UneducatedHead of Household
Studied from Class 1 to 11Head of Household Studied
Up to Class 12 or Above
Persons Disabled Before Age 15
Persons Disabled After Age 15 and Non-Disabled
Differences in Access According to Level of Education of the Head of Household
%
-22.3-31.8
-19.3
-31.1
-24.1-28.5 -18.2
Persons Disabled Before Age 15
Persons Disabled After Age 15 and Non-Disabled Ownership Difference Between PwDs/NDs
Persons Disabled Before Age 15
Persons Disabled After Age 15 and Non-Disabled Ownership Difference Between PwDs/NDs

24 Towards Inclusion and Equality in Education?
The right graph of Figure 13 (Table 17 in the Annexure) shows that the families owning both a high number of livestock (cows and sheep) and/or land do not send a significantly higher proportion of children who are disabled at an early age to school (35.8% versus 33.3% of households that own little livestock and land). A similar result is found with ownership of camels, horses, goats and other animals found in rural areas. These results suggest that other factors, such as gender, come into play. This also shows that the financial capacity to send children to school, even children with disability, is a factor that is important in urban areas but has less weight in areas where the very existence of a school is lacking and where socio-cultural barriers such as stigmatisation of certain types of disability and beliefs concerning girls’ education remain major obstacles.
Conclusions Regarding AccessTo Sum Up• The proportion of non-disabled children currently accessing public school is almost twice the proportion
of children with disability. Recent efforts remain insufficient for children with disability. Results show that policy makers’ effort to send children back to school is not yet reaching children who became disabled at an early stage.
• In general, within all age groups surveyed, males have more access to school than females. At all ages, women without disability have less access to school than men who become disabled before school-starting age.
• Boys with physical disability are increasingly accessing school, whereas boys with sensorial disability or mental difficulty (with the exception of epilepsy) are lagging behind. For girls the main issue remains the access of all girls to school. The gap that we observe with regards to physical disability can be explained by easier access of boys with these disabilities due to social norms of acceptability and minimal effort required within classes in order to include them within the education process.
• In the main towns of the country and for children aged between 7 and 14, the education effort has been considerable, but is not reaching children with disability, and is further enhancing this inequality. The only exception is wealthy families that have a propensity to send children to school more often, including children with disability.
• In general, where there is an absence of schools of any form in the area, the other reasons for no education due to being disabled or being a girl become secondary. However, when structures do exist, then the lack of access is attributed to the disability, before being explained by gender.
Steps ForwardThe first challenge of course remains to re-open or set up the schools. But once this is achieved, access will need to be regarded in a larger perspective, going beyond the issues of physical access to physical structures. As results in this section have clearly shown, boys with physical disability have better access than any other category when schools do exist. Access is also related to social access, closely dependent on social and cultural norms and beliefs. The question that policy-makers will then need to ask is: when a school does exist and there is a road leading up to it, what are the hidden barriers?
The most obvious one is related to gender, as results of the NDSA have shown: disabled girls are getting left behind. The solutions proposed will be specific to each context and will range from ensuring the presence of female teachers, well-separated structures, to ensuring that parents realise the need for and the benefits of sending their disabled daughter to school. Girls with less severe physical and mental or sensorial disabilities often contribute to household chores in a considerable way. Local solutions may then include the setting-up of classes for girls who do have other responsibilities at a convenient time and place.
Whatever the situation, the first step towards ensuring access is to reassure and convince parents and the community. Current efforts are being made to get girls back to school; however, the focus also needs to be on girls with disability.
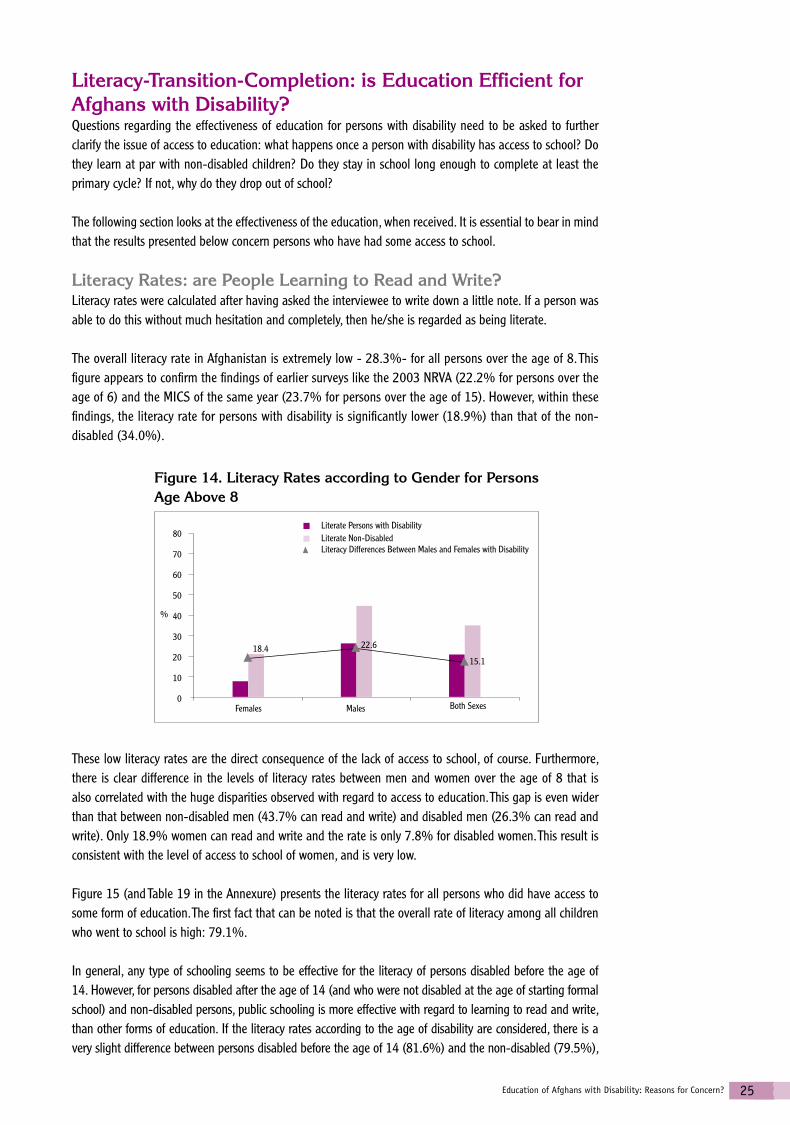
25Education of Afghans with Disability: Reasons for Concern?
Literacy-Transition-Completion: is Education Efficient for Afghans with Disability?Questions regarding the effectiveness of education for persons with disability need to be asked to further clarify the issue of access to education: what happens once a person with disability has access to school? Do they learn at par with non-disabled children? Do they stay in school long enough to complete at least the primary cycle? If not, why do they drop out of school?
The following section looks at the effectiveness of the education, when received. It is essential to bear in mind that the results presented below concern persons who have had some access to school.
Literacy Rates: are People Learning to Read and Write?Literacy rates were calculated after having asked the interviewee to write down a little note. If a person was able to do this without much hesitation and completely, then he/she is regarded as being literate.
The overall literacy rate in Afghanistan is extremely low - 28.3%- for all persons over the age of 8. This figure appears to confirm the findings of earlier surveys like the 2003 NRVA (22.2% for persons over the age of 6) and the MICS of the same year (23.7% for persons over the age of 15). However, within these findings, the literacy rate for persons with disability is significantly lower (18.9%) than that of the non-disabled (34.0%).
These low literacy rates are the direct consequence of the lack of access to school, of course. Furthermore, there is clear difference in the levels of literacy rates between men and women over the age of 8 that is also correlated with the huge disparities observed with regard to access to education. This gap is even wider than that between non-disabled men (43.7% can read and write) and disabled men (26.3% can read and write). Only 18.9% women can read and write and the rate is only 7.8% for disabled women. This result is consistent with the level of access to school of women, and is very low.
Figure 15 (and Table 19 in the Annexure) presents the literacy rates for all persons who did have access to some form of education. The first fact that can be noted is that the overall rate of literacy among all children who went to school is high: 79.1%.
In general, any type of schooling seems to be effective for the literacy of persons disabled before the age of 14. However, for persons disabled after the age of 14 (and who were not disabled at the age of starting formal school) and non-disabled persons, public schooling is more effective with regard to learning to read and write, than other forms of education. If the literacy rates according to the age of disability are considered, there is a very slight difference between persons disabled before the age of 14 (81.6%) and the non-disabled (79.5%),
80
70
60
50
40
30
20
10
0Females Males Both Sexes
Figure 14. Literacy Rates according to Gender for Persons Age Above 8
Literate Persons with Disability
Literate Non-Disabled Literacy Differences Between Males and Females with Disability
%
18.4 22.6
15.1
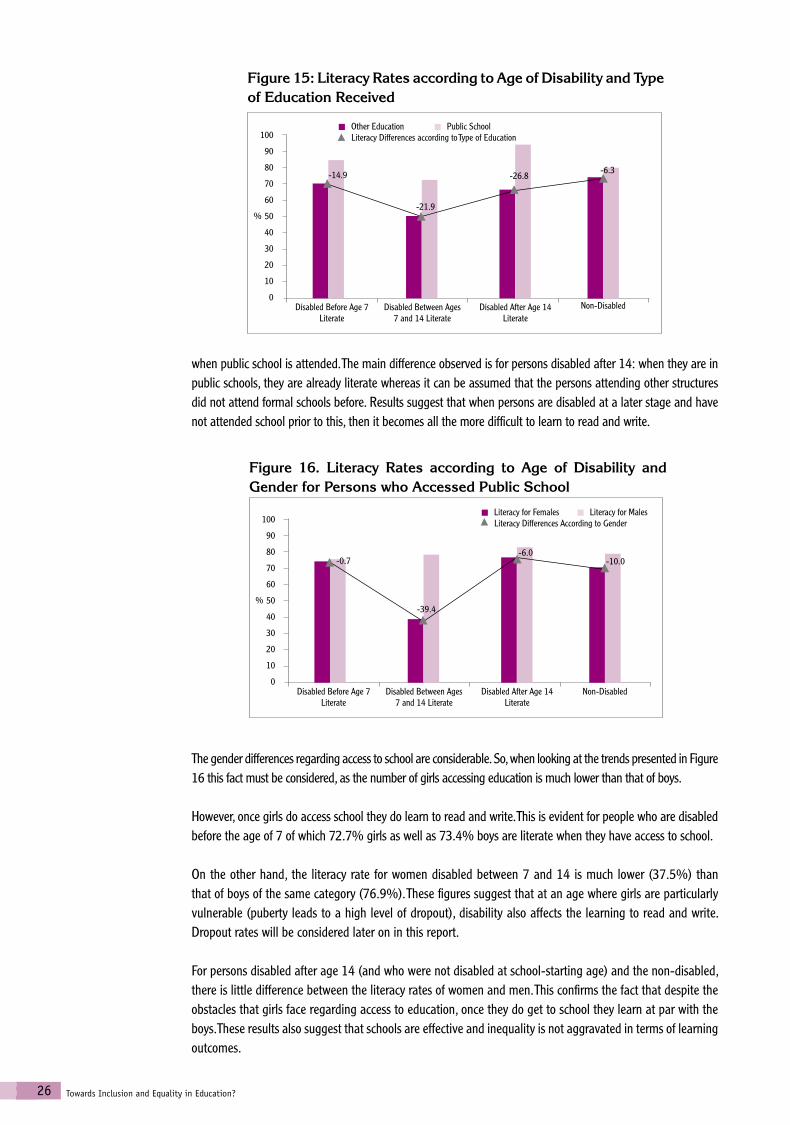
26 Towards Inclusion and Equality in Education?
when public school is attended. The main difference observed is for persons disabled after 14: when they are in public schools, they are already literate whereas it can be assumed that the persons attending other structures did not attend formal schools before. Results suggest that when persons are disabled at a later stage and have not attended school prior to this, then it becomes all the more difficult to learn to read and write.
The gender differences regarding access to school are considerable. So, when looking at the trends presented in Figure 16 this fact must be considered, as the number of girls accessing education is much lower than that of boys.
However, once girls do access school they do learn to read and write. This is evident for people who are disabled before the age of 7 of which 72.7% girls as well as 73.4% boys are literate when they have access to school.
On the other hand, the literacy rate for women disabled between 7 and 14 is much lower (37.5%) than that of boys of the same category (76.9%). These figures suggest that at an age where girls are particularly vulnerable (puberty leads to a high level of dropout), disability also affects the learning to read and write. Dropout rates will be considered later on in this report.
For persons disabled after age 14 (and who were not disabled at school-starting age) and the non-disabled, there is little difference between the literacy rates of women and men. This confirms the fact that despite the obstacles that girls face regarding access to education, once they do get to school they learn at par with the boys. These results also suggest that schools are effective and inequality is not aggravated in terms of learning outcomes.
100
90
80
70
60
50
40
30
20
10
0Disabled Before Age 7
Literate
Figure 16. Literacy Rates according to Age of Disability and Gender for Persons who Accessed Public School
-0.7
-39.4
-6.0-10.0
Disabled Between Ages 7 and 14 Literate
Disabled After Age 14 Literate
Non-Disabled
Literacy for Females Literacy for Males Literacy Differences According to Gender
%
Figure 15: Literacy Rates according to Age of Disability and Type of Education Received
100
90
80
70
60
50
40
30
20
10
0Disabled Before Age 7
Literate
Other Education Public School Literacy Differences according to Type of Education
-14.9
-21.9
-26.8-6.3
Disabled Between Ages 7 and 14 Literate
Disabled After Age 14 Literate
Non-Disabled
%
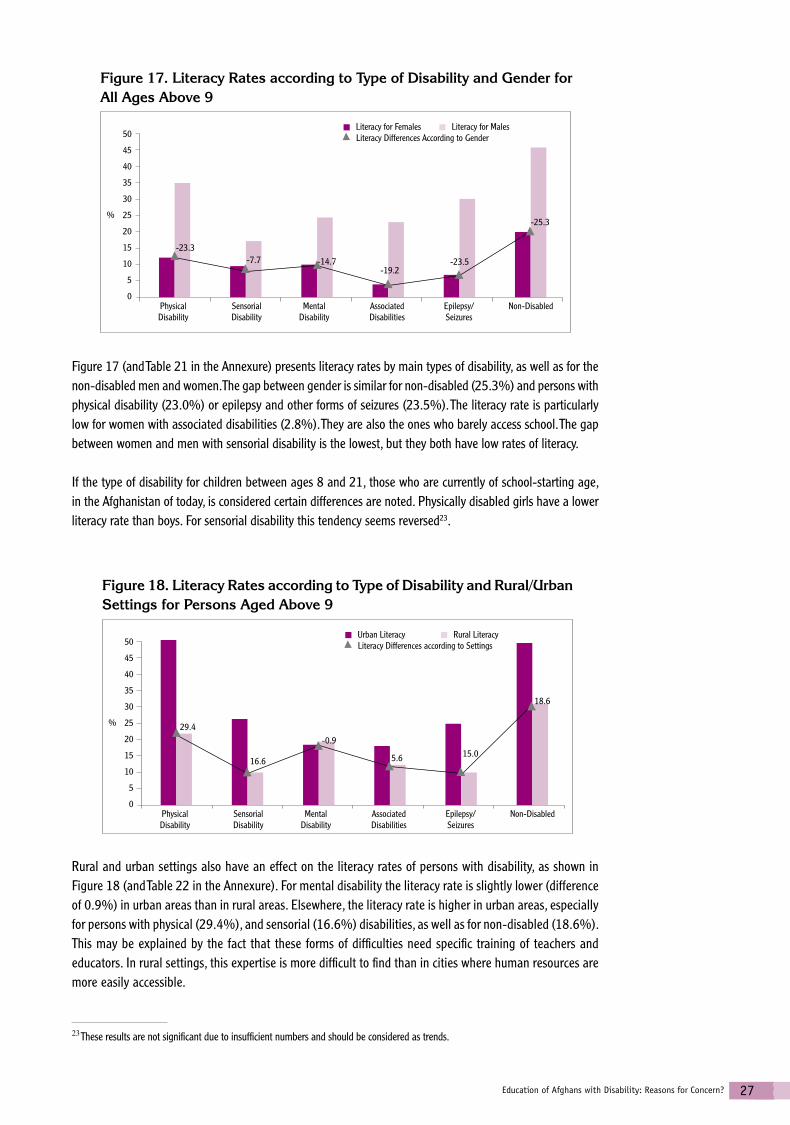
27Education of Afghans with Disability: Reasons for Concern?
5.6
50
45
40
35
30
25
20
15
10
5
0Physical Disability
Figure 17. Literacy Rates according to Type of Disability and Gender for All Ages Above 9
-23.3-7.7 -14.7
Sensorial Disability
Mental Disability
Associated Disabilities
Literacy for Females Literacy for Males Literacy Differences According to Gender
%
-19.2-23.5
-25.3
Epilepsy/Seizures
Non-Disabled
50
45
40
35
30
25
20
15
10
5
0Physical Disability
Figure 18. Literacy Rates according to Type of Disability and Rural/Urban Settings for Persons Aged Above 9
29.4
16.6
Sensorial Disability
Mental Disability
Associated Disabilities
Urban Literacy Rural Literacy Literacy Differences according to Settings
%
15.0
18.6
Epilepsy/Seizures
Non-Disabled
23 These results are not significant due to insufficient numbers and should be considered as trends.
Figure 17 (and Table 21 in the Annexure) presents literacy rates by main types of disability, as well as for the non-disabled men and women. The gap between gender is similar for non-disabled (25.3%) and persons with physical disability (23.0%) or epilepsy and other forms of seizures (23.5%). The literacy rate is particularly low for women with associated disabilities (2.8%). They are also the ones who barely access school. The gap between women and men with sensorial disability is the lowest, but they both have low rates of literacy.
If the type of disability for children between ages 8 and 21, those who are currently of school-starting age, in the Afghanistan of today, is considered certain differences are noted. Physically disabled girls have a lower literacy rate than boys. For sensorial disability this tendency seems reversed23.
Rural and urban settings also have an effect on the literacy rates of persons with disability, as shown in Figure 18 (and Table 22 in the Annexure). For mental disability the literacy rate is slightly lower (difference of 0.9%) in urban areas than in rural areas. Elsewhere, the literacy rate is higher in urban areas, especially for persons with physical (29.4%), and sensorial (16.6%) disabilities, as well as for non-disabled (18.6%). This may be explained by the fact that these forms of difficulties need specific training of teachers and educators. In rural settings, this expertise is more difficult to find than in cities where human resources are more easily accessible.
-0.9

28 Towards Inclusion and Equality in Education?
Figure 19. Attendance Rates by Sex for Persons with Disability and Non-Disabled Aged 7 to 18
70
60
50
40
30
20
10
0Child with Disability Non-Disabled
Girls Attendance Rate
Boys Attendance Rate Attendance Differences
to Gender
%
Whenever and Wherever Schools Exist, are Children with Disability Completing Education Cycles?This question is essential particularly during the current time, when new schools are being established and efforts are being made to increase the number of children attending schools. What happens once children are in school? Do the educational structures retain children long enough to complete the primary cycle? How many children go on to the higher education cycles?
The following section examines the capacity of the education systems to retain children with disability long enough to complete minimum levels of education. The results presented below relate to the persons who actually did access school, these however remain a minority to date.
Attendance: Children Are Catching Up24
The recent political events in Afghanistan have led to a very specific current situation. Children of different ages are going to school; but their profiles have one very specific dimension, characteristic of post-conflict situations: sometimes children start primary school at 15 years of age, or even older because schools are re-opening in a more politically stable and secure environment.
For girls, the improvement is even more spectacular considering that since the change of the political regime, enrolment for girls is a priority. Figure 19 (and Table 23 in the Annexure) show that a large majority (67.9%) of boys between ages 7 and 18, as well as a large number of boys with disability (43.5%) in the same age group are currently in school. The figures are of course not as high for non-disabled girls or for girls with disability: only 37.8% of the former and 16.8% of the latter are currently in school. Further analysis reveals that the difference is not in the dropout rate, which is lower for girls than for boys, but in the non-access rate which is a lot higher (respectively 58.5% and 80.2% for non-disabled girls and girls with disability). Moreover, children with disability, especially girls, start school at an older age, around nine.
Figure 20 (and Table 24 in the Annexure) demonstrates that the attendance rate is particularly high for non-disabled boys between 7 and 13 years of age (76.8%), which corresponds to the usual age for primary school attendance. It remains high after age 14 (more than half of the boys between 14 and 18 go to school), because boys who could not go to school during the war period started going to school after 2002, even if it was at a higher age. They started primary school between 8 and 15 years of age instead of at age 7.
The same phenomenon is not observed for non-disabled girls. If there is a clear increase in attendance between ages 7 and 14 in comparison to the attendance rate for girls of this age group in the previous period, the rate falls considerably after age 14 (19.7% of the 14 to 18 age group go to school). This is probably due
24 N.B.: Attendance Rate= (Number of Children of an Age Group currently in School)/(Total Number of Children of the Age Group).
-26.7
-30.1

29Education of Afghans with Disability: Reasons for Concern?
in part to puberty and marriage, both leading the family to withdraw girls from school. It is also due to the fact that schools that have recently opened only teach up to Class 6 or lower. Finally, another reason to be considered is that once girls have completed the primary level, they leave school: the head of family often does not see the usefulness of sending girls to school after primary level.
For children with disability, the situation is different. Between ages 7 and 13, the attendance rate is lower than for non-disabled children, especially for girls. More than half (63.2%) non-disabled children go to school but only a little more than a third of disabled children (36.1%) attend school. Among the latter, only 21.1% of disabled girls attend school at that age. After age 13, the number of boys with disability going to school lessens (38.2% go to school), but the drop is considerable for girls with disability (only 10.9% aged 14 to 18 years old go to school). Already at a disadvantage for reasons stated above, disability is yet another factor that is an impedement for girls from completing their education.
Retention, Transition and Completion RatesRetention of children until the last grade of primary school is a major challenge for schools. The challenge is not only to send children to school, but to have the highest number of them accomplish one or more cycles of study. School efficiency can be measured by comparing the number of children who are still in school at the end of the primary cycle.
Transition rates, as explained above, relate to the number of persons who make it to secondary education.
Completion rates look at the proportion of persons who complete school.
Higher education looks at the proportion of persons who access at least the first year of university. In view of the very small number of persons who actually reach this level in Afghanistan, the further level of university education was not assessed.
Figure 21 (and Table 25 in the Annexure) illustrates the level of education reached according to the age at which a person becomes disabled. There is a statistically significant difference between persons who become disabled at an early age (before age 7) and people disabled after school age or non-disabled. Not only do persons disabled at an early age have problems accessing the education system, but once in school, they have difficulties staying within the system. It appears that children who become disabled once in school, have more chances of completing their education than if they were disabled before school-going age. NDSA results explain that persons who are disabled between the ages of 7 and 14 have similar retention and completion rates than persons disabled after 15 and the non-disabled: further breakdown between these categories did not yield any significant differences. Furthermore, within the sample there were very few persons, disabled before the age of 7 and who went on to university.
Figure 20. Attendance Rates by Sex and Age Groups for Persons with Disability and Non-Disabled
80
70
60
50
40
30
20
10
0Boys with Disability
7.9
25.6
10.2
28.5
Non-Disabled Boys Girls with Disability Non-Disabled Girls
Age Category 7-13 Age Category 14-18 Attendance Differences according to Age Groups
%

30 Towards Inclusion and Equality in Education?
The second factor that influences retention and transition is the type of disability that the person has. Figure 22 (and Table 26 in the Annexure) present these results for persons who were disabled during their education years (before the age of 18).
The overall trends are similar for all types of disability as well as for the non-disabled persons. The proportion of persons who finish primary school is not very high and the number of persons who actually finish secondary school is extremely low. If the various types of disability are considered, persons who have a physical disability during the school-going years do better at the primary level than all the others including the non-disabled. This can lead to the assumption that social norms of valorisation and acceptance do play an important role. Additionally, physically disabled persons have special needs with regards to access but once in school the teaching methods are the same as those used for the rest of the children. This is not the case for sensorial and mental disabilities, where actually getting to school is not the major obstacle but the main challenge lies in the adaptation of teaching methods and the training of teachers. Sensitisation of other children to their special needs is also an important element in order to fight stigma and discrimination.
Finally, the gender factor is essential when looking at these results. The overall trends make it obvious that it is the physically disabled boys who have the highest access and are retained in schools. The number of disabled girls is far lower.
Dropout: Rates and ReasonsThis section presents the same trends as above but for dropout rates, which are directly linked to the retention and completion rates. Dropout rates show the proportion of persons leaving school at each level described above. These rates provide a better understanding of the levels at which persons with disability are the most vulnerable within the education process.
Figure 21. Retention, Transition and Completion Rates of Persons having Accessed Education according to Age of Disability
60
50
40
30
20
10
0In Class 5 and Above In Class 6 and Above In Class 12 and Above Higher Education
Persons Disabled Before Age 7 Persons Disabled Between Ages 7 and 14 Persons Disabled After Age 15 and Non-Disabled
%
60
50
40
30
20
10
0In Class 5 and Above
Figure 22. Retention, Transition and Completion Rates according to Different Types of Disability
In Class 6 and Above In Class 12 and Above Higher Education
%
Physical Disability Before Age 18 Sensorial Disability Before Age 18 Mental Disability Before Age 18 Associated Disabilities Before Age 18 Epilepsy/Seizures Before Age 18 Non-Disabled or Disabled After Age 18

31Education of Afghans with Disability: Reasons for Concern?
Figure 23. Dropout according to Age of Disability for Persons Age Above 23
80
70
60
50
40
30
20
10
0Disabled Before
Age 7Disabled Between
Ages 7 and 14Disabled Between Ages 15 and 20
Disabled After Age 20 and Non-Disabled
Dropout Before Class 6 (Age>12) Dropout Class 6 (Age>12)
Dropout Class 7 to 11 (Age>18) Dropout Class 12 (Age>18)
Reached Class 12 (Age>23)
%
50
45
40
35
30
25
20
15
10
5
0Physical Disability
Before Age 18
Figure 24. Dropout and Completion according to Type of Disability
Sensorial DisabilityBefore Age 18
Mental DisabilityBefore Age 18
Associated DisabilitiesBefore Age 18
Dropout Before Class 6 Dropout Class 6 Total Dropout Before Class 12 Finished Class 12 Higher Education
%
Epilepsy/SeizuresBefore Age 18
Disabled After Age 18/Non-Disabled
Figure 23 (and Table 27 in the Annexure) confirms the results found in the previous section. When people become disabled before age 7 or are disabled during school years, the chances that they will drop out before the end of primary school are high. There is no person with disability who became disabled before school age and reached the higher education level in the sample. If persons are disabled between ages 15 and 20, they have a high chance of not completing secondary school. Disability also has a negative impact on students resulting in the abandoning of school, inability to follow class or even rejection by the educational system. Sensitisation campaigns for teachers and the community should focus on ways to retain children who become disabled while still in the educational process. However, Figure 24 suggests that this issue is less of a problem for physically disabled children, especially boys, than for children with other types of disability.
It is important to note that the majority of persons with disability drop out during the primary years; whether they are disabled or not. However, the dropout rate in primary school is the lowest for the physically disabled. A closer look at the dataset shows that those that remain in school are mainly boys; girls with any type of disability have a higher probability of dropping out before completion of the primary cycle. Huge retention efforts need to be made in addition to increasing access in primary schools.
For persons with sensorial and complex associated disabilities, the dropout rates are the highest at the primary level. These results clearly indicate a lack of adaptation of the education process, in terms of sensitivity, material and delivery, for these types of difficulties.

32 Towards Inclusion and Equality in Education?
There is a clear difference between the reasons why those disabled during school years and the non-disabled dropped out of school as shown in Figure 25 (and Table 29 in the Annexure). For the first group, the main reason identified by respondents and their families is their disability, economic difficulties and the absence or shutting down of school. For the non-disabled, the latter two reasons are primarily stated. It is still difficult to understand what lies behind the explanation “because of my disability”. However, since these persons did have access to school, the fact that the learning environment in general not being adapted to include children with disability, is a likely interpretation. Close examination of the results present two factors that play a role in the dropout of children with disability. First, the burden on the family (more for the physically disabled who need to be taken to school) and second the discrimination and prejudicial behaviour (more for mental and sensorial forms of disability) of classmates and teachers. This, combined with a lack of adapted material and sensitised teachers makes learning impossible for these children.
There is a strong belief that persons with physical disabilities can be included in mainstream education whereas those who have sensorial or mental difficulties need to attend specialised structures. Policy decisions will need to take this into consideration when instituting measures regarding the education of children with these forms of disability. At present they receive appropriate education incase where there are schools, often run by NGOs that have specialised teachers, methods and materials. But these opportunities are very few and mainly located in large cities. In urban areas, these structures are costly and very difficult to set up and sustain due to a lack of adequate human resources.
Is School Considered to be Useful?The answer to this question can be summed up in one word: Yes. A huge majority of Afghans interviewed in the NDSA, regardless of age, gender or where they live, consider education in general to be useful (over 90% in all categories, see Figure 26 (and Table 30 in the Annexure). The value of receiving education is not questioned. However the reasons to explain were more difficult to identify. In some villages, especially in the south of Afghanistan, education is still not considered useful for girls.
Overall there is no major difference between persons with disability and the non-disabled. The main reason given is that it is useful for everyday life. This reason is closely linked to the prospects of finding a job for male respondents. It is difficult to understand the context in which female respondents answer this question as their answers are more linked to marital status and age as well as the area in which they live. A complementary analysis needs to be done regarding this information.
Moreover, when asked whether the persons who are not currently in school (dropped out or never went to school) would like to go to school, it is encouraging to note that a huge proportion of the younger generation disabled or not, would like to go (back) to school: close to 70% of both categories aged 5 to 14 confirm this. With age, this possibility seems more and more impossible; the older generation does not
40
30
20
10
0School Shutdown
Figure 25. Reasons Identified for Dropping out of School
-18.8 -14.3
Economic Difficulty
Studies Completed or Apprenticeship
Failure
Disabled Before Age 18 Disabled After Age 18 and Non-Disabled Differences Between Two Categories
%
33.8
-1.4
Become Disabled Other or Don’t Know
0.1
0.8
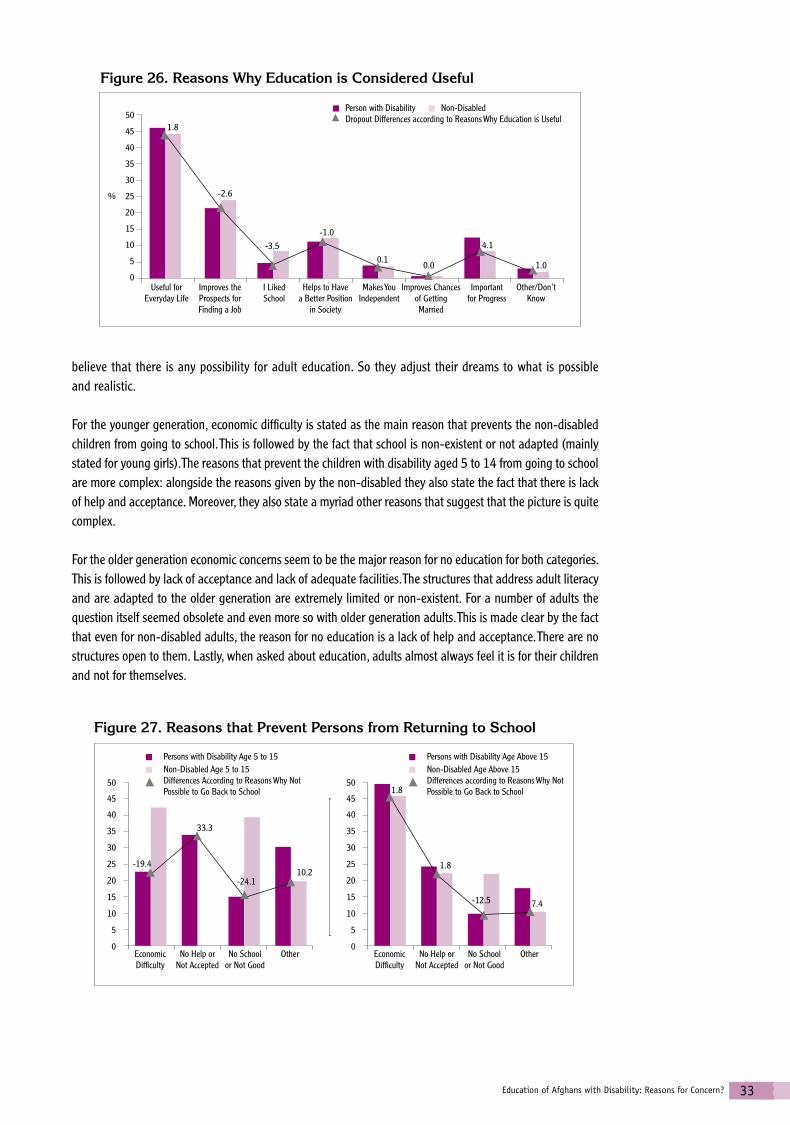
33Education of Afghans with Disability: Reasons for Concern?
50
45
40
35
30
25
20
15
10
5
0Useful for
Everyday Life
Figure 26. Reasons Why Education is Considered Useful
1.8
-2.6
0.9
Improves the Prospects for Finding a Job
I Liked School
Helps to Have a Better Position
in Society
Person with Disability Non-Disabled Dropout Differences according to Reasons Why Education is Useful
%
0.1
4.1
1.0
Makes You Independent
Improves Chances of Getting Married
-3.5-1.0
0.0
Important for Progress
Other/Don’t Know
believe that there is any possibility for adult education. So they adjust their dreams to what is possible and realistic.
For the younger generation, economic difficulty is stated as the main reason that prevents the non-disabled children from going to school. This is followed by the fact that school is non-existent or not adapted (mainly stated for young girls). The reasons that prevent the children with disability aged 5 to 14 from going to school are more complex: alongside the reasons given by the non-disabled they also state the fact that there is lack of help and acceptance. Moreover, they also state a myriad other reasons that suggest that the picture is quite complex.
For the older generation economic concerns seem to be the major reason for no education for both categories. This is followed by lack of acceptance and lack of adequate facilities. The structures that address adult literacy and are adapted to the older generation are extremely limited or non-existent. For a number of adults the question itself seemed obsolete and even more so with older generation adults. This is made clear by the fact that even for non-disabled adults, the reason for no education is a lack of help and acceptance. There are no structures open to them. Lastly, when asked about education, adults almost always feel it is for their children and not for themselves.
50
45
40
35
30
25
20
15
10
5
0Economic Difficulty
Figure 27. Reasons that Prevent Persons from Returning to School
Persons with Disability Age 5 to 15
Non-Disabled Age 5 to 15 Differences According to Reasons Why Not
Possible to Go Back to School
No Help or Not Accepted
No Schoolor Not Good
Other
50
45
40
35
30
25
20
15
10
5
0Economic Difficulty
Persons with Disability Age Above 15
Non-Disabled Age Above 15 Differences according to Reasons Why Not
Possible to Go Back to School
No Help or Not Accepted
No Schoolor Not Good
Other
-19.4
33.3
-24.110.2
1.8
1.8
-12.5 7.4

34 Towards Inclusion and Equality in Education?
Conclusions and Recommendations Regarding Efficiency of Education
To sum up:For Literacy• When people have access to some form of schooling, a majority of them learn to read and write.• Formal school systems show high literacy rates for both children with disability and the non-disabled.• Gender differences are less obvious with regard to the literacy rates than with regard to access. • Schools, whenever and wherever they do exist, contribute to reducing inequalities in terms of basic
learning outcomes, the first one being literacy.
For Retention and Completion of Education Cycles• A very small proportion of children with disability, who accessed education, actually make it through
school: the majority drops out during the primary cycle.• Only a handful of children with disability are present in the higher education cycles.• Girls with disability have higher dropout rates than boys and are most vulnerable during early
adolescence.• Becoming disabled is stated as the main reason for dropping out of school.• Children with physical disability, especially boys, are better off than those with other forms of disability.
Steps Forward:For physically disabled boys the main problem seems to be access, discussed in the section above. As and when schools open or re-open, these children will be integrated within the educational process, showing learning outcomes that are at par with non-disabled children, or even better.
Within schools, special focus needs to be given consistently to the needs of children with sensorial disability. The effort required is more considerable in terms of adaptation of methods and teacher training with regard to learning to read, write and communicate in general. This can be achieved by adapting the curriculum of teachers to include basic sign language or Braille for instance, in the long term. In the short term, persons who already have this training can provide this basic training, and sensitise teachers and other students regarding sensorial disability in general.
For the mentally disabled and associated disabilities, where the picture is more complex and the needs more diverse, no single method can be efficient. Depending upon the severity of the difficulties considered, the adapted solutions might range from home schooling to specialised structures. However the first step towards inclusion and acceptance of these disabilities is the sensitisation of teachers and educators to their various forms. This in turn will allow them to adapt training methods. In the mid and long term this can also help detect signs and understand the type of disability and not confuse for instance, hearing problems with intellectual disability, which has disastrous implications for the child.
Finally, the gender factor is omnipresent throughout the education process in a country like Afghanistan. Results of the NDSA suggest that once in school, girls learn at par with boys. However, they remain vulnerable at all stages of education, and disability places them even more at risk. Any policy or programme decisions will need to systematically take this factor into account. One of the imperative needs is to have female teachers present within schools, at all levels.

35Challenges Ahead to Achieve Quality and Equality in Education
Figure 28 presents the trends in education for persons under the age of 26, that is the younger generation. It shows clearly that access to education is improving for non-disabled persons (over 50% have access to school). However persons disabled before the age of 7 are still not benefiting sufficiently from this improvement (over 65% remain out of school). Retention rates in primary and secondary schools are slightly better for persons disabled after 18 and non-disabled persons.
Challenges Ahead to Achieve Quality and Equality in Education
Figure 28. Summary of the Findings Regarding Persons Under the Age of 26
80%
70%
60%
50%
40%
30%
20%
10%
0%No Education* Access to
Education*Retention Till
Class 5**Retention Till
Class 6**
Persons Disabled at Defined Ages
Disabled at Defined Ages and Non-Disabled
Completion Till Class 12**
Higher Education**
However, the proportion of persons finishing a cycle of education, primary or secondary, remains extremely low for all persons indicating the quality of the school systems might be the next priority for the Government of Afghanistan, once access to school is secured for all children.
In order to achieve the over-arching goal of equality in education, a number of fields will need to be targeted simultaneously.
Reduce Gaps between the Six Main Cities and the Rest of the CountryThe high level of access to school for children of school going-age in Kabul and Herat cities explains a better accessibility to school for children with disability. The NDSA results also highlight to what extent big cities have a lead as compared with smaller cities and villages in terms of existence of schools and access to these. However, when schools do exist in more remote areas, differences in access to education for children aged 7 to 14 show that educational efforts are not adequately reaching children with disability, but further enhance inequality among persons with disability. The first priority of course, is to open or re-open the schools. But unless specific attention is given to include children with disability, these structures will become just another system for excluding this vulnerable group. In order to be inclusive, schools need to be consistently
* For ‘No Education’ and ‘Access to Education’ the figure presents the differences between persons disabled before age 7 on one hand, and those disabled after this age and the non-disabled on the other hand. ** For these categories, differences between people disabled before age 18 on one hand and those disabled after this age and the non-disabled on the other hand are presented. This figure presents the overall trends for the younger generation, as various age groups are considered.
36 Towards Inclusion and Equality in Education?
attentive to the aspects that are discussed below. If not, schools will be at best, a way of maintaining in place prejudices, beliefs and discriminatory practices; at worst, they will further enhance inequality between the fortunate and the vulnerable.
Focusing on the Quality, Relevance and Efficiency of EducationThe NDSA shows that when persons have access to some form of schooling a majority of them learn to read and write. Formal school systems show high literacy rates for both children with disability and the non-disabled. Moreover, gender differences are less obvious with regard to the literacy rates than with regards to access. Experiences of other countries have also shown that once girls access and stay in schools, they learn at par, and often better than boys. These results suggest that school, whenever and wherever it does exist, contributes to reducing inequalities in terms of basic learning outcomes, the first one being literacy. Furthermore, within schools children with physical disabilities have the same completion rates as the non-disabled.
The term that is most commonly used to describe this essential role of education is inclusion. As stated in the first section of the report, literacy and completion are important indicators of achievement, but they do not say much about the content of education as well as its relevance to everyday life, and an ever-changing work-market. If policy-makers are in agreement that one of the main roles of education is to promote social cohesion and responsibility, then they will have to look more closely at content and delivery of information. Education that is relevant is composed of the four pillars: learning to know, learning to be, learning to do and learning to live together. The components of these pillars need to be defined according to the context, the last one being of utmost importance, especially in a post-conflict period.
Girls with Disability: a Dual ChallengeIn general, at all ages, males have more access to school than females. At all ages, women without disability have less access to school than men who become disabled before school-starting age. The effect of gender is significant within almost all indicators that have been presented in this report. Gender seems to have more importance than being disabled.
The reasons behind these differences are many and intertwined. They range from beliefs and cultural practices, to distance of school, the availability of female teachers and adequate facilities such as toilets. These reasons must be taken into account systematically and according to the specific requirements. The need for consideration of the above issues is also evident when the reasons given for not sending girls to school are examined. A number of persons believe that schools are not for girls. This is in contradiction to the fact that a large majority of persons think that education is useful in general (over 90% of our sample).
Gender is a complex factor to understand and to undertake through policies and programmes, since it usually entails deep-rooted beliefs and cultural practices that cannot be changed overnight. The issues of education for girls will require a lot of thought and discussion among different actors involved, including Ministry of Women Affairs. At school, sensitisation of girls and women’s rights should start within the boys’ classes.
All of the above clearly demonstrates that beyond making school accessible in terms of distance, facilities and teachers, a huge effort needs to be made regarding gender stereotypes and gender specific attitudes. This should be done at every level including teacher training, curricula and material development, and teaching methodologies in order to encourage girls with disability to access education at par with other children.
Different Types of Disability, Different Access Boys with physical disability are increasingly accessing school, whereas boys with sensorial disability or mental disability (with the exception of epilepsy) are lagging behind. For girls the main issue remains the

37Challenges Ahead to Achieve Quality and Equality in Education
access of all girls to school. The gap that is observed pertaining to physical disability can be explained by easier access of boys with these disabilities due to social norms of acceptability and minimal effort required within classes in order to include them within the education process.
Findings also show differences in terms of learning outcomes such as literacy. It is evident that within schools, special focus should be given to children with sensorial disability as more efforts are needed to adapt methods and teacher training to enhance the quality of learning for reading, writing and communication skills in general. As access to education improves, it is plausible that certain other forms of disability will become more apparent, such as learning and intellectual disabilities. At present these forms of difficulties are still hard to detect.
The challenge here is huge, as there is no one uniform way to proceed. It calls for a variety of measures that need to be adapted to local contexts. However, it is possible to lay the framework for a system that fights exclusion of all children. This can only be done through sensitisation: that of teachers and educators on one hand, and of parents and communities on the other. Teachers need to be trained about disability: what are the various forms and the related conditions. They also need to be aware of training methods, or at least have the required knowledge on where to access resources and information. Parents need to be convinced of the importance of education for their children who have disabilities, regarding the possibilities of developing their abilities and ways of helping them. If these two domains are strengthened, then finding teaching solutions based on the context and available resources, will be facilitated.
Mainstreaming Disability: the Effective Way to Reduce Inequality in EducationThe most disturbing finding of the survey with regard to education is that the efforts of different decision makers are not reaching persons with disability and the non-disabled equally. The proportion of non-disabled children accessing public school is almost twice as high than the proportion of children with disability. Results from the NDSA show that policy makers’ efforts to send children back to school is not yet reaching children who became disabled at an early stage.
Additionally, in the major cities of the country where the schools do exist and the effort to bring children into schools has been considerable, children aged between 7 and 14 are not benefiting from this effort. In fact, these efforts are further enhancing inequality and leaving children with disability behind.
Education for all is based on the strong belief that having access to school is a major component of fighting poverty and inequality in the long term. However, as and when policies and programmes are set up, the situation of children with disability is almost never considered at the very onset — when measures can be effective and easier to implement in terms of human efforts and financial costs. Disability concerns are taken into account once they become a glaring reality on the field and often when numbers of children with disability are considered sufficient in order to take action. However, the fact remains that a number of experiences have shown that taking into consideration the concerns of all vulnerable groups in general, children with disability in particular, at the very time when crucial decisions are being made, is not only effective and economical, but also the only solution that is sustainable in the long term. Mainstreaming disability also means making education structures sensitive not only to accept and include children with disability, but to go one step further and seek them out.

38 Towards Inclusion and Equality in Education?
Bibliography
BAKHSHI P., DUBOIS J.L. TRANI J.F. (2004), “Enhancing Security and Social Sustainability: Strengthening Capabilities: the Case of Persons with Disabilities in Afghanistan,” Paper Presented at 4th International Conference on the Capability Approach: Enhancing Human Security, 5–7 September 2004, University of Pavia, Italy.
BURCHARDT T. (2004), “Capability and Disability: the Capabilities Framework and the Social Model of Disability”, Disability and Society, December 2004.
CENTRE FOR DISEASE CONTROL AND PREVENTION (2003), “Mortality, Injury, and Disability Survey”, Preliminary Report, April 2003.
DUBOIS J.L., ROUSSEAU S., (2001), “Reinforcing Household’s Capabilities as a Way to Reduce Vulnerability an Prevent Poverty in Equitable Terms”, Paper Presented at 1st Conference on the Capability Approach, Justice and Poverty: Examining Sen’s Capability Approach, Cambridge University 5–7 June 2001.
MINISTRY OF EDUCATION (2004), National Report on the Development of Education in Afghanistan, 10 August 2004.
MITRA S., (2003), “The capability Approach of Disability”, 3rd Conference on the Capability Approach, From Sustainable Development to Sustainable Freedom, 7–9 September 2003, University of Pavia, Italy.
NUSSBAUM, M. (2000), Women and Human Development: The Capabilities Approach, Cambridge University Press, Cambridge.
PETERS S.J. (2003), Inclusive Education: Achieving Education for All by Including those with Disabilities and Special Education Needs, Report Prepared for the Disability Group, The World Bank, 30 April 2003.
SEN A. (1999) Development as Freedom, Oxford University Press, Oxford.
THAKKAR M., CERVEAU T., DAVIN E., (2004), “Afghan Perception on Disabilities, A Research Project on the Perceptions and practices Regarding Disability in Afghanistan, to Inform a Communication Strategy”, Study carried out by ALTAI Consulting for UNICEF, UNOPS, UNDP, Kabul.
TERZI L. (2003), “A Capability Perspective on Impairment, Disability and Special Needs: Towards Social Justice in Education,” Paper Presented at 3rd Conference on the Capability Approach, From Sustainable Development to Sustainable Freedom, 7–9 September 2003, University of Pavia, Italy.
TURMUSANI M. (2004), “Disabled People & Education in Afghanistan”, Disability World, no. 23, April–May 2004.
UNITED NATIONS DEVELOPMENT PROGRAMME (2004), National Program for Action on Disability, The expected outcome, Report Kabul.

39Bibliography
UNDP (2004), Afghanistan National Human Development Report, “Security with a Human Face: Challenges and Responsibilities”, Kabul, 2004.
UNITED NATIONS ECONOMIC AND SOCIAL COMMISSION FOR ASIA AND PACIFIC (2003), Statistical Indicators for Asia and the Pacific, vol. XXXIII (2). Bangkok.
UNESCO (2006), EFA Global Monitoring Report, Paris, 2006.
UNESCO (2005), “Contributing to a more Sustainable Future: Quality Education, Life Skills and Education for Sustainable Development”, Report ED/PEQ/IQL/2005/PI/H/2, 2005, Paris.
UNESCO, The Delors Commission, (1996), “Learning the Treasure Within”, Report to UNESCO of the International Commission on Education for the Twenty-first Century, 1996, Paris.
UNITED NATIONS INTERNATIONAL CHILDREN AND EDUCATION FUND and CENTRAL STATISTICS OFFICE OF AFGHANISTAN (2003), “Multiple Indicators Cluster Survey”, Report, Kabul.
UNITED NATIONS POPULATION FUND, “The Promise of Equality Gender Equity, Reproductive Health and the Millennium Development Goals”, State of World Population 2005 Report, September 2005.
VENTEVOGEL P., AZIMI S., JALAL S., KORTMANN F. (2002), “Mental Health Care Reform in Afghanistan”, Journal of Ayub Medical College, Abbotabad, December 2002, 14 (4):1–3.
WORLD BANK (2000), Designing Household Survey in Developing Countries, Lessons from 15 Years of the Living Standards Measurement Study, volume 1, Edited by Margaret Grosh and Paul Glewwe, May 2000.
WORLD HEALTH ORGANIZATION (1987), International Classification of Impairments, Activities and Participation, WHO, Geneva.
WORLD HEALTH ORGANIZATION (2001), International Classification of Functioning, Disability and Health, Geneva.

40 Towards Inclusion and Equality in Education?
Table 7. Access to Education according to Different Types of School
Type of Education Persons with Disability
Non-Disabled Total
Government School Number 135756 10755023 10890779
% in School Category 22.3**(1) 43.6**(1) 43.1
Private School Number 5197 277229 282426
% in School Category 0.9 1.1 1.1
Training CentreNumber 5197 282555 287752
% in School Category 0.9 1.1 1.1
Religious School (Madrasa) Number 15589 547832 563421
% in School Category 2.6 2.2 2.2
In the Family/with SomeoneNumber 2599 186812 189411
% in School Category 0.4 0.8 0.7
No EducationNumber 443644 12630671 13074315
% in School Category 73.0**(1) 51.2**(1) 51.7
Total Number 607982 25288104**(2)
Source: NDSA. Note: † Some data should be interpreted with caution due to low numbers. � Weighted by population of provinces. (1) Test of comparison of proportion of percentage between Persons with Disability and Non-Disabled. **Significant at p<0.01. * Significant at p<0.05. (2) Test Chi 2 of Pearson of independence. ** Significant at p<0.01.
Table 8. Access to Education according to Age
Access to Education Persons with Disability Non-Disabled Total
Access for Age 7 to 14Number 53913 7975070 8028983
% in Age Category 36.1**(1) 65.4**(1) 65.1
Total for Age 7 to 14 Number 149397 12189494 12338891
Access for Age 15 to 25Number 31828 1632194 1664022
% in Age Category 26.8 31.7 31.6
Total Age 15 to 25 Number 118868 5149778 5268646
Access for Age 26 and above
Number 63007 1650252 1713259
% in Age Category 19.7*(1) 25.9*(1) 25.6
Total for Age 26 and Above Number 320230 6360544 6680774**(2)
Source: NDSA. Note: Weighted by population of provinces. (1)** Test of comparison of proportion of percentage between Persons with Disability and Non-Disabled. Significant at p<0.01. * Significant at p<0.05. (2)Test Chi 2 of Pearson of independence. ** Significant at p<0.01.
Annexure

41Annexure
Table 9. Access to Education according to Age of Disability and Gender
Access to Education Females Males Total
Access for Persons Disabled Before Age 7
Number 14940 53263 68203
% in Age Became Disabled Category 16.0*(2) 37.4**(1) 28.9
Access for Persons Disabled After Age 7
Number 10393 68853 79246
% in Age Became Disabled Category 7.4**(1) 34.0**(1) 23.2
Access for Non-DisabledNumber 2170153 5173033 7343186
% in Non-Disabled Category 24.3**(1) 56.0**(1) 40.4
Total Number 9081387 9446436 18527823**(2)
Source: NDSA. *Note: Data presented above excludes respondents less than age 6. �Weighted by estimates of population of provinces. Test of comparison of proportion of percentage between males and females for persons became disabled before 7, after 7 and non-disabled. (1)** Significant at p<0.01. * Significant at p<0.05. (2)Test Chi 2 of Pearson of independence. ** Significant at p<0.01.
Table 10. Access to Education according to Age of Disability, Gender and Age Categories
Access to School† Disabled Before Age 7
Disabled After Age 7 and
Non-DisabledTotal
Male Age 7-14 Access to SchoolNumber 38973 2526108 2565081
% in Age Category 49.2**(1) 77.9**(1) 77.2
Female Age 7-14 Access to SchoolNumber 9094 1422519 1431613
% in Age Category 16.5**(1) 48.8**(1) 48.2
Male Age 15-25 Access to SchoolNumber 11042 1371854 1382896
% in Age Category 34.7**(1) 52.4**(1) 52.2
Female Age 15-25 Access to SchoolNumber 5196 501454 506650
% in Age Category 23.5 18.7 18.7
Male Age Above 26 Access to SchoolNumber 3248 1340026 1343274
% in Age Category 10.4**(1) 37.4**(1) 37.2
Female Age Above 26 Access to SchoolNumber 650 254624 255274**(2
% in Age Category 4.0 7.3 7.3
Source: NDSA. Note: † Some data should be interpreted with caution due to low numbers. Data presented above excludes respondents less than 6 years old. � Weighted by estimates of population of provinces. (1) Test of comparison of proportion of percentage between persons became disabled before 7, after 7 and non-disabled. **Significant at p<0.01 * Significant at p<0.05. (2) Test Chi 2 of Pearson of independence. ** Significant at p<0.01. Don’t know and refuse to answer not included in table : <0.5%.
Table 11. Access to Education according to Gender and Type of Disability for Persons Aged 7 to 14
Access by Gender and Types of Disability †
Physical Disability
Sensorial Disability
Mental Disability
Associated Disabilities
Epilepsy/ Seizures
Non-Disabled Total
Boys’ Access to School
Number 21435 11042 2598 2598 5196 5395829 5438698
% in Accessing School
62.3 37.0 80.0 28.6 50.0 77.3 76.9
Girls’ Access to School
Number 3248 1299 3248 0 3248 2584438 2595481**(2% in Accessing School
17.2 11.1 35.7 0.0 26.3 49.6 49.2
Source: NDSA. Note: † Some data should be interpreted with caution due to low numbers. Data presented above excludes respondents less than 6 years old Weighted by estimates of population of provinces. (2) Test Chi 2 of Pearson of independence. ** Significant at p<0.01. Don’t know and refuse to answer not included in table : <0.5%.

42 Towards Inclusion and Equality in Education?
Table 12. Access to Education according to Urban and Rural Areas
Access to School by Settings Disabled Before Age 7
Disabled After Age 7 and Non-Disabled Total
Access to School in Urban Settings
Number 26632 3070433 3097065
% in Accessing School 36.0**(1) 56.9**(1) 56.7
Total Urban Population Number 74049 5391932 5465981
Access to School in Rural Settings
Number 41571 4351999 4393570
% in Accessing School 25.7 33.1 33.0
Total Rural Population Number 161738 13135892 13297630**(2)
Source: NDSA. Note: Data presented above excludes respondents less than age 6. Weighted by estimates of population of provinces. (1) Test of comparison of proportion of percentage between persons with disability before 7 and persons with disability after 7 and non-disabled for access to school according to settings. **Significant at p<0.01 * Significant at p<0.05. (2) ** Test Chi 2 of Pearson of independence. Significant at p<0.01.
Table 13. Access to Education according to Gender Differences in Urban and Rural Areas
Access by Gender and Settings Disabled Before Age 7
Disabled After Age 7 and Non-Disabled Total
Access of Males to School in Urban Settings
Number 18837 2004518 2023355
% in Accessing School 41.4**(1) 73.0**(1) 72.5
Access of Females to School in Urban Settings
Number 7795 1065915 1073710
% in Accessing School 27.3 40.3 40.2
Access of Males to School in Rural Settings
Number 34426 3237368 3271794
% in Accessing School 35.6 48.3 48.1
Access of Females to School in Rural Settings
Number 7145 1114631 1121776
% in Accessing School 11.0 17.3 17.3**(2)
Source: NDSA. Note: Data presented above excludes respondents less than age 6. � Weighted by estimates of population of provinces. Test of comparison of proportion of percentage between persons with disability before 7 and persons with disability after 7 and non-disabled for access to school according to settings and gender. Significant at p<0.01 (2) ** Test Chi 2 of Pearson of independence. Significant at p<0.01.
Table 14. Access to Education according to Age of Disability and Geographical Area
Access by Regions�† Disabled Before Age 7
Disabled After Age 7 and Non-Disabled Total
Access to School Central Region
Number 25333 2510519 2535852
% in Accessing School 41.1 46.0 45.9
Access to School Western Region
Number 16239 979525 995764
% in Accessing School 31.3 36.2 36.1
Access to School Eastern Region
Number 7145 1377700 1384845
% in Accessing School 21.6**(1) 42.0**(1) 41.8
Access to School Southern Region
Number 4547 445593 450140
% in Accessing School 14.0 22.9 22.8
Access to School North-Western Region
Number 7795 1026942 1034737
% in Accessing School 30.8 41.9 41.8
Access to School North-Eastern Region
Number 7145 1082154 1089299
% in Accessing School 22.9*(1) 40.3*(1) 40.1
Source: NDSA. Note: † Some data should be interpreted with caution due to low numbers. Data presented above excludes respondents less than 6 years old. � Weighted by estimates of population of provinces. Test of comparison of proportion of percentage between persons with disability before age 7 and persons with disability after age 7 and non-disabled for access to school according to regions. Significant at p<0.01 (2) ** Test Chi 2 of Pearson of independence. Significant at p<0.01.

43Annexure
Table 15. Access to Education according to Age of Disability, Gender and Geographical Area
Access by Gender and Regions�† Disabled Before Age 7
Disabled After Age 7 and Non-Disabled Total
Access of Males to School Central Region
Number 20136 1786918 1807054% in Accessing School 57.4 64.6 64.5
Access of Females to School Central Region
Number 5196 723601 728797% in Accessing School 19.5 26.8 26.8
Access of Males to School Western Region
Number 12341 632664 645005% in Accessing School 40.4 45.7 45.6
Access of Females to School Western Region
Number 3897 346861 350758% in Accessing School 18.2 26.2 26.1
Access of Males to School Eastern Region
Number 6496 1058120 1064616% in Accessing School 27.8 62.6 62.1
Access of Females to School Eastern Region
Number 650 319580 320230% in Accessing School 6.7 20.1 20.0
Access of Males to School Southern Region
Number 3248 365698 368946% in Accessing School 15.6 35.6 35.2
Access of Females to School Southern Region
Number 1299 79895 81194% in Accessing School 11.1 8.7 8.7
Access of Males to School North-Western Region
Number 5846 667090 672936% in Accessing School 37.5 55.9 55.7
Access of Females to School North-Western Region
Number 1949 359852 361801% in Accessing School 20.0 28.6 28.5
Access of Males to School North-Eastern Region
Number 5196 731396 736592% in Accessing School 30.8 52.8 52.5
Access of Females to School North-Eastern Region
Number 1949 350758 352707% in Accessing School 13.6 27.1 26.9
Source: NDSA. Note: † Some data should be interpreted with caution due to low numbers. Data presented above excludes respondents less than 6 years old. � Weighted by estimates of population of provinces. Test of comparison of proportion of percentage between persons with disability before age 7 and persons with disability after age 7 and non-disabled for access to school according to regions and gender. ** Significant at p<0.01. * Significant at p<0.05. (2) ** Test Chi 2 of Pearson of independence. Significant at p<0.01.
Table 16. Access to Education of Children with Disability and Non-disabled Children Aged 7 to 17 according to the Level of Education of the Head of Household
Level of Education of the Head of Household
Age of Disability Access No Access Total
No school
Less than 15 years old
Number 44 115 159% in Class Category 27.7**(1) 72.3 100.0
More than 15 years old
Number 3633 3642 7275% in Class Category 49.9 50.1 100.0
Total Number 3677 3757 7434
Class 1 to 11
Less than 15 years old
Number 28 44 72% in Class Category 38.9 61.1 100.0
More than 15 years old
Number 2105 873 2978% in Class Category 70.7 29.3 100.0
Total Number 2133 917 3050
Class 12 or Above
Less than 15 years old
Number 23 12 35% in Class Category 65.7****(1) 34.3 100.0
More than 15 years old
Number 1357 240 1597% in Class Category 85.0**(1) 15.0 100.0
Total Number 1380 252 1632**(2)
Source: NDSA, Note: (1) test of comparison of proportion of percentage of persons became disabled before age 15 and persons became disabled after age 15 and Non-disabled between different levels of education of the head of household. ** Significant at p<0.01. * Significant at p<0.05 (2) ** Test Chi 2 of Pearson of independence. Significant at p<0.01.

44 Towards Inclusion and Equality in Education?
Table 17. Access to Education of Children with Disability and Non-disabled Children Aged 7 to 17 according to the Level of Wealth of the Household Measured by Ownership of TV or Car, Animals and Land
Indicator of Wealth
Age Became Disabled Before or After 15 Access No Access Total
TV or Car
Less than Age 15
Number 19487 16888 36375
% in Age Became Disabled Category 53.6**(1) 46.4 100.0
More than Age 15
Number 2972870 536920 3509790
% in Age Became Disabled Category 84.7 15.3 100.0
Total Number 2992357 553808 3546165
No TV no Car
Less than Age 15
Number 42221 92886 135107
% in Age Became Disabled Category 31.3**(1) 68.7 100.0
More than Age 15
Number 5407001 4349790 9756791
% in Age Became Disabled Category 55.4 44.6 100.0
Total Number 5449222**(2) 4442676**(2) 9891898
Owns Few Sheep Cows and Land
Less than Age 15
Number 55861 100031 155892
% in Age Became Disabled Category 35.8**(1) 64.2 100.0
More than Age 15
Number 7762277 4315494 12077771
% in Age Became Disabled Category 64.3**(1) 35.7 100.0
Total Number 7818138 4415525 12233663
Owns Many Sheep Cows or Land
Less than Age 15
Number 5846 11692 17538
% in Age Became Disabled Category 33.3**(1) 66.7 100.0
More than Age 15
Number 655138 617464 1272602
% in Age Became Disabled Category 51.5**(1) 48.5 100.0
Total Number 660984**(2) 629156**(2) 1290140
Source: NDSA, Note: � Weighted by estimates of population of provinces. (1) Test of comparison of proportion of percentage of persons became disabled before age 15 and persons became disabled after age 15 and Non-disabled considering between owners of TV, car, animals and land regarding access to school. ** Significant at p<0.01 * Significant at p<0.05 (2) ** Test Chi 2 of Pearson of independence. Significant at p<0.01. Possess of TV, car, animals and/or land are a proxy for level of wealth of the household.
Table 18. Literacy Rates according to Gender for Persons Age Above 8
Literacy Rates� Female Male Both Sexes
Literate Persons with Disability
Number 18187 91587 109774
% in Literacy Category 7.8**(1) 26.3**(1) 18.9
Total Number 232539 348810 581349
Literate Non-Disabled
Number 2048427 5678514 7726941
% in Literacy Category 21.1**(1) 43.7**(1) 34.0
Total Number 9713531 13005461 22718992**2
Source: NDSA, Note: � Weighted by estimates of population of provinces. (1) Test of comparison of proportion of percentage between persons with disability and non-disabled according to sex regarding literacy. ** Significant at p<0.01 * Significant at p<0.05 (2) ** Test Chi 2 of Pearson of independence. Significant at p<0.01.
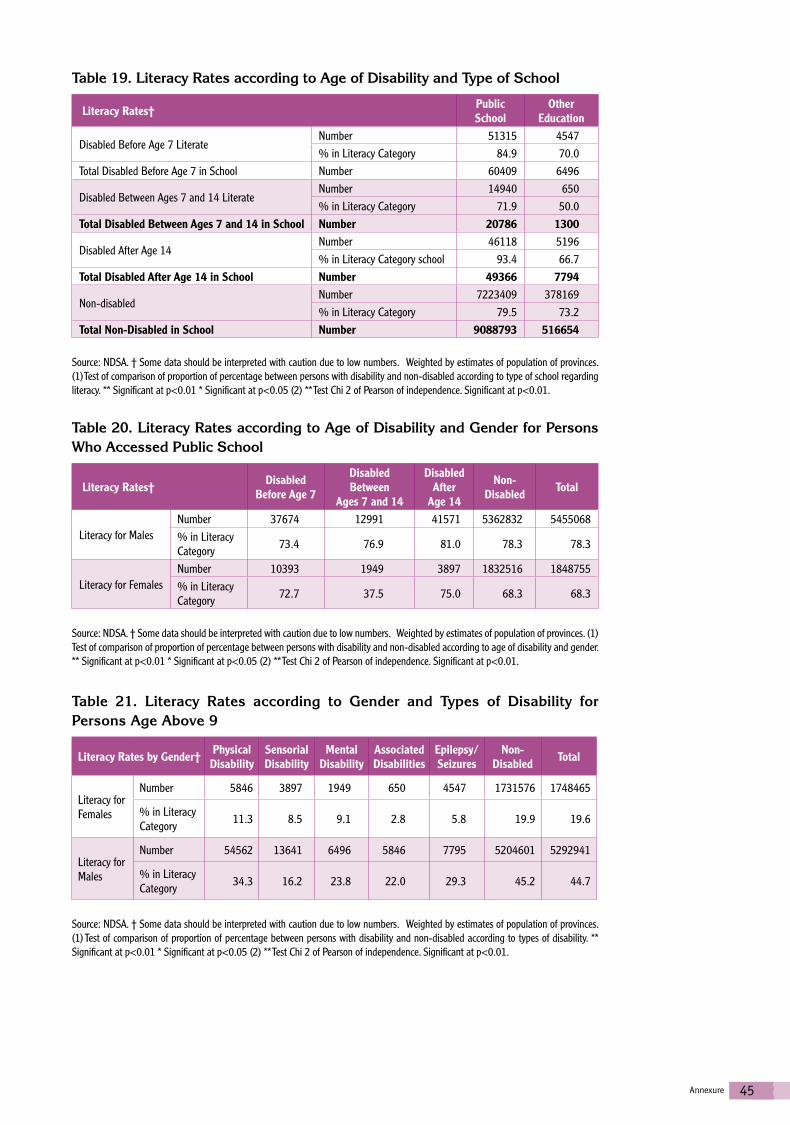
45Annexure
Table 19. Literacy Rates according to Age of Disability and Type of School
Literacy Rates† Public School
Other Education
Disabled Before Age 7 LiterateNumber 51315 4547% in Literacy Category 84.9 70.0
Total Disabled Before Age 7 in School Number 60409 6496
Disabled Between Ages 7 and 14 LiterateNumber 14940 650% in Literacy Category 71.9 50.0
Total Disabled Between Ages 7 and 14 in School Number 20786 1300
Disabled After Age 14 Number 46118 5196% in Literacy Category school 93.4 66.7
Total Disabled After Age 14 in School Number 49366 7794
Non-disabledNumber 7223409 378169% in Literacy Category 79.5 73.2
Total Non-Disabled in School Number 9088793 516654
Source: NDSA. † Some data should be interpreted with caution due to low numbers. � Weighted by estimates of population of provinces. (1) Test of comparison of proportion of percentage between persons with disability and non-disabled according to type of school regarding literacy. ** Significant at p<0.01 * Significant at p<0.05 (2) ** Test Chi 2 of Pearson of independence. Significant at p<0.01.
Table 20. Literacy Rates according to Age of Disability and Gender for Persons Who Accessed Public School
Literacy Rates† Disabled Before Age 7
Disabled Between
Ages 7 and 14
Disabled After
Age 14
Non-Disabled Total
Literacy for MalesNumber 37674 12991 41571 5362832 5455068% in Literacy Category 73.4 76.9 81.0 78.3 78.3
Literacy for FemalesNumber 10393 1949 3897 1832516 1848755% in Literacy Category 72.7 37.5 75.0 68.3 68.3
Source: NDSA. † Some data should be interpreted with caution due to low numbers. � Weighted by estimates of population of provinces. (1) Test of comparison of proportion of percentage between persons with disability and non-disabled according to age of disability and gender. ** Significant at p<0.01 * Significant at p<0.05 (2) ** Test Chi 2 of Pearson of independence. Significant at p<0.01.
Table 21. Literacy Rates according to Gender and Types of Disability for Persons Age Above 9
Literacy Rates by Gender†� Physical Disability
Sensorial Disability
Mental Disability
Associated Disabilities
Epilepsy/ Seizures
Non-Disabled Total
Literacy for Females
Number 5846 3897 1949 650 4547 1731576 1748465
% in Literacy Category 11.3 8.5 9.1 2.8 5.8 19.9 19.6
Literacy for Males
Number 54562 13641 6496 5846 7795 5204601 5292941
% in Literacy Category 34.3 16.2 23.8 22.0 29.3 45.2 44.7
Source: NDSA. † Some data should be interpreted with caution due to low numbers. � Weighted by estimates of population of provinces. (1) Test of comparison of proportion of percentage between persons with disability and non-disabled according to types of disability. ** Significant at p<0.01 * Significant at p<0.05 (2) ** Test Chi 2 of Pearson of independence. Significant at p<0.01.
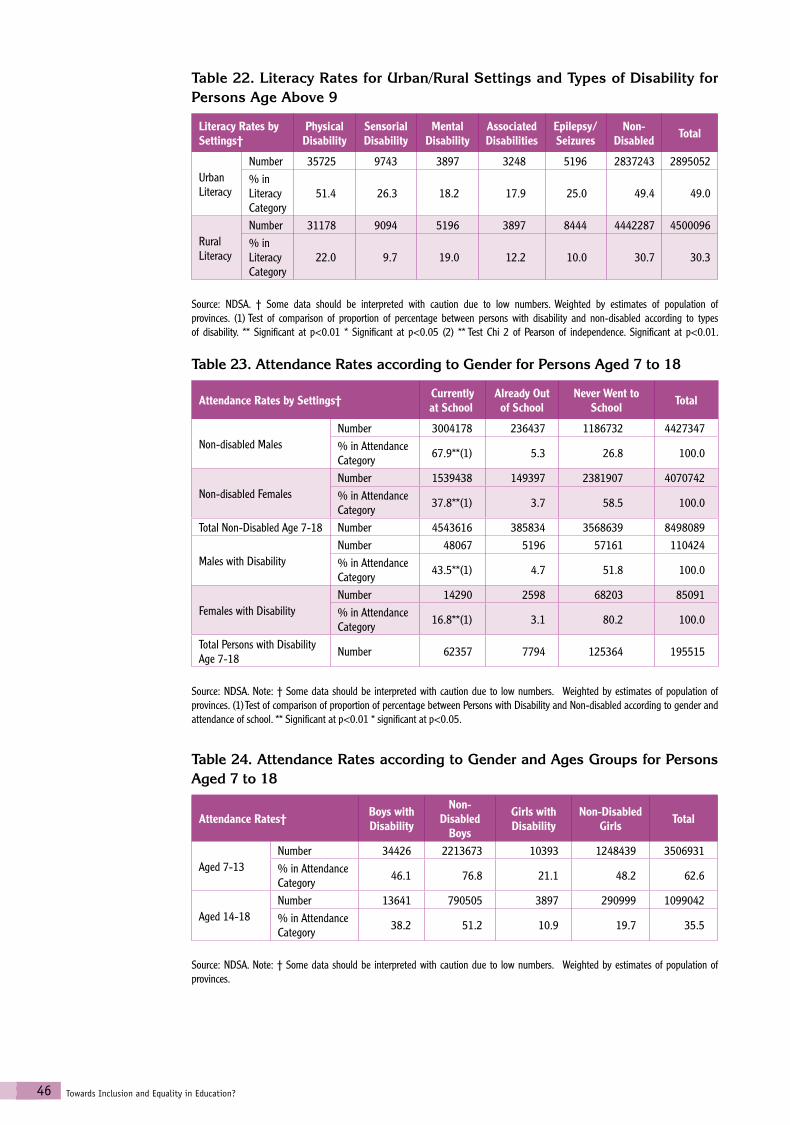
46 Towards Inclusion and Equality in Education?
Table 22. Literacy Rates for Urban/Rural Settings and Types of Disability for Persons Age Above 9
Literacy Rates by Settings†�
Physical Disability
Sensorial Disability
Mental Disability
Associated Disabilities
Epilepsy/ Seizures
Non-Disabled Total
Urban Literacy
Number 35725 9743 3897 3248 5196 2837243 2895052% in Literacy Category
51.4 26.3 18.2 17.9 25.0 49.4 49.0
Rural Literacy
Number 31178 9094 5196 3897 8444 4442287 4500096% in Literacy Category
22.0 9.7 19.0 12.2 10.0 30.7 30.3
Source: NDSA. † Some data should be interpreted with caution due to low numbers. Weighted by estimates of population of provinces. (1) Test of comparison of proportion of percentage between persons with disability and non-disabled according to types of disability. ** Significant at p<0.01 * Significant at p<0.05 (2) ** Test Chi 2 of Pearson of independence. Significant at p<0.01.
Table 23. Attendance Rates according to Gender for Persons Aged 7 to 18
Attendance Rates by Settings†� Currently at School�
Already Out of School
Never Went to School Total
Non-disabled MalesNumber 3004178 236437 1186732 4427347% in Attendance Category 67.9**(1) 5.3 26.8 100.0
Non-disabled FemalesNumber 1539438 149397 2381907 4070742% in Attendance Category 37.8**(1) 3.7 58.5 100.0
Total Non-Disabled Age 7-18 Number 4543616 385834 3568639 8498089
Males with DisabilityNumber 48067 5196 57161 110424% in Attendance Category 43.5**(1) 4.7 51.8 100.0
Females with DisabilityNumber 14290 2598 68203 85091% in Attendance Category 16.8**(1) 3.1 80.2 100.0
Total Persons with Disability Age 7-18 Number 62357 7794 125364 195515
Source: NDSA. Note: † Some data should be interpreted with caution due to low numbers. � Weighted by estimates of population of provinces. (1) Test of comparison of proportion of percentage between Persons with Disability and Non-disabled according to gender and attendance of school. ** Significant at p<0.01 * significant at p<0.05.
Table 24. Attendance Rates according to Gender and Ages Groups for Persons Aged 7 to 18
Attendance Rates†� Boys with Disability
Non-Disabled
Boys
Girls with Disability
Non-Disabled Girls Total
Aged 7-13Number 34426 2213673 10393 1248439 3506931% in Attendance Category 46.1 76.8 21.1 48.2 62.6
Aged 14-18Number 13641 790505 3897 290999 1099042% in Attendance Category 38.2 51.2 10.9 19.7 35.5
Source: NDSA. Note: † Some data should be interpreted with caution due to low numbers. � Weighted by estimates of population of provinces.
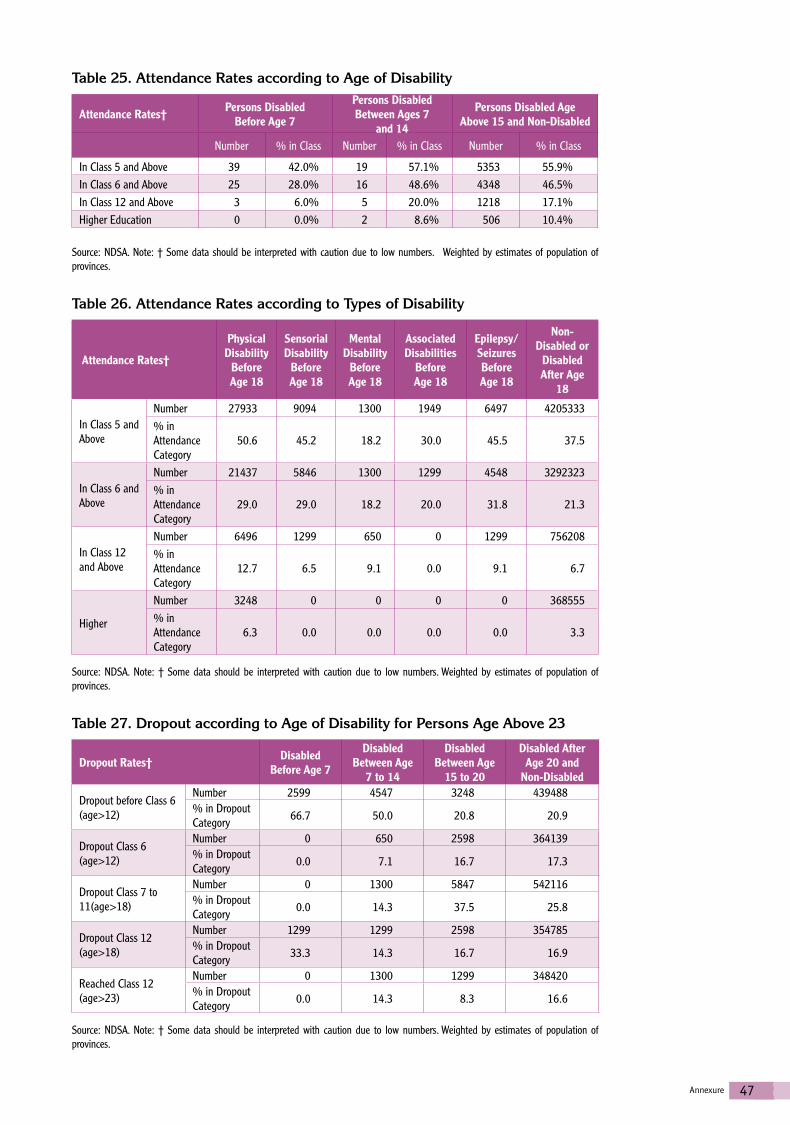
47Annexure
Table 25. Attendance Rates according to Age of Disability
Attendance Rates†� Persons Disabled Before Age 7
Persons Disabled Between Ages 7
and 14
Persons Disabled Age Above 15 and Non-Disabled
Number % in Class Number % in Class Number % in Class
In Class 5 and Above 39 42.0% 19 57.1% 5353 55.9%In Class 6 and Above 25 28.0% 16 48.6% 4348 46.5%In Class 12 and Above 3 6.0% 5 20.0% 1218 17.1%Higher Education 0 0.0% 2 8.6% 506 10.4%
Source: NDSA. Note: † Some data should be interpreted with caution due to low numbers. � Weighted by estimates of population of provinces.
Table 26. Attendance Rates according to Types of Disability
Attendance Rates†�
Physical Disability
Before Age 18
Sensorial Disability
Before Age 18
Mental Disability
Before Age 18
Associated Disabilities
Before Age 18
Epilepsy/ Seizures Before Age 18
Non-Disabled or
Disabled After Age
18
In Class 5 and Above
Number 27933 9094 1300 1949 6497 4205333% in Attendance Category
50.6 45.2 18.2 30.0 45.5 37.5
In Class 6 and Above
Number 21437 5846 1300 1299 4548 3292323% in Attendance Category
29.0 29.0 18.2 20.0 31.8 21.3
In Class 12 and Above
Number 6496 1299 650 0 1299 756208% in Attendance Category
12.7 6.5 9.1 0.0 9.1 6.7
Higher
Number 3248 0 0 0 0 368555% in Attendance Category
6.3 0.0 0.0 0.0 0.0 3.3
Source: NDSA. Note: † Some data should be interpreted with caution due to low numbers. Weighted by estimates of population of provinces.
Table 27. Dropout according to Age of Disability for Persons Age Above 23
Dropout Rates†� Disabled Before Age 7
Disabled Between Age
7 to 14
Disabled Between Age
15 to 20
Disabled After Age 20 and
Non-Disabled
Dropout before Class 6 (age>12)
Number 2599 4547 3248 439488% in Dropout Category 66.7 50.0 20.8 20.9
Dropout Class 6 (age>12)
Number 0 650 2598 364139% in Dropout Category 0.0 7.1 16.7 17.3
Dropout Class 7 to 11(age>18)
Number 0 1300 5847 542116% in Dropout Category 0.0 14.3 37.5 25.8
Dropout Class 12 (age>18)
Number 1299 1299 2598 354785% in Dropout Category 33.3 14.3 16.7 16.9
Reached Class 12 (age>23)
Number 0 1300 1299 348420% in Dropout Category 0.0 14.3 8.3 16.6
Source: NDSA. Note: † Some data should be interpreted with caution due to low numbers. Weighted by estimates of population of provinces.
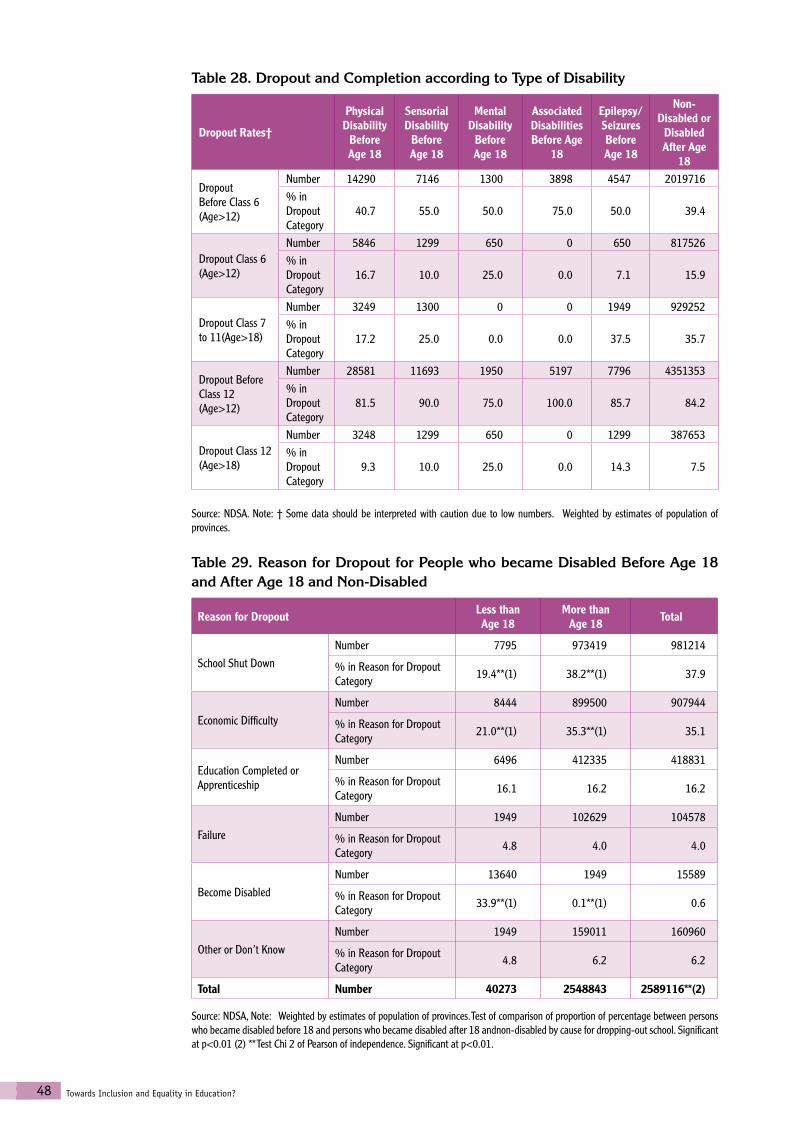
48 Towards Inclusion and Equality in Education?
Table 28. Dropout and Completion according to Type of Disability
Dropout Rates†�
Physical Disability
Before Age 18
Sensorial Disability
Before Age 18
Mental Disability
Before Age 18
Associated Disabilities Before Age
18
Epilepsy/ Seizures Before Age 18
Non-Disabled or
Disabled After Age
18
Dropout Before Class 6 (Age>12)
Number 14290 7146 1300 3898 4547 2019716% in Dropout Category
40.7 55.0 50.0 75.0 50.0 39.4
Dropout Class 6 (Age>12)
Number 5846 1299 650 0 650 817526% in Dropout Category
16.7 10.0 25.0 0.0 7.1 15.9
Dropout Class 7 to 11(Age>18)
Number 3249 1300 0 0 1949 929252% in Dropout Category
17.2 25.0 0.0 0.0 37.5 35.7
Dropout Before Class 12 (Age>12)
Number 28581 11693 1950 5197 7796 4351353% in Dropout Category
81.5 90.0 75.0 100.0 85.7 84.2
Dropout Class 12 (Age>18)
Number 3248 1299 650 0 1299 387653% in Dropout Category
9.3 10.0 25.0 0.0 14.3 7.5
Source: NDSA. Note: † Some data should be interpreted with caution due to low numbers. � Weighted by estimates of population of provinces.
Table 29. Reason for Dropout for People who became Disabled Before Age 18 and After Age 18 and Non-Disabled
Reason for Dropout� Less than Age 18
More than Age 18 Total
School Shut DownNumber 7795 973419 981214
% in Reason for Dropout Category 19.4**(1) 38.2**(1) 37.9
Economic DifficultyNumber 8444 899500 907944
% in Reason for Dropout Category 21.0**(1) 35.3**(1) 35.1
Education Completed or Apprenticeship
Number 6496 412335 418831
% in Reason for Dropout Category 16.1 16.2 16.2
FailureNumber 1949 102629 104578
% in Reason for Dropout Category 4.8 4.0 4.0
Become DisabledNumber 13640 1949 15589
% in Reason for Dropout Category 33.9**(1) 0.1**(1) 0.6
Other or Don’t KnowNumber 1949 159011 160960
% in Reason for Dropout Category 4.8 6.2 6.2
Total Number 40273 2548843 2589116**(2)
Source: NDSA, Note: � Weighted by estimates of population of provinces. Test of comparison of proportion of percentage between persons who became disabled before 18 and persons who became disabled after 18 andnon-disabled by cause for dropping-out school. Significant at p<0.01 (2) ** Test Chi 2 of Pearson of independence. Significant at p<0.01.

49Annexure
Table 30. Why Education is Useful
Reason Why Education is Useful Non-Disabled
Person with Disability Total
Useful for Everyday LifeNumber 885989 494959 1380948% in Reason Education Useful Category 43.6 45.4 44.2
Improves the Prospects for Finding a JobNumber 478720 227993 706713% in Reason Education Useful Category 23.5 20.9 22.6
I Liked SchoolNumber 159790 48066 207856% in Reason Education Useful Category 7.9 4.4 6.7
Helps to Have a Better Position in SocietyNumber 237087 116919 354006% in Reason Education Useful Category 11.7 10.7 11.3
Makes You IndependentNumber 68203 38324 106527% in Reason Education Useful Category 3.4 3.5 3.4
Improves Chances of Getting MarriedNumber 6495 3248 9743% in Reason Education Useful Category 0.3 0.3 0.3
Important for ProgressNumber 163687 132509 296196% in Reason Education Useful Category 8.0** 12.1** 9.5
Other/Don’t KnowNumber 34427 29230 63657% in Reason Education Useful Category 1.7 2.7 2.0
Total Number 2034398 1091248 3125646
Source: NDSA, Note: � Weighted by estimates of population of provinces. Test of comparison of proportion of percentage between persons with disability and non-disabled by reason for education being useful. (1) ** Significant at p<0.01. * Significant at p<0.05 (2) ** Test Chi 2 of Pearson of independence. Significant at p<0.01. � Two answers possible.
Table 31. Reasons that Prevent Persons Age Above 5 from Going (Back) to School
Reasons Preventing Going to School Person with Disability
Non-Disabled Total
Less than 15
Economic difficultyNumber 3897 122375 126272% Within Category 22.2 41.7 33.3
No help or not acceptedNumber 5846 0 5846% Within Category 33.3 0.0 14.3
No School or not goodNumber 2598 275930 278528% Within Category 14.8 38.9 28.6
OtherNumber 5196 98212 103408% Within Category 29.6 19.4 23.8
Total Number 17537 496517 514054Above 15
Economic DifficultyNumber 20136 617594 637730% Within Category 49.2 45.9 47.1
No Help or Not AcceptedNumber 9743 295676 305419% Within Category 23.8 22.0 22.7
No School or Not GoodNumber 3898 217080 220978% Within Category 9.5 22.0 17.4
OtherNumber 7145 125753 132898% Within Category 17.5 10.1 12.8
Total Number 40922 1256103 1297025
Source: NDSA,

NATIONAL DISABILITY SURVEY IN AFGHANISTAN, 2005
TOWARDS INCLUSION AND EQUALITY IN EDUCATION?
FROM ASSUMPTIONS TO FACTS
Islamic Republic of Afghanistan
The National Disability Survey in Afghanistan was carried out in 2005. It is the fi rst such study that covered the entire territory. Based on the International Classifi cation of Functioning, Disability and Health of the World Health Organization, and the Capabilities Approach of Amartya Sen, the NDSA aims to provide insights into the living conditions, needs and hopes of Afghans with disability and their families. This document describes the situation of people with disability with regards to education: access, literacy, completion and dropout, as well as the perception of education value. A large majority of Afghans consider education useful; however school remains inaccessible for part of the population, mainly girls and even more so for girls with disability. Inaccessibility of school is not only due to diffi culty regarding physical access, but is more widely related to the prejudices from the community, from parents of children without disability, as well as lack of awareness and training of teachers. Mainstreaming children with disability systematically within the education system will require the overcoming of age-old beliefs and deep-rooted practices. This report hopes to contribute to fi nding the ways to achieve this.
United NationsEuropean Union
TOWARDS INCLUSION AND EQUALITY IN EDUCATION?
NATIONAL DISABILITY SURVEY IN AFGHANISTAN 2005