towards neural network recognition of handwritten arabic
TRANSCRIPT

Towards Neural Network Recognition Of
Handwritten Arabic Letters
By Tim Klassen
A Project Submitted to the Faculty of Computer Science
In Partial Fulfill ment of the Requirements
For the Degree of
MASTER OF COMPUTER SCIENCE (M.C.Sc.)
Major Subject: Computer Science
APPROVED: Dr. Malcolm Heywood, Supervisor Dr. Nur Zincir-Heywood, Committee Member
Dalhousie University Hali fax, Nova Scotia 2001

ii
Table of Contents
List of Figures _____________________________________________________v
List of Equations___________________________________________________v
List of Tables_______________________________________________________v
1. Introduction _________________________________________________1
1.1. Overview _____________________________________________________________1
1.2. Summary of Hypothesis_________________________________________________2
2. Background Information _________________________________ 2
2.1. On-line Character Recognition___________________________________________2 2.1.1. Character Recognition______________________________________________________2 2.1.2. On-line vs. Off -line ________________________________________________________3
2.2. Arabic Characters _____________________________________________________4 2.2.1. Overview of Arabic Characters_______________________________________________4 2.2.2. Arabic Alphabet___________________________________________________________5
2.3. SOM (Self-Organizing Maps) ____________________________________________7
2.4. Perceptron Learning __________________________________________________10
2.5. Summary____________________________________________________________13
3. Review of State of the Art ________________________________14
3.1. Overview ____________________________________________________________14
3.2. Al-Sheik, Al-Taweel : Hierarchical Rule-based Approach ___________________14
3.3. El-Emami, Usher : Segmented Structural Analysis Approach_________________14
3.4. Bouslama, Amin: Structural and Fuzzy Approach__________________________15
3.5. Alimi, Ghorbel: Template matching and Dynamic Programming Approach ____15
3.6. El-Wakil and Shoukry: Hierarchical Template Matching and k-nearest Neighbor Classification Approach _____________________________________________________16
3.7. Alimi: Evolutionary Neuro-Fuzzy Approach ______________________________16
3.8. Summary - Strengths and Weaknesses of Previous Work ___________________17 3.8.1. Hierarchical Rule-based Approach ___________________________________________17 3.8.2. Segmented Structural Analysis Approach______________________________________17 3.8.3. Structural and Fuzzy Approach ______________________________________________18 3.8.4. Template Matching and Dynamic Programming Approach ________________________18 3.8.5. Hierarchical Template Matching and k-nearest Neighbor Approach _________________18 3.8.6. Evolutionary Neuro-Fuzzy Approach _________________________________________18
4. Case for Neural Network Approach____________________18

iii
4.1. Purpose statement ____________________________________________________18
4.2. Justification of Approach ______________________________________________19
5. Conceptual Model _________________________________________20
5.1. Overview of Conceptual Model__________________________________________20
5.2. Data Collection _______________________________________________________22 5.2.1. Tablet and Monitor Specifications____________________________________________22 5.2.2. Data Set ________________________________________________________________22 5.2.3. WinTab ________________________________________________________________24 5.2.4. Introduction of Noise______________________________________________________24
5.3. File Representation ___________________________________________________25 5.3.1. Persistent Storage ________________________________________________________25 5.3.2. Extendable Format________________________________________________________25 5.3.3. Data Format for system ____________________________________________________26
5.4. Segmentation ________________________________________________________27 5.4.1. Letter Segmentation_______________________________________________________27 5.4.2. Stroke Segmentation ______________________________________________________28
5.5. Cr itical Point Extraction _______________________________________________29
5.6. Normalization of Data _________________________________________________31 5.6.1. Scaling Normalization_____________________________________________________31 5.6.2. Translation Normalization__________________________________________________33 5.6.3. Time Normalization_______________________________________________________34 5.6.4. Rotation Normalization____________________________________________________35 5.6.5. Skew Normalization ______________________________________________________35
5.7. Feature Extraction ____________________________________________________36 5.7.1. Purpose of Feature Extraction _______________________________________________36 5.7.2. Suitabil ity of SOM for Feature Extraction______________________________________36 5.7.3. General SOM Feature Extractor Design _______________________________________36 5.7.4. Two SOM Model_________________________________________________________37 5.7.5. One SOM Model _________________________________________________________38 5.7.6. Feature Vector Normalization _______________________________________________39
5.8. Classification_________________________________________________________40 5.8.1. Perceptron ______________________________________________________________40 5.8.2. Multi-Layer Perceptron ____________________________________________________40 5.8.3. Genetic Programming _____________________________________________________41 5.8.4. Class-wise Partitioning ____________________________________________________41 5.8.5. Pruning ________________________________________________________________42
5.9. Output ______________________________________________________________43
5.10. Summary __________________________________________________________44
6. Experimental Measurements____________________________44
6.1. Results of Experiments ________________________________________________45 6.1.1. Trial 1 – No partitioning or pruning __________________________________________45 6.1.2. Trial 2 – Partition and Pruning on Training Set__________________________________ 46 6.1.3. Trial 3 – Partitioning and Pruning on Validation Set______________________________47

iv
6.1.4. Effectiveness of Partitioning and Pruning______________________________________47 6.1.5. Test Set Analysis_________________________________________________________48
6.2. Proof of concept ______________________________________________________49
6.3. Comparing Perceptrons with Other Classifiers ____________________________49
6.4. Comparing NNHALR with Previous Systems______________________________50
6.5. Summary____________________________________________________________51
7. Conclusions ________________________________________________52
7.1. Conclusions drawn____________________________________________________52
7.2. Summary of contr ibutions______________________________________________53
7.3. Future Research ______________________________________________________53
7.4. Real-wor ld applications of the concept ___________________________________53
7.5. Summary____________________________________________________________54
References_______________________________________________________55
Appendix A – Informed Consent Form_____________________57
Appendix B – Experimental Tables _________________________58

v
List of Figures Figure 1 - Examples of off-line(left) and on-line(right) handwriting inputs ..................................................3 Figure 2- Letters of the Isolated Arabic Alphabet ..........................................................................................4 Figure 3 - Recognition classes........................................................................................................................5 Figure 4 - Similar Normalized shapes in the same class ................................................................................6 Figure 5- Samples of Various Arabic Letter Forms .......................................................................................7 Figure 6 - Unfolding of the Self-Organizing Map..........................................................................................8 Figure 7 - Neighborhood of 1 in red; of 2 in blue and of 3 in purple.............................................................9 Figure 8 - Simple Perceptron........................................................................................................................10 Figure 9 - XOR is a non-linear problem.......................................................................................................12 Figure 10 - NNHALR system.......................................................................................................................21 Figure 11 - Jitter (left) on a small screen; Smoother (right) on a larger screen............................................22 Figure 12 - Extra control codes in data collection........................................................................................24 Figure 13 - Data Collection Dialog Box.......................................................................................................26 Figure 14 - Segmentation into Matlab files................................................................................................. 28 Figure 15 - Calculating Line of Sight ...........................................................................................................29 Figure 16 - Critical Point Density – Original Letter(Left); Critical Points extracted with Delta=10 (right) 31 Figure 17 - Variance in Superimposed Letter Classes..................................................................................33 Figure 18 - Normalizing Letter data.............................................................................................................33 Figure 19 - Two SOM Model ......................................................................................................................37 Figure 20 - One SOM Model........................................................................................................................38 Figure 21 - 2SOM 70 vs 1 SOM 60..............................................................................................................39 Figure 22 - Remove Node Algorithm...........................................................................................................43 Figure 23 - Trial #1 Training and Validation Confusion Matrix .................................................................. 46 Figure 24- Trial#1 Test Set Confusion Matrix .............................................................................................47
List of Equations Equation 1-General Hebbian Learning...........................................................................................................9 Equation 2 - Simplified SOM equation..........................................................................................................9 Equation 3 - SOM Updating...........................................................................................................................9 Equation 4 - Perceptron Output to delimiter................................................................................................. 11 Equation 5- Simplified Perceptron Output ................................................................................................... 11 Equation 6 -Perceptron Weight Updating Rules ..........................................................................................11 Equation 7 – Alif Detector ............................................................................Err or ! Bookmark not defined. Equation 8 – Feature Normalization.............................................................................................................40
List of Tables Table 1 - Phases of a Pattern Recognition System .......................................................................................20 Table 2 -Breakdown of Data Sets by Class.................................................................................................. 23 Table 3 - Nationali ty and Gender Breakdown of NNHALR Data set ..........................................................27 Table 4 - Test data for selection of parameter Delta.....................................................................................30 Table 5 - Errors with Class-Wise Partitioning on Training Set .................................................................... 42 Table 6 - Errors with Class-Wise Partitioning on Validation Set ................................................................. 42 Table 7 – Trials in Arabic Letter Experiments.............................................................................................45 Table 8 - Recognition Accuracy Results......................................................................................................46 Table 9 - Relative Effectiveness of Partitioning and Pruning.......................................................................48 Table 10 – Summary of Previous Approaches.............................................................................................50 Table 11 – Average Calculations of Scale.................................................................................................... 58

1
1. Introduction
1.1. Overview
On-line character recognition is a challenging problem. Much of the diff iculty
stems from the fact that pattern recognition is a complex process that cannot be solved
completely by analytical methods
Many applications in hand-held computing and digital signatures and verification
use on-line character recognition. As computers become increasingly ubiquitous and
mobile, the interfaces have been rapidly shrinking. However, as the technology that
powers these hand-held and portable devices miniaturizes components, one component
has severe limitations on size reduction.
The standard computer keyboard cannot shrink to the size of hand-held devices
such as personal digital assistants or cell phones and still be useable. The need for a
natural interface that can scale gracefully with the shrinking size of personal digital
assistant platforms becomes apparent. A small stylus or pen and electronic tablet are a
suitable solution for most hand-held devices. Handwriting is a vital process for this
interface to be useful.
Thirty years of research has gone into producing on-line Latin or Asian language
letter recognition systems. However, very littl e has been done in Arabic until recently.
Most of the current Arabic letter recognition systems do not allow for noisy data input.
Hand-held computing must make this allowance because of the environment for using
such a device. Handhelds are typically used while in moving vehicles or walking where
the probabilit y of noise being introduced into the writing process is high.
In this work, we introduce a novel Arabic letter recognition system that can be
adapted to the demands of hand-held and digital tablet applications. Our system uses
neural networks for feature extraction and classification. Linear networks are employed
as classifiers because of the low computational overhead during training and recall .

2
1.2. Summary of Hypothesis
The objective of this project is to demonstrate a framework for giving good
recognition accuracy to on-line Arabic letter input using an unsupervised learning method
(Self-Organizing Maps – see Section 2.3) for feature extraction (see Section 5.7) and a
supervised learning method (Perceptrons - see Section 2.4) for classification (see Section
5.8 ). Good recognition accuracy means that the system will scale well for many writers,
classify eff iciently, and have the potential to be robust in the presence of noisy data input.
This system should also be robust to scale, position and rotation and be computationally
eff icient.
2. Background Information
2.1. On-line Character Recognition
2.1.1. Character Recognition
The primary task of alphabet character recognition is to take an input character
and correctly assign it as one of the possible output classes. This process can be divided
into two general stages: feature selection and classification. Feature selection is criti cal
to the whole process since the classifier will not be able to recognize from poorly selected
features. Lippman gives criteria to choose features by:
“ Features should contain information required to distinguish between classes, be insensitive to irrelevant variabilit y in the input, and also be limited in number to permit efficient computation of discriminant functions and to limit the amount of training data required.” [1]
Often the researcher does this task manually, but a neural network approach allows the
network to automatically extract the relevant features.
There are many possible types of classifiers: statistical (Bayesian), symbolic
(Rule Induction, Genetic Programming), and hyperplane (multi -layer perceptron).

3
Statistical classifiers need to have a priori knowledge of the features to classify.
Symbolic and hyperplane classifiers can theoretically combine feature extraction and
classifiers in one step. A SOM/perceptron1 combination is a two-stage system, with the
SOM clustering to extract pertinent features and the perceptron participating as a linear
classifier. (More about SOMs in Section 2.3 and perceptrons in Section 2.4 )
Due to the different characteristics in performance, we compare 1) a perceptron
2) a multi -layer perceptron (see Section 5.8.2) and 3) genetic programming (see Section
5.8.3) for classification.
2.1.2. On-line vs. Off-line
There are two kinds of input for character recognition: off -line and on-line. Off -
line character recognition takes a raster image from a scanner, digital camera or other
digital input source. The image is binarized using a threshold technique if it is color or
gray-scale so that the image pixels are either on (1) or off (0). The rest of the pre-
processing is similar to the on-line version with two key differences: Off -line processing
happens after the writing of characters is complete and the scanned image is pre-
processed. Secondly, off -line inputs have no temporal information associated with the
image. The system is not able to infer any relationships between pixels or the order in
1 Self-Organizing Feature Map
Figure 1 - Examples of off -line(left) and on-line(r ight) handwr iting inputs

4
which strokes were created. Its knowledge is limited to whether a given pixel is on or
off .
On-line character recognition accepts (x,y) coordinate pairs from an electronic
pen touching a pressure-sensitive digital tablet. On-line processing happens in real-time
while the writing is taking place. Also, relationships between pixels and strokes are
supplied due to the implicit sequencing of on-line systems that can assist in the
recognition task (see Figure 1).
2.2. Arabic Characters
2.2.1. Overview of Arabic Characters
Arabic is a language spoken by Arabs in over 20 countries, and roughly
associated with the geographic region of the Middle East and North Africa, but is also
spoken as a second language by several Asian countries in which Islam is the principle
religion (e.g. Indonesia). However, non-Semitic languages such as Farsi, Urdu, Malay,
and some West African languages such as Hausa have adopted the Arabic alphabet for
writing 2. Due to the cursive nature of the script, there are several characteristics that
2 “Arabic Language” entry, Encarta Encyclopedia CD-ROM, 1999.
Figure 2- Letters of the Isolated Arabic Alphabet

5
make recognition of Arabic distinct from the recognition of Latin scripts or Chinese (see
Figure 2) 3. The following section summarizes the nature of these differences.
2.2.2. Arabic Alphabet
Arabic has 28 letters in the alphabet. It is based on 18 distinct shapes that vary
according to their connection to preceding or following letters. Using a combination of
dots and symbols above and below these shapes, the full complement of 28 consonants
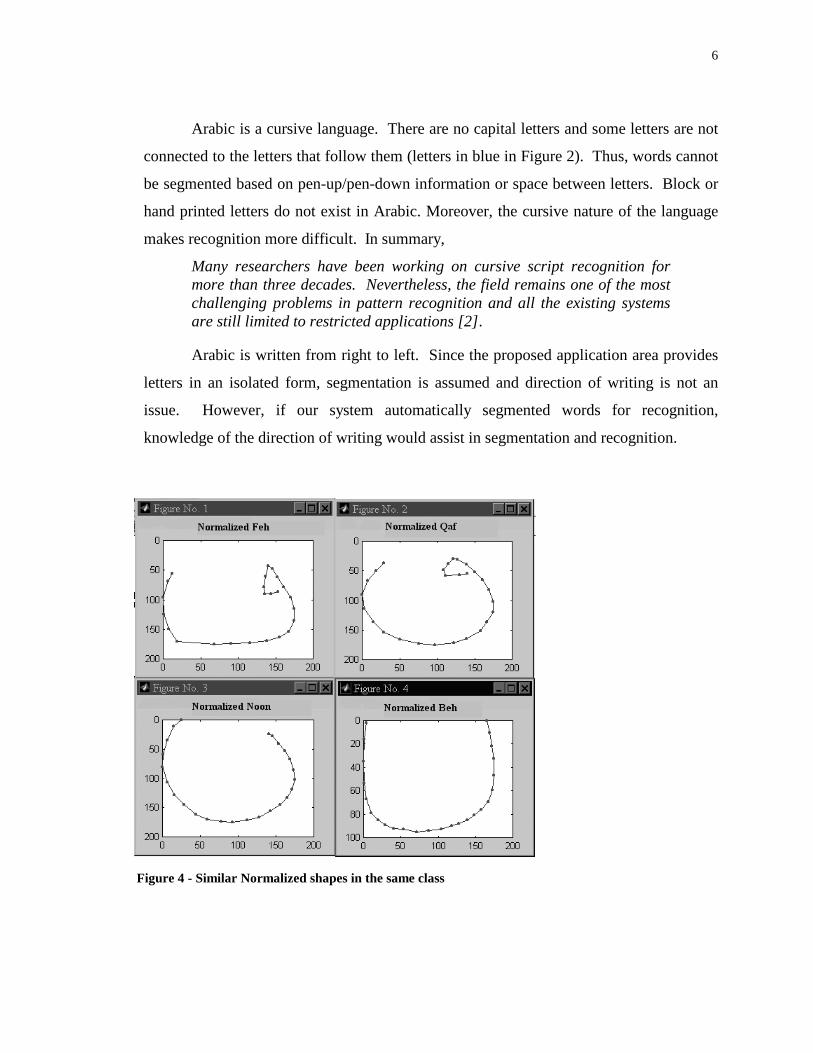
can be constructed. Our system recognizes 15 distinct shapes or classes (see Figure 3)
because the assumption is made that certain classes are similar enough, that they will
look the same after normalization (see Figure 4).
Figure 3 - Recognition classes
3 graphic from http://www.arabic2000.com/arabic/alphabet.html
6
Arabic is a cursive language. There are no capital letters and some letters are not
connected to the letters that follow them (letters in blue in Figure 2). Thus, words cannot
be segmented based on pen-up/pen-down information or space between letters. Block or
hand printed letters do not exist in Arabic. Moreover, the cursive nature of the language
makes recognition more diff icult. In summary,
Many researchers have been working on cursive script recognition for more than three decades. Nevertheless, the field remains one of the most challenging problems in pattern recognition and all the existing systems are still li mited to restricted applications [2] .
Arabic is written from right to left. Since the proposed application area provides
letters in an isolated form, segmentation is assumed and direction of writing is not an
issue. However, if our system automatically segmented words for recognition,
knowledge of the direction of writing would assist in segmentation and recognition.
Figure 4 - Similar Normalized shapes in the same class

7
Arabic has four forms for each letter depending on the position of the letter in
each word. These are initial, medial, final and isolated (see Figure 5)4. A more
generalized system would need to train 60 separate classes rather than 15 classes (for
isolated letters) to accommodate all four forms for each letter.
A key difference between Latin scripts and Arabic is the fact that many letters
only differ by a dot(s) but the primary stroke is exactly the same. Out of the 15 classes
for isolated letters, 10 classes have 2 or more letters that vary by only a dot(s) or symbol.
This highlights the need for a good feature extractor/classifier for the secondary stroke(s).
The system detailed in this work addresses the recognition of primary strokes, and makes
recommendations regarding the recognition of secondary strokes.
2.3. SOM (Self-Organizing Maps) Unsupervised learning is useful for feature extraction because it finds
relationships between raw data points and clusters them together. These relationships or
patterns in data become features of the data set. Self-Organizing Maps are a neural
network example of unsupervised learning.
This section will give a brief overview of Self-Organizing Feature Maps (or
SOMs). Teuvo Kohonen first introduced SOMs in 1982. They are defined as follows:
The self-organizing map (SOM) is a new powerful software tool for the visualization of high-dimensional data. It converts complex, nonlinear statistical relationships on a low-dimensional display. As it therefore
4 Taken from www.sakkal.com/ArtArabicCalli graphy.html
Figure 5- Samples of Var ious Arabic Letter Forms

8
compresses information while preserving the most important topological and metric relationships of the primary data elements on the display, it may also be thought to produce some kind of abstraction[3] . Two key features of the SOM are its abilit y to visualize high-dimensional data as
well as abstract statistical relationships from data that may not be seen manually. It
differs from general competitive learning algorithms because it is topologically ordered.
Neighboring neurons will have similar features in the input space. Figure 6 depicts the
unfolding of the ‘map’ as training progresses in an SOM in this application.
The competitive process of modified Hebbian5 learning trains a SOM.
Equation 1 shows how the weight of a neuron j (wj) is adapted through the
learning process where η is the learning rate, x is the input, y is the post-synaptic output,
and the modification term g(yj) which is a ‘f orgetting’ f unction of the neuron’s output
that prevents neuron saturation [4]. If we set the learning rate and the forgetting function
to be the same variable, Equation 1 simpli fies to Equation 2.
5 Hebbian learning compares pre and post-synaptic activities in a neuron. If the input and output are correlated, the weight is increased. If the input and output are not correlated, decrease the weight.
Figure 6 - Unfolding of the Self-Organizing Map

9
Equation 1-General Hebbian Learning
jjjj wygxy
dt
dw)(−=η
Equation 2 - Simpli fied SOM equation
î
−
=)(
)(
,0
),(
xi
xijj
outsidejif
insidejifwx
dt
dw
λλη
Procedurally, neurons are created and linked together in a chosen topology and
initialized with random weighting. Each neuron is presented with the same data pattern
and the neuron with the smallest Euclidean distance between its weight and that data
pattern (see Equation) becomes the winning neuron. The weights used in calculating the
distance inside the winning neurons’ neighborhood are updated to incrementally
minimize the distance between pattern and weights (see Equation 3).
Equation 3 - SOM Updating
î
∈−+
=+otherwisenw
njifnwxnnwnw
j
xijj
j ),(
)()],([)()()1(
)(λη
Figure 7 - Neighborhood of 1 in red; of 2 in blue and of 3 in purple

10
Two key parameters control the learning process: the neighborhood function
λ i(x) which determines the radius around the winning neuron i for a given input x inside
which the neighboring neuron’s weights are adapted ( see Figure 7)and the learning rate
η(n)at epoch n, which determines how much of a jump the neurons in the neighborhood
of the winning neuron take toward the input vector. In order to ensure a topological
ordering of the neurons at convergence, as well as stabilit y during learning, the
neighborhood and learning rate adaptively shrink over time. Thus, by the end of the
training process, the neighborhood consists of just the winning neuron and the learning
rate approaches zero. For more information, see Haykin [5] or Kohonen [6].
2.4. Perceptron Learning The role of supervised learning in a pattern recognition problem is in training the
classifier. Input is passed into the classifier along with a target label. If the classification
does not match the target label, the weights can be adjusted so that the input is correctly
classified. The supervised learning technique used in this work as a classifier is a
perceptron. In effect the assumption is made that linear discriminants will be suff icient.
By doing so we gain a very simple learning rule which lends itself to real-time learning in
handheld computing divices.
Figure 8 - Simple Perceptron
Xm
w3
w2
X1
y
w1
wm
P X3
X2
b

11
Perceptrons are simple neurons with a fixed number of inputs and matching
weights for each input (see Figure 8). The output is binary and a perceptron has a
threshold or bias, b, which provides the boundary between the two output classes.
Equation 4 - Perceptron Output to delimiter
∑=
+=m
iii bxwv
1
In Equation 4, the result v is the input for the delimiter6. Substituting the bias (b) as the
first input simpli fies Equation 4 to give Equation 5. This equation assumes that
Equation 5- Simpli fied Perceptron Output
)()()()()(0
nxnwnxnwnv Tm
iii
�== ∑=
x0(n) = 1, w0(n) = b(n) and that there are n training samples. This defines the hyperplane
decision surface between the binary output classes (C1 and C2 ) .
The weights are updated according to Equation 7 -Perceptron Weight Updating
Rules . If the weights are correctly classified, the new weights are unchanged. However,
if the classification was incorrect, the weights are moved toward training input x
modulated by a learning rate η(n). This learning rate may be fixed or decay over time.
6 The delimiter is a function which usually decides that an output is in Class 1 if it is positive and Class 2 if it is negative
Equation 7 -Perceptron Weight Updating Rules
wi(n+1) = wi (n) if wTx(n) > 0 and x(n) belongs to class C1
wi (n+1) = wi (n) if wTx(n) ≤ 0 and x(n) belongs to class C2
wi (n+1) = wi (n) – η(n)x(n) if wTx(n) > 0 and x(n) belongs to class C2
wi (n+1) = wi (n) + η(n)x(n) if wTx(n) ≤ 0 and x(n) belongs to class C1
Equation 6 - Perceptron weight updating Rules

12
A simple perceptron works properly if the classes are linearly separable.
Linearly separable classes do not have any quadratic, cubic, or higher order terms in the
equation defining the solution. This means that the classes in m dimensions must be far
enough apart that a hyperplane surface in m-1 dimensions can separate them. If this
cannot be accomplished then the solution is non-linear and a perceptron will not correctly
separate the classes. XOR is a classic example of a non-linear problem that cannot be
solved by a perceptron. Looking at Figure 9, there is no way to draw a straight line that
separates the ‘x’ symbols and circle symbols.
Figure 9 - XOR is a non-linear problem
If the problem has a non-linear solution, a multi -layer perceptron (MLP) with
hidden layers can be used. However, MLP suffers from getting trapped in local error
minima as well as lengthy learning times as the number of inputs or nodes increase.
Stated differently:
Since back-propagation learning is basically a hill climbing technique, it runs the risk of being trapped in a local minimum where every small change in synaptic weights increases the cost function. But somewhere else in the weight space there exists another set of synaptic weights for which the cost function is smaller than the local minimum in which the network is stuck…In principle, neural networks such as multi -layer perceptrons …have to overcome the scaling problem, which addresses the issue of how well the network behaves …as the computational task increases in size and complexity [5] . Learning is simple and eff icient for a perceptron and it should be chosen if the
problem has a linear solution. For more information on perceptrons, see Haykin [5].

13
2.5. Summary
On-line character recognition is divided into two phases: feature selection and
classification. Determining representative features is very important in the recognition
process. On-line processes are done in real-time and have implicit sequencing and
temporal information encoded into the input.
The Arabic alphabet, which is used by other cultures besides Arabs, has 28
characters that can be described with 15 primary stroke classes. Recognizing Arabic
letters differs from recognizing Asian languages or Latin script languages 7.
Self-Organizing Maps (SOMs) are a competitive learning process with the
property that they are topologically ordered. They typically allow the user to visualize
higher-dimension input vectors in 1- or 2-D space and automatically select features
capable of representing the input space. The learning rate and neighborhood function
decay over time so that the learning algorithm converges. SOMs are used in this system
as a feature extractor.
Perceptrons are neurons, which have an arbitrary number of inputs, weights and a
bias term with a binary output. These are trained to tune the weights towards a given
input pattern by a fixed or variable learning rate if the perceptron misclassifies that input
pattern. Perceptrons are a good choice for solving linear problems. If the problem is
non-linear, then multi-layer perceptrons can be used to solve it, at the expense of further
uncertainty in the training process (local minima). Perceptrons are used in this system as
the primary classifier.
7 Asian languages tend to be block and stroke-based characters while Latin languages are cursive but have letter classes which are distinguishable by more than dots or a symbol. Arabic is cursive with high connectivity between letters.

14
3. Review of State of the Art
3.1. Overview
Pattern recognition is a well-established field of study and character recognition
has long been seen as one of its important contributions. However, Arabic character
recognition has been one of the last major languages to receive attention 8. This is due, in
part, to the cursive nature of the task (see comments in Section 2.2.2). Two common
themes have driven much of the work in on-line Arabic character recognition. The first is
a hierarchical division of the input letter space to simpli fy the problem. The second
theme is heuristically defined rules for classification or feature selection, which tend to be
data and writer dependent. Now we will t ake a look at most of the earlier works by
method. After looking at all the approaches, we will discuss the strengths and weaknesses
of each method and summarize findings in Table 10 in Section 6.4.
3.2. Al-Sheik, Al-Taweel : Hierarchical Rule-based Approach
Al-Sheik and Al-Taweel assumed a reliable segmentation stage, which divided
letters into the 4 groups of letters (initial, medial, final and isolated) as discussed in
Section 2.2.2. The recognition system depended on a hierarchical division by the number
of strokes. One stroke letters were classified separately from two stroke letters etc.
Ratios between extrema and position of dots in comparison to the primary stroke were
defined heuristically on the data set to produce a rule-based classification. Recognition
rates for isolated letters were reported at 100% [7]. It was unclear from the paper whether
these results were on the training or test set.
3.3. El-Emami, Usher: Segmented Structural Analysis Approach
El-Emami and Usher were trying to recognize postal address words after
segmenting them into letters. They used a structural analysis method for selecting
features of Arabic characters. The classification used a decision tree. In pre-processing,
8 An early work by Amin. et al. was only published in 1980.
15
they segmented using Belaid and Haton’s method for finding extreme curvature. Some
of the features extracted during this segmentation process were direction codes, slope and
presence of dot flags. A new input needed to search three decision trees for the primary
stroke and also for the upper and lower dots. The decision tree was hand-tweaked to find
the best parameters to fit the data set, which possibly could have led to overfitting [8].
The system was trained on 10 writers with a set of 120 postal code words with a
total of 13 characters. They used one tester who had a recognition rate of 86%. They
instructed him to change his writing style to account for a weakness in the system and
obtained 100% accuracy [9].
3.4. Bouslama, Amin: Structural and Fuzzy Approach
Bouslama and Amin produced a hybrid system that combined structural and fuzzy
techniques. Structural analysis discriminated between various letter classes to be
recognized and fuzzy logic allowed for variabilit y in people’s handwriting within the
same class. Sampling was done on the input data points by comparing tangent angles at
various points along the line. Endpoints were kept automatically. The first point that had
a tangent difference bigger than a threshold θ became the next sampled point. The
authors chose basic shapes such as curves, loops, lines and dots as good features for
discriminating between letter classes. These were constructed using geometric and
structural relationships between the sampled points. After fuzzifying 9 the features, fuzzy
‘ If-then rules’ were created heuristically by the authors, following a study of the data set.
These fuzzy rules could distinguish letters from combinations of these fuzzy features and
allowed for fuzzy membership in a letter class instead of binary membership to cover the
variabilit y in handwriting between authors. No test or accuracy results were listed [10].
3.5. Alimi, Ghorbel: Template matching and Dynamic Programming Approach
Alimi and Ghorbel showed how to minimize error in an on-line recognition
system for isolated Arabic characters using template matching and dynamic programming

16
with assumed segmentation. the reference bank of prototypes was prepared after
smoothing, normalization and coding the data coordinates into a parametric
representation of angles. When new data was presented to the system, the distance
between the prototype and new data string was minimized using dynamic programming.
The number of prototypes was varied to see the effect on recognition rates. As expected,
more prototypes gave better accuracy. The optimum was at 9 prototypes with 96%
accuracy on test data for one author [9].
3.6. El-Wakil and Shoukry: Hierarchical Template Matching and k-nearest Neighbor Classification Approach
El-Wakil and Shoukry used stable features to hierarchically reduce the number of
letter class considered based on template matching. The stable features were: 1) the
number of dots 2) relative position of the dots compared with the primary stroke 3)
number of secondary strokes and 4)slope of secondary stroke. A k-nearest neighbor
classifier then used primary strokes encoded as a primitive of angular directions in the
stroke to determine the closest class. Recognition accuracy varied with the length of
primitive strings but the optimal string length gave an accuracy of 84% by testing 7
writers on sets of 60 characters. Weighting the features manually by their relative
importance gave a maximum accuracy of 93% [11].
3.7. Alimi: Evolutionary Neuro-Fuzzy Approach
Alimi set forth a complete system that segmented letters according to an
understanding of the way that humans write. Given that an Arabic letter can have at most
6 strokes and that a stroke is defined as an asymmetric bell -shaped function of curvili near
velocity with the speed tapering off at the end of the stroke, a system can automatically
segment a letter into sub-strokes, which define that letter. Each character can be
represented as 6 feature vectors. If the character has less than 6 strokes, the empty
strokes are zeroed out.
9 A fuzzified feature allows for a degree of membership instead of just in or out of class.

17
This set of feature vectors was given to a fuzzy beta radial basis function neural
network to recognize various letters. The strokes were overlapped to give all possible
combinations of strokes into letters.
These overlapped outputs were passed to a genetic algorithm to robustly
recognize words. Through a series of mutations and crossovers, the letters were
segmented out and recognized. Reported accuracy was 89% without dot and diacritical
information [12].
3.8. Summary - Strengths and Weaknesses of Previous Work
3.8.1. Hierarchical Rule-based Approach
This approach had an excellent recognition rate and a good divide-and-conquer
strategy by reducing the classes through hierarchical rules. It also attempted to classify all
of the forms of Arabic letters and used a large data set. However, this approach would be
extremely sensitive to noisy data in terms of the number of strokes since the hierarchy
was built on counting the exact number of strokes. That is to say, when using a tablet for
data entry, stylus bounce is often experienced on the hard surface. In addition, using
ratios of extrema is probably optimized for the particular data set and might not
generalize well .
3.8.2. Segmented Structural Analysis Approach
This approach also had good accuracy and attempted to automatically segment
words. However, the method was sensitive to rotation and was tested on a limited input
data set and a limited output classification set. The third experiment gave 100% accuracy
results on one writer who was coached to alter his style to avoid weaknesses in the
system. Before this alteration, the system was recognizing at 86% accuracy. Overfitting
was a concern since the parameters were tweaked to give 100% accuracy on the training
set.

18
3.8.3. Structural and Fuzzy Approach
This system had perfect training results. 44 fuzzy rules were constructed to
describe the training set completely. However, the fuzzy rules used were quite heuristic
as seen by the author’s quote: “These rules are obtained heuristically from the study of
many handwritten samples.” [10] The paper did not list any test set accuracy results.
3.8.4. Template Matching and Dynamic Programming Approach
Alimi and Ghorbel produced good test results at 96%. However, they only used
one test subject who varied his handwriting across the prototypes. This approach did not
give enough variety in authors. It was not evident whether this approach generalized well
or not.
3.8.5. Hierarchical Template Matching and k-nearest Neighbor Approach
Like many other systems the authors showed good recognition results. Also, li ke
many other systems, this approach’s stable features were sensitive to noise and might not
generalize well since the results were based on a test set of 60 characters alone.
3.8.6. Evolutionary Neuro-Fuzzy Approach
This approach was more robust, possibly due to the use of a genetic algorithm. It
also segmented in a novel way using curvili near velocity. The test set was constrained to
only one word and a small subset of 7 different letters. The system was also writer
dependent and so might have problems with scaling to more writers.
4. Case for Neural Network Approach
4.1. Purpose statement
As mentioned in the introduction, this research will show on-line average Arabic
character recognition rates above 80% and training recognition rates above 90% using
neural networks for feature extraction and classification with multiple unconstrained

19
writers. Linear networks will be emphasized, where this represents the lowest
computational overhead during both training and recall , hence suitable for hand held
devices – the target application device.
4.2. Justification of Approach
Past work in the area of on-line Arabic character recognition has focused on
structural/hierarchical methods which create features based on the a priori identification
of the number of strokes, type of strokes and shape of strokes. This work clusters co-
ordinates in a stroke using a topologically ordered SOM that accounts for variations in
handwriting and should handle noise robustly in practice (providing that the training set
is suitably varied). This is a novel use of neural networks in general and SOMs in
particular to solve the on-line Arabic handwriting recognition problem. The only other
neural network approach to on-line Arabic character recognition is Alimi ’s approach
using beta Radial Basis Functions and Genetic Programming. Our system classifies with
a perceptron because of its training eff iciency and simplicity as a linear classifier.
Arabic is a major world language spoken by 186 milli on people (2001 estimate)10.
Very littl e research has gone into character recognition in Arabic due to the diff iculty of
the task and lack of researchers interested in this field. As the Arab world becomes
increasingly computerized 11 and mobile, and technology becomes increasingly
ubiquitous, the need for a natural interface becomes apparent. Typing is not a natural
user-friendly interface. Voice recognition is more complex, computationally expensive
and prone to interference from the environment, leaving handwriting recognition as a
viable alternative.
Palm-held computing is on the rise. A keyboard is too big for a palm-held
computer so a stylus and tablet system for interaction requires a much smaller interface.
Hence the need for handwriting recognition.
10 see http://www.al-bab.com/arab/language/lang.htm. 11 See http://www.ditnet.co.ae/itnews/newsmay99/newsmay77_table.html for Arab World increase in Internet users during a 4 month period

20
Palm12 introduced an Arabic interface for their palm computer in 2000. However,
originally, it had a script that the user needed to learn in Arabic li ke Graff iti for English.
In 2001, Palm Pilot realized the importance of customized script by introducing Nukoush.
“ Even though we have tested our Graffiti database after consulting with over 25 users from different countries to come up with the best designed hand-writing technique, we feel that this is not enough, so we created Nukoush” . 13
Our system goes one step beyond Nukoush since it does not require the user to
create prototype letters but can use the weighted system out of the box. Customized
prototype letters will im prove the recognition rates for a given user but our system will
generalize better than a Palm with a customized Nukoush interface. Moreover, use of a
perceptron classifier provides for fast additional real-time training to give user specific
fine-tuning of the classification stage.
In the following section, we will l ook at the conceptual model of our system and
explore its details.
5. Conceptual Model
5.1. Overview of Conceptual Model
Any pattern recognition system can be divided into a number of distinct stages:
Data collection, Storage, Segmentation, Input reduction, Normalization, Feature
Extraction and Classification. The goal of the overall system is to correctly classify the
pattern being analyzed. Each stage has unique goals that enhance that possibilit y (see
Table 1). Figure 10 shows the phases of the Neural Network Handwritten Arabic Letter
Recognition (NNHALR) system described in this paper.
Table 1 - Phases of a Pattern Recognition System
Pattern Recognition Phase Goal of Phase
Data Collection To accurately record raw data while minimizing quantization errors
12 Palm is a popular hand-held Personal Digital Assistant for basic mobile tasks such as note-taking, email and scheduling. 13 Palm’s Arabic site: http://www.arabicpalm.com/APOS.htm#Nukoush

21
File Storage To make the data persistent so that experiments can be repeated on the data with an extensible format.
Segmentation To divide or separate data input into defined, clearly understood blocks or segments.
Sampling To decrease the size of the input data with a resulting decrease in complexity for training while minimizing loss of accuracy.
Normalization To make the inputs invariant to such things as rotation, scale and translation.
Feature Extraction To further reduce the input space by grouping inputs into relevant features
Classification To correctly classify the input as one of the output classes
Figure 10 - NNHALR system
Sampling/ Cr itical Points
Normal-ization
Feature Extraction/
SOM
.pendown 212 312 213 312 .penup
File Storage
Data Collection
-1 -1 212 312 213 312 -2 -2
Seg-mentation
Classifi-cation /
Perceptron

22
5.2. Data Collection
5.2.1. Tablet and Monitor Specifications
Data collection for the NNHALR system was done using a digital tablet to collect
Arabic letter samples from Arabic writers. The digital tablet used was a Wacom
Graphire Model ET-0405-U with a resolution accuracy of 23 points/cm. The active
surface is 9.2 x 12.8 cm. It has a sampling frequency of 100 points/sec. The monitor
used was a 13 inch Optiquest by Viewsonic at 1024x768 pixel resolution. The data
capture application screen was set to the size of the monitor to standardize the input space
and to smooth the data samples. Earlier data samples were collected from a smaller data
capture application screen and the results were subject to significant amounts of jitter as
the user attempted to fit handwriting to the small monitor screen window space (see
Figure 11 ).
Figure 11 - Jitter (left) on a small screen; Smoother (r ight) on a larger screen
5.2.2. Data Set
The data set for the NNHALR system needed to be large enough to cover the
variabilit y in handwritten Arabic. There are major intra-class differences between the
ways that various volunteers write the same letter in Arabic. We decided that the data set
400 450 500 550 600
200
250
300
350
400
450
50090 100 110 120 130 140
40
50
60
70
80
90
100

23
should have 200 instances of each of the 28 letter classes. This would require 20
volunteers writing 10 complete iterations of the alphabet.
Most of these authors were students from the Faculty of Computer Science at
Dalhousie University while a few were from the Hali fax community at large and their
data samples were collected over the period of April -June 2001. Writer 2 was not
included in any of the experimental tests since the data was collected on the small data
capture application screen and hence the output was very jittery. The writers signed an
informed consent form indicating their willi ngness to participate in this voluntary study
(see Appendix A for a sample form)
After the first volunteer, it became apparent that 10 iterations were excessive
since this volunteer rushed to get through and the last iterations were written in a sloppy
handwriting style. The number of expected iterations was reduced to 5, which gave a
better mix of letter styles. They were well written at the beginning and sloppier towards
the end. This gave an ideal of 2800 letters with 20 volunteers x 5 iterations x 28 letters.
The volunteers were asked to go through the whole alphabet 5 times rather than
consecutively writing each letter 5 times. This gave the volunteer time to “ forget” the
way that they wrote a given letter.
Actually, 2769 samples were collected since there was a bug with the data
collection program which wrote data collected from a sample directly to disk and if the
volunteer entered the data very quickly, it would drop a letter occasionally as it was
writing previous data to the disk. Also the program was designed to reject any data items
which did not have matching control codes. (see Table 2 for a breakdown of actual letters
in the data set)
Table 2 -Breakdown of Data Sets by Class
1 2 3 4 5 6 7 8 9 10 11 12 13 14 15
Train 54 237 179 120 120 120 117 120 119 119 119 60 58 59 55
Validation 40 160 120 79 80 79 80 79 78 79 80 40 40 39 40
Test 23 98 74 50 50 48 50 50 50 50 49 25 25 25 25

24
5.2.3. WinTab
The data collection program was a custom C program for Windows using the
WinTab specification14. WinTab is a standard interface for pointing devices to
communicate with Windows. This permitted raw x and y coordinates to be taken directly
from the digital tablet. Implicit in this data collection was a sequence t, which aided in
letter recognition later on.
5.2.4. Introduction of Noise
There was some noise introduced in the data collection phase in the form of
additional pen-up and pen-down signals (see Figure 12). These were artifacts 15 of the
pen bouncing on the hard surface of the digital tablet as the volunteers wrote the letter.
14 See www.pointing.com for details of the WINTAB specification.
Figure 12 - Extra control codes in data collection
Additional Pen –up/ Pen-down Ar tifacts

25
They were realistic and the NNHALR system should handle them in the future, but for
now, the data was manually cleaned to exclude additional pen-up and pen-down signals.
Note, that many of the previous works in the field will not robustly handle noise like
these extra control signals, since they do a count of the number of strokes as a feature
which is used to recognize the letter.
Another artifact introduced in normal handwriting was hooks. Many systems
dehook the handwriting before recognition but a neural network method includes the
hooks in the training set and therefore the samples do not need dehooking.
The quantization artifacts introduced were minimal since the resolution accuracy
was 23 points/cm on a 9.2 x 12.8 cm writing space. This gives a quantization error of
0.5% in the x direction and 0.4% in the y direction. Errors from other factors far
outweigh any quantization effects. The resolution of the Palm hand-held is 0.035 cm
which gives similar quantization effects.
5.3. File Representation
5.3.1. Persistent Storage Our system needed persistent data storage. This way, the raw data was accessible
at any time for training and testing purposes. Eventually, the system will handle real-
time on-line data but this can be simulated using files as the source instead of a writer
using the digital tablet. Upon completion, only the weights of the feature extraction and
classification phases would be stored persistently.
5.3.2. Extendable Format
15 In this paper, the terms noise and artifacts are used interchangeably.

26
The data was stored in a format that could be easily understood by other
handwriting recognition programs. The UNIPEN 16 standard for cursive handwriting was
chosen to accomplish this. This format has become the worldwide-accepted standard for
storing cursive handwriting data. The NNHALR system needed the data in a Matlab-
compatible format, so it received an additional conversion for this purpose but many
programs are written to read UNIPEN data directly. Matlab17 provided the application
and algorithm development environment for processing further phases of the recognition
process including neural network feature extraction and classification.
5.3.3. Data Format for system
Each volunteer’s data was stored in one large Unipen-compliant file. This file had
a header section with fields such as gender, handedness, country of origin and age
16 details on UNIPEN can be found at http://hwr.nici.kun.nl/unipen/ 17 For more about Matlab, see www.mathworks.com
Figure 13 - Data Collection Dialog Box

27
range(see Figure 13). After the file header, there was a letter label header. This was
followed by pen-up/pen-down control code information and x and y coordinate
information generated from the pen on the digital tablet. This process was repeated for
each letter in the iteration set. Table 3 lists the data set subdivided by gender and country
of origin to give an idea of even distribution of the data.
Table 3 - Nationali ty and Gender Breakdown of NNHALR Data set
Egypt KSA Kuwait Other Palestine Syria Totals
Male 4 2 3 1 4 0 14
Totals 7 3 4 3 6 2 25
Female 3 1 1 2 2 2 11
5.4. Segmentation
5.4.1. Letter Segmentation
Segmentation occurs at two levels. In a more general recognition system, words must be
segmented into letters and then letters into strokes. In order for the pattern recognition
system to recognize Arabic letters correctly, robust letter segmentation is needed. Since
the NNHALR system only processes isolated Arabic letters, letter segmentation is
assumed. However, the system does need to pre-process the archived UNIPEN format. A
custom segmentation program, written in C, which separated the

28
Figure 14 - Segmentation into Matlab files
UNIPEN file for each volunteer into individual files for each letter and converted
the UNIPEN format into Matlab-ready format was used (see Figure 14).
5.4.2. Stroke Segmentation
Stroke segmentation is done automatically by pen-up and pen-down control codes
provided by the tablet. In the absence of noise, an automatic segmentation program could
simply count strokes and divide the letter into its respective primary and secondary
strokes 18. These would then be sent to separate SOMs for feature extraction. However,
since the data samples included extra pen-up and pen-down control codes as artifacts in
the data collection process, the primary and secondary strokes were manually separated
with the goal of automating the process later on.
This task is simpli fied because there is a definite order to the strokes. The
primary stroke is almost always written before any secondary strokes. Thus, in an
18 A primary stroke is the first and longest stroke. It represents the body of the letter. The secondary stroke(s) is any strokes that follow in the same letter.
-1 -1 286 184 285 182 285 181 285 182 285 184 284 185 . . . . . . 438 315 438 316 437 316 435 317 -2 -2
.VERSION 1.0
.DATA_SOURCE Tim Klassen Dalhousie University .DATA_CONTACT Tim Klassen Dalhousie University email: [email protected] .DATA_ID Arabic .COORD X Y .HIERARCHY CHARACTER. ############################################# .DATE May 6 2001 .SEX F .HAND R .COUNTRY Other .AGE +30 ############################################# .SEGMENT Letter: HAH Unicode: 062D .PEN_DOWN 286 184 285 182 285 181 285 182 285 184 284 185 . . . . . . 438 315 438 316 437 316 435 317 .PEN_UP
Matlab-ready control codes
Y Coordinates
X Coordinates
29
automated system, the Primary SOM can receive the first stroke. If it recognizes, then
the secondary strokes are sent to the Secondary SOM. However, if the Primary SOM is
undecided about the first stroke, then there is possibly noise and the second stroke is sent
to the Primary SOM. This procedure is repeated until the Primary SOM gives a positive
identification of a stroke using a threshold φ. This threshold could be defined as a degree
of confidence in the winning classification.
Many of the systems looked at in Section 3 depend on a count of the strokes as a
key feature to be fed to the classifier. This creates a problem if the data is noisy. Our
system should deal with this effectively since the feature extraction does not depend on
control codes or stroke counting after segmentation.
5.5. Critical Point Extraction
The next phase reduces the data input space in order to minimize the training
requirements by considering only the important features of a letter instead of every data
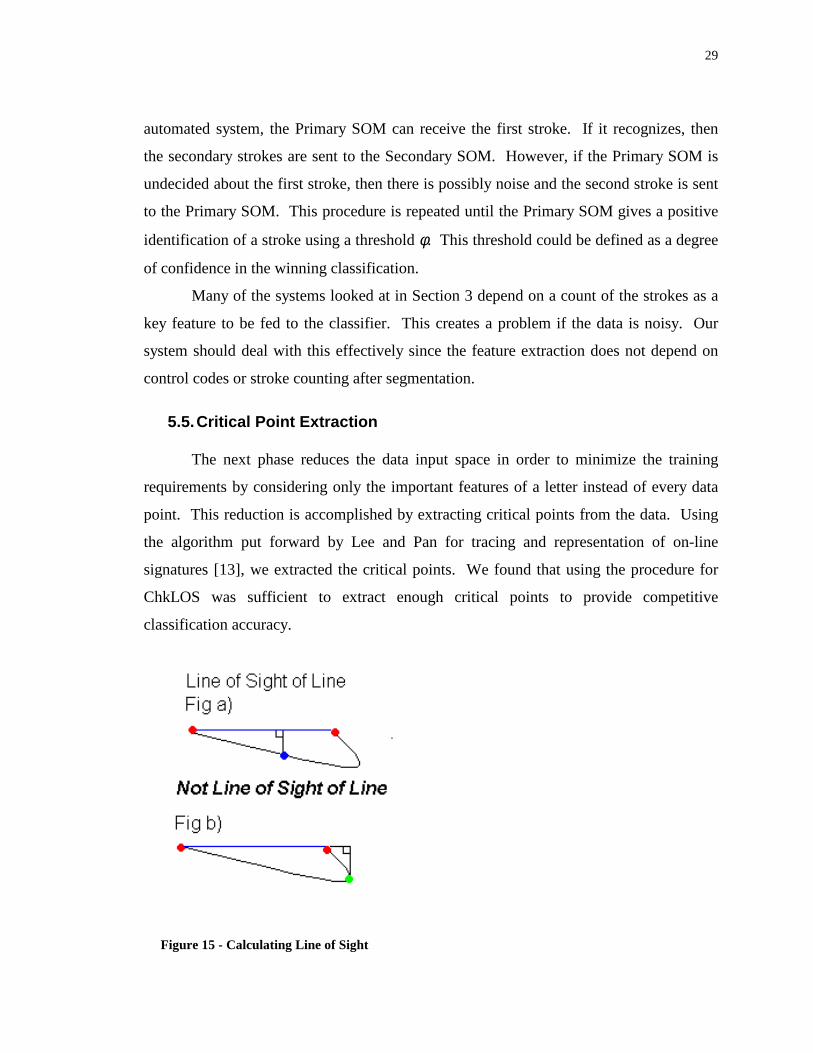
point. This reduction is accomplished by extracting criti cal points from the data. Using
the algorithm put forward by Lee and Pan for tracing and representation of on-line
signatures [13], we extracted the criti cal points. We found that using the procedure for
ChkLOS was suff icient to extract enough criti cal points to provide competitive
classification accuracy.
Figure 15 - Calculating L ine of Sight

30
ChkLOS stands for Check Line of Sight and checks to see if an intermediate point
is in Line of Sight of a line between two endpoints (see Figure 15). Note that in part a) of
Figure 15, the blue dot is LOS of the blue line while in part b), the green dot is not LOS
of the blue line. This procedure will give criti cal points at all endpoints and any curvature
variation greater than a threshold δ.
This threshold can be varied to give different numbers of criti cal points. If δ is
set to zero, then all the points are given. If δ is set high, then only a few criti cal points
will be calculated. What is the right number of criti cal points for reducing the input space
while retaining the important data points to create features? Tejwani says:
“T he human apparently places heavy emphasis on features that are formed by criti cal points that are symmetrically opposite about an axis and features that are extracted from adjacent criti cal points from the shape.” [14]
Since cursive handwriting is not a closed shape, there generally is not symmetry
about an axis. However, at high points of curvature there should be a concentration of
criti cal points while straighter sections of stroke will have significantly less criti cal points
(see Figure 16). Table 4 shows experimental data for choosing a δ threshold of 10 which
minimized the average number of data points and the standard deviation of the number of
data points.
Table 4 - Test data for selection of parameter Delta
Delta Values for CheckLOS Mean Standard
Deviation
Min Max Mean Min Max Mean Delta = 1 10.48 32.89 20.92 3.61 9.93 6.42 Delta = 2 10.23 32.04 20.51 3.46 9.59 6.25 Delta = 5 9.77 29.71 19.34 3.15 8.53 5.77 Delta=10 8.83 25.97 17.36 2.63 7.58 5.17

31
Delta = 10 8.83 25.97 17.36 2.63 7.58 5.17
5.6. Normalization of Data Once these criti cal points have been extracted, the data needs to be normalized so
that the letters will be the same size and in the same position.
5.6.1. Scaling Normalization
People have great variabilit y in their handwriting. Some write small l etters and
others write larger letters. Scaling reduces or enlarges the size of the letters to a pre-
defined size. In our system, the predefined size is given by the mean of the average
difference between the maximum and minimum in the x and y directions across all
volunteers.
Table 11 in Appendix B shows the resulting averages. After rounding the mean x
and mean y values to 175, the scaled box size for the data is 175x175 pixels. One of the
side effects of scaling the letter data is that the minima and maxima in the x and y
directions touch the edge of the scaling box. An analysis of the data shows that this works
well for all l etters except for the letter Ali f which is tall and thin (similar to the letter ‘ l’
in the Latin alphabet). We modified the scaling algorithm to only scale in the y direction
Figure 16 - Cr itical Point Density – Or iginal Letter(Left); Cr itical Points extracted with Delta=10 (r ight)

32
but leave the x direction untouched for Ali f. This scaled Ali f was then centered in the unit
box. This gave marked improvement in Ali f recognition accuracy 19 .
However, this process must be automated so that the algorithm automatically
detects an ali f. Comparing the ratio of the difference in extrema in the x
direction divided by the difference in extrema in the y direction accomplishes this. If
these ratios are greater than some threshold γ (defined heuristically), the letter is not an
ali f (see Equation 7). This leads to the interesting case of classifying the letter to extract
the features before classifying the letter.
Equation 7 – Ali f Detector
î
≤>
=−−=
thresholdrifalif
thresholdrifalifnot
yy
xxr
)min()max(
)min()max(
19 Choosing a threshold of 0.25 doesn’ t classify about 11% of the Ali fs on average but doesn’ t misclassify any other letters. This means that 89% of Ali fs are now normalized for height but not width.
33
5.6.2. Translation Normalization
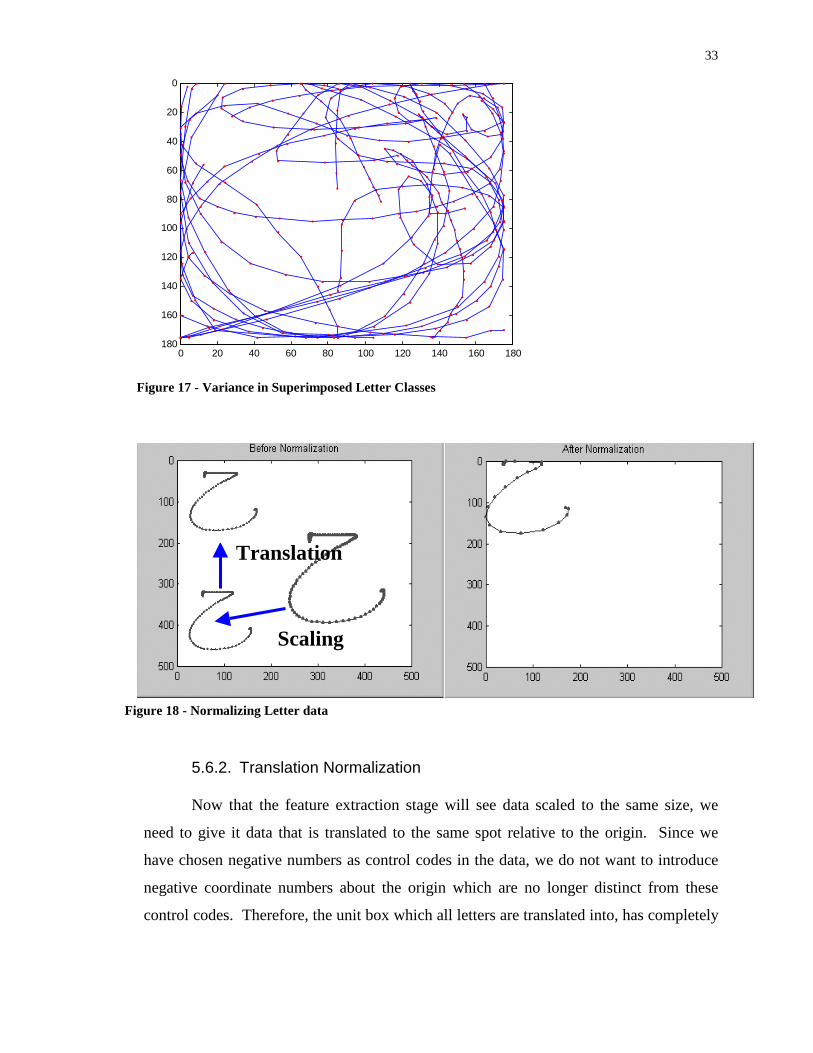
Now that the feature extraction stage will see data scaled to the same size, we
need to give it data that is translated to the same spot relative to the origin. Since we
have chosen negative numbers as control codes in the data, we do not want to introduce
negative coordinate numbers about the origin which are no longer distinct from these
control codes. Therefore, the unit box which all l etters are translated into, has completely
Figure 17 - Var iance in Superimposed Letter Classes
Figure 18 - Normalizing Letter data
0 20 40 60 80 100 120 140 160 180
0
20
40
60
80
100
120
140
160
180
Scaling
Translation

34
positive coordinates.20 Translating within this box enhances the similarities along the
edge while translating about the centroid would enhance the similarities close to the
centroid. This process should be selected to reflect the greatest variance in the data set.
Figure 17 shows the variance in letters normalized to a unit box where the greatest
variance is along the edges of the unit box. Figure 18 gives a typical letter before and
after scaling and translation.
The NNHALR system was scaled across the entire letter before segmentation.
This gives a wider variety in input and should lead to more robust feature extraction.
However, an alternative scaling technique would be to scale after segmentation which
should give better recognition accuracy across the data set.
5.6.3. Time Normalization
As stated earlier, one of the advantages of on-line character recognition is that
temporal information such as sequence and length of time to produce strokes is implicit.
Sequence information was used in our system to give the feature extraction stage
additional temporal information about a coordinate within a stroke. The Wacom
Graphire tablet records pen input at a maximum rate of 100 points/second 21. However,
some volunteers write at a different pace than others and may even write at a different
pace from themselves at a given time. This is li kely to distract the learning process from
identifying robust features (i.e. represents a source of ‘ noise’) . We therefore, need to
normalize the sequence information over the unit interval in order to compare different
strokes.
However, following normalization with time across the unit interval (ie. t ∈
[0,1]), the SOM did not separate well i n the temporal direction. Since the interval along
the other axis (x and y co-ordinates) was much larger, the SOM only performed well i n
the coordinate direction. Normalizing time with t ∈ [0,100] corrected that problem. This
means that the first endpoint is t = 0 and the last endpoint is t =100 for each letter. Time
normalization is divided across strokes so that if a letter has 2 strokes, the first or primary
20 0 to 175 in the x direction and 0 to 175 in the y direction

35
stroke will be lower in the time-normalized sequence and the second or secondary stroke
will have higher time-normalized sequence numbers.
It remains to be seen what the effect on secondary strokes is, but it seems to work
well on primary strokes. A possible variation for trying to improve recognition accuracy
is to set the temporal horizon at max(t) =100 for each stroke rather than each letter since
letters without secondary strokes will have a different temporal horizon than letters with
secondary strokes. One hundred was arbitrarily chosen as a unit interval because it was
the nearest order of magnitude to the magnitude of the scaled x & y maxima.
5.6.4. Rotation Normalization
Making a data set rotation-invariant is another typical normalization. It was
assumed that the SOM would handle slight variations in rotation and produce robust
features since the SOM is topologically ordered grouping similar rotation orientated
letters together. However, Writer 26 wrote all of the data on the slant and the
performance on recognition (39%) was the worst of any of the test data.
In addition, this writer also introduced some new patterns previously unseen but
this effect was not suff icient to account for this level of poor recognition. A slight
modification on the system would be to rotate the data by some small random angle about
a Gaussian curve. This favors small random changes in rotation while allowing for more
extreme rotational change. This would give a new data set with more robust invariance to
rotation. Another possible solution was to use an algorithm to detect the longest axis
about which to rotate the letter and normalize it with respect to the origin. It was decided
that this method was too computationally intensive.
5.6.5. Skew Normalization
Skew22 is stretching or shrinking an object. Italicized letters are an example of
skew. Again, the assumption was that the SOM would handle the skew in letters because
of its topological ordering properties and natural variations in skew in the data set.
21 Wacom Graphire Users Manual p. 108. 22 Skew and slant are used interchangeably in this paper.
36
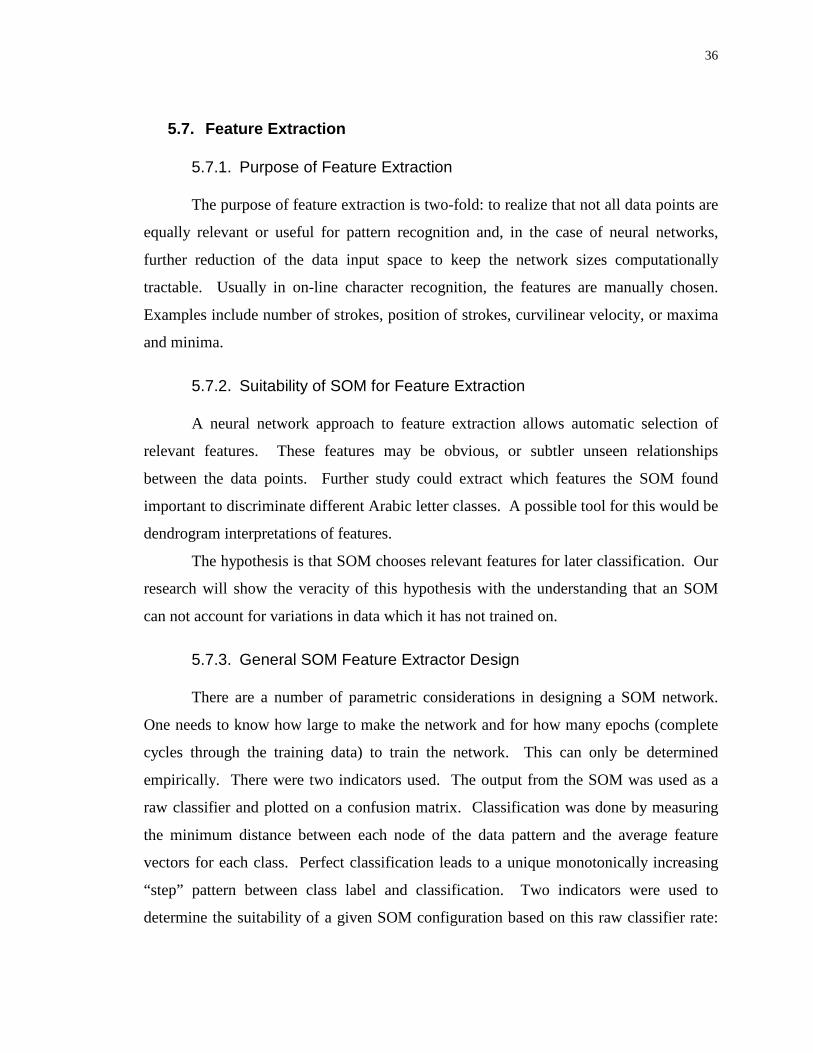
5.7. Feature Extraction
5.7.1. Purpose of Feature Extraction
The purpose of feature extraction is two-fold: to realize that not all data points are
equally relevant or useful for pattern recognition and, in the case of neural networks,
further reduction of the data input space to keep the network sizes computationally
tractable. Usually in on-line character recognition, the features are manually chosen.
Examples include number of strokes, position of strokes, curvili near velocity, or maxima
and minima.
5.7.2. Suitability of SOM for Feature Extraction
A neural network approach to feature extraction allows automatic selection of
relevant features. These features may be obvious, or subtler unseen relationships
between the data points. Further study could extract which features the SOM found
important to discriminate different Arabic letter classes. A possible tool for this would be
dendrogram interpretations of features.
The hypothesis is that SOM chooses relevant features for later classification. Our
research will show the veracity of this hypothesis with the understanding that an SOM
can not account for variations in data which it has not trained on.
5.7.3. General SOM Feature Extractor Design
There are a number of parametric considerations in designing a SOM network.
One needs to know how large to make the network and for how many epochs (complete
cycles through the training data) to train the network. This can only be determined
empirically. There were two indicators used. The output from the SOM was used as a
raw classifier and plotted on a confusion matrix. Classification was done by measuring
the minimum distance between each node of the data pattern and the average feature
vectors for each class. Perfect classification leads to a unique monotonically increasing
“step” pattern between class label and classification. Two indicators were used to
determine the suitabilit y of a given SOM configuration based on this raw classifier rate:

37
the gross misclassification rate and the “clumpiness” of the misclassifications 23. In other
words, how many errors did it make and how consistently did it misclassify them? Was
it ordered or random?
5.7.4. Two SOM Model
In order to decide on a particular configuration for a SOM, we experimented with
various configurations and arrangements of neurons and noticed that when a square SOM
was used, the neurons were organized in a rectangular shape. Since the edge neurons
were not being activated, a rectangular arrangement of neurons was chosen (see Figure
6).
The next phase in training the SOM configurations was to recognize that various
Arabic letter classes favored one configuration over another and to train a number of
23 “Clumpiness” indicates whether a given misclassification was consistently misclassified (above a threshold) or whether it is randomly misclassified.
Figure 19 - Two SOM M odel
-1 –1 –1 21 12 7 22 12 10 23 14 12 -2 -2 -2
-1 –1 –1 21 12 7 22 12 10 23 14 12 -2 -2 -2
-1 –1 –1 21 12 7 22 12 10 23 14 12 -2 -2 -2 Normalized
Reduced Data Set
x t
35 Node SOM
24 Node SOM
t t
y
-0.238 -0.217 0.238 -0.412 -0.234 0.634 -0.833 -0.238 0.854 -0.432 Feature Vector
-0.238 -0.217 0.238 -0.412 -0.234 0.634 -0.833 -0.238 0.854 -0.432 Feature Vector
-0.238 -0.217 0.238 -0.412 -0.234 0.634 -0.833 -0.238 0.854 -0.432 Feature Vectors
38
SOM networks to cover the spectrum of Arabic letter classification. This would prove
useful in partitioning later on (see Section 5.8.4).
The first SOM model was a pair of SOM, one SOM for X coordinates & T (time)
inputs and the second SOM for Y coordinates & T(time) inputs. The first SOM was 35
nodes in a 7x5 arrangement. The second SOM was 24 nodes in a 6 x 4 arrangement (see
Figure 19). In the model, primary data strokes are fed simultaneously to the dual SOM,
data pair by data pair, and a winner node is determined based on the SOM equation given
in Equation 2. When these winning nodes are activated, the cumulative scores in the
corresponding output vector offset are incremented. After all the data pairs have
randomly been entered in the SOM, the two SOM output feature vectors are joined
together to create a new output feature vector of 59 outputs per pattern. The other 2 SOM
architecture tried was 70 nodes, 35 nodes for X & T and 35 nodes for Y & T.
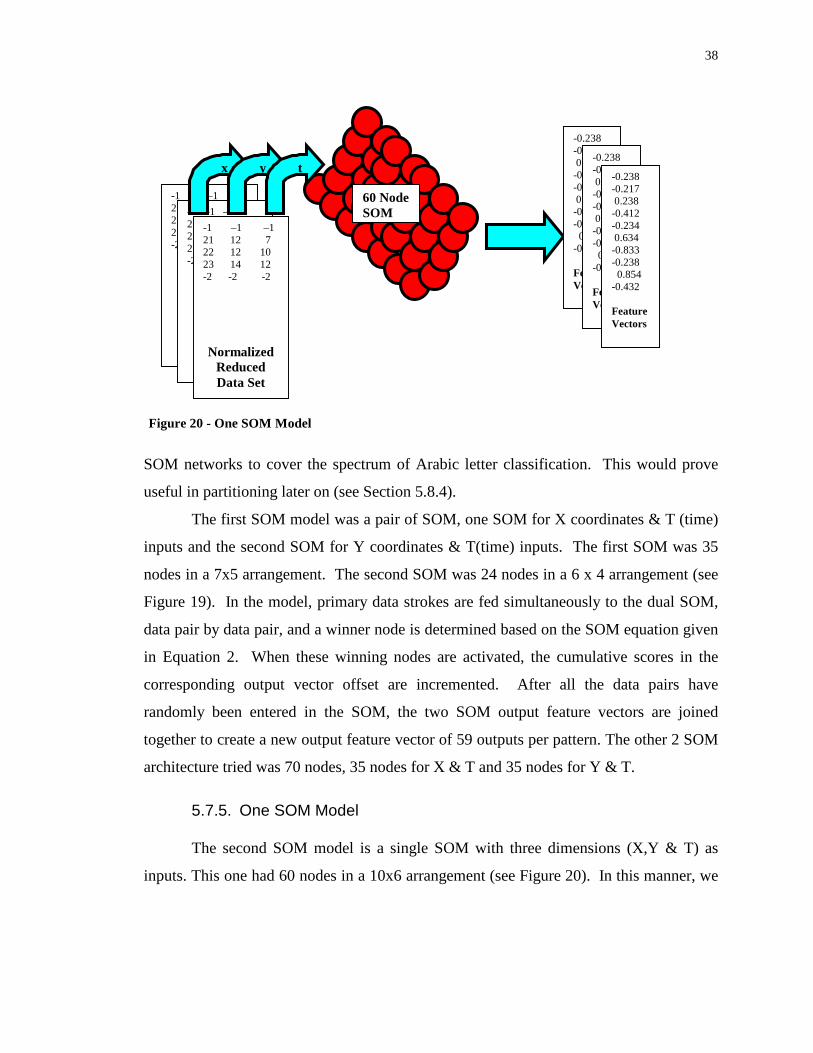
5.7.5. One SOM Model
The second SOM model is a single SOM with three dimensions (X,Y & T) as
inputs. This one had 60 nodes in a 10x6 arrangement (see Figure 20). In this manner, we
Figure 20 - One SOM M odel
-1 –1 –1 21 12 7 22 12 10 23 14 12 -2 -2 -2
-1 –1 –1 21 12 7 22 12 10 23 14 12 -2 -2 -2
-1 –1 –1 21 12 7 22 12 10 23 14 12 -2 -2 -2 Normalized
Reduced Data Set
x
60 Node SOM
y
-0.238 -0.217 0.238 -0.412 -0.234 0.634 -0.833 -0.238 0.854 -0.432 Feature Vector
-0.238 -0.217 0.238 -0.412 -0.234 0.634 -0.833 -0.238 0.854 -0.432 Feature Vector
-0.238 -0.217 0.238 -0.412 -0.234 0.634 -0.833 -0.238 0.854 -0.432 Feature Vectors
t

39
could compare directly how a 59-node pair of SOMs and a 60 node SOM performed
respectively.
It was determined that the 2 SOM network extracted features better than the 1
SOM network. X&T needed 35 nodes while Y&T needed 24 nodes. 5000 epochs was
chosen as a suitable duration for training. Training for more epochs (7500) did not really
improve the misclassification scores or the “clumpy” nature of the misclassifications.
Figure 21 shows the difference in classification accuracy between 2 SOM 70 and
1 SOM 60 by letter class. Any difference below zero indicates better performance by 2
SOM 70. Class 2 is the deciding class for overall accuracy difference on the training set.
5.7.6. Feature Vector Normalization
The outputs from the feature vector are normalized according to Equation 8. The
j th element in the i th output vector is decremented by the mean and divided by the
standard deviation for that vector. This helps the classifier to train better by placing 68%
Figure 21 - 2SOM 70 vs 1 SOM 60
2 SOM 70 vs 1 SOM 60 on Training Set
-70
-60
-50
-40
-30
-20
-10
0
10
20
30
40
1 2 3 4 5 6 7 8 9 10 11 12 13 14 15
Class Label
Dif
fere
nce
in E
rro
rs

40
of the data within a single standard deviation of the mean (zero) and 99% within three
standard deviations [15].
Equation 8 – Feature Normalization
stdi
ijinormji P
PPP
−= ,
,
5.8. Classification
5.8.1. Perceptron
A perceptron, which takes the normalized SOM outputs as inputs, is trained for
each of the 15 classes. The input ranges are the normalized max and min from each SOM
node. We trained the perceptron for 500 epochs on the inputs from the 1st,3rd and 5th
samples from each of the first 20 writers. This accounted for the “sloppy” factor where
the writers would write faster and sloppier as the trial experiment progressed. Originally,
we had been training on the 1st,2nd and 3rd samples and found that the data was more
likely to overfit neat handwriting. The training error goal varied with the different SOM
architecture inputs. With each group of perceptrons, we took the lowest training error in
the first 500 epochs and saved the weights at that point.
In training the group of perceptrons, we modified the original transfer function of
the network from hardlim to purelin 24 to give the output described in Section 5.9.
5.8.2. Multi-Layer Perceptron
Recall from the discussion in Section 2.5 that multi -layer perceptrons were useful
for solving non-linear problems. To test the hypothesis that the classification of Arabic
handwritten letters was a non-linear problem and therefore was too diff icult for a
24 Hardlim is a transfer function that outputs 1 for any outputs above zero and 0 for all outputs below zero. Purelin gives the output as it is without any changes.
41
perceptron to solve, we used the same outputs from a SOM and classified using a set of
MLPs, with one MLP for each SOM network. The results are discussed in Section 6.3.
5.8.3. Genetic Programming
Genetic programming uses mutation and crossover to search a population of
encoded symbolic solutions to solve the classification problem. Genetic programs use the
instruction set (+, -, *, %, sine, cosine, sqrt in this case) to create programs that will
correctly classify a given data set with a given recognition rate. This provides a
comparison with the classification accuracy of the perceptron using an alternative, more
robust non-linear learning algorithm than that of the MLP.
The results are discussed in Section 6.3. For more information about genetic
programming, see Koza[16] for the seminal paper in the field and Tomassi [17] for a
concise introduction to GP .
5.8.4. Class-wise Partitioning
After trying the above three different SOM/perceptron architectures, it was noted
that classification performance varied class-wise across different SOM configurations. A
new system could therefore be composed by partitioning25 the various architecture’s
based on the best class-wise classifications, as identified on training or validation data,
for a better overall recognition rate.
The lowest expected error rate for each class was chosen (see colored entries in
Table 5 and Table 6) and a committee of experts was established. Based on training or
validation error performance, a given SOM/ perceptron combination would be chosen for
a particular class. These class selections would then be “fixed” so that the classification
would be based on the SOM/perceptron’s most discriminant classes. In the case of a tie
between class-wise classification errors, the SOM architecture which had the lowest
25 Partitioning is the process of recognizing which SOM performs best on a given letter class and ‘combining’ those nodes to create a new ‘single’ SOM. This SOM could be manually created by combining neurons from the other SOMs but we simulated this.

42
overall error rate was chosen. Partitioning on training(Table 5) gave a different result
than partitioning on validation (Table 6).
Table 5 - Err ors with Class-Wise Par titioning on Training Set
By Class 1 2 3 4 5 6 7 8 9 10 11 12 13 14 15 Total
Err ors
2 SOM 59 3 75 9 23 19 63 3 3 22 11 16 1 4 0 8 260
2 SOM 70 6 17 9 11 28 17 8 2 18 19 52 2 4 2 7 202
1 SOM 60 5 97 69 22 19 15 11 6 9 25 8 4 6 4 7 307
Partitioned 3 17 9 11 19 15 3 2 9 11 8 1 4 0 7 119
Table 6 - Err ors with Class-Wise Par titioning on Validation Set
By Class 1 2 3 4 5 6 7 8 9 10 11 12 13 14 15 Total
Err ors
2 SOM 59 13 68 15 30 18 46 10 9 19 15 15 6 13 5 12 294
2 SOM 70 14 16 19 15 24 15 22 5 16 29 40 9 19 3 13 259
1 SOM 60 6 82 52 17 25 20 10 12 18 24 12 9 6 13 15 321
Partitioned 6 16 15 15 18 15 10 5 16 15 12 6 6 3 12 170
5.8.5. Pruning
One problem encountered using Class-wise partitioning was that a committee of
experts increased the number of SOM neurons three-fold to 189 neurons. Given the
intended application base, ideally the system needed to be smaller. Pruning the nodes
provided a chance to get rid of non-productive nodes and improve error rates at the same
time.

43
Using the fact that each SOM/perceptron combination performed well on a subset
of the classes, an algorithm (see Figure 22) was implemented that attempted removing
each SOM node and simulating the classification result for those classes in the perceptron
network. Zeroing out the input for that node simulated removing a node. The node that
reduced the original error by the most was permanently zeroed out. As long as the error
decreased or stayed the same, nodes would continue to be removed. In Section 6.1.4, we
will discuss the effectiveness of partitioning and pruning.
5.9. Output
The purelin output from the perceptrons gave various levels of activation of the
different class output neurons for a given input sample. Ideally, the correct class should
be positive while all other class output activations are negative. However, there were two
other possibiliti es that occurred: 1) there was more than one positive output 2) there were
no positive outputs. The rule for deciding which class won was to take the maximum
activation level and declare that class as the winner, even if all classes had negative
Figure 22 - Remove Node Algor ithm
[removednodes] = removenode(network,data set,target set,initialbaseerror) initialize variables while errorchange >= 0 adjust errorchange zero out the best node for reducing error for i = 1 to size of data set zero out the ith row run data set through network find errors in classification compare against partitioned classes for error count end select new node which has the largest negative errorchange store node index to removednodes end return;

44
activation. Using a purelin transfer function and the maximum rule for winning
classification led to some misclassifications whereas a hardlim rule [39] would have
classified the pattern as undecided. However, it also classified some negative activations
correctly since the correct class was closest to a positive activation .
5.10. Summary
A handwriting recognition system has many phases that assist in transforming raw
x & y co-ordinates into a classification decision. Preprocessing of the data includes
segmentation, representation, sampling and normalization. The next major stage is
feature selection. In our system, this was done by an SOM architecture to automatically
select discriminant features. The last major stage is classification. These results went
through an optimization stage of class-wise partitioning and pruning. Section 6.3
compares the performance of a perceptron, a multi -layer perceptron and a genetic
programming algorithm as classifiers.
6. Experimental Measurements
Our experiments were conducted on the Arabic handwriting of 25 independent
writers who contributed a total of 3461 isolated Arabic letters as detailed in Section 5.2
(see Table 2 for breakdown by class). These letters were then processed as described in
Section 5. The experiments had 3 trials on 3 disjoint data sets: 1) training (1656 letters) 2)
validation (1113 letters) and 3) test (692 letters). The validation set was composed of
letters that were written by the same authors as the test set but not seen in testing. The test
set was written by 5 authors that were totally ‘unseen’ in the training process.
There were four procedures done in our experiments: training, partitioning (see
Section 5.8.4), pruning (see Section 5.8.5) and testing. The first trial trained on the
training set and tested on the validation set and test set without partitioning or pruning.
The second trial trained, partitioned and pruned on the training set and then tested on the
validation set and test set. The third trial trained on the training set, partitioned and
pruned on the validation set and tested on the test set (see Table 7).

45
Table 7 – Tr ials in Arabic Letter Experiments
Training Set Validation Set Test Set
Train � � �
Partition � �
Prune � �
Test �
� �
� �
6.1. Results of Experiments
The first experiment was to simply train the 3 SOM architectures on the training
set and test on all three sets without any optimizations. The results are displayed in
Section 6.1.1.
This became the baseline for later optimizations. The baseline for recognition accuracy
was defined as the average accuracy of the validation and test set of the best
SOM/perceptron architecture without partitioning or pruning. We found that choosing an
error goal for each SOM/perceptron architecture during the 5000 epochs perceptron
training time improved the accuracy across training, validation and test. Using this
output as a baseline, we then ran trials #1-3 and compared results. (see Table 8).
6.1.1. Trial 1 – No partitioning or pruning

46
The best SOM for recognition accuracy is the 2 SOM 70 node. On training, it
recorded an accuracy of 88%. On validation, it had recognition accuracy of 77%. On
test it had an accuracy of 64%. Figure 24 and Figure 25 show the respective confusion
matrices for Trial 1 across the training, validation and test sets.
6.1.2. Trial 2 – Partition and Pruning on Training Set
The training accuracy results were 94%. The validation accuracy results for
partition and pruning on training set were 82% for class-wise partitioning only and 84%
for partitioning and pruning based on the training set. The test accuracy results were 77%
on training pruning and partitioning. Partitioning on the training set selected 6 nodes from
the 59 SOM, 6 nodes from the 70 SOM and 3 nodes from the 60 SOM (refer to Table 5).
Pruning on the training set reduced the 59 SOM to 53 nodes, the 70 SOM to 63 nodes,
and the 60 SOM to 42 nodes. This was a total of 158 nodes or a reduction of 16% in the
number of nodes after pruning. Pruning also reduced the number of errors by 1%.
Table 8 - Recognition Accuracy Results
Train Validation Test Average
Baseline – No training goal 83% 75% 63% 69%
Figure 24 - Tr ial #1 Training and Validation Confusion Matr ix

47
Trial #1 – No optimizations
with training goal
88% 77% 64% 72%
Trial #2 – Partition/Prune on Training 94% 84% 77% 80%
Trial #3 – Partition/Prune on Validation 90% 89% 79% 85%
Average 92% 83% 73% 79%
Genetic Programming 92% 77% 72% 74.5%
6.1.3. Trial 3 – Partitioning and Pruning on Validation Set
The validation accuracy results were 89% after partitioning and pruning on the
validation set and 85% after only partitioning. The test accuracy results were 79% based
on validation set pruning and partitioning. Partitioning on the validation set selected 6
nodes from the 59 SOM, 6 nodes from the 70 SOM, and 3 nodes from the 60 SOM.
Pruning on the validation set reduced the 59 SOM to 43 nodes, the 70 SOM to 63 nodes,
and the 60 SOM to 42 nodes. This was a total of 148 nodes or a reduction of 22% in the
number of nodes. Pruning also reduced the number of errors by 4%.
6.1.4. Effectiveness of Partitioning and Pruning
Figure 25- Tr ial#1 Test Set Confusion Matr ix

48
We have generally shown the effectiveness of class-wise partitioning and pruning.
What is the relative effectiveness of partitioning and pruning based on training compared
with being based on validation data?
When the training set is used for partitioning, there are 4 classes in the test set
where partitioning doesn’ t choose the lowest error rate for a total of 7 errors. This makes
a differential of 1%. When the validation set is used for partitioning, there are 2 classes in
the test set where partitioning doesn’ t choose the lowest error rate for a total of 4 errors.
This would only reduce errors by 0.57%. Clearly, partitioning on a data set that is
different from the training set is optimal over partitioning on the same set as training.
When the training set is used for pruning, there are 156 errors instead of 222
errors without pruning for a total error decrease of 9.5% over the test set. When the
validation set is used for pruning, there are 148 errors instead of 198 errors without
pruning for a total error decrease of 7.2% over the test set.
Pruning the data set results in a decrease in error rate. We also notice that pruning
on the validation set is optimal by 8 errors over pruning on the training set (these finding
are summarized in Table 9).
Table 9 - Relative Effectiveness of Par titioning and Pruning
Training Set Validation Set
After Partitioning
Non-optimal classes 4 2
Additional errors 7 4
After Pruning
Total Errors in Test set 156 or 23% 148 or 21%
6.1.5. Test Set Analysis
Looking at a breakdown of the test set results, we notice that three out of the five
test writers had accuracy above 80%. Writer 26 was excluded because she wrote all her
letters on a slant which resulted in an accuracy of 39.3%. (try rotating her data later)

49
Writer 1 2 3 4 5 6 7 8 9 10 11 12 13 14 15 Total
Error
Accuracy
22 4 0 1 4 1 1 3 0 0 1 1 0 1 0 1 18 87.1%
23 1 2 2 1 5 0 0 2 5 2 0 0 4 0 1 25 82.1%
24 2 3 1 3 2 6 2 2 2 4 6 1 3 2 1 34 70.6%
25 0 4 12 4 5 5 5 1 10 3 0 0 3 0 2 54 60.3%
27 4 5 0 4 1 1 1 0 0 0 0 0 2 1 0 19 86.3%
6.2. Proof of concept
Our initial claim was: “This research will show on-line average Arabic character
recognition rates above 80% and training recognition rates above 90% using neural
networks for classification and feature extraction with multiple unconstrained writers.”
Part of the data collection process was to instruct the writers to write isolated
letters “as they normally would” (see Section 5.2.2). This gave our data set the desired
unconstrained nature.
We had 25 sets of data that we trained and tested on to show multiple writers.
Our average recognition rate for validation and test sets was 71.8% in Trial #1, 80.1% in
Trial #2 and 85.1% in Trial #3 for a total average of 79%. The training recognition rate
was 88% in Trial#1, and 94% in Trial #2 and 90% in Trial #3 for an average of 92% 26.
6.3. Comparing Perceptrons with Other Classifiers
Perceptrons are quick to train and suitable for linear problems. The assumption
for this project was that the problem could be solved linearly. To check this hypothesis,
non-linear classifiers (Genetic Programming and Multi -layer perceptrons) were compared
with perceptrons.
26 Calculations were done as follows : The average recognition rate is the average of the averages between validation and test sets across the 3 trials.

50
Genetic Programming (GP) is an evolutionary machine learning strategy that uses
cross-overs and mutations to create a program of mathematical operations on a data
population to produce the “fittest” population as discussed in Section 5.8.3. It was tested
on the poorest performing SOM network, SOM 60. Genetic Programming had a positive
example average of 92% for the training set, 77% for the validation set, and 72% for the
test set. Perceptrons had a positive example average of 81 % for the training set, 71% for
the validation set and 54% for the test set. Multi -layer Perceptrons (MLPs) had a positive
example average of 94% for the training set, 73% for the validation set and 60% for the
test set. The detailed results can be found in Appendix B : Tables 12-14.
GP had better test set results than the perceptron and is more robust in a noisy
environment. However, the perceptron scored better for the validation set which is the
closest simulation to a PDA with a single user. Multi -Layer Perceptrons overfitted on the
training set and did poorly on the validation and test set.
The perceptron classifiers also overfitted on negative examples. A technique to
overcome this is to weight the positive examples more heavily.
6.4. Comparing NNHALR with Previous Systems
Table 10 – Summary of Previous Approaches
Approach Segmentation Writers Sensitive to
Noise
Classes Data Set Recognition
Accuracy
Hierarchical Rule-
Based
No ? Yes 60 1200 100%
Segmented Structural
Analysis
Yes 1 Yes 13 50 words 86%
Structural / Fuzzy No ? Yes 28 ? 100%
Template/Dynamic No 1 No? 28 28 x 20
copies
96%
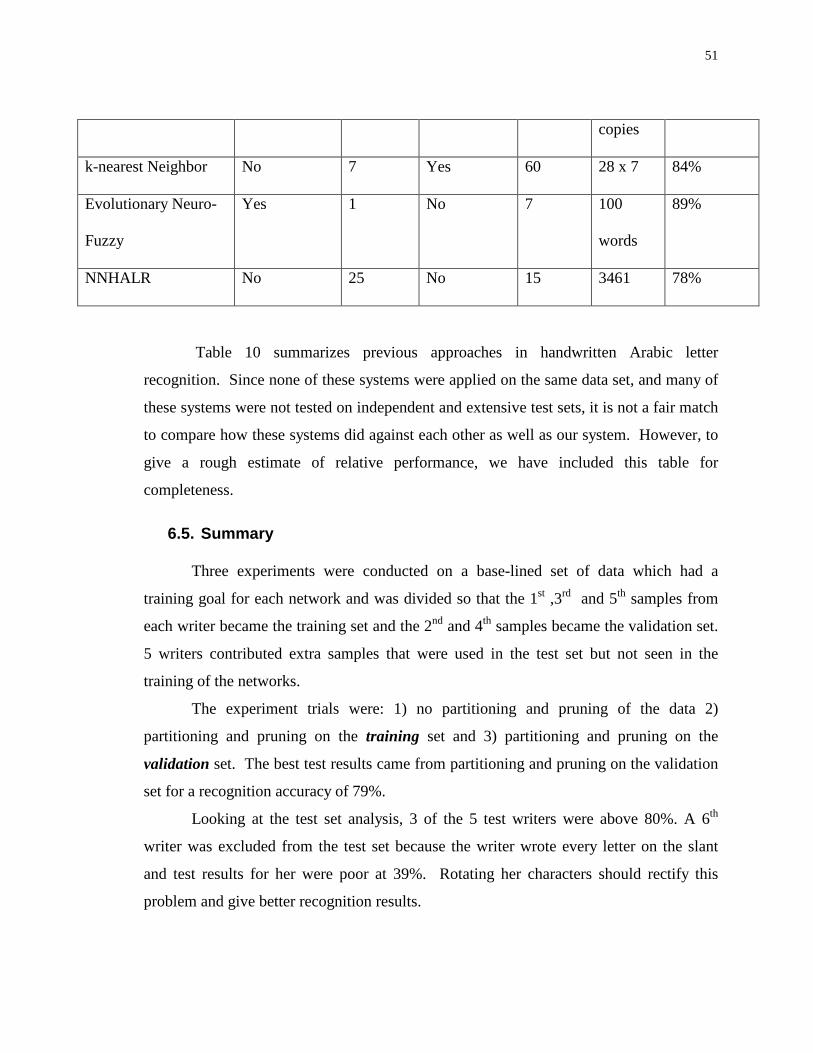
51
copies
k-nearest Neighbor No 7 Yes 60 28 x 7 84%
Evolutionary Neuro-
Fuzzy
Yes 1 No 7 100
words
89%
NNHALR No 25 No 15 3461 78%
Table 10 summarizes previous approaches in handwritten Arabic letter
recognition. Since none of these systems were applied on the same data set, and many of
these systems were not tested on independent and extensive test sets, it is not a fair match
to compare how these systems did against each other as well as our system. However, to
give a rough estimate of relative performance, we have included this table for
completeness.
6.5. Summary
Three experiments were conducted on a base-lined set of data which had a
training goal for each network and was divided so that the 1st ,3rd and 5th samples from
each writer became the training set and the 2nd and 4th samples became the validation set.
5 writers contributed extra samples that were used in the test set but not seen in the
training of the networks.
The experiment trials were: 1) no partitioning and pruning of the data 2)
partitioning and pruning on the training set and 3) partitioning and pruning on the
validation set. The best test results came from partitioning and pruning on the validation
set for a recognition accuracy of 79%.
Looking at the test set analysis, 3 of the 5 test writers were above 80%. A 6th
writer was excluded from the test set because the writer wrote every letter on the slant
and test results for her were poor at 39%. Rotating her characters should rectify this
problem and give better recognition results.

52
Class-wise partitioning and pruning both proved to be useful optimizations for
improving recognition accuracy. The initial claim was validated in the training set and
was within 1% of being validated in the average of the validation and test sets.
Genetic programming provides a robust non-linear solution to the worst network.
MLPs perform well on the training set but tend to overfit and have poorer validation and
test results. This points to further investigation of non-linear solutions. However, this
needs to be weighed off against the speed of the perceptron for on-line adaption in
personal digital assistant computing platforms.
7. Conclusions
7.1. Conclusions drawn
We can conclude that our Neural Network approach to recognizing Arabic
Handwritten Letters is proved as a viable concept. Further refinement of the networks
will certainly produce higher recognition accuracy while increasing the robustness of the
solution.
The Arabic language has some distinctions from Asian or Latin-script languages
that make it a unique recognition problem. Our system accounts for some of these in the
separation of primary and secondary strokes into separate recognition tasks and the SOM
handling extra control codes.
Many of the previous approaches to Arabic cursive character recognition involved
hierarchical reduction of the complexity of the problem and heuristic rules for feature
selection which would not react well to noisy input.
Further work is necessary to explore non-linear classifiers and optimizing linear
solutions.
Also, to complete the Arabic letter recognition process, the NNHALR system
should handle secondary strokes. This can be done by manually segmenting the
secondary strokes initially and creating another SOM feature extractor/perceptron
classifier combination and training it for secondary strokes. The results from secondary
53
stroke classification could then be used to analyze the output from the primary stroke
classification. The secondary stroke classifier only needs to recognize 4 classes: hat, line,
dot and hamza (an s-shaped symbol) (see Figure 2 ). It could assist recognition for the
primary stroke classifier by excluding letters which did not have the classified secondary
stroke. This would cause the system to classify the data for the runner-up class and likely
improve recognition accuracy.
7.2. Summary of contributions • Arabic handwritten isolated letter UniPen-compliant data set of 3469 letters
• Self-Organizing Feature Map network tuned to produce relevant features for Arabic recognition from data coordinates while reducing the input space
• Perceptron network tuned to recognize the 15 letter class shapes
• Robust automated feature selection in the SOM
• Potential of robustness in the presence of noise
7.3. Future Research
• Secondary Strokes Feature Extractor/Classifier
• Automatic segmentation of primary and secondary strokes
• Test assumption about similar letter classes
• Change temporal horizon for primary and secondary strokes
• Check robustness in noisy setting and with different random initializations
• Determine which features the SOM finds important using a dendrogram
• Explore non-linear classifiers
• Try translating data about the centroid instead of extrema
• Normalize scale after segmentation
• Bias the data towards positive examples
7.4. Real-world applications of the concept

54
• Palm interface for Arabic, which like Nukoush, has a customizable Grafitti script but
can also work well for other people
• Handwriting tutorial for children
• Arabic input for computers where people do not know how to type
• Cell phone input
7.5. Summary
Arabic handwriting recognition is a diff icult problem but our hope is that the
NNHALR system will be a step towards a neural network approach to robustly solve it.
The concept is proved as a possibilit y. Now, it remains for further research to build on
this foundation and work towards automatic segmentation and recognition of Arabic
words.

55
References [1] Lippmann, R. “Pattern Classification using Neural Networks” , IEEE Communications Magazine, p. 48, November 1989. [2] Amin, A. “Arabic Character Recognition” , Handbook of Character Recognition and Document Image Analysis, World Scientific Publishing Company, 1997, pp. 398. [3] Kohonen, T., Oja E., Simula Olli , Visa A., and Kangas, J. “Engineering Applications of the Self-Organizing Map”, Proceedings of the IEEE, vol. 84, no. 10, p. 1358,October 1996. [4] Haykin, S., Neural Networks: A Comprehensive Foundation, Prentice-Hall , New Jersey, USA.1994. Chapter 10.5: Self-Organizing Feature-Mapping Algorithm. [5] Haykin, S., Neural Networks: A Comprehensive Foundation, (2nd Edition),Prentice-Hall , New Jersey, USA.1999. Chapter 3.8,3.9:Perceptrons. [6] Kohonen, T. “The Self-Organizing Map”, Proceedings of the IEEE, Vol. 78. No. 9, pp.,1464-1480, September 1990. [7] El-Sheik, T.S. and El-Taweel, S.G., “Real-Time Arabic Handwritten Character Recognition” ,Pattern Recognition, volume 23 (1990), number 12 , pp. 1323-1332. [8] Al-Emami, S. and Usher, M. “On-Line Recognition of Handwritten Arabic Characters” , IEEE Transactions on Pattern Analysis and Machine Intelli gence, Vol. 12, No. 7, July 1990. pp. 704-710. [9] Alimi , A. and Ghorbel, O. “The Analysis of Error in an On-Line Recognition System of Arabic Handwritten Characters” , Proceedings of ICDAR 1995, 14-16 August 1995, Montreal, Canada. pp. 890-893. [10] Bouslama, F. and Amin, A., “Pen-based Recognition System of Arabic Character Utili zing Structural and Fuzzy Techniques” , 1998 Second International Conference on Knowledge-Based Intelli gent Electronic Systems, 21-23 April 1998, Adelaide, Australia. Editors, L.C. Jain and R.K. Jain, pp 76-85. [11] El-Wakil ,M. and Shoukry, A., “On-Line Recognition of Handwritten Isolated Arabic Characters” , Pattern Recognition, vol. 22, no.2, pp. 97-105, February 1989.

56
[12] Alimi , A., “An Evolutionary Neuro-Fuzzy Approach to Recognize On-Line Arabic Handwriting” , Proceedings of the 4th International Conference Document Analysis and Recognition (ICDAR '97), pp. 382-386, 1997. [13] Lee, S. and Pan, J. “Off line Tracing and Representation of Signatures” ,IEEE Transactions on Systems, Man, and Cybernetics, Vol. 22, No.4, pp. 755-771, July/August 1992. [14] Tejwani, Y. and Jones, R. “Machine Recognition of Partial Shapes using Feature Vectors” , IEEE Transactions on Systems, Man and Cybernetics, Vol. SMC-15, No. 4, p. 510, July/August 1985. [15] Rui Y., Haung T.S., Mehrotra S., “Content-based image retrieval with relevance feedback in MARS”,Proceedings of the International Conference on Image Processing (1997), Vol 2, pp 815-818. [16] Koza J.R., “Hierarchical genetic algorithms operating on populations of computer programs”, Proceedings of the 11th International Joint Conference on Genetic Algorithms, Sridharan N.S. (ed), 1989, pp 768-774. [17] Tomassini M., “Evolutionary Algorithms.” in Towards Evolvable Hardware, Lecture Notes in Computer Science - 1062, Sanchez E., Tomassini M., (eds). Springer-Verlag, 1996, pp 19-47.

57
Appendix A – Informed Consent Form
Data Collection for Cursive Arabic Alphabet Recognition
Principal Investigators: Tim Klassen Dr. Malcolm Heywood Faculty of Computer Science Faculty of Computer Science Dalhousie University Dalhousie University We invite you to take part in a research study at Dalhousie University. Taking part in this study is voluntary and you may withdraw from the study at any time. There will be no repercussion from choosing not to participate in this study. The study is described below. This description tells you what you will be asked to do and includes any risks or inconvenience you might experience. Participating in the study may not benefit you directly but we may be able to learn how to recognize custom Arabic script and incorporate that into the design of new hand-held recognition software. There is no compensation for participating in this study and you may terminate your participation in the study at any time without prejudice. You should discuss any questions you have about this study with either of the principal investigators. The purpose of this study is to recognize custom Arabic letters written on a digital tablet. The study consists of a single session of 15-20 minutes where you will be asked to fill i n a dialog box with information consisting of your gender, handedness, age range and country of origin. Then you will be asked to write the letters of the Arabic alphabet 5 times. These entries will be recorded in a file. All personal and identifying data will be kept confidential. Only the user code will be used by the computer system and the informed consent form will be kept in a secure place. In the event that you have any diff iculties with, or wish to voice concern about, any aspect of your participation in this study, you may contact the Human Research Ethics/Integrity Coordinator at the Dalhousie University Off ice of Human Research Ethics and Integrity for assistance. The phone number is (902)494-1462. I have read the explanations about this study. I am at least 18 years of age. I have been given the opportunity to discuss it and my questions have been answered to my satisfaction. I hereby consent to take part in the study. However, I realize that my participation is voluntary and that I am free to withdraw from the study at any time. Par ticipant: Researcher: Name:_____________________________ Name:_______________________ Signature:__________________________ Signature:____________________ Date:______________________________ Date: ________________________

58
Appendix B – Experimental Tables
Table 11 – Average Calculations of Scale
Table 12 - Genetic Programming Class Results for SOM 60
Training Validation Test Combined Positive Negative Combined Positive Negative Combined Positive Negative
1 82% 100% 81% 82% 90% 82% 75% 78% 75% 2 78% 89% 76% 81% 79% 82% 76% 70% 77% 3 72% 94% 70% 82% 80% 82% 75% 74% 75% 4 72% 82% 71% 77% 71% 78% 75% 68% 76% 5 79% 86% 78% 88% 93% 88% 85% 90% 85% 6 67% 94% 66% 76% 83% 75% 79% 75% 79% 7 75% 100% 74% 81% 85% 81% 82% 76% 82% 8 77% 93% 75% 88% 72% 89% 84% 76% 85% 9 77% 100% 75% 77% 89% 76% 75% 72% 75%
10 73% 93% 71% 75% 89% 74% 74% 76% 73% 11 77% 81% 76% 74% 48% 76% 78% 53% 80% 12 72% 92% 71% 73% 68% 74% 76% 40% 77% 13 75% 100% 74% 82% 73% 82% 76% 84% 75% 14 77% 88% 77% 89% 74% 89% 77% 76% 90%
Writer Average X Average Y1 168 1853 74 734 157 1545 53 566 318 3187 121 1318 72 1049 91 108
10 264 25311 170 16112 87 8313 140 14314 265 26115 336 29716 82 7517 211 18218 120 12519 284 27520 159 19021 313 347
Averages 174.25 176.05

59
15 76% 100% 75% 81% 63% 82% 84% 72% 84% Totals 75% 93% 74% 80% 77% 80% 78% 72% 79%
Table 13 - Multi-Layer Perceptron Results with Training Par titioning/Pruning
Training Validation Test Combined Positive Negative Combined Positive Negative Combined Positive Negative
1 99% 87% 100% 98% 75% 99% 97% 61% 98% 2 100% 100% 100% 93% 78% 96% 90% 67% 93% 3 100% 97% 100% 96% 78% 98% 94% 66% 97% 4 99% 88% 99% 95% 66% 97% 92% 52% 95% 5 99% 97% 99% 95% 70% 97% 91% 54% 94% 6 99% 94% 100% 96% 56% 99% 94% 33% 98% 7 100% 98% 100% 97% 91% 98% 96% 72% 97% 8 100% 96% 100% 97% 81% 99% 96% 60% 99% 9 100% 97% 100% 96% 65% 98% 94% 50% 98%
10 99% 92% 100% 97% 68% 99% 95% 56% 98% 11 99% 97% 99% 95% 71% 97% 92% 53% 95% 12 100% 93% 100% 99% 88% 100% 98% 76% 99% 13 100% 91% 100% 98% 58% 99% 97% 52% 99% 14 99% 93% 100% 98% 79% 99% 98% 80% 99% 15 100% 93% 100% 98% 68% 99% 97% 60% 98%
Totals 99% 94% 100% 96% 73% 98% 95% 60% 97%
Table 14 - Perceptron Results by Class with Training Par titioning/Pruning
Training Validation Test Combined Positive Negative Combined Positive Negative Combined Positive Negative
1 99% 91% 100% 97% 70% 99% 97% 52% 99% 2 94% 93% 94% 93% 90% 93% 92% 86% 93% 3 99% 96% 99% 97% 84% 98% 97% 80% 99% 4 98% 90% 99% 96% 78% 97% 93% 68% 95% 5 97% 86% 98% 96% 78% 97% 95% 64% 97% 6 91% 97% 90% 89% 92% 88% 92% 73% 94% 7 98% 97% 98% 96% 88% 97% 95% 78% 96% 8 99% 98% 99% 98% 94% 98% 97% 90% 98% 9 93% 96% 93% 92% 81% 93% 92% 74% 94%
10 98% 91% 98% 96% 80% 97% 95% 82% 96% 11 91% 92% 91% 89% 88% 89% 88% 80% 89% 12 99% 100% 99% 96% 80% 99% 98% 100% 98% 13 99% 86% 100% 97% 97% 99% 97% 48% 99% 14 99% 95% 99% 96% 92% 99% 98% 88% 98% 15 99% 93% 99% 97% 70% 98% 96% 67% 97%
Totals 97% 93% 97% 95% 84% 96% 95% 77% 96%