towards reinforcement solutions for urban fibre/fabric waste … · 2017-09-26 · towards...
TRANSCRIPT
Towards reinforcement solutions for urban fibre/fabric waste
using bio-based biodegradable resins.
Pramod Agrawal1, Alina Hermes
1, Solaf Bapeer
1, Anton Luiken
2, Gerrit
Bouwhuis1 and Ger Brinks
1 1Saxion University of Applied Sciences, Research group Smart Functional Materials,
Research Centre Design and Technology, Building Epy Drost, van Galenstraat 19,
7511 JL Enschede, The Netherlands. 2Alcon Advies B.V., De Aa 31, 7642 HA Wierden, The Netherlands.
E-mail: [email protected]
Abstract. The main research question is how to systematically define and characterize urban
textile waste and how to effectively utilise it to produce reinforcement(s) with selected bio-
based biodegradable resin(s). Several composite samples have been produced utilising
predominantly natural and predominantly synthetic fibres by combining loose fibres with PLA,
nonwoven fabric with PLA, woven fabric with PLA, two-layer composite & four-layer
composite samples. Physio-chemical characterisations according to the established standards
have been conducted. The present work is a step toward the circular economy and closing the
loop in textile value chain.
1. Introduction
Close loop thinking is an important part of current business strategies to reduce resource consumption
and positively contribute to the environment [1]. Consuming resources and generating waste on large
scale is typical for mainstream manufacturing industries [2]. ‘Circular economy’ (CE) is an approach
that would transform the use of resources in the economy and waste would become a valuable input to
other processes and products. Textile industry has huge impact on the environment. Around 90Kton
textile waste is collected in the Netherlands. Around 35% thereof is damaged and not re-usable
anymore as such [3]. Huge amounts of urban waste could serve as raw material sources for the new
applications. However, urban waste is less defined and consists of multiple materials. Therefore, the
research question in this paper is: how to systematically define and characterize urban textile waste
and how to utilise them effectively to produce reinforcement(s) with selected biodegradable bio-based
resin(s).
2. Materials and Methods
2.1 Physiochemical Characterisation
Characterisation of the textile fibres/fabric have been conducted to establish the fibre type and
percentage of each type in the waste stream. Physiochemical characterisation according to the
established standards have been conducted in terms of Raw materials test (AATCC TM 20A-2014),
Microscopic images (AATCC TM20-2013), Burn test (AATCC TM20-2013), Moisture regain
(AATCC TM 20A-2014), Oil extraction to determine the percentage of oil in the fibres (Mesdan Lab,
Code 273B), DuPont Waterdrop test (AATCC TM79-2014) density, fibre/fabric thickness, weight per

m2 (ASTM D3776-07), Elongation and tensile strength (ISO 2062:2009). The primary purpose of
these characterisation/tests were to identify % of fibres in textile waste streams and suitability of
substrates for composite making. Additionally, several synthetic waste streams have been tested with
FT-IR (Bruker-Tensor 27) for polymer determination.
2.2 Nonwoven production
In order to understand the effect of dimensional stability of reinforcement on composite making. Some
of the loose waste fibres have been converted into non-woven using air-laid web forming and needle
punching technique to ensure almost equal strength in all direction. Nonwoven production was carried
out at Havivank BV, Tilburg, the Netherlands.
2.3 Composite production
Hot press technique (preheating at 200⁰C for 40min and pressing with 2MPa for 3-5 min) has been
used for composite samples using three different poly lactic acid resins (PLA 2003D granulates which
is high molecular weight and crystalline, PLA 4060D granulates which is low molecular weight and
amorphous and PLA nonwoven with unknown properties) from Rodenburg Biopolymers BV and
Havivank BV, The Netherlands. Resulting composite samples have been evaluated using Charpy test
(ISO 14125:1998) for toughness/energy uptake and Three-point bending test (ISO 179-1:2010) for the
flexural strength.
3. Results and Discussion
3.1 Characterisation of textile waste streams
A systematic approach has been adopted (Figure 1) to handle the textile waste streams. Physio-
chemical tests and characterisation (see section 2.1) have been conducted to identify the % of certain
fibre type in the textile waste stream. As there are hardly no pure waste streams, the textile waste has
been broadly categorised as A) Predominantly natural fibres, further divided in to three parts a)
recycled fibres; such as Jute, Cacao Jute, Denim, Cotton, Acrylic wool blends, workwear mix fibres,
b) dust; such as cotton dust, Acrylic wool dust, and c) woven fabrics; such as jute bags and Demin
jeans. For the B) Predominantly synthetic fibres samples are e.g. waste stream 1 (claimed as
Polyamide 6/6.6), waste stream 2 (claimed as Polypropylene fibres), waste stream 3 (claimed as
Polyethylene) and waste stream 4 (shredded fibres from workwear/uniforms) etc. Considering the
complex and heterogeneous mix from batch to batch, the fibre/textiles waste streams have been used
as such, since it is almost impossible to purify them into 100% natural fibres and 100% synthetic
fibres
Figure 1: A systematic approach to handle fibre/textile waste into composite samples.
Physiochemical characterisation of several textile waste streams (dust, fibres, non-woven,
woven) samples have been conducted according to the tests and standards mentioned in the section
2.1. However, it was still not possible to establish the fibre types from the synthetic waste streams.
Therefore FT-IR studies of three different synthetic waste streams (WS1, WS2, WS3) have been
conducted using similar reference materials. The results of FT-IR spectra are presented in Figure 3.
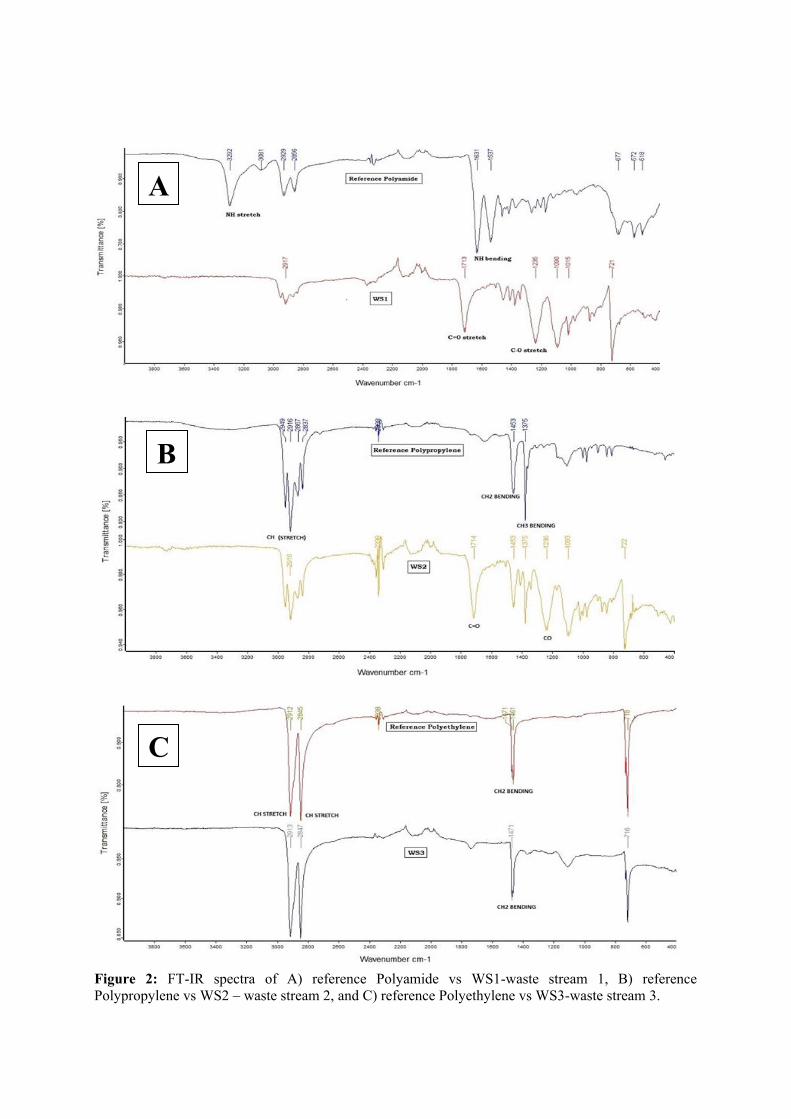
Figure 2: FT-IR spectra of A) reference Polyamide vs WS1-waste stream 1, B) reference
Polypropylene vs WS2 – waste stream 2, and C) reference Polyethylene vs WS3-waste stream 3.
A
B
C
It is clear from the Figure 3A that important absorption peaks of amide (3292 cm -¹ and 1631 cm -
¹) are not seen, when looking at the waste material of PA 6/66 (WS1). The remarkable peaks in the
waste material (WS1) are at 1713 cm -¹ and 1235 cm -¹. These peaks together are characteristics of an
ester group. From comparing the spectra of the waste material, it is clearly not a polyamide. The
spectra of WS1 has more similarities with PES, therefore it can be said that the main component of
WS1 is polyester and not as proposed polyamide spectra.
Figure 3B shows the comparison FT-IR spectra of reference Polypropylene and waste stream 2.
The spectra of the PP reference show three important peaks around 2916 cm -¹, 1453 cm -¹ and 1375
cm -¹. The peaks at 1375 cm -¹ and 1453 cm -¹, are similar to the absorption frequency of CH2
bending, these two peaks form an alkane group. It can be said that the main component is a PP of the
reference material. It is clear that there are additional peaks at 1713 cm -¹ and 1235 cm -¹ resembling
to polyester (Figure 3B). Hence it can be said that the waste stream 2 is a mixture of PP and PES.
Figure 3C, shows the FT-IR spectra of PE starting with the reference and then waste material
(WS3). The spectra of the reference PE show three important peaks, at around 2912 cm -¹, 2845 cm -¹
and 1461 cm -¹ the peaks at 2912 cm -¹ and 2845 cm -¹ are similar to the absorption frequency of CH
stretch with a frequency around 2850-3000 cm -¹. The peaks of the PE waste material are similar to the
reference PE. With peaks around 2913 cm -¹, 2847 cm -¹ and 1471 cm -¹. From spectra of the waste
material compared to the reference material it can be assumed that the main component is PE of the
reference and of the waste.
Finally, woven jute bags, loose cacao jute fibres, and cotton mix have been selected for the further
study from predominantly natural fibre waste stream. For the synthetic fibres waste stream the chosen
materials are waste stream 1 (PES), Waste stream 2 (Polypropylene/PES mix) and
Uniforms/Workwear mix. The decision was made on the basic of availability of raw materials and
ease/possibility to make in composite,
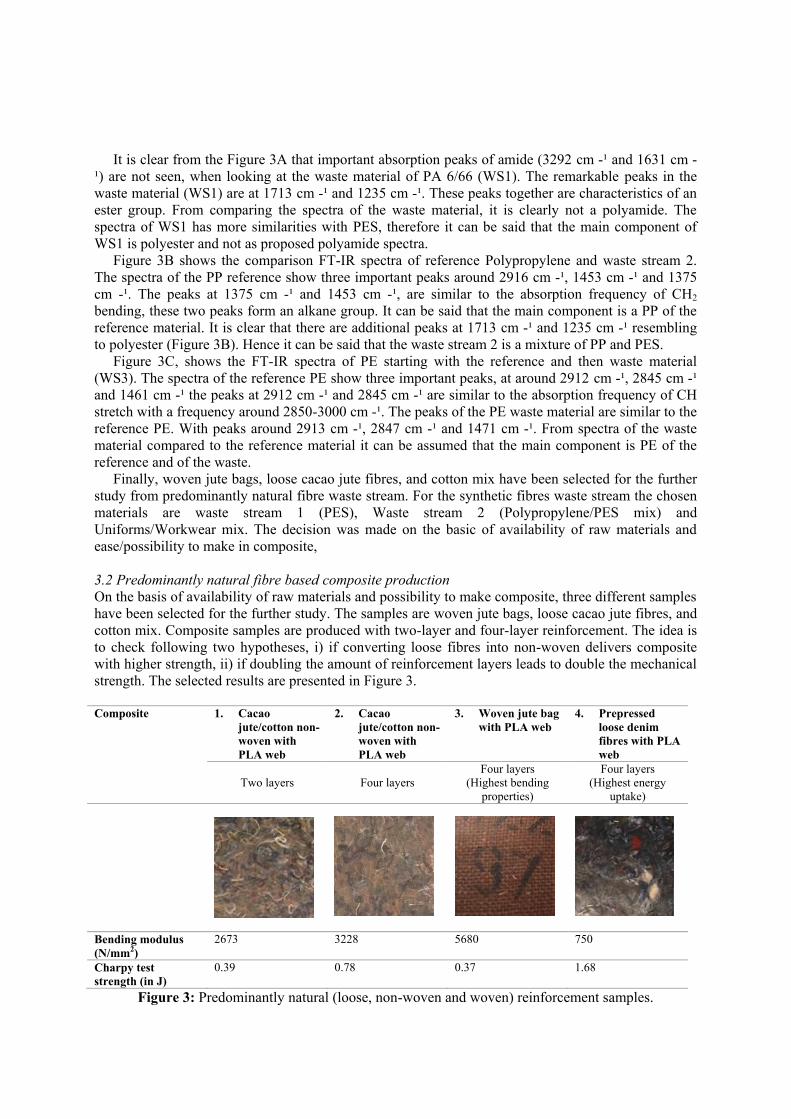
3.2 Predominantly natural fibre based composite production
On the basis of availability of raw materials and possibility to make composite, three different samples
have been selected for the further study. The samples are woven jute bags, loose cacao jute fibres, and
cotton mix. Composite samples are produced with two-layer and four-layer reinforcement. The idea is
to check following two hypotheses, i) if converting loose fibres into non-woven delivers composite
with higher strength, ii) if doubling the amount of reinforcement layers leads to double the mechanical
strength. The selected results are presented in Figure 3.
Composite 1. Cacao
jute/cotton non-
woven with
PLA web
2. Cacao
jute/cotton non-
woven with
PLA web
3. Woven jute bag
with PLA web
4. Prepressed
loose denim
fibres with PLA
web
Two layers
Four layers
Four layers
(Highest bending
properties)
Four layers
(Highest energy
uptake)
Bending modulus
(N/mm2)
2673 3228 5680 750
Charpy test
strength (in J)
0.39 0.78 0.37 1.68
Figure 3: Predominantly natural (loose, non-woven and woven) reinforcement samples.
As described earlier, the Three-point bending test (ISO 179-1:2010) is meant for flexural strength
and the Charpy test for the toughness/energy uptake. As seen from the figure 3, it is clear that doubling
the reinforcement layers (sample 1 vs sample 2), not necessarily doubles the bending modulus,
however the energy update tends to increase linearly. The higher flexural strength/bending properties
(5680 N/mm2) achieved by woven jute bag and PLA as resin. The woven structure of the
reinforcement seems to be responsible for this results. The highest toughness/energy uptake (in J) is
achieved for prepressed loose denim fibres. This can be attributed to easier penetration of PLA resin
across the loose denim fibers during composite production. To sum up it is advisable to use loose fibre
reinforcement for rigid surface like tables. Woven reinforced materials such as the jute bag could be
used for chairs as their bending behavior is superior. Additionally, it is to say that mixing Jute and
Cotton in nonwoven structure (Figure 3, sample 2) could be a good solution for making a product with
mixed/moderate properties
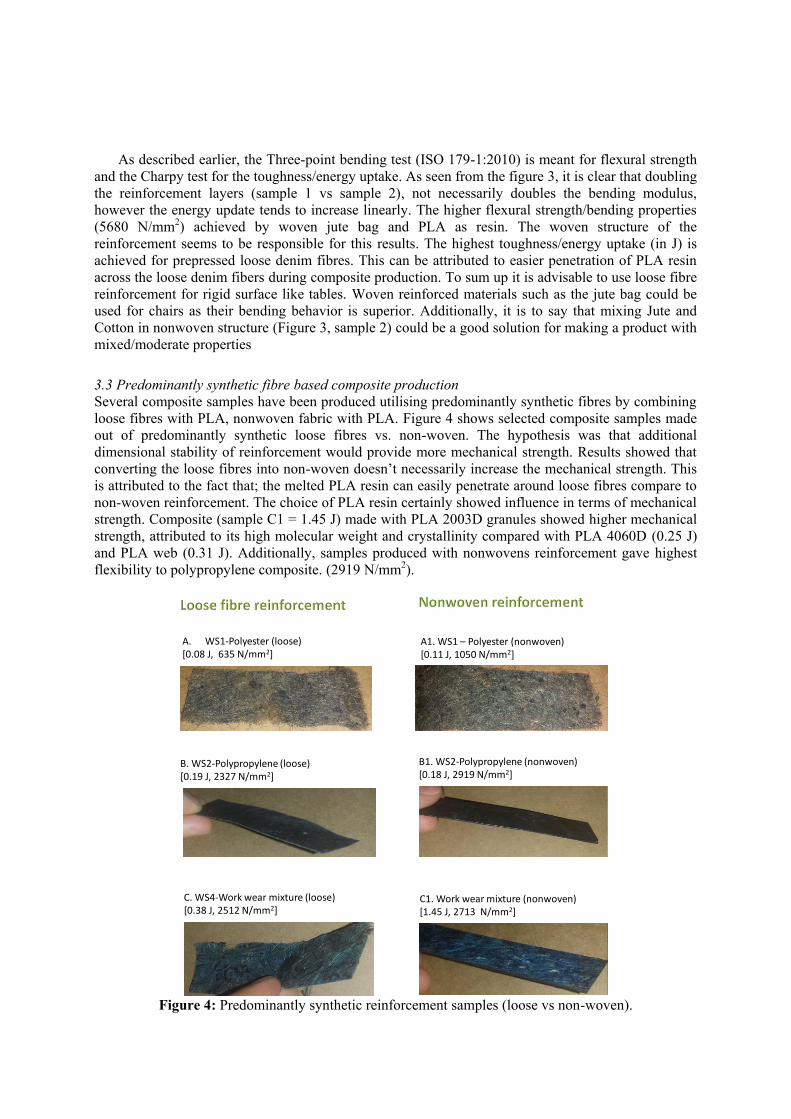
3.3 Predominantly synthetic fibre based composite production
Several composite samples have been produced utilising predominantly synthetic fibres by combining
loose fibres with PLA, nonwoven fabric with PLA. Figure 4 shows selected composite samples made
out of predominantly synthetic loose fibres vs. non-woven. The hypothesis was that additional
dimensional stability of reinforcement would provide more mechanical strength. Results showed that
converting the loose fibres into non-woven doesn’t necessarily increase the mechanical strength. This
is attributed to the fact that; the melted PLA resin can easily penetrate around loose fibres compare to
non-woven reinforcement. The choice of PLA resin certainly showed influence in terms of mechanical
strength. Composite (sample C1 = 1.45 J) made with PLA 2003D granules showed higher mechanical
strength, attributed to its high molecular weight and crystallinity compared with PLA 4060D (0.25 J)
and PLA web (0.31 J). Additionally, samples produced with nonwovens reinforcement gave highest
flexibility to polypropylene composite. (2919 N/mm2).
Figure 4: Predominantly synthetic reinforcement samples (loose vs non-woven).
C. WS4-Work wear mixture (loose)[0.38 J, 2512 N/mm2]
A. WS1-Polyester (loose) [0.08 J, 635 N/mm2]
B1. WS2-Polypropylene (nonwoven)[0.18 J, 2919 N/mm2]
B. WS2-Polypropylene (loose) [0.19 J, 2327 N/mm2]
A1. WS1 – Polyester (nonwoven)[0.11 J, 1050 N/mm2]
C1. Work wear mixture (nonwoven)[1.45 J, 2713 N/mm2]
4. Conclusions
During the course of this project, we identified a great number of possible material combinations with
varying technical and mechanical characteristics, as well as with a wide range of different perceptive
values (all data not shared). With some of the most favourable material combinations first prototypes
are developed, tested and investigated. Several loose fibre/non-woven/woven reinforced composite
samples have been prepared using three different PLA resins as a matrix for bio-based composites.
Composite samples with several interesting combinations with workwear mix fibres, Polypropylene
non-woven, Jute fibres, Denim fabric etc., have been produced with diverse properties (strength and
flexibility). It is possible to get tailored made end properties in terms of strength, flexibility by
selecting right type of reinforcement material and choice of resin. However further systematic research
is ongoing in the direction of optimizing end properties and circularity of the composite product(s).
There are opportunities in the area of i) large number of end applications, ii) the higher added value on
the material properties, iii) large volumes (with use of textile based waste materials) can be achieved
with and iv) the ability to optimize for (full) circularity. The present work is a step toward the circular
economy and closing the loop in textile value chain.
Acknowledgments
Authors wishing to acknowledge financial support from SIA-RAAK project entitled RECURF: Re-
using Circular Urban Fibres and Biobased Plastics in Urban Products. Support from partners
Amsterdam University of Applied Sciences, and Havivank BV Tilburg, Rodenburg Biopolymers BV,
Oosterhout, The Netherlands is appreciated.
References
[1] Felix Preston, 2012, A Global Redesign? Shaping the Circular Economy, EERG BP Chantham
House, 02, pp 1-20.
[2] Farazee MS Asif, Carmine Bianchi, Amir Rashid, and Cornel M Nicolescu, 2012, J. of
Remanufacturing, 2:4
[3] Koen de Snoo, 2012, Massabalans van in Nederland ingezameld en geimporteerd textile, Dutch
Ministerie van Infrastuctuur en Milieu, pp 1-29.

A preliminary study on puncture resistances of top andbottom layers of multi-layered needlepunched nonwovengeotextiles
G Alan and M TercanUsak University, Engineering Faculty, Textile Engineering Department, Usak İzmirYolu, 8. Km 1 Eylül Kampüsü, Uşak-Merkez, Türkiye
Email: [email protected]
Abstract. Needlepunched nonwoven textiles are commonly used as geotextiles for variousapplications. Considering both environmental and economical benefits, utilization of recycledfibres in nonwoven geotextiles has become an attractive issue. Within this scope, the aim ofthis study is to evaluate the puncture resistance performances of top and bottom layers ofmulti-layered needle punched nonwovens made of recycled fibres to be used as membraneprotective geotextiles by comparing them with those of made from polypropylene andpolyester fibres. Puncture resistance results indicated that nonwovens made of recycled fibresdemonstrated good performances at this preliminary stage.
1. IntroductionGeotextiles are defined as permeable fabrics generally obtained through nonwoven technology to beused in association with soil considering their ability to separate, filter, reinforce, drain, or protect. Inrecent years recycled fibres are commonly used in nonwoven geotextiles for their cost effectivenessand their replacable strength performances with that of the originals. The assessment of mechanicalstrength and durability performances of nonwoven geotextiles consisting of original and recycledfibres have attracted great attention from researchers for several applications [1-6]. From thisstandpoint the aim of this study is to evaluate the convenience of needle punched nonwovens made ofrecycled fibres to be used as membrane protective geotextiles by comparing their puncture resistanceperformances with those of made from polypropylene and polyester fibres. The puncture resistancetest of the fabrics were carried out according to the test standard TS EN ISO 12236.
2. MaterialsFibre fineness and staple length values of the standard polypropylene fibre and polyester fibre were 6dtex and 64 mm respectively. Recycled fibres were gained by mechanical recycling of any type oftextiles consisting of various fibres with length values in rank of 20 mm-80 mm and fineness valueschanging between 6-12 dtex.
3. Production Step
3.1 Preparation for needlepunchingFibers opened up from the bales were applicated an antistatic agent to prevent static electric chargingand were laid out for 24 hours. Thereafter they were fed into a fan for twice and blown up to the fiberstorage area. By this way the fibers were opened and dispersed for the preparation for carding process.In the carding zone fibers passed over 3 pairs of opener and cleaner drums and licked-in to the maincarding zone in which they were aligned in an essential parallel direction and carded by 6 pairs of

band type wired carding drums. The web formed by this way on the card was removed from the cardby doffer to the cross lapper. Folding of the layers were adjusted to meet the mass per unit area valuesfor each type of fabric and layered form of the webs were delivered to preneedle punching passingthrough the web feeder.
3.2 Needlepunching ProcessPreneedle punching loom used for this research was 12 cm x 240 cm in size and containedapproximately 3600 needles vertically arranged. Needle type was 5 x 18 x 32 x 3 ½ R333 G 1002.Production speed was adjusted to 3.67 meters/minute. Considering these production parameters punchdensities of the fabrics were calculated through the formula given below where;= /Ɛ , is punch density (m-2),n, is number of needles in the unit width of needling loom (m-1).P, is production speed (m.min-1)m, is number of punches in unit time (min-1).
Needlepunch densities of the nonwoven fabrics were calculated through this formulation as indicatedbelow and found to be 10.218 punches/m2 for each type of nonwoven fabric which can be consideredas a soft preneedle punching process.= , / = 10218 punches/m2
In the end, 12 types of preneedle punched nonwoven fabrics consisting of three types of raw materialsand 4 equivalent masses were produced through a conventional needle punching system. Properties offabrics which will be used as top and bottom layers of muti-layered end-products are given in Table 1.

Table 1. Nonwoven fabric properties.
Raw material Mass per unit area(g/m2)
Fabric Thickness(mm)
Needlepunchdensity(punches/m2)
Polypropylene 100 2.592 10218Polypropylene 150 3.876 10218Polypropylene 200 4.743 10218PolypropylenePolyesterPolyesterPolyesterPolyesterRecycled fibreRecycled FibreRecycled FibreRecycled Fibre
250100150200250100150200250
5.3372.4824.2604.4564.7502.1282.9273.5804.170
102181021810218102181021810218102181021810218
4. Test ProcedureThe determination of puncture resistance performances on nonwoven geotextiles has a greatimportance to evaluate required features for durability of the products [7]. Test procedure was carriedout according to “Geotextiles and geotextile-Related products-Static puncture test” TS EN ISO 12236.Test specimens were prepared through the instructions and conditioned for 24 hours. Five sampleswere duplicated for determining puncture resistance.
5. Results and DiscussionIn the case of soil-geotextile interaction the geotextile is subjected to perpendicular forces to it’s planedue to the subgrade surface irregularities [9]. Therefore researchers have studied puncture resistanceperformances of needlepunched nonwoven geotextiles by means of differences in testing prodcedures[9,10]. Puncture resistance values of the fabrics are presented in Table 2. These values are obtained forpreneedled top and bottom layers of the muti-layered end-products.
Table 2. Puncture resistance results of fabrics (N).
Raw material 100 g/m2 150 g/m2 200 g/m2 250 g/m2
Polypropylene 1.1076 7.2160 10.0100 17.7375Polyester 1.3800 8.0000 12.0800 10.9200Recycled 13.630 16.2475 9.2700 21.8120
In this study in the case of comparing puncture resistance values from the viewpoint of mass perunit area datum between each raw material group, it is obviously seen that for both PP fabrics and PETfabrics puncture resistances increased with increasing mass per unit area values as presumed excludingthe puncture resistance of the PET fabric of 250g/m2. Hereby, when needling density is too high forthe punched web, the bonding structure of the nonwoven is damaged and the puncture resistance ofnonwoven decreases accordingly [11]. Although the thickness values of the PET fabric of 200 and 250
g/m2 were very close to each other the aforementioned reason might have caused the punctureresistance result. Considering recycled fabrics it can be observed that except the puncture resistancevalue of the fabric of 200 g/m2 rising values take place for rising mass per unit area valuesrespectively.
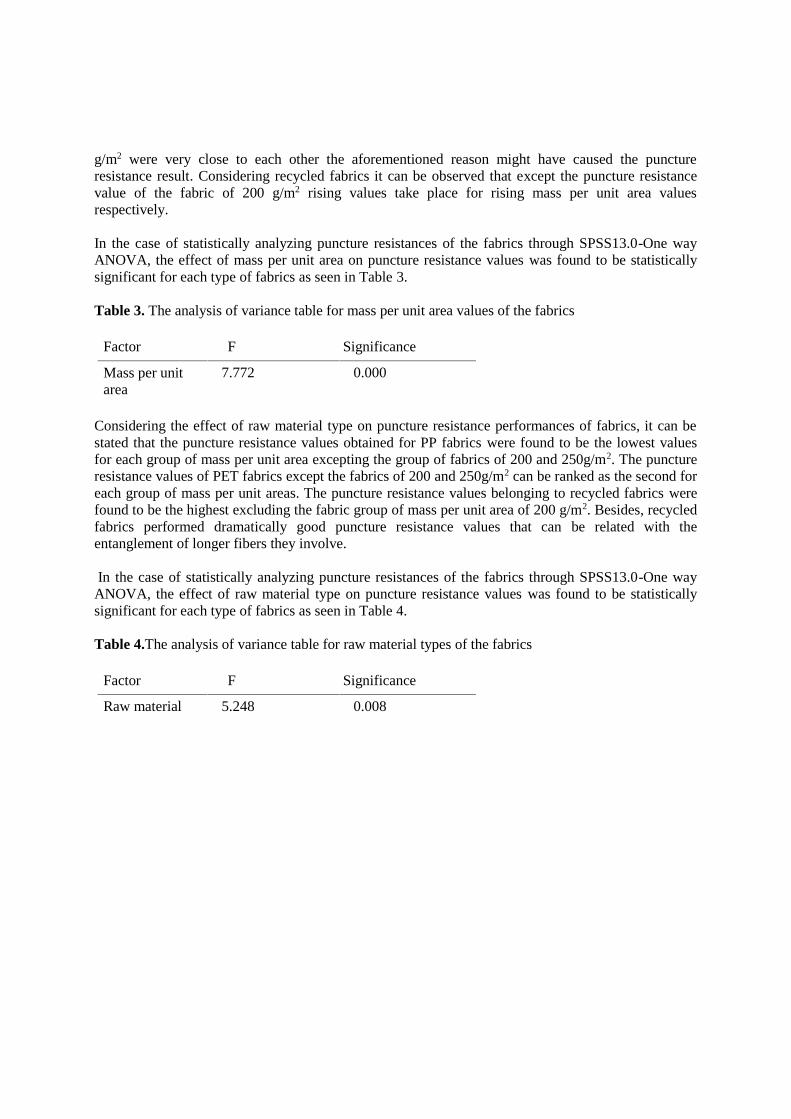
In the case of statistically analyzing puncture resistances of the fabrics through SPSS13.0-One wayANOVA, the effect of mass per unit area on puncture resistance values was found to be statisticallysignificant for each type of fabrics as seen in Table 3.
Table 3. The analysis of variance table for mass per unit area values of the fabrics
Factor F Significance
Mass per unitarea
7.772 0.000
Considering the effect of raw material type on puncture resistance performances of fabrics, it can bestated that the puncture resistance values obtained for PP fabrics were found to be the lowest valuesfor each group of mass per unit area excepting the group of fabrics of 200 and 250g/m2. The punctureresistance values of PET fabrics except the fabrics of 200 and 250g/m2 can be ranked as the second foreach group of mass per unit areas. The puncture resistance values belonging to recycled fabrics werefound to be the highest excluding the fabric group of mass per unit area of 200 g/m2. Besides, recycledfabrics performed dramatically good puncture resistance values that can be related with theentanglement of longer fibers they involve.
In the case of statistically analyzing puncture resistances of the fabrics through SPSS13.0-One wayANOVA, the effect of raw material type on puncture resistance values was found to be statisticallysignificant for each type of fabrics as seen in Table 4.
Table 4.The analysis of variance table for raw material types of the fabrics
Factor F Significance
Raw material 5.248 0.008
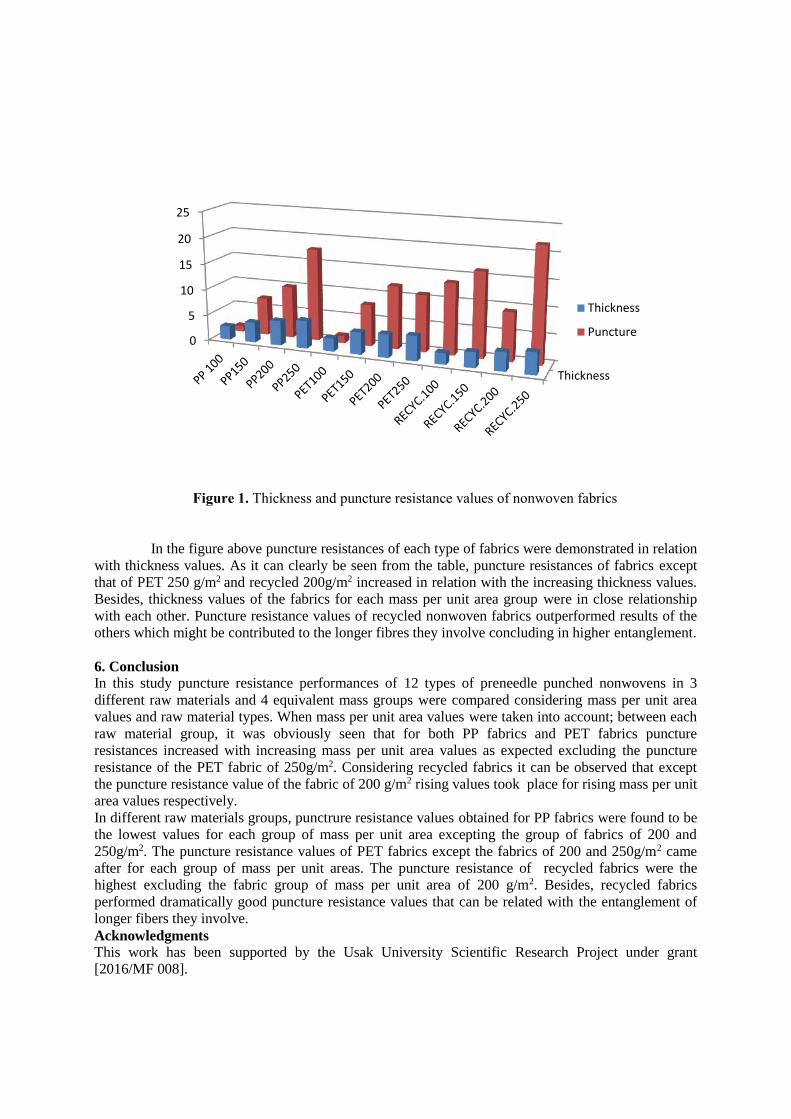
Figure 1. Thickness and puncture resistance values of nonwoven fabrics
In the figure above puncture resistances of each type of fabrics were demonstrated in relationwith thickness values. As it can clearly be seen from the table, puncture resistances of fabrics exceptthat of PET 250 g/m2 and recycled 200g/m2 increased in relation with the increasing thickness values.Besides, thickness values of the fabrics for each mass per unit area group were in close relationshipwith each other. Puncture resistance values of recycled nonwoven fabrics outperformed results of theothers which might be contributed to the longer fibres they involve concluding in higher entanglement.
6. ConclusionIn this study puncture resistance performances of 12 types of preneedle punched nonwovens in 3different raw materials and 4 equivalent mass groups were compared considering mass per unit areavalues and raw material types. When mass per unit area values were taken into account; between eachraw material group, it was obviously seen that for both PP fabrics and PET fabrics punctureresistances increased with increasing mass per unit area values as expected excluding the punctureresistance of the PET fabric of 250g/m2. Considering recycled fabrics it can be observed that exceptthe puncture resistance value of the fabric of 200 g/m2 rising values took place for rising mass per unitarea values respectively.In different raw materials groups, punctrure resistance values obtained for PP fabrics were found to bethe lowest values for each group of mass per unit area excepting the group of fabrics of 200 and250g/m2. The puncture resistance values of PET fabrics except the fabrics of 200 and 250g/m2 cameafter for each group of mass per unit areas. The puncture resistance of recycled fabrics were thehighest excluding the fabric group of mass per unit area of 200 g/m2. Besides, recycled fabricsperformed dramatically good puncture resistance values that can be related with the entanglement oflonger fibers they involve.AcknowledgmentsThis work has been supported by the Usak University Scientific Research Project under grant[2016/MF 008].
Thickness
0
5
10
15
20
25
Thickness
Puncture
References[1] Sakthivel S, Ezhil Anban J J and Ramachandran T 2014 Development of needle
punched nonwoven fabrics from reclaimed fibers for air filtration applicationsJournal of Engineered Fibers and Fabrics 9 Issue 1 Access
[2] Sakthivel S and Ramachandran T 2012 Thermal conductivity of non-woven materialsusing reclaimed fibres International Journal of Engineering Research andApplications (IJERA) 2 Issue 3 pp.2983-87 Access
[3] Lin J H, Lin C M, Kuo C Y, Lin C W, Hsieh C T and Lou C W 2010 Manufacturetechnology of novel reinforcing composite geotextile made of recycled nonwovenselvages Advanced Materials Research 123-125 pp 137-140 Access
[4] Lin J H, Li J H, Hsieh J C, Hsing W H, Lou C W 2015 Physical properties ofgeotextiles reinforced by recycled kevlar selvages Applied Mechanics and Materials749 pp 295-298 Access
[5] Gorchakova V M, Kuchkovskaya A B and Izmailov B A 2013 Influence oforganosilicon modifiers on the properties of recycled polyester fibers and geotextilenon-cloth materials Fibre Chemistry 45 pp214-217 Access
[6] Restall S J, Jackson L A, Heertenc G, Hornseya W P 2002 Case studies showing thegrowth and development of geotextile sand containers: an Australian perspectiveGeotextiles and Geomembranes 20 321–342 Access
[7] Bolt A and Duszynska A 2010 Static puncture resistance of non-woven geotextilesModern Building Materials Structures and Techniques (Lithuania The 10 thInternational Conference pp 1083-87Access
[8] Ghosh T K 1998 Puncture resistance of pre-strained geotextiles and it’s relation touniaxial tensile strain at failure Geotextiles and Geomembranes 16 293-302 Access
[9] Koerner G R and Koerner R M 2010 Puncture resistance of polyester (PET) andpolypropylene (PP) needle-punched nonwoven geotextiles Geotextiles andGeomembranes 29 pp 360-362 Access
[10] Askari A S, Najar S S, Vaghasloo Y A 2012 Study the effect of test speed and fabricweight on puncture behavior of polyester needlepunched nonwoven geotextilesJournal of Engineered Fibers and Fabrics 7 Issue 3 Access
[11] Li T T, Wang R, Lou C W and Jia-Horng Lin J H 2012 Evaluation of high-modulus,puncture-resistance composite nonwoven fabrics by response surface methodologyJournal of Industrial Textiles 43(2) 247–263 Access

Social and economic importance of textile reuse and recyclingin Brazil
J Baruque-Ramos1, M C Amaral1, M C Laktim1, H N Santos2, F B Araujo3 andW F Zonatti1,3
1University of Sao Paulo, School of Arts, Sciences and Humanities, Av. ArlindoBettio, 1000, 03828000, Sao Paulo – SP – Brazil.2Minas Gerais States University, Design School, Belo Horizonte – MG – Brazil;
3Federal Institute of Education, Science and Technology of Rio de Janeiro. Rio deJaneiro – RJ – Brazil.
Email: [email protected]
Abstract. Brazil is an important world producer of textiles. However, this industrial activity,combined with additional import and trade, generates millions of tons of textile scraps, unsoldclothing and discarded post-consumption garments. There is a great potential for the recyclingand reuse industry in the context of solidarity and circular economy. The present study aimedto present examples in Brazil related to waste reduction, reuse and recycling of textiles in thecontext of solidary economy. In this way, some representative initiatives, from Sao Paulo,Minas Gerais and Rio de Janeiro states are presented and discussed based on these principlesand approaching responsible lifestyles and environmental awareness and the refusal to wasteresources in general. The main socioenvironmental benefits are related to the training of laborand local income generation, the population's awareness of consumption patterns, saving ofnatural resources and raw materials, and mitigation of environmental impacts.Keywords: textile reuse and recycling, solidarity economy, social project, fashion.
1. IntroductionIn the process of transformation towards sustainability there is the need to understand the consumptionaspect more deeply [1]. Despite the efforts, the general perspective of industrial production in terms ofsustainability is worse than ever, mainly due to the increase in production and consumption volumes[2] [3]. The overall volume of textile consumption at the global level is estimated at more than 30million tons per year and the environmental impacts of this industry are remarkable [4]. Although it isestimated that the consumption of textiles by the population accounts for 5% of the carbon emissionsfor the total amount of goods acquired by an individual, the purchase of clothes is increasing and theshortening of the useful life of these articles increases the environmental load of the industry [5] [6].
Today, textiles and clothing are much cheaper compared to household income than a few decadesago. These articles had lower prices, causing individuals to have more pieces and of lower quality. Inthe United Kingdom in 1950, 30% of a family's income was used to purchase clothes. Currently, thisnumber corresponds to 12%, with a greater number of consumed items. It is also estimated that,progressively, clothing will form a decreasing proportion of total household expenditures due tofalling prices and household enrichment [7].
Environmental and ethical issues in the textile and clothing industry are complex, and traditionallythey have been viewed through a very limited lens, focusing on "eco-materials" or ethical principles ofproduction, for example. A more holistic approach is needed in this area. Therefore, it is essential to
produce more knowledge not only about materials and production processes, but also about consumerrelations with products discarded in the context of sustainable development [2] [3].
Even the reuse of post-consumption clothing is difficult because the huge amount of textile articles.Charity shops get more donations than they can actually manage. Thus, while retail markets arecrowded with cheap clothes, second-hand clothing markets are also saturated. In Finland, a second-hand charity shop received more than eight million kilograms of old clothing in 2010, an increase of3.5% over the previous year [2] [3].
In Brazil, the reuse and recycling of textiles has no due importance, unlike some Europeancountries and the United States [8] [9] [10] [11], where laws on the disposal of solid wastes andstudies about industrial and domestic scraps of textiles have relevance. Countries such as China,Bangladesh and India, among others, are major exporters of clothing products, mainly to developedcountries of the European Union and the United States, which do not have to deal strongly with theenvironmental problems arising from industrial textile production, but with the problems related to thedisposal of post-consumption.
Brazil, one of the largest textile and confection manufacturer [12] [13] [14] [15] should be moreconcerned on issues related to leftovers and discards of these two industrial areas as well as post-consumption. In numbers, the country is the 5th world producer of textiles (about 1.8 million tons ofarticles made per year) [15]. Also, the 7th in the production of yarns and flat fabrics and the 3rd in theproduction of knitted fabrics [16], in addition to generating millions of direct and indirect jobs. Brazilproduces 170,000 tons of textile scraps per year. About 80% of this material is destined to irregulardiscard and landfills. A waste that could generate income and promote the establishment of sustainablebusinesses [17].
Only in relation to the disposal of post-consumption garments, near 5.5 billion of pieces per yearare produced from 32,000 Brazilian companies, and it is estimated that more than 150 million have nodefinite destination and end up stockpiled, destroyed or moldy. On average, the collections have salesfrom 50% to 75%, when exposed in retail. The leftovers go to sales off or bazaars. At the end, the losscan reach 7% not sold, which can be donated, shredded, deposited in landfills or incinerated [18]. Still,in 2011, Brazil had 1,200 industrial companies, exclusively manufacturing professional clothes, with aproduction of 267 million of uniforms per year. Besides, the country also imports textiles and clothing.These data highlight the potential that this segment can generate for the recycling industry in thecontext of circular economy [15].
The textile reuse can be done by industrial or artisan ways. The manual process is simple andconsists of the reutilization of the fabric scraps to make upcycling or/and handicrafts in an infinity ofobjects that depend exclusively on the craftsman's abilities and creativity [19].
Including different stakeholders from civil society, such as NGOs - Non-GovernmentalOrganizations, universities and community groups, it is crucial for companies to create recycling andwaste recovery strategies through new policies. South America is an example for organizationsinvolved in the construction and adaptation of programs and policies related to solid wastemanagement [20].
The increasing of production and disposal of textile articles is a global fact. Despite the largeamount of textile wastes, mainly from the confectionary industry, in Brazil they are still not properlyavailed and are currently disposed of in landfills. At the same time, in this country there are examplesabout the concept based on the principles of solidarity economy [21] [22] aiming to valorize and trainthe involved workers, as well as objectifying waste reduction, reuse and recycling, approachingresponsible lifestyles and the refusal to waste resources in general [20].
In this way, the present study aimed to present examples in Brazil related to associations andactions linked to the management activity of textile waste.
2. MethodsThe methodology was based in visitations and application of questionnaires and conducting semi-structured interviews with representatives of different agencies and institutions in the Brazilian textile
sector, as well as representatives of associations and cooperatives linked to the management activity oftextile waste.
The semi-structured interview favors not only the description of social phenomena, but also theirexplanation and understanding of their totality, besides maintaining the conscious and active presenceof the researcher in the process of collecting information [23] [24].
3. ResultsThe waste transformation into new products could help to mitigate environmental impacts, but it couldalso drive income generation for the population and the local creative industry. On the other hand,informal selective collection is quite commonplace. Part of this activity happens in cooperatives ororganized associations with or without municipal support. Sometimes these groups add value to thecollected materials, which are separated for creating new products. In Brazil, about 800,000 people areinvolved in the informal work of reuse and recycling of materials, and often also in cooperativerecycling. Most of these individuals live in poverty and work in dangerous conditions [22].
Although the activity of selective waste collectors is recognized according to the BrazilianClassification of Occupations, this work remains in the field of informality. Not all cooperatives orassociations are formalized and not all have access to labor rights as provided by law. Recently,regional cooperation networks have emerged to promote collective marketing and engage themselvesin other collective actions [25].
The resource recovery rate per recycler and cooperative varies according to the quality ofseparation of materials at source, mode of transport, equipments, infrastructure at the processing center(where separation, baling and storage take place), level of training, among others. On average, arecycler carries up to 200 kilograms of material per day, which amounts to about 4 tonnes per month.The working journey is long, often 12 hours a day, traveling an average distance of 20 km/day on thesearch for recyclable materials. Informal and organized recyclers are estimated to recover 60% of thepaper and paperboard that are recycled in Brazil and up to 90% of all materials that feed the recyclingindustry in the country. It is still estimated that formal and informal recyclers recover up to 20% ofurban solid waste produced in Brazil [26].
The recyclable waste collectors that are integrated into a cooperative or association, and supportedby local government, often experience previously unknown opportunities for other workers in thissector. These practices further empower waste collectors and open new ways for social development[27]. In this way, waste collectors contribute to the neighborhood improvement, waste cleaning,demonstrating resource recovery behaviors, and thus create opportunities for greater communitycohesion. This detail has been widely observed in the case of Brazil and other countries [28], as alsodiscussed by Zapata-Campos and Zapata [29] for the Nicaragua case.
The National Solid Waste Policy (Brazilian Federal Law 12,305, Aug. 2, 2010) [30] providesguidelines for municipalities to collaborate with solid waste reuse and recycling groups. It supports theparticipation of waste collectors in actions of shared responsibility for the product life cycle andprioritizes recycling cooperatives in formal recycling programs [30] [31].
In a study published in 2011, about data covering the year 2010, the Brazilian Institute ofGeography and Statistics (IBGE) recorded the existence of more than 11,000 non-profit organizationsin Brazil, which covers the social development, culture and art, and a total of 507 non-profitorganizations exclusively for employment and training activities [32].
In the South and Southeast Brazilian regions, notably in São Paulo state, there are some chemicaland mechanical textile waste recycling companies [33] [34] [35]. However closer to the principles ofsolidarity and circular economy, several institutions and NGOs are already working with the reuse oftextile wastes, such as the Ecotece Institute [36] and the Retalhar company [37]. These residues aretransformed into corporate gifts, such as cases, ecobags and rubbish bins for cars produced byinclusive labor and resold to the origin companies.

There are numerous initiatives, brands and stylists who work with upcycling in fashion. One ofthem is the Brazilian brand COMAS, which produces cloths using as main raw material discardedmen's shirts. The products have classic style, simplicity and timeless design (Figure 1a) [38].
(a) (b)Figure 1. (a) Cloths made from discarded men's shirts (COMAS, Sao Paulo – Brazil) [38]. (b) “Viverde Costura” social project (“Living Sewing”, Minas Gerais – Brazil) [39]
The “Viver de Costura” (“Living Sewing”) social project (Figure 1b) provides sewing training forwomen in the Sabara region (state of Minas Gerais). It is linked to the Center for Design and SocialResponsibility of Design School (State University of Minas Gerais), and aims, besides to teachsewing, to realize product development with innovative solutions and design. This project was born aspart of the 'Minas Raizes' mother project, which received the “Citizens without Borders” award in2011 in the 'Culture' category [39].
In the metropolitan area of Rio de Janeiro (“Baixada Fluminense”, Rio de Janeiro State) composedby cities such as Belford Roxo and Duque de Caxias, for example, there is a Local ProductiveFootwear Arrangement [40]. Despite its enormous economic potential, it is worth mentioning thegeneration and discarding of the textile scraps from this sector. The work of the Superintendence ofWomen of the municipality of Belford Roxo, which currently develops the “Feirart de Bel” (“Art BelFair”) project, is observed. It brings together at least 30 artisans every week to exhibit and market, insquares, parking lots and malls, the handicraft produced through the reuse of discarded raw materials,among them the textile ones [41].
The EcoModa Project (http://culturaniteroi.com.br/ecocultural/), established in Niteroi city (Rio deJaneiro State) since 2006, reuses textile wastes donated by various companies to create new garments.Based on the principles of solidarity economy, it aims to value and empower the involved workers andstudents, as well as to reduce waste by reusing and recycling [42]. In this way, it also contributes todebate about the reduction of urban waste, since fashion has been a fundamental tool for dialoguebetween the State and the socio-cultural foundations [43]. In addition to promoting the culture ofsustainability, income generation is one of its goals. Subsequently, the group of graduates can multiplytheir knowledge in the communities, where they reside, working with the recycling and reuse ofmaterials. The project aims, above all, to formally structure cooperatives with each group of graduatestudents who will then manage their products/brands independently of the project [43]. In addition tothe remarkably social character, it is a laboratory for creations and experimentations in the area ofdesign (Figure 2), besides to give subsidies to its students in the management / pricing of fashionpieces, as well as assists in the final parade of course graduation.

(a) (b) (c) (d)Figure 2. Creative process in EcoModa project: (a) discarded clothes as raw material; (b) accessoriesmade of fabrics, purses and bags produced by the students; (c) the designer and stylist Almir França(left) explains the process of construction of the new pieces; (d) detail of the new fabric createdthrough the reused raw materials [Source: Authors’ files].
The pieces of EcoModa students have had space in the Brazilian fashion market. In the "FashionBusiness", one of the sector's largest business event, held in late 2015, EcoModa showed the students'autumn-in-2016 collection produced with banners, hoses, fabric wastes, post-consumption jeans andother materials, which commonly would be discarded. In this same event, renowned Brazilian brandssuch as Blue Man, Mara Mac, Mary Zaide, Marcos & Rudy, Rosana Bernardes, Totem and VictorDzenk were also present [43].
The Association of Brazilian Women Entrepreneurs - AMEBRAS (Rio de Janeiro city, RJ)(http://www.amebras.org.br/) carries out reuse activities of textile materials from the Rio carnival,since 1998. It has approximately 886 associates from different classes and business segments, and hasprofessionally qualified about 22,000 people, young people and adults, living in different communitiesin Rio de Janeiro.
The main raw materials for reuse are fabrics, feathers, feathers, sequins and various trims. They areobtained in the moments known as "dispersion" of the samba schools, that is, when each of themfinishes their presentation in “sambodromo da Marques de Sapucai”. During the parade of eachschool, many items of the floats and samba dancers’ costumes fall off to the floor.
AMEBRAS is an official seller of the products of Rio carnival. Some of its products are alsomarketed by “Camisa de Bamba” (http://www.camisadebamba.com.br/). These are notebooks,calendars, mobile covers, kits with bath towels, slippers, mugs, flags, dolls, among others. Part ofthese items are industrialized, produced with virgin raw material, approximately 25% of the total. Theother 75% of the items, such as headgear, masks, costumes and dolls, are handcrafted with reuse rawmaterials through the professional training courses that AMEBRAS performs. Moreover, since theornaments are made with reuse material available at that time, it should be emphasized that there is noway to control the acquired raw material, which can vary (from colors and compositions) from time totime - unlike what happens with the industrialized products and / or produced with virgin raw material,but generating exclusive creations (Figure 3).
(a) (b) (c) (d)Figure 3. Examples of costumes and carnival ornaments made with reuse material by AMEBRASstudents [Source: Authors’ files].
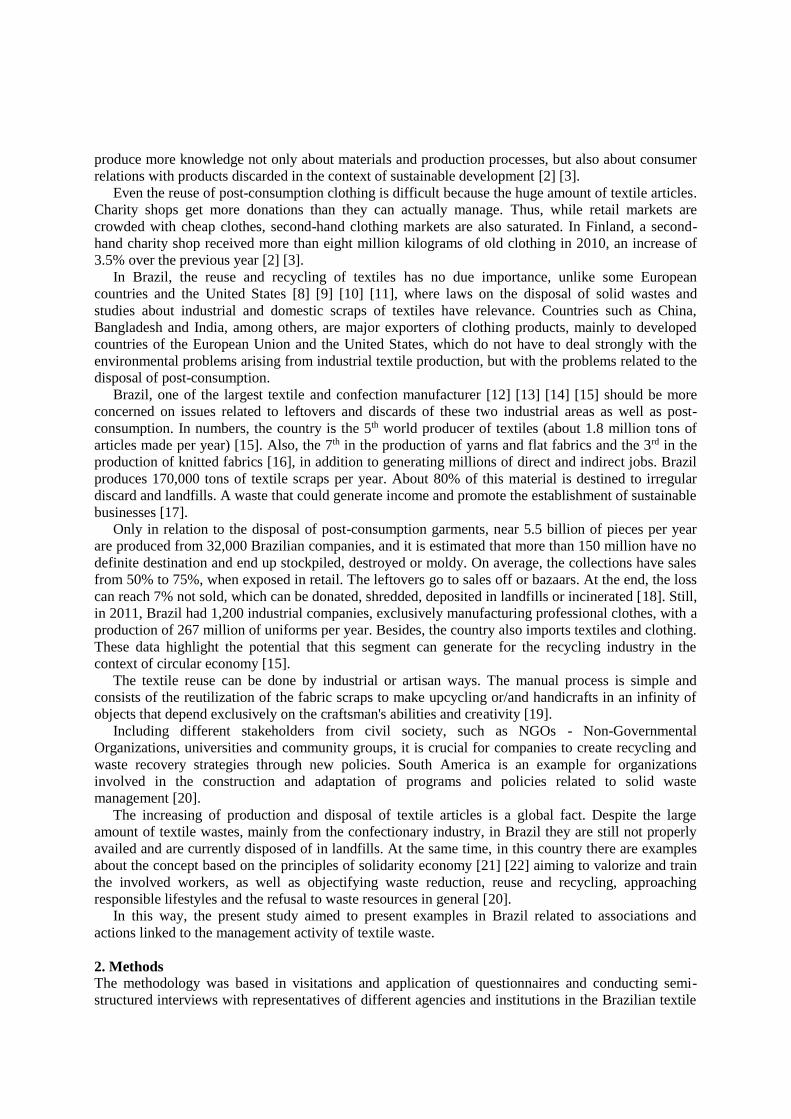
The brand "Acorda” follows firmly in the initial proposal to create products from discarded fabrics,maintaining the contemporary tendency, but moving in the opposite direction to fast fashion throughsustainability and creativity. Each piece is handcrafted by means of an assembly process, where thefabrics and their combinations are highly selected to guarantee exclusive and loving products to theircustomers" [44].
Acorda brand (http://www.useacorda.com/) exists since 2013 and arose from the interest offounders for fashion, carnival and the taste of producing unique pieces. For the summer / 2017collection titled "Afrofuturism," the brand aims to "tell stories" through their creations. The targetaudience is composed mostly of Afro culture and history fans and foreigners from different countrieswho visit Rio de Janeiro. The partners of Acorda are also photographic models in the advertisingcampaigns of their products because they believe transmit greater visual identification with their targetaudience. Currently, Acorda has an assortment of products of approximately 270 pieces, amongecobags, clutches, pockets, among others (Figure 2), which are sold on its own site, in fashion fairsand in multi-brand stores.
(a)(b)
(c)
(d)
(e)Figure 4. (a) The partners Luana Maria (left) and Michelle Andrade (right) pose for the current brandcampaign, titled "Little Africa"; Pieces produced by Acorda: (b) ecobags, (c) clutches, (d) and (e)pockets, Source: Acorda [44]
Acorda has a strong concern with environmental and social sustainability. Therefore, it makescommercially fair partnerships with productive groups. The brand uses mainly discarded fabrics asraw material for its creations. It also uses trims from carnival costumes, animal food bags, bank bagsand even carpentry waste, all discarded by their sources. Majorly, the material used in the productioncomes from donations. It seeks to awaken a greater awareness of the individuals in relation to thediscards of solid residues. Thus, the creation of the pieces occurs, basically, through the materialavailable for that moment or collection, not being able to choose / define colors or types of fabric,previously.
In addition, it tries to minimize the generation of residues in its production - here understood as the"residues of residues", using, practically, 100% of the material received so as not to generate leftovers.In this way, one must be able to create pieces with all available material and adjust their size to thesize of the flaps received as donation.
In all visited institutions, many problems related to management of textile waste were pointed.Among them, the principal are: i) inexistence of legal and / or tax incentives for companies that usereuse raw materials in their production; ii) lack of a well-established network of contacts for theprocurement of raw materials; iii) difficulties in transportation of the donated material; iv) mixedcomposition or/and color/pattern of textile wastes, demanding time-consuming work for the trial andseparation; v) hygienization of the donated raw material, since many donated are dirty and requirepre-treatment and / or cleaning to be used in the production; vi) space for storage of inputs andconsequent increase in the production of pieces.
In the State of Rio de Janeiro and in other Brazilian regions (excepted Sao Paulo State), industriesthat recycle textile discards have not yet been found, only reuse activities employing this material. In

this way, Local Productive Arrangements can provide actions related to these activities. Reuse of thetextile material is performed with discarded material by confections, as well as on articles of clothingdiscarded by industries and individuals. These residues are often reused in projects and social projectsthat have a concern with the socio-environmental area, since they aim to train vulnerable workers,generate income and minimize environmental impacts. It is also observed that the reuse of textilewaste through public policy or company actions is a fertile field for creative experimentation andproduction of new fashionable pieces and accessories with sustainable appeal, as well as contributingto the preservation of the environment.
Some projects that reuse textiles or participate indirectly in this activity receive financial assistancein their actions from State or Municipality. However, there is no legal incentive at Federal, State orMunicipal level regarding the reuse/recycling of materials by private companies of any segment. Inaddition, there are problems related to the lack of a Reverse Logistics, as well as oneroustransportation, unhygienic raw material, no adequate storage space, and the low number of recyclingcompanies installed in the Brazil. The main socioenvironmental benefits are related to the training oflabor and local income generation, the population's awareness of consumption patterns, saving ofnatural resources and raw materials, and mitigation of environmental impacts.
Thus, although Brazil is on the right way in promoting the recycling and reuse of wastes, includingtextiles, there is still much to be done in terms of a solidary and circular economy approaches in termsof benefiting the people and the society.
4. ConclusionDespite of the huge waste of textile residues that could be profitable in a context of circular and
solidarity economy in Brazil, several institutions and NGOs are already working with the reuse oftextile wastes in order to valorize and train the involved workers, generating income and increasing theenvironmental awareness. Some of these examples are presented and discussed in this study, in thebelief of seeking sustainable alternatives for textile and fashion sectors. Furthermore, textile reuse andrecycling activities are a positive contribution to the disposal of solid waste from industries, garmentsor even domestic waste, given the significant volume of these and also given their incorrectdestination, commonly disposed in rivers, bays and landfills.
References[1] Throne-Holst H et al 2007 J. of Cleaner Production 15 1328–1336[2] Niinimäki K 2011 From disposable to sustainable - the complex interplay between design and
consumption of textiles and clothing PhD thesis (Helsink, FI: Aalto University) p 293[3] Niinimäki K and Hassi L 2011 J. of Cleaner Production 19(16) 1876-1883[4] Chen H and Burns L D 2006 Clothing & Textile Research J. 3(24) 248–261[5] Spangenberg J 2001 Sustainable development: From catchwords to benchmarks and
operational concepts (Sustainable Solutions: Developing Products and Services for theFuture) ed M Charter and U Tischner (Sheffield, UK: Greenleaf) pp 24–47
[6] Nurmela J 2009 Proc. Conf. “Future of the Consumer Society” (Tampere, FI) p 253[7] Jackson T and Shaw D 2009 Mastering Fashion Marketing (New York, USA: Palgrave
Macmillan)[8] Council for Textile Recycling 1997 Don't Overlook Textiles!
<http://www.smartasn.org/textilerecycle/>[9] Camara di Commercio Prato 2009 Cardato regenerated CO2 neutral
<http://www.po.camcom.it/servizi/iniziative/2009_cardato/>[10] Muhammad I 2013 German Textile Recycling Benchmarking. Case I: CO Bach. thesis (Forssa,
FI: Häme University of Applied Sciences) p 44[11] Humana Nova 2014 Textile recycling information sheet
<http://www.humananova.org/en/columns/0/5/textile-recycling-information-sheet/ >[12] Mello M B C et al 2007 Revista Producao OnLine 7(2) 99-117
[13] Neuls G 2012 Economia movida a CO2 (Pagina 22 vol 68) ed A Safatle (Sao Paulo, BR: Fund.Getulio Vargas) pp 13
[14] ABIT 2013 Industria Textil e de Confeccao Brasileira<http://www.abit.org.br/conteudo/links/publicacoes/cartilha_rtcc.pdf>
[15] IEMI 2015 Relatorio Setorial da Industria Textil Brasileira 2015 vol 15 (Sao Paulo, BR: IEMI)p 196
[16] Finkler M et al 2005 Polimeros: ciencia e tecnologia 15(3) 171-175[17] SEBRAE 2014 Retalhos de tecidos: no lugar do desperdicio, negocios sustentaveis
<http://www.sebraemercados.com.br/retalhos-de-tecidos-no-lugar-do-desperdicio-negocios-sustentaveis/>
[18] Frias M C 2012 Reciclagem avança como destino de roupa encalhada<http://www1.folha.uol.com.br/fsp/mercado/45405-mercado-aberto.shtml>
[19] SINDITEXTILSP 2014 Projeto Retalho Fashion.<http://sinditextilsp.org.br/index.php?option=com_content&view=article&id=112&Itemid=116>
[20] Gutberlet J 2013 Proc. Institution of Civil Engineers-Waste and Resource Management vol 166n 3 (London, UK: ICE Publishing) p 110-113
[21] Gutberlet J 2009 Development in Practice 19(6) 737–751[22] Gutberlet J 2012 Geography Compass 6(1) 19–34[23] Trivinos A N S 1987 Introducao a pesquisa em ciencias sociais: a pesquisa qualitativa em
educacao (Sao Paulo, BR: Atlas)[24] Manzini E J 2003 Consideracoes sobre a elaboracao de roteiro para entrevista semiestruturada
(Coloquios sobre pesquisa em educacao especial) ed M C Marquezine et al (Londrina, BR:Eduel) pp 11-25
[25] Singer P 2003 Proposta: Revista Trimestral de Debate da Fase 97 12-16<http://www.bibliotecadigital.abong.org.br/bitstream/handle/11465/1889/Proposta%20-%20Revista%20Trimestral%20de%20Debate%20da%20Fase%20n%c2%ba%2097.pdf?sequence=1&isAllowed=y>
[26] Conceicao M 2005 Os Empresarios do Lixo: um Paradoxo da Modernidade (2nd ed, Campinas,BR: Ed. Átomo)
[27] Couto G A 2012 Social learning and human development in cooperative work of collectors inSao Paulo MSc thesis (Sao Paulo, BR: University of Sao Paulo) p 150
[28] Medina M 2010 Solid Wastes, Poverty and the Environment in Developing Country Cities:challenges and opportunities Working Paper Series 2010/23 (Helsinki, FI: United NationsUniversity - World Institute for Development Economics Research) p 17<https://www.wider.unu.edu/sites/default/files/wp2010-23.pdf>
[29] Zapata-Campos M J and Zapata P 2013 Environment and Urbanization 25(1) 225-242[30] Brazil 2010 Politica Nacional de Residuos Solidos Law n. 12,305, Aug. 2, 2010
<http://www.planalto.gov.br/ccivil_03/_ato2007-2010/2010/lei/l12305.htm>[31] Brazilian Ministry of Enviroment 2009 Relatorio tecnico de caracterizacao de residuos solidos
<http://www.mma.gov.br/port/conama/processos/18018FE8/Relat_LixiviacaoAmiantoFibrocimento_Rel031E09.pdf>
[32] Instituto Brasileiro de Geografia e Estatistica (IBGE) 2011 Classificacao das entidades sem finslucrativos < http://biblioteca.ibge.gov.br/pt/biblioteca-catalogo?view=detalhes&id=262841>
[33] Zonatti W F et al 2015 Sustentabilidade em Debate 6(3) 50-69[34] Zonatti W F et al 2016 Brazilian scope of management and recycling of textile wastes Natural
Fibres: Advances in Science and Technology Towards Industrial Applications (Dordrecht:Springer Netherlands) pp 429-439
[35] Amaral M C et al 2017 Gestao & Producao in press.[36] Ecotece 2016 Instituto Ecotece <www.ecotece.org.br>[37] Retalhar 2016 Empresa Retalhar <www.retalhar.com.br>

[38] Comas 2016 Sobre Comas <http://www.comas.com.br/sobre-comas-pg-3715d>[39] Changemakers 2016 Viver de Costura: capacitacao em costura de grupo produtivo da região
de Sabara MG <https://www.changemakers.com/pt-br/tecendoamudanca/entries/viver-de-costura>
[40] Estado do Rio de Janeiro 2015 Arranjos Produtivos Locais<http://www.desenvolvimento.gov.br/arquivos/dwnl_1310055560.pdf>
[41] Noticias de Belford Roxo 2016 Artesas de Belford Roxo expoem em Feira de Artesanato<http://noticiasdebelfordroxo.blogspot.com.br/2016/09/artesas-de-belford-roxo-expoem-em-feira-artesanato-sexta-feira.html>
[42] Barr S, Gilg A 2006 Geoforum 37 (6) 906–920.[43] Ecocultural Niteroi. Oficinas de Moda Chegam a Comunidades de Niteroi.
<http://ecoculturalniteroi.com.br/blog/?id=1748&equ=ecocultural>[44] Acorda. Acorda < http://www.useacorda.com/>

Investigation of eco-friendly casein fibre production methods
M C Bier1, S Kohn
1, A Stierand
1, N Grimmelsmann
1, S V Homburg
1,
A Rattenholl2, and A Ehrmann
1 Bielefeld University of Applied Sciences, Faculty of Engineering and Mathematics,
Interaktion 1, 33619 Bielefeld, Germany 1Working Group of Textile Technologies 2Institute of Biotechnological Process Engineering
Email: [email protected]
Abstract: The growing environmentally awareness of the consumers leads to a lot of new
products in the textile industry. Either a sustainably produced textile or one which is created by
reuse of a waste product is preferred. One possibility to create fibers from waste is using waste
milk for casein fiber production. Opposite to several other biopolymers, however, spinning
fibers from casein causes diverse problems. This article gives an overview of the investigations
on how to produce fibres from the milk protein casein in a sustainable way, i.e. without
formaldehyde or other polluting ingredients. Mechanical properties as well as water-resistance
were investigated for chemical and physical modifications of the base composition. In this
way, the positive influence of paraffin oil and wax as well as aggregation at high temperatures
could be proven, while temperature treatment resulted in a higher E-modulus.
1. Introduction
Approximately 2 million tons of milk are thrown away every year only in Germany. This waste milk
still contains 2.8-3.2 % of the protein casein which was already used for fibre production in the 1930s.
But at that time casein fibres were produced with formaldehyde, the process needed a lot of water and
the production could not be made profitable; a problem which is not yet solved [1]. Over the last years
new methods were found to produce these fibres in a more eco-friendly way and a newly developed
process without using formaldehyde is described in a recent patent [2]; however, these fibres are co-
spun together with viscose or wool. In electrospinning, casein can be used in combination with other
materials [3,4] or in graft copolymers [5], again with weak water resistance.
On the other hand, casein is able to absorb water which gives a smooth sensation on the skin and
makes it comfortable to wear. Especially people with skin diseases such as neurodermatitis would
benefit from this clothing. It is also reported that casein has a natural antibacterial effect. Additionally,
casein can be used to attract macromolecules (i.e. proteins, polysaccharides, etc.) and to work as a
size-selective molecular device [6]. In the form of a multilayer film, it has been reported to promote
biomineralization [7]. This opens a wide range of new possibilities in the medical sector. Due to these
properties of textiles containing casein, more investigations should be performed to increase strength
and water resistance of casein fibers. However, crosslinking with citric acid should be avoided since
these fibers are known to be cytotoxic [9].
In previous investigations casein powder was mixed with water in different proportions, stirred, slowly
heated up to 75 °C and spun by hand extrusion through nozzles of different diameters as well as used
as coatings on different textile fabrics [8]. To reduce brittleness of the resulting fibre, different
amounts of glycerine were added to the solution.
This resulted in significantly different viscosities depending on the casein-water proportion. In all
cases, the necessity to add the casein to heated water in small amounts during stirring emerged.
Independent of the mixing ratio, the resulting fibres or textile coatings were quite hard and brittle. The
coated textile fabrics showed a water resistance of up to 33 minutes.
To improve the results, another chemical approach was tested in this paper.
2. Materials and Methods
Technical casein from bovine milk containing 90 % protein (Sigma, St. Louis, USA) was ground in a
mortar and filtered through a sieve with 200 µm mesh size. Viscous paraffin oil from Roth (Karlsruhe,
Germany) and glycerol (99.8 %) from alexmo cosmetics (Weyhe, Germany) were added in most
recipes. Partly, glucose or wax (KahlWax 6592, Trittau, Germany) were added.
For all compositions, glycerol was mixed with equal amounts of distilled water. Casein was added
under stirring at 500 rpm at room temperature. Depending on the recipe, other ingredients were added.
The pH value of this mixture was carefully adjusted to pH 6.5, using 0.5 M NaOH since casein is
soluble in water only above pH 6.4. After the casein was completely dissolved, the mixture was heated
to 65 °C to decrease viscosity and allow formation of fibers through a spinning nozzle.
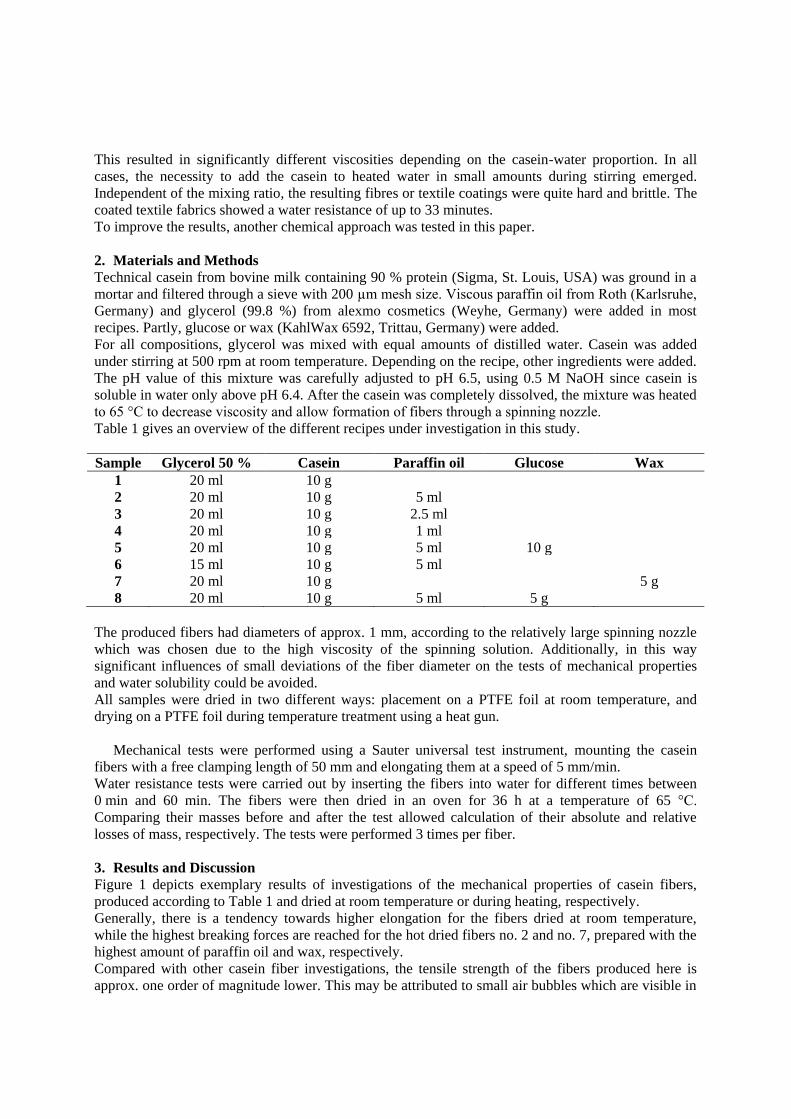
Table 1 gives an overview of the different recipes under investigation in this study.
Sample Glycerol 50 % Casein Paraffin oil Glucose Wax
1 20 ml 10 g
2 20 ml 10 g 5 ml
3 20 ml 10 g 2.5 ml
4 20 ml 10 g 1 ml
5 20 ml 10 g 5 ml 10 g
6 15 ml 10 g 5 ml
7 20 ml 10 g 5 g
8 20 ml 10 g 5 ml 5 g
The produced fibers had diameters of approx. 1 mm, according to the relatively large spinning nozzle
which was chosen due to the high viscosity of the spinning solution. Additionally, in this way
significant influences of small deviations of the fiber diameter on the tests of mechanical properties
and water solubility could be avoided.
All samples were dried in two different ways: placement on a PTFE foil at room temperature, and
drying on a PTFE foil during temperature treatment using a heat gun.
Mechanical tests were performed using a Sauter universal test instrument, mounting the casein
fibers with a free clamping length of 50 mm and elongating them at a speed of 5 mm/min.
Water resistance tests were carried out by inserting the fibers into water for different times between
0 min and 60 min. The fibers were then dried in an oven for 36 h at a temperature of 65 °C.
Comparing their masses before and after the test allowed calculation of their absolute and relative
losses of mass, respectively. The tests were performed 3 times per fiber.
3. Results and Discussion
Figure 1 depicts exemplary results of investigations of the mechanical properties of casein fibers,
produced according to Table 1 and dried at room temperature or during heating, respectively.
Generally, there is a tendency towards higher elongation for the fibers dried at room temperature,
while the highest breaking forces are reached for the hot dried fibers no. 2 and no. 7, prepared with the
highest amount of paraffin oil and wax, respectively.
Compared with other casein fiber investigations, the tensile strength of the fibers produced here is
approx. one order of magnitude lower. This may be attributed to small air bubbles which are visible in

all fiber cross-sections. Apparently, in a next step, the amount of air in the spinning solution must be
reduced, e.g. by using ultrasonic degassing after heating or by stirring in vacuum.
0 20 40 60 80 1000.00
0.05
0.10
0.15
Cold dried
Casein 1
Casein 2
Casein 3
Casein 4
Casein 6
Casein 7
Casein 8
Str
ess /
MP
a
Elongation / %
0 20 40 60 80 1000.00
0.05
0.10
0.15
Hot dried
Casein 1
Casein 2
Casein 3
Casein 4
Casein 6
Casein 7
Casein 8
Str
ess /
MP
a
Elongation / %
Figure 1. Stress-strain curves, measured for casein fibers produced from different recipes (table 1)
and dried at different temperatures.
In the tests depicted here, the main focus was not on high breaking forces, which are not necessary
for diverse applications in the medical sector. More important is the possibility to tailor the water
solubility, especially for drug release or similar medical applications.
Figure 2 depicts the results of the respective tests. Here, especially the results of the longest
immersion time show differences between the different chemical compositions of the samples and the
temperature treatment during drying. Relatively low mass losses were reached for sample 2 as well as
sample 7 after hot drying. Apparently, wax as well as paraffin oil support water resistance, while
glucose – which was reported by another group to help crosslinking [10] – does not show any effect on
the water resistance of the gained fibers.
1 2 3 4 5 6 7 80.0
0.2
0.4
0.6
0.8
1.0
rela
tive m
ass lo
ss
Sample
0 min
1 min
5 min
15 min
60 min
dried cold
1 2 3 4 5 6 7 80.0
0.2
0.4
0.6
0.8
1.0
rela
tive m
ass lo
ss
Sample
0 min
1 min
5 min
15 min
60 min
dried hot
Figure 2. Relative mass loss, measured for the samples described above after drying at different
temperatures, after immersing in water for different times.
Although the results depicted here are not yet sufficient for an application of casein in most
medical applications, the experiments show that increasing water resistance of casein is also possible
without adding citric acid.
4. Conclusion
To conclude, we have investigated the influence of different chemical ingredients and temperature
treatment on casein fiber production. The mechanical properties are significantly lower than in other
biopolymers which are in the order of a few cN/dtex, i.e. a few hundred MPa [11], but one order of

magnitude higher than foams from microcrystalline chitosan [12], suggesting their use in medical
applications which do not necessitate high mechanical strength, e.g. in wound healing, drug delivery
or for tissue engineering. Chemical modifications as well as temperature treatment resulted in
significantly increased water resistance, showing a way to possible eco-friendly production methods of
casein fibres without formaldehyde or cytotoxic citric acid.
References
[1] Fisher McKenna K, Master thesis, University of Kansas (2012),
https://kuscholarworks.ku.edu/bitstream/handle/1808/10482/McKenna_ku_0099M_12024_
DATA_1.pdf?sequence=1
[2] Domaske A, Process for producing milk protein fibers and milk protein fibres product obtained
therefrom, Patent WO2012079760
[3] Grothe T, Grimmelsmann N, Homburg S V, Ehrmann A 2017 Possible applications of nano-
spun fabrics and materials, Materials Today: Proceedings, submitted
[4] Tomasula P M, Sousa A M M, Liou S-C et al. 2016 Short communication: Electrospinning of
casein/pullulan blends for food-grade application, Journal of Dairy Science 99 1837-1845
[5] Dong Q Z, Gu L X 2002 Synthesis of AN-g-casein copolymer in concentrated aqueous solution
of sodium thiocyanate and AN-g-casein fiber’s structure and property, European Polymer
Journal 38 511-519
[6] Peixoto P D S, Bouchox A, Hue S, Madec M N, Thomas D, Floury J, Gesan-Guiziou G 2015
Diffusion and Partitioning of Macromolecules in Casein Microgels: Evidence for Size-
Dependent Attractive Interactions in a Dense Protein System, Langmuir 31 1755-1765
[7] Szyk-Warzynska L, Kilan K, Socha R P 2014 Characterization of casein and poly-L-arginine
multilayer films, J. Colloid Interface Science 423 76-84
[8] Bier M C, Kohn S, Stierand A, Grimmelsmann N, Homburg S V, Ehrmann A 2016
Investigation of the casein fibre production in an eco-friendly way, Proceedings of Aachen-
Dresden-Denkendorf International Textile Conference, Dresden
[9] Yang Y Q, Reddy N 2012 Properties and potential medical applications of regenerated casein
fibers crosslinked with citric acid, Int. J. Biol. Macromolecules 51 37-44
[10] Pellegrino L, van Boekel M A J S, Gruppen H, Resmini P, Pagani M A 1999 Heat-induced
aggregation and covalent linkages in β-casein model systems, Int. Dairy Journal 9 255-260
[11] Ozgen B 2012 New biodegradable fibres, yarn properties and their applications in textiles: a
review, Industria Textila 63 3-7
[12] Kopania E, Wiśniewska-Wrona M 2016 Biopolymer composites based on lignin and
microcrystalline chitosan, Progress on Chemistry and Application of Chitin and its
Derivatives, Volume XXI

Application of recycled fibres and geotextiles for thestabilisation of steep slopes
J Broda1, J Grzybowska-Pietras1, G Nguyen1,2, A Gawlowski1, R Laszczak1 andS Przybylo1
1University of Bielsko-Biala, Faculty of Materials, Civil and EnvironmentalEngineering , Institute of Textile Engineering and Polymer Materials,Willowa 2, 43-309 Bielsko-Biala, Poland2University of Žilina, Faculty of Civil Engineering, Department of Geotechnics,Univerzitná 8215/1, 010 26 Žilina, Slovakia
E-mail: [email protected]
Abstract. The recycled fibres and textiles were used for the protection of the steep slopeexposed to intensive rill erosion. One part of the slope was protected with the geotextilesformed from the meandrically arranged thick ropes containing a nonwoven manufactured froma blend of recycled natural and synthetic fibres. For the protection of the other part, therecycled polyester fibres mixed with the covering soil were applied. After the installation, thebehaviour of the slope was monitored and the efficiency of both techniques was compared. Itwas stated that both, the geotextiles and the loose fibres randomly distributed on the soilprevent washing away the soil particles and protect the slope from sliding. It was revealed thatthe recycled fibres can be satisfactory utilized for the efficient protection of the slope againsterosion and sliding.
1. IntroductionConstruction of earth structures and exploitation of open mines lead to the formation of slopes proneto land sliding and endangered by surface erosion caused by water. Due to the high risk of landslideand erosive damage, the protection of the slopes to ensure their stability is highly desirable.Different methods are used for the stabilization of the slopes. One of the techniques, often applied forseveral decades, involves the application of the geosynthetics. Geosynthetics have high biological andchemical resistance, non-corrosiveness, lightness and relatively low price. They are usually suppliedas rolled products which can be easily transported and spread on the slopes. The installation of thegeosynthetics is easy and does not require a lot of manpower or the use of heavy, specializedequipment. The installed geosynthetics provide an aesthetic look of the protected objects [1-3].Different products including geotextiles, geomatts, geogrids and geomembranes are offered on themarket. The variety of available products allows the selection of products most suitable for the localcircumstances.
In addition to the known products which have been used for many years , new geotextiles wereinvented few years ago. The innovative geotextiles were built from meandrically arranged thick ropeswhich were connected into segments with additional linking chains. The geotextiles were successfullyused for the stabilization of the slopes prone to land sliding in the gravel pit and disused lignite mine,as well as for the protection of the drainage and road side ditches [4-7].
For the manufacturing of the ropes, the Kemafil technology and various materials (easily available onthe local market) were useded [5]. It was revealed that the pre-consumer or post-consumer textilewastes can serve as a valuable raw material for the manufacturing the geotextiles. The production ofgeotextiles extends the life of the fibres and is an interesting alternative to troublesome methods ofwaste textiles disposal.
The second technique for the stabilization of slopes consists in reinforcing the soil with randomlydistributed natural or synthetic fibres. The fibres mixed with the soil serve as natural plant roots,which improve the strength of the soil and the stability of natural slopes. The technique was used forvarious civil engineering structures such as pavement layers, retaining walls, railway embankments, aswell as for the protection of slopes, foundation engineering and anti-earthquake geo-structures [8].
The reinforced soil mixture sprayed onto the eroded, cut slopes can be used as an infilling of theerosion gullies. This can be an effective repair method, especially in low cohesion materials like sand,dispersive clays or soils containing gypsum [9]. The impressive example for the implementation ofthis technique was the use of the polypropylene fibres for the stabilisation of a huge embankmentconstructed of residual fat clays in Texas [10].During the investigations, both of the above mentioned techniques were used for the protection of thesteep slope exposed to intensive rill erosion. The efficiency of each method and their combination inthe protection of the slope was analysed.
2. Materials and methods
2.1. Site characteristicsThe investigations were performed in a terrain located in the foothills of the mountain range BeskidMaly, in the northeast suburbs of Bielsko-Biala (Poland). The area is formed by meadows spread onthe wide and gently sloping northbound hills.
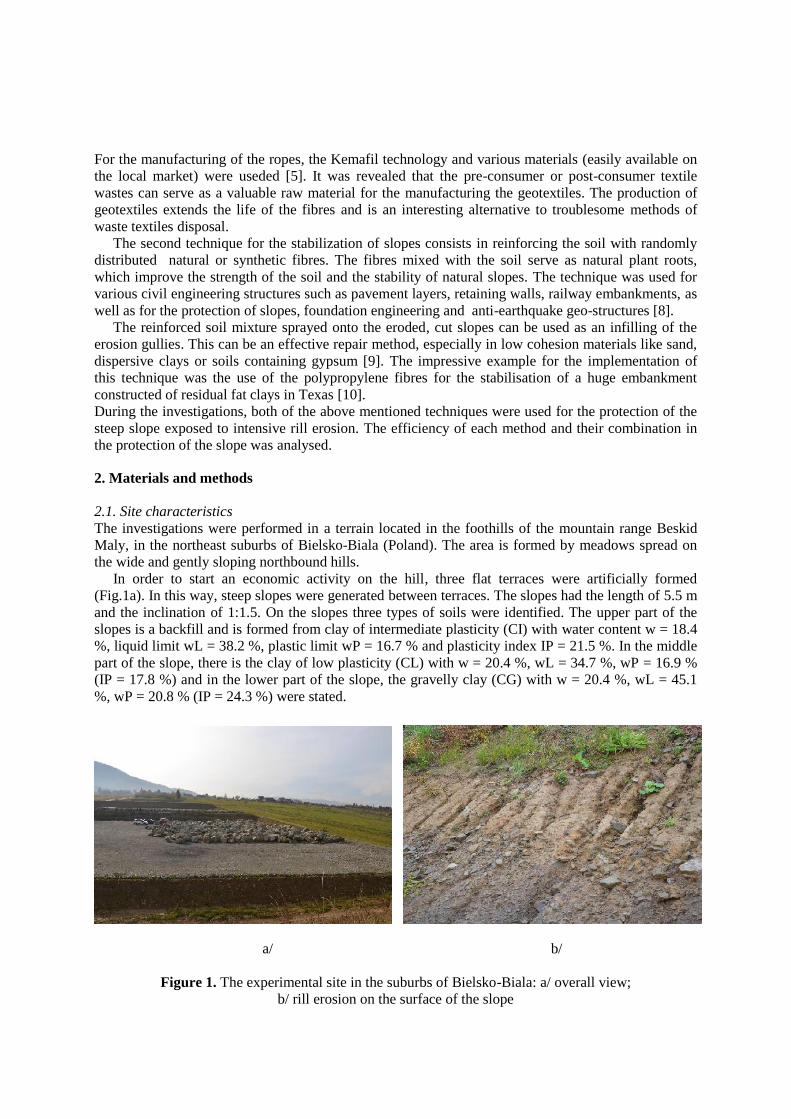
In order to start an economic activity on the hill, three flat terraces were artificially formed(Fig.1a). In this way, steep slopes were generated between terraces. The slopes had the length of 5.5 mand the inclination of 1:1.5. On the slopes three types of soils were identified. The upper part of theslopes is a backfill and is formed from clay of intermediate plasticity (CI) with water content w = 18.4%, liquid limit wL = 38.2 %, plastic limit wP = 16.7 % and plasticity index IP = 21.5 %. In the middlepart of the slope, there is the clay of low plasticity (CL) with w = 20.4 %, wL = 34.7 %, wP = 16.9 %(IP = 17.8 %) and in the lower part of the slope, the gravelly clay (CG) with w = 20.4 %, wL = 45.1%, wP = 20.8 % (IP = 24.3 %) were stated.
a/ b/
Figure 1. The experimental site in the suburbs of Bielsko-Biala: a/ overall view;b/ rill erosion on the surface of the slope
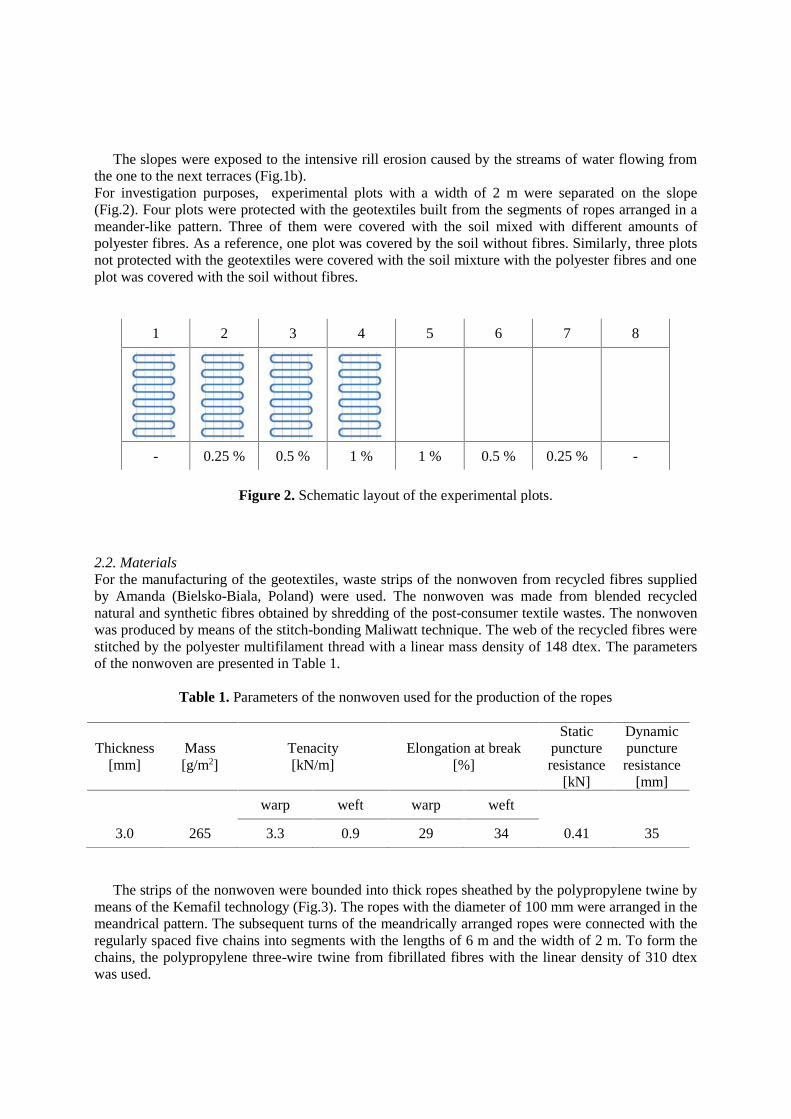
The slopes were exposed to the intensive rill erosion caused by the streams of water flowing fromthe one to the next terraces (Fig.1b).For investigation purposes, experimental plots with a width of 2 m were separated on the slope(Fig.2). Four plots were protected with the geotextiles built from the segments of ropes arranged in ameander-like pattern. Three of them were covered with the soil mixed with different amounts ofpolyester fibres. As a reference, one plot was covered by the soil without fibres. Similarly, three plotsnot protected with the geotextiles were covered with the soil mixture with the polyester fibres and oneplot was covered with the soil without fibres.
1 2 3 4 5 6 7 8
- 0.25 % 0.5 % 1 % 1 % 0.5 % 0.25 % -
Figure 2. Schematic layout of the experimental plots.
2.2. MaterialsFor the manufacturing of the geotextiles, waste strips of the nonwoven from recycled fibres suppliedby Amanda (Bielsko-Biala, Poland) were used. The nonwoven was made from blended recyclednatural and synthetic fibres obtained by shredding of the post-consumer textile wastes. The nonwovenwas produced by means of the stitch-bonding Maliwatt technique. The web of the recycled fibres werestitched by the polyester multifilament thread with a linear mass density of 148 dtex. The parametersof the nonwoven are presented in Table 1.
Table 1. Parameters of the nonwoven used for the production of the ropes
Thickness[mm]
Mass[g/m2]
Tenacity[kN/m]
Elongation at break[%]
Staticpunctureresistance
[kN]
Dynamicpunctureresistance
[mm]warp weft warp weft
3.0 265 3.3 0.9 29 34 0.41 35
The strips of the nonwoven were bounded into thick ropes sheathed by the polypropylene twine bymeans of the Kemafil technology (Fig.3). The ropes with the diameter of 100 mm were arranged in themeandrical pattern. The subsequent turns of the meandrically arranged ropes were connected with theregularly spaced five chains into segments with the lengths of 6 m and the width of 2 m. To form thechains, the polypropylene three-wire twine from fibrillated fibres with the linear density of 310 dtexwas used.
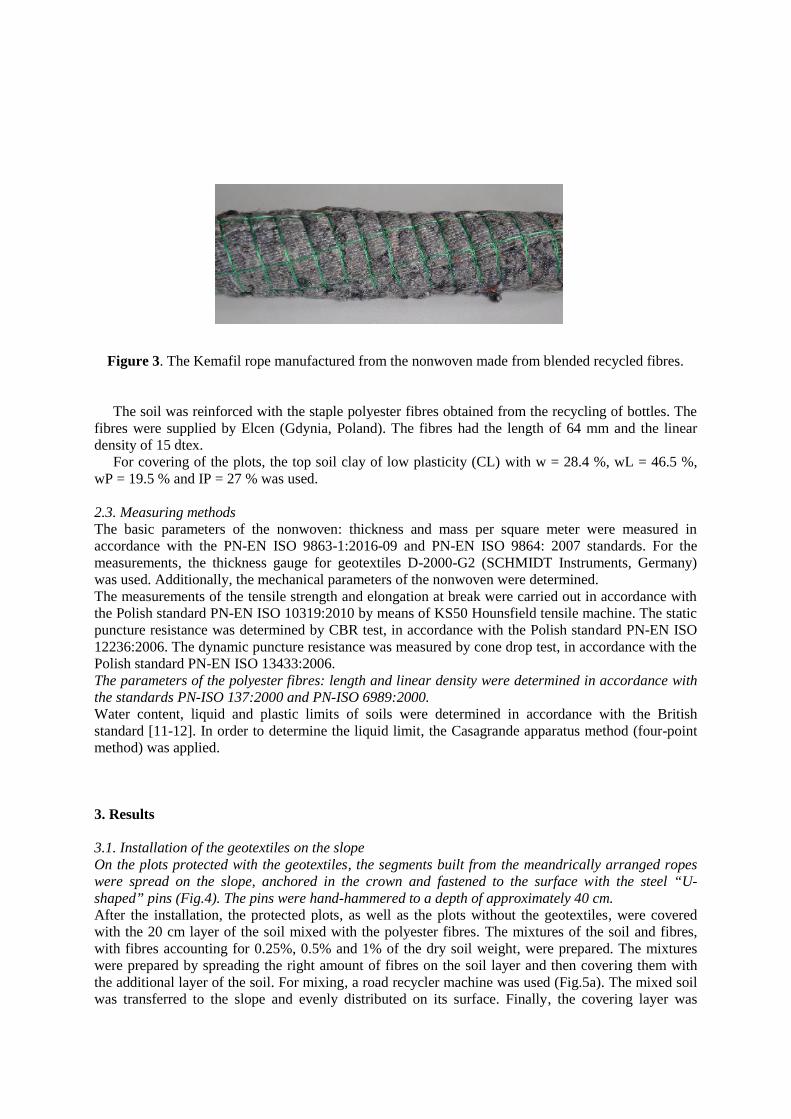
Figure 3. The Kemafil rope manufactured from the nonwoven made from blended recycled fibres.
The soil was reinforced with the staple polyester fibres obtained from the recycling of bottles. Thefibres were supplied by Elcen (Gdynia, Poland). The fibres had the length of 64 mm and the lineardensity of 15 dtex.
For covering of the plots, the top soil clay of low plasticity (CL) with w = 28.4 %, wL = 46.5 %,wP = 19.5 % and IP = 27 % was used.
2.3. Measuring methodsThe basic parameters of the nonwoven: thickness and mass per square meter were measured inaccordance with the PN-EN ISO 9863-1:2016-09 and PN-EN ISO 9864: 2007 standards. For themeasurements, the thickness gauge for geotextiles D-2000-G2 (SCHMIDT Instruments, Germany)was used. Additionally, the mechanical parameters of the nonwoven were determined.The measurements of the tensile strength and elongation at break were carried out in accordance withthe Polish standard PN-EN ISO 10319:2010 by means of KS50 Hounsfield tensile machine. The staticpuncture resistance was determined by CBR test, in accordance with the Polish standard PN-EN ISO12236:2006. The dynamic puncture resistance was measured by cone drop test, in accordance with thePolish standard PN-EN ISO 13433:2006.The parameters of the polyester fibres: length and linear density were determined in accordance withthe standards PN-ISO 137:2000 and PN-ISO 6989:2000.Water content, liquid and plastic limits of soils were determined in accordance with the Britishstandard [11-12]. In order to determine the liquid limit, the Casagrande apparatus method (four-pointmethod) was applied.
3. Results
3.1. Installation of the geotextiles on the slopeOn the plots protected with the geotextiles, the segments built from the meandrically arranged ropeswere spread on the slope, anchored in the crown and fastened to the surface with the steel “U-shaped” pins (Fig.4). The pins were hand-hammered to a depth of approximately 40 cm.After the installation, the protected plots, as well as the plots without the geotextiles, were coveredwith the 20 cm layer of the soil mixed with the polyester fibres. The mixtures of the soil and fibres,with fibres accounting for 0.25%, 0.5% and 1% of the dry soil weight, were prepared. The mixtureswere prepared by spreading the right amount of fibres on the soil layer and then covering them withthe additional layer of the soil. For mixing, a road recycler machine was used (Fig.5a). The mixed soilwas transferred to the slope and evenly distributed on its surface. Finally, the covering layer was

compacted by the excavator bucket (Fig.5b). Few days after the installation, the grass seeds were sownon the surface of the slope.
a/ b/
Figure 4. Installation of the meandrical geotextiles: a/ the segments spread on the surfaceof the slope; b/ fastening of the ropes
a/ b/
Figure 5. Covering of the slope with a layer of the soil mixed with polyester fibres:a/ mixing of the fibres with the soil; b/ formation of the covering layer on the slope
3.2. Monitoring of the slopeIn first week after the installation, it was stated that the geotextiles installed on the slope as well as thefibres mixed the soil provide immediate protection of the slope against erosion. During the first rainsthat fell before grass seeds germination, no erosive grooves on the surface of the slope were detected.In the first period of exploitation, the settlement of the soil located between the turns of the ropes wasobserved on the plots protected with the geotextiles. Simultaneously, the ropes arranged laterally onthe slope formed a network of micro-dams which slowed down the runoff of water. The dams stoppedthe soil particles detached from the surface and their transport down the slope with the water streamwas impeded.

On the plots reinforced with the fibres randomly distributed in the soil, the fibres formed a structuralmesh, which held the soil particles. Moreover, the fibres absorbed certain part of energy from the raindrops or flowing water, thus, preventing the washing away of the soil particles.In the following months the monitoring of the slope will be continued. The influence of the installedgeotextiles on the greening of the slope will be evaluated. Simultaneously, the effect of the fibreconcentration on the stabilization of the slope will be discerned.
4. Conclusions
The meandrical geotextiles made from the recycled fibres provide efficient protection of the slopeagainst erosion. The subsequent turns of the ropes prevent the soil from sliding down the slope andform bag-like structures which can keep large amounts of the topsoil on the slope, even in humidconditions. The fibres mixed with the clay soil considerably improve the strength of the soils andprevent slope sliding.The fibres and the geotextiles ensure the protection of the slope immediately after the installation,before the greening of the slope and the development of grass cover.For the protection of the slope, the recycled polyester fibres as well as nonwoven made from therecycled fibres can be utilized. The use of the recycled fibres in the protection of slopes can contributeto the rational textile waste management.
AcknowledgmentsThe authors gratefully acknowledge the funding by ERANET-CORNET consortium under theinternational research project PROGEO 2 “Geotextiles from Sustainable Raw Materials and TextileWaste, New Mobile Production Technology and New Application Fields in Drainage and HydraulicEngineering ”. DZP/CORNET/1/20/2017.
References[1] Rickson RJ. 2006. Earth Surface Processes and Landforms 31 550[2] Theisen MS. 1992. Geotextiles and Geomembranes 11 535[3] Pritchard M, Sarsby RW and Anand SC. 2000. Textiles in civil engineering. Part 2 – natural
fibre geotextiles, in: Horrocks, A.R., Anand, S.C. (Eds.), Handbook of technical textiles,Woodhead Publishing, Cambridge, 372
[4] Seeger M. 2009 Knitting International 115 28[5] Broda J, Gawlowski A, Rom M, Laszczak R, Mitka A, Przybylo S, Grzybowska-Pietras J. 2016
Tekstilec 59 115[6] Broda J, Gawlowski A, Laszczak R, Mitka A, Przybylo S, Grzybowska-Pietras J and Rom M.
2017 Geotextiles and Geomembranes 45 45[7] Broda J, Gawlowski A, Przybylo S, Binias D, Rom M, Grzybowska-Pietras J and Laszczak R.
2017 Journal of Technical Textiles, in press[8] Hejazi S M, Sheikhzadeh M, Abtahi S M, and Zadhoush A. 2012 Construction and Building
Materials 30 100[9] http://web.mst.edu/~rogersda/umrcourses/ge441/New%20Course%20File/
Lecture%204%20part% 03%20to%205.pdf[10] Gregory GH 2011. Sustainability aspects of the fiber reinforced soil repair of a roadway
embankment. The 24th annual GRI Conference Proceedings “Optimizing sustainability usinggeosynthetics”, Dallas, Texas, 16.03.2011.
[11] BS 5930:2015 Code of practice for ground investigations, London: British Standards Institution,2015.
[12] BS 1377: Part 2: 1990 Methods of test for soils for civil engineering purposes. PartClassification Tests, London: British Standards Institution, 1990.

Textile Sustainability: reuse of clean waste from the textileand apparel industry
A C Broega1, C Jordão1 and S B Martins2
1University of Minho, Centre for Textile Science and Technology, Textile EngineeringDepartment, Campus Azurém, Guimarães, Portugal2Universidade Estadual de Londrina, Campus Universitário, Londrina - PR, Brasil
E-mail: [email protected]
Abstract. Today societies are already experiencing changes in their production systems andeven consumption in order to guarantee the survival and well-being of future generations. Thisfact emerges from the need to adopt a more sustainable posture in both people's daily lives andproductive systems. Within this context, textile sustainability emerges as the object of study ofthis work whose aim is to analyse which sustainability dimensions are being prioritized by theclean waste management systems of the textile and garment industry’s. This article aims toanalyse solutions that are being proposed by sustainable creative business models in the reuseof discarded fabrics by the textile industry. Search also through a qualitative research by a casestudy (the Reuse Fabric Bank) understand the benefits generated by the re-use inenvironmental, economic, social and ways to add value.
1. IntroductionThe exaggerated consumption and incorrect waste disposal have generated increasing and alarmingenvironmental, social and economic problems. Data from the UN (2015) show that carbon dioxideemissions have increased almost 50 % since 1990 and 40 % of the oceans are impacted by the wastepollution with reduced fishing and loss of coastal habitats. While 1.3 billion tons of food is wasteddaily, the vast majority of the world's people starve in developing countries, where 12.9 % of thepopulation is starving. UN projections for 2050 come up with a population of 9.6 million people,requiring 3 planets to provide natural resources to support current lifestyles [1].Given this context, sustainability presents itself as a way to minimize environmental and social crisesin view of the maintenance and perpetuation of resources for future generations. However, there is astrong awareness of society when it comes to rethinking their consumption habits and promotingradical changes in the way they produce, consume and their lifestyles [2].In this context of transition to sustainability, we can observe the mobilization of some sectors, namelythe fashion industry, which begins to point out some proposals for changes in their productionsystems. In face of the textile and clothing industry’s negative impact in the environmental and socialspheres, innovative initiatives are emerging, which seek solutions through systems development builtunder the pillars of sustainability.
This article presents the main objective of analysing the sustainable dimensions that are beingprioritized by organizations related to the textile industry in Brazil, which carry out changes throughinnovative systems for sustainability. In order to carry out the present study, textile and clothing weredelimited, selecting sustainable projects in Brazilian institutions that perform the clean wastemanagement service of the textile and clothing industry for new products development with added

value. The Reuse Fabric Bank of São Paulo was used as a case study and analysed its systemicstructure. The tool SDO-Sustainability Design Orientation Toolkit was applied in order to map thruradars the sustainability dimensions, which are being prioritized by the Reuse Fabric Bank, but alsoapplied as systemic innovation strategies.
2. State of Art
2.1 Sustainable FashionThe fashion industry products have an ephemeral life cycle, as they are mostly designed by trends thatstimulate consumers to renew their goods every season and, thus, strengthen the capitalist systemstructure. In search of systems construction, which oppose the dictates of the fast fashion model,understood as a practice of fashion companies and distribution networks, which focus on the strategyof constantly design updating of their products combined with low production costs, fast flow and lowsales prices [4]; also the ones that think more ethically about fashion and generate positive impacts inthe environmental, social and cultural spheres with economic equilibrium. Thus, there is an increasingnumber of initiatives that reflect the sustainable fashion concept. The sustainability process driveschanges in the fashion industry, which discusses ways to reduce the clothing environmental impact,exalting the role of designers as systemic change facilitators [5].
Designing for sustainability is about developing products with low environmental impact and highsocial quality, analysing the criteria, methods and investments of Life Cycle Design. This requires thedesigner to increase his attention to all phases of the product life cycle, from the raw materialextraction stage, in order to product materials, to the final phase of use, which needs to be consideredas early as the beginning of the project, named stage of its decomposition or discard [6]. Faced withthe possibilities of sustainable actions in the fashion industry, there is a moment of change of scenery,in which a new and more selective consumer emerges, aware of the impact that their actions may haveon current generations and their descendants. The consumer also demands brands that are aligned withthe principles of transforming the world into a better place [7].
2.2 Sustainable waste management systems of Brazilian textile and clothing industryThe implementation of more effective laws, that charge corporate responsibility for environmental andsocial issues, has led to restructuration of the textile and clothing industry production chain, not onlyto comply with the requirements of these regulations, but also with the objective of fulfilling thedemands of a growing market, which starts to adopt a more conscious consumption. Under thisapproach, innovative actions, although still incipient, are being identified. These are redesigning theproductive structure regarding the textile and garment industry waste’s reuse with reverse logisticspractices and cleaner production. The actors involved in this context change are private companies,nongovernmental organizations, public agencies, community associations, class institutions (tradeunions, professional associations, etc.), academia and consumers themselves, who seek alternative andinnovative solutions. However, the challenge of balancing production and consumption patterns is stilla complex task, aggravated by the fact that sustainability is still a concept in evolution, also by thedifficulties in its practical implementation [8].To make a better comprehension, the actions that are being developed in the Brazilian context, and inorder to deepen the knowledge about the sustainable systems construction of the textile and clothingchain, we mapped sustainable initiatives examples, that have been practiced by differentiated actors ofthis productive chain, as shown below.
2.2.1 Project of Fashion RetailThe "Retail Fashion" project is held in Bom-Retiro - São-Paulo through a partnership betweenSinditêxtil-SP (Union of Spinning and Weaving Industries of the State of São Paulo, BR) with thesupport of ABIT (Brazilian Textile Industry Association and São Paulo City Hall), as well as otherinstitutions in an area that concentrates more than 1200 clothing factories. These generateapproximately 12 tons of textile waste (clean waste) per day, which represents 2 % of the annualwastage generated in Brazil [9].

The project, which is still in its initial stages, aims to manage the commercialization of this waste inorder to contribute to the reuse of it as raw material for the textile companies and to propose a wastemanagement plan in accordance with the National Solid Waste Policy. In order to avoided that theindustry not to be subject to compulsory regulations [10].
2.2.2 The Brandili Textile BrandThe Brandili Têxtil brand has been working in the area of children's clothing for over 50 years and, forthe past five years, it has taken a sustainable stance by using natural resources responsibly.The company, based in the state of Santa-Catarina, reuses textile waste for ecological yarnsproduction. This process relies on a partnership of companies that provide raw material, (clineindustrial waste), for reuse in the ecological yarns production, from textile materials and bottles madeof polyethylene terephthalate (known as PET bottles). Reverse logistics actions are observed in thecompany, since the post-consumer distribution channels are formed by reverse products’ flow andmaterials from products’ disposal, once their original functionality has been exhausted, returning tothe production cycle in another way [11].
2.2.3 The Insecta Shoes BrandThe Insecta Shoes brand was created in Porto-Alegre – Rio-Grande-do-Sul in 2014, is distinguishedby marking vegan footwear with a positioning that works with animal protection values, since it doesnot use any animal input in its products. The brand adopts a sustainable posture, because all of itsfootwear is made of used clothing or leftover fabrics, industrial rubber waste or recycled plastic. Allthe material is carefully searched in second hand articles fairs, as well as in products of the ReusableFabric Bank of São Paulo, case study object of this work. In a research carried out in Porto-Alegre,with Bárbara Mattivy, founding partner of the brand, it is observed that there is a concern in extendingfabric’s life and, at the same time, guaranteeing a reduction of materials in the production line [12].
2.2.4 The Ecosimple BrandCreated in 2010 in the city of Americana – São-Paulo, the merger result of other textile companieswith a business model, added to an innovative and sustainable concept. The fabrics and brand productsuse 100 % recycled materials, combining technology with sustainability. The raw materials used arerecycled PES from bottles, discarded clothing or fabric’s leftovers from garment factories and wastefrom spinning processes that give rise to more sustainable products which are used in a wide variety ofsegments. Ecosimple presents itself in the Brazilian textile context as a company that uses innovationby adopting a production model that minimizes environmental impact and favour’s poor communities.
2.2.5 Bank of Clothing from Caxias-do-SulThe Clothing Bank of Caxias-do-Sul (BVCS), in Rio-Grande-do-Sul, was founded in October 2009 asa centralizing body for textile waste from the industries of the Rio-Grande-do-Sul state region. TheBVCS receives the waste from the industries, performs a sorting by types of materials and organizesthe fabric’s leftovers for posterior assignment to registered communities, which will reuse thesematerials. What cannot be reused by the communities goes to other industries that make reuse forstuffing or is destined for co-processing, closing the product cycle.
3. MethodologyThe research method used was the case study, in order to investigate in greater depth a contemporaryphenomenon, in this case, the phenomenon of sustainability in the textile sector. Since it was atechnically singular situation, an analysis unit was used, defined by the business model criterion,which performs the collection service, separation and commercialization/disposal of the leftovers fromthe textile and garment industry, which would have landfills or other destinations that could have anegative impact on the environment and society.The unit that served as the study analysis object was the Reuse Fabric Bank of São-Paulo capital,which will be explained later. In the second phase of the empirical work development, aftercategorizing the data, the information was submitted to a tool called Sustainability Design-Orienting
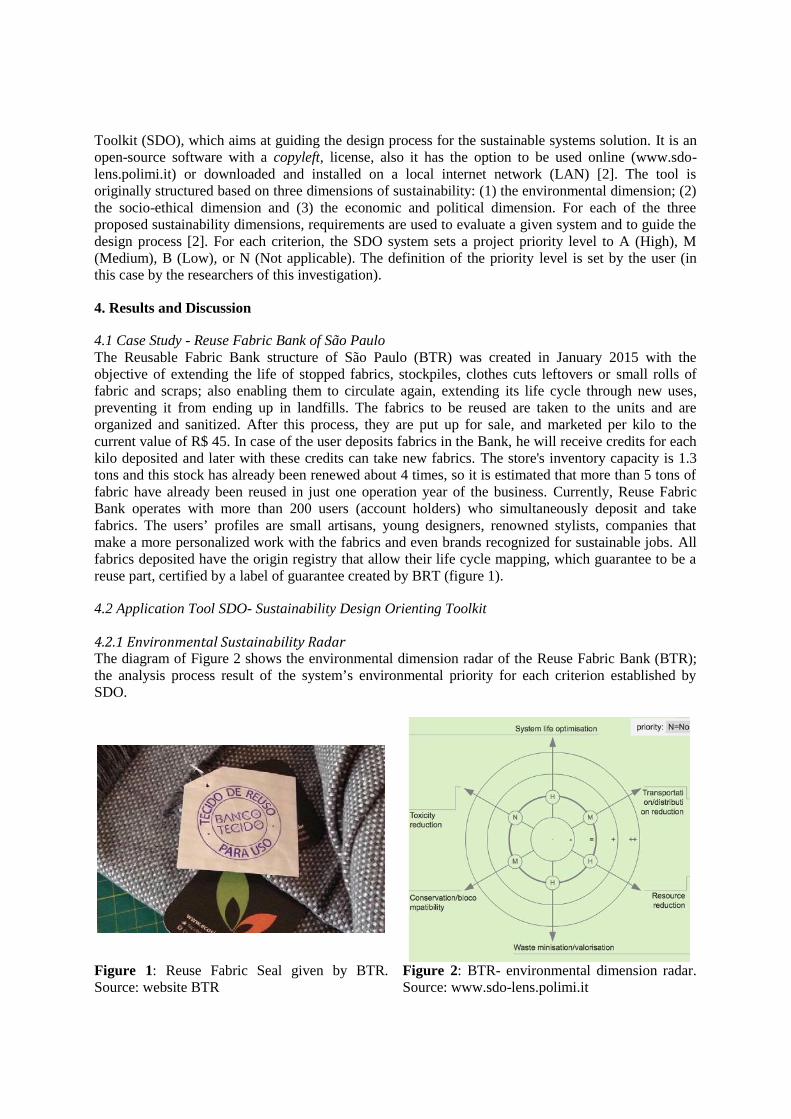
Toolkit (SDO), which aims at guiding the design process for the sustainable systems solution. It is anopen-source software with a copyleft, license, also it has the option to be used online (www.sdo-lens.polimi.it) or downloaded and installed on a local internet network (LAN) [2]. The tool isoriginally structured based on three dimensions of sustainability: (1) the environmental dimension; (2)the socio-ethical dimension and (3) the economic and political dimension. For each of the threeproposed sustainability dimensions, requirements are used to evaluate a given system and to guide thedesign process [2]. For each criterion, the SDO system sets a project priority level to A (High), M(Medium), B (Low), or N (Not applicable). The definition of the priority level is set by the user (inthis case by the researchers of this investigation).
4. Results and Discussion
4.1 Case Study - Reuse Fabric Bank of São PauloThe Reusable Fabric Bank structure of São Paulo (BTR) was created in January 2015 with theobjective of extending the life of stopped fabrics, stockpiles, clothes cuts leftovers or small rolls offabric and scraps; also enabling them to circulate again, extending its life cycle through new uses,preventing it from ending up in landfills. The fabrics to be reused are taken to the units and areorganized and sanitized. After this process, they are put up for sale, and marketed per kilo to thecurrent value of R$ 45. In case of the user deposits fabrics in the Bank, he will receive credits for eachkilo deposited and later with these credits can take new fabrics. The store's inventory capacity is 1.3tons and this stock has already been renewed about 4 times, so it is estimated that more than 5 tons offabric have already been reused in just one operation year of the business. Currently, Reuse FabricBank operates with more than 200 users (account holders) who simultaneously deposit and takefabrics. The users’ profiles are small artisans, young designers, renowned stylists, companies thatmake a more personalized work with the fabrics and even brands recognized for sustainable jobs. Allfabrics deposited have the origin registry that allow their life cycle mapping, which guarantee to be areuse part, certified by a label of guarantee created by BRT (figure 1).
4.2 Application Tool SDO- Sustainability Design Orienting Toolkit
4.2.1 Environmental Sustainability RadarThe diagram of Figure 2 shows the environmental dimension radar of the Reuse Fabric Bank (BTR);the analysis process result of the system’s environmental priority for each criterion established bySDO.
Figure 1: Reuse Fabric Seal given by BTR.Source: website BTR
Figure 2: BTR- environmental dimension radar.Source: www.sdo-lens.polimi.it
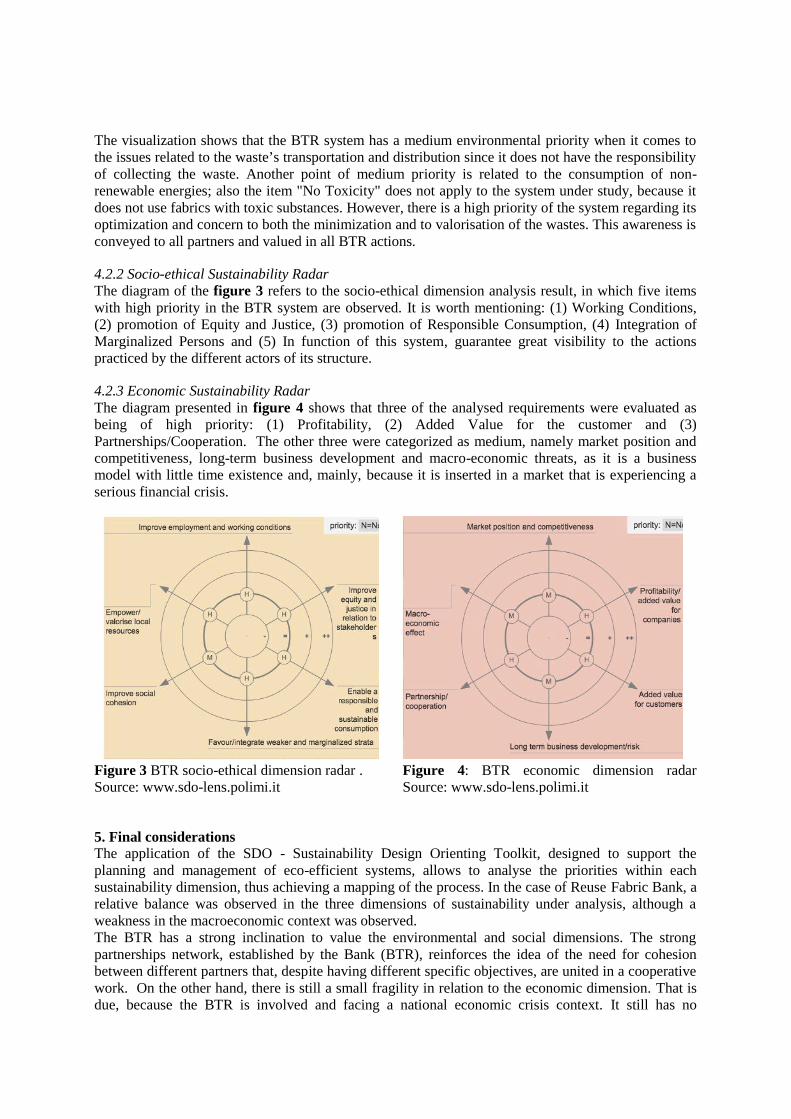
The visualization shows that the BTR system has a medium environmental priority when it comes tothe issues related to the waste’s transportation and distribution since it does not have the responsibilityof collecting the waste. Another point of medium priority is related to the consumption of non-renewable energies; also the item "No Toxicity" does not apply to the system under study, because itdoes not use fabrics with toxic substances. However, there is a high priority of the system regarding itsoptimization and concern to both the minimization and to valorisation of the wastes. This awareness isconveyed to all partners and valued in all BTR actions.
4.2.2 Socio-ethical Sustainability RadarThe diagram of the figure 3 refers to the socio-ethical dimension analysis result, in which five itemswith high priority in the BTR system are observed. It is worth mentioning: (1) Working Conditions,(2) promotion of Equity and Justice, (3) promotion of Responsible Consumption, (4) Integration ofMarginalized Persons and (5) In function of this system, guarantee great visibility to the actionspracticed by the different actors of its structure.
4.2.3 Economic Sustainability RadarThe diagram presented in figure 4 shows that three of the analysed requirements were evaluated asbeing of high priority: (1) Profitability, (2) Added Value for the customer and (3)Partnerships/Cooperation. The other three were categorized as medium, namely market position andcompetitiveness, long-term business development and macro-economic threats, as it is a businessmodel with little time existence and, mainly, because it is inserted in a market that is experiencing aserious financial crisis.
Figure 3 BTR socio-ethical dimension radar .Source: www.sdo-lens.polimi.it
Figure 4: BTR economic dimension radarSource: www.sdo-lens.polimi.it
5. Final considerationsThe application of the SDO - Sustainability Design Orienting Toolkit, designed to support theplanning and management of eco-efficient systems, allows to analyse the priorities within eachsustainability dimension, thus achieving a mapping of the process. In the case of Reuse Fabric Bank, arelative balance was observed in the three dimensions of sustainability under analysis, although aweakness in the macroeconomic context was observed.The BTR has a strong inclination to value the environmental and social dimensions. The strongpartnerships network, established by the Bank (BTR), reinforces the idea of the need for cohesionbetween different partners that, despite having different specific objectives, are united in a cooperativework. On the other hand, there is still a small fragility in relation to the economic dimension. That isdue, because the BTR is involved and facing a national economic crisis context. It still has no
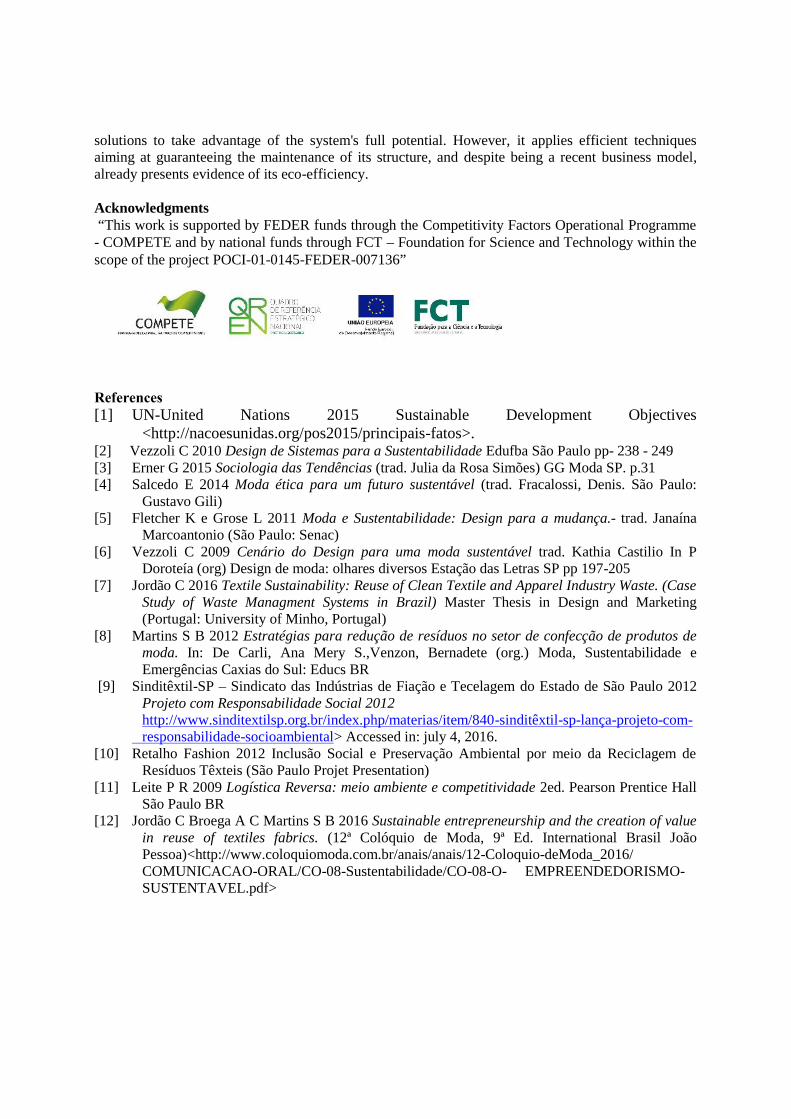
solutions to take advantage of the system's full potential. However, it applies efficient techniquesaiming at guaranteeing the maintenance of its structure, and despite being a recent business model,already presents evidence of its eco-efficiency.
Acknowledgments“This work is supported by FEDER funds through the Competitivity Factors Operational Programme- COMPETE and by national funds through FCT – Foundation for Science and Technology within thescope of the project POCI-01-0145-FEDER-007136”
References[1] UN-United Nations 2015 Sustainable Development Objectives
<http://nacoesunidas.org/pos2015/principais-fatos>.[2] Vezzoli C 2010 Design de Sistemas para a Sustentabilidade Edufba São Paulo pp- 238 - 249[3] Erner G 2015 Sociologia das Tendências (trad. Julia da Rosa Simões) GG Moda SP. p.31[4] Salcedo E 2014 Moda ética para um futuro sustentável (trad. Fracalossi, Denis. São Paulo:
Gustavo Gili)[5] Fletcher K e Grose L 2011 Moda e Sustentabilidade: Design para a mudança.- trad. Janaína
Marcoantonio (São Paulo: Senac)[6] Vezzoli C 2009 Cenário do Design para uma moda sustentável trad. Kathia Castilio In P
Doroteía (org) Design de moda: olhares diversos Estação das Letras SP pp 197-205[7] Jordão C 2016 Textile Sustainability: Reuse of Clean Textile and Apparel Industry Waste. (Case
Study of Waste Managment Systems in Brazil) Master Thesis in Design and Marketing(Portugal: University of Minho, Portugal)
[8] Martins S B 2012 Estratégias para redução de resíduos no setor de confecção de produtos demoda. In: De Carli, Ana Mery S.,Venzon, Bernadete (org.) Moda, Sustentabilidade eEmergências Caxias do Sul: Educs BR
[9] Sinditêxtil-SP – Sindicato das Indústrias de Fiação e Tecelagem do Estado de São Paulo 2012Projeto com Responsabilidade Social 2012http://www.sinditextilsp.org.br/index.php/materias/item/840-sinditêxtil-sp-lança-projeto-com-responsabilidade-socioambiental> Accessed in: july 4, 2016.
[10] Retalho Fashion 2012 Inclusão Social e Preservação Ambiental por meio da Reciclagem deResíduos Têxteis (São Paulo Projet Presentation)
[11] Leite P R 2009 Logística Reversa: meio ambiente e competitividade 2ed. Pearson Prentice HallSão Paulo BR
[12] Jordão C Broega A C Martins S B 2016 Sustainable entrepreneurship and the creation of valuein reuse of textiles fabrics. (12ª Colóquio de Moda, 9ª Ed. International Brasil JoãoPessoa)<http://www.coloquiomoda.com.br/anais/anais/12-Coloquio-deModa_2016/COMUNICACAO-ORAL/CO-08-Sustentabilidade/CO-08-O- EMPREENDEDORISMO-SUSTENTAVEL.pdf>
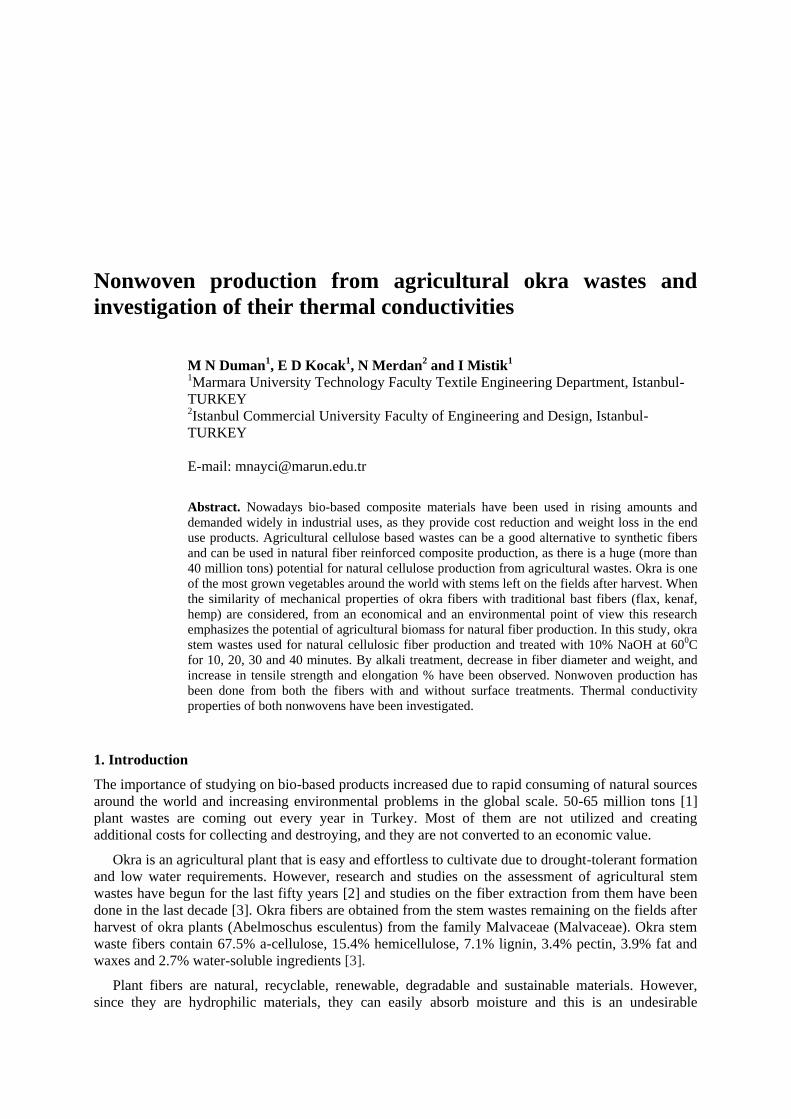
Nonwoven production from agricultural okra wastes and
investigation of their thermal conductivities
M N Duman1, E D Kocak
1, N Merdan
2 and I Mistik
1
1Marmara University Technology Faculty Textile Engineering Department, Istanbul-
TURKEY 2Istanbul Commercial University Faculty of Engineering and Design, Istanbul-
TURKEY
E-mail: [email protected]
Abstract. Nowadays bio-based composite materials have been used in rising amounts and
demanded widely in industrial uses, as they provide cost reduction and weight loss in the end
use products. Agricultural cellulose based wastes can be a good alternative to synthetic fibers
and can be used in natural fiber reinforced composite production, as there is a huge (more than
40 million tons) potential for natural cellulose production from agricultural wastes. Okra is one
of the most grown vegetables around the world with stems left on the fields after harvest. When
the similarity of mechanical properties of okra fibers with traditional bast fibers (flax, kenaf,
hemp) are considered, from an economical and an environmental point of view this research
emphasizes the potential of agricultural biomass for natural fiber production. In this study, okra
stem wastes used for natural cellulosic fiber production and treated with 10% NaOH at 600C
for 10, 20, 30 and 40 minutes. By alkali treatment, decrease in fiber diameter and weight, and
increase in tensile strength and elongation % have been observed. Nonwoven production has
been done from both the fibers with and without surface treatments. Thermal conductivity
properties of both nonwovens have been investigated.
1. Introduction
The importance of studying on bio-based products increased due to rapid consuming of natural sources
around the world and increasing environmental problems in the global scale. 50-65 million tons [1]
plant wastes are coming out every year in Turkey. Most of them are not utilized and creating
additional costs for collecting and destroying, and they are not converted to an economic value.
Okra is an agricultural plant that is easy and effortless to cultivate due to drought-tolerant formation
and low water requirements. However, research and studies on the assessment of agricultural stem
wastes have begun for the last fifty years [2] and studies on the fiber extraction from them have been
done in the last decade [3]. Okra fibers are obtained from the stem wastes remaining on the fields after
harvest of okra plants (Abelmoschus esculentus) from the family Malvaceae (Malvaceae). Okra stem
waste fibers contain 67.5% a-cellulose, 15.4% hemicellulose, 7.1% lignin, 3.4% pectin, 3.9% fat and
waxes and 2.7% water-soluble ingredients [3].
Plant fibers are natural, recyclable, renewable, degradable and sustainable materials. However,
since they are hydrophilic materials, they can easily absorb moisture and this is an undesirable

characteristic as it will cause decay. Surface modification is made to facilitate the industrial use of
plant fibers and thus to increase it. The surface modification made as a pre-treatment can be applied by
many methods to improve the mechanical properties of the fibers, such as strength, and to increase the
absorbency of the subsequent treatments by providing surface roughness, some of which are
alkalization with sodium hydroxide (NaOH) [4–12]or Sodium sulphate (Na2SO4) [12,13], bleaching
with Sodium hypochlorite (NaClO) or Sodium chlorite (NaClO2) [4,5,8,14], and acetylation with
acetic acid [13–15]. Surface modification processes also remove as much of the structural material as
lignin, hemicellulose, and pectin, allowing more reaction zones to occur in the cellulosic structure
[13]. It has been observed that when the concentration of the chemical substance is too high, as well as
being an important factor, it negatively affects the mechanical properties such as the strength of the
fiber [12]. When pre-treated with alkaline, the content of cellulose increases to 75-80% due to removal
of hemicellulose, lignin, pectin and other water-soluble substances in the okra stem fiber. The fiber
becomes less dense and less rigid, which allows for more ability to the fibrillar structure to settle in the
direction of tension [16]. The most common and widely used chemical in alkalisation is sodium
hydroxide. Alkalisation process changes the natural structure of cellulose from cellulose I to cellulose
II, the alkalization depolymerizes the molecular structure of natural cellulose I by forming short
crystals [17].
As 36.000 tons/year okra grown in Turkey [1], utilization of the okra stem wastes has been studied
according to 9th developments plan and region development visions of the State Planning
Organization, while okra fibers have similar mechanical properties with the traditional fibers [3–
5,14,18]. The aim of this study was utilizing the okra stem wastes and contributing them to the
environmental biomass cycle by removing the wastes in their sources and by producing
environmentally friendly, value added, a novel fiber/product. And it has the leading potential of
production of the first fiber/product manufacturing from the agricultural wastes in Turkey.
In this study, okra stem wastes used for natural cellulosic fiber production and treated with 10% NaOH
at 600C for 10, 20, 30 and 40 minutes. By alkali treatment, decrease in fiber diameter and weight, and
increase in tensile strength and elongation % have been observed. Nonwoven production has been
done from both the fibers with and without surface treatments. Thermal conductivity properties of both
nonwovens have been investigated.
2. Materials and Method
Okra stem wastes have been collected from Mediterranean region. Fibers produced from okra stem
wastes by using the specially designed machine (100 kg/hour capacity) in Marmara University. The
fibers are left in the water-filled containers for 20 days so that the residues on the fibers separated from
the plant extracts and the adhesive materials can be removed completely. In order to clean and
fibrillate the surface of the fiber samples (each 2 g), surface modification has been applied with 10%
NaOH at 600C in ratio of 1:20 g/ml for 10, 20, 30 and 40 minutes by referring Islam and Pickering's
studies [17]. Then fibers first washed warm at 25°C, were neutralized with 5% acetic acid solution for
5 minutes and dried in the stove at 100°C for 2 hours. Finally, the fibers were conditioned in
laboratory conditions (65±2% relative humidity 20±20C).
Tensile strength and elongation% values of okra fibers have been tested with INSTRON 4411
testing machine (50 N load, 10 mm/min speed) according to ASTM D 3822 standards, their diameters
have been measured with Projectina CH-9495 microscope, and their morphological views have been
taken with JEOL JSM-T330 electron microscope in Physical Test Laboratory of Marmara University
Faculty of Technology Textile Engineering Department. Then combing and needle punching processes
have been applied to the fibers with and without surface modifications at the laboratuary based
sampling nonwoven production line in ITA Laboratories in Istanbul/Turkey for forming nonwoven
surfaces. In this line there are combing machine (CFS1/Feeding width-exit 1000 mm, 650m/min.),
cross laying machine (FRT50, input-output 1000 mm, band 49 m/min, exit 6m/min.), needling

machine ((MAG4000 roller AR95, preneedling–end needling 1200 mm, distance of the calenders 0-10
mm, roller: 1200 mm, needling speed 0-rpm-400rpm; oven 0-6,5 m/min., roller 0-10 m/min.) that can
work seperately. The capacity of the machine is 50 kg/h and its width is 1000 mm (Cormatex S.R.L.).
Thermal conductivity properties of both nonwovens have been investigated according to TS ISO 5085
standards in Marmara University laboratories with P.A. HILTON LTD.H940 testing machine.
3. Results
The fibers obtained from okra body wastes are amorphous due to their lignocellulosic properties and
their most important ingredients are cellulose, hemicellulose and lignin. The characteristic properties
of each component play a decisive role in all properties of the fiber. Okra body waste fibers are
adhered to each other by materials such as lignin, gum and wax in the cells of the structure. After the
fibers are separated from the plant extracts, it is necessary to apply the hydrophilization process in
order to remove the water repellent substances like lignin. For this reason, in this study one of the
methods used for surface modification to hydrophilize and fibrillate the okra stem waste fibers is the
conventional method.
Factors affecting alkalization are the type and concentration of the chemical substances, the
duration of the process and the heat. Alkali treatment removes lignin and hemicellulose from the fiber
structure. By the alkali processes applied in this project, alkali-sensitive (OH) groups between the
molecules reacted with water molecules as shown in equation (1) below to remove the H-bonds, so the
amorphous structure and the amount of fibrillation which increases the amount of contact between the
fiber and the matrix increased. The surface irregularity also increased with the rupture of the H-bonds,
which leads to better mechanical bonding between the fiber and the matrix and to the tensile strength
of the composite [19].
Fiber – OH + NaOH Fiber – O – Na + H2O (1)
The stem diameter of the okra plant which grows in different regions in Turkey varies between 10-50
mm. Physical diameters (μm) (figure 1) of okra stem waste fibers obtained from different regions were
determined for treated and untreated fibers.
Figure 1. Diameters of okra fiber samples
pre-treated with 10% sodium hydroxide.
Figure 2. Measured weights and weight loss % of
okra stem waste fibers treated with 10% sodium
hydroxide.
In this study, the diameter of the okra stem fibers was measured from different points of the fiber
and the average was taken. As shown in table 1, surface modified fibers showed some swelling due to
mercerization and widening in cross-section. However, hemicellulose, lignin and other impurities are
also removed during the surface modification process, and accordingly the diameter is reduced to
some extent. When the cross-sectional and longitudinal views (figure 3) and diameter measurements of
the okra stem fibers are examined, it is seen that there is a linear deformation [5] in the okra stem
fibers as well as in all of the plant fibers.

Figure 3. Longitudinal and cross-sectional SEM images of untreated and 10% sodium hydroxide
treated okra stem waste fibers respectively.
It is seen that the results of the treatments with sodium hydroxide in the SEM images of okra stem
fibers are effective. Inorganic materials, oils and waxes and non-cellulosic materials have been
removed from the fiber surface. The chemical modification of the fiber surface appears to modify the
surface of the fibers to give rise to roughness on the surfaces. As can be seen from SEM micrographs,
it has been found that the conventional method is used to produce fibrillation on the surface of the okra
stem waste fibers without damaging the molecular structure of the fiber and reducing its mechanical
properties [20]. Because swelling is a physicochemical phenomenon of plant fibers in the context of
water and chemicals, water molecules penetrate the gaps in the fiber and open hydrogen bonds,
making the cellulosic fibers suitable for swelling. During the swelling process, the hydrogen bonds of
the cellulose molecules break off and the water molecules are transported through hydrogen bonds.
Thus, the water molecules bond with the OH groups of the cellulose fibers via hydrogen bonds, and as
a result, the cellulose fibers begin to swell. It has been found that the degree of swelling is dependent
on the number of free hydroxyl (OH-) groups in the fiber [21,22].
Tensile strength, elongation (%), Young's modulus (%) of okra stem waste fibers after surface
modification with conventional method are given in figure 4. Its morphological structure, crystallinity,
amorphous region ratio and orientation, physical and chemical properties affect the mechanical
properties of lignocellulosic fibers. The moisture absorption capacity of lignocellulosic fibers varies
depending on the fiber structure. Surface modification processes increase the roughness rate on the
fiber surface and the ability to absorb moisture [23].
Figure 4. Mechanical properties of okra stem waste
fibers treated with 10% sodium hydroxide.
Figure 5. The calculated heat transfer
coefficients of okra fiber nonwovens treated
with 10% NaOH at different durations
As shown in figure 4, the increase in the tensile strength of the okra fibers with respect to the untreated
fiber in the surface modification with sodium hydroxide according to the conventional method was
determined, but decrease at tensile strength over 30 minutes was observed. After surface treatment, the
okra stem waste fibers are weighed with a precision scale after preconditioning in lab conditions. The
weight of each sample before treatment is 2 g. The weight loss of the fibers is calculated as a
percentage by the following equation (2).
Wj = ((Wbefore – Wafter)/Wbefore) x 100 (2)
Wj: Weight loss%, Wbefore: Weight before treatment, Wafter: Weight after treatment
Figure 2 shows the weight measurements and the weight loss (%) values of okra stem waste fibers
after the treatment according to the pre-treatment. It can be said that 20 minutes of treatment with
sodium hydroxide gives very good results and also allows the removal of the most purities. In addition,
improvement in the brightness and stiffness of the okra stem waste fibers was observed.
After non-woven surface formation by needle punching method from treated and untreated okra waste
fibers, the heat conductivity tests of these nonwovens have been done according to TS ISO 5085
standards. The heat transfer coefficient (K) of non-woven surfaces was shown in w/m ºC. The linear
conduction module was used in the heat transfer device. The heat flow value (Q) from the digital
display of the device was determined in watts. The heat transfer coefficient was calculated by using the
eauqtion (3) as shown below.
K = (Q.dx)/(A.ΔT) (3)
K: heat transfer coefficient, dx: thickness of nonwoven surfaces, A: area of test area, ΔT: temperature
difference, Q: heat flow value
The heat transfer coefficient K is determined at w/m ºC. The dx thickness parameter in the equation has
a very decisive role. To measure the heat transfer coefficient of non-woven surfaces obtained from the
okra stem waste fibers, a material Δx with a diameter of 25 mm have been placed between the two
brass plates at the T3 and T4 temperatures. The one side of the nonwoven surfaces have been adjusted
to the temperature T3 and the other side of the surfaces to the temperature T4. According to Fourier
Heat Conduction Law, while a heat transfer was occurring between the two media with temperature
differences from the hot region to the cold region, the non-woven surfaces between these two-media
had a certain heat transfer coefficient. According to the Fourier Law, the heat transfer coefficient of
the material has been calculated with the equation (4) as shown below.
Qx = - k.A.(ΔT/ Δx) (4)
After the measurement system started to function, temperatures T3 and T4 have been read from the
digital display in every 10 minutes. The heat transfer coefficient of the surfaces has been calculated
from the Fourier Law in the direction of the heat energy supplied to the system, sample thickness and
area information.
As shown in figure 5, the okra fiber nonwoven treated with 10% NaOH at 10 minutes has the best
heat transfer coefficient. Although the okra fiber nonwovens treated with 10% NaOH at 20, 30 and 40
minutes have better heat transfer coefficients than the okra fiber nonwoven which was produced from
untreated fibers, their heat transfer coefficients are lower than the okra fiber nonwoven treated with
10% NaOH at 10 minutes. Also, it is seen from the graphic that there is no correlation with the heat
transfer coefficients and the treatment durations.
4. Conclusion
Agricultural waste fibers and nonwovens obtained these fibers can have good mechanical properties
and thermal conductivity values as the traditional fibers (both natural and synthetic) used in industry.
Agricultural waste fibers are cost effective, lightweight, environmentally friendly, renewable,
recyclable and degradable. As this study is a part of a TUBITAK (The Scientific and Technological
Research Council of Turkey) research project, our studies are continuing. Nonwoven productions from
okra stem waste fibers treated with different chemicals and enzymes will be done, and their heat

transfer coefficients will be measured and compared.
Acknowledgements
Authors are highly thankful to TÜBİTAK (The Scientific and Technological Research Council of
Turkey) for aiding our project #215M984. This study is a part of this project.
References
[1] “Türkiye İstatistik Kurumu” [Online]. Available: http://www.tuik.gov.tr/PreTabloArama.do.
[Accessed: 09-May-2017].
[2] FRANKLIN W. MARTIN, 1982, “Okra, Potential Multiple-Purpose Crop for the Temperate
Zones and Tropics,” Econ. Bot., 36(3), pp. 340–345.
[3] Alam, M. S., and Khan, G. M. a., 2007, “Chemical Analysis of Okra Bast Fiber (Abelmoschus
Esculentus) and Its Physico-Chemical Properties,” J. Text. Apparel, Technol.
Manag., 5(4), pp. 1–9.
[4] Khan, G. M. A., and Alam, S., 2013, “Surface Chemical Treatments of Jute Fiber for High
Value Composite Uses,” J. Mater. Sci., 1(2), pp. 39–44.
[5] De Rosa, I. M., Kenny, J. M., Puglia, D., Santulli, C., and Sarasini, F., 2009, “Morphological,
Thermal and Mechanical Characterization of Okra (Abelmoschus Esculentus) Fibres
as Potential Reinforcement in Polymer Composites,” Compos. Sci. Technol., 70, pp.
116–122.
[6] Fortunati, E., Puglia, D., Monti, M., Santulli, C., Maniruzzaman, M., Foresti, M. L., Vazquez,
A., and Kenny, J. M., 2013, “Okra (Abelmoschus Esculentus) Fibre Based PLA
Composites: Mechanical Behaviour and Biodegradation,” Journa Polym. Environ., 21,
pp. 726–737.
[7] Arifuzzaman Khan, G. M., Shaheruzzaman, M., Rahman, M. H., Abdur Razzaque, S. M.,
Sakinul Islam, M., and Shamsul Alam, M., 2009, “Surface Modification of Okra
Bast Fiber and Its Physico-Chemical Characteristics,” Fibers Polym., 10(1), pp. 65–70.
[8] Rosa, I. De, Kenny, J., Maniruzzaman, M., Monti, M., Puglia, D., and Sarasini, F., 2011, “Effect
of Chemical Treatments on the Mechanical and Thermal Behaviour of Okra
(Abelmoschus Esculentus) Fibres,” Compos. Sci. Technol., 71(2), pp. 246–254.
[9] Yılmaz, N. D., Konak, S., Yılmaz, K., Kartal, A. A., and Kayahan, E., 2016, “Characterization,
Modification and Use of Biomass: Okra Fibers,” Bioinspired, Biomim.
Nanobiomaterials, 5(3), pp. 85– 95.
[10] Moniruzzaman, M., Maniruzzaman, M., Gafur, M. A., and Santulli, C., 2009, “Lady’s Finger
Fibres for Possible Use as a Reinforcement in Composite Materials,” J. Biobased
Mater. Bioenergy, 3, pp. 1–5.
[11] Kishimoto, A., Koumoto, K., Yanagida, H., and Nameki, M., 1991, “Microstructure
Dependence of Mechanical and Dielectric Strengths-I. Porosity,” Eng. Fract. Mech.,
40(4–5), pp. 927–930.
[12] Srinivasababu, N., 2015, “An Overview of Okra Fibre Reinforced Polymer Composites,” Mater.
Sci. Eng., 83(1), p. 12003.
[13] Onyedum, O., Aduloju, S. C., Sheidu, S. O., Metu, C. S., and Owolabi, O. B., 2015,
“Comparative Mechanical Analysis of Okra Fiber and Banana Fiber Composite
Used in Manufacturing Automotive Car Bumpers,” Am. J. Eng. Technol. Soc., 2(6), pp.
193–199.
[14] Kumar, D. S., Tony, D. E., Kumar, a P., Kumar, K. A., Rao, D. B. S., and Nadendla, R., 2013,
“A Review on : Abelmoschus Esculentus ( Okra ),” Int. Res. J. Pharm. appied Sci., 3(4),
pp. 129–132.
[15] Fortunati, E., Puglia, D., Monti, M., Santulli, C., Maniruzzaman, M., and Kenny, J. M., 2013,

“Cellulose Nanocrystals Extracted from Okra Fibers in PVA Nanocomposites,” J. Appl.
Polym. Sci, 128, pp. 3220–3230.
[16] Arifuzzaman Khan, G., Ahsanul Haque, M., and Shamsul Alam, M., 2014, “Studies on Okra
Bast Fibre- Reinforced Phenol Formaldehyde Resin Composites,” Biomass and
Bioenergy, Springer International Publishing, pp. 157–174.
[17] Islam, M. S., and Pickering, K. L., 2014, “An Empirical Equation for Predicting Mechanical
Property of Chemically Treated Natural Fibre Using a Statistically Designed
Experiment,” Fibers Polym., 15(2), pp. 355–363.
[18] Mwaikambo, L. Y., and Ansell, M. P., 2002, “Chemical Modification of Hemp, Sisal, Jute, and
Kapok Fibers by Alkalization,” J. Appl. Polym. Sci., 84(12), pp. 2222–2234.
[19] Hamideh Hajiha, Mohini Sain, and Lucia H. Mei, 2014, “Modification and Characterization of
Hemp and Sisal Fibers,” J. Nat. Fibers, 11(2), pp. 144–168.
[20] Rong, M. Z., Zhang, M. Q., Liu, Y., Yang, G. C., and Zeng, H. M., 2001, “The Effect of Fiber
Treatment on the Mechanical Properties of Unidirectional Sisal-Reinforced Epoxy
Composites,” Compos. Sci. Technol., 61, pp. 1437–1447.
[21] Bledzki, A. K., and Gassan, J., 1999, “Composites Reinforced with Cellulose Based Fibres,”
Prog. Polym. Sci, 24, pp. 221–274.
[22] Gassan, J., and Bledzki, A. K., 1998, “Alkali Treatment of Jute Fibers : Relationship Between
Structure and Mechanical Properties,” J. Appl. Polym. Sci., pp. 623–629.
[23] Li, X., Tabil, L. G., and Panigrahi, S., 2007, “Chemical Treatments of Natural Fiber for Use in
Natural Fiber-Reinforced Composites: A Review,” J. Polym. Environ., 15(1), pp. 25–
33.
Silk industry and carbon footprint mitigation
A M Giacomin1, J B Garcia Jr
2, W F Zonatti
3, M C Silva-Santos
1, M C Laktim
1 and
J Baruque-Ramos1
1University of Sao Paulo, School of Arts, Sciences and Humanities, Av. Arlindo Bettio,
1000, 03828000, Sao Paulo – SP – Brazil. 2Vale da Seda Institute – Maringa – PR – Brazil. 3Federal Institute of Education, Science and Technology of Rio de Janeiro. Rio de Janeiro
– RJ – Brazil.
E-mail: [email protected]
Abstract. Currently there is a concern with issues related to sustainability and more conscious
consumption habits. The carbon footprint measures the total amount of greenhouse gas (GHG)
emissions produced directly and indirectly by human activities and is usually expressed in tonnes
of carbon dioxide (CO2) equivalents. The present study takes into account data collected in
scientific literature regarding the carbon footprint, garments produced with silk fiber and the role of
mulberry as a CO2 mitigation tool. There is an indication of a positive correlation between silk
garments and carbon footprint mitigation when computed the cultivation of mulberry trees in this
calculation. A field of them mitigates CO2 equivalents in a proportion of 735 times the weight of
the produced silk fiber by the mulberry cultivated area. At the same time, additional researches are
needed in order to identify and evaluate methods to advertise this positive correlation in order to
contribute to a more sustainable fashion industry.
Keywords: Silk industry, Carbon Footprint, Sustainability.
1. Introduction
Carbon footprint is the term used to evaluate the total emission of greenhouse gases (GHG) by human
activities [1]. It refers to the mass of GHG emitted due to the production, use and discard of a product [2].
Carbon footprint is a simplified form of calculating the environmental footprint of the product, and is
based on ISO14040, the global standard for life cycle assessment (LCA) [3].
According to the World Wildlife Fund, carbon footprint of mankind is the main cause of climate
change. However, its reduction is an essential step towards ending ecological abuse and live within the
limits and means provided by our planet [4]. Companies are now improving communication with
consumers, showing a desire to reduce GHG emissions along the value chain. The fashion industry also
should provide sustainable alternatives and raise awareness of environmental problems [5] [6] [2].
The sericulture is an agroindustrial activity that comprises three phases: the agricultural cultivation of
mulberry (Morus sp.), which is the essential food for the development of the silkworm (Bombyx mori), the
zootechnical insect and industrial processing of cocoons for silk reeling [7].
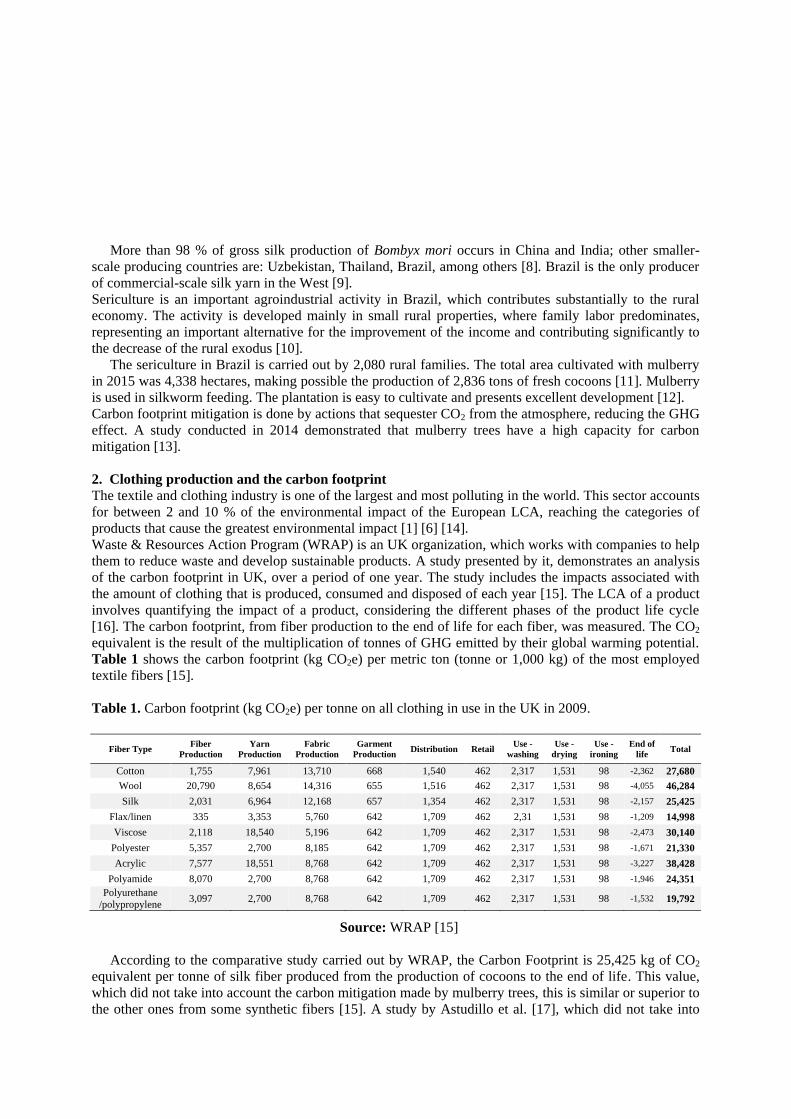
More than 98 % of gross silk production of Bombyx mori occurs in China and India; other smaller-
scale producing countries are: Uzbekistan, Thailand, Brazil, among others [8]. Brazil is the only producer
of commercial-scale silk yarn in the West [9].
Sericulture is an important agroindustrial activity in Brazil, which contributes substantially to the rural
economy. The activity is developed mainly in small rural properties, where family labor predominates,
representing an important alternative for the improvement of the income and contributing significantly to
the decrease of the rural exodus [10].
The sericulture in Brazil is carried out by 2,080 rural families. The total area cultivated with mulberry
in 2015 was 4,338 hectares, making possible the production of 2,836 tons of fresh cocoons [11]. Mulberry
is used in silkworm feeding. The plantation is easy to cultivate and presents excellent development [12].
Carbon footprint mitigation is done by actions that sequester CO2 from the atmosphere, reducing the GHG
effect. A study conducted in 2014 demonstrated that mulberry trees have a high capacity for carbon
mitigation [13].
2. Clothing production and the carbon footprint
The textile and clothing industry is one of the largest and most polluting in the world. This sector accounts
for between 2 and 10 % of the environmental impact of the European LCA, reaching the categories of
products that cause the greatest environmental impact [1] [6] [14].
Waste & Resources Action Program (WRAP) is an UK organization, which works with companies to help
them to reduce waste and develop sustainable products. A study presented by it, demonstrates an analysis
of the carbon footprint in UK, over a period of one year. The study includes the impacts associated with
the amount of clothing that is produced, consumed and disposed of each year [15]. The LCA of a product
involves quantifying the impact of a product, considering the different phases of the product life cycle
[16]. The carbon footprint, from fiber production to the end of life for each fiber, was measured. The CO2
equivalent is the result of the multiplication of tonnes of GHG emitted by their global warming potential.
Table 1 shows the carbon footprint (kg CO2e) per metric ton (tonne or 1,000 kg) of the most employed
textile fibers [15].
Table 1. Carbon footprint (kg CO2e) per tonne on all clothing in use in the UK in 2009.
Fiber Type Fiber
Production
Yarn
Production
Fabric
Production
Garment
Production Distribution Retail
Use -
washing
Use -
drying
Use -
ironing
End of
life Total
Cotton 1,755 7,961 13,710 668 1,540 462 2,317 1,531 98 -2,362 27,680
Wool 20,790 8,654 14,316 655 1,516 462 2,317 1,531 98 -4,055 46,284
Silk 2,031 6,964 12,168 657 1,354 462 2,317 1,531 98 -2,157 25,425
Flax/linen 335 3,353 5,760 642 1,709 462 2,31 1,531 98 -1,209 14,998
Viscose 2,118 18,540 5,196 642 1,709 462 2,317 1,531 98 -2,473 30,140
Polyester 5,357 2,700 8,185 642 1,709 462 2,317 1,531 98 -1,671 21,330
Acrylic 7,577 18,551 8,768 642 1,709 462 2,317 1,531 98 -3,227 38,428
Polyamide 8,070 2,700 8,768 642 1,709 462 2,317 1,531 98 -1,946 24,351
Polyurethane
/polypropylene 3,097 2,700 8,768 642 1,709 462 2,317 1,531 98 -1,532 19,792
Source: WRAP [15]
According to the comparative study carried out by WRAP, the Carbon Footprint is 25,425 kg of CO2
equivalent per tonne of silk fiber produced from the production of cocoons to the end of life. This value,
which did not take into account the carbon mitigation made by mulberry trees, this is similar or superior to
the other ones from some synthetic fibers [15]. A study by Astudillo et al. [17], which did not take into
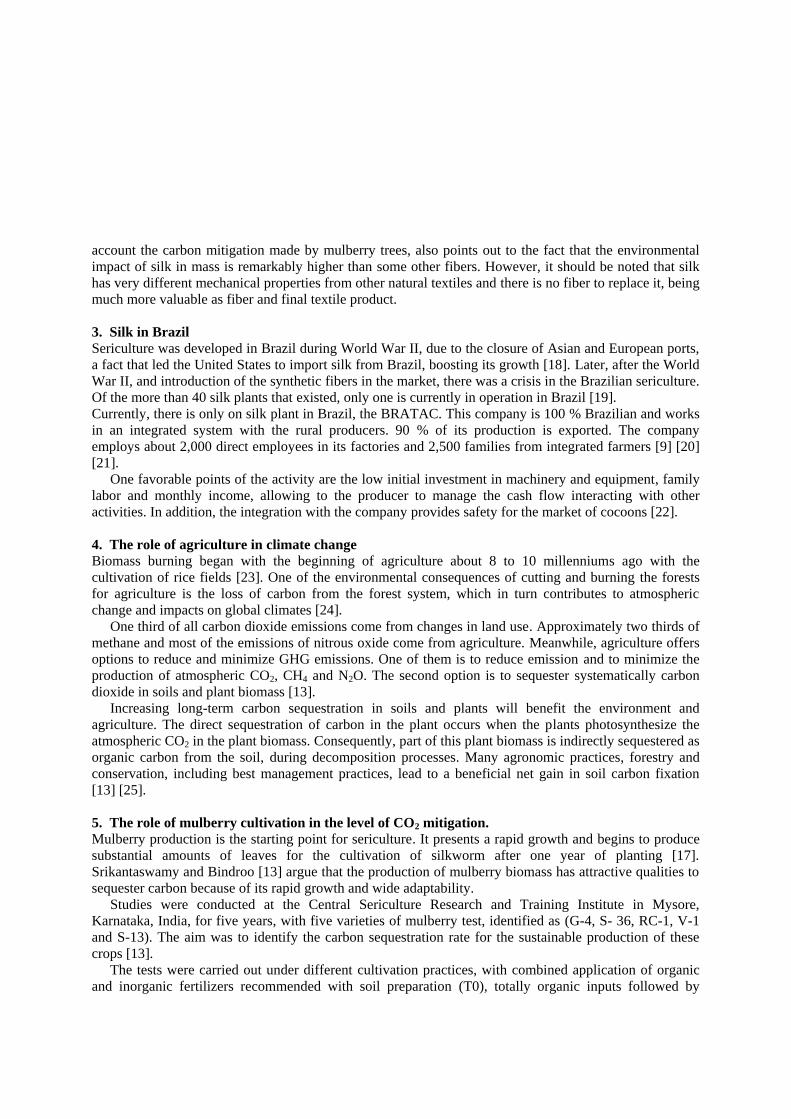
account the carbon mitigation made by mulberry trees, also points out to the fact that the environmental
impact of silk in mass is remarkably higher than some other fibers. However, it should be noted that silk
has very different mechanical properties from other natural textiles and there is no fiber to replace it, being
much more valuable as fiber and final textile product.
3. Silk in Brazil
Sericulture was developed in Brazil during World War II, due to the closure of Asian and European ports,
a fact that led the United States to import silk from Brazil, boosting its growth [18]. Later, after the World
War II, and introduction of the synthetic fibers in the market, there was a crisis in the Brazilian sericulture.
Of the more than 40 silk plants that existed, only one is currently in operation in Brazil [19].
Currently, there is only on silk plant in Brazil, the BRATAC. This company is 100 % Brazilian and works
in an integrated system with the rural producers. 90 % of its production is exported. The company
employs about 2,000 direct employees in its factories and 2,500 families from integrated farmers [9] [20]
[21].
One favorable points of the activity are the low initial investment in machinery and equipment, family
labor and monthly income, allowing to the producer to manage the cash flow interacting with other
activities. In addition, the integration with the company provides safety for the market of cocoons [22].
4. The role of agriculture in climate change
Biomass burning began with the beginning of agriculture about 8 to 10 millenniums ago with the
cultivation of rice fields [23]. One of the environmental consequences of cutting and burning the forests
for agriculture is the loss of carbon from the forest system, which in turn contributes to atmospheric
change and impacts on global climates [24].
One third of all carbon dioxide emissions come from changes in land use. Approximately two thirds of
methane and most of the emissions of nitrous oxide come from agriculture. Meanwhile, agriculture offers
options to reduce and minimize GHG emissions. One of them is to reduce emission and to minimize the
production of atmospheric CO2, CH4 and N2O. The second option is to sequester systematically carbon
dioxide in soils and plant biomass [13].
Increasing long-term carbon sequestration in soils and plants will benefit the environment and
agriculture. The direct sequestration of carbon in the plant occurs when the plants photosynthesize the
atmospheric CO2 in the plant biomass. Consequently, part of this plant biomass is indirectly sequestered as
organic carbon from the soil, during decomposition processes. Many agronomic practices, forestry and
conservation, including best management practices, lead to a beneficial net gain in soil carbon fixation
[13] [25].
5. The role of mulberry cultivation in the level of CO2 mitigation.
Mulberry production is the starting point for sericulture. It presents a rapid growth and begins to produce
substantial amounts of leaves for the cultivation of silkworm after one year of planting [17].
Srikantaswamy and Bindroo [13] argue that the production of mulberry biomass has attractive qualities to
sequester carbon because of its rapid growth and wide adaptability.
Studies were conducted at the Central Sericulture Research and Training Institute in Mysore,
Karnataka, India, for five years, with five varieties of mulberry test, identified as (G-4, S- 36, RC-1, V-1
and S-13). The aim was to identify the carbon sequestration rate for the sustainable production of these
crops [13].
The tests were carried out under different cultivation practices, with combined application of organic
and inorganic fertilizers recommended with soil preparation (T0), totally organic inputs followed by
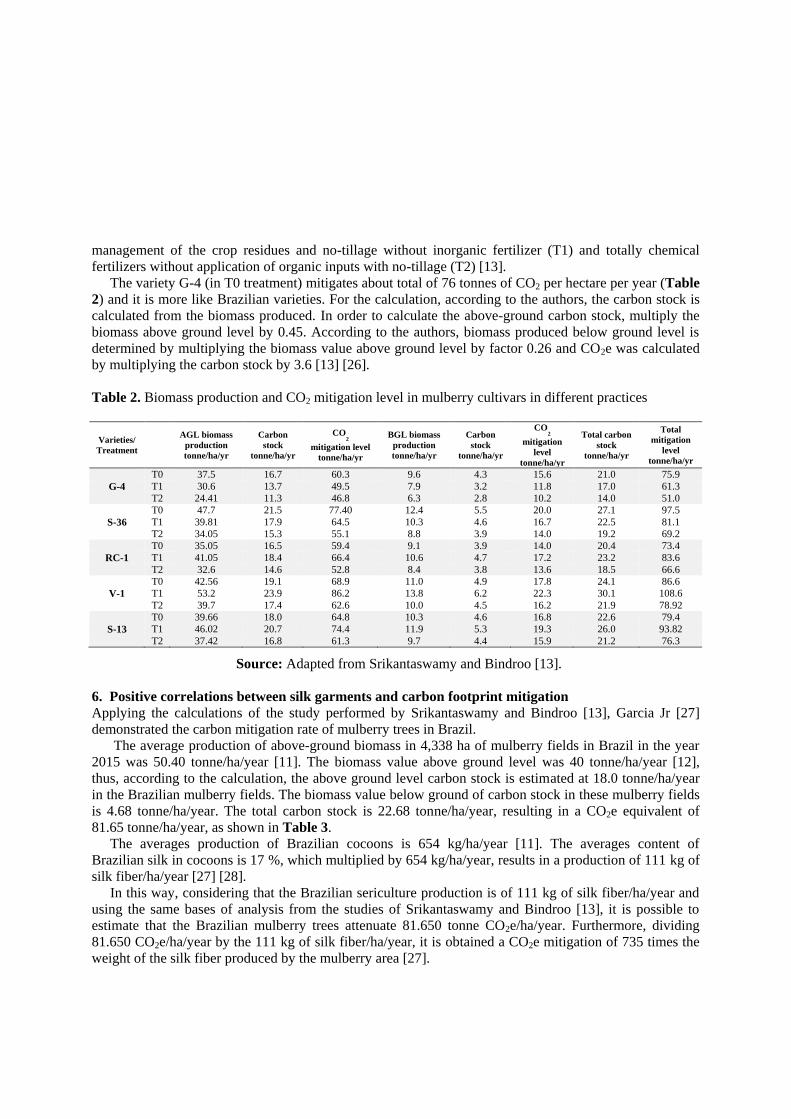
management of the crop residues and no-tillage without inorganic fertilizer (T1) and totally chemical
fertilizers without application of organic inputs with no-tillage (T2) [13].
The variety G-4 (in T0 treatment) mitigates about total of 76 tonnes of CO2 per hectare per year (Table
2) and it is more like Brazilian varieties. For the calculation, according to the authors, the carbon stock is
calculated from the biomass produced. In order to calculate the above-ground carbon stock, multiply the
biomass above ground level by 0.45. According to the authors, biomass produced below ground level is
determined by multiplying the biomass value above ground level by factor 0.26 and CO2e was calculated
by multiplying the carbon stock by 3.6 [13] [26].
Table 2. Biomass production and CO2 mitigation level in mulberry cultivars in different practices
Varieties/
Treatment
AGL biomass
production
tonne/ha/yr
Carbon
stock
tonne/ha/yr
CO2
mitigation level
tonne/ha/yr
BGL biomass
production
tonne/ha/yr
Carbon
stock
tonne/ha/yr
CO2
mitigation
level
tonne/ha/yr
Total carbon
stock
tonne/ha/yr
Total
mitigation
level
tonne/ha/yr
T0 37.5 16.7 60.3 9.6 4.3 15.6 21.0 75.9
G-4 T1 30.6 13.7 49.5 7.9 3.2 11.8 17.0 61.3
T2 24.41 11.3 46.8 6.3 2.8 10.2 14.0 51.0
T0 47.7 21.5 77.40 12.4 5.5 20.0 27.1 97.5
S-36 T1 39.81 17.9 64.5 10.3 4.6 16.7 22.5 81.1
T2 34.05 15.3 55.1 8.8 3.9 14.0 19.2 69.2
T0 35.05 16.5 59.4 9.1 3.9 14.0 20.4 73.4
RC-1 T1 41.05 18.4 66.4 10.6 4.7 17.2 23.2 83.6
T2 32.6 14.6 52.8 8.4 3.8 13.6 18.5 66.6
T0 42.56 19.1 68.9 11.0 4.9 17.8 24.1 86.6
V-1 T1 53.2 23.9 86.2 13.8 6.2 22.3 30.1 108.6
T2 39.7 17.4 62.6 10.0 4.5 16.2 21.9 78.92
T0 39.66 18.0 64.8 10.3 4.6 16.8 22.6 79.4
S-13 T1 46.02 20.7 74.4 11.9 5.3 19.3 26.0 93.82
T2 37.42 16.8 61.3 9.7 4.4 15.9 21.2 76.3
Source: Adapted from Srikantaswamy and Bindroo [13].
6. Positive correlations between silk garments and carbon footprint mitigation
Applying the calculations of the study performed by Srikantaswamy and Bindroo [13], Garcia Jr [27]
demonstrated the carbon mitigation rate of mulberry trees in Brazil.
The average production of above-ground biomass in 4,338 ha of mulberry fields in Brazil in the year
2015 was 50.40 tonne/ha/year [11]. The biomass value above ground level was 40 tonne/ha/year [12],
thus, according to the calculation, the above ground level carbon stock is estimated at 18.0 tonne/ha/year
in the Brazilian mulberry fields. The biomass value below ground of carbon stock in these mulberry fields
is 4.68 tonne/ha/year. The total carbon stock is 22.68 tonne/ha/year, resulting in a CO2e equivalent of
81.65 tonne/ha/year, as shown in Table 3.
The averages production of Brazilian cocoons is 654 kg/ha/year [11]. The averages content of
Brazilian silk in cocoons is 17 %, which multiplied by 654 kg/ha/year, results in a production of 111 kg of
silk fiber/ha/year [27] [28].
In this way, considering that the Brazilian sericulture production is of 111 kg of silk fiber/ha/year and
using the same bases of analysis from the studies of Srikantaswamy and Bindroo [13], it is possible to
estimate that the Brazilian mulberry trees attenuate 81.650 tonne CO2e/ha/year. Furthermore, dividing
81.650 CO2e/ha/year by the 111 kg of silk fiber/ha/year, it is obtained a CO2e mitigation of 735 times the
weight of the silk fiber produced by the mulberry area [27].
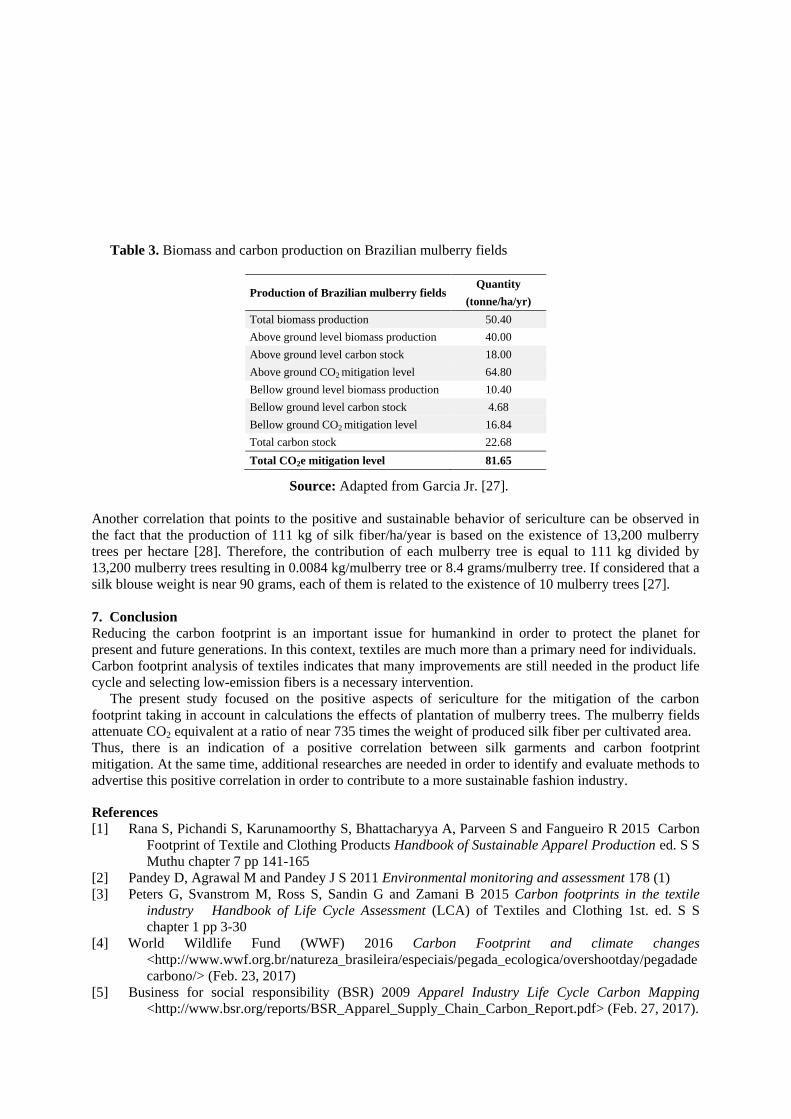
Table 3. Biomass and carbon production on Brazilian mulberry fields
Production of Brazilian mulberry fields Quantity
(tonne/ha/yr)
Total biomass production 50.40
Above ground level biomass production 40.00
Above ground level carbon stock 18.00
Above ground CO2 mitigation level 64.80
Bellow ground level biomass production 10.40
Bellow ground level carbon stock 4.68
Bellow ground CO2 mitigation level 16.84
Total carbon stock 22.68
Total CO2e mitigation level 81.65
Source: Adapted from Garcia Jr. [27].
Another correlation that points to the positive and sustainable behavior of sericulture can be observed in
the fact that the production of 111 kg of silk fiber/ha/year is based on the existence of 13,200 mulberry
trees per hectare [28]. Therefore, the contribution of each mulberry tree is equal to 111 kg divided by
13,200 mulberry trees resulting in 0.0084 kg/mulberry tree or 8.4 grams/mulberry tree. If considered that a
silk blouse weight is near 90 grams, each of them is related to the existence of 10 mulberry trees [27].
7. Conclusion
Reducing the carbon footprint is an important issue for humankind in order to protect the planet for
present and future generations. In this context, textiles are much more than a primary need for individuals.
Carbon footprint analysis of textiles indicates that many improvements are still needed in the product life
cycle and selecting low-emission fibers is a necessary intervention.
The present study focused on the positive aspects of sericulture for the mitigation of the carbon
footprint taking in account in calculations the effects of plantation of mulberry trees. The mulberry fields
attenuate CO2 equivalent at a ratio of near 735 times the weight of produced silk fiber per cultivated area.
Thus, there is an indication of a positive correlation between silk garments and carbon footprint
mitigation. At the same time, additional researches are needed in order to identify and evaluate methods to
advertise this positive correlation in order to contribute to a more sustainable fashion industry.
References
[1] Rana S, Pichandi S, Karunamoorthy S, Bhattacharyya A, Parveen S and Fangueiro R 2015 Carbon
Footprint of Textile and Clothing Products Handbook of Sustainable Apparel Production ed. S S
Muthu chapter 7 pp 141-165
[2] Pandey D, Agrawal M and Pandey J S 2011 Environmental monitoring and assessment 178 (1)
[3] Peters G, Svanstrom M, Ross S, Sandin G and Zamani B 2015 Carbon footprints in the textile
industry Handbook of Life Cycle Assessment (LCA) of Textiles and Clothing 1st. ed. S S
chapter 1 pp 3-30
[4] World Wildlife Fund (WWF) 2016 Carbon Footprint and climate changes
<http://www.wwf.org.br/natureza_brasileira/especiais/pegada_ecologica/overshootday/pegadade
carbono/> (Feb. 23, 2017)
[5] Business for social responsibility (BSR) 2009 Apparel Industry Life Cycle Carbon Mapping
<http://www.bsr.org/reports/BSR_Apparel_Supply_Chain_Carbon_Report.pdf> (Feb. 27, 2017).
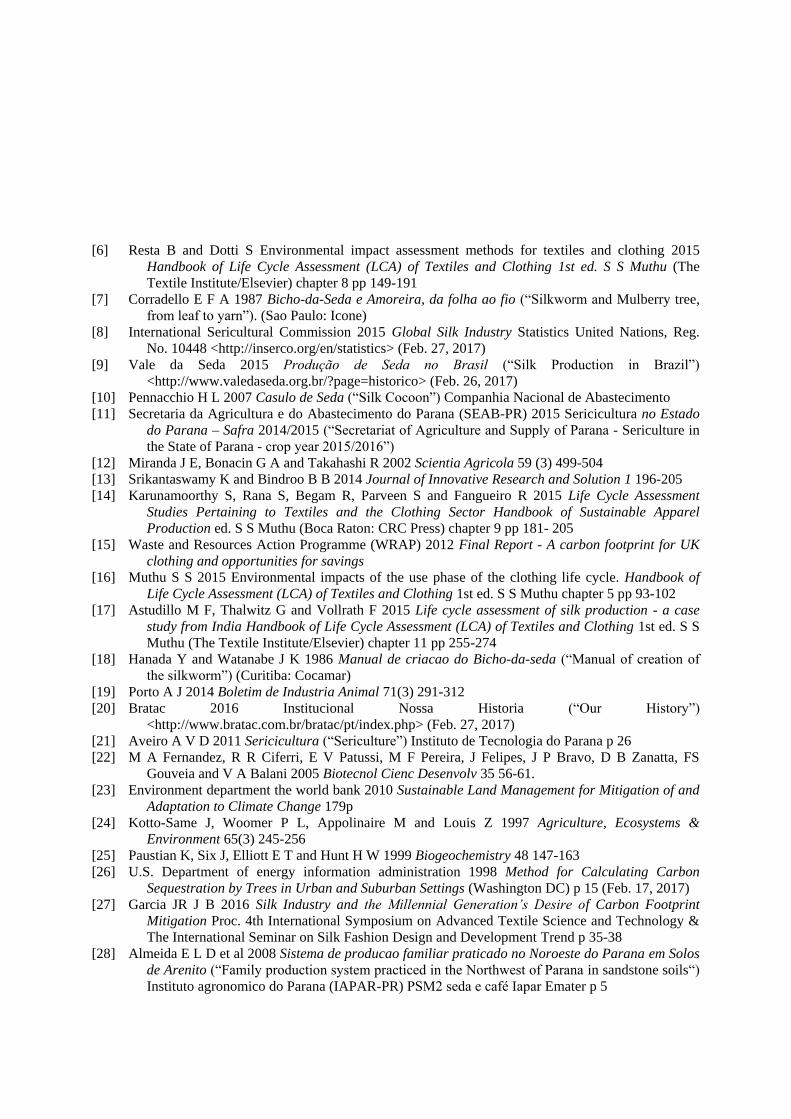
[6] Resta B and Dotti S Environmental impact assessment methods for textiles and clothing 2015
Handbook of Life Cycle Assessment (LCA) of Textiles and Clothing 1st ed. S S Muthu (The
Textile Institute/Elsevier) chapter 8 pp 149-191
[7] Corradello E F A 1987 Bicho-da-Seda e Amoreira, da folha ao fio (“Silkworm and Mulberry tree,
from leaf to yarn”). (Sao Paulo: Icone)
[8] International Sericultural Commission 2015 Global Silk Industry Statistics United Nations, Reg.
No. 10448 <http://inserco.org/en/statistics> (Feb. 27, 2017)
[9] Vale da Seda 2015 Produção de Seda no Brasil (“Silk Production in Brazil”)
<http://www.valedaseda.org.br/?page=historico> (Feb. 26, 2017)
[10] Pennacchio H L 2007 Casulo de Seda (“Silk Cocoon”) Companhia Nacional de Abastecimento
[11] Secretaria da Agricultura e do Abastecimento do Parana (SEAB-PR) 2015 Sericicultura no Estado
do Parana – Safra 2014/2015 (“Secretariat of Agriculture and Supply of Parana - Sericulture in
the State of Parana - crop year 2015/2016”)
[12] Miranda J E, Bonacin G A and Takahashi R 2002 Scientia Agricola 59 (3) 499-504
[13] Srikantaswamy K and Bindroo B B 2014 Journal of Innovative Research and Solution 1 196-205
[14] Karunamoorthy S, Rana S, Begam R, Parveen S and Fangueiro R 2015 Life Cycle Assessment
Studies Pertaining to Textiles and the Clothing Sector Handbook of Sustainable Apparel
Production ed. S S Muthu (Boca Raton: CRC Press) chapter 9 pp 181- 205
[15] Waste and Resources Action Programme (WRAP) 2012 Final Report - A carbon footprint for UK
clothing and opportunities for savings
[16] Muthu S S 2015 Environmental impacts of the use phase of the clothing life cycle. Handbook of
Life Cycle Assessment (LCA) of Textiles and Clothing 1st ed. S S Muthu chapter 5 pp 93-102
[17] Astudillo M F, Thalwitz G and Vollrath F 2015 Life cycle assessment of silk production - a case
study from India Handbook of Life Cycle Assessment (LCA) of Textiles and Clothing 1st ed. S S
Muthu (The Textile Institute/Elsevier) chapter 11 pp 255-274
[18] Hanada Y and Watanabe J K 1986 Manual de criacao do Bicho-da-seda (“Manual of creation of
the silkworm”) (Curitiba: Cocamar)
[19] Porto A J 2014 Boletim de Industria Animal 71(3) 291-312
[20] Bratac 2016 Institucional Nossa Historia (“Our History”)
<http://www.bratac.com.br/bratac/pt/index.php> (Feb. 27, 2017)
[21] Aveiro A V D 2011 Sericicultura (“Sericulture”) Instituto de Tecnologia do Parana p 26
[22] M A Fernandez, R R Ciferri, E V Patussi, M F Pereira, J Felipes, J P Bravo, D B Zanatta, FS
Gouveia and V A Balani 2005 Biotecnol Cienc Desenvolv 35 56-61.
[23] Environment department the world bank 2010 Sustainable Land Management for Mitigation of and
Adaptation to Climate Change 179p
[24] Kotto-Same J, Woomer P L, Appolinaire M and Louis Z 1997 Agriculture, Ecosystems &
Environment 65(3) 245-256
[25] Paustian K, Six J, Elliott E T and Hunt H W 1999 Biogeochemistry 48 147-163
[26] U.S. Department of energy information administration 1998 Method for Calculating Carbon
Sequestration by Trees in Urban and Suburban Settings (Washington DC) p 15 (Feb. 17, 2017)
[27] Garcia JR J B 2016 Silk Industry and the Millennial Generation’s Desire of Carbon Footprint
Mitigation Proc. 4th International Symposium on Advanced Textile Science and Technology &
The International Seminar on Silk Fashion Design and Development Trend p 35-38
[28] Almeida E L D et al 2008 Sistema de producao familiar praticado no Noroeste do Parana em Solos
de Arenito (“Family production system practiced in the Northwest of Parana in sandstone soils“)
Instituto agronomico do Parana (IAPAR-PR) PSM2 seda e café Iapar Emater p 5

Hemp Fiber for Furnishing Applications
D D Lamberti1 and A K Sarkar2
1Design and Merchandising, Colorado State University, Fort Collins, CO 80523, USA2Textile Development and Marketing, Fashion Institute of Technology,State University of New York, New York, NY 10001, USA
E-mail: [email protected]
Abstract. The primary objective of the study was to compare and contrast the performancecharacteristics of 100% woven cotton and 100% woven hemp fabrics for furnishing applications.Results obtained showed no difference between cotton and hemp fabrics in terms of colorfastness tocrocking; oily stain release; flammability; tearing strength; breaking strength and elongation. Forcolorfastness to light, the hemp fabrics in this study exhibited noticeable color change. With regardto colorfastness to water, hemp fabrics performed satisfactorily indicating that steam cleaning ofhemp furnishing fabrics in this study is not a concern. For abrasion resistance, the performance ofhemp fabrics was slightly less than the cotton fabrics in the study. In conclusion, based on testresults and benchmark comparisons, this study indicates that hemp is a viable fiber for use infurnishing applications.
1. IntroductionRefined resources such as petroleum, which are currently used for manufacturing synthetic fibers arerapidly depleting. It is estimated that the supply of fossil fuels such as crude oil are only expected to lastfor another 50-60 years, with world conventional oil production peaking between 2021 and 2112 [1].Moreover, manufacture of synthetic fibers is not a closed loop process meaning that by-products cannotbe processed back into the production cycle. During production of synthetic fibers such as nylon orpolyester, volatile monomers and solvents that contribute to water and air pollution are released into theatmosphere [2]. It is imperative, therefore, that professionals in the textile industry begin to consideralternative resources for raw material used for fiber. It is doubly crucial that while considering alternativeresources; sustainable, renewable and less polluting natural fibers be considered for uses hithertodominated by synthetic fibers.
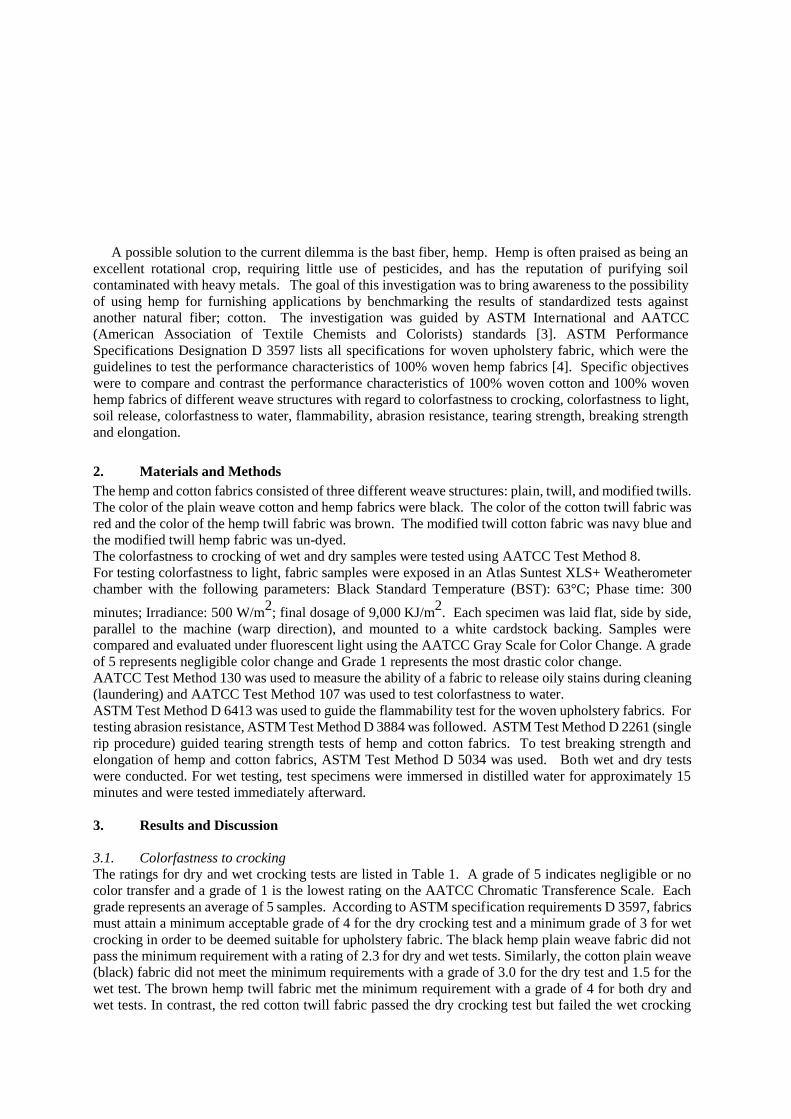
A possible solution to the current dilemma is the bast fiber, hemp. Hemp is often praised as being anexcellent rotational crop, requiring little use of pesticides, and has the reputation of purifying soilcontaminated with heavy metals. The goal of this investigation was to bring awareness to the possibilityof using hemp for furnishing applications by benchmarking the results of standardized tests againstanother natural fiber; cotton. The investigation was guided by ASTM International and AATCC(American Association of Textile Chemists and Colorists) standards [3]. ASTM PerformanceSpecifications Designation D 3597 lists all specifications for woven upholstery fabric, which were theguidelines to test the performance characteristics of 100% woven hemp fabrics [4]. Specific objectiveswere to compare and contrast the performance characteristics of 100% woven cotton and 100% wovenhemp fabrics of different weave structures with regard to colorfastness to crocking, colorfastness to light,soil release, colorfastness to water, flammability, abrasion resistance, tearing strength, breaking strengthand elongation.
2. Materials and MethodsThe hemp and cotton fabrics consisted of three different weave structures: plain, twill, and modified twills.The color of the plain weave cotton and hemp fabrics were black. The color of the cotton twill fabric wasred and the color of the hemp twill fabric was brown. The modified twill cotton fabric was navy blue andthe modified twill hemp fabric was un-dyed.The colorfastness to crocking of wet and dry samples were tested using AATCC Test Method 8.For testing colorfastness to light, fabric samples were exposed in an Atlas Suntest XLS+ Weatherometerchamber with the following parameters: Black Standard Temperature (BST): 63°C; Phase time: 300
minutes; Irradiance: 500 W/m2; final dosage of 9,000 KJ/m2. Each specimen was laid flat, side by side,parallel to the machine (warp direction), and mounted to a white cardstock backing. Samples werecompared and evaluated under fluorescent light using the AATCC Gray Scale for Color Change. A gradeof 5 represents negligible color change and Grade 1 represents the most drastic color change.AATCC Test Method 130 was used to measure the ability of a fabric to release oily stains during cleaning(laundering) and AATCC Test Method 107 was used to test colorfastness to water.ASTM Test Method D 6413 was used to guide the flammability test for the woven upholstery fabrics. Fortesting abrasion resistance, ASTM Test Method D 3884 was followed. ASTM Test Method D 2261 (singlerip procedure) guided tearing strength tests of hemp and cotton fabrics. To test breaking strength andelongation of hemp and cotton fabrics, ASTM Test Method D 5034 was used. Both wet and dry testswere conducted. For wet testing, test specimens were immersed in distilled water for approximately 15minutes and were tested immediately afterward.
3. Results and Discussion
3.1. Colorfastness to crockingThe ratings for dry and wet crocking tests are listed in Table 1. A grade of 5 indicates negligible or nocolor transfer and a grade of 1 is the lowest rating on the AATCC Chromatic Transference Scale. Eachgrade represents an average of 5 samples. According to ASTM specification requirements D 3597, fabricsmust attain a minimum acceptable grade of 4 for the dry crocking test and a minimum grade of 3 for wetcrocking in order to be deemed suitable for upholstery fabric. The black hemp plain weave fabric did notpass the minimum requirement with a rating of 2.3 for dry and wet tests. Similarly, the cotton plain weave(black) fabric did not meet the minimum requirements with a grade of 3.0 for the dry test and 1.5 for thewet test. The brown hemp twill fabric met the minimum requirement with a grade of 4 for both dry andwet tests. In contrast, the red cotton twill fabric passed the dry crocking test but failed the wet crocking
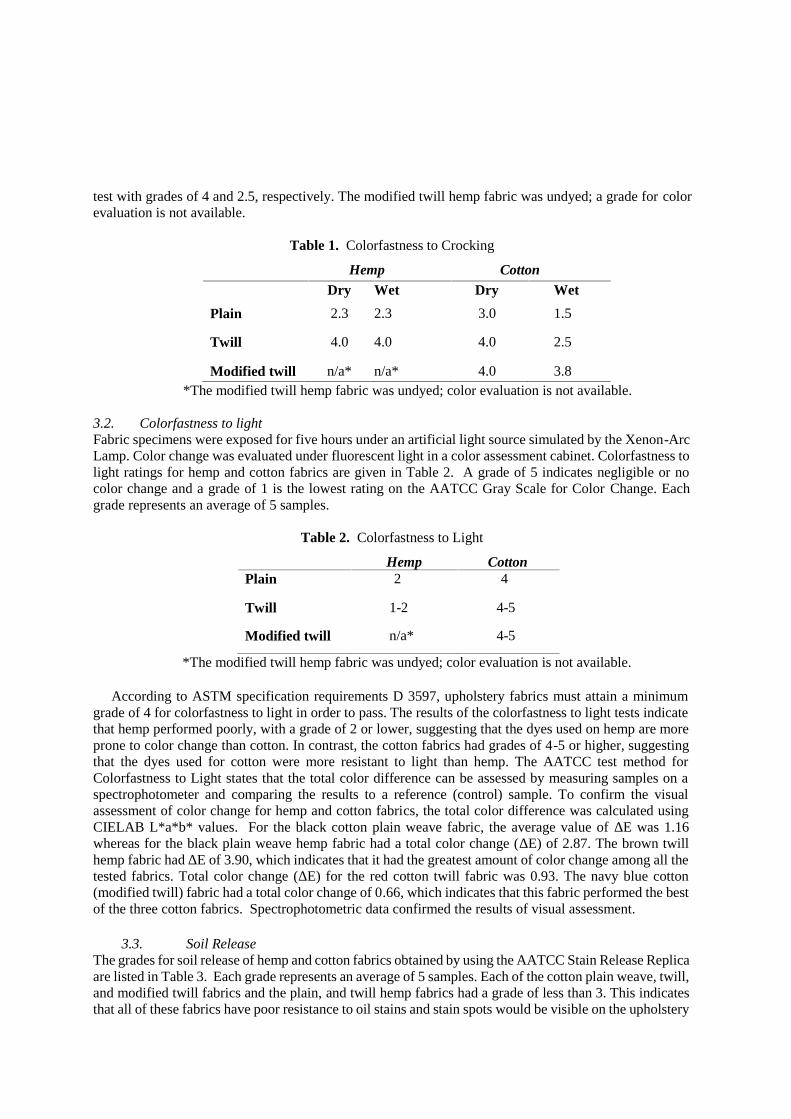
test with grades of 4 and 2.5, respectively. The modified twill hemp fabric was undyed; a grade for colorevaluation is not available.
Table 1. Colorfastness to Crocking
Hemp CottonDry Wet Dry Wet
Plain 2.3 2.3 3.0 1.5
Twill 4.0 4.0 4.0 2.5
Modified twill n/a* n/a* 4.0 3.8*The modified twill hemp fabric was undyed; color evaluation is not available.
3.2. Colorfastness to lightFabric specimens were exposed for five hours under an artificial light source simulated by the Xenon-ArcLamp. Color change was evaluated under fluorescent light in a color assessment cabinet. Colorfastness tolight ratings for hemp and cotton fabrics are given in Table 2. A grade of 5 indicates negligible or nocolor change and a grade of 1 is the lowest rating on the AATCC Gray Scale for Color Change. Eachgrade represents an average of 5 samples.
Table 2. Colorfastness to Light
Hemp CottonPlain 2 4
Twill 1-2 4-5
Modified twill n/a* 4-5
*The modified twill hemp fabric was undyed; color evaluation is not available.
According to ASTM specification requirements D 3597, upholstery fabrics must attain a minimumgrade of 4 for colorfastness to light in order to pass. The results of the colorfastness to light tests indicatethat hemp performed poorly, with a grade of 2 or lower, suggesting that the dyes used on hemp are moreprone to color change than cotton. In contrast, the cotton fabrics had grades of 4-5 or higher, suggestingthat the dyes used for cotton were more resistant to light than hemp. The AATCC test method forColorfastness to Light states that the total color difference can be assessed by measuring samples on aspectrophotometer and comparing the results to a reference (control) sample. To confirm the visualassessment of color change for hemp and cotton fabrics, the total color difference was calculated usingCIELAB L*a*b* values. For the black cotton plain weave fabric, the average value of ∆E was 1.16whereas for the black plain weave hemp fabric had a total color change (∆E) of 2.87. The brown twillhemp fabric had ∆E of 3.90, which indicates that it had the greatest amount of color change among all thetested fabrics. Total color change (∆E) for the red cotton twill fabric was 0.93. The navy blue cotton(modified twill) fabric had a total color change of 0.66, which indicates that this fabric performed the bestof the three cotton fabrics. Spectrophotometric data confirmed the results of visual assessment.
3.3. Soil ReleaseThe grades for soil release of hemp and cotton fabrics obtained by using the AATCC Stain Release Replicaare listed in Table 3. Each grade represents an average of 5 samples. Each of the cotton plain weave, twill,and modified twill fabrics and the plain, and twill hemp fabrics had a grade of less than 3. This indicatesthat all of these fabrics have poor resistance to oil stains and stain spots would be visible on the upholstery

even after laundering. Only the modified twill hemp fabric had a rating higher than 3 and displayed goodstain resistance.
Table 3. Soil Release: Oily Stain Release
Hemp CottonPlain 2.8 1.8
Twill 1.7 1.1
Modified twill 4.4 1.3
3.4. Colorfastness to waterFor colorfastness to water evaluation, hemp and cotton fabrics were immersed in water for 15 minutes,passed once through a laboratory wringer, and stacked between plastic plates onto the perspiration tester.They were placed into a drying oven for 14 hours. Multi-fiber samples containing wool, rayon, silk, nylon,cotton, acetate, and polyester yarns were attached to each sample during wetting and drying. Color transferwas evaluated using the Gray Scale for Staining. A grade of 5 represents negligible or no color transferand a grade of 1 is the most drastic color transfer. The grades reported in Table 4 are the average of 5samples. As shown in Table 4, the black hemp plain weave and brown hemp twill fabric had grades of 4and higher on the Gray Scale for Staining. In contrast, the cotton fabrics had lower grades, particularly thered cotton twill fabric. The greatest amount of staining for the red cotton twill fabric occurred on rayon,cotton, and silk. Similarly, the navy blue cotton (modified twill) fabric had grades of 3 for staining onrayon and a grade of 3- 4 and 3 for staining on cotton. The black cotton plain weave fabric had grades of4 or higher for staining on all fiber types with the exception of rayon, which received a grade of 3. Wool,acetate, and polyester were relatively unaffected by staining, with grades of 3-4 or higher for all hemp andcotton fabrics. It was duly noted that staining on all cotton fabrics, except for the red cotton twill, occurredin a spotted pattern as opposed to an even spread of color transfer.
Table 4. Colorfastness to Water
Wool Rayon Silk Nylon Cotton Acetate PolyesterHemp Plain 4 4-5 4-5 4 4 4-5 4
Twill 4-5 4-5 4 4-5 4-5 4-5 4Modifiedtwill n/a* n/a* n/a* n/a* n/a* n/a* n/a*
Cotton Plain
TwillModifiedtwill
4-5
3-4
4-5
3
1-2
3
4
2-3
4
4-5
3-4
4
4
1-2
3
4-5
4
4-5
5
3-4
4*The modified twill hemp fabric was undyed; color evaluation is not available.
3.5. FlammabilityFlammability of textiles refers to their burning behavior and particularly to the ease of ignition andcontinued burning after ignition. To compare the flame resistance of the hemp and cotton fabrics; theburn time, afterglow time and char length were determined by the vertical flame test method. Theaverage burn times of the hemp and cotton fabrics in the warp and filling directions are listed in Table
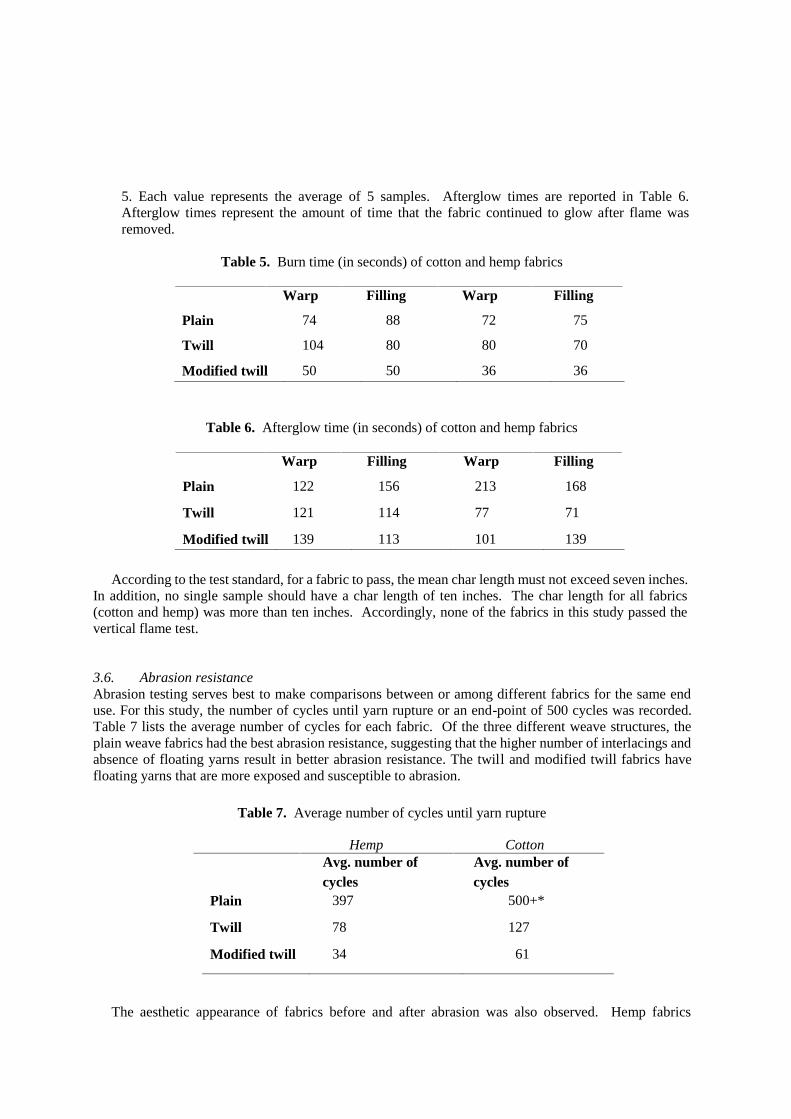
5. Each value represents the average of 5 samples. Afterglow times are reported in Table 6.Afterglow times represent the amount of time that the fabric continued to glow after flame wasremoved.
Table 5. Burn time (in seconds) of cotton and hemp fabrics
Warp Filling Warp Filling
Plain 74 88 72 75
Twill 104 80 80 70
Modified twill 50 50 36 36
Table 6. Afterglow time (in seconds) of cotton and hemp fabrics
Warp Filling Warp Filling
Plain 122 156 213 168
Twill 121 114 77 71
Modified twill 139 113 101 139
According to the test standard, for a fabric to pass, the mean char length must not exceed seven inches.In addition, no single sample should have a char length of ten inches. The char length for all fabrics(cotton and hemp) was more than ten inches. Accordingly, none of the fabrics in this study passed thevertical flame test.
3.6. Abrasion resistanceAbrasion testing serves best to make comparisons between or among different fabrics for the same enduse. For this study, the number of cycles until yarn rupture or an end-point of 500 cycles was recorded.Table 7 lists the average number of cycles for each fabric. Of the three different weave structures, theplain weave fabrics had the best abrasion resistance, suggesting that the higher number of interlacings andabsence of floating yarns result in better abrasion resistance. The twill and modified twill fabrics havefloating yarns that are more exposed and susceptible to abrasion.
Table 7. Average number of cycles until yarn rupture
Hemp CottonAvg. number of Avg. number ofcycles cycles
Plain 397 500+*
Twill 78 127
Modified twill 34 61
The aesthetic appearance of fabrics before and after abrasion was also observed. Hemp fabrics

exhibited highly noticeable frosting (color change due to flat localized abrasion) across all weavestructures. For cotton fabrics, the plain weave and modified twill fabrics exhibited frosting the mostwhereas the twill fabric had the least amount of frosting. In addition to frosting, pilling was observed onseveral fabrics. Pilling occurred on both the cotton and hemp plain weave fabrics and to a lesser extent onthe twill and modified twill fabrics.
3.7. Tearing strengthTo measure the tearing strength of hemp and cotton fabrics, the single rip procedure at a constant rate ofextension was used (ASTM D 2261). The results in Tables 8 and 9 represent the average of five samplesin the warp and filling direction in dry and wet conditions respectively.
Table 8. Dry tearing strength (lbf) of hemp and cotton fabrics
Hemp CottonWarp Filling Warp Filling
Plain 9.9 9 11.4 8.4
Twill 36.8 33.2 10.4 8.2
Modified twill 40.1 40.5 8.2 6.4
Table 9. Wet tearing strength (lbf) of hemp and cotton fabrics
Hemp CottonWarp Filling Warp Filling
Plain 16.1 14 16.6 13
Twill 50.6 29.4 11.6 7.4
Modified twill 42.4 31.4 12.9 8.2
As the data in the tables show, the hemp plain weave fabric had lower tearing strength in the dry testcompared to the cotton plain weave fabric. The hemp twill and hemp modified twill fabric had highertearing strength than the cotton twill and modified twill fabric in both directions for both dry and wet tests.To illuminate the results more, the GLM procedure for the least square means was done at a significancelevel of 0.05. The two-way interaction between fiber and structure did not show a significant differencebetween hemp and cotton plain weave fabrics with a p-value of 0.97. However, there was a significantstatistical difference between the hemp and cotton twill fabrics and hemp and cotton modified twill fabricswith p-values < 0.0001. However, since the minimum requirement for tearing strength of upholstery fabricis 6 lbf, all fabrics in this study met the specification requirement and are acceptable for use in upholstery.
3.8. Breaking strength and elongationFor breaking strength tests, the average breaking force of five specimens for each weave structure of hempand cotton was calculated. Results are reported in Tables 10 and 11. These values indicate the maximumbreaking force exerted on the specimen. Results from breaking tests show that warp yarns had a higherbreaking strength than filling yarns. In addition, it was also confirmed that for cellulosic fabrics thebreaking strength of wet fabrics were greater than dry fabrics.
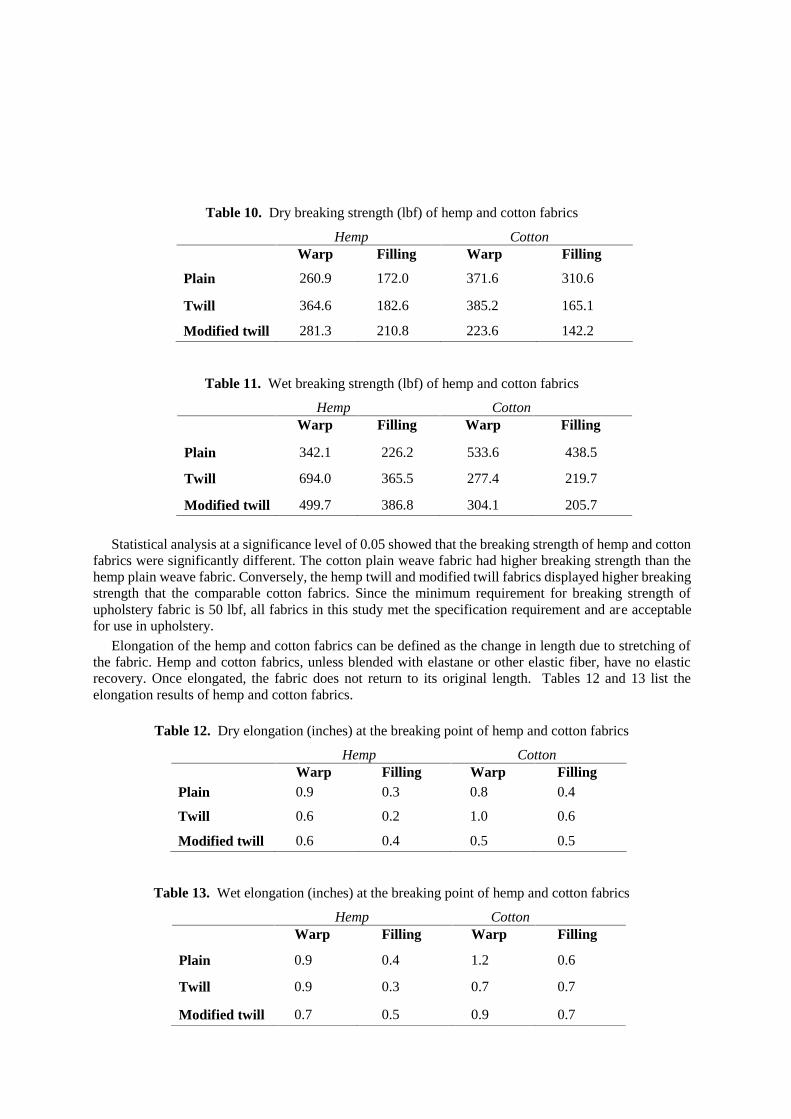
Table 10. Dry breaking strength (lbf) of hemp and cotton fabrics
Hemp CottonWarp Filling Warp Filling
Plain 260.9 172.0 371.6 310.6
Twill 364.6 182.6 385.2 165.1
Modified twill 281.3 210.8 223.6 142.2
Table 11. Wet breaking strength (lbf) of hemp and cotton fabrics
Hemp CottonWarp Filling Warp Filling
Plain 342.1 226.2 533.6 438.5
Twill 694.0 365.5 277.4 219.7
Modified twill 499.7 386.8 304.1 205.7
Statistical analysis at a significance level of 0.05 showed that the breaking strength of hemp and cottonfabrics were significantly different. The cotton plain weave fabric had higher breaking strength than thehemp plain weave fabric. Conversely, the hemp twill and modified twill fabrics displayed higher breakingstrength that the comparable cotton fabrics. Since the minimum requirement for breaking strength ofupholstery fabric is 50 lbf, all fabrics in this study met the specification requirement and are acceptablefor use in upholstery.
Elongation of the hemp and cotton fabrics can be defined as the change in length due to stretching ofthe fabric. Hemp and cotton fabrics, unless blended with elastane or other elastic fiber, have no elasticrecovery. Once elongated, the fabric does not return to its original length. Tables 12 and 13 list theelongation results of hemp and cotton fabrics.
Table 12. Dry elongation (inches) at the breaking point of hemp and cotton fabrics
Hemp CottonWarp Filling Warp Filling
Plain 0.9 0.3 0.8 0.4
Twill 0.6 0.2 1.0 0.6
Modified twill 0.6 0.4 0.5 0.5
Table 13. Wet elongation (inches) at the breaking point of hemp and cotton fabrics
Hemp CottonWarp Filling Warp Filling
Plain 0.9 0.4 1.2 0.6
Twill 0.9 0.3 0.7 0.7
Modified twill 0.7 0.5 0.9 0.7

Statistical analysis at a significance level of 0.05 indicated that the amount of elongation between hempplain weave and cotton plain weave fabrics was not significantly different (p-value = 0.11). There was asignificant difference (p-value = 0.003) in elongation between the hemp twill and cotton twill fabrics.Elongation of the hemp modified twill and cotton modified twill fabrics were not significantly differentwith a p-value of 0.10. There is no minimum or maximum elongation requirement for upholstery fabricaccording to ASTM performance specifications.
4. Results and DiscussionBased on the data obtained, it is concluded that the colorfastness to crocking was satisfactory in the caseof both the hemp and cotton twill fabrics but unsatisfactory for the plain weave fabrics. The results fromdry and wet crocking tests are influenced by the amount of dye penetration, proper selection of dyestuffs,and finishes present on the fabric.
Based on the total color difference (∆E) values, the hemp fabrics had the greatest amount of colorchange on exposure to light. The results suggest that the use of hemp in home furnishings may be limitedto indoor upholstery applications. Typically, indoor home furnishings are not exposed to a great amountof sunlight. However, in cases where hemp-upholstered furniture sits near an uncovered window, findingssuggest that noticeable color change may occur within a short period of time. For indoor hemp-upholstered furniture that will be exposed to sunlight for prolonged periods, it is suggested that a treatmentbe applied that will provide resistance to color change caused by light.Visual comparisons between specimens for oily stain release are subjective in nature. It was found thathemp fabrics had slightly higher grades than the cotton fabrics, particularly the modified twill and theplain weave fabrics. Cotton fabrics had grades of less than 2, which indicate poor stain removal comparedto the hemp fabrics. The results from the oily stain release test suggest that none of the hemp and cottonfabrics had a soil or a stain release finish applied to them. Although the soil release test is not required fordetermining suitability for upholstery fabric, it demonstrates a fabric’s propensity for staining due to oilysubstances. It is possible that the depth of color or lightness of the sample influenced higher grades for thehemp plain weave and hemp modified twill fabrics. Upholstered furniture serves as seating for everydayuse or social gatherings, which can lead to incidence of spilled food or beverage containing oil or fattysubstances. In this case, to prevent oil staining, a soil release finish should be applied to hemp- upholsteredfurniture in high-traffic areas.
According to AATCC Test Method 107, the colorfastness to water test measures the resistance to waterof dyed, printed, or other colored textile yarns and fabrics. As a whole, the hemp fabrics that were testedperformed well, while the cotton fabrics were graded lower and failed to pass the ASTM specificationrequirements for upholstery fabric. The multi-fiber sample exhibited the greatest amount of stainingagainst the cotton fabrics. The hemp fabrics had negligible staining on the multi-fiber sample whenexposed to water at 100°F, which indicates good colorfastness to water. The colorfastness to water testindicates how resistant a fabric is to cleaning. Dye loss and color transfer may be an issue when upholsterysteam cleaners are used.All hemp and cotton fabrics tested failed the flame resistance test by exceeding a maximum char lengthof 10 inches. The ease of ignition for hemp and cotton fabrics suggests that flame spread can be severe.This poses a serious threat of injury incurred by victims of an upholstery-related fire. Generally, fire isunpredictable and the flammability of upholstery fabric can be affected by other factors such as textileitems in the immediate surrounding area. The test results indicate that both cotton and hemp fabrics havepoor flame resistance without a proper flame resistant or flame retardant finish. The high amount of smokeand afterglow time indicates the hazard that untreated hemp and cotton fabrics pose when used forupholstery fabric.
The abrasion resistance of a fabric is subject to various factors, such as fiber content, yarn size, yarntwist, fabric construction, fabric count, fabric thickness, and weight. Abrasion is a crucial measure ofdurability of upholstery fabric as well as a factor in consumer satisfaction. If the development of holes,pilling, or frosting occurs as a result of abrasion in actual wear, the consumer is likely to be dissatisfiedwith a furniture item upholstered in that particular fabric. The number of cycles until yarn rupture is a

subjective evaluation. However, since cotton lasted through a much higher number of cycles in all threedifferent weave structures, it can be suggested that cotton has better abrasion resistance than hemp amongthe fabrics investigated in this study.
The tearing strength of upholstery fabric gauges how well the upholstery fabric behaves under stress,for example when seated on or when pulled at the seam. There was a not a significant difference in tearingstrength between wet and dry tests. Additionally, all fabrics were acceptable according to ASTMspecifications. It is also concluded that a hemp fabric with a twill or modified twill weave structure wouldbe more ideal for upholstery use since their tearing strength values were significantly higher than plainweave fabrics.
There was no significant difference between hemp and cotton in terms of breaking strength. All thefabrics met the minimum ASTM specification requirement for breaking strength of upholstery fabric. Itis further noted that twill or modified twill fabrics are more suitable for furniture applications. Also, bothhemp and cotton fabrics have poor elastic recovery, meaning when they are stretched, they do not returnto their original length or shape. Aesthetically, this can be problematic if upholstery on furniture becomesloose and stretched out due to stress on the fabric over time.
References[1] Blackburn R S 2005 Biodegradable and Sustainable fibres (Cambridge, U.K.: Woodhead
Publishing Ltd)[2] Claudio L 2007 Environmental Health Perspectives 115 448-454[3] American Association of Textile Chemists and Colorists 2009 AATCC Technical Manual
(Research Triangle Park, North Carolina, USA: AATCC)[4] ASTM International 2009 ASTM D3597, Standard Performance Specification for Woven
Upholstery Fabrics (West Conshohocken, Pennsylvania, USA: ASTM International)
Fashion garment manufacturing – FGM and cyclabilitytheory
F D Mendes1 and M C L dos Santos 2
1Universidade de São Paulo, EACH, Têxtil e Moda, Rua Arlindo Béttio, 1000 - JardimKeralux, São Paulo - SP, 03828-000, Brasil2Universidade de São Paulo, FAU, Departamento de Projeto, R. do Lago, 876 -Butantã, São Paulo - SP, 03178-200, Brasil
E-mail: [email protected]
Abstract. This article, derived from an ongoing research, presents the possibilities of reducingthe inappropriate disposal of textile residues generated by the fabric cutting sector of theFashion Garment Manufacturing (FGM). The raw material used is very varied, resulting in alarge number of productive processes. FGM produces clothing that has as its main features ashort life cycle, a high rate of diversification and differentiation, and small production batches,resulting in few similar parts. The production process is differentiated according to thecharacteristics of the fabric and the look of the garment. During the production process, at least10% of textile waste is generated during the cutting process, which is constantly discarded inan inadequate way. The Cyclability theory is researched aiming at the possibility of reductionin the generation of waste and elimination of inappropriate disposal. The case study presentsthe action research carried out in three small Brazilian companies to study the applicability ofthe Cyclability theory.
1. IntroductionThe Fashion Garment Manufacturing – FGM is the most sensitive link of the Textile Chain to plannedobsolescence, resulting in an acceleration of the process of development and production of short lifecycle items. The main raw materials of this product are fabrics composed of yarns with purecomposition or mixtures of natural, synthetic and artificial fibers. The main end product of the chain isin the fashion industry, clothing [1]. There are numerous types of waste generated in the textile chainbeing discarded, mainly without major concern with the impacts to the environment.
In this research there are theoretical methodological sources of different authors, among them [2]Yin and [3] Lakatos, who did not present actions in order to enable the execution of scientificresearch, data collection and information of a subject inserted in a little empirical environment studiedand documented. Case study and action research start from a qualitative research in which the "what","why" and "how" questions form the basis of research and study.
The article presents an action research carried out in three complementary companies as a solutionfor a solid textile waste management. A company that manufactures uniforms, a textile defibrationcompany and a non-governmental organization (NGO) that uses textile waste as raw material. Duringthe action research there was a significant reduction in the generation of waste from the cutting

department. The remainder of the unused waste was defibrated. The material was absorbed by theautomobile industry in the production of acoustic lining.
2. Theoretical basis - Textile ChainThe Fashion Garment Manufacturing – FGM is part of the Textile Chain, and each link comprises aset of industries forming a network of inputs that have been transformed into final products in order tomeet the demand of final consumers. The sequence of production processes suffers more or lessinfluence of the fashion cycle at each stage of the Textile Chain [1]. The image in Figure 1 shows allthe links in the chain and the interrelationship between the participating industries. The main axisshows the production sequence that begins in the fibers ending in the retail, going through theproduction of fashionable clothing. In its surroundings are observed the adjacent industries that givesupport for the fashion clothing to materialize, such as those of beneficiation and producers of suppliesand distribution equipment. This entire network is served by the machinery industry that has evolvedover the past 60 years to precede this chain. It is noticed that fashion, through the Fashion Bureaux andTextile Design, influences the chain, more subtly in the fibers, and more aggressively in the retail.
Figure 1. Textile Chain
2.1. Fashion ClothingIn each new season, the fashion clothing industry, influenced by information from the FashionBureaux, provides retailers with a wide variety of new products with novelties in their shapes, colors,materials and textures, making it possible to meet fashion clothing brands that meet the needs ofDifferent consumer markets. The goal is to satisfy the desires of a conservative public, consuming abasic and classic fashion or bold and innovative or the vanguard of fashion and unusual products.

Figure 2. Fashion collection
Figure 2 presents a collection of fashion apparel, a set of garment parts developed and producedfor distribution in the retail market. It is noticed that the pieces between them are quite differentiatedin their forms and volumes of fabrics. In this collection are used several types of fabric, each one withspecific characteristics.
3. Fashion Garment Manufacturing - FGMThe FGM production process consumes a large quantity of different types of fabric, such as flatwoven, knitted fabric and others, produced with different types of yarn, twist, pure yarn, fiber blendand others, composed of various natural fibers, Artificial or synthetic, causing a great possibility ofdevelopment of new clothes of fashion. As a result, there is the generation of a wide variety of solidtextile waste with high harmful impact on the environment.For each ton of product, approximately 10% of textile waste is generated. The Brazilian textileindustry produces, on average, 1.878 million tons of final products. [4]. Thus, 190,000 tons of unusedtextile waste per year are disposed of incorrectly. According to the Brazilian law PLN No. 12,305/10,which establishes the National Solid Waste Policy (PNRS), entrepreneurs should be responsible forthe proper management of waste generated.There are bibliography citing studies that have succeeded in solutions related to the management oftextile waste. Many theories are in their stages of implementation of the processes of reduction, reuseand recycling of textile materials.
4. CyclabilityThe theory of Design for Cyclability described by Dr. Kate Goldsworthy [5] describes three itemsintended for Zero Waste Future and Creating Closed Loop Systems: Now upcycling by design, NearDesign for Cradle-2-Cradle, Future Design for Material Ecologies, as shown in Figure 3.
Figure 3. Creating Closed Loop Systenms by Dr. Goldsworthy. Source: (Earley, 2012)
- Now Upcycling by Design: limited materials with limited life cycles. Although return journeyscan be designed at the end-of-life, this approach only postpones the end of the discarded material atlandfill, where it may never biodegrade, it may degrade very slowly or may add harmful materials tothe environment as it degrades.
- Near Design for Cradle-2-Cradle: limited materials with unlimited life cycles. By considering thebarriers to recycling as part of the design brief, connected loops can be built into the material's future
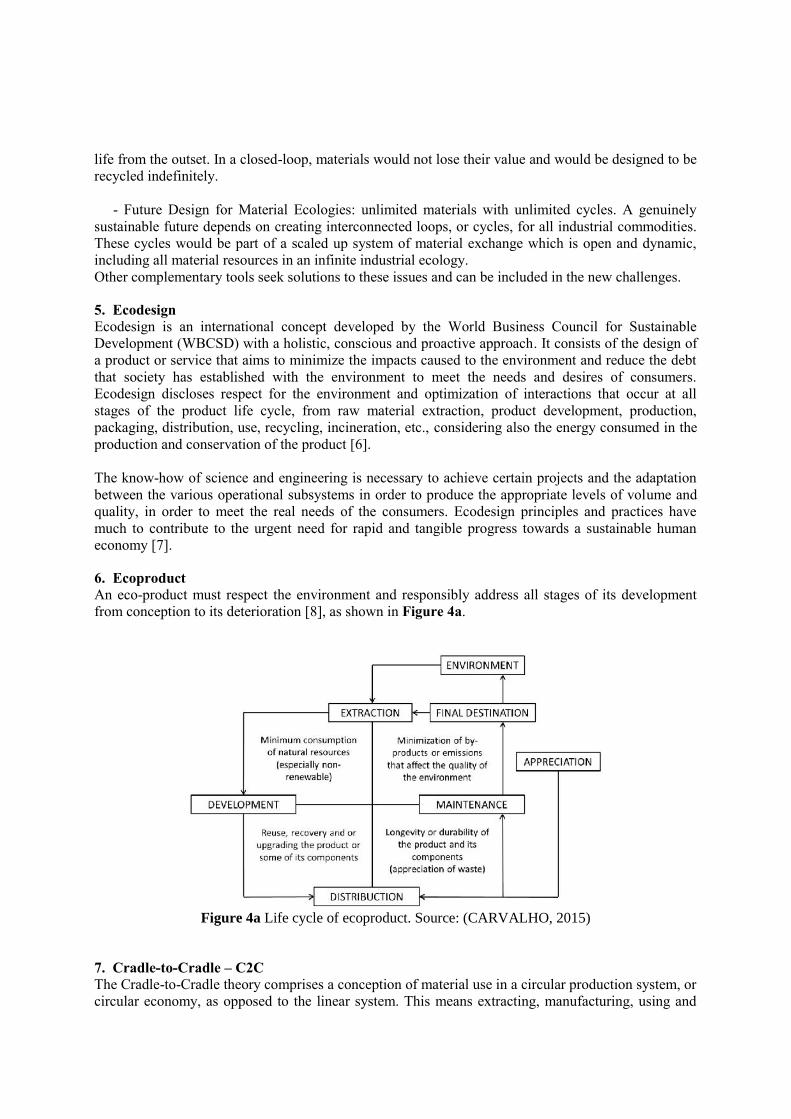
life from the outset. In a closed-loop, materials would not lose their value and would be designed to berecycled indefinitely.
- Future Design for Material Ecologies: unlimited materials with unlimited cycles. A genuinelysustainable future depends on creating interconnected loops, or cycles, for all industrial commodities.These cycles would be part of a scaled up system of material exchange which is open and dynamic,including all material resources in an infinite industrial ecology.Other complementary tools seek solutions to these issues and can be included in the new challenges.
5. EcodesignEcodesign is an international concept developed by the World Business Council for SustainableDevelopment (WBCSD) with a holistic, conscious and proactive approach. It consists of the design ofa product or service that aims to minimize the impacts caused to the environment and reduce the debtthat society has established with the environment to meet the needs and desires of consumers.Ecodesign discloses respect for the environment and optimization of interactions that occur at allstages of the product life cycle, from raw material extraction, product development, production,packaging, distribution, use, recycling, incineration, etc., considering also the energy consumed in theproduction and conservation of the product [6].
The know-how of science and engineering is necessary to achieve certain projects and the adaptationbetween the various operational subsystems in order to produce the appropriate levels of volume andquality, in order to meet the real needs of the consumers. Ecodesign principles and practices havemuch to contribute to the urgent need for rapid and tangible progress towards a sustainable humaneconomy [7].
6. EcoproductAn eco-product must respect the environment and responsibly address all stages of its developmentfrom conception to its deterioration [8], as shown in Figure 4a.
Figure 4a Life cycle of ecoproduct. Source: (CARVALHO, 2015)
7. Cradle-to-Cradle – C2CThe Cradle-to-Cradle theory comprises a conception of material use in a circular production system, orcircular economy, as opposed to the linear system. This means extracting, manufacturing, using and

again making their waste available as new raw material or a new product, resulting in zero residue [9].The authors also used concepts to distinguish recycling that results in a material that shows loss ofquality, “downcycling”, as opposed to another, more useful and productive, “upcycling”.
The C2C argues that all components and raw materials used or constituents of the productionprocess can be totally reused in the same or a new process after its useful life. This is not recycling.C2C strictly abrogates the elimination of the concept of waste and, as a new paradigm, does not acceptthe waste of by-products, adopting its complete extinction [10]. C2C determines that materials mustnecessarily generate new products of equal or greater quality than the first, even if not for the sameapplication or for the same market. The concept advocates that the production process and the rawmaterials are ecologically efficient and not only efficient. Macdounough & Braungart illustrates thesystem with a few examples, including biodegradable fibers or intelligent fibers, which enablecomplete reprocessing in the textile industry, materials designed as biological nutrients such as textilesand packaging made from natural fibers that can biodegrade safely, Restoring nutrients to depleted soil[11].
8. Case StudyThe company X produces uniforms for professionals working in the administrative and security areaof companies, are social attire, jacket, pants, shirts, skirts. These pieces are produced with flat andcomposite fabrics of mixed, artificial and natural fibers. Consume in their production approximately10 thousand kilos of fabrics per week, generating approximately 100 kilos of waste. Two years ago itstarted a project to reduce its waste disposal during the cutting stage and began to cut parts of thewaste in formats that could be used in new products.
These new products are developed and produced by an NGO that welcomes, for the overnight stay,people in situations of extreme vulnerability who live on the streets of the city of São Paulo. Thesepeople participated in workshops and learned to produce carpets using the waste as raw material.Figures 4 and 5 show the processes of rugs made of rectangular flaps and of crochet produced withlong strips of the sides of the fabrics.
Figure 4 Figure 5
A company defibrillates the waste that does not have dimensions to enable its use. These wastes areprocessed by machines that, after defibration, form compacted bundles of fibers. These bales areintended for the panel manufacturing and automotive coating industries. Figure 6 shows the volume ofdebris that is defibrillated and Figure 7 shows the lustrates the bales that are used in the automotivecomponent industry.
Figure 6 Figure 7
9. Analysis and conclusionThe uniforms company began to cooperate with the NGO offering strips and rectangles of fabricsalready cut into the necessary dimension for the production of carpets. It is the use of small spacesexisting between the parts necessary for the production of uniforms in the company's cuttingdepartment.As a result, time was gained in the production of carpets with increased quality and a 50% reduction ofdiscarded waste was verified and the remainder also being sent to a defibrillator processing companyfor the production of automotive and acoustic coating panels.The implementation of the project has shown that it is possible for garment companies to dispose oftheir waste. It is possible to see the application of the C2C system, also considering that the officialresponsible for the cutting department, resistant to the new recovery process, did not fully cooperatewith the new procedure, from which it can be concluded that much more satisfactory results arepossible.As for the "Future Design for Material Ecologies" phase of "Design for Cyclability", the resultsdepend on a new technological awareness accompanied by the evolution of human consciousness tothe values of ethics, transparency, responsibility and desire to correct decades of environmentalchanges. High values of education, the principles of coexistence and community participation mustalso be taken into account in order for change to be positive, prosperous and effective.In addition to legal sanctions, environmental issues have recently begun to show great globalimportance and brand identity, resulting in a business concern with the proper disposal of solid waste.
References
[1] Mendes F D 2010 Um Estudo Comparativo entre as Manufaturas do Vestuário de Moda doBrasil e da Índia (doctoral thesis in production engineering Universidade Paulista, SãoPaulo).
[2] Yin R K 2008 Case Study Research: Design and Methods (Applied Social Research Methods)4a.ed. (USA: Sage Publications).
[3] Lakatos E M and Marconi M A 2007 Metodologia Científica (São Paulo, Atlas).[4] IEMI, Instituto de Estudos e Marketing Industrial. Relatório Setorial da Cadeia Têxtil
Brasileira. 2015 São Paulo: Free Press.[5] Earley R and Collet C 2012 Material Futures 01 -Textile Futures Research Centre (UAL –
University of the Arts London, London).[6] UNEP - United Nations Environment Programme, ECO-DESIGN production without
destruction, <http://www.unep.fr/shared/publications/other/webx0008xpa/ecodesign.pdf>access: 20/03/2016.
[7] Hoffmann E 2012 User integration in sustainable product development : organisationallearning through boundary-spanning processes (Sheffield, UK : Greenleaf Pub).

[8] Oliveira J F S 2005 Ecoprodutos. In:Gestão Ambiental (Lisboa: Lidel) chapter 7 pp. 91-116.[9] Braungart M and McDonough W 2014 Cradle to Cradle: criar e reciclar ilimitadamente
(Barcelona, Editora Gustavo Gil).[10] MCDonough W, Braungart M, Anastas P T, Zimmerman J B 2003 Applying the Principles
Engineering of Green to Cradle-to-Cradle Design.[11] Salcedo, E 2014 Moda ética para um futuro sustentável. Editora: Gustavo Gili- Barcelona.

Printing of cotton with eco-friendly, red algal pigment fromGracilaria sp.
S Moldovan1, M Ferrandiz1, E Franco1, E Mira1, L Capablanca 1 and Mª Bonet2
1Textile Technological Institute (AITEX), Biotechnology Department, Plaza EmilioSala, 1, 03801, Alcoy, Alicante, Spain2 Polytechnic University of Valencia, Higher Polytechnic School of Alcoy, Textile andpapermaking department, Plaza de Ferrándiz y Carbonell, 03801, Alcoy, Alicante,Spain
E-mail: [email protected]
Abstract. Natural dyes represent an emerging trend in the textile industry and eco-fashion dueto the increasing awareness of the sustainability concept, which must be applied to thesurrounding environment. In the light of the stated problem, the search for alternative sourcesof dyes, revealed the new, eco-friendly, biodegradable, non-carcinogenic and sustainablecolorant matter, the algal biomass. In the present work, the suitability and viability of printingcotton fabrics with pigments obtained from the red macroalgae Gracilaria sp., has beeninvestigated. For this aim, phycoerythrin, the red pigment, was extracted from fresh algalbiomass, and used in a laboratory pigment-printing process, employing a natural and syntheticprinting paste, for process efficiency comparison. The color values and the rubbing andlaundering fastness of the printed substrates were evaluated. Results show that a light pinkcolor can be obtained when applying both tested printing processes, and in terms of colorfastness, both printing pastes show good behavior. In conclusion, the algal pigments show ahigh printing capacity on cotton substrates, either when employing the synthetic conventionalpaste and; moreover, when applying the more sustainable and eco-friendly natural paste.
1. IntroductionThe growing popularity of the sustainability and greening concepts generates an increase in theawareness of the need to protect the environment. When applying these concepts to one of the mostdemanded industries, the textile industry, research studies exposed the necessity of exploration formore sustainable alternatives to the synthetic products, which are pollution generating. A solution tothese needs can be represented by the focus on the reutilization of natural dyes, although they wereused for the coloration of goods from ancient times. Nevertheless, dyes originating from vegetablesources are interesting due to the very low dyes´ toxicity[1].Natural dyes are pigments derived from mineral, animal or plant sources[2], and can be obtained fromany part of the plant, such as leaves, fruits, seeds, flowers, bark root, etc[3]. The two biggestdisadvantages of plant pigments production are represented by the need of a wide arable land for theircultivation and the CO2 emissions[4].
Regardless of the source, these products, which may be categorized as ´green´ dyes, are in essence,secondary metabolites produced by the organism[5]. The unique characteristic of secondarymetabolites generation presents a scientific and technological challenge.

Taking into consideration the difficulties and inconvenients imposed by the ´conventional´ naturaldyes, this investigation work puts in light another source of natural pigments, namely, the algalbiomass, which surpasses the previously mentioned impediments.In recent years, significant interest has been developed in the commercial utilization of algae, based ontheir valuable chemical constituents, taking into account the multiple bioactive compounds contentwith applications in the food, cosmetic, agri- and horticultural sectors and in human health. The maincompounds, which present special interest, include pigments, lipids and fatty acids, proteins,polysaccharides and phenolic[6]. Macroalgae contain phycoerythrins and carotenoids, which representvaluable pigments for the textile finishing industry. Phycoerythrin, is a water-soluble, light harvestingprotein, which is specialized in the energy transfer chain[7].
There is an increasing interest on the employment of natural dyes in textile processes. Althoughdyeing with natural dyes is widespread through scientific research, papers on the printing via naturalcolorants are limited.Pigment printing is considered the easiest printing method[8], and it is defined as the process of fixinginsoluble pigments, which have no affinity to the fiber on the textile with binding agents. It isconsidered the most economical printing process and can be applied to all substrates[9].This study was focused on the validation of pigment printing of natural dyes, originating from redmacro algae, on cotton substrates. To this purpose, phycoerythrin, the red pigment extracted fromGracilaria sp., was used in a laboratory pigment-printing process employing a natural and syntheticprinting paste, with the aim of comparing the process efficiency. The color values and the rubbing andlaundering fastness of the printed substrates were evaluated and revealed good to excellent colorbehavior when applied on cotton substrates.
2. Materials and methods
2.1. Pigment cultivation and extractionPhycoerythrin, red pigment, was extracted from the red macroalgae Gracilaria sp., obtained fromAlgaplus, Portugal. The fresh algal biomass was collected from large-scale cultivation tanks, in anopen-system; and was subjected to one freeze (-20 ºC) - thaw (4 ºC) cycle, in order to obtain thepigment. The extracts were obtained in distilled water at pH=7, after magnetic stirring for 5 hours,under dimmed light. In the extraction process, Ammonium Sulphate (supplied by Sigma-Aldrich,Spain for protein stabilization was added) in a concentration of 20 %, with respect to the biomassweight for protein stabilization. The resulting extract was a solution, which was employed as obtainedin the printing process, by adding it to the mother pastes described in table 1.
2.2. Textile finishing process on cotton fabrics
2.2.1. Cotton pretreatment.
A mordanting pre-treatment was applied to cotton fabrics in order to increase the affinity dye-cellulosic-fiber, by immersing the fabric substrate in a solution containing 6 % (reported to the dryfabric weight) Cream of Tartar (supplied by Sigma-Aldrich, Spain), for 45 minutes, at 85 ºC.
2.2.2. Printing process.
In this study, cotton fabrics (supplied by Intexter UPC, Spain) weighing 200 gr/m2, were used for theapplication of pigment printing process and the natural sources extracts were used directly as dyestuffin the natural and synthetic printing pastes, as shown in table 1.
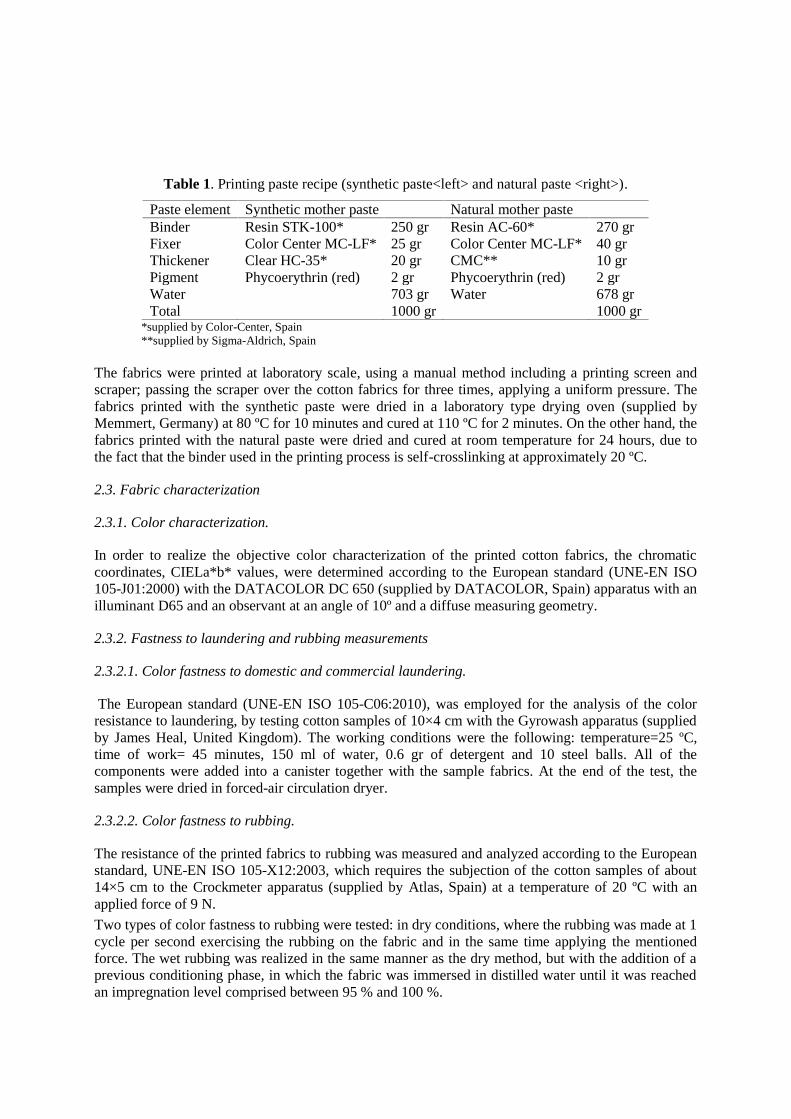
Table 1. Printing paste recipe (synthetic paste<left> and natural paste <right>).
Paste element Synthetic mother paste Natural mother pasteBinder Resin STK-100* 250 gr Resin AC-60* 270 grFixer Color Center MC-LF* 25 gr Color Center MC-LF* 40 grThickener Clear HC-35* 20 gr CMC** 10 grPigment Phycoerythrin (red) 2 gr Phycoerythrin (red) 2 grWater 703 gr Water 678 grTotal 1000 gr 1000 gr
*supplied by Color-Center, Spain**supplied by Sigma-Aldrich, Spain
The fabrics were printed at laboratory scale, using a manual method including a printing screen andscraper; passing the scraper over the cotton fabrics for three times, applying a uniform pressure. Thefabrics printed with the synthetic paste were dried in a laboratory type drying oven (supplied byMemmert, Germany) at 80 ºC for 10 minutes and cured at 110 ºC for 2 minutes. On the other hand, thefabrics printed with the natural paste were dried and cured at room temperature for 24 hours, due tothe fact that the binder used in the printing process is self-crosslinking at approximately 20 ºC.
2.3. Fabric characterization
2.3.1. Color characterization.
In order to realize the objective color characterization of the printed cotton fabrics, the chromaticcoordinates, CIELa*b* values, were determined according to the European standard (UNE-EN ISO105-J01:2000) with the DATACOLOR DC 650 (supplied by DATACOLOR, Spain) apparatus with anilluminant D65 and an observant at an angle of 10º and a diffuse measuring geometry.
2.3.2. Fastness to laundering and rubbing measurements
2.3.2.1. Color fastness to domestic and commercial laundering.
The European standard (UNE-EN ISO 105-C06:2010), was employed for the analysis of the colorresistance to laundering, by testing cotton samples of 10×4 cm with the Gyrowash apparatus (suppliedby James Heal, United Kingdom). The working conditions were the following: temperature=25 ºC,time of work= 45 minutes, 150 ml of water, 0.6 gr of detergent and 10 steel balls. All of thecomponents were added into a canister together with the sample fabrics. At the end of the test, thesamples were dried in forced-air circulation dryer.
2.3.2.2. Color fastness to rubbing.
The resistance of the printed fabrics to rubbing was measured and analyzed according to the Europeanstandard, UNE-EN ISO 105-X12:2003, which requires the subjection of the cotton samples of about14×5 cm to the Crockmeter apparatus (supplied by Atlas, Spain) at a temperature of 20 ºC with anapplied force of 9 N.Two types of color fastness to rubbing were tested: in dry conditions, where the rubbing was made at 1cycle per second exercising the rubbing on the fabric and in the same time applying the mentionedforce. The wet rubbing was realized in the same manner as the dry method, but with the addition of aprevious conditioning phase, in which the fabric was immersed in distilled water until it was reachedan impregnation level comprised between 95 % and 100 %.

3. Results and discussions
3.1. Printing processDuring the printing process, the algal pigment was used to provide a light red color, as seen in figure1. The color shades only related with the natural dye extract concentration, binder and fiber type.
A B
Figure 1. Printed cotton fabrics, A. synthetic paste and B. natural paste
3.2. Color characterization and printing efficiencyDuring the printing process, the phycoerythrin obtained from Gracilaria sp. was used to provide alight red color (pink). As presented in Table 1. the color shades only related with the natural dyeextract concentration, binder and fiber type.Table 2. shows that in cotton printing there is a favorable circumstance in the use of natural dyestuff.As known, the L* value represents the lightness of the color (L*, L*= 0 refers to black and L*= 100refers to white). In the employment of the synthetic paste, it can be observed a slightly lighter colorthan in the case where the natural paste was employed. In addition, it can be mentioned that the lightcolor obtained was due to the low concentration of colorant employed in the process. Regarding thecolor area, both types of the printed fabrics are found in the red –yellow area (a*, b*). From the coloranalysis of the phycoerythrin, it can be stated that a light red color can be obtained with this kind ofnatural dye and that the intensity of the color depends on the amount of colorant added to the motherpaste, in both synthetic and natural printing processes.
Table 2. Color values of the printed cotton
PE with synthetic paste PE with natural pasteL* 92,99 92,5a* 2,61 2,73b* 3,91 2,71
Chroma (C*) 4,7 3,85Hue angle (hº) 56,31 44,75
Table 3. Color intensity and lightness differences between the synthetic paste printed cotton fabricsand the ones printed with the natural paste
Cotton synthetic vs. natural paste∆L* 0.49∆E* 1.30
The significance of ∆E*, by being characterized by a positive value, confirms that exists adifference of color between the samples printed with synthetic paste and the ones printed with naturalpaste. Meanwhile, the value of ∆L* indicates a slightly lighter color in the case where it was employedthe synthetic printing paste, due to the fact that the sample was subjected to high temperatures in thebinder curing phase.
3.3. Fastness of printsThe characterization of the printed cotton through laundering and rubbing fastness can be seen inTable 4. The fastness results indicate similar values for both types of printed fabrics and confirm theapplicability of this natural pigment in the natural and synthetic printing processes. The washing
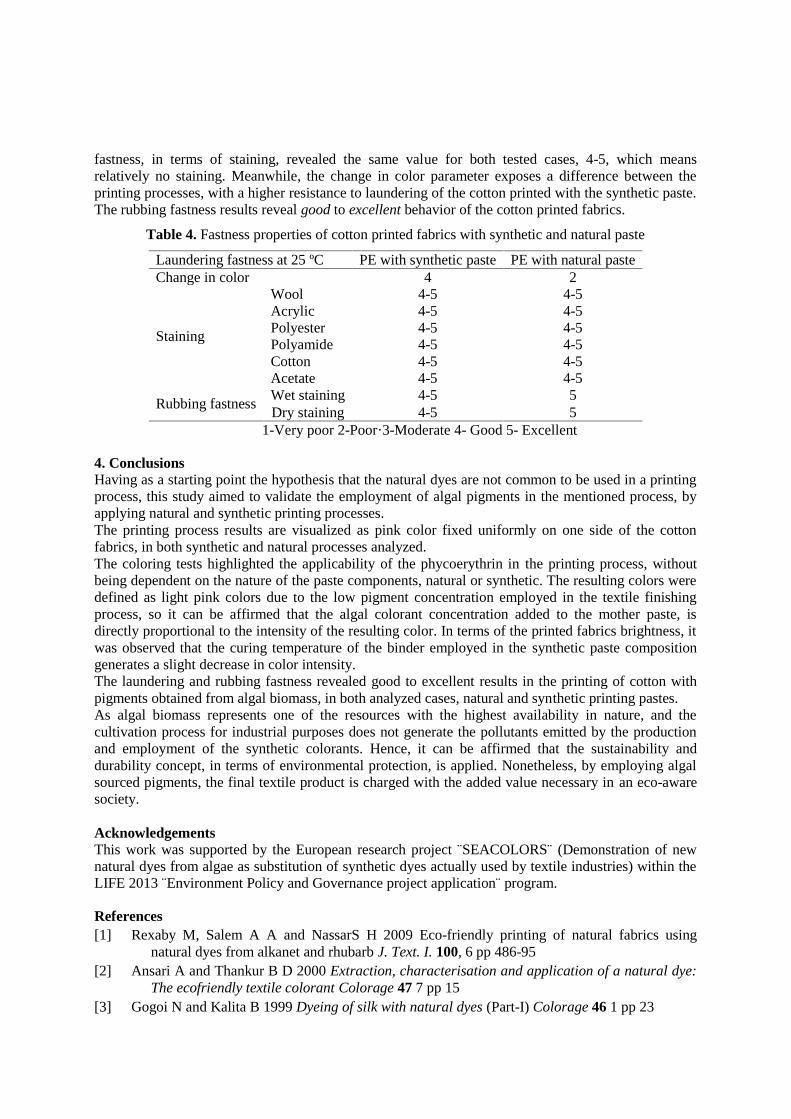
fastness, in terms of staining, revealed the same value for both tested cases, 4-5, which meansrelatively no staining. Meanwhile, the change in color parameter exposes a difference between theprinting processes, with a higher resistance to laundering of the cotton printed with the synthetic paste.The rubbing fastness results reveal good to excellent behavior of the cotton printed fabrics.
Table 4. Fastness properties of cotton printed fabrics with synthetic and natural paste
Laundering fastness at 25 ºC PE with synthetic paste PE with natural pasteChange in color 4 2
Staining
Wool 4-5 4-5Acrylic 4-5 4-5Polyester 4-5 4-5Polyamide 4-5 4-5Cotton 4-5 4-5Acetate 4-5 4-5
Rubbing fastness Wet staining 4-5 5Dry staining 4-5 5
1-Very poor 2-Poor·3-Moderate 4- Good 5- Excellent
4. ConclusionsHaving as a starting point the hypothesis that the natural dyes are not common to be used in a printingprocess, this study aimed to validate the employment of algal pigments in the mentioned process, byapplying natural and synthetic printing processes.The printing process results are visualized as pink color fixed uniformly on one side of the cottonfabrics, in both synthetic and natural processes analyzed.The coloring tests highlighted the applicability of the phycoerythrin in the printing process, withoutbeing dependent on the nature of the paste components, natural or synthetic. The resulting colors weredefined as light pink colors due to the low pigment concentration employed in the textile finishingprocess, so it can be affirmed that the algal colorant concentration added to the mother paste, isdirectly proportional to the intensity of the resulting color. In terms of the printed fabrics brightness, itwas observed that the curing temperature of the binder employed in the synthetic paste compositiongenerates a slight decrease in color intensity.The laundering and rubbing fastness revealed good to excellent results in the printing of cotton withpigments obtained from algal biomass, in both analyzed cases, natural and synthetic printing pastes.As algal biomass represents one of the resources with the highest availability in nature, and thecultivation process for industrial purposes does not generate the pollutants emitted by the productionand employment of the synthetic colorants. Hence, it can be affirmed that the sustainability anddurability concept, in terms of environmental protection, is applied. Nonetheless, by employing algalsourced pigments, the final textile product is charged with the added value necessary in an eco-awaresociety.
AcknowledgementsThis work was supported by the European research project ¨SEACOLORS¨ (Demonstration of newnatural dyes from algae as substitution of synthetic dyes actually used by textile industries) within theLIFE 2013 ¨Environment Policy and Governance project application¨ program.
References[1] Rexaby M, Salem A A and NassarS H 2009 Eco-friendly printing of natural fabrics using
natural dyes from alkanet and rhubarb J. Text. I. 100, 6 pp 486-95[2] Ansari A and Thankur B D 2000 Extraction, characterisation and application of a natural dye:
The ecofriendly textile colorant Colorage 47 7 pp 15[3] Gogoi N and Kalita B 1999 Dyeing of silk with natural dyes (Part-I) Colorage 46 1 pp 23
[4] Smith P et al. 2007 Mitigation In Climate Change Contribution of Working Group III to theFourth Assessment Report of the Intergovernmental Panel on Climate Chang ed Davidson OR, Bosch P R, Dave R, Meyer L A and Metz B (New York: Cambridge University Press) pp499-532
[5] Segupta S and Singh B R 2003 Natural, ´Green´ Dyes for the Textile Industry. Toxics UseReduction Institute, Masachusetts
[6] Stengel D B, Connan S and Popper Z A 2011 Algal chemodiversity and bioactivity: Sources ofnatural variability and implications fro commercial application Biotechnol. Adv. 29 pp 483-501
[7] Liu L N, Chen X L , Zhang X Y and Zhang Y Z 2005 One-step chromatography method forefficient separation and purification of R-phycoerythrin from Posidonia urcelolata J.Biotechnol. 116 pp 91-100
[8] El-Molla M M and Schneider R 2006 Development of ecofriendly binders for pigment printingof all types of textile fabrics Dyes and Pigments 71 2 pp 130-7
[9] Bahtiyari M I, Benli H and Yavas A 2013 Printing of wool and cotton fabrics with natural dyes.Asian Journal of Chemistry 25 6 pp 3220-4

The life cycle assessment of cellulose pulp from waste cotton
via the SaXcell™ process.
Jens Oelerich1, Marijn Bijleveld
2, Gerrit H Bouwhuis
1 and Ger J Brinks
1
1Saxion University of Applied Sciences, School of Creative Technology,
Research group Smart Functional Materials, van Galenstraat 19, 9711JL Enschede,
The Netherlands, 2CE Delft, Oude Delft 180, 2611 HH Delft, The Netherlands
E-mail: [email protected]
Abstract. Recycling of cotton waste into high value products is a longstanding goal in textile
research. The SaXcellTM process provides a chemical recycling route towards virgin fibres. In
this study a Life cycle assessment (LCA) is conducted to measure the impact of the chemical
recycling of cotton waste on the environment. Pure cotton waste and cotton containing 10 % of
polyester are elaborated. The results show that chemical recycling via the SaXcellTM process
can have a lower impact on climate change and other impact category than comparable pulping
technologies.
1. Introduction Recycling is one of the most important solutions to the environmental problems that the world will
face due to increasing population and welfare [1]. While in the plastic and paper industry recycling is
state of the art, the recycling of textiles is still underdeveloped and most of the textile waste is burned.
Considering the enormous needs for energy and chemicals during the production of textile fibres [2],
the creation of a closed material cycle for textile fibres is expected to decrease the environmental
impact of textiles.
SaXcell™ (Saxion and cellulose) is a regenerated cellulosic fibre made out of 100 % cotton waste
material and has recently been developed at Saxion UAS, The Netherlands. A lot of progress is made
in creating a sustainable and economically valuable process for waste cotton recycling into
regenerated cellulose fibres [3] (see Figure 1). In order to be able to give objective information on the
environmental impact of the production of the SaXcell™ fibre, as a first step, a life cycle assessment
(LCA) has been carried out of the dissolving pulp production from cotton waste as feedstock (figure 1
steps 1-5).
The goal of this LCA-study is to evaluate the environmental impact of the production of cellulose
dissolving pulp via the SaXcell™ process. Pulp from two different kinds of (sorted) waste textiles is
inventoried:
1. 100 % cotton
2. 90 % cotton / 10 % PET
Calculations are performed on processes that were not optimized for a low environmental impact.

Figure 1. The SaXcellTM recycling process and subsequent fabric production
2. Methods The LCA study is executed by CE Delft according to the ISO-standard of good LCA practice (ISO
14044:2006 ‘Environmental management - Life cycle assessment - Requirements and guidelines’) and
also reported accordingly. This investigation is a cradle-to-gate investigation, meaning that the product
is evaluated from the resource extraction (cradle) to the factory gate (i.e., before transport of the pulp
to the fibre production facility).
The data for the production of SaXcell pulp is collected by Saxion in consultation with textile
production experts. The data is inventoried per 100 kg of SaXcell pulp. For the LCA of regenerated
pulp from cotton waste, data from laboratory and pilot plant scale experiments at Saxion are used and
translated to an industrial scale production. This translation is done based on literature data and experts
estimations. De data is modelled in the LCA software Simapro, by making use of the environmental
background data of the Ecoinvent database.
The SaXcell pulp is a feedstock for fibre production via the Lyocell process. Due to the unavailability
of data on industrial fibre production via the Lyocell process, the fibre production is excluded in this
study (step 6 in Figure 1).
The ReCiPe method (midpoint level) is selected as life cycle impact assessment method. With this
method, eighteen different environmental effects and indicators are calculated. The results of five are
shown in this report. As representative values, here, the climate change values in kg CO2-eq. are
reported. Additionally a comparison between SaXcell pulp from 100 % white cotton waste and
existing sulphate pulps will be shown. Several other environmental assessments have been applied
(not reported here) in order to ensure optimal comparability with other studies.
1 •Textile waste collection and sorting
2 •Unravelling and/or milling
3 •Removal of polyester and other impurities
4 •Discolouration of remaining textile waste
5 •Adjustment of the degree of polymerization (DP)
6 •Spinning of SaXcellTM fibers
7 •Yarn production
8 •Fabric production
9 •Fabric finishing
10 •Tailoring

3. Results
3.1 Data collection (inventory)
Data about the SaXcellTM process was collected based on laboratory and pilot scale experiments and
translated to an industrial scale production.
3.1.1. Energy
The (estimated) energy requirement for pulp production at industrial scale is shown in table 1.
Electricity consumption in the pulping process consists of unravelling the textile waste, milling,
dewatering and stirring during the chemical processes. Heat from natural gas is required for process
water heating. The process is based on an integrated plant where pulp production is directly followed
by fibre production (not included in this study). For that reason for drying no electricity or heat is
accounted.
Table 1. Electricity and heat use for industrial scale production of 100 kg of SaXcell pulp
Process 100 % cotton 90 % cotton / 10 % PET
Electricity (kWh) 58.4 63.8
Heat (MJ) 169 427
The stirring process and all heating processes are assumed to consume 30% less energy than in the lab
scale situation. This was an estimation based on the effects of process optimization, integration, and
up-scaling.
An uncertainty assessment is performed for the process step that adjusts the degree polymerisation
(DP reduction step; see figure 1, step 5). This step was additionally calculated with the use of a
biocatalyst instead of an acid as catalyst. In that case only 58 MJ instead of 169 MJ for heating was
required.
3.1.2 Transport
Transport of waste material is based on averaged distances between the place of collection of textiles
and the sorting facilities within the Netherlands. For the transport from the sorting location to the pulp
production plant it is assumed that the pulp production takes place in the centre of the Netherlands and
sorting occurs within the Netherlands (see table 2).
Table 2. Transport of raw materials
Process Kilometres Transportation type
From collection to sorting location 75 Truck (<10 t)
From sorting to pulp and filament production 200 Truck (24 t)
3.1.3 Input materials
The chemicals used during the pulping process are given in table 3. The water consumption is a
summary of the process steps and the washing cycles. It is assumed that a water recycling system
reduces the actual water consumption by 70 % (this is taken into account in the figures in table 3).
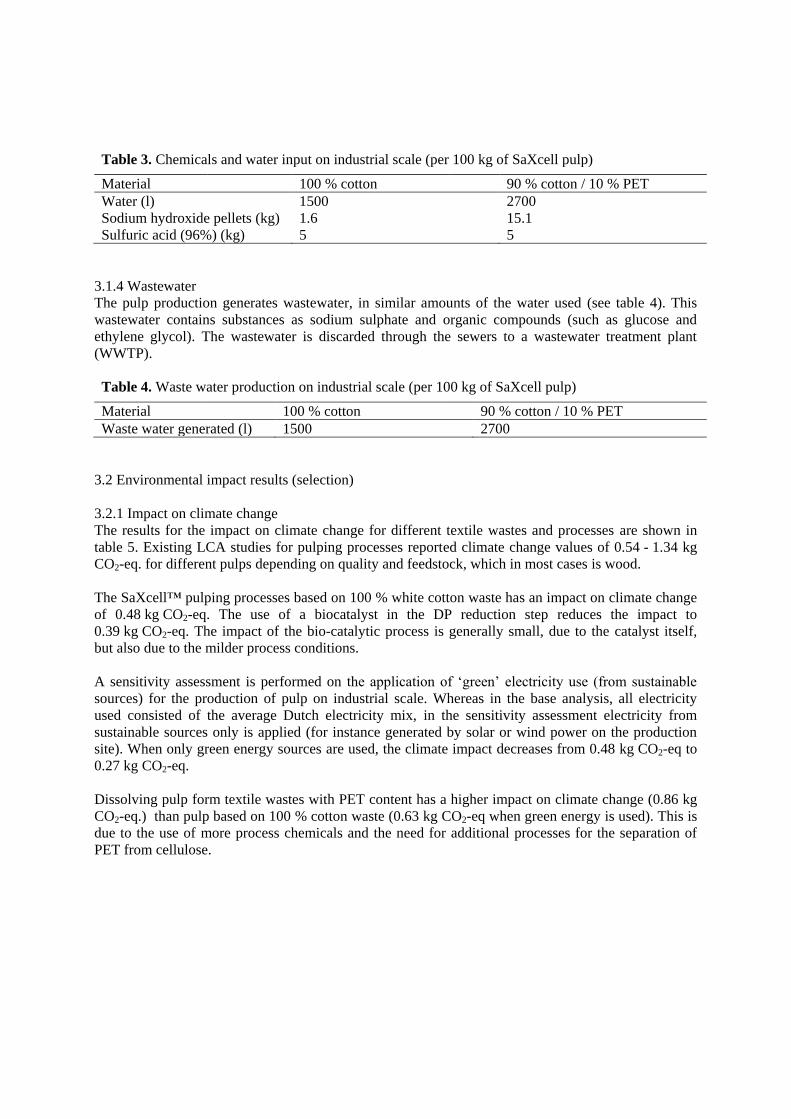
Table 3. Chemicals and water input on industrial scale (per 100 kg of SaXcell pulp)
Material 100 % cotton 90 % cotton / 10 % PET
Water (l) 1500 2700
Sodium hydroxide pellets (kg) 1.6 15.1
Sulfuric acid (96%) (kg) 5 5
3.1.4 Wastewater
The pulp production generates wastewater, in similar amounts of the water used (see table 4). This
wastewater contains substances as sodium sulphate and organic compounds (such as glucose and
ethylene glycol). The wastewater is discarded through the sewers to a wastewater treatment plant
(WWTP).
Table 4. Waste water production on industrial scale (per 100 kg of SaXcell pulp)
Material 100 % cotton 90 % cotton / 10 % PET
Waste water generated (l) 1500 2700
3.2 Environmental impact results (selection)
3.2.1 Impact on climate change
The results for the impact on climate change for different textile wastes and processes are shown in
table 5. Existing LCA studies for pulping processes reported climate change values of 0.54 - 1.34 kg
CO2-eq. for different pulps depending on quality and feedstock, which in most cases is wood.
The SaXcell™ pulping processes based on 100 % white cotton waste has an impact on climate change
of 0.48 kg CO2-eq. The use of a biocatalyst in the DP reduction step reduces the impact to
0.39 kg CO2-eq. The impact of the bio-catalytic process is generally small, due to the catalyst itself,
but also due to the milder process conditions.
A sensitivity assessment is performed on the application of ‘green’ electricity use (from sustainable
sources) for the production of pulp on industrial scale. Whereas in the base analysis, all electricity
used consisted of the average Dutch electricity mix, in the sensitivity assessment electricity from
sustainable sources only is applied (for instance generated by solar or wind power on the production
site). When only green energy sources are used, the climate impact decreases from 0.48 kg CO2-eq to
0.27 kg CO2-eq.
Dissolving pulp form textile wastes with PET content has a higher impact on climate change (0.86 kg
CO2-eq.) than pulp based on 100 % cotton waste (0.63 kg CO2-eq when green energy is used). This is
due to the use of more process chemicals and the need for additional processes for the separation of
PET from cellulose.
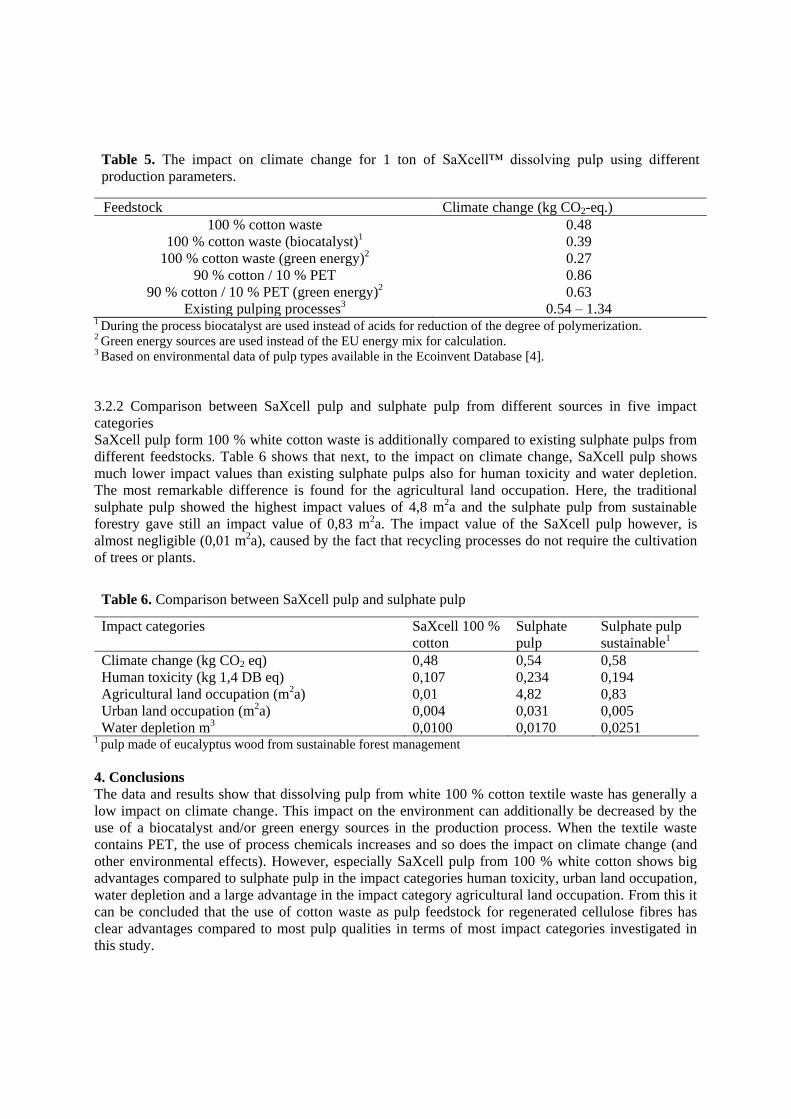
Table 5. The impact on climate change for 1 ton of SaXcell™ dissolving pulp using different
production parameters.
Feedstock Climate change (kg CO2-eq.)
100 % cotton waste 0.48
100 % cotton waste (biocatalyst)1 0.39
100 % cotton waste (green energy)2 0.27
90 % cotton / 10 % PET 0.86
90 % cotton / 10 % PET (green energy)2 0.63
Existing pulping processes3 0.54 – 1.34 1 During the process biocatalyst are used instead of acids for reduction of the degree of polymerization. 2 Green energy sources are used instead of the EU energy mix for calculation. 3 Based on environmental data of pulp types available in the Ecoinvent Database [4].
3.2.2 Comparison between SaXcell pulp and sulphate pulp from different sources in five impact
categories
SaXcell pulp form 100 % white cotton waste is additionally compared to existing sulphate pulps from
different feedstocks. Table 6 shows that next, to the impact on climate change, SaXcell pulp shows
much lower impact values than existing sulphate pulps also for human toxicity and water depletion.
The most remarkable difference is found for the agricultural land occupation. Here, the traditional
sulphate pulp showed the highest impact values of 4,8 m2a and the sulphate pulp from sustainable
forestry gave still an impact value of 0,83 m2a. The impact value of the SaXcell pulp however, is
almost negligible (0,01 m2a), caused by the fact that recycling processes do not require the cultivation
of trees or plants.
Table 6. Comparison between SaXcell pulp and sulphate pulp
Impact categories SaXcell 100 %
cotton
Sulphate
pulp
Sulphate pulp
sustainable1
Climate change (kg CO2 eq) 0,48 0,54 0,58
Human toxicity (kg 1,4 DB eq) 0,107 0,234 0,194
Agricultural land occupation (m2a) 0,01 4,82 0,83
Urban land occupation (m2a) 0,004 0,031 0,005
Water depletion m3 0,0100 0,0170 0,0251 1 pulp made of eucalyptus wood from sustainable forest management
4. Conclusions The data and results show that dissolving pulp from white 100 % cotton textile waste has generally a
low impact on climate change. This impact on the environment can additionally be decreased by the
use of a biocatalyst and/or green energy sources in the production process. When the textile waste
contains PET, the use of process chemicals increases and so does the impact on climate change (and
other environmental effects). However, especially SaXcell pulp from 100 % white cotton shows big
advantages compared to sulphate pulp in the impact categories human toxicity, urban land occupation,
water depletion and a large advantage in the impact category agricultural land occupation. From this it
can be concluded that the use of cotton waste as pulp feedstock for regenerated cellulose fibres has
clear advantages compared to most pulp qualities in terms of most impact categories investigated in
this study.
Acknowledgments
The authors wish to thank TechForFuture, Centre of Expertise HTSM (http://www.techforfuture.nl)
and C&A foundation for their financial support.
References
[1] Villanueva A, Delgado L, Luo Z, Eder P, Catarino A S and Litten D 2010 Study on the selection
of waste streams for end-of-waste assessment. (Luxembourg: Publications Office of the
European Union) p 130 - 144
[2] Zacune J, 2013 Factsheet Cotton (Friends of the Earth Europe Online)
http://www.foeeurope.org/sites/default/files/publications/13_factsheet-cotton-gb.pdf
Accessed: 24-04-2017
[3] Oelerich J, Groeneveld R A J, Bouwhuis G H and Brinks G J. 2016 SaXcellTM: The
development of a new fibre from 100 % cotton waste. Proc., Int., Conf., 16th AUTEX World
Textile Conference 2016 (Ljubljana)
[4] Ecoinvent database v.3.1 2014 (Dübendorf: Swiss Centre for Life Cycle Inventories)

Investigation some characteristics of chicken feather’s rachisN Paşayev1, S Kocatepe1, N Maraş1, M Soylak2 and M Erol1,1Erciyes University Department of Textile Engineering, Kayseri / Turkey2Erciyes University Faculty of Aeronautics and Astronautics, Kayseri / Turkey
E-mail: [email protected]
Abstract: In recent years, obtaining the natural protein fibers from chicken feathers, whichare obtained as a by-product in the production of chicken meat and which causeenvironmental pollution and important part is waste, has been drawn to the perspective ofscientists. So, the investigations about the chicken feather fibers reveal important propertiesof these fibers. Chicken feather fibers are obtained by mechanical cutting of the barbs whichhave fibrous structure, the structure branched from rachis and constitute the body of thefeather. The rachis part of chicken feather constitutes approximately half of the weight of thefeathers. So, it is necessary to examine the properties of the chicken feathers in order to gaintheir industrialization. This study is concerned with the mechanical and physical properties ofthe material that is taken as a by-product in the production of fibers from chicken feathers andconstitutes the rachis part of the feathers.
1. IntroductionIn recent years, the perspective of obtaining the natural protein fibers from chicken feathers whichare obtained as a byproduct in the production of white meat and the important part is waste andcauses environmental pollution, attracts the attention of scientists. Investigations on chicken featherfibers reveal important properties of these fibers [1]-[4]. Chicken feather fibers are obtained bymechanical cutting of barbs (fibrous structure), which are extended from rachis. But today,technology of fiber production from chicken feathers is not available. Such a technology is beingdeveloped at Erciyes University (Turkey). In the production of fibers from chicken feather with usingspecial machine, the rachis part of feather is seperated from this part of the barbs.Chicken feather barbs constitutes approximately half of the weight of the feathers. This means thatindustrialization of chicken feathers should be considered about the part of the rachis. In this study,some properties of this material were examined.
2. Experiment2.1. MaterialThe material of chicken feather’s rachis used in this study was taken from “Tad Piliç” company andobtained this chicken feathers at Textile Engineering Department in Erciyes University. The chickenfeathers obtained from farm were washed at 40°C with washing matter, which has a dirt and greaseremover specialities, and sodium hypochlorite(NACIO) in terms of not damaging the fibers. After thewater of feathers was taken in the centrifuge, the feathers were dried at a temperature of 40°C in alaboratory-type feather dry machine at Erciyes University Department of Textile Engineering anddisinfection was applied for 12 minutes at 70°C temperature. The dried feathers were subjected to theprocess of separation from the rachis part of the barbs part. Separated fibers and barbs were collectedseparately (Figure 1).2.2. MethodSem analyzeOne of the important features of the chicken feather’s rachis material is related to the internalstructure of this material. The Leo440 Scanning Electron Microscope(SEM) at Erciyes UniversityTechnology Research and Application Center was used to analyze the internal and surface of rachis.The rachis was obtained with separation of barbs was cutten precisely with the help of a sharp razor

on a glass plate in transverse and longitudinal directions and affixed on metal plates with doublesided tape. Samples were subjected to SEM analysis.
Figure 1. Fiber (a) and rachis (b) materials taken in chicken feather fiber production
Mechanical properties of chicken feather’s rachisChicken feather is very different in terms of content of rachis material. Thus, the parts of the rachisare very different according to their thickness and length and this situation affects their mechanicalproperties. In order to investigate the mechanical properties of chicken feather’s rachis material,tensile tests were applied to rachis samples at Erciyes University Technology Research andApplication Center. For the test, 14 rachis samples with a length over 2cm were taken and theirthicknesses were measured. The thickness of the sample was measured at three points: both ends andmidpoints of samples were measured with calipers and obtained average value and numbered thesamples. Tensile tests were applied for each sample and all data were taken to the table.Investigation of the hygroscopic properties of the samplesThe hygroscopic properties of the rachis samples obtained from chicken feather were investigated asthe dehumidification and water absorption properties of the samples.Investigation of the getting moisture ability of chicken feather’s rachis from airAn experimental study was conducted to investigate the getting moisture ability of chicken feather’srachis and the weighing method was used to determine the moisture content of the rachis. The ambienttemperature and the relative environment humidity were chosen as the independent changing factors inthe study. The levels of change of the factors are given in Table 1.
Table 1. Test conditions for examining the getting moisture ability of chicken feather rachis from air
Independent changing factors Change levels of factors
Environment temperature, oC 20 40 60Relative environment humidity, % 65 80 95
For using in the experiments, the 3gr sample was taken from rachis mass, which was conditionedfor 2 hours at 20°C temperature and 65% relative humidity. The samples were weighed for 2 hoursunder the conditions specified in the test plan and the weights of the samples were determined byweighing and the results were written to the table. The moisture of the fiber sample which was keptfor 2 hours under the determined environment conditions according to the test plan was evaluated interms of the dry weight of the sample in percent, as following the formula:
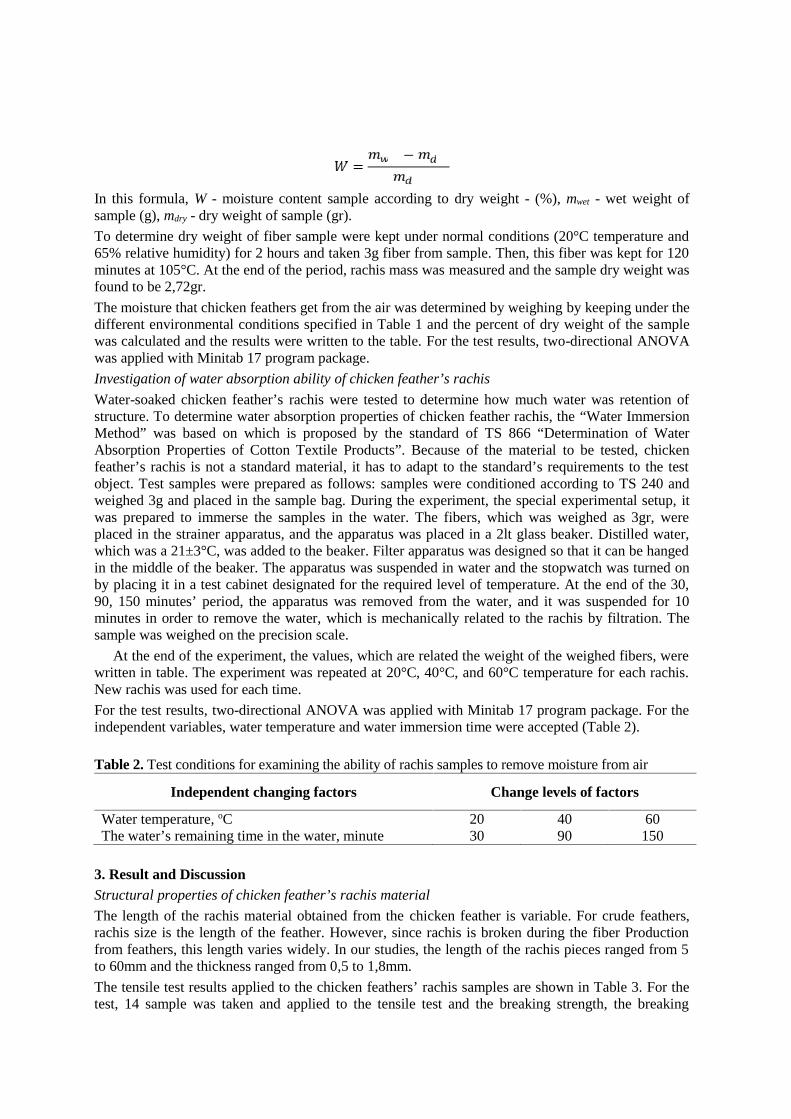
= −In this formula, W - moisture content sample according to dry weight - (%), mwet - wet weight ofsample (g), mdry - dry weight of sample (gr).To determine dry weight of fiber sample were kept under normal conditions (20°C temperature and65% relative humidity) for 2 hours and taken 3g fiber from sample. Then, this fiber was kept for 120minutes at 105°C. At the end of the period, rachis mass was measured and the sample dry weight wasfound to be 2,72gr.The moisture that chicken feathers get from the air was determined by weighing by keeping under thedifferent environmental conditions specified in Table 1 and the percent of dry weight of the samplewas calculated and the results were written to the table. For the test results, two-directional ANOVAwas applied with Minitab 17 program package.Investigation of water absorption ability of chicken feather’s rachisWater-soaked chicken feather’s rachis were tested to determine how much water was retention ofstructure. To determine water absorption properties of chicken feather rachis, the “Water ImmersionMethod” was based on which is proposed by the standard of TS 866 “Determination of WaterAbsorption Properties of Cotton Textile Products”. Because of the material to be tested, chickenfeather’s rachis is not a standard material, it has to adapt to the standard’s requirements to the testobject. Test samples were prepared as follows: samples were conditioned according to TS 240 andweighed 3g and placed in the sample bag. During the experiment, the special experimental setup, itwas prepared to immerse the samples in the water. The fibers, which was weighed as 3gr, wereplaced in the strainer apparatus, and the apparatus was placed in a 2lt glass beaker. Distilled water,which was a 21±3°C, was added to the beaker. Filter apparatus was designed so that it can be hangedin the middle of the beaker. The apparatus was suspended in water and the stopwatch was turned onby placing it in a test cabinet designated for the required level of temperature. At the end of the 30,90, 150 minutes’ period, the apparatus was removed from the water, and it was suspended for 10minutes in order to remove the water, which is mechanically related to the rachis by filtration. Thesample was weighed on the precision scale.
At the end of the experiment, the values, which are related the weight of the weighed fibers, werewritten in table. The experiment was repeated at 20°C, 40°C, and 60°C temperature for each rachis.New rachis was used for each time.For the test results, two-directional ANOVA was applied with Minitab 17 program package. For theindependent variables, water temperature and water immersion time were accepted (Table 2).
Table 2. Test conditions for examining the ability of rachis samples to remove moisture from air
Independent changing factors Change levels of factors
Water temperature, oC 20 40 60The water’s remaining time in the water, minute 30 90 150
3. Result and DiscussionStructural properties of chicken feather’s rachis materialThe length of the rachis material obtained from the chicken feather is variable. For crude feathers,rachis size is the length of the feather. However, since rachis is broken during the fiber Productionfrom feathers, this length varies widely. In our studies, the length of the rachis pieces ranged from 5to 60mm and the thickness ranged from 0,5 to 1,8mm.The tensile test results applied to the chicken feathers’ rachis samples are shown in Table 3. For thetest, 14 sample was taken and applied to the tensile test and the breaking strength, the breaking

extension and elastic modulus values are written in accordance with thickness values of the samples.As can be seen here, there is a close relationship between the tensile strength and the thickness of therachis material. The mean values of the mechanical properties are given in Table 3.
Table 3. Tensile test results applied to chicken feather rachis
SampleDiameter of
rachis sample, 10-3
m
MaxStrength,
N
Max Extension,%
Elasticity modulus,100∙MPa
1 1,25 45,81 4,88 9,962 1,33 64,66 8,44 8,043 1,07 27,06 3,79 8,774 1,32 54,62 7,51 10,765 1,40 76,25 9,79 8,146 1,69 82,71 5,01 10,177 1,52 80,83 9,17 8,238 1,37 59,70 7,22 9,019 1,47 73,23 10,19 8,2310 1,34 56,58 4,68 11,4011 1,22 37,34 4,55 9,0712 1,39 39,33 3,39 8,9413 1,12 34,56 5,22 9,3314 1,16 37,48 3,67 11,65
Average value 1,33 55,01 6,25 9,41
The specific weight of chicken feather material is known as 0,80g/m³ [2]. According to measurementof volumetric weight of rachis is 0,255g/m³ in our study.One of the most important features of the feathers is that they are extremely light, which is due to thehollow structure of the feather material. Through SEM analysis, micro-porous microstructure ofchicken feather bars and rachis were obtained and is was seen that this structure was similar to eachother (Figure 2).
Figure 2. SEM images of the microcellular internal structure of chicken feather fiber and rachis
In Figure 3, SEM images of transverse and longitudinal sections of rachis samples are given. It hasbeen revealed that the pores forming this structure are in the form of microcells with dimensions of5…20 µm, which are closed on all sides.
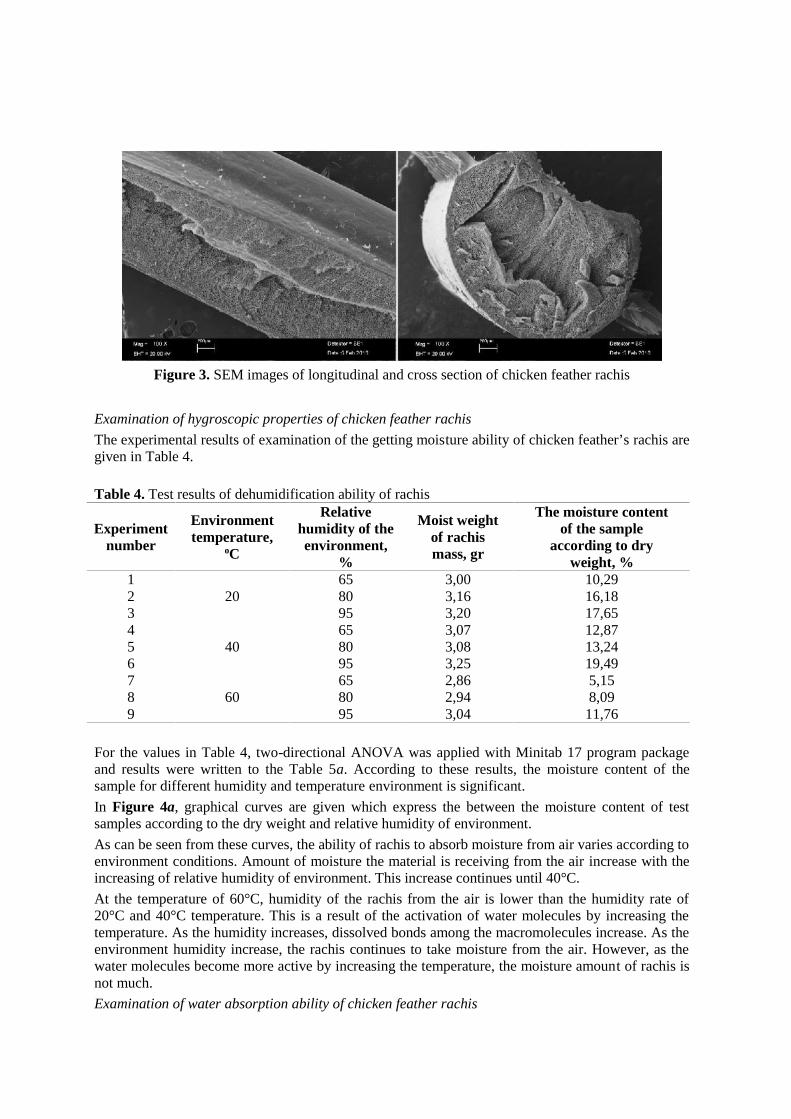
Figure 3. SEM images of longitudinal and cross section of chicken feather rachis
Examination of hygroscopic properties of chicken feather rachisThe experimental results of examination of the getting moisture ability of chicken feather’s rachis aregiven in Table 4.
Table 4. Test results of dehumidification ability of rachis
Experimentnumber
Environmenttemperature,
oC
Relativehumidity of theenvironment,
%
Moist weightof rachismass, gr
The moisture contentof the sample
according to dryweight, %
120
65 3,00 10,292 80 3,16 16,183 95 3,20 17,654
4065 3,07 12,87
5 80 3,08 13,246 95 3,25 19,497
6065 2,86 5,15
8 80 2,94 8,099 95 3,04 11,76
For the values in Table 4, two-directional ANOVA was applied with Minitab 17 program packageand results were written to the Table 5a. According to these results, the moisture content of thesample for different humidity and temperature environment is significant.In Figure 4a, graphical curves are given which express the between the moisture content of testsamples according to the dry weight and relative humidity of environment.As can be seen from these curves, the ability of rachis to absorb moisture from air varies according toenvironment conditions. Amount of moisture the material is receiving from the air increase with theincreasing of relative humidity of environment. This increase continues until 40°C.At the temperature of 60°C, humidity of the rachis from the air is lower than the humidity rate of20°C and 40°C temperature. This is a result of the activation of water molecules by increasing thetemperature. As the humidity increases, dissolved bonds among the macromolecules increase. As theenvironment humidity increase, the rachis continues to take moisture from the air. However, as thewater molecules become more active by increasing the temperature, the moisture amount of rachis isnot much.Examination of water absorption ability of chicken feather rachis

Water absorption test results of water-dipped chicken feather’s rachis are shown in Table 6. İn Table5b gives the variance analysis applied to these results. In Figure 4b, according to the table values,when compared the water amount of rachis material according to dry weight with water immersiontime of samples, the graphical curves are given. These curves show that water absorption ability ofrachis material changes according to water absorption time and water temperature in a certain way.
Table 5. ANOVA tables of dehumidification test results of rachis
Notes: HRS – Humidity ration of sample; RHE – Humidity of environment, ET – EnvironmentTemperature,
WPS – The wetting period of the sample, T – Temperature
Figure 4. Changing in the rate of dehumidification in chicken feather rachis according toenvironment humidity
As can be seen from graphs in Table 5 and Figure 6, the amount of water retained in the structure ofsample between 20-60°C temperature, which are tested to the getting water test for 30, 60, and 150minutes, is decreasing at the first time with increased water-dip time in constant environmenttemperature.
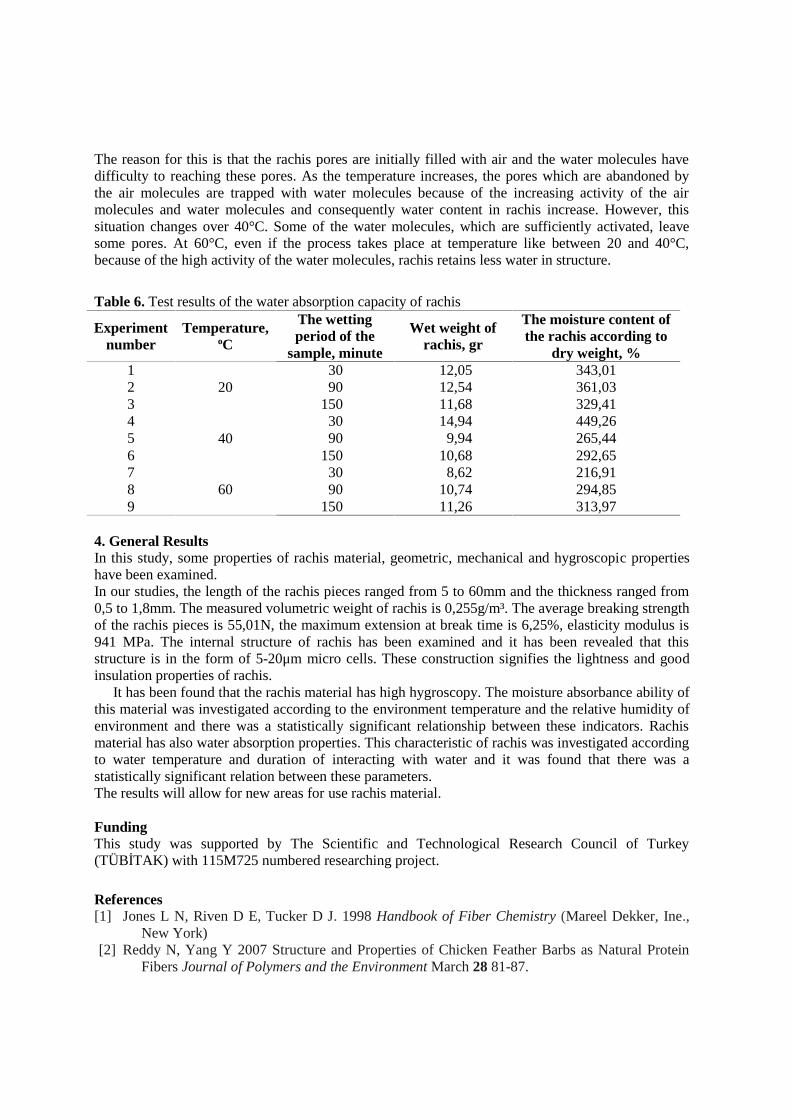
The reason for this is that the rachis pores are initially filled with air and the water molecules havedifficulty to reaching these pores. As the temperature increases, the pores which are abandoned bythe air molecules are trapped with water molecules because of the increasing activity of the airmolecules and water molecules and consequently water content in rachis increase. However, thissituation changes over 40°C. Some of the water molecules, which are sufficiently activated, leavesome pores. At 60°C, even if the process takes place at temperature like between 20 and 40°C,because of the high activity of the water molecules, rachis retains less water in structure.
Table 6. Test results of the water absorption capacity of rachis
Experimentnumber
Temperature,oC
The wettingperiod of the
sample, minute
Wet weight ofrachis, gr
The moisture content ofthe rachis according to
dry weight, %1
2030 12,05 343,01
2 90 12,54 361,033 150 11,68 329,414
4030 14,94 449,26
5 90 9,94 265,446 150 10,68 292,657
6030 8,62 216,91
8 90 10,74 294,859 150 11,26 313,97
4. General ResultsIn this study, some properties of rachis material, geometric, mechanical and hygroscopic propertieshave been examined.In our studies, the length of the rachis pieces ranged from 5 to 60mm and the thickness ranged from0,5 to 1,8mm. The measured volumetric weight of rachis is 0,255g/m³. The average breaking strengthof the rachis pieces is 55,01N, the maximum extension at break time is 6,25%, elasticity modulus is941 MPa. The internal structure of rachis has been examined and it has been revealed that thisstructure is in the form of 5-20μm micro cells. These construction signifies the lightness and goodinsulation properties of rachis.
It has been found that the rachis material has high hygroscopy. The moisture absorbance ability ofthis material was investigated according to the environment temperature and the relative humidity ofenvironment and there was a statistically significant relationship between these indicators. Rachismaterial has also water absorption properties. This characteristic of rachis was investigated accordingto water temperature and duration of interacting with water and it was found that there was astatistically significant relation between these parameters.The results will allow for new areas for use rachis material.
FundingThis study was supported by The Scientific and Technological Research Council of Turkey(TÜBİTAK) with 115M725 numbered researching project.
References[1] Jones L N, Riven D E, Tucker D J. 1998 Handbook of Fiber Chemistry (Mareel Dekker, Ine.,
New York)[2] Reddy N, Yang Y 2007 Structure and Properties of Chicken Feather Barbs as Natural Protein
Fibers Journal of Polymers and the Environment March 28 81-87.

[3] Martinez-Hernandez A L, Velasco-Santos C 2012. Keratın Fıbers From Chıcken Feathers:Structure And Advances In Polymer Composıtes Keratin: Structure, Properties andApplications (Nova Science Publishers, Ine. N.Y.)
[4] Chinta S K, Landage S M, Yadav K 2013. Application of Chicken Feathers inTechnical TextilesInternational Journal of lnnovative Research in Science, Engineering and Technology Vol. 2,Issue 4 1158-1165
Multiple faces of contemporary hand knitting
A Pavko-Čuden
University of Ljubljana, Faculty of Natural Sciences and Engineering, Department of
Textiles, Graphic Arts and Design, Snežniška ulica 5, 1000 Ljubljana, Slovenia
E-mail: [email protected]
Abstract. Knitting and crocheting are traditional textile techniques with great significance both
in history and modern times. Similar to other textile techniques, knitting has developed into a
diversified industrial sector, comprising the production of knitted fabrics, knitwear, hosiery and
fashion accessories. At the same time, contemporary knitting and crocheting became hobbies
as well as arts-and-crafts activities, extending to various areas of work and leisure. Historical
and traditional ethnic knitting and crocheting patterns keep inspiring designers’ collections and
also other industrial products. Not so long ago, knitting was seen as an ordinary and
unchanging indoor activity and, in its domestic history, it was the preserve of older women
making products of dainty work and taste. Today, knitting deals with urban population of all
classes. The popularity of leisure hand knitting is increasing; moreover, hand knitting is
becoming more and more widespread among young people. With the emergence of artistic and
handicraft markets, hand-knitting and crocheting developed into a profitable market activity.
Positive effects of hand knitting have become increasingly important - from generating
creativity and innovativeness, through knitting and socializing in groups, to medical and
therapeutic effects as well as social and global connections. Yarn bombing, yarn storming or
graffiti knitting has been used to describe urban social practices of knitted objects placed, or
tagged, in public spaces. Knitting became means of communication, artistic and social
expression and statement. The advantage of hand knitting is its mobility. One can knit almost
everywhere, and for hand knitting, only a ball of yarn and knitting needles are required. Hand-
knitted products have nice touch, they are custom-made and therefore personalized.
1. Introduction
Knitting and crocheting are traditional textile techniques with great significance both in history and
modern times. Similar to other textile techniques, knitting has developed into a diversified industrial
sector, comprising the production of knitted fabrics, knitwear, hosiery and fashion accessories for
clothing as well as for non-clothing purposes. At the same time, contemporary knitting and crocheting
became hobbies as well as means of artistic expression and arts-and-crafts activities, extending to
various areas of work and leisure. Historical and traditional ethnic knitting and crocheting patterns
keep inspiring designers’ collections and also other industrial products.
Not so long ago, knitting was seen as an ordinary and unchanging indoor activity and, in its
domestic history, it was the preserve of older women making products of dainty work and taste [1].
Today, knitting deals with rural and urban population of all classes. The popularity of leisure hand
knitting and crocheting is increasing; moreover, hand knitting is becoming more and more widespread
among young urbans. With the emergence of hobby and artistic handicraft markets, hand-knitting and
crocheting developed into a profitable market activity.
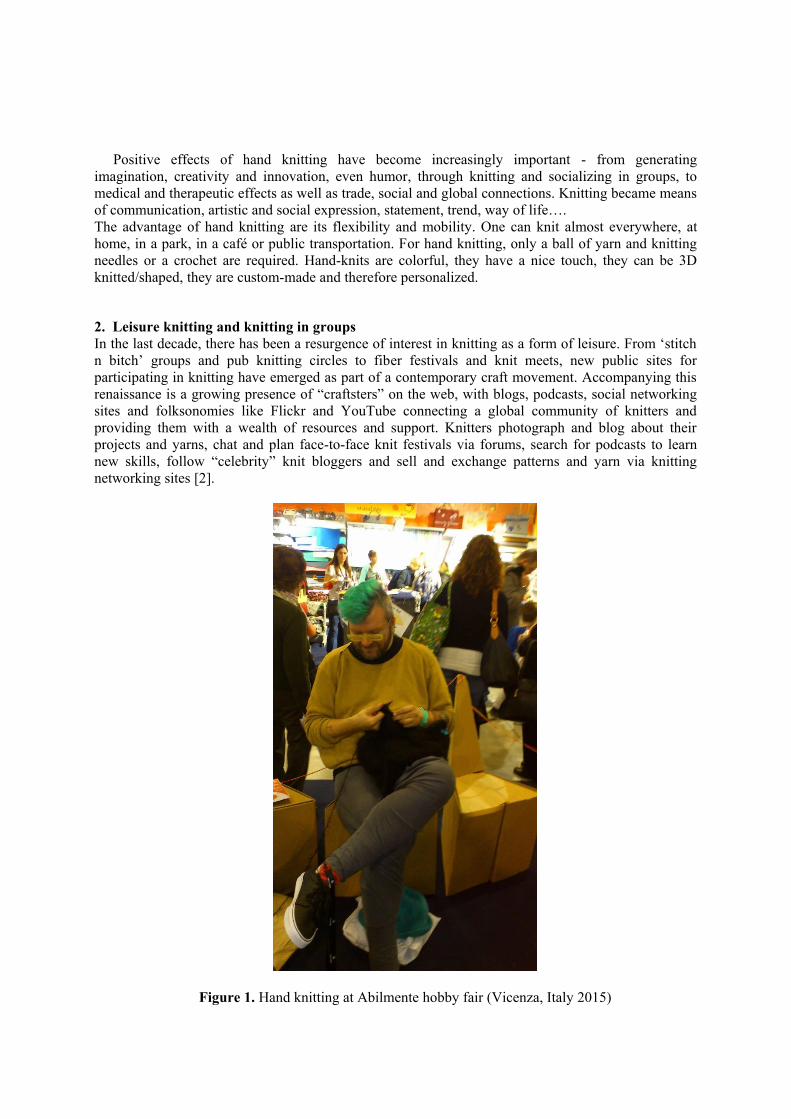
Positive effects of hand knitting have become increasingly important - from generating
imagination, creativity and innovation, even humor, through knitting and socializing in groups, to
medical and therapeutic effects as well as trade, social and global connections. Knitting became means
of communication, artistic and social expression, statement, trend, way of life….
The advantage of hand knitting are its flexibility and mobility. One can knit almost everywhere, at
home, in a park, in a café or public transportation. For hand knitting, only a ball of yarn and knitting
needles or a crochet are required. Hand-knits are colorful, they have a nice touch, they can be 3D
knitted/shaped, they are custom-made and therefore personalized.
2. Leisure knitting and knitting in groups
In the last decade, there has been a resurgence of interest in knitting as a form of leisure. From ‘stitch
n bitch’ groups and pub knitting circles to fiber festivals and knit meets, new public sites for
participating in knitting have emerged as part of a contemporary craft movement. Accompanying this
renaissance is a growing presence of “craftsters” on the web, with blogs, podcasts, social networking
sites and folksonomies like Flickr and YouTube connecting a global community of knitters and
providing them with a wealth of resources and support. Knitters photograph and blog about their
projects and yarns, chat and plan face-to-face knit festivals via forums, search for podcasts to learn
new skills, follow “celebrity” knit bloggers and sell and exchange patterns and yarn via knitting
networking sites [2].
Figure 1. Hand knitting at Abilmente hobby fair (Vicenza, Italy 2015)

The growth of do it yourself (DIY) craft culture, of which knitting is a part, itself has a history that
encompasses professional and leisure practices, diverse forms of production and consumption, fine art,
performance and fashion with activities spanning public and private spheres [2]. Knitting, along with a
number of other lifestyle activities like gardening and cooking, is seen as providing an alternative
temporality which allows individuals to create meaning outside of the spheres of domesticity or
employment [3]. This nostalgic reclaiming of craft is understood as a response to mass consumerism,
globalization and the homogeneity of the high street, reflecting a desire for individualization and a
playful and ironic trend for celebrating domesticity in popular culture [4,2]. On the other hand, it was
proved that knitting in a group impacts significantly on perceived happiness, improved social contact
and communication with others [5]. In 2012, Slovenian group launched the project Connections.
Connections was a textile installation in progress. Project offered moments of calm engagement,
creative expression, healing remembrance, relaxed socialization to regular people. Visitors were
invited to take off shoes, sit down, inspect, touch, and learn simple textile technique, how to make a
rug with their fingers. The project connected people by working together on the symbolic textile field
– carpet [6].
Figure 2. Group knitting with fingers: project Connections (Ljubljana, Slovenia 2012)
(http://www.oloopdesign.com/en/projects/connections/)
3. Therapeutic knitting
There is increasing evidence that engaging in creative and meaningful occupation can impact
positively on health and wellbeing. The results of an online survey among more than 300 knitters
showed that there was a significant relationship between knitting frequency and feeling calm and
happy. More frequent knitters also reported higher cognitive functioning [5]. Knitters control the
rhythm of their craft and may change it according to their mood. This rhythm is instantaneously
calming [7].
Therapeutic knitting takes the benefits of knitting and enhances them to improve well-being or to
treat certain medical conditions. The psychological benefits of knitting alone or within a group range
from distraction, refocusing of attention, and enabling feelings of control to providing rewarding
occupation and enabling relaxation and contribution. Through knitting, lost emotions associated with
anticipation, pride, excitement, and happiness are reawakened. Life circumstances such as illness,
retirement, or redundancy can change identity and perception of self. Knitting can enable the knitter to

build a new positive identity through, for example, knitting for charity [7]. Knitting complex patterns
can also be beneficial for hand joint exercise and memory training.
4. Knitting art
Because of the nature of the stitch and the use of a continuous thread, knitted fabrics are very strong
and can be used to support large structures. Knitting that appears in unexpected environments, knitting
that masquerades, as something it is not, knitting that provokes questions – this is when knitting
becomes art [8].
The textile that had arisen as a need since the birth of humankind changed over time and managed
to get out of everyday use. The knitting that takes place among the textile arts which are emerging
together with the cultural history of mankind has proceeded on its way together with the growing
cultures and the age without slowing down and has been used in the field of art. Contemporary artists
have revealed new forms of art of knitting by getting out of traditions or by reinterpreting the
traditional values [9].
For example, Sandra Backlund is a knitting artist that brings architectural forms to knitwear. Her
knitted garments are more pieces of art than wearable clothes.
Figure 3. Sandra Backlund: Ink Blot Test (http://sandrabacklund.com/previous-
collection.php?page=28)
5. Guerilla knitting
Guerilla knitting also named yarn bombing, yarn storming or graffiti knitting has been used to describe
urban social practices of knitted objects placed, or tagged, in public spaces. This amusing new trend
encourages young urbanites to wrap colorful knitted fabric around lamp posts, trees, and sometimes
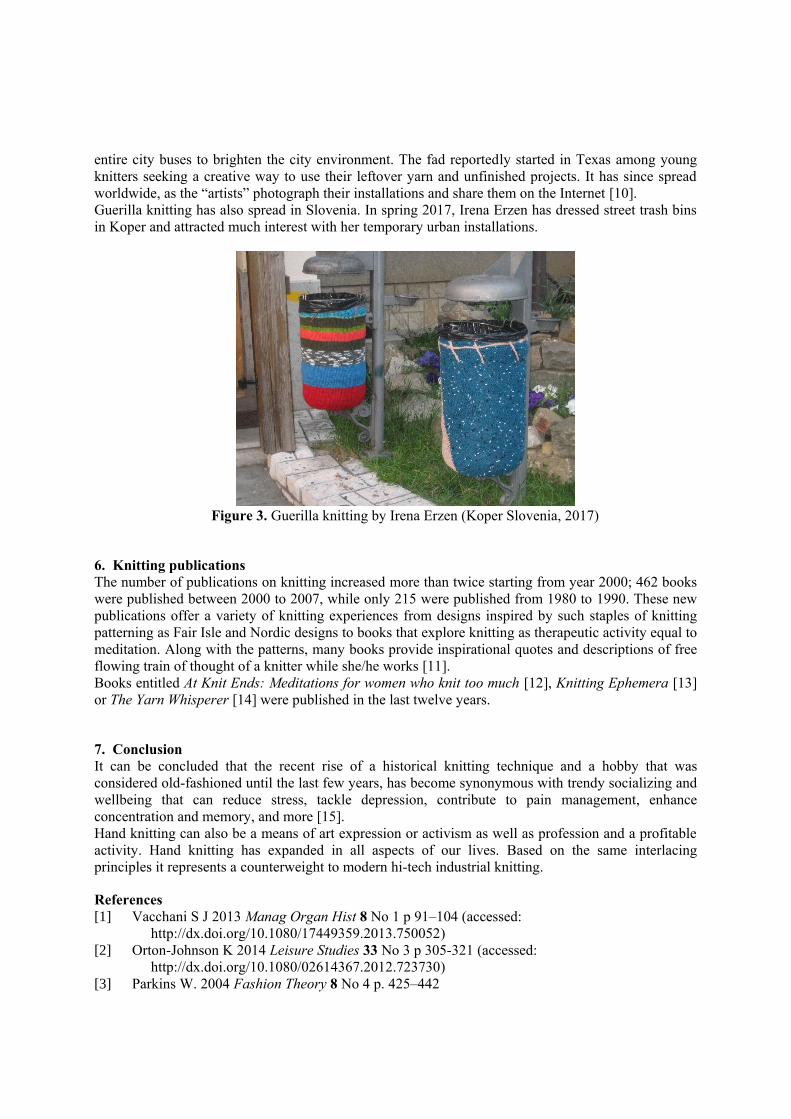
entire city buses to brighten the city environment. The fad reportedly started in Texas among young
knitters seeking a creative way to use their leftover yarn and unfinished projects. It has since spread
worldwide, as the “artists” photograph their installations and share them on the Internet [10].
Guerilla knitting has also spread in Slovenia. In spring 2017, Irena Erzen has dressed street trash bins
in Koper and attracted much interest with her temporary urban installations.
Figure 3. Guerilla knitting by Irena Erzen (Koper Slovenia, 2017)
6. Knitting publications
The number of publications on knitting increased more than twice starting from year 2000; 462 books
were published between 2000 to 2007, while only 215 were published from 1980 to 1990. These new
publications offer a variety of knitting experiences from designs inspired by such staples of knitting
patterning as Fair Isle and Nordic designs to books that explore knitting as therapeutic activity equal to
meditation. Along with the patterns, many books provide inspirational quotes and descriptions of free
flowing train of thought of a knitter while she/he works [11].
Books entitled At Knit Ends: Meditations for women who knit too much [12], Knitting Ephemera [13]
or The Yarn Whisperer [14] were published in the last twelve years.
7. Conclusion
It can be concluded that the recent rise of a historical knitting technique and a hobby that was
considered old-fashioned until the last few years, has become synonymous with trendy socializing and
wellbeing that can reduce stress, tackle depression, contribute to pain management, enhance
concentration and memory, and more [15].
Hand knitting can also be a means of art expression or activism as well as profession and a profitable
activity. Hand knitting has expanded in all aspects of our lives. Based on the same interlacing
principles it represents a counterweight to modern hi-tech industrial knitting.
References
[1] Vacchani S J 2013 Manag Organ Hist 8 No 1 p 91–104 (accessed:
http://dx.doi.org/10.1080/17449359.2013.750052)
[2] Orton-Johnson K 2014 Leisure Studies 33 No 3 p 305-321 (accessed:
http://dx.doi.org/10.1080/02614367.2012.723730)
[3] Parkins W. 2004 Fashion Theory 8 No 4 p. 425–442
[4] Greer B 2008 Knitting for good! A guide to creating personal, social and political change,
stitch by stitch (Boston, MA: Trumpeter books)
[5] Riley J, Corkhill B and Morris C 2013 Br J Occup Ther 76 No 2 p 50-57
[6] Oloopdesign Connections (accessed: http://www.oloopdesign.com/en/projects/connections/)
[7] Corkhill B, Hemmings J, Maddock A and Riley J 2014 Textile 12 Iss 1 p 34-57
[8] Black S 2012 Knitting fashion, industry, craft (London : V&A Publishing)
[9] Tavman M B and Oskay N Knitting in art 2012 Proceedings of 46th International Congress
IFKT 6 - 8 September 2012, Sinaia, Romania
[10] McIntosh B 2011 English Teaching Forum No 1 p 36-43 (accessed:
https://americanenglish.state.gov/files/ae/resource_files/49_1_6_feature-article.pdf)
[11] Hosegood B 2009 The Journal of Cloth & Culture 7 No 2 p 148-163
[12] Pearl Mc-Phee S 2005 At Knit Ends: Meditations for Women Who Knitt Too Much (North
Adams MA : Storey Publishing)
[13] Sulcoski C J 2015 Knitting Ephemera (New York : Sixth&Springbooks)
[14] Parkes C 2013 The Yarn Whisperer (New York : Stewart, Tabori & Chang)
[15] Hamburgh R Knitting as therapy (accessed: http://www.rin-hamburgh.co.uk/2014/03/knitting-
therapy-welldoing/)

Assessment of toxicity of raw textile wastewater and after its
reuse
Jorge Marcos Rosa 1
; Suely Ivone Borrely 2
; Maurício de Campos Araújo 1
1 University of São Paulo - USP
Arlindo Bettio Avenue, 1000 - Emerlino Matarazzo
CEP 03828-000 - São Paulo - SP - Brazil 2
Institute of Energetic and Nuclear Researches,
Lineu Prestes Avenue,2242 - Butantã
CEP 03178-200 - SãoPaulo - Brazil
Corresponding author
Email: [email protected]
Abstract. Five consecutive dyeings were made using the treated effluent in every step. All
photochemical treatments obtained decolourization efficiency (DE) above 90%, allowing the
effluent to be reused in dyeings with fluorescent brighteners, from the first until the last treated
effluent. In this proposed process, the rate of total organic carbon (TOC) presented after five
consecutive dyeings achieved with treated effluent was 34 mg L-1
compared with 435 mg L-1
of
the final effluent that was obtained after five conventional processes. The salinity of the final
effluent obtained by this proposed process was 2.34 g L-1
of NaCl compared with 25.00 g L-1
presented in the effluent obtained by the conventional process. The values of the colour
fastness to water showed no significant differences between the colours that were made by two
processes. The average water consumption for a one-kilogram cotton dyeing after fifteen
dyeings achieved by this proposed process was approximately 24 litres compared with the 70
litres that were consumed by the conventional process. However, the final treated effluent
presented values of toxicity < 6.25% (EC50, with 95% confidence interval) against 10.25% of
the raw effluent. It means that in the sample concentration of the treated effluent presented
100% of Daphina similis mortality, indicating that this sample was more toxic than the raw
effluent.
Keywords: toxicity, reuse of water, reactive dyestuff, dyeing of cotton, textiles
1. Introduction
The reactive dyestuff, which is the primary type of dyestuff that is used in Brazil and in all over the
world [1,2], contains a reactive group forming a covalent bond with the fibre polymer and acts as an
integral part of the fibre. This covalent bond is formed between the dye molecules and the terminal –
OH (hydroxyl) group of cellulosic fibres or between the dye molecules and the terminal –NH2
(amino) group of polyamide or wool fibres. Moreover, textile processing effluents are often
characterized by a high content level of dissolved organic dyes, resulting in large values of chemical
and biological oxygen demands (COD and BOD) in the aquatic systems into which they are
discharged. Moreover, reactive dyeing is the most commonly used coloration method for cotton, yet, it
generates the most problematic effluents that are not only difficult to treat but also non-reusable. Such
wastewater streams are a major environmental issue in developing countries [3-5].
It has been studied by researchers from many countries, including various types of treatments by
photocatalysis. As example, Ben Younes et al [6] investigated the ability of Trametes trogii to
decolorize azo and triarylmethane-dyes in the absence of redox mediators and studied various physico-
chemical parameters in order to achieve maximum dye decolorization. Xiao et al [7] investigated
supported perovskite oxide (LaFeO3/SBA-15) for the first time as catalyst for the oxidation of organic
dyestuff using hydrogen peroxide as oxidant, where tests indicate that LaFeO3/SBA-15 has large
adsorption capacity, good catalytic performances, and wide working pH ranges (from 2 to 10) for the
oxidation of dyestuff such rhodamine B, reactive brilliant red X-3B and direct scarlet 4BS.
Dias et al [8] evaluated the use of a residue-based catalyst for heterogeneous photo-Fenton of
Reactive Black 5 dyestuff (RB5), preparing the catalyst by chemical vapor deposition of ethanol on a
red mud residue, an important waste of the aluminum industry rich in iron oxide. Semeraro et al. [9]
investigated the interactions between two industrial textile dyestuff in an aqueous solution and a series
of different commercial cyclodextrins at 25 °C by spectrophotometric and electrochemical
measurements to study their efficiency in the removal of colour from real textile wastewater in order
to recover and reuse both clean water and dyes for other industrial processes, which is the same
objective of this study.
Synthetic polyethylenimine and biopolymer chitosan were employed by Dasgupta et al. [10] in
order to initiate the retention of anionic reactive red 120 (RR 120) from its aqueous solutions using
polymer-enhanced ultrafiltration. In the ionizing radiation area, Borrely et al. [11] investigated colour
and toxicity removal of C.I Reactive Blue 222 after radiation processing, which was conducted using a
dynamitron electron beam accelerator. The best value of colour removal by radiation was 90%, with
2.5 kGy, in which Daphnia similis and Brachionus plicatilis were fitted well. All those factors
mentioned before, such as water consumption, waste treatment, cotton fibre, reactive dyestuff and
their effluents, were decisive for the development of this study.
2. Material and Methods
2.1. Reagents and materials Sodium metasilicate 98% (Quimesp), nonionic detergent, nonionic levelling agent, fluorescent
brightener and catalase (Golden Technology) were used in the processes of bleaching and white
dyeings; hydrogen peroxide 50% (Quimesp) was used in the processes of bleaching, white dyeings
and homogeneous photocatalysis; sulfuric acid 98% (Labsynth) was used for pH correction (Quimis
pH metre); potassium titanium oxalate 0.1 mol L-1
(Merck) was used to detect hydrogen peroxide
(H2O2) residuals after bleaching and photocatalysis processes.
C. I. Reactive Yellow 145; C. I. Reactive Orange 122, C. I. Reactive Red 239, Azo chromophore
group, heterobifunctional reactive groups type VS+MCT, 1136.32 g mol-1
and CAS Registry Number
89157-03-9 (RR239) and C. I. Reactive Black 5, Azo chromophore group, homobifunctional reactive
groups type VS+VS, 991.82 g mol-1
and CAS Registry Number 12225-25-1/17095-24-8 (RB5) were
provided by Golden Technology; sodium chloride 98%, sodium carbonate 98% and sodium hydroxide
98% (Quimesp) were used in the dyeings process; 100% cotton woven fabric, 180 g m-2
, 26 yarns 20/1
Ne per cm in the weft and 24 yarns 30/1 Ne per cm in the warp were also used.

2.2. Procedures 2.2.1. Bleaching. The bleaching process was executed in a jigger (Jigger Mathis) in 100 g samples
with a liquor ratio of 10:1 using 1.0 g L-1
detergent; 1.0 g L-1
levelling agent and 0.5 g L-1
sodium
metasilicate (Na2SiO3). In the case of H2O2, bleaching was conducted with normal water with 4.0 mL
L-1
, and the bleaching achieved with reuse water was executed with ‘4.0 - QR’ mL L-1
, where ‘QR’ is
the residual amount of H2O2 detected after the photochemical treatment [12]. In both cases, the
substrate was treated for 30 min at 95 ºC. Then, the bath was cooled to 55 ºC, and the pH was adjusted
to 6.5. After 5 min at 55 ºC, 0.5 g L-1
of catalase was added, and the temperature was maintained
during the 15 min in order to remove residual of H2O2. The 0.1 mol L-1
(C4K2O9Ti) potassium titanium
oxalate solution was used to detect any possible H2O2 residual.
2.2.2. Dyeings, Five colours and their Pantone® numbers were based on the Book of SENAI Mix
Design Spring/Summer 2016/2017. The dyeing recipes were obtained by Match Wizard® software
(Datacolor 650 SF Plus) and are described in the Table 1.
Table 1. Recipes of dyeing
Color Pantone®
Black -
Cosmic 194027
Mystic 193323
Refugy 191543
Safari 180312
The Euclidian distance between the colours obtained with normal water versus the colours obtained
with treated effluent was calculated by the equation
E* = [(a*)2 + (b*)
2 + (L*)
2]
1/2
where a* represents the green-red axis, b* represents the yellow-blue axis and L* represents the
white-black axis.
The amount of salt (NaCl), sodium carbonate (Na2CO3) and sodium hydroxide (NaOH) used in all
the dyeings were obtained using the manufacturer's recommendations. The only exception was the
amount of NaCl that was used in dyeings made with recycled water; in these cases, the recommended
amount of NaCL was subtracted from the amount that was already present and determined by
conductivimetry (Digimed DM-32). These values were obtained by correlation between the specific
conductivity (S cm-1
) and known concentrations of NaCl. The correlation graphic and the equation
are shown in Figure 1.
Figure 1
Figure 1. Correlation between conductivity and [NaCl]

The recipes are described in Table 2, including the amounts of dyestuff and auxiliaries that were
utilized in all dyeings.
Table 2. Amounts of dyeings chemicals
Color RY145 RR239 RB5
Base
RB5 NaCl Na2CO3 NaOH 50 ºBé
% g L-1
mL L-1
Black - - - 7.000 70.000 7.000 2.000
Cosmic 0.205 0.366 3.000 - 60.000 7.000 1.500
Mystic 0.284 1.040 1.420 - 50.000 6.000 1.500
Refugy 0.700 1.440 0.300 - 50.000 6.000 1.500
Safari 0.950 0.800 0.680 - 50.000 6.000 1.500
All dyeings were executed by the “All in” process proposed by Salem [13]. The baths of every step
were collected, the pH was adjusted to 7.0 (H2SO4), and the final effluent was stored to posterior
photochemical treatment.
2.2.3. Photocatalysis treatments. The photocatalysis processes were performed in a batch reactor
with a capacity of 10 L, using 3 lamps Phillips TL 8 W with irradiation type UV-C in 253.7 nm
operating with 50 V, 2 A and independent actuation, setting the potency variation to 8 W, 16 W or 24
W. Circulation of the bath was provided by a 6 W pump, with a circulation capacity equal to 150 L h-1
.
Based on the results presented by Rosa et al. [14], the first effluent was diluted in a 4:1 ratio of
water and effluent. The water in the next effluent was replaced by the previously treated effluent.
Time was maintained until a minimum of 85% of decolourization efficiency (DE) was reached, as
calculated by equation
% DE = [1 – (Abso / Absf)] · 100
In order to use the absorbance decay, aliquots of 12 mL were collected in intervals of 15 min and
conditioned in acrylic bucks with 1.0 cm of optical path. The absorbance (Abs) of the aliquots was
assessed by spectrophotometry VIS (Konica-Minolta CM 3600d).
2.2.4. Reuse of treated effluents. The first dyeing effluent treatment was diluted in a 4:1 ratio with
water. The second dyeing effluent treatment was diluted in a 4:1 ratio with the first treated effluent
instead water; this process continued with the third dyeing and so on, until 15 dyeings were completed.
A white dyeing was performed in order to verify a possible interference in this type of dyeing when
executed with treated effluents after treatment with each of the 15 dyeings. In addition, white dyeings
were also conducted with water and compared by the whiteness index (Wi), which was determined by
the Ganz-Griesser method [15] and calculated by the following equation
Wi = (1 · Y) + (-1868.322 · x) + (-3695.690 · y) + 1809.441
where Y is the value of Y-tristimulus of the sample; x and y are the values of the chromaticity
coordinates assessed by spectrophotometry VIS at 470 nm, under D65 illuminant at 10° (Konica-
Minolta CM 3600d).
2.2.5. Colourfastness. The fastness properties of all colours were tested and assessed according to
the standards described by the ISO 105-E01 Textiles from the International Organization for
Standardization (ISO) [16]. All colour changes and staining were assessed by the grey scale using
spectrophotometer software (Konica-Minolta CM 3600d) under illuminant D65. Before the tests, the
samples were conditioned for 24 h in a standard atmosphere at 20 ± 2°C and at a relative humidity of
65 ± 2 %.
2.2.6. Total organic carbon (TOC). The TOC was determined by the 5310-D/14878 method [17]
after the photochemical treatment of the 5th dyeing (proposed process) and in the untreated effluent
after 5th dyeings (conventional process).

2.2.7. Toxicitity. The toxicity test for Daphnia similis was performed according to procedure
described by ABNT NBR 12713/2009 norm [18]. The results, expressed in EC50, indicate the median
concentration of the effluent that caused toxic effect, or immobility, on the microorganisms exposed to
the sample for 48 hours.
3. Results and discussion
3.1. Effluents treatment All photocatalysis treatments presented DE values higher than 90%, all of them indicating reactions
of first order. The sample values are described in Table 3.
Table 3. Obtained DE values.
n Color Abso Absf DE Time
(min) máx
(nm)
1º Black 2.3468 0.0003 99.99 240 600
2º Cosmic 0.7943 0.0048 99.40 240 560
3º Mystic 0.5650 0.0013 99.77 240 540
4º Refugy 0.4669 0.0078 98.33 240 540
5º Safari 0.3394 0.0057 98.32 240 550
The obtained values allow continuous reuse in the 5-colour dyeings and also in the all-white
dyeings.
3.1.1. Reuse of effluent: White dyeings. The Wi values were used as comparisons between white
dyeings executed with treated effluent versus white dyeings executed with water, as described in Table
4.
Table 4. Wi values of the white dyeings.
White dyeing executed after
treatment of effluent:
Wi values (%)
Water Treated effluent
1-Black 152 152 0.00
2-Cosmic 149 148 0.67
3-Mystic 155 148 4.52
4-Refugy 146 144 1.37
5-Safari 145 139 4.14
Deviation Media 2.14
For the results presented, in which the average deviation was lower than 3%, it is concluded that
the difference was not significant between the white dyeings executed with normal water and the
treated effluent, which demonstrated that the process can be applied not only for future dyeings of
colours but also for washes and other bleaching processes.
3.1.2. Reuse of effluent: Colours. The E* values that were used as comparisons between colours
dyeings executed with treated effluent versus colours dyeings executed with water are described in
Table 5.
Table 5. Values of E*.
Color Water Treated effluent
E* a* b* L* a* b* L*
Black 23.81 -2.14 -12.04 24.21 -2.29 -12.17 0.45
Cosmic 30.75 6.35 -10.72 30.68 6.31 -10.82 0.13
Mystic 36.83 15.94 1.06 37.95 15.81 1.09 1.13
Refugy 32.82 2.53 3.36 32.09 3.20 3.36 0.99
Safari 49.07 14.34 18.96 48.19 15.00 18.95 1.10
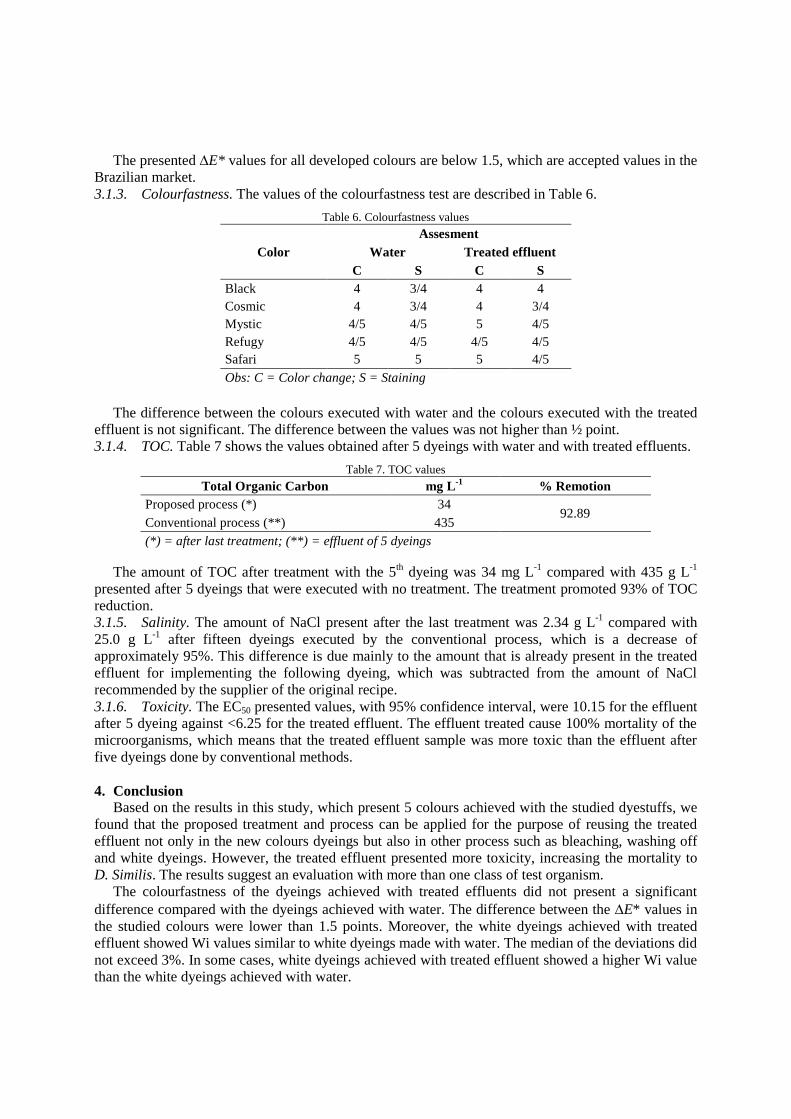
The presented E* values for all developed colours are below 1.5, which are accepted values in the
Brazilian market.
3.1.3. Colourfastness. The values of the colourfastness test are described in Table 6.
Table 6. Colourfastness values
Color
Assesment
Water Treated effluent
C S C S
Black 4 3/4 4 4
Cosmic 4 3/4 4 3/4
Mystic 4/5 4/5 5 4/5
Refugy 4/5 4/5 4/5 4/5
Safari 5 5 5 4/5
Obs: C = Color change; S = Staining
The difference between the colours executed with water and the colours executed with the treated
effluent is not significant. The difference between the values was not higher than ½ point.
3.1.4. TOC. Table 7 shows the values obtained after 5 dyeings with water and with treated effluents.
Table 7. TOC values
Total Organic Carbon mg L-1
% Remotion
Proposed process (*) 34 92.89
Conventional process (**) 435
(*) = after last treatment; (**) = effluent of 5 dyeings
The amount of TOC after treatment with the 5th dyeing was 34 mg L
-1 compared with 435 g L
-1
presented after 5 dyeings that were executed with no treatment. The treatment promoted 93% of TOC
reduction.
3.1.5. Salinity. The amount of NaCl present after the last treatment was 2.34 g L-1
compared with
25.0 g L-1
after fifteen dyeings executed by the conventional process, which is a decrease of
approximately 95%. This difference is due mainly to the amount that is already present in the treated
effluent for implementing the following dyeing, which was subtracted from the amount of NaCl
recommended by the supplier of the original recipe.
3.1.6. Toxicity. The EC50 presented values, with 95% confidence interval, were 10.15 for the effluent
after 5 dyeing against <6.25 for the treated effluent. The effluent treated cause 100% mortality of the
microorganisms, which means that the treated effluent sample was more toxic than the effluent after
five dyeings done by conventional methods.
4. Conclusion
Based on the results in this study, which present 5 colours achieved with the studied dyestuffs, we
found that the proposed treatment and process can be applied for the purpose of reusing the treated
effluent not only in the new colours dyeings but also in other process such as bleaching, washing off
and white dyeings. However, the treated effluent presented more toxicity, increasing the mortality to
D. Similis. The results suggest an evaluation with more than one class of test organism.
The colourfastness of the dyeings achieved with treated effluents did not present a significant
difference compared with the dyeings achieved with water. The difference between the E* values in
the studied colours were lower than 1.5 points. Moreover, the white dyeings achieved with treated
effluent showed Wi values similar to white dyeings made with water. The median of the deviations did
not exceed 3%. In some cases, white dyeings achieved with treated effluent showed a higher Wi value
than the white dyeings achieved with water.
The average water consumption for dyeing a kilogram of cotton was 24 L after fifteen dyeings
achieved by the proposed process using the colours and dyestuffs studied, which is less compared with
the 70 L that were consumed by the same dyeings achieved by the conventional process.
Theoretically, in the dyeing of 1000 kg executed by the proposed process leads to eventual
replenishment of water about 10%, indicate that the economy would conserve approximately 66.5 m3
of water when compared to conventional process.
Acknowledgement
The authors are grateful to Research Support Program of SENAI-SP, to Golden Technology and to
School of Arts, Science and Humanities, USP.
5. References
[1] Abiquim – Brazilian Association of Chemical Industry (2014). Sectoral activities: dyes and
pigments. http://www.abiquim.org.br/corantes, accessed February, 20th.
[2] Mathieu-Denoncourt, J., Martyniuk, C.J., Solla, S.R., Balakrishnan, V.K., Langlois, V.S., Environ.
Sci. Technol. 48 (2014), 2952-2961.
[3] Sekar, S., Surianarayanan, M., Ranganathan, V., Macfarlane, D.R., Mandal, A.B., Environ. Sci.
Technol. 46 (2012), 4902-4908.
[4] Chen, L., Wang, B., Ruan, X., Chen, J., Yang, Y., J. Clean. Prod. 107 (2015), 550-556.
[5] Lykidou, S., Karanikas, E., Nikolaidis, N., Tsatsaroni, E., Text. Res. J. 86 (2016), 823-836.
[6] Ben Younes, S., Cherif, I., Dhouib, A., Sayad, S., Catal Lett 146 (2016), 204-211.
[7] Xiao, P., Hong, J., Wang, T., Xu, X., Yuan, Y., Li, J., Zhu, J., Catal Lett 143 (2013), 887-894.
[8] Dias, F.F., Oliveira, A.A.S., Arcanjo, A.P., Moura, F.C.C., Pacheco, J.G.A., Appl. Catal. B 186
(2016) 136-142.
[9] Semeraro, P., Rizzi, V., Fini, P., Matera, S., Cosma, P., Franco, E., García, R., Ferrándiz, M.,
Núñez, E., Gabaldón, J.A., Fortea, I., Pérez, E., Ferrándiz, M., Dyes Pigm. 119 (2015), 84-94.
[10] Dasgupta, J., Sikder, J., Mandal, T., Adhikari, U., J. Hazard. Mater. 299 (2015), 192-205.
[11] Borrely, S.I., Morais, A.V., Rosa, J.M., Badaró-Pedroso, C., Pereira, M.C., Higa, M.C., Radiat.
Phys. Chem. 124 (2016), 198-202.
[12] USP Technologies: Analytical Methods for Hydrogen Peroxide for Product Assay. Disponible at
http://www.h2o2.com/technical-library/default.aspx?pid=67&name=Analytical-Methods-for-H2O2.
Accessed on July, 15th, 2015.
[13] Salem, V., Textile Dyeing: Fibres, Concepts and Technologies, 1st Edition, Ed. Blucher and
Golden Technology, São Paulo, Brazil.
[14] Rosa, J.M., Fileti, A.M.F., Tambourgi, E.B., Santana, J.C.C., J. Clean. Prod. 90 (2015), 60-65.
[15] Griesser, R., Appita J. 49 (1996), 105-112.
[16] APHA, AWWA, WPCF (2005). Standard Methods for the Examination of Water and
Wastewater, 21th ed. American Public Health Association, Washington, DC.
[17] ISO 105-E01. Textiles - Tests for colour fastness. Part E01: Colour fastness to water (2013).
[18] ABNT: Aquatic ecotoxicology - Acute toxicity - Test with Daphnia spp (Cladocera, Crustacea),
Rio de Janeiro: ABNT, 2009 (In Portuguese).

Physical properties of recycled PET non-woven fabrics for
buildings
S Üstün Çetin1 and A E Tayyar2
1 Uşak University, Technical Sciences Vocational School, Uşak, Turkey2 Uşak University, Engineering Faculty, Textile Engineering Department, Uşak,Turkey
Email: [email protected]
Abstract: Recycled fibers have been commonly used in non-woven production technology forengineering applications such as textile engineering and civil engineering. Nonwovensincluding recycled fibers can be utilized in insulation, roofing and floor separationapplications. In this study, physical performance properties such as drape, bending resistance,tensile strength, and breaking elongation values of non-woven fabrics consisting of v-PET(virgin) and r-PET (recycled) fibers in five different blend ratios are examined comparatively.The test results indicated that r-PET can be used in non-wovens for civil engineeringapplications such as insulation, roofing and floor separation fulfilling the acceptable qualitylevel values.
1. IntroductionIn recent years, recycling has been an attractive issue for researchers considering sustainability of thewastes arising from different engineering applications. In this scope, r-PET fibers which aremechanically and chemically recycled from PET bottles can be reused in needle punched non-wovenproduction technology in profitable amounts. The first PET bottle recycling process made by thecompany, known as Jude Polymers, in 1976, by converting PET bottles into plastic belts and paintbrushes [1]. It is known that 72% of the recycled PET flakes are used for fiber production [2]. In orderto recycle PET and to be particularly suitable for secondary use, it is necessary to carry some physicalproperties. Otherwise, it is impossible for secondary usage. Some physical properties of recycled PETshould have are listed in Table 1. Besides some researches indicated that 1 kg of PET sawdust from1.246 kg of PET bottles by mechanical recycling and 1 kg of PET polymer of 1.133 kg of PET bottlesby chemical recycling can be obtained [3].
Table 1 Properties of Recycled PET should carry [1].
Property Value[ η ] >0.7 dl g-1
Tm >240 °CWater ContentFlake Size
<0.02 wt %0.4<D<8 mm
Dyestuff content <10ppmYellowing Index <20Metal Content <3ppmPVC Content <50ppmPolyolefin Content <10ppm
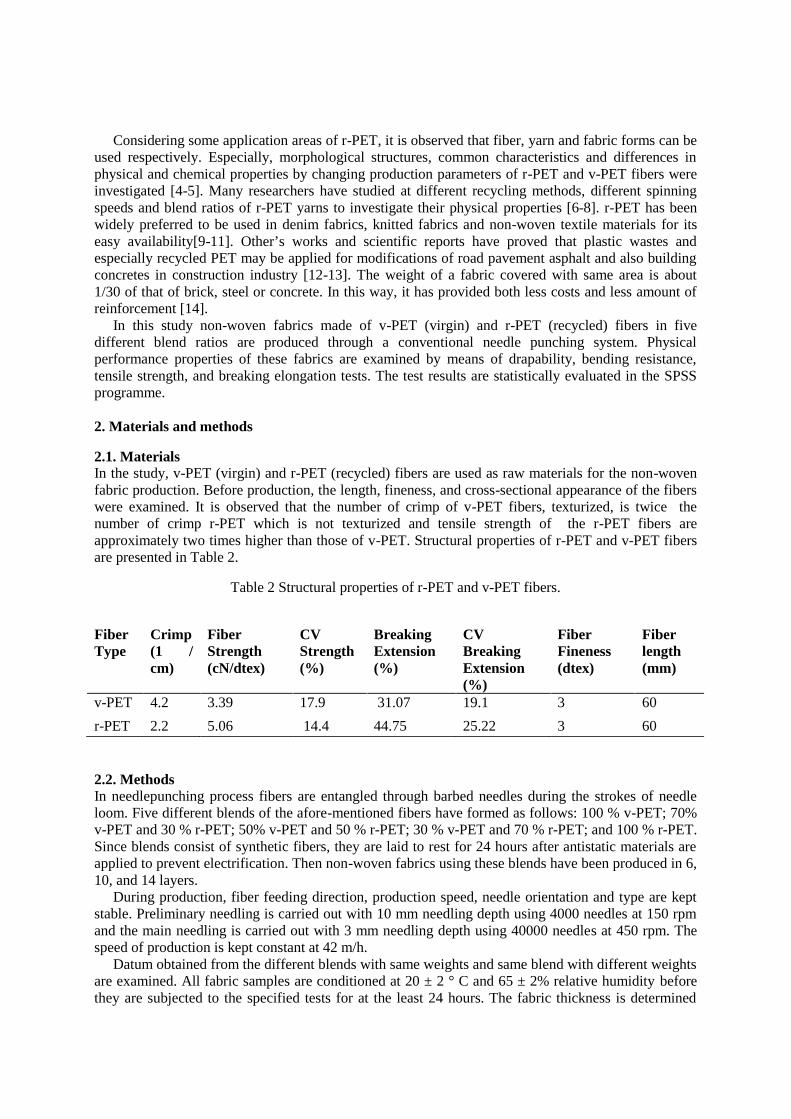
Considering some application areas of r-PET, it is observed that fiber, yarn and fabric forms can beused respectively. Especially, morphological structures, common characteristics and differences inphysical and chemical properties by changing production parameters of r-PET and v-PET fibers wereinvestigated [4-5]. Many researchers have studied at different recycling methods, different spinningspeeds and blend ratios of r-PET yarns to investigate their physical properties [6-8]. r-PET has beenwidely preferred to be used in denim fabrics, knitted fabrics and non-woven textile materials for itseasy availability[9-11]. Other’s works and scientific reports have proved that plastic wastes andespecially recycled PET may be applied for modifications of road pavement asphalt and also buildingconcretes in construction industry [12-13]. The weight of a fabric covered with same area is about1/30 of that of brick, steel or concrete. In this way, it has provided both less costs and less amount ofreinforcement [14].
In this study non-woven fabrics made of v-PET (virgin) and r-PET (recycled) fibers in fivedifferent blend ratios are produced through a conventional needle punching system. Physicalperformance properties of these fabrics are examined by means of drapability, bending resistance,tensile strength, and breaking elongation tests. The test results are statistically evaluated in the SPSSprogramme.
2. Materials and methods
2.1. MaterialsIn the study, v-PET (virgin) and r-PET (recycled) fibers are used as raw materials for the non-wovenfabric production. Before production, the length, fineness, and cross-sectional appearance of the fiberswere examined. It is observed that the number of crimp of v-PET fibers, texturized, is twice thenumber of crimp r-PET which is not texturized and tensile strength of the r-PET fibers areapproximately two times higher than those of v-PET. Structural properties of r-PET and v-PET fibersare presented in Table 2.
Table 2 Structural properties of r-PET and v-PET fibers.
FiberType
Crimp(1 /cm)
FiberStrength(cN/dtex)
CVStrength(%)
BreakingExtension(%)
CVBreakingExtension(%)
FiberFineness(dtex)
Fiberlength(mm)
v-PET 4.2 3.39 17.9 31.07 19.1 3 60r-PET 2.2 5.06 14.4 44.75 25.22 3 60
2.2. MethodsIn needlepunching process fibers are entangled through barbed needles during the strokes of needleloom. Five different blends of the afore-mentioned fibers have formed as follows: 100 % v-PET; 70%v-PET and 30 % r-PET; 50% v-PET and 50 % r-PET; 30 % v-PET and 70 % r-PET; and 100 % r-PET.Since blends consist of synthetic fibers, they are laid to rest for 24 hours after antistatic materials areapplied to prevent electrification. Then non-woven fabrics using these blends have been produced in 6,10, and 14 layers.
During production, fiber feeding direction, production speed, needle orientation and type are keptstable. Preliminary needling is carried out with 10 mm needling depth using 4000 needles at 150 rpmand the main needling is carried out with 3 mm needling depth using 40000 needles at 450 rpm. Thespeed of production is kept constant at 42 m/h.
Datum obtained from the different blends with same weights and same blend with different weightsare examined. All fabric samples are conditioned at 20 ± 2 ° C and 65 ± 2% relative humidity beforethey are subjected to the specified tests for at the least 24 hours. The fabric thickness is determined

based on TS 7128 EN ISO 5084 standard.The determination of the tensile strength is based on TS ENISO 13934-1, "Stretching Properties of Textile-Fabrics-Part 1: The Strength of the Biggest Strengthand the Strongest Strength under the Greatest Strength-Strip Method" standard. The determination ofbending resistance and fabric weight are based on TS EN ISO 9073-7 '' Determination of BendingStrength of Woven Textile Products '' standard and “Determination of Unit Length and Unit AreaMass ISO 3801 Method 5 TS 251”, respectively [15-18].
3. ResultsThickness, weight, drape, bending resistance and tensile strength tests have been carried out toevaluate the physical performances of these 15 fabrics. The mean values of results are demonstrated inTable 3. The effects of blending ratio on drape, bending resistance, tensile strength, and breakingelongation between groups according to the analysis of variance at 95% confidence level (p < 0.05)are listed in Table 3. The comparisons and differences among the groups for fabric type are performedusing post-hoc Tukey and Games-Howell tests depending on homogeneity of variances. “a”, “b”, “c”and “d” letters are used in Table 3 to indicate the differences of measured average values of all type offabrics.
Table 3 The mean value of results.
Fabr
ics
Dra
pe (%
)
Bend
ing
Rig
idity
(mg.
cm)
(MD
)
Bend
ing
Rig
idity
(mg.
cm) (
CD
)
Tens
ileSt
reng
th(N
)(M
D)
Tens
ileSt
reng
th(N
)(C
D)
Brea
king
Elon
gatio
n(m
m)(
MD
)
Brea
king
Elon
gatio
n(m
m)(
CD
)
6 la
yer
100% r-PET 92.94bc 257.52c 289.88d 70.14c 142.69b 16.04ab 27.05a
70% r-PET 30% v-PET 89.48ab 77.57a 136.71a 42.77b 57.78a 16.43b 28.53a
50%r-PET 50% v-PET 91.96abc 81.16a 162.56b 25.15a 39.35a 13.77a 26.26a
30% r-RET 70% v-PET 88.68a 80.23a 123.25a 29.03ab 35.13a 14.92ab 28.15a
100%v- PET 9580c 165.87b 268.44c 27.11ab 46.10a 15.14ab 27.35a
10 la
yer
100% r-PET 97.59a 919.99c 1439.12d 177.99c 448.54d 11.77a 21.64a
70% r-PET 30% v-PET 96.20a 542.60b 1354.66c 142.22b 339.15bc 12.88ab 24.37b
50%r-PET 50% v-PET 96.55a 526.82b 876.33a 120.85ab 248.34ab 12.25ab 26.82c
30% r-RET 70% v-PET 95.92a 433.19a 433.19b 108.41a 221.95a 12.68ab 25.53bc
100%v- PET 97.43a 1206.12d 1430.15cd 146.73b 363.49cd 13.56b 24.24b
14 la
yer
100% r-PET 98.76b 5162.70b 4513.70a 495.96c 967.25b 12.04a 16.23a
70% r-PET 30% v-PET 96.19a 2170.93a 5246.32b 397.45b 803.17b 11.55a 17.67ab
50%r-PET 50% v-PET 97.85b 1838.87a 4158.49a 301.70a 514.95a 12.05a 18.59bc
30% r-RET 70% v-PET 97.75b 2420.06a 4357.54a 247.00a 465.52a 11.18a 20.71cd
100%v- PET 97.86b 9464.04c 5797.81c 296.91a 380.77a 13.77b 21.14d
Note: The average values are arranged such that the letter ‘a’ shows the lowest average value and the letter ‘c’ shows the highest averagevalue. Any two average values not sharing a letter in common mean that they are significantly different from each other at 95% confidencelevel.
3.1 Weight and thicknessIncreasing production layer from 6to 14under constant production circumstances has raised reasonablyweight and thickness values of fabrics. Measured thickness and weight values and expected weightvalues of blended fabrics according to %100 fabrics showed in Table 4. Thickness and weight valuesof 100% v-PET and 100% r-PET fabrics are found to be fairly close. Considering the blended fabricsin three different ratios; thickness and weight values are measured as compatible with each other.However, measured weight values of blended fabrics are found to be much lower than expectedweight values. It is considered that the difference between measured and expected weight valuesbecome husks. The percentage of husks changes between %19.81 and %31.86 and increases with thehigher percentage of r-PET amount. This is because of in capability of the stiff and non-texturized r-
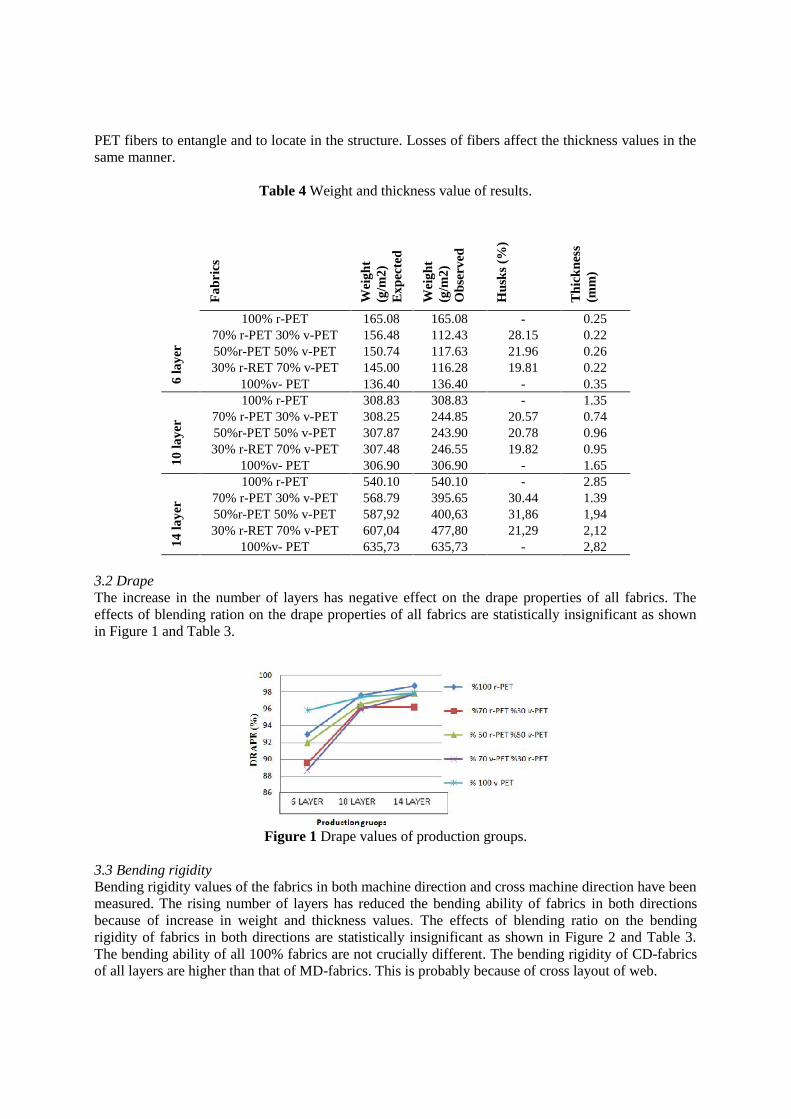
PET fibers to entangle and to locate in the structure. Losses of fibers affect the thickness values in thesame manner.
Table 4 Weight and thickness value of results.Fa
bric
s
Wei
ght
(g/m
2)Ex
pect
ed
Wei
ght
(g/m
2)O
bser
ved
Hus
ks (%
)
Thic
knes
s(m
m)
6 la
yer
100% r-PET 165.08 165.08 - 0.2570% r-PET 30% v-PET 156.48 112.43 28.15 0.2250%r-PET 50% v-PET 150.74 117.63 21.96 0.2630% r-RET 70% v-PET 145.00 116.28 19.81 0.22
100%v- PET 136.40 136.40 - 0.35
10 la
yer
100% r-PET 308.83 308.83 - 1.3570% r-PET 30% v-PET 308.25 244.85 20.57 0.7450%r-PET 50% v-PET 307.87 243.90 20.78 0.9630% r-RET 70% v-PET 307.48 246.55 19.82 0.95
100%v- PET 306.90 306.90 - 1.65
14 la
yer
100% r-PET 540.10 540.10 - 2.8570% r-PET 30% v-PET 568.79 395.65 30.44 1.3950%r-PET 50% v-PET 587,92 400,63 31,86 1,9430% r-RET 70% v-PET 607,04 477,80 21,29 2,12
100%v- PET 635,73 635,73 - 2,82
3.2 DrapeThe increase in the number of layers has negative effect on the drape properties of all fabrics. Theeffects of blending ration on the drape properties of all fabrics are statistically insignificant as shownin Figure 1 and Table 3.
Figure 1 Drape values of production groups.
3.3 Bending rigidityBending rigidity values of the fabrics in both machine direction and cross machine direction have beenmeasured. The rising number of layers has reduced the bending ability of fabrics in both directionsbecause of increase in weight and thickness values. The effects of blending ratio on the bendingrigidity of fabrics in both directions are statistically insignificant as shown in Figure 2 and Table 3.The bending ability of all 100% fabrics are not crucially different. The bending rigidity of CD-fabricsof all layers are higher than that of MD-fabrics. This is probably because of cross layout of web.

Figure 2 Bending rigidity values of production groups.
3.4 Tensile strength and breaking elongationTensile strength of samples is tested in both machine direction and cross machine direction and resultsshown in Figure 3. The increase in the number of layers has positive effect on the tensile strength andnegative effect on breaking elongation of all fabrics as shown in Table 3. The tensile strength of CD-fabrics of all layers are higher than that of MD-fabrics. This is probably because of cross layout ofweb and higher fiber orientation in cross machine direction. Conversely, the breaking elongations ofCD-fabrics of all layers are lower than that of MD-fabrics. The tensile strength of 100% r-PET fabricsis higher than that of 100%v-PET fabrics because of higher fibers strength of r-PET. The breakingelongation all 100% fabrics are not different statistically. Although the effects of blending ratio on thetensile strength and breaking elongation of fabrics in both directions are statistically insignificant,higher r-PET ratio causes higher tensile strength and lower breaking elongation. Since, increasing ther-PET ratio added into blend leads to increment in husks amount thus, the effect of r-PET ratio ontensile properties is disguised.
Figure3 Tensile strength values of production groups.
4. ConclusionsThe non-woven fabrics with 5 different blends of r-PET and v-PET fibers in 6, 10, and 14 layers havebeen produced. Weights, thickness, drape, bending resistance, tensile strength, and breakingelongation properties have been evaluated. As expected, ticker and heavier fabrics have less drapeability and breaking elongation while more bending rigidity and tensile strength. The effect ofblending ratio on fabric properties can be seen more clearly if the amount of r-PET is increase by
about 24 % in order to reduce husks. r-PET non-woven fabrics are competitive with v-PET non-wovenfabrics in many ways for construction industry where tensile and shape ability properties arenecessary.AcknowledgementsThis work was supported by the Uşak University Scientific Research Project under grant[2010/TP009]. We would like to acknowledge the Department of Textile Engineering of Dokuz EylülUniversity for their technical support.
References[1] Sevencan F and Vaizoğlu S A 2007 PET ve geri dönüşümü Kor Hek 6 (4) pp 307-312 CrossRef[2] Shen L,Worrell E and Patel M K 2010 Open-looprecycling: A LCA case study of PET bottle-to-
fiber recycling Resources, Conservation and Recycling 55 (1) pp 34-52 CrossRef[3] Masaiko H 2005. LCA as A Component of Configuration Engine for KIH.[4] He S-S, We M-Y, Liu M-H and Xue W–L 2014 Characterization of virgin and recycled poly
(ethylene terephthalate) (PET) fibers Journal of the Textile Institute 106 pp 800-806CrossRef
[5] Tapia-Picazo C, Luna-Bárcenas J G, García-Chávez A, Gonzalez-Nuñez R , Bonilla-PetricioletA, and Alvarez-Castillo A 2014 Polyester Fiber Production Using Virgin and Recycled PETFibers and Polymers 15 pp 547-552 CrossRef
[6] Lee S Y, Won J S ,Yoo J J, Hahm W-G and Lee S G 2012 Physical Properties of RecycledPolyester Yarns According to Recycling Methods Textile Coloration and Finishing 24 pp91-96 CrossRef
[7] Abbasi M, Mojtahedi M R M and Khosroshahi A 2007 Effect of spinning speed on the structureand physical properties of filament yarns produced from used PET bottles Appl Polym Sci103 pp 3972-3975 CrossRef
[8] Telli A and Özdil N 2013 Properties of the yarns produced from r-pet fibers and their blendsTekstil ve Konfeksiyon 23 pp 3-10 CrossRef
[9] Can MU 2015 Tekstil döküntüsü içeren nonwoven kumaşların iç mimaride kullanılabilirliğiThesis (M.Sc.) İstanbul Technical University Institute of Science and Technology CrossRef
[10] Choi Y J and Kim S H 2015 Characterization of recycled polyethylene terephthalates andpolyethylene terephthalate–nylon6 blend knitted fabrics Textile Research Journal 85-4 2015CrossRef
[11] Telli A and BabaarslanO 2016 The effect of recycled fibers on the washing performance ofdenim fabrics 108 pp 812-820 CrossRef
[12] Rebeiz K S and Fowler DW1994 Recycled PET flexural properties of reinforced polyesterconcrete made with recycled PET Journal of Reinforced Plastics and Composites 13 pp895-907 CrossRef
[13] Sulyman M , Haponiuk J, and Formela K 2016 Utilization of Recycled PolyethyleneTerephthalate (PET) in Engineering Materials: A Review International Journal ofEnvironmental Science and Development7 pp 100-108 CrossRef
[14] KOZAK M 2010 Tekstil atıkların yapı malzemesi olarak kullanım alanlarının araştırılmasıTeknolojik Araştırmalar 6 pp 62-70 CrossRef
[15] Turkish Standard 1998 Textiles determination of thickness of textiles and textile porducts TS7128 EN ISO 5084
[16] Turkish Standard 2002 Textiles-Tensile properties of fabrics- Part 1: Determination ofmaximum force and elongation at maximum force using the strip method TS EN ISO 13934-1
[17] Turkish Standard 1973 Stiffness determination of woven textiles TS 1409[18] Turkish Standard 1991Determination of Mass Per Unit Length and Mass Per Unit Area of
Woven FabricsISO 3801 Method 5 TS 251
Fashion design solutions for environmentally consciousconsumers
M Wagner1,2,3, Y Chen3, A Curteza2, S Thomassey1, A Perwuelz1 and X Zeng1
1 GEMTEX, ENSAIT, 2 Allée Louise et Victor Champier, 59056 Roubaix, France2 Faculty of Textiles Leather and Industrial Management, Gheorghe Asachi TechnicalUniversity of Iasi, B-dul. D. Mangeron Nr. 67, 700050 Iasi, Romania3 College of Textile and Clothing Engineering, Soochow University, Suzhou 215006,China
Email: [email protected]
Abstract. This paper intends to give an overview of the design solutions in fashion forenvironmentally conscious consumers, presenting green and ethical practices in contemporaryclothing design. The results introduce the concept of slow fashion and discuss available fashiondesign solutions, giving most prominent examples of sustainable products and brands, thesecontain one or more design features. By this, the discussion extracts the main contemporaryideas. The presented examples of current offers are all envisioning less impact on theenvironment and society. Sustainable design solutions use more environmentally friendlymaterials such as organic cotton, incorporate circular design or design for recycling, e.g.,replacing button closures with alternative closing possibilities or leather labels with printedversions, or ensure long product life through durability, among other methods. There arediffering designs due to creators’ individuality. This overview can be beneficial for the futuredevelopment of new solutions for more environmentally friendly fashion.
1. IntroductionThe present study is part of a PhD project in sustainable design and management of textiles, focusingon consumer perception of ethical fashion. To understand consumer perception, the concept of ethicalfashion is analysed in here, identifying design solutions existing in clothing nowadays. Thecontemporary clothing design can show changes in society.
Ethical or sustainable fashion might sound like a paradox. The fashion industry is one of the mostpolluting industries and consumers, and their consumption patterns are one of the challengers. But,sustainability, in general, is rising and affecting all kind of business, also textiles: Sustainability hasbecome a key issue in the fashion industry over the past year [1]. The promotion of ethical fashion isbecoming more prominent in the fashion industry, also seen in the example of the Ethical FashionShow in Germany, held parallel to the Berlin Fashion Week; In their Green Showroom, brands fromthe street and casual wear are present with the focus on design and sustainability: urban Zeitgeist, eco-fair lifestyle and fashion [2]. Eco fashion is focusing more and more on the design, reducing theperception of old-fashioned eco clothing. Contemporary eco clothing design needs to be able tobalance ethics, aesthetics and functionality.
According to the push and pull marketing concepts, not only the industry but also consumers areinfluencers, creating new challenges through their impact on the environment. Consumers have
become more demanding and aware of environmental issues [3]. The question arises, how theseconsumer needs for more environmentally friendly fashion solutions influence the design of garments?
In differently reported studies, consumer behaviour analysis focuses on consumer motivations anddecision-making. In this context, ethics reflects morals and leads to pro-social behaviour; Researchersnoticed that consumers tend to give socially desirable answers to questions related to their sustainablebehaviour, resulting in an attitude-behaviour gap [4-6]. Instead, the study can focus on themeasurement of the attitude towards the product design and attributes to define ethical consumerbehaviour. Clothing designers are incorporating sustainability into their design strategies and materialchoices as discussed in the following, presenting contemporary consumer products found insustainable fashion.
2. ApproachThis study investigates into the slow fashion concept and the contemporary design solutions available,and aspects related to environmentally conscious consumers are discussed, presenting most prominentexamples of sustainable products, emphasizing on one or more design possibilities, having a betterenvironmental performance than traditional solutions. Results for sustainable practices are presentedaccording to the six main solutions defined by Caniato et al. [7], see table 1, and based on theexperience found in literature and current trends, as well as including consumer needs.
Table 1. Main sustainable solutions
Sustainable solutions(i) use of organic fibres(ii) reuse and recycling of materials(iii) vintage practices and second-hand(iv) clean technologies(v) green certifications(vi) green product and process design
3. Results and discussionThe presented examples of current trends and offers grouped according to the sustainable solutioncategories have all in common that they have less impact on the environment or society. Referring tothe first category, sustainable design solutions use more environmentally friendly materials such asorganic cotton. Secondly, by incorporating circular design or design for recycling, designs can replacebutton closures with alternative closing possibilities or leather labels with printed versions, or amongother methods, ensure long product life through durability. There is a broad variety, design solutionsare different due to designer individuality and the influence of other factors, such as social and fashiontrends. Designs are shaped by various factors such as branding as well as consumer needs, resulting inthe design solutions presented in this study. To promote sustainable fashion, consumer needs have tobe defined and met accordingly through offering the right design solutions that should have physicalbut also emotional durability such as long lasting wear and relevance or desirability of consumers.
3.1 Slow fashion conceptOn the one hand, due to the environmental problems in the fashion industry and on the other hand, dueto the consumer demand and more consciousness, a new concept rises along the traditional fast fashionconcept. The slow fashion concept refers to the slow food movement, which focuses on local andsmall producer [8]. According to the Slow Fashion Award [9], the concept describes high qualityrealised through design, as well as fair labour conditions. The general aim is to reduce the negativeenvironmental impact of fashion and its processes. This is caused by the use of chemical products, the
exploitation of finite resources, and the high CO2 emissions [10]. In the following, examples ofchanges from the fast to the slow fashion design are discussed, inspired by environmental and ethicalissues occurring in the fashion industry.
3.2. Sustainable fashion design practicesTo create eco or environmentally friendly fashion, sustainable practisers are operating on severallevels, either in the whole supply chain or solely in a single company [11]. Eco design can also focus,besides the steps involved in the supply chain, on the pre-consumer phase which includes productionand transportation, and it can apply in the use or the post-consumer phase, either through recycling orupcycling. For clothing it has been seen that the environmental impact can be strongly influenced bythe use phase of the consumer in the care phase or laundering; additionally, it is possible to involve allthe stages of the lifecycle, including at the systems design level [12].
3.2.1. Organic fibres. Organic fibres have less impact on the soil or environment due to the lack of useof toxic insecticides, herbicides or fungicides [7]. Most prominent example for the use of organicfibres in clothing is organic cotton. Often, consumers tend to prefer natural fibres to synthetic [13];however, most consumers are not aware of the real impact in the production process. E.g., to produceone kilogram of cotton, a high amount of water is needed, up to 10.000 litres of water.
Other natural raw materials from a plant are hemp or kapok, and from an animal source wool andsilk which are available as organic wool and peace silk, this refers to a more ethical procedure ofgaining the fibres. The wool process is mulesing free, and the alternative silk process can gain the silkwithout boiling and killing the silk worm. Still, for consumers being highly ethical and thereforeavoiding animal products, i.e., living a vegan lifestyle, wool and silk are not suitable.An example is that of the US brand Patagonia with a management based on sustainable developmentand an offer of innovative and efficient products [14]. The design strategy uses only organic cotton,and focuses on both the product quality and sustainability [10]. Also, consumers show importance ofthe origin of the raw material; The Ethnicity report [15] states the high interest of French consumerstowards the origin of raw materials and production location compared to environmental or socialimpact in general in production process [16]; Local suppliers are shortening the transportation cycle.Also, another fibre approach focuses on using more durable textile materials which can prolong theproduct life, or more sustainable materials such as recycled fibres, described in the following.
3.2.2. Reuse and recycling. The reuse and recycling of materials have a lower impact on theenvironment by saving resources and decreasing landfill. The three concepts are the three R’s, toreduce, reuse and recycle. The traditional concept of a linear process is transformed into a circular one,incorporating circular design. When designing for recycling, additional considerations have to bemade, such as material content and product accessories; i.e., there are difficulties in recycling productsaccording to a separation of different materials and accessories such as buttons or labels. Therefore,the design process can already focus on design for circularity by, e.g., replacing button closures withalternative closing designs or leather labels with printed versions.
Besides old clothing from e.g. manufacturing scraps, also other materials can be used in thefashion design such as bottles and tyres [7]. Most prominent example is the recycling of truck canvasby the Swiss company FREITAG, selling backpacks, bags and other accessories made from recycledmaterial such as old truck canvas, safety belts or bicycle tubes [17]. Using this concept, the brandoffers unique designs and creates a lifestyle product with more value. Other companies worldwide areadopting similar concepts. Examples are the Romanian brand upside-down, selling products Made inRomania and reusing materials such as from old outdoor advertising banners and billboards [18]. Or,another example is the Turkish brand %100 ISTANBUL, which sells upcycled bags in their conceptstore made from recycled seed or food sacks and also exhibition banners and others [19].
Another prominent example is the German sports brand Adidas and the launch of Parley for theOceans, using recycled ocean plastic for their products [20]. Besides sneakers, also swimwear
products are offered, made from upcycled fishing nets and debris; the design of the products isinspired by the sea, using blue colours and the wave structures among others. On the one hand,especially when it comes to performing products, the quality has to be ensured. Recycled productshave been seen to cause the problem of trust in quality. In the luxury sector, research revealed that theconsumer perception of the products made from recycled materials is negative [21].
3.2.3. Vintage and second-hand. These practices are offering a unique fashion to consumers.Consumers can have nostalgic emotions towards them and require different styles than these availableon the current market. Moreover, due to cost reasons, the second-hand options are desirable, especiallyfor price-conscious consumers or those with lower incomes, such as students. For specific types ofclothing such as children wear, second-hand clothing is preferred as children grow fast and requirebigger sized garments. Other alternative models or approaches offer clothing that customers can rent,share, lease, or switch.
3.2.4. Clean technologies. Besides information technologies [22], companies focus on theimprovement of product processes, e.g., using less water during dying or using natural dyes, i.e.,vegetable and plant dyes. Also, social cause care is included, by basing dying on traditional methods.In this context, companies are working with a non-profit organisation to develop sustainablecommunity-based projects.
3.2.5. Green certifications. Besides the traditional design requirements, the design for green productsfollows certain eco standards. As mentioned before, organic cotton is well known; Besides,certifications include the fair trade of suppliers. A prominent example of certification is the GOTS(Global Organic Textile Standards) and the Fairtrade certification or Fair Wear Foundation. Also,there are country-specific certificates, such as the Bündnis für Nachhaltige Textilien from Germany;others are the Oeko-Tex. The certifications need certain measurements accordingly, such as throughthe LCA (life cycle assessment).
3.2.6. Green product and process design. A green product can present one of the six in here mentionedsolutions, or several or all of them. Referring to the example of organic cotton, using a single approachthis means that the textile material is certified as coming from a fair trade source; but to includemultiple approaches, other factors should be considered as well. These considerations include forexample the dyeing, i.e., using natural dye to avoid chemical substances. Hereby the whole productbecomes sustainable. Besides the product, sustainable design also applies to the packaging andservices, using improved packaging and giving consumer advice on garment care such as washingwith lower temperature and less often, or offering disposing services to customers, e.g., H&M andtheir Garment Collecting service [23]. Therefore, besides the product characteristics and the materialsused, also production technologies and services should be included to define a green product to besustainable [7]. As mentioned, consumers and their use phase have an influence on the products’sustainability, see the following.
3.3 Sustainable fashion consumers’ needsConsumers can be the main influencers in the design process of products, refer to the concept of
consumer-centred design. Also, through their ‘pester’ power, especially in social media or throughfeedback systems, their opinion becomes important and can influence either positively or negatively.Environmental consumers have been seen to passively or actively promote or boycott products relatedto environmental issues or ethics, such as boycotting brands and products using fur or angora wool.
Therefore, the perception and decision-making process of consumers is a rising topic in researchand company’s marketing departments. The research on consumer behaviour, and especially on ethics,needs a sensitive approach, due to bias in what the consumers state and how they behave; refer to thepreviously mentioned attitude-behaviour gap due to socially desirable answers.
Different researchers tried to define the factors that can minimise this gap. One approach is tofocus not only on ethics in the product - it has been found that ethicality might not be the mainpurchase criteria - but also on other factors such as price and availability [24, 25]. Also, as there is abroad variety of key influence factors and buying motivations, and the function the fashion itemperforms varies strongly [26], two categories in product design were defined; the functional andsymbolic product attributes [27], whereby the product can also own both. Concluding, besides generalproduct features and sustainable design, emotions have to be included into the design to achieve fullconsumer satisfaction.
4. ConclusionsThe results show that contemporary fashion design offers several solutions for the environmentallyconscious consumer. However, there is a necessity for more information on both sides, for theconsumer and the company related stakeholders to create real sustainable products. Evaluation toolssuch as LCA are helpful to determine the real value; marketing tools are necessary to promote thesustainable value towards the consumer, including traditional factors as well as contemporaryevaluators such as sensory features like emotions and feeling. The presentation of the rightinformation about the product is crucial to promote the green product; different types from severalsources are available. Researchers need to consider subjective attributes and analyse according to thebrand values if the product incorporates this image. This overview can benefit the future developmentof new solutions in sustainable clothing design, in further research the acceptance of the variousconcepts needs testing.
AcknowledgementsAuthors would like to thank the EU doctoral program Erasmus Mundus Joint Doctorates (EMJDs)Sustainable Management and Design for Textiles (SMDTex) for the financial support of the work.
References[1] Vogue 2015 Save the Fashion Industry, Save the World! How We Can Make a Greener Future.[2] Ethical Fashion Show 2017 Ethical Fashion Show. [3] Nielsen 2014 Global Survey on Corporate Social Responsibility. [4] Joergens C 2006 Ethical fashion: myth or future trend? JFMM 10 pp 360-71 [5] Carrigan M and Attala A 2001 The myth of the ethical consumer – do ethics matter in purchase
behaviour? J. Consum. Mark. 18 pp 560-78 [6] Auger P and Devinney T M 2007 Do What Consumers Say Matter? The Misalignment of
Preferences with Unconstrained Ethical Intensions J. Bus. Ethics 76 pp 361-83 [7] Caniato F, Caridi M, Crippa L and Moretto A 2012 Environmental sustainability in fashion
supply chains: An exploratory case based research Int. J. Prod. Econ. 135 pp 659-70 [8] New York Times 2009 Luxury-goods Makers Embrace Sustainability ed J Kahn [9] Slow Fashion 2010 Slow Fashion Award. [10] Chouinard Y and Brown M S 1997 Going organic converting Patagonia’s cotton product line J.
Ind. Ecol. 1 pp 117-29 [11] De Brito M P, Carbone V and Meunier Blanquart C 2008 Towards a sustainable fashion retail
supply chain in Europe: Organisation and performance Int. J. Prod. Econ. 114 pp 659-70 [12] Fletcher K 2008 Sustainable Fashion and Textiles: Design Journeys (London: Earthscan) pp
212[13] Research I S 2013 Manufacturing in Britain: A Survey of Factors Affecting Growth and
Performance: Industrial Systems Research [14] Teulon H 2006 Patagonia, le succès avec ou malgré le développement durable? Entrep. Hist. 4
pp 116-34

[15] Ethnicity 2013 Les Français et la consummation responsable. [16] Achabou M A and Dekhili S 2015 Sustainable Fashion Supply Chain Management. In: From
Sourcing to Retailing, ed C Tsan-Ming and C TCE (Switzerland: Springer InternationalPublishing) pp 168
[17] Freitag 2017 Freitag. [18] Upside-down 2017 Upside-down. [19] %100 ISTANBUL 2017 %100 ISTANBUL. [20] Adidas 2017 Adidas.[21] Achabou M and Dekhili S 2013 Luxury and sustainable development: is there a match? J. Bus.
Res. 66 pp 1896-903 [22] Nieminen E, Linke M, Tobler M and Vander Becke B 2007 EU COST Action 628: life cycle
assessment (LCA) of textile processing J. Clean. Prod. 15 pp 1259-70 [23] H&M 2016 H&M [24] Sima V 2014 Green behaviour of the Romanian consumers EI-TC 3 pp 77-89 [25] Greenpeace 2015 Wegwerfware Kleidung Repräsentative Greenpeace-Umfrage zu
Kaufverhalten, Trageduaer und der Entsorgung von Mode. (Hamburg: Greenpeace e.V.) [26] Niinimäki K 2010 Eco-clothing, consumer identity and ideology Sustainable Development 18
pp 150-62 [27] Birtwistle G and Tsim C 2005 Consumer purchasing behaviour: an investigation of the UK
mature women’s clothing market JCB 4 pp 453-64