towards the achievement of prioritised sustainable … · towards the achievement of prioritised...
TRANSCRIPT

TOWARDS THE ACHIEVEMENT OF
PRIORITISED SUSTAINABLE DEVELOPMENT GOALS
IN OIC COUNTRIES
O R G A N I S AT I O N O F I S L A M I C C O O P E R AT I O N
STATISTICAL ECONOMIC AND SOCIAL RESEARCHAND TRAINING CENTRE FOR ISLAMIC COUNTRIES
STATISTICAL, ECONOMIC AND SOCIAL RESEARCHAND TRAINING CENTRE FOR ISLAMIC COUNTRIES
Kudüs Cad. No:9 D�plomat�k S�te 06450 ORAN-Ankara, TurkeyTel: (90-312) 468 61 72-76 Fax: (90-312) 468 57 26Ema�l : o�cankara@sesr�c .org Web: www.sesr�c .org
SESRICSESRICSESRIC


Towards the Achievement of Prioritised Sustainable Development Goals in OIC Countries
A Progress Report by SESRIC
ORGANISATION OF ISLAMIC COOPERATION
STATISTICAL, ECONOMIC AND SOCIAL RESEARCH AND TRAINING CENTRE FOR ISLAMIC COUNTRIES

© 2019 Statistical, Economic and Social Research and Training Centre for Islamic Countries (SESRIC) Address: Kudüs Cad. No: 9, Diplomatik Site, 06450 Oran, Ankara –Turkey Telephone: +90–312–468 6172 | Fax: +90–312–467 3458 | Website: www.sesric.org | E-mail: [email protected] All rights reserved High standards have been applied during processing and preparation stage by the SESRIC to maximize the accuracy of the data included in this work. The denominations and other information shown on any illustrative section or figure do not imply any judgment on the part of the SESRIC concerning the legal status of any entity. Besides it denies any responsibility for any kind of political debate that may arise using the data and information presented in this publication. The boundaries and names shown on the map(s) (if any) presented in this publication do not imply official endorsement or acceptance by the SESRIC. The material presented in this publication is copyrighted. By the virtue of the copyright it claims and as it encourages dissemination of its publications for the sake of the OIC Member Countries, SESRIC gives the permission to view, copy, and download the material presented provided that these materials are not going to be reused, on whatsoever condition, for commercial purposes. For permission to reproduce or reprint any part of this publication, please send a request with complete information to the Publication Department of SESRIC at Kudüs Cad., No: 9, Diplomatik Site, 06450 Oran, Ankara –Turkey. All queries on rights and licenses should be addressed to the Publication Department of SESRIC at the aforementioned address. ISBN: 978-975-6427-90-3 For additional information, contact Statistics and Information Department of SESRIC through: [email protected] Cover design by Savas Pehlivan, Publication Department, SESRIC. Acknowledgements: Under the general guidance of H.E. Mr Nebil DABUR, Director General of SESRIC, this Report has been prepared by a team at SESRIC led by Dr Atilla KARAMAN, Director of Statistics and Information Department, and including Dr Ahmet OZTURK, Mr Davron ISHNAZAROV, and Mr Muzamil EDEMA. The following sections were contributed by (i) Assessment and Methodology of Progress towards the SDGs, SDG 8, and SDG 9: Dr Ahmet OZTURK; SDG 1, SDG 2, SDG 4, and Appendix 1: Mr Davron ISHNAZAROV; (ii) SDG 3, SDG 5, and SDG 13: Mr Muzamil EDEMA; and edited by Dr Atilla KARAMAN.

Towards the Achievement of Prioritised Sustainable Development Goals in OIC Countries: A Progress Report by SESRIC I
Table of Contents Foreword ................................................................................................................................................................................................. V
Executive Summary ................................................................................................................................................................................ VI
Assessment and Methodology of Progress towards the SDGs ................................................................................................................. 1
SDG 1. End Poverty in all its Forms Everywhere ..................................................................................................................................... 5
SDG 2: End Hunger, Achieve Food Security and Improved Nutrition and Promote Sustainable Agriculture ............................................. 9
SDG 3. Ensure Healthy Lives and Promote Well-Being for All at All Ages .............................................................................................. 13
SDG 4: Ensure Inclusive and Equitable Quality Education and Promote Lifelong Learning Opportunities for All .................................... 20
SDG 5. Achieve Gender Equality and Empower All Women and Girls ................................................................................................... 24
SDG 8: Promote Sustained, Inclusive and Sustainable Economic Growth, Full and Productive Employment and Decent Work for All ... 25
SDG 9: Build Resilient Infrastructure, Promote Inclusive and Sustainable Industrialization and Foster Innovation ................................. 30
SDG 13: Take Urgent Action to Combat Climate Change and Its Impacts .............................................................................................. 35
References ............................................................................................................................................................................................ 37
Appendices ........................................................................................................................................................................................... 38
Appendix 1: Technical Notes .............................................................................................................................................................. 38
Appendix 2: List of Indicators Selected for Assessment and Methodology of Progress towards the SDGs .......................................... 50

Towards the Achievement of Prioritised Sustainable Development Goals in OIC Countries: A Progress Report by SESRIC II
List of Figures Figure 1: Graphic Representation of the SDG Trends Methodology for Indicators with Quantitative Targets ............................................ 3 Figure 2: Graphic Representation of the SDG Trends Methodology for Indicators without Quantitative Targets ....................................... 4 Figure 3: Proportion of Population below International Poverty Line, Percent, 2000 vs. 2017 ................................................................... 5 Figure 4: Proportion of Population Living below the National Poverty Line, Percent, 2000 vs. 2017 ......................................................... 6 Figure 5: Direct Economic Loss Attributed to Disasters Relative to GDP, Percent, 2005-2017 ................................................................. 7 Figure 6: Proportion of Total Government Spending on Essential Services, Education, Percent, 2000 vs. 2017 ...................................... 8 Figure 7: Prevalence of Undernourishment, Percent, 2000 vs. 2016 ........................................................................................................ 9 Figure 8: Proportion of Children Moderately or Severely Stunted, Percent, 2000 vs. 2016 .......................................................................... 10 Figure 9: Proportion of Local Breeds by Levels of Extinction Risk (%), 2000 vs. 2018 ............................................................................ 11 Figure 10: Total Official Flows to Agriculture sector, Millions of Constant 2016 USD, 2000-2016 ........................................................... 12 Figure 11: Maternal Mortality Ratio per 100,000 Live Births, 2000 vs. 2015 ........................................................................................... 13 Figure 12: Under-Five Mortality Rate, Deaths per 1,000 Live Births, 2000 vs. 2017 ............................................................................... 14 Figure 13: Tuberculosis Incidence per 100,000 Population, 2000 vs. 2017, ........................................................................................... 15 Figure 14: Mortality Rate Attributed to Cardiovascular Disease, Cancer, Diabetes or Chronic Respiratory Disease (Probability), Ages 30-70, Both Sexes, 2000 vs. 2017 .............................................................................................................................................................. 16 Figure 15: Suicide Mortality Rate, Both Sexes, Deaths per 100,000 Population, 2000 vs. 2016, ............................................................ 16 Figure 16: Alcohol Consumption per capita within a Calendar Year, Ages 15+, 2000 vs. 2016 ............................................................... 17 Figure 17: Women of Reproductive Age who have their Need for Family Planning Satisfied with Modern Methods, Ages 15-49. 2000 vs. 2018 ...................................................................................................................................................................................................... 18 Figure 18: Medical Doctors per 10,000 Population, 2000 ....................................................................................................................... 19 Figure 19: Medical Doctors per 10,000 Population, 2018 ....................................................................................................................... 19 Figure 20: Participation Rate in Organized Learning (One Year Before the Official Primary Entry Age), Both Sexes, Percent, 2000 vs. 2017 .............................................................................................................................................................................................................. 20 Figure 21: Total Official Flows for Scholarships, by Recipient Countries, Millions of Constant 2016 USD, 2000-2016 ............................ 21 Figure 22: Proportion of Teachers in Primary Education who have Received at least Minimum Organized Teacher Training, 2000 vs. 2017 .............................................................................................................................................................................................................. 22 Figure 23: Gender Parity Index for Participation Rate in Organized Learning (One Year Before the Official Primary Entry Age), 2000 ... 23 Figure 24: Gender Parity Index for Participation Rate in Organized Learning (One Year Before the Official Primary Entry Age), 2018 ... 23 Figure 25: Proportion of Seats Held by Women in National Parliaments, Percent, 2000 vs. 2018 .......................................................... 24 Figure 26: Annual Growth Rate of Real GDP per capita, Percent, 2000-2017 ........................................................................................ 25 Figure 27: Annual Growth Rate of Real GDP per Employed Person, Percent, 2000-2018 ...................................................................... 26 Figure 28: Unemployment Rate, 15+ Both Sexes, Percent, 2000 vs. 2017 ............................................................................................. 27 Figure 29: Proportion of Adults with an Account at a Financial Institution or Mobile-Money-Service Provider, 15+ Both Sexes, Percent, 2000 vs. 2017 ........................................................................................................................................................................................ 28 Figure 30: Domestic Material Consumption per capita, All Raw Materials, Tonnes, 2000 vs. 2017 ......................................................... 29 Figure 31: Manufacturing Value Added as a Proportion of GDP, Percent, 2000 vs. 2018 ....................................................................... 30 Figure 32: Research and Development Expenditure as a Proportion of GDP, Percent, 2000 vs. 2017 ................................................... 31 Figure 33: Proportion of Medium & High-Tech Industry Value Added in Total Value Added of Manufacturing, Percent, 2000 vs. 2016 .. 33 Figure 34: CO2 Emissions per Unit of Manufacturing Value Added, Kilograms of CO2 per Constant 2010 USD, 2000 vs. 2016 .............. 33 Figure 35: Proportion of Population Covered by a Mobile Network, 3G, Percent, 2000-2017 ................................................................. 34 Figure 36: Number of Directly Affected Persons Attributed to Disasters per 100,000 population, 2000-2017 .......................................... 36

Towards the Achievement of Prioritised Sustainable Development Goals in OIC Countries: A Progress Report by SESRIC III
List of Tables Table 1: Trend Visualization of Sustainable Development Goals ............................................................................................................. 1 Table 2: Trend Visualization of Sustainable Development Goals and Indicators ...................................................................................... 2 Table 3: Reference Years Used for Selected Indicators for Evaluating the Progress of OIC Countries Towards SDG 1 ......................... 40 Table 4: Reference Years Used for Selected Indicators for Evaluating the Progress of OIC Countries Towards SDG 2 ......................... 41 Table 5: Reference Years Used for Selected Indicators for Evaluating the Progress of OIC Countries Towards SDG 2 (cont.) .............. 42 Table 6: Reference Years Used for Selected Indicators for Evaluating the Progress of OIC Countries Towards SDG 3 ......................... 43 Table 7: Reference Years Used for Selected Indicators for Evaluating the Progress of OIC Countries Towards SDG 3 (cont.) .............. 44 Table 8: Reference Years Used for Selected Indicators for Evaluating the Progress of OIC Countries Towards SDG 4 ......................... 45 Table 9: Reference Years Used for Selected Indicators for Evaluating the Progress of OIC Countries Towards SDG 8 ......................... 46 Table 10: Reference Years Used for Selected Indicators for Evaluating the Progress of OIC Countries Towards SDG 9 ....................... 47 Table 11: Reference Years Used for Selected Indicators for Evaluating the Progress of OIC Countries Towards SDGs 5 and 13 .......... 48 Table 12: Reference Years Used for Additional Indicators Selected for Evaluating the Progress of OIC Countries Towards SDGs ........ 49

Towards the Achievement of Prioritised Sustainable Development Goals in OIC Countries: A Progress Report by SESRIC IV
Acronyms Used COMCEC Standing Committee for Economic and Commercial Cooperation EAGR Exponential Annual Growth Rate GDP Gross Domestic Product ICTs Information and Communication Technologies IHR International Health Regulations LDCs Least Developed Countries MDGs Millennium Development Goals MHT Medium-High and High-Tech Industry MMR Maternal Mortality Ratio MR Mortality Rate MVA Manufacturing Value Added ODA Total Official Development Assistance OIC Organisation of Islamic Cooperation OOF Other Official Flows PPP Purchasing Power Parity SDGs Sustainable Development Goals SESRIC Statistical, Economic and Social Research and Training Centre for Islamic Countries TOF Total Official Flows UAE United Arab Emirates UN United Nations UNSD United Nations Statistics Division USD United States Dollar(s) WDI World Development Indicators WMO World Meteorological Organization

Towards the Achievement of Prioritised Sustainable Development Goals in OIC Countries: A Progress Report by SESRIC V
ForewordThe 2030 Global Development Agenda, which has been endorsed in 2015, provides a comprehensive guideline for a sustainable world with mutual prosperity, productivity, and riches for all. The year 2030 is approaching rapidly, and we must evaluate if our past and current actions are setting the foundation for the achievement of the Sustainable Development Goals (SDGs). In this connection, it is with great enthusiasm that I present to you the new Progress Report by SESRIC ‘Towards the Achievement of Prioritised Sustainable Development Goals in OIC Countries’.
Between 2016 and 2018, through comprehensive and rigorous efforts, SESRIC has determined eight priority SDGs of extreme relevance at the OIC level, namely SDG 1 (No Poverty), SDG 2 (Zero Hunger), SDG 3 (Good Health & Well-Being), SDG 4 (Quality Education), SDG 5 (Gender Equality), SDG 8 (Decent Work & Economic Growth), SDG 9 (Industry, Innovation & Infrastructure), and SDG 13 (Climate Action). The current Report is prepared by SESRIC based on the results of these efforts. It provides an assessment of the progress made by the OIC countries regarding these eight prioritised SDGs. It is through such informative analysis that we can pinpoint where we currently stand and detect means and ways to further the OIC group’s
effort to reach the 2030 Agenda.
The Report reveals that the OIC countries as a group will not be able to achieve the prioritised SDGs by 2030 if they continue at the current pace. However, some of the significant progress made on different SDGs is noteworthy to be highlighted. In the 2000s, the population of the OIC countries living under 1.90 USD was around 30.1 percent compared to 16.2 percent in 2017. The prevalence of undernourishment in the OIC countries group has fallen from 16.3 percent in 2000 to 13.4 percent in 2016. Substantial improvements have also been achieved by the OIC countries group in decreasing maternal mortality rate (MR), under-five MR, and neonatal MR. Particularly, maternal MR fell from 397 deaths per 100,000 live births in 2000 to 256 deaths in 2015.
Notwithstanding the progress made, this Report identifies numerous areas where many OIC countries are still facing serious challenges in meeting the 2030 targets in OIC countries. For example, extensive policy measures are essential for the OIC countries group to end poverty by 2030. Although the prevalence of undernourishment and malnutrition has fallen across the OIC countries, with the current progress rates, no OIC country will be able to achieve the SDG 2 targets of ending hunger and all forms of malnutrition for all by 2030. In terms of health and well-being, OIC countries have managed to record substantial improvements but the slow pace of the OIC countries prevents them from achieving this SDG target and reducing the disparity with the rest of the world.
We see similar improvements in the area of education, economic growth and innovation but unfortunately, these advancements at the current pace are not enough to lead OIC countries to the achievement of the 2030 targets. As highlighted throughout the Report, a much deeper, faster and more ambitious response is needed from the OIC countries to unleash the social and economic transformation required to achieve the SDGs. These responses should focus on the alternative financing schemes particularly Islamic Finance for the achievement of the prioritised SDGs, inclusive and diversified economies, better use of data for better policy design, and expansion of elementary services to broader public such as quality education and social protection amongst many others.
I find this Progress Report by SESRIC to be immensely important for the OIC countries. It will serve as a blueprint to ensure that OIC countries are aware of their progress, shortcomings, and strengths regarding the prioritised SDGs. I hope that this Report will facilitate and motivate OIC countries to intensify their collective efforts to close the data gaps for better monitoring the SDGs and provide a knowledge base that can contribute to the acceleration of achieving the SDGs.
Nebil DABUR
Director General SESRIC

Towards the Achievement of Prioritised Sustainable Development Goals in OIC Countries: A Progress Report by SESRIC VI
Executive Summary“Towards the Achievement of Prioritised Sustainable Development Goals in OIC Countries: A Progress Report by SESRIC” provides an assessment vis-à-vis where OIC countries stand with respect to the prioritised 8 SDGs and their progress towards these goals in the light of the selected indicators. The Statistical, Economic and Social Research and Training Centre for Islamic Countries (SESRIC) has been tasked with preparing this Report in line with the Resolutions of the 34th Session of the Standing Committee for Economic and Commercial Cooperation (COMCEC) of the Organisation of Islamic Cooperation (OIC) that was held on 26-29 November 2018 in Istanbul, Turkey.
The Report focuses on the progress of the OIC countries on accomplishing SDGs that were prioritised by 36 OIC countries that responded to the “Tendency Survey on SDG Priorities of OIC Member Countries”. As per the findings of the Survey, 8 SDGs were prioritised in the order of SDG 1 (No Poverty), SDG 3 (Good Health & Well-Being), SDG 2 (Zero Hunger), SDG 4 (Quality Education), SDG 5 (Gender Equality), SDG 8 (Decent Work & Economic Growth), SDG 9 (Industry, Innovation & Infrastructure), and SDG 13 (Climate Action).
The methods that are applied to depict the progress of the SDGs focus on developments over time and not only on the current status of the indicators and related goals. In this regard, the main purpose of the Report is to analyse whether indicators selected have moved towards or away from the related SDGs. The progress of an OIC country or a country group is estimated through comparing the value of the indicator in 2000 or earliest year available to the value of that indicator in 2018 or the latest year.
In overall, the OIC countries as a group is estimated not to achieve any of the prioritised SDGs by 2030 if the current pace of progress is to be maintained without any amelioration through 2030. Although some progress has been observed in ending poverty (SDG 1), ensuring healthy lives (SDG 3), ensuring inclusive and equitable quality education (SDG 4), and supporting industry, innovation and infrastructure (SDG 9) in the OIC countries group, these improvements are not still sufficient to achieve the targets of the prioritised SDGs by 2030. Regarding ending hunger (SDG 2) and ensuring sustainable economic growth and decent work (SDG 8), stagnant progress has been recorded that is too slow for the OIC countries group to be on track to achieve these two SDGs.
On the other hand, insufficient levels of data on SDG 5 and SDG 13 indicators pose challenges to make a comprehensive progress analysis on the entirety of these goals; thus, the Report leaves the OIC level aggregate estimations in future editions once data are accessible on the Global SDG Indicators Database maintained by UNSD.
Goal 1: No Poverty
Extensive policy measures are essential for the OIC countries group to end poverty by 2030. The OIC countries group had around 30.1% of their population living on less than 1.90 USD a day in the 2000s. By 2017, this rate decreased nearly by half to 16.2%. Despite significant improvements, progress is insufficient on ending extreme poverty for all people in the OIC by 2030.
Strengthening economic, social, health and environmental resilience is important for OIC countries. In this connection,
direct economic losses attributed to disasters have significantly been reduced across the OIC countries since the 2000s, yet some OIC countries are still remaining vulnerable to climate-related disasters.
Efficient mobilisation of government resources is an essential element of the poverty alleviation strategies. Therefore, education, health, and social protection sectors need significant resource allocations. For instance, the number of OIC countries with education expenditures within the range of 15% to 20% of total public spending or above – as suggested by Incheon Declaration – has decreased from 27 to 24 over the analysed period. This suggests that OIC countries group need to increase government spending on the aforementioned essential key services to help those left behind in getting back on their feet.
Goal 2: Zero Hunger
The prevalence of undernourishment in the OIC countries group has fallen from 16.3% in 2000 to 13.4% in 2016. Despite this overall positive progress, this indicator has continuously showed an upwards trend from 12.2% in 2011 to 13.4% in 2016. Malnutrition and undernourishment lead to several health issues among children; such as, stunting, wasting, and overweight. Particularly, stunting and wasting in children have been declining but with the current progress rates, no OIC country will be able to achieve the SDG 2 targets of ending hunger and all forms of malnutrition for all by 2030.
This slow progress urges for rational utilisation and management of water, land, technology, and other natural and human resources in the sufficient production of safe and nutritious food for all. In this context, increasing funding and investment in agricultural productivity – particularly through international cooperation – would help to achieve the related targets found in the 2030 Development Agenda. Specifically, particular attention should be paid on small-scale businesses and farmers. Moreover, the OIC countries need to develop their capacities to study and estimate the local breeds that may face the danger of extinction to take adequate measures in advance.
Goal 3: Good Health and Well-Being
Health is a fundamental human right and an important aspect of sustainable development due to its strong connections to the other aspects of sustainable development; namely, water and sanitation, gender equality, climate change, and peace and stability. Poor health limits economic opportunities for men and women and increases poverty within communities.
Substantial improvements have been achieved by the OIC countries group in decreasing maternal mortality rate (MR), under-five MR, and neonatal MR. Particularly, maternal MR fell from 397 deaths per 100,000 live births in 2000 to 256 deaths in 2015. This progress would need to be maintained and further improved in order to achieve the related SDG 3 targets by 2030.
In the OIC as a whole, the risk of dying from cardiovascular diseases, cancer, diabetes, and chronic respiratory diseases for those aged 30–70 years decreased by 2.9 percentage-points from 25.1% in 2000 to 22.2% in 2016. However, the decrease recorded by the OIC countries group still remained below that of the world. These non-communicable diseases have a major impact on the health and well-being of people in the OIC countries which deny the citizens’ life of dignity, undermine labour productivity, and threaten their economic prosperity.

Towards the Achievement of Prioritised Sustainable Development Goals in OIC Countries: A Progress Report by SESRIC VII
Between 2000 and 2018, the percentage of women of reproductive age who had access to modern contraceptive methods in the OIC countries group increased by 6.2 percentage points from 52.7% in 2000 to 59% in 2018 in parallel to the 2.2 percentage-point increase in the world average from 73.5% in 2000 to 75.7 in 2018. However, the slow pace of the OIC countries group prevent them from achieving this SDG target and reducing the disparity with the rest of the world.
Goal 4: Quality Education
Education is a primary instrument that can lead to improved life and wellbeing of the people. Despite some achievements in students’ participation and progress across the different levels
of education, many OIC countries have demonstrated insufficient progress towards achieving SDG 4 targets by 2030.
Participation in pre-primary education has been increasing in the majority of OIC countries but still many of them would not be able to provide an access to pre-primary education for all children by 2030. In the OIC countries group, the average participation rate in early child education was around 58.6% based on 2018 or most recent year available data. As a result, the OIC countries group need to intensify their efforts to ensure that all girls and boys have access to quality early childhood development. On the other hand, majority of the OIC countries have already achieved or are on track to achieve gender equality in pre-primary education.
Foreign support and international mobility of the students and scientists are of great importance in developing the education sector. Total Official Development Assistance (ODA) in the form of scholarship to OIC countries has increased from 126.6 million USD in 2006 to 177.1 million USD (constant 2016) in 2016. The international support to students in particular in least developed countries (LDCs) would need to be maintained and further improved in order to achieve the ambition laid out in the 2030 Agenda.
Additionally, there is an increasing need for qualified teachers in the OIC countries group. Only in 16 OIC countries, all teachers have received organised teacher trainings. Based on the progress recorded between 2000 and 2018, the OIC countries group need to take the necessary measures to maintain the level of required qualified teachers.
Goal 8: Decent Work and Economic Growth
Increased economic growth is needed to meet the SDG 8 target of 7% GDP growth per annum in the least developed countries of the OIC. In the period 2000-2017, the average annual growth rate of real GDP per capita was 2.7% for the group of both all OIC countries and 21 OIC Least Developed Countries (OIC-LDCs). Although the rate was slightly over that of the world (1.7%), it was less than half the target rate of at least 7% a year. OIC-LDCs could not achieve the target of 7% GDP growth per annum if the growth pace could not be accelerated notably.
Economic growth in a country can be achieved either by increasing employment or by total factor productivity through more effective work. Growth in labour productivity — measured by GDP per employed person — was estimated as 2.7% for the OIC countries group in the period 2000-2018, which was slightly higher than that of the world (1.6%). However, the average labour productivity growth rate for the OIC countries group slowed after the financial crisis of 2008-2009. The average rate was 2.2% between 2009 and 2018, compared to 3.2% between 2000 and 2008. Growth in labour productivity drives sustainable
increases in earnings and living standards. The slowdown of productivity growth therefore represents a negative development for the OIC countries group to achieve higher level of development.
The average unemployment rate of the OIC countries group decreased from 8% in 2000 to 7.6% in 2017 based on available data for 42 OIC countries. The OIC countries group will highly likely miss realising the target of achieving full and productive employment and decent work for all by 2030 due to the sluggish progress since 2000. Long-term unemployment causes long-lasting negative impacts for individuals and society by endangering social cohesion and increasing the risk of poverty and social conflict.
Overall, there is still more room for achieving the goal of sustained economic growth, in particular for the least developed countries of the OIC. In those countries, promoting economic diversification is very important not just protecting countries from unexpected global and national economic crises but also ensuring long-term sustainability and more inclusive growth.
Goal 9: Industry, Innovation and Infrastructure
Investments in physical infrastructure — transport, irrigation, energy, and information and communication technology — are crucial to achieving sustainable and inclusive development. During the period 2000-2018, manufacturing value added as a proportion of GDP increased just 1.1 percentage-point in the OIC countries group from 13% to 14.1%. Based on this pace of progress, none of the 21 OIC-LDCs are assessed to be able to achieve the target of doubling industry’s share in GDP by 2030. Therefore, significant investments are needed in the OIC-LDCs to boost technological progress and economic growth.
Although expenditures on research and development (R&D) have grown across the OIC countries in general, all OIC countries lag behind the world average. The OIC economies can increase their competitiveness against other countries and regions by strengthening their scientific and technological base. However, expenditure on R&D in relation to GDP of the OIC countries group has shown limited growth during the past 17 years since 2000. In OIC countries group, 0.4% of GDP was devoted on R&D (based on 2017 or last year available data), compared to 1.7% in the World in 2016 (no estimation was provided in the data source for 2017).
Similarly, despite improvements, the OIC countries showed considerable variation in higher-tech manufacturing. The share of medium-high and high-tech industries in total manufacturing value-added increased by 3 percentage-points from 29.6% in 2000 to 32.6% in 2016 in the OIC countries group. The increase recorded by the world, on the other hand, was 4.1 percentage-points from 40.5% in 2000 to 44.7% in 2016. This is indicative of the continued need for strong and efficient policy support for R&D and innovation activities in the OIC countries in order to reduce the development disparities between the OIC and the rest of the world.
A general decrease was observed in emissions intensity of manufacturing across the OIC countries. CO2 emissions per unit of manufacturing value-added in constant 2010 USD was estimated as 0.7 kg in the OIC countries group in 2016, a 0.2 kg decline compared to 2000. However, this promising recovery was not reflected in the global emissions intensity level. The world average of CO2 emissions per unit of MVA was stagnant at around 0.5 kg CO2 per USD during the period 2000-2016.

Towards the Achievement of Prioritised Sustainable Development Goals in OIC Countries: A Progress Report by SESRIC 1
Assessment and Methodology of Progress towards the SDGsThis section assesses progress towards achieving the SDGs for the OIC countries group. Using historic data since 2000, it is estimated how fast OIC has been progressing towards an SDG and considers whether this pace will be sufficient to achieve the SDG by 2030 or earlier years for indicators having targets. In the remaining cases, the indicator’s trend is compared with the desired direction based on some specified thresholds.
The assessment of indicator trends is visualised in Table 1 in the form of a 4-arrow system. The direction of the arrows shows whether or not the goals or indicators are moving in a sustainable direction. The analysis depends on the desired direction that can be different to the direction in which an indicator is moving. For example, a reduction of the unemployment rate or the proportion of population below the international poverty line would be represented with an arrow facing “up”, as reductions in these indicators mean progress
towards SDG targets. The methodology for assessing indicators are explained further in the next subsection.
Table 1 clearly indicates that the OIC countries group will not achieve any of the 6 SDGs (SDG 1, 2, 3, 4, 8, and 9) with data available by 2030 on its current trajectory. Although progress has been observed in ending poverty (SDG 1), ensuring healthy lives (SDG 3), ensuring inclusive and equitable quality
education (SDG 4), and supporting industry, innovation and infrastructure (SDG 9), these improvements are not sufficient to achieve the SDG targets by 2030.
Regarding ending hunger (SDG 2) and ensuring sustainable economic growth and decent work (SDG 8), stagnant progress has been recorded that is too slow for the OIC countries group to be on track to achieve these two SDGs.
There is a lack of data preventing a comprehensive analysis of SDG 5 and SDG 13; thus, the Report leaves the OIC level aggregate estimations in future editions once data are accessible on the Global SDG Indicators Database maintained by UNSD.
Table 2 provides the progress assessment by indicators chosen in the analysis. Overall, the variation of the goals and indicators are close to each other. One important difference is observed in Goal 9 (supporting industry, innovation and infrastructure). Although manufacturing value added as a proportion of GDP has “decreasing” trend, the proportion of population covered by a third-generation (3G) mobile network seems to be on track. Moreover, OIC countries group will achieve the 2030 SDG targets of ensuring women's full and effective representation in national parliaments if the current pace of progress continues.
Table 1: Trend Visualization of Sustainable Development Goals
OIC
SDG 1: No poverty ↗
SDG 2: Zero hunger →
SDG 3: Good health and well-being ↗
SDG 4: Quality education ↗
SDG 5: Gender equality :
SDG 8: Decent work and economic growth →
SDG 9: Industry, innovation and infrastructure ↗
SDG 13: Climate action :
Source: SESRIC staff calculations based on data extracted between 16/05-13/06/2019 from United Nations Statistics Division (UNSD), Global SDG Indicators Database.
Technical Note: The 4-arrow system for denoting progress assessment of SDGs
:
It shows “stagnant
progress towards SDG” and this
progress it is too slow for the goals to be met by 2030
It shows the trend is going in the wrong direction and it is considered as “movement away from SDG”
It is “on track to
meet SDG” or
shows “significant
progress towards SDG”
It shows “moderate progress towards SDG”, but this
progress is not sufficient to achieve the goal by 2030
It shows the calculation of trend is not possible due to lack of data

Towards the Achievement of Prioritised Sustainable Development Goals in OIC Countries: A Progress Report by SESRIC 2
Table 2: Trend Visualization of Sustainable Development Goals and Indicators
OIC
SDG 1: No poverty ↗
Extreme poverty ↗
National poverty ↗
Economic losses from disasters ↗
Resources mobilization for education →
SDG 2: Zero hunger →
Prevalence of undernourishment →
Prevalence of stunting →
Investment in agriculture →
SDG 3: Good health and well-being ↗
Maternal mortality ↗
Child mortality ↗
Tuberculosis incidence →
Suicide mortality →
Alcohol consumption →
Road traffic deaths →
Reproductive health →
Unintentional poisoning deaths ↗
Immunization coverage ↗
Medical doctor density ↗
Regulations’ core capacities ↗
SDG 4: Quality education ↗
Participation in early childhood education ↗
Equal access to early childhood education ↑
Qualified teachers ↗
SDG 5: Gender equality :
Women’s representation in national parliaments ↑
SDG 8: Decent work and economic growth →
Per capita economic growth →
Growth in labour productivity →
Resource efficiency in consumption ↓
Unemployment rate →
Proportion of bank account holders ↑
SDG 9: Industry, innovation and infrastructure ↗
Manufacturing value added ↓
Carbon dioxide emissions →
Research and development expenditure ↗
Higher-tech manufacturing →
Third-generation (3G) mobile coverage ↑
SDG 13: Climate action :
Affected persons attributed to disasters :
Source: SESRIC staff calculations based on data extracted between 16/05-13/06/2019 from United Nations Statistics Division (UNSD), Global SDG Indicators Database.

Towards the Achievement of Prioritised Sustainable Development Goals in OIC Countries: A Progress Report by SESRIC 3
Methodology of Progress towards the SDGs
Two methods are applied to illustrate the progress of the Sustainable Development Goals. These assessment methods focus on developments over time and not on the current status of the indicators. In this regard, the main purpose of the progress assessment is to measure whether an indicator has moved towards or away from the SDG.
The progress of a country group is estimated through comparing the value of the indicator in 2000 or earliest year available to the value of indicator in 2018 or the latest year available based on the exponential annual growth rate. Each SDG is covered by maximum number of targets that have indicators with data on more than 50% of the countries. Tables 3-12 indicate the period over which the trend is calculated.
Since only a limited number of SDGs indicators have explicit quantified and measurable targets, two methods are developed to assess progress towards the SDGs. For indicators with quantitative targets, the current estimated trend for each indicator is compared against required or theoretical trend necessary to reach the quantitative target. For indicators without quantitative targets, the annual rate of progress is applied to measure the progress of SDGs. Similar strategies are also employed by Eurostat (2019), and SDG Center for Africa and Sustainable Development Solutions Network (2019).
Method 1: Indicators with quantitative targets
This method is composed of three steps. The current estimated trend for each indicator is firstly computed based on the exponential annual growth rate (EAGR), using the following:
𝐸𝐴𝐺𝑅𝑎 =ln(𝐴𝑡 𝐴𝑡0
⁄ )
𝑡 − 𝑡0
where: 𝑡0 = base year, 𝑡 = most recent year, 𝐴𝑡0 = indicator value
in base year, 𝐴𝑡 = indicator value in most recent year. Since many variables vary continuously rather than in a step-wise fashion, 𝐸𝐴𝐺𝑅 is chosen to measure the tracking progress. 𝐸𝐴𝐺𝑅 assesses the pace and direction of the evolution of an indicator. It is based on the data from the first and the last years of the analysed time span, which has to be at least 5 years.
In the second step, the required or theoretical trend necessary to reach the quantitative target is computed, using the following:
𝐸𝐴𝐺𝑅𝑟 =ln(𝐵𝑡1
𝐴𝑡0⁄ )
𝑡1 − 𝑡0
where: 𝑡0 = base year, 𝑡1= target year, 𝐴𝑡0 = indicator value in
base year, 𝐵𝑡1= target value in target year.
In the final step, the ratio of actual to required growth rate is calculated as follows:
𝑅𝑎/𝑟 =𝐸𝐴𝐺𝑅𝑎
𝐸𝐴𝐺𝑅𝑟
Based on this final computation, if the ratio of actual to required growth rate is 100% or more, the indicator shows “significant
progress towards SDG” and the OIC countries group is on on-track to achieve the SDG target for the relevant indicator. If the ratio is at least 50%, but less than 100%, the trend shows “moderate progress towards SDG”, and if the ratio is at least 0%,
but less than 50%, the trend shows “stagnant progress towards
SDG” and this progress it is too slow for the goals to be met by 2030. Negative ratios mean that the trend is going in the wrong direction and it is considered as “movement away from SDG”.
This methodology is visualized in Figure 1.
Figure 1: Graphic Representation of the SDG Trends Methodology for Indicators with Quantitative Targets
In this method, quantitative targets are explicitly mentioned in SDGs. The first exception is the target of annual growth rate of real GDP per capita for OIC countries that are not classified in the least developed countries (OIC-LDCs) group. For those non OIC-LDCs, the target is determined as 5% per annum to get a better comparison within OIC. Moreover, since this indicator is already measured as annual growth rate, the simple average of 2000-2017 is used as 𝐸𝐴𝐺𝑅𝑎. The second exception is the indicator of annual growth rate of real GDP per employed person. The same targets
and methodology of annual growth rate of real GDP per capita are implemented for this indicator. Due to applying formulas, if the target is 0% for an indicator, for example the proportion of population below the international poverty line, the value of 1% is accepted as already maintaining the SDG achievement level. Similarly, if the target is 100%, 95% is also accepted as already maintaining SDG achievement level. Moreover, if the target is specified as “double its share” or “by half”, the year 2015 or the
latest year available are taken as the base year.
2000 2005 2010 2015 2020 2025 2030
Required target path
50% target path

Towards the Achievement of Prioritised Sustainable Development Goals in OIC Countries: A Progress Report by SESRIC 4
Method 2: Indicators without quantitative targets
The assessment of trends for indicators without quantitative targets is based on the exponential annual growth rate (EAGR), using the following formula:
𝐸𝐴𝐺𝑅 =ln(𝐴𝑡 𝐴𝑡0
⁄ )
𝑡 − 𝑡0
where: 𝑡0 = base year, 𝑡 = most recent year, 𝐴𝑡0 = indicator value
in base year, 𝐴𝑡 = indicator value in most recent year.
Comparing the indicator trend with the desired direction is the only possible way to estimate the progress towards SDGs for
indicators without targets. The observed annual growth rate is compared to the following thresholds: a change of 2% per year or more in the desired direction is considered “significant
progress towards SDG”; a change of more than 1% but less than 2% (including 1%) per year in the desired direction is considered “moderate progress towards SDG”; a change of more than 0%
but less than 1% (including 0%) per year in the desired direction is considered “stagnant progress towards SDG”; and a change in the wrong direction is considered “movement away from SDG”. This threshold strategy provide enough variation causing
a sufficient number of indicators falling in all four categories. A similar threshold strategy is also employed by Eurostat (2019) with smaller thresholds. The methodology for indicators without targets is visualized in Figure 2.
Figure 2: Graphic Representation of the SDG Trends Methodology for Indicators without Quantitative Targets
Method for calculating average scores at the goal level
The estimated progress values for indicators are inserted into a scoring function in order to compute the average estimated progress for SDGs. The average scores on the goal level are calculated as the simple arithmetic mean of the individual scores of the indicators chosen for monitoring the respective goal. These goal-level scores range from 0 (worst score) to 4(best score). The scoring functions use broader cut-off points than the thresholds used in calculation of 𝐸𝐴𝐺𝑅 and 𝑅𝑎/𝑟 to allow for larger variability in the scores. Both threshold points are designed in harmony to ensure that indicators with and without quantitative targets have the same weight when calculating the average score at the goal level.
For indicators with quantitative targets, each indicator trend is first re-normalized on a scale from 0 to 4 linearly. Decreasing indicators are assigned a value between 0-1 where 𝑅𝑎/𝑟 of -50% or below receives a score of 0. Indicator trends that show “stagnant progress towards SDG” are assigned a value between
1-2, where 𝑅𝑎/𝑟 of 0% receives a score of 1. Indicators that show “moderate progress towards SDG” are assigned a value between 2-3 where 𝑅𝑎/𝑟 of 50% receives a score of 2. Those indicators that show “significant progress towards SDG” or “on
track” are assigned values between 3-4 where 𝑅𝑎/𝑟 of 100% receives a score of 3 and 𝑅𝑎/𝑟 of 150% or above receives a score of 4. Indicators that are already maintaining SDG achievement are assigned a score of exactly 3.5 as it is the mean of 3-4 interval. The score function is continuously linear as a whole.
For indicators without quantitative targets, each indicator trend is similarly re-normalized on a scale from 0-4. Decreasing indicators are assigned a value between 0-1 where 𝐸𝐴𝐺𝑅 of -1% or below receives a score of 0. Indicator trends that show “stagnant progress towards SDG” are assigned a value between
1-2, where 𝐸𝐴𝐺𝑅 of 0% receives a score of 1. Indicators that show “moderate progress towards SDG” are assigned a value between 2-3 where 𝐸𝐴𝐺𝑅 of 1% receives a score of 2. Those indicators that show “significant progress towards SDG” are
assigned values between 3-4 where 𝐸𝐴𝐺𝑅 of 2% receives a score of 3 and 𝐸𝐴𝐺𝑅 of 4% or above receive a score of 4. Indicators that are already maintaining SDG achievement are assigned a score of exactly 3.5 as it is the mean of 3-4 interval. The score function is continuously linear as a whole.
The overall goal trends are computed as an arithmetic average of the rescaled values for all trend indicators. An average between 0-1 corresponds to a “movement away from SDG”, 1-2 to “stagnant progress towards SDG”, 2-3 to “moderate progress
towards SDG”, and 3-4 to “significant progress towards SDG.”
Trends are reported at the SDG level only if trend data are available for at least three trend indicators under a goal. The available indicators are insufficient to calculate a meaningful average score for SDG 5 and SDG 13. These trends are designated with the symbol of “:” in the 4-arrow system. The tables in Appendix 2 provide the complete list of indicators used to compute SDG trends along with source of data and respective target values, if any.
2000 2005 2010 2015 2020 2025 2030
1% growth per year
2% growth per year

Towards the Achievement of Prioritised Sustainable Development Goals in OIC Countries: A Progress Report by SESRIC 5
SDG 1. End Poverty in all its Forms EverywherePoverty is the backbone of the problems associated with poor health, low education, and unemployment. As a result, the poor population loses the opportunities to exert their full potential, benefit the society and achieve wellbeing in life. In the development economics literature, the widely used “poverty trap” theory
postulates that low-income economies, particularly, the least developed countries have been stuck in the poverty circle and only substantial long-term measures such as investment into education and research and development can take these countries to the next stages of the economic development. In this retrospect, policy measures are essential in fair and effective distribution of the resources available to national/sub-national governments as well as improving cooperation across the sectors with a specific focus on education, social protection, and other universal primary needs of the people.
Sustainable Development Goal 1 (SDG 1) targets at eliminating extreme poverty in its all forms by 2030. SDG 1 calls to ensure equal rights and access to resources for all groups of the population. Safeguarding basic standards of living and providing social services and benefits for the poorest and most vulnerable group of the population, while ensuring the wellbeing and shared prosperity for everyone is covered in the vision of SDG 1.
Extensive policy measures are essential for OIC countries to eradicate extreme poverty by 2030
People can be characterised as living in extreme poverty if their earnings are below the international poverty line which was originally defined as dollar-a-day at 1985 purchasing-power-parity (PPP) and this measure has been used systematically since 1990. Later, it was increased to 1.25 USD a day at 2005 PPP and has been used until the end of the Millennium Development Goals (MDGs) period.
Currently, the international poverty line is demarcated as the proportion of the population living on less than 1.90 USD per day at 2011 PPP. This line represents the average of national poverty lines a day for 15 poorest countries in the world based on their per capita consumption levels (UNSD, SDG 1.1 metadata). From 2000 through 2017, the proportion of the world population living below the international poverty line has decreased from around 25.6% to 10%.
As to the OIC countries group, in the 2000s around 30.1% of the population were living on less than 1.90 USD a day. By 2017, this number decreased nearly by half to 16.2%. When compared with the global poverty average, the OIC countries group average is higher as 21 out of 47 least developed countries (LDCs) are OIC countries.
SDG target 1.1 envisions the complete elimination of extreme poverty by the year 2030. 30 out of 39 OIC countries with data available on “proportion of population below international poverty line” have demonstrated progress in poverty alleviation since 2000. 10 OIC countries, namely; Jordan, Kyrgyzstan, Tajikistan, Turkey, Morocco, Pakistan, Gambia, Indonesia, Egypt, and Tunisia, managed to decrease their poverty figures at an annual average rate ranging between 27.5% and 9.7% in the period 2000-2017.
Azerbaijan, Kazakhstan, and Malaysia already achieved SDG 1.1. Following these top 3 countries Jordan (0.1%), Iran (0.2%), and Turkey (0.2%) seem to achieve SDG 1.1 soon.
Figure 3: Proportion of Population below International Poverty Line, Percent, 2000 vs. 2017
Source: SESRIC staff calculations based on data extracted between 16/05-13/06/2019 from United Nations Statistics Division (UNSD), Global SDG Indicators Database. Please see Appendix 1 for exceptions and details.
0 10 20 30 40 50 60 70 80
MozambiqueNiger
UgandaChad
GuineaSierra Leone
MaliBurkina Faso
TogoGuinea-Bissau
NigeriaSenegal
BeninGambia
KyrgyzstanIndonesia
BangladeshTajikistan
OICPakistan
WorldCote d'Ivoire
CameroonDjibouti
MauritaniaComoros
KazakhstanMaldives
YemenGabon
MoroccoTunisia
EgyptAzerbaijan
IraqAlbaniaTurkey
PalestineJordan
IranMalaysia
2000 2017

Towards the Achievement of Prioritised Sustainable Development Goals in OIC Countries: A Progress Report by SESRIC 6
Based on their progress pace between 2000 and 2017, 8 OIC countries including Kyrgyzstan, Morocco, Egypt, Tunisia, Albania, Tajikistan, Pakistan, and Palestine are expected to either achieve SDG 1.1 or decrease their extreme poverty proportions below 1% by 2030.
On the other hand, poverty has exacerbated in 8 OIC countries - Yemen, Comoros, Iraq, Guinea-Bissau, Cote d'Ivoire, Djibouti, Cameroon, and Benin (Figure 3). As of 2017 (or most recent year), more than 40% of the population in 10 OIC countries (Guinea-Bissau, Mozambique, Nigeria, Sierra Leone, Mali, Benin, Togo, Niger, Burkina Faso, and Uganda) have been living under extreme poverty conditions (Figure 3).
If the current trend in poverty alleviation holds, approximately 10% of the total OIC population is estimated to be living in extreme poverty in 2030. This estimation for the world is 6%.
Few OIC countries are projected to achieve the poverty eradication target measured in national poverty lines by 2030
Measuring national poverty lines is intended to provide more precise estimates of poverty rates that are consistent with national specific social and economic circumstances. Thus, a uniform measure does not exist for comparing national poverty rates. Generally, more advanced economies inclined to have more complex poverty definitions that comprise access to different public services and social facilities.
Definitions of “national poverty line” vary greatly across countries. As calculating an OIC average or regional averages as well as making cross-country comparison would be not useful, the progress of individual countries over time is considered in this Report. SDG target 1.2 is “by 2030, reduce at least by half the
proportion of men, women, and children of all ages living in poverty in all its dimensions according to national definitions” (UNSD, SDG 1.2 metadata).
Since 2000, 31 OIC countries have demonstrated some improvements in poverty eradication based on their respective national poverty estimations over the period under consideration. 14 OIC countries are expected to achieve SDG 1.2 by 2030. 4 OIC countries have already achieved this target. The countries with the double-digit average annual progress rate in poverty alleviation measured by national poverty line are Turkey (22.6%), Kazakhstan (20.4%), Azerbaijan (19.2%) and Malaysia (19.2%), followed by Morocco (7.7%), Uganda (6.8%) and Pakistan (6.5%) (Figure 4).
In contrast, proportions of people below national poverty lines increased in 8 OIC countries. Due to political instability or enormous flows of refugees, Syria, Jordan, and Yemen witnessed the highest setbacks. They are followed by Egypt, Cote d'Ivoire, Guinea-Bissau, Benin, and Palestine. These countries are in the most vulnerable situation and expected to miss the target in 2030 if the circumstances will not reverse by then.
It is worth noting that there may be some inconsistencies in measuring progress rates between using the national poverty line and the international poverty line. Particularly, Iraq, Comoros, and Cameroon show improvements in decreasing proportions of people living below the national poverty line, although their international poverty line figures got worse over the same period (Figure 3 and Figure 4).
Figure 4: Proportion of Population Living below the National Poverty Line, Percent, 2000 vs. 2017
Source: SESRIC staff calculations based on data extracted between 16/05-13/06/2019 from United Nations Statistics Division (UNSD), Global SDG Indicators Database. Please see Appendix 1 for exceptions and details.
0 10 20 30 40 50 60 70 80
Sierra Leone
Guinea-Bissau
Pakistan
Togo
Mali
Guinea
Senegal
Chad
Mozambique
Burkina Faso
Mauritania
Azerbaijan
Bangladesh
Niger
Nigeria
Kazakhstan
Comoros
Cameroon
Kyrgyzstan
Uganda
Cote d'Ivoire
Benin
Afghanistan
Yemen
Tajikistan
Turkey
Syria
Palestine
Albania
Tunisia
Maldives
Iraq
Egypt
Indonesia
Morocco
Uzbekistan
Jordan
Malaysia
2000 2017

Towards the Achievement of Prioritised Sustainable Development Goals in OIC Countries: A Progress Report by SESRIC 7
OIC countries are remaining vulnerable to climate-related disasters
There are direct economic losses from natural disasters generally in the form of physical damage as well as indirect devaluations in economic value associated with direct economic losses. Direct economic loss is estimated through measuring the economic value of the physical assets such as schools, hospitals, houses, infrastructure, government buildings and others affected by environmental disaster.
SDG target 1.5 is “to build the resilience of the poor and those in
vulnerable situations and reduce their exposure and vulnerability to climate-related extreme events and other economic, social and environmental shocks and disasters by 2030” (UNSD, SDG 1.5 metadata).
SDG target 1.5 originates from Target C of the Sendai Framework for Disaster Risk Reduction 2015-2030. The indicator selected to measure the progress of the target is also the same - direct economic loss attributed to disasters relative to GDP. Based on available data, economic losses attributed to disaster in the OIC countries group have decreased from around 22.3 billion USD to
10.5 billion USD over the period 2005-2017. Data on direct economic losses attributed to the disaster were available on 36 OIC countries. Figure 5 below shows the share of these losses in GDP for 28 OIC countries between 2005 and 2017 or last year available.
Based on 2017 or the most recent data available, 13 OIC countries, including, Azerbaijan, Burkina Faso, Djibouti, Egypt, Gambia, Guinea, Kuwait, Maldives, Palestine, Somalia, Turkey, Uganda, and Uzbekistan were without any economic losses attributed to disasters. On the other hand, 7 OIC countries including Albania, Comoros, Kyrgyzstan, Lebanon, Morocco, Niger, and Senegal had economic losses below 1 million USD. Among the 13 OIC countries, only 5 of them, namely; Burkina Faso, Djibouti, Maldives, Turkey, and Uganda reported losses when the whole period (2005-2017) is considered.
Overall, 20 OIC countries listed above already reported no direct economic losses or losses less than 1 million USD attributed to disasters. However, this indicator on its own does not represent the whole target and does not show whether results were a result of policies and disaster management measures in the respective countries.
Figure 5: Direct Economic Loss Attributed to Disasters Relative to GDP, Percent, 2005-2017
Source: SESRIC staff calculations based on data extracted between 16/05-13/06/2019 from United Nations Statistics Division (UNSD), Global SDG Indicators Database. Please see Appendix 1 for exceptions and details.

Towards the Achievement of Prioritised Sustainable Development Goals in OIC Countries: A Progress Report by SESRIC 8
OIC countries need to implement urgent actions to increase the allocation of total public spending on education in the 15%-20% range
Efficient mobilization of government resources is an essential element of poverty alleviation strategies. Education, together with health and other social services sectors are necessary for sustainable development. The 2030 Development Agenda approaches this issue as a means of implementation for the achievement of SDG 1. Accordingly, SDG target 1.a calls for mobilisation of resources toward providing essential services to all population. As SDG 1.a does not specifically mention a quantifiable target, some benchmark targets set by relevant international organisations have been used as reference points for our analysis.
Education 2030, Incheon Declaration, and Framework for Action for the Implementation of SDG 4 call for the allocation of the total public spending on education in the 15%-20% range, on average
equivalent to 4% to 6% of the GDP of a country. While the number of OIC countries with education expenditures within the range of 15%-20% of total public spending or above was 27 in 2000, it decreased to 24 countries in 2017.
The proportion of government expenditure on education also decreased across 28 OIC countries from 2000 to 2017. Education spending in 11 OIC countries (Mali, Guinea, Niger, Gabon, Bangladesh, Maldives, Azerbaijan, Kuwait, Egypt, Djibouti and Yemen) declined below 15% during this period in opposition to the suggested levels by the Incheon Declaration.
In contrast, share of government spending on education in total public spending has increased in 20 OIC countries. Progress has been most fruitful for 7 OIC countries (Benin, Cameroon, Guinea-Bissau, Indonesia, Kyrgyzstan, Tajikistan, and Oman) that were below the 15% target in 2000 but succeeded to achieve the target of Incheon Declaration by 2017 (Figure 6).
Figure 6: Proportion of Total Government Spending on Essential Services, Education, Percent, 2000 vs. 2017
o/o 2000 ●/● 2017
Source: SESRIC staff calculations based on data extracted between 16/05-13/06/2019 from United Nations Statistics Division (UNSD), Global SDG Indicators Database. Please see Appendix 1 for exceptions and details.
0
5
10
15
20
25
30
35
40
Leba
non
Mau
ritan
iaS
udan
Bru
nei
Uga
nda
Turk
eyA
lban
iaP
akis
tan
Om
anC
amer
oon
Gui
nea-
Bis
sau
Tajik
ista
nG
uyan
aK
yrgy
zsta
nB
enin
Moz
ambi
que
Syr
iaS
audi
Ara
bia
Indo
nesi
aS
eneg
al
Countries with increase
0
5
10
15
20
25
30
35
40B
ahra
inA
zerb
aija
nQ
atar
Gam
bia
Egy
ptG
abon
Mal
dive
sB
angl
ades
hK
azak
hsta
nD
jibou
tiC
had
Yem
enJo
rdan
Nig
erK
uwai
tG
uine
aM
ali
Com
oros
Afg
hani
stan
Togo
Mor
occo
Bur
kina
Fas
oC
ote
d'Iv
oire
Sie
rra
Leon
eU
zbek
ista
nIra
nM
alay
sia
Tuni
sia
Countries with decrease

Towards the Achievement of Prioritised Sustainable Development Goals in OIC Countries: A Progress Report by SESRIC 9
SDG 2: End Hunger, Achieve Food Security and Improved Nutrition and Promote Sustainable AgricultureThe OIC countries have made moderate achievements in reducing the proportions of people suffering from hunger. As there is still a significant number of undernourished people and children with wasting and stunting, rational utilisation and management of water, land, technology, other natural and human resources in the sufficient production of food is a must to achieve SDG 2 by 2030. In this context, increased levels of funding and investment particularly through international cooperation are expected to better food production productivity. Most attention is to be paid towards the small-scale businesses and farmers.
Upwards trend after 2011 still holds true for the proportion of the undernourished people in total OIC population
SDG target 2.2 envisions the complete elimination of prevalence of undernourishment by 2030. To measure progress in this regard, the proportion of undernourished people in the total population is a widely used indicator. Prevalence of undernourishment defines the proportion of the population regularly consuming an insufficient amount of food for living normal and healthy life measured by caloric intake. Individuals’ age, weight, height, activity levels, and population demographics of a particular country can define basic caloric requirements.
According to the data extracted from the UNSD Global SDG Database, there were around 223 million undernourished people in the OIC countries group, corresponding to around 28% of the 804 million undernourished people globally in 2016.
Over the period from 2000 to 2016, the prevalence of undernourishment in the OIC countries group has fallen from 16.3% to 13.4% of the total population. Despite this overall positive progress, the constant upwards trend observed between 2011 (12.2%) and 2016 (13.4%) calls for necessary precautions to be taken by the OIC countries to prevent the prevalence of undernourishment getting worse.
At the country level, Azerbaijan, Kuwait, and Turkey already achieved the no undernourishment by 2030 target. Kazakhstan with less than 2.5% and UAE, Brunei, and Malaysia with levels below 3% are closely approaching the target. Apart from these countries, the progress of all other OIC countries was not sufficient enough to meet the target if they will continue with a similar rate of progress in eradicating undernourishment.
Overall, 39 OIC countries demonstrated positive improvements in tackling the prevalence of undernourishment. Among them, the highest performance was demonstrated by Cameroon with a yearly decrease at 9% undernourishment fall from 30.8% in 2000 to 7.3% in 2016 (Figure 7). However, 10 OIC countries showed no change or even recorded an increase in the proportions of the undernourished people in their respective total populations.
Figure 7: Prevalence of Undernourishment, Percent, 2000 vs. 2016
Source: SESRIC staff calculations based on data extracted between 16/05-13/06/2019 from United Nations Statistics Division (UNSD), Global SDG Indicators Database. Please see Appendix 1 for exceptions and details.
0 10 20 30 40 50
DjiboutiAfghanistan
MozambiqueChad
Sierra LeoneTogo
CameroonYemen
SenegalIraq
UgandaGuinea
Guinea-BissauSudan
Burkina FasoPakistan
AzerbaijanBeninNiger
BangladeshCote d'Ivoire
IndonesiaKyrgyzstan
OICUzbekistan
WorldMali
MaldivesGambia
SurinameJordanOman
MauritaniaAlgeriaGabonNigeria
GuyanaTurkmenistan
AlbaniaMorocco
Saudi ArabiaKazakhstan
EgyptIran
TunisiaUAE
BruneiMalaysiaLebanon
KuwaitTurkey
2000 2016

Towards the Achievement of Prioritised Sustainable Development Goals in OIC Countries: A Progress Report by SESRIC 10
Stunting and wasting in children have been declining but with the current progress rate, no OIC country will achieve the SDG target 2.2 by 2030
Prevalence of malnutrition (in the forms of overweight, wasting, and stunting) measures the result part of the hunger in contrast to undernourishment which demarcates the cause. It is important to investigate this indicator as one of its forms; i.e. stunting, is one of the underlying causes of child mortality. Children suffering from stunting are most generally lag behind in cognitive and physical performances what limit them in reaching their full potential (UNSD, SDG 2.2 metadata).
The proportion of children moderately or severely stunted in the OIC countries group has decreased from 37.2% to 32.5% between 2000 and 2016. In comparison, global figures also dropped from 34.2% to 22.2% over the same period (Figure 8).
The immediate SDG target is to cut the prevalence of child stunting by 40% from its 2012 levels. The more long-term target is to eliminate child stunting and all other forms of malnutrition by 2030. Overall, 40 out of 50 OIC countries with available data showed an improvement over the period under consideration. 5 OIC countries with highest annual progress rates of 6% or more were Kazakhstan, Palestine, Uzbekistan, Cote d'Ivoire, and Turkmenistan (Figure 8).
On the other end, 10 OIC countries, namely; Oman, Djibouti, Malaysia, Kuwait, Syria, Pakistan, Gambia, Nigeria, Chad, and Sudan witnessed a worsening situation during the period in focus. If the current progress pace does not change, no OIC country is expected to achieve the target by 2030.
With regards to the children moderately or severely wasted, 3 OIC countries; Morocco, Palestine, and Uzbekistan showed a significant improvement and are expected to achieve the relevant SDG target by 2030. Azerbaijan, Togo, Kazakhstan, Kyrgyzstan, and Benin are also very likely to achieve the target. Unfortunately, 16 OIC countries exhibited an exacerbation of the situation where the proportion of children moderately or severely wasted increased.
In OIC countries, child overweight caused by malnutrition is relatively less of an issue compared to the above discussed malnutrition issues. By 2030, 10 OIC countries including Cote d'Ivoire, Burkina Faso, Senegal, Nigeria, Togo, Yemen, Mauritania, Benin, Syria, and Guinea-Bissau are projected to achieve the target.
Yet, proportion of overweight children has increased in 16 OIC countries and remained unchanged in 2 OIC countries. This is an emerging malnutrition issue that can cause significant damages to child wellbeing.
OIC countries need to develop their capacities to study and estimate the local breeds that may face the danger of extinction
SDG target 2.5 calls for maintaining the genetic diversity of plants, animals, and species and is set for 2020. In 42 OIC countries, all local breeds were at unknown level of risk of extinction. The case with these 42 OIC countries is consequently an alarming case as without information on the level of risk of extinction of all breeds, one cannot design and implement policies to manage the situation.
As of 2018, 91.7% of the local breeds in OIC countries were classified as being at the unknown level of risk of extinction, 2.2% known being at risk and 6.1% known being not at risk.
Figure 8: Proportion of Children Moderately or Severely Stunted, Percent, 2000 vs. 2016
Source: SESRIC staff calculations based on data extracted between 16/05-13/06/2019 from United Nations Statistics Division (UNSD), Global SDG Indicators Database. Please see Appendix 1 for exceptions and details.
0 10 20 30 40 50 60
AfghanistanYemen
NigerBangladesh
MozambiqueComoros
UgandaBurkina Faso
NigeriaMali
IndonesiaTajikistanPakistan
Cote d'IvoireMauritania
ChadGuineaAlbania
BeninSierra Leone
SudanOIC
Guinea-BissauCameroon
WorldMaldivesSenegalSomalia
IraqTurkmenistan
TogoDjiboutiGabon
UzbekistanEgyptSyria
AzerbaijanGambiaAlgeria
MoroccoKyrgyzstan
KazakhstanMalaysia
TunisiaPalestine
TurkeySuriname
GuyanaJordanOman
IranKuwait
2000 2016

Towards the Achievement of Prioritised Sustainable Development Goals in OIC Countries: A Progress Report by SESRIC 11
Compared with 2000 values, the situation worsened in 2018 as only 0.9% was known to be at risk and 7.6% were not at risk in 2000. On the global scale, 66.6% of the breeds were classified being at unknown level of risk of extinction, 26.3% known being at risk of extinction and 7.1% not at risk in 2018. The global situation has slightly improved since 2000 as the proportion of breeds at risk was as high as 27.9% (Figure 9).
Among the OIC countries with available data, 3 of them including Senegal (50%), Niger (41.7%), and Indonesia (26.1%) were with the highest share of breeds being not at risk in 2018. Only in Indonesia, proportions of breeds known being not at risk has increased from 16.3% in 2000 to 26.1% in 2018.
In all other OIC countries, proportions of the breeds known being not at risk has decreased (Figure 9). The highest deterioration during the period under consideration was observed in Iraq from 26.7% to 0%, Malaysia from 41.8% to 8.3%, and Tunisia from 33.3% to 12.5%.
Total Official Flows to the agriculture sector in OIC countries are on the rise
Total Official Flows (TOF) consists of Official Development Assistance (ODA) and Other Official Flows (OOF). Financial
disbursement to be considered ODA, it should have a minimum of 25% grant element and should be allocated for development purposes. Flows not meeting these criteria are referred to as OOF.
Between 2000 and 2016, the OIC countries recorded an increase of around 60%, from 2.7 billion USD to 4.3 billion USD, in the TOF to the agriculture sector. This growth has been equivalent to the overall increase in total disbursements of TOF to agriculture across the world. In 2016, OIC countries claimed a 36% share of the global TOF to agriculture.
Top recipients were 5 OIC countries including Turkey, Afghanistan, Morocco, Indonesia, and Bangladesh. They accounted for 40% of the TOF to agriculture sector of the OIC countries group in 2016. The OIC countries with the highest percentage increase in TOF to the agriculture sector from 2000 to 2016 were Uzbekistan, Somalia, Guyana, Afghanistan, and the Maldives within the range of 75% and 675% (Figure 10).
However, members of the Development Assistance Committee (DAC) and international organisations decreased their TOF to agriculture sector in 14 OIC countries. As Bahrain, Oman, and Saudi Arabia graduated from ODA recipient status by 2010, TOF to agriculture sector in these 3 OIC countries were not reported by DAC members anymore (Figure 10).
Figure 9: Proportion of Local Breeds by Levels of Extinction Risk (%), 2000 vs. 2018
Source: SESRIC staff calculations based on data extracted between 16/05-13/06/2019 from United Nations Statistics Division (UNSD), Global SDG Indicators Database. Please see Technical notes section for exceptions and details. 42 OIC countries were not included in the figure as 100% of local breeds were classified as unknown level of extinction and 0% was known being at risk and not at risk.
0.0
50.0
50.0
52.6
62.2
66.7
73.3
80.6
81.4
91.5
0.0
8.3
0.0
5.3
27.9
0.0
0.0
3.2
2.3
0.9
100.0
41.7
50.0
42.1
9.9
33.3
26.7
16.1
16.3
7.6
0% 20% 40% 60% 80% 100%
Senegal
Malaysia
Niger
Turkey
World
Tunisia
Iraq
Albania
Indonesia
OIC
2000
Unknown Level of Risk of ExtinctionKnown Being at RiskKnown Being Not at Risk
50.0
75.0
45.8
66.3
66.6
87.5
100.0
79.1
70.7
91.7
0.0
16.7
12.5
14.5
26.3
0.0
0.0
11.6
3.2
2.2
50.0
8.3
41.7
19.3
7.1
12.5
0.0
9.3
26.1
6.1
0% 20% 40% 60% 80% 100%
Senegal
Malaysia
Niger
Turkey
World
Tunisia
Iraq
Albania
Indonesia
OIC
2018
Unknown Level of Risk of ExtinctionKnown Being at RiskKnown Being Not at Risk

Towards the Achievement of Prioritised Sustainable Development Goals in OIC Countries: A Progress Report by SESRIC 12
Figure 10: Total Official Flows to Agriculture sector, Millions of Constant 2016 USD, 2000-2016
Source: SESRIC staff calculations based on data extracted between 16/05-13/06/2019 from United Nations Statistics Division (UNSD), Global SDG Indicators Database. Please see Appendix 1 for exceptions and details.

Towards the Achievement of Prioritised Sustainable Development Goals in OIC Countries: A Progress Report by SESRIC 13
SDG 3. Ensure Healthy Lives and Promote Well-Being for All at All Ages SDG 3 focuses on ensuring healthy lives and promoting well-being for all at all ages. Health is a fundamental human right and an important aspect of sustainable development due to its strong connections to the other aspects of sustainable development, namely; water and sanitation, gender equality, climate change, and peace and stability. Poor health limits economic opportunities for men and women and increases poverty within communities around the world.
Maternal mortality ratio in OIC countries improved between 2000 and 2015 despite many countries still having high rates in 2015
The maternal mortality ratio (MMR) is defined as the number of maternal deaths during a given time period per 100,000 live births. It depicts the risk of maternal death relative to the number of live births and essentially captures the risk of death in a single pregnancy or a single live birth (UNSD, SDG 3.1 metadata).
In 2015, the MMR in the world was estimated at 216 deaths per 100,000 live births which was comparatively lower than the 2000 level of 341 deaths per 100,000 live births. In the OIC countries group, the MMR was estimated at 397 deaths per 100,000 live births in 2000 versus 256 deaths per 100,000 live births in 2015. The MMR of the OIC countries group was higher than that of the world in both 2000 and 2015.
In 2015, MMR of 25 OIC countries was above the world average. The situation was the worst in Sierra Leone with 1,360 deaths per 100,000 live births. The remaining 32 OIC countries had MMR below 200 deaths per 100,000 live births which was less than the world average.
In order to achieve the SDG target on MMR by 2030, an MMR less than 70 per 100,000 live births must be achieved. In 2015, 25 OIC countries had MMR below 70 per 100,000 live births which is the figure required to achieve the target by 2030.
Between 2000 and 2015, 14 OIC countries with the highest MMR declines were Sierra Leone (1,290), Afghanistan (704), Chad (514), Mozambique (426), Nigeria (356), Somalia (348), Guinea (297), Uganda (277), Guinea-Bissau (251), Mali (247), Niger (241), Sudan (233), Bangladesh (223), and Mauritania (211). Furthermore, MMR decline in 40 OIC countries was below 200 deaths per 100,000. However, MMR increased in 3 OIC countries namely; Guyana (19), Kyrgyzstan (2), and Uzbekistan (2) in the period under consideration (Figure 11).
Under-Five Mortality Rate in the OIC countries group still high as of 2017
Under-Five Mortality Rate (U5MR) is defined as the probability of a child born in a specific year or period dying before reaching the age of 5 years, if subject to the age-specific mortality rates of that period, expressed per 1,000 live births (UNSD, SDG 3.2 metadata).
The global U5MR declined from 77 deaths per 1,000 live births in 2000 to 39 in 2017. However, the OIC countries group average remained higher than that of the world in both years, 100 deaths per 1,000 live births in 2000 and 55 in 2017.
At the individual OIC country level, U5MR in 27 OIC countries was at least equal to or below the 25 per 1,000 live births target set by 2030. Among them, most exceptional were by Bahrain (7), Saudi Arabia (7), and Qatar (8), Lebanon (8), Malaysia (8),
Figure 11: Maternal Mortality Ratio per 100,000 Live Births, 2000 vs. 2015
Source: SESRIC staff calculations based on data extracted between 16/05-13/06/2019 from United Nations Statistics Division (UNSD), Global SDG Indicators Database. Please see Appendix 1 for exceptions and details.
0 500 1000 1500 2000 2500 3000
Sierra LeoneChad
NigeriaAfghanistan
SomaliaGuinea
MozambiqueGambia
MaliMauritania
Guinea-BissauNiger
CameroonCote d'Ivoire
UgandaBenin
Burkina FasoSudan
ComorosTogo
SenegalYemenGabon
DjiboutiBangladesh
OICWorld
PakistanIndonesiaSurinameMoroccoGuyanaAlgeria
MaldivesTunisiaTurkeyJordan
KyrgyzstanSyria
PalestineTajikistan
KazakhstanEgypt
IraqTurkmenistan
MalaysiaIran
AzerbaijanAlbania
LebanonUzbekistan
BruneiQatar
Saudi ArabiaBahrain
OmanLibyaUAE
Kuwait
2000 2015

Towards the Achievement of Prioritised Sustainable Development Goals in OIC Countries: A Progress Report by SESRIC 14
Maldives (8), Kuwait (8), Albania (9), UAE (9), and Kazakhstan 10 deaths per 1,000 live births in 2017. On the other hand, U5MR in 30 OIC countries in 2017 remained above 25 deaths per 1,000 live births. 5 of these OIC countries including Somalia (127), Chad (123), Sierra Leone (111), Mali (106) and Nigeria (100) had rates which were four times or higher than the 25 deaths per 1,000 live births target.
On the other hand, U5MR decreased in all OIC countries between 2000 and 2017. 10 OIC countries with the highest U5MR declines were Niger, Sierra Leone, Mali, Burkina Faso, Mozambique, Uganda, Guinea-Bissau, Senegal, Nigeria, and Guinea. The decreases in these countries were between 80 and 139 deaths per 1,000 live births (Figure 12).
Declines recorded in Neonatal Mortality Rate between 2000 and 2017 need to be maintained by OIC countries to achieve the child mortality target
Neonatal Mortality Rate (NMR) is defined as the probability that a child born in a specific year or period will die before reaching 28 completed days of life, if subject to the age-specific mortality rates of that period, expressed per 1,000 live births (UNSD, SDG 3.2 metadata).
NMR target has been set as 12 neonatal deaths per 1,000 live births by 2030 to reflect the importance of neonatal mortality as part of overall child mortality. Globally, NMR declined from 31 neonatal deaths per 1,000 live births in 2000 to 18 neonatal deaths per 1,000 live births in 2017. 25 OIC countries already have reduced their NMR to at least as low as 12 per 1,000 live births in 2017 while 32 countries had NMR still above 12 per 1,000 live births in the same year.
Tuberculosis remains a major health challenge as it threatens lives of many people in OIC countries
The tuberculosis (TB) incidence per 100,000 population is defined as the estimated number of new and relapse TB cases (all forms of TB, including cases in people living with HIV) arising in a given year, expressed as a rate per 100,000 population (UNSD, SDG 3.3 metadata).
TB is one of the many communicable or infectious diseases which countries aim to end by 2030. Although the number of cases of tuberculosis per 100,000 people globally decreased from 170 in 2000 to 134 in 2017, the prevalence was still higher in the OIC countries group with168 cases per 100,000 in 2017.
In 2017, TB cases in 19 OIC countries were more than 100 per 100,000 people and top 10 OIC countries with TB cases were Mozambique (551), Gabon (529), Guinea-Bissau (374), Indonesia (319), Sierra Leone (301), Djibouti (269), Pakistan (267), Somalia (266), Bangladesh (221), Nigeria (219), and Uganda (201).
However, TB cases in 38 OIC countries were below 100 per 100,000 people in 2017 and 4 countries, namely; Jordan, Oman, Palestine, and UAE had the least cases of TB incidence in the same year.
Between 2000 and 2017, the number of affected individuals with TB in 46 OIC countries significantly declined and notable of these countries were in Kyrgyzstan, Kazakhstan, Niger, Cameroon, Tajikistan, Mauritania, Cote d'Ivoire and Djibouti by over 100 per 100,000 people. The prevalence remained the same in 3 OIC countries between the same period even though TB cases in 8 OIC countries (Guinea-Bissau, Mozambique,
Figure 12: Under-Five Mortality Rate, Deaths per 1,000 Live Births, 2000 vs. 2017
Source: SESRIC staff calculations based on data extracted between 16/05-13/06/2019 from United Nations Statistics Division (UNSD), Global SDG Indicators Database. Please see Appendix 1 for exceptions and details.
0 30 60 90 120 150 180 210 240
Sierra LeoneNiger
MaliChad
NigeriaBurkina Faso
Guinea-BissauSomalia
MozambiqueGuinea
CameroonCote d'Ivoire
UgandaBenin
SenegalAfghanistan
TogoGambia
MauritaniaPakistan
SudanDjibouti
ComorosOIC
YemenTajikistan
BangladeshGabon
TurkmenistanWorld
AzerbaijanUzbekistan
IndonesiaMorocco
KyrgyzstanEgypt
GuyanaIraq
MaldivesKazakhstan
AlgeriaTurkey
SurinameIran
TunisiaPalestine
LibyaJordan
AlbaniaSyria
Saudi ArabiaLebanon
OmanKuwait
BahrainQatar
BruneiUAE
Malaysia
2000 2017

Towards the Achievement of Prioritised Sustainable Development Goals in OIC Countries: A Progress Report by SESRIC 15
Figure 13: Tuberculosis Incidence per 100,000 Population, 2000 vs. 2017,
Source: SESRIC staff calculations based on data extracted
between 16/05-13/06/2019 from United Nations Statistics
Division (UNSD), Global SDG Indicators Database. Please see
Appendix 1 for exceptions and details.
Malaysia, Guyana, Gabon, Tunisia, Suriname, and Chad) rather
increased (Figure 13). The OIC countries need to deploy and
scale up appropriate interventions to prevent, detect and treat
TB in order to achieve SDG target 3.3 by 2030.
Non-communicable diseases have a major impact
on the health and well-being of people in the OIC
countries
Probability of dying between the ages of 30 and 70 years from
non-communicable diseases (NCDs) including cardiovascular
diseases, cancer, diabetes or chronic respiratory diseases is
defined as the percentage of 30-year-old-people who would die
before their 70th birthday from cardiovascular disease, cancer,
diabetes, or chronic respiratory disease, assuming that s/he
would experience current mortality rates at every age and s/he
would not die from any other cause of death e.g. injuries or
HIV/AIDS (UNSD, SDG 3.4 metadata).
The risk of dying from cardiovascular diseases, cancer, diabetes
and chronic respiratory diseases for those aged 30–70 years
decreased by 4.1 percentage-points from 22.4% in 2000 to
18.3% in 2016 in the world. Likewise, the risk of dying from the
same NCDs in the OIC countries group decreased by 2.9
percentage-points from 25.1% in 2000 to 22.2% in 2016.
However, the decrease recorded by the OIC countries group still
remained below that of the world.
While the mortality rate attributed to aforementioned NCDs
decreased in 50 OIC countries, 4 OIC countries including Cote
d'Ivoire, Egypt, Bangladesh, and Indonesia recorded an increase
in risk of dying from these NCDs between 2000 and 2016.
In addition to this, the OIC countries with over 10 percentage-
points decrease in the mortality rate attributed to cardiovascular
disease, cancer, diabetes or chronic respiratory disease
between 2000 and 2016 were Morocco, Bahrain, Kazakhstan,
and Maldives.
The snapshot between 2000 and 2016 of mortality rate
attributed to NCDs in the OIC countries demonstrated
considerable decline, however, majority of the OIC countries
remained far from the objective of reducing by ⅓ the premature
mortality from NCDs by 2030 (Figure 14).
Suicide Mortality Rate remained lower for the OIC
countries group in comparison to that of the world
in 2016
The suicide mortality rate (SMR) is defined as the number of
suicide deaths in a year, divided by the population, and
multiplied by 100,000 (UNSD, SDG 3.4 metadata). Globally, the
estimated SMR dropped from 12.9 per 100,000 population in
2000 to 10.6 in 2016. Meanwhile, the estimated decline in the
OIC countries group was from 12.9 per 100,000 population in
2000 to 5.7 in 2016. Considering these rates, the global SMR
was almost two folds higher than that of the OIC countries group
in 2016. When examined in detail, death rates from suicides
ranged from 1.9 to 29.2 per 100,000 people in the OIC countries
group in 2016. Notably, the SMR in 6 OIC countries including
Guyana (29.2), Suriname (22.8), Kazakhstan (22.5), Cote
d’Ivoire (14.5), and Cameroon (12.2) were above the world
average. Furthermore, between 2000 and 2016, the SMR in 30
OIC countries decreased by 0.1 to 11.5 percentage points,
remained unchanged in 4 countries, and increased in 22 OIC
countries by 0.1 to 5.8 percentage points (Figure 15).
0 100 200 300 400 500 600 700
DjiboutiGabon
MozambiqueIndonesia
Cote d'IvoireCameroon
Guinea-BissauSierra Leone
SomaliaUganda
PakistanMauritaniaKyrgyzstan
GuineaBangladesh
NigeriaTajikistan
OICNiger
AfghanistanGambia
WorldKazakhstan
SenegalChad
SudanYemen
MoroccoTurkmenistan
BruneiUzbekistan
BeninAzerbaijan
MaliMalaysia
AlgeriaBurkina Faso
GuyanaMaldives
QatarTogo
IraqLibya
ComorosSyria
BahrainTurkeyKuwaitEgypt
TunisiaSuriname
AlbaniaIran
LebanonSaudi Arabia
OmanJordan
UAEPalestine
2000 2017

Towards the Achievement of Prioritised Sustainable Development Goals in OIC Countries: A Progress Report by SESRIC 16
Figure 14: Mortality Rate Attributed to Cardiovascular Disease, Cancer, Diabetes or Chronic Respiratory Disease (Probability), Ages 30-70, Both Sexes, 2000 vs. 2017
Source: SESRIC staff calculations based on data extracted between 16/05-13/06/2019 from United Nations Statistics Division (UNSD), Global SDG Indicators Database. Please see Appendix 1 for exceptions and details.
Figure 15: Suicide Mortality Rate, Both Sexes, Deaths per 100,000 Population, 2000 vs. 2016,
Source: SESRIC staff calculations based on data extracted between 16/05-13/06/2019 from United Nations Statistics Division (UNSD), Global SDG Indicators Database. Please see Appendix 1 for exceptions and details.
0 5 10 15 20 25 30 35 40
KazakhstanSierra LeoneAfghanistan
TurkmenistanYemen
GuyanaKyrgyzstan
SudanUzbekistanAzerbaijanSuriname
MaliTajikistan
MozambiqueMaldivesPakistan
IndonesiaCote d'Ivoire
ComorosUgandaNigeria
EgyptOIC
TogoCameroon
MoroccoChad
IraqSomalia
IranJordan
BahrainGuinea-Bissau
OmanGambia
LibyaSyria
Burkina FasoGuinea
WorldTurkeyKuwait
DjiboutiUAE
BangladeshSenegalLebanon
AlgeriaBrunei
MalaysiaNigerBenin
AlbaniaTunisia
Saudi ArabiaQatar
MauritaniaGabon
2000 20160 5 10 15 20 25 30 35 40
KazakhstanSuriname
GuyanaCameroon
WorldKyrgyzstan
UgandaSierra Leone
IranNigeria
TogoCote d'Ivoire
BeninTurkmenistanMozambiqueBurkina Faso
ChadSudan
SenegalUzbekistan
TurkeyMorocco
YemenGabon
BahrainBangladesh
GambiaOIC
GuineaDjibouti
AfghanistanAlbania
MaliMalaysia
LibyaComoros
Guinea-BissauSomalia
NigerMaldives
OmanAlgeria
IndonesiaTunisia
QatarMauritania
JordanPakistan
EgyptUAE
LebanonTajikistan
BruneiSaudi Arabia
IraqAzerbaijan
KuwaitSyria
2000 2016

Towards the Achievement of Prioritised Sustainable Development Goals in OIC Countries: A Progress Report by SESRIC 17
Annual consumption of pure alcohol slightly increased in the OIC countries group between 2000 and 2016
Harmful use of alcohol is defined according to the national context as alcohol per capita consumption (aged 15 years and older) within a calendar year in litres of pure alcohol (UNSD, SDG 3.5 metadata).
Alcohol consumption in the OIC countries group has increased from 2.4 litres to 2.48 litres per person per year between 2000 and 2016, respectively. The figure was still below the global average which increased from 5.74 litres to 6.38 litres per person per year over the same period. In 2016, the average annual consumption of pure alcohol in 8 OIC countries including Nigeria (13.38), Gabon (11.45), Uganda (9.46), Cameroon (8.89), Cote d'Ivoire (8.36), Burkina Faso (8.17), Kazakhstan (7.66), and Albania (7.47) surpassed the global average. In 48 OIC countries, the average annual consumption of pure alcohol ranged from 0.01 to 6.27 litres per person. Average annual consumption of pure alcohol in litres per person decreased in 24 OIC countries between 2000 and 2016. Oman and Azerbaijan witnessed significant decreases of 10.99 and 7.69 litres per person in the same period, respectively. Despite the decline, alcohol consumption in litres per person remained unchanged in Sudan and an increase from 0.1 to 2.03 litres of alcohol consumption per person was recorded in 31 OIC countries during the same period (Figure 16).
High death rate due to road traffic injuries still remain as an unsolved issue for the OIC countries group
The progress towards SDG target 3.6 to reduce the death rate due to road traffic injuries by 50% by 2020 remains far from sufficient among the OIC countries. In 2013, death rate due to road traffic injuries in 40 OIC countries ranged from 18.7 to 73.4 deaths per 100,000 population. Libya, Iran, Mozambique, Togo and Burkina Faso were the top 5 OIC countries with death rates due to road traffic injuries. These figures were also higher than that of the world in the same year. While death rate due to road traffic injuries declined in 37 OIC countries between 2000 and 2013, increases were recorded in 20 OIC countries.
The OIC countries group showed significant progress concerning access to sexual and reproductive health-care services for women between 2000 and 2018 “Proportion of women of reproductive age who have their need for family planning satisfied with modern methods” is defined as the percentage of women of reproductive age (15-49 years) who desire either to have no (additional) children or to postpone the next child and who are currently using a modern contraceptive method (UNSD, SDG 3.7 metadata). Between 2000 and 2018, the percentage of women of reproductive age who had access to modern contraceptive methods increased both globally and at the OIC level. However, progress made by the OIC countries group was more significant than that of the world. The OIC countries group average increased 6.2 percentage points from 52.7% in 2000 to 59% in 2018. The world average, on the other hand, increased 2.2 percentage point from 73.5% in 2000 to 75.7% in 2018. At OIC country level, the percentage of women of reproductive age who had access to modern contraceptive methods in 27 OIC countries have increased whereas there was decrease in 13 OIC countries between 2000 and 2018 (Figure 17).
Figure 16: Alcohol Consumption per capita within a Calendar Year, Ages 15+, 2000 vs. 2016
Source: SESRIC staff calculations based on data extracted between 16/05-13/06/2019 from United Nations Statistics Division (UNSD), Global SDG Indicators Database. Please see Appendix 1 for exceptions and details.
0 3 6 9 12 15
NigeriaUganda
OmanGabon
GuyanaAzerbaijan
Sierra LeoneBurkina Faso
KyrgyzstanKazakhstan
Cote d'IvoireCameroon
AlbaniaUzbekistan
SurinameWorld
TurkmenistanChad
Guinea-BissauGambia
LebanonUAE
MozambiqueTajikistan
OICBenin
TurkeyBahrain
MalaysiaTogo
TunisiaMaldives
DjiboutiSenegalMorocco
MaliSyriaQatar
YemenGuinea
IndonesiaAlgeriaSudan
IraqJordanBrunei
BangladeshNigerEgypt
MauritaniaComoros
Saudi ArabiaIran
PakistanLibya
KuwaitAfghanistan
Somalia
2000 2016

Towards the Achievement of Prioritised Sustainable Development Goals in OIC Countries: A Progress Report by SESRIC 18
Figure 17: Women of Reproductive Age who have their Need for Family Planning Satisfied with Modern Methods, Ages 15-49. 2000 vs. 2018
Source: SESRIC staff calculations based on data extracted between 16/05-13/06/2019 from United Nations Statistics Division (UNSD), Global SDG Indicators Database. Please see Appendix 1 for exceptions and details.
Number of medical doctors per 10,000 population in most OIC countries has increased
The density of medical doctors is defined as the number of medical doctors, including generalists and specialist medical practitioners per 10,000 population in the given national and/or subnational area. (UNSD, SDG 3.c metadata).
In 2018, the density of medical doctors in 17 OIC countries was over 15 per 10,000 population, while 39 OIC countries were below 15 per 10,000 population in the same year. However, between 2000 and 2018, the density of medical doctors increased in 38 OIC countries with Saudi Arabia and Kuwait being the noticeable countries with higher densities of medical doctors. On the other hand, densities decreased in 18 OUC countries during the period under consideration (Figure 18, Figure 19).
As per SDG target 3.d, International Health Regulations (IHR) capacity and health emergency preparedness address health system issues, mostly focusing on strengthening health systems in least developed and developing countries. Regarding the 13 IHR, more than 30 OIC countries have achieved an average rating of 50% and above for all capacities related with implementation of the regulations in 2017. Nevertheless, some OIC countries have not achieved 50% in the same year.
0 10 20 30 40 50 60 70 80 90
KazakhstanEgypt
IndonesiaAlgeriaWorld
MoroccoTunisia
TurkmenistanPalestine
Guinea-BissauKyrgyzstan
BangladeshGuyana
IraqJordanTurkey
OICMozambique
TajikistanYemen
NigerUganda
CameroonPakistan
Cote d'IvoireNigeria
LibyaGambiaGabon
TogoBurkina Faso
SenegalGuinea
Sierra LeoneMali
OmanAzerbaijan
BeninAlbania
MauritaniaChad
Sudan
2000 2018

Towards the Achievement of Prioritised Sustainable Development Goals in OIC Countries: A Progress Report by SESRIC 19
Figure 18: Medical Doctors per 10,000 Population, 2000
Source: SESRIC staff using the Tableau Public Software and based on the data extracted between 16/05-13/06/2019 from United Nations Statistics Division (UNSD), Global SDG Indicators Database
Figure 19: Medical Doctors per 10,000 Population, 2018
Source: SESRIC staff using the Tableau Public Software and based on the data extracted between 16/05-13/06/2019 from United Nations Statistics Division (UNSD), Global SDG Indicators Database

Towards the Achievement of Prioritised Sustainable Development Goals in OIC Countries: A Progress Report by SESRIC 20
SDG 4: Ensure Inclusive and Equitable Quality Education and Promote Lifelong Learning Opportunities for AllEducation is a primary driver that can lead to improved life and wellbeing of the people. New developments in the education sector today can allow providing quality education to the most disadvantaged people, provide technical and practical knowledge with the most cost-effective methods, exchange of know-how and building technical capacities through means such as vocational educational training, online education programs, capacity building and technical cooperation projects and others.
Despite these advances in the education sector, there is wide discrepancy between OIC countries as well as among genders and other groups within the OIC countries. Although some achievements were recorded in student participation and progress across the different levels of education, some OIC countries have challenges concerning enrolment at schools, progression from grade to grade, and sufficiency of teachers per student. Under these circumstances, many OIC countries are expected to miss the SDG 4 targets by 2030.
In this connection, there is a need for concerted actions involving the OIC countries, donors, and international organisations in promoting quality education opportunities for everyone in the OIC countries.
Participation in pre-primary education is increasing in the majority of OIC countries; still concerns exist for the access to education for all children by 2030
Some OIC countries have faced challenges in meeting the most fundamental education targets such as ensuring enrolment and participation of children at school, particularly female and other vulnerable groups of population, increasing literacy rate, providing access to basic study materials, and sufficient number of teachers per student.
Participation rate in organised learning shows the proportion of children in a given age group enrolled in at least one organised learning program that includes both education and care. The primary target is not to have all children participating in pre-primary organised learning programs but to provide an access to such education to all children (UNSD, SDG 4.2 metadata).
In the OIC countries group, the average participation rate in organised learning one year before the official primary entry age was around 58.6% based on 2018 or most recent year available data. Figure 20 shows how the OIC countries as a group and at the individual country level lag behind the target level.
The progress demonstrated by several OIC countries, during the period from 2000 and 2018, allows to project them being as on track to achieve the target by 2030. The highest annual progress rate has been demonstrated by Algeria, Iraq, and Bangladesh at 33.3%, 16.4% and 16.4%, respectively.
Overall, 13 OIC countries out of 35 with sufficient data, namely; Algeria, Bangladesh, Iraq, Benin, Kyrgyzstan, Azerbaijan, Qatar, Albania, Oman, Guinea, Maldives, Malaysia, and UAE are on track to achieve the 100% participation rates. Additionally, Suriname, Bahrain, Lebanon, Brunei and Guyana are expected to have above 90% of the children to be enrolled in pre-primary education.
Figure 20: Participation Rate in Organized Learning (One Year Before the Official Primary Entry Age), Both Sexes, Percent, 2000 vs. 2017
Source: SESRIC staff calculations based on data extracted between 16/05-13/06/2019 from United Nations Statistics Division (UNSD), Global SDG Indicators Database. * Please see Appendix 1 for exceptions and details.
0 10 20 30 40 50 60 70 80 90 100
Lebanon
Brunei
Guyana
Kuwait
Suriname
Malaysia
UAE
Maldives
Benin
Morocco
World
Oman
Bahrain
Palestine
Albania
Syria
Mali
Qatar
OIC
Cote d'Ivoire
Kyrgyzstan
Cameroon
Sierra Leone
Uzbekistan
Togo
Bangladesh
Iran
Burkina Faso
Azerbaijan
Guinea
Egypt
Senegal
Algeria
Tajikistan
Iraq
Niger
Djibouti
2000* 2018*

Towards the Achievement of Prioritised Sustainable Development Goals in OIC Countries: A Progress Report by SESRIC 21
Total official scholarships influx to OIC countries more than doubled between 2006 and 2016
Total ODA in the form of scholarships to the OIC countries has increased from 126.6 million USD in 2006 to 177.1 million USD (constant 2016) in 2016. However, the share of the scholarships to OIC countries in the total global scholarships has decreased from 30.6% to 22.5% in the same period.
These scholarships are allocated for individual students towards pursuing the studies in higher education programmes that may include vocational training, technical, engineering, and ICTs, as well as other academic programmes (UNSD, SDG 4.b metadata). SDG target 4.b calls for substantial increase of scholarships to developing countries by 2020, particularly those in Africa. The scholarships are considered as ODA as they largely come in the form of grants for the purpose of development and economic growth of the beneficiary countries.
Scholarships to 46 beneficiary OIC countries have demonstrated an upwards trend while scholarships to 4 OIC countries, namely; Malaysia, Palestine, Niger, and Guinea-Bissau have decreased over the period considered.
10 OIC countries, namely; Indonesia, Morocco, Turkey, Algeria, Syria, Egypt, Tunisia, Pakistan, Bangladesh, and Cameroon
received around 64% of the scholarships allocated to the OIC in 2016 (Figure 21). The highest increase in the allocation of scholarships during the period in consideration has been observed in Turkmenistan and followed by Tajikistan, Suriname, Yemen, and Cote d'Ivoire.
There is an increasing need for qualified teachers in the OIC countries
Qualified specialists, professionals and overall human resources pool play a critical role in the development and prosperity of any country. Lacking to provide adequate education for youth hinders the future economic growth of any country. In this regard, adequately trained teachers are considered important for the long-term progress of a country.
On the one hand, proportions of primary level teachers who received organised teacher training have increased in 33 OIC countries out of 45 with available data during the period from 2000 to 2018. In 16 of these countries including Algeria, Cote d'Ivoire, Djibouti, Gabon, Gambia, Iran, Iraq, Jordan, Kazakhstan, Morocco, Oman, Palestine, Saudi Arabia, Tajikistan, Tunisia, and UAE, 100% of the teachers have received the organised teacher trainings (Figure 22).
Figure 21: Total Official Flows for Scholarships, by Recipient Countries, Millions of Constant 2016 USD, 2000-2016
Source: SESRIC staff calculations based on data extracted between 16/05-13/06/2019 from United Nations Statistics Division (UNSD), Global SDG Indicators Database. Please see Appendix 1 for exceptions and details.

Towards the Achievement of Prioritised Sustainable Development Goals in OIC Countries: A Progress Report by SESRIC 22
Based on the progress demonstrated between 2000 and 2018, it is estimated that by 2030, all teachers in primary education in 4 more OIC countries (Kyrgyzstan, Mozambique, Maldives, and Guyana), will receive at least minimum training required to teach at this level.
On the other hand, the proportion of teachers in primary education that received minimum required training have decreased in 12 OIC
countries between 2000 and 2017. Among these countries with decrease, 5 countries, namely; Uzbekistan, Azerbaijan, Suriname, Mauritania, and Kuwait used to have 100% of their teachers in primary education received minimum qualification training but these figures decreased to 98.9%, 98.0%, 98.4%, 84.8%, and 78.9%, respectively, over the period under consideration (Figure 22).
Figure 22: Proportion of Teachers in Primary Education who have Received at least Minimum Organized Teacher Training, 2000 vs. 2017
o/o 2000 ●/● 2017
Source: SESRIC staff calculations based on data extracted between 16/05-13/06/2019 from United Nations Statistics Division (UNSD), Global SDG Indicators Database. Please see Appendix 1 for exceptions and details.
Majority of the OIC countries have achieved gender parity in pre-primary organised learning
Gender parity index value with “1” indicates a parity between the groups, female and male. In other words, participation of children from both groups in organised learning as a proportion of total children in that age group is equal.
SDG target 4.5 envisions to eliminate the disparities and to provide equal access to the education and vocational training to all by 2030, particularly for the vulnerable including the persons with disabilities, indigenous people, and female among others. (UNSD, SDG 4.5 metadata)
Most OIC countries have achieved the parity between the genders in organised learning among the age group one year before the
official primary education. 19 OIC countries achieved gender parity in pre-primary education in 2018 or latest available year with data (Figure 24). Additional 14 OIC countries are estimated to achieve the gender parity by 2030.
On the other hand, gender parity was slightly below 0.9 in 2 OIC countries including Morocco, Tajikistan, and Yemen. However, Morocco is anticipated to achieve the parity by 2030 or earlier (Figure 23 and Figure 24).
The gender parity index values show fluctuations but are generally found within the optimal range. However, if the fluctuation with downwards trend will continue with the same rate, 8 OIC countries will be under the risk of not having gender parity in pre-primary education by 2030.
30
35
40
45
50
55
60
65
70
75
80
85
90
95
100
Gui
nea-
Bis
sau
Mal
iS
ierr
a Le
one
Sud
anB
enin
Guy
ana
Sen
egal
Gui
nea
Cam
eroo
nP
akis
tan
Bah
rain
Bru
nei
Bur
kina
Fas
oM
aldi
ves
Kyr
gyzs
tan
Moz
ambi
que
Mal
aysi
aU
AE
Gam
bia
Djib
outi
30
35
40
45
50
55
60
65
70
75
80
85
90
95
100
Qat
ar
Ban
glad
esh
Com
oros
Cha
d
Nig
er
Nig
eria
Togo
Kuw
ait
Mau
ritan
ia
Aze
rbai
jan
Sur
inam
e
Uzb
ekis
tan
Countries with increase in the Proportions of Trained Teachers
Countries with decrease in the Proportions of Trained Teachers

Towards the Achievement of Prioritised Sustainable Development Goals in OIC Countries: A Progress Report by SESRIC 23
Figure 23: Gender Parity Index for Participation Rate in Organized Learning (One Year Before the Official Primary Entry Age), 2000
Source: SESRIC staff using the Tableau Public Software and based on the data extracted between 16/05-13/06/2019 from United Nations Statistics Division (UNSD), Global SDG Indicators Database
Figure 24: Gender Parity Index for Participation Rate in Organized Learning (One Year Before the Official Primary Entry Age), 2018
Source: SESRIC staff using the Tableau Public Software and based on the data extracted between 16/05-13/06/2019 from United Nations Statistics Division (UNSD), Global SDG Indicators Database

Towards the Achievement of Prioritised Sustainable Development Goals in OIC Countries: A Progress Report by SESRIC 24
SDG 5. Achieve Gender Equality and Empower All Women and GirlsGender equality is still a bottleneck for emancipation of women and girls despite it being a widely discussed topic in public sphere and the decline in other forms of discrimination in the last two decades. SDG 5 echoes all the efforts put in place to eliminate all socio-economic and political imbalances between women and men. The existence of gender inequality has continued to stagnate social progress of women and girls who represent half of the world’s population.
Many societal discriminations have led lack of proper education levels attained by women and girls which translate into lack of access to skills and limited opportunities in the labour market. Development of human capital - especially for women and girls through girl-child education - provides a primary means to enable women and girls to develop to their fullest potential as responsible citizens not only in the OIC countries but also all over the world. In this sense, education is vital to ensuring a brighter future and better quality of life in our societies. Getting rid of all sorts of discrimination against women and girls will enable them to assume a more active role in social, economic and political decision-making.
More equitable representation of women is required in the parliaments of OIC countries to accurately reflect the composition and diverse interests of women in the society
Globally, the proportion of seats held by women in national parliaments as percentage of total number of seats has increased from 13.3% in 2000 to 23.4% in 2018. As a positive note, the proportion of seats held by women in national parliaments as percentage of total number of seats in the OIC countries group increased from 8.4% to 19.1% over the same period; however, this figure was below that of the world.
In 2018, the proportion of seats held by women in national parliaments as percentage of total number of seats in 15 OIC countries was above 25%. These countries include Senegal (41.8%), Mozambique (39.6%), Uganda (34.3%), Guyana (31.9%), Tunisia (31.3%) Cameroon (31.1%), Sudan (30.5%) Albania (27.9%), Afghanistan (27.7%), Kazakhstan (27.1%), Turkmenistan (25.8%), Algeria (25.8%), Suriname (25.5%), Iraq (25.3%), and Mauritania (25.2%).
Furthermore, 48 OIC countries managed to increase their proportions of seats held by women in national parliaments as percentage of total number of seats between 2000 and 2018 within the range of 1 percentage point and 29.7 percentage points. In contrary, 6 OIC countries including Maldives, Turkmenistan, Yemen, Pakistan, Oman and Mali witnessed decreases ranging between -0.1 and -3.4 percentage points in the same indicator over the same period.
The results of all the efforts put in place through the international community to rectify the under-representation of women in parliaments by ensuring gender equality from the period of MDGs to SDGs can clearly be seen with these increments recorded in the proportion of seats held by women in national parliaments of the OIC countries. In overall, the number of women parliamentarians in the OIC countries has increased at significantly higher rates between 2000 and 2018. This shows that the OIC countries in general are making a good progress towards reaching equality between men and women in positions of power and decision-making (Figure 25).
Figure 25: Proportion of Seats Held by Women in National Parliaments, Percent, 2000 vs. 2018
Source: SESRIC staff calculations based on data extracted between 16/05-13/06/2019 from United Nations Statistics Division (UNSD), Global SDG Indicators Database. Please see Appendix 1 for exceptions and details.
0 5 10 15 20 25 30 35 40 45 50
MozambiqueAfghanistan
TurkmenistanPakistanGuyanaUganda
SurinameEgyptWorld
MaliSenegalTunisia
AzerbaijanSyria
KazakhstanBangladesh
BruneiGuineaSudan
Sierra LeoneCote d'Ivoire
OICGabon
Burkina FasoSomalia
IndonesiaGuinea-Bissau
MalaysiaUzbekistan
IraqBenin
MaldivesCameroon
AlbaniaTogo
IranLibya
TurkeyMauritania
NigeriaAlgeria
ComorosTajikistan
OmanChad
LebanonGambia
KyrgyzstanNiger
YemenMorocco
UAESaudi Arabia
JordanDjibouti
QatarBahrainKuwait
2000 2018

Towards the Achievement of Prioritised Sustainable Development Goals in OIC Countries: A Progress Report by SESRIC 25
SDG 8: Promote Sustained, Inclusive and Sustainable Economic Growth, Full and Productive Employment and Decent Work for AllSDG 8 recognises the importance of sustained inclusive economic growth, which can lead to new and better employment opportunities while not harming the environment. It calls job opportunities and decent working conditions that should be provided to the whole working age population. Moreover, rapid economic growth can especially help the OIC countries close the economic development gap with developed countries.
Increased economic growth is needed to meet the 7% GDP growth per annum target in the OIC-LDCs
Annual growth rate of real GDP per capita is calculated as the percentage change in the real GDP per capita between two consecutive years. The data for real GDP are measured in constant USD to facilitate both the calculation of country growth rates and producing regional and global aggregates data. The real GDP per capita is a proxy for the average standard of living of residents in a country or area. A positive percentage change in this indicator can be interpreted as an increase in the average standard of living of the residents in a country or area (UNSD, SDG 8.1 metadata).
In the period 2000-2017, the average annual growth rate of real GDP per capita was 2.7% for both the entire OIC countries group and OIC-LDCs group with 21 countries.
Although the rate was slightly over that of the world (1.7%), it was less than half the target rate of 7% a year. Indeed, Figure 26 clearly indicates that the annual growth rate of OIC-LDCs group ranged between 2% and 4% for almost all years from 2000 to 2017. Therefore, OIC-LDCs cannot achieve the target of 7% GDP growth per annum unless their development pace accelerates notably. This suggests that much work remains to achieve the goal of sustained economic growth, in particular for the OIC-LDCs. In those countries, promoting economic diversification is very important as well as not just protecting countries from unexpected global and national economic crises but also ensuring long-term sustainability and more inclusive growth.
At the individual OIC country level, only Azerbaijan reached the average annual growth rate of real GDP per capita over 7% with 8.2% for the period 2000-2017. On the other hand, the real GDP per capita of Azerbaijan decreased from 2015 to 2017 (Figure 26). Beside Azerbaijan, 6 other OIC countries including Turkmenistan, Kazakhstan, Uzbekistan, Tajikistan, Afghanistan, and Mali were observed to have the average annual growth rate of real GDP per capita over 5% from 2000 to 2017. In the same time interval, the average annual growth rate of real GDP per capita was negative for 9 OIC countries, namely Yemen, Syria, UAE, Gabon, Brunei, Oman, Kuwait, Somalia, and Bahrain (Figure 26).
Figure 26: Annual Growth Rate of Real GDP per capita, Percent, 2000-2017
Source: SESRIC staff calculations based on data extracted between 16/05-13/06/2019 from United Nations Statistics Division (UNSD), Global SDG Indicators Database. Please see Appendix 1 for exceptions and details.

Towards the Achievement of Prioritised Sustainable Development Goals in OIC Countries: A Progress Report by SESRIC 26
Labour productivity in OIC countries, despite improvements, shows wide disparities
Annual growth rate of real GDP per employed person conveys the annual percentage change in real GDP per employed person. The growth rate of real GDP per employed person is a measure of labour productivity growth; thus, providing information on the evolution, efficiency, and quality of human capital in the production process. Economic growth in a country can be achieved either by increasing employment or by total factor productivity through more effective work by those who are employed. This indicator casts light on the productivity effect, being therefore a key measure of economic performance. Labour productivity (and growth) estimates can support the formulation of labour market policies and monitor their effects for policy makers. They can also contribute to the understanding of how labour market performance affects employed persons’ living standards (UNSD, SDG 8.2 metadata).
Growth in labour productivity — measured by GDP per employed person — was estimated as 2.7% for the OIC countries group in the period 2000-2018, which was slightly over that of the world (1.6%). However, the average labour productivity growth rate for
the OIC countries group slowed after the financial crisis of 2008-2009. The average rate was 2.2% between 2009 and 2018, compared to 3.2% between 2000 and 2008. Indeed, the annual growth rate ranged between 1% and 3% for the last 10 years, from 2009 to 2018 (Figure 27). Growth in labour productivity drives sustainable increases in earnings and living standards. The slowdown of productivity growth, therefore, represents a negative development for the OIC countries group to achieve higher levels of development.
The OIC countries group showed considerable variation in the growth of labour productivity, which was over 5%, on average, for only 3 Central Asia countries, namely; Azerbaijan, Turkmenistan, and Kazakhstan from 2000 to 2018. 21 OIC countries were observed to have an average labour productivity growth between 2% and 5%, 20 OIC countries were observed to have that rate between 0% and 2% in the same time period. However, 12 OIC countries, including Yemen, Oman, Gabon, Bahrain, Syria, Kuwait, Saudi Arabia, Qatar, Brunei, Lebanon, Comoros, and Gambia showed negative average labour productivity growth for the period 2000-2018 (Figure 27).
Figure 27: Annual Growth Rate of Real GDP per Employed Person, Percent, 2000-2018
Source: SESRIC staff calculations based on data extracted between 16/05-13/06/2019 from United Nations Statistics Division (UNSD), Global SDG Indicators Database. Please see Appendix 1 for exceptions and details.
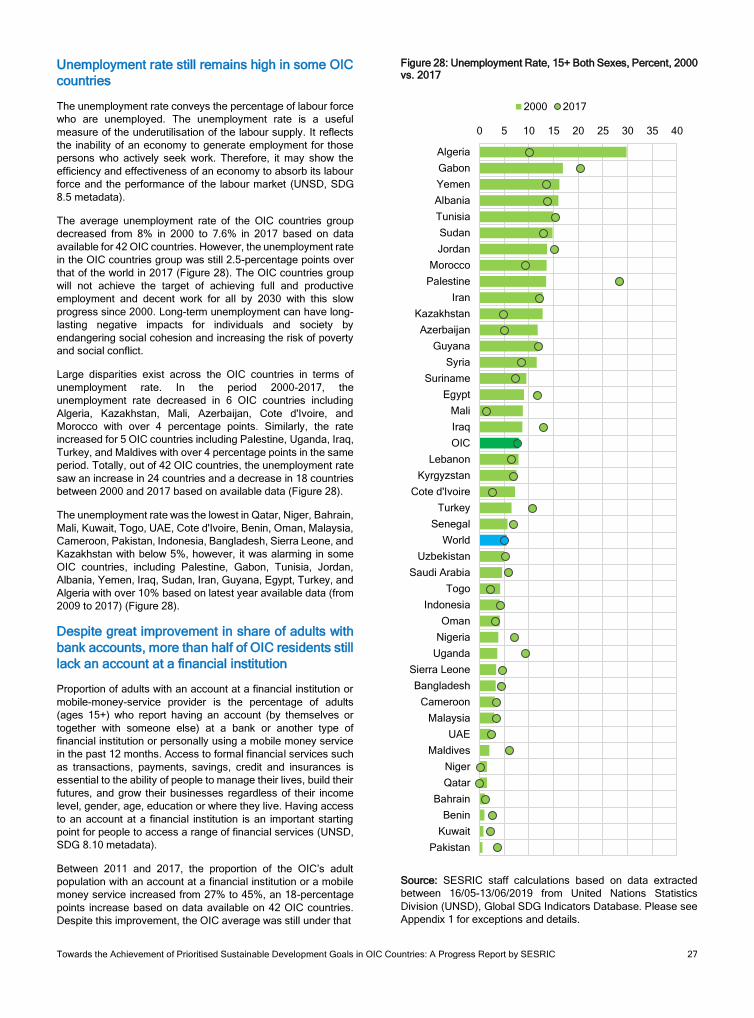
Towards the Achievement of Prioritised Sustainable Development Goals in OIC Countries: A Progress Report by SESRIC 27
Unemployment rate still remains high in some OIC countries
The unemployment rate conveys the percentage of labour force who are unemployed. The unemployment rate is a useful measure of the underutilisation of the labour supply. It reflects the inability of an economy to generate employment for those persons who actively seek work. Therefore, it may show the efficiency and effectiveness of an economy to absorb its labour force and the performance of the labour market (UNSD, SDG 8.5 metadata).
The average unemployment rate of the OIC countries group decreased from 8% in 2000 to 7.6% in 2017 based on data available for 42 OIC countries. However, the unemployment rate in the OIC countries group was still 2.5-percentage points over that of the world in 2017 (Figure 28). The OIC countries group will not achieve the target of achieving full and productive employment and decent work for all by 2030 with this slow progress since 2000. Long-term unemployment can have long-lasting negative impacts for individuals and society by endangering social cohesion and increasing the risk of poverty and social conflict.
Large disparities exist across the OIC countries in terms of unemployment rate. In the period 2000-2017, the unemployment rate decreased in 6 OIC countries including Algeria, Kazakhstan, Mali, Azerbaijan, Cote d'Ivoire, and Morocco with over 4 percentage points. Similarly, the rate increased for 5 OIC countries including Palestine, Uganda, Iraq, Turkey, and Maldives with over 4 percentage points in the same period. Totally, out of 42 OIC countries, the unemployment rate saw an increase in 24 countries and a decrease in 18 countries between 2000 and 2017 based on available data (Figure 28).
The unemployment rate was the lowest in Qatar, Niger, Bahrain, Mali, Kuwait, Togo, UAE, Cote d'Ivoire, Benin, Oman, Malaysia, Cameroon, Pakistan, Indonesia, Bangladesh, Sierra Leone, and Kazakhstan with below 5%, however, it was alarming in some OIC countries, including Palestine, Gabon, Tunisia, Jordan, Albania, Yemen, Iraq, Sudan, Iran, Guyana, Egypt, Turkey, and Algeria with over 10% based on latest year available data (from 2009 to 2017) (Figure 28).
Despite great improvement in share of adults with bank accounts, more than half of OIC residents still lack an account at a financial institution
Proportion of adults with an account at a financial institution or mobile-money-service provider is the percentage of adults (ages 15+) who report having an account (by themselves or together with someone else) at a bank or another type of financial institution or personally using a mobile money service in the past 12 months. Access to formal financial services such as transactions, payments, savings, credit and insurances is essential to the ability of people to manage their lives, build their futures, and grow their businesses regardless of their income level, gender, age, education or where they live. Having access to an account at a financial institution is an important starting point for people to access a range of financial services (UNSD, SDG 8.10 metadata).
Between 2011 and 2017, the proportion of the OIC’s adult
population with an account at a financial institution or a mobile money service increased from 27% to 45%, an 18-percentage points increase based on data available on 42 OIC countries. Despite this improvement, the OIC average was still under that
Figure 28: Unemployment Rate, 15+ Both Sexes, Percent, 2000 vs. 2017
Source: SESRIC staff calculations based on data extracted between 16/05-13/06/2019 from United Nations Statistics Division (UNSD), Global SDG Indicators Database. Please see Appendix 1 for exceptions and details.
0 5 10 15 20 25 30 35 40
AlgeriaGabonYemenAlbaniaTunisiaSudanJordan
MoroccoPalestine
IranKazakhstanAzerbaijan
GuyanaSyria
SurinameEgypt
MaliIraqOIC
LebanonKyrgyzstan
Cote d'IvoireTurkey
SenegalWorld
UzbekistanSaudi Arabia
TogoIndonesia
OmanNigeria
UgandaSierra LeoneBangladesh
CameroonMalaysia
UAEMaldives
NigerQatar
BahrainBenin
KuwaitPakistan
2000 2017

Towards the Achievement of Prioritised Sustainable Development Goals in OIC Countries: A Progress Report by SESRIC 28
of the world, which increased from 55% to 72% in the same period (Figure 29).
The OIC countries group has made the greatest progress towards expanding access to banking, insurance and financial services for all. Out of 42 OIC countries, 29 countries are on-track to meet the target rate of 100% by 2030 based on the pace of progress since 2011. However, the progress for 8 OIC countries is not enough to achieve this target with their available trends. These countries need to fast-track progress. From 2011 to 2017, 1 country experienced a regression, but 4 countries do not have sufficient trend data to calculate their trend estimates.
The performance of OIC countries concerning having an account at a financial institution has been quite heterogeneous. The strong performing 7 OIC countries were Tajikistan, Turkmenistan, Gabon, Uganda, Senegal, Kyrgyzstan, and Togo with over 35-percentage points increase in the period 2011-2017. On the other hand, 10 OIC countries, including Algeria, Tunisia, Sudan, Lebanon, Cote d'Ivoire, Afghanistan, Palestine, Sierra Leone, Mauritania, and Yemen increased their share of adults with bank accounts under 10-percentage points (Figure 29).
The highest proportion of adults with an account at a financial institution or mobile-money-service provider were recorded in Iran, UAE, Malaysia, and Bahrain with over 80% in 2017. 7 out 42 OIC countries were also observed to have that proportion between 50% and 80%. In contrast, in 2017, the proportion of account holders was below 20% in 5 OIC countries, including Sierra Leone, Niger, Sudan, Afghanistan, and Yemen (Figure 29).
While per capita consumption of natural resources increases in most OIC countries, their consumption levels are still under that of the world
Domestic material consumption (DMC) presents the amount of material that needs to be handled within an economy, which is either added to material stocks of buildings and transport infrastructure or used to fuel the economy as material throughput, and therefore, DMC describes the physical dimension of economic processes and interactions. Per-capita DMC describes the average level of material use in production processes within an economy – an environmental pressure indicator (UNSD, SDG 8.4 metadata). Using natural resources more efficiently may reduce the pressure from production and increases the competitiveness of the economy.
While per capita DMC increased from 5.5 metric tons per capita in 2000 to 7.4 metric tons per capita in 2017, it remained below that of the world in terms of level and percentage increase of per capita DMC. During the same time period, the world average rose from 8.6 metric tons per capita to 11.7 metric tons per capita (Figure 30).
DMC per capita increased in majority of the OIC countries over this period while UAE, Jordan, Guinea, Somalia, Uganda, Afghanistan, Malaysia, Cote d'Ivoire, and Senegal saw decreases. The highest increases were recorded in Qatar, Oman, Kazakhstan, and Saudi Arabia with over 10 metric tons per capita from 2000 to 2017 (Figure 30).
There is also a wide range across the OIC countries in the per capital level of DMC. While 17 OIC economies were observed to use more than 10 metric tons per capita in 2017, 21 OIC economies were observed to use fewer than 5 metric tons per capita (Figure 30).
Figure 29: Proportion of Adults with an Account at a Financial Institution or Mobile-Money-Service Provider, 15+ Both Sexes, Percent, 2000 vs. 2017
Source: SESRIC staff calculations based on data extracted between 16/05-13/06/2019 from United Nations Statistics Division (UNSD), Global SDG Indicators Database. Please see Appendix 1 for exceptions and details. The red line in the graph shows the target rate of 100% by 2030.
0 10 20 30 40 50 60 70 80 90 100
KuwaitIran
MalaysiaBahrain
UAETurkeyWorld
Saudi ArabiaKazakhstan
LebanonCote d'Ivoire
AlgeriaBangladesh
NigeriaAlbaniaTunisia
OICJordan
UzbekistanUganda
IndonesiaPalestine
GabonMauritania
Sierra LeoneAzerbaijanCameroon
Burkina FasoIraq
BeninPakistan
TogoEgypt
AfghanistanChad
MaliSudan
SenegalKyrgyzstan
GuineaYemen
TajikistanNiger
Turkmenistan
2011 2017

Towards the Achievement of Prioritised Sustainable Development Goals in OIC Countries: A Progress Report by SESRIC 29
Figure 30: Domestic Material Consumption per capita, All Raw Materials, Tonnes, 2000 vs. 2017
Source: SESRIC staff calculations based on data extracted between 16/05-13/06/2019 from United Nations Statistics Division (UNSD), Global SDG Indicators Database. Please see Appendix 1 for exceptions and details.
0 5 10 15 20 25 30 35 40 45 50
QatarBahrainKuwait
UAEGuyana
BruneiMalaysia
KazakhstanOman
Saudi ArabiaSuriname
IranTurkey
LibyaTurkmenistan
LebanonJordanWorld
UzbekistanTunisia
SyriaKyrgyzstan
EgyptAlbania
MauritaniaOIC
IndonesiaIraq
GabonGuineaAlgeria
MoroccoMaldives
BeninSudan
MaliPakistan
AzerbaijanSomaliaSenegal
NigerUganda
CameroonTogo
NigeriaCote d'Ivoire
Guinea-BissauBurkina Faso
ChadAfghanistan
MozambiqueComoros
YemenGambia
BangladeshDjibouti
Sierra LeoneTajikistan
2000 2017

Towards the Achievement of Prioritised Sustainable Development Goals in OIC Countries: A Progress Report by SESRIC 30
SDG 9: Build Resilient Infrastructure, Promote Inclusive and Sustainable Industrialization and Foster InnovationInvestments in physical infrastructure – transport, irrigation, energy, and information and communication technology – are crucial to achieving sustainable and inclusive development. Empirical studies indicate that investment in infrastructure has a strong relationship with growth in productivity and incomes, and improvements in health and education outcomes.
Technological progress plays a crucial role in improving labour productivity, which in turn leads to sustained long-term economic growth. Technological advance also increases resource and energy-efficiency that is very critical in achieving environmental objectives. Without technology and innovation, sustainable industrialisation will not be achieved.
In this regard, SDG 9 calls for building resilient and sustainable infrastructure, promoting inclusive and sustainable industrialisation, and fostering research and innovation.
Significant investment is needed in OIC countries to boost technological progress and economic growth
Manufacturing value added (MVA) as a proportion of gross domestic product (GDP) is a ratio of MVA to GDP, in constant 2010 USD. Researchers and policy makers widely use MVA to assess the level of industrialisation of a country. The share of MVA in GDP reflects a country’s national development in
general as manufacturing is one of the principal engines of economic development (UNSD, SDG 9.2 metadata).
In the period 2000-2018, MVA as a proportion of GDP increased just 1.1 percentage-point in the OIC countries group from 13% to 14.1%. The world average also increased 1.1 percentage-point from 15.3% in 2000 to 16.5% in 2018. Due to this slow progress, none of the 21 OIC-LDCs are able to achieve the target of doubling industry’s share in GDP by 2030 with the pace of progress so far. Indeed, in 18 years since 2000, while the MVA share in GDP increased only in 5 OIC-LDCs, it declined in 16 OIC-LDCs. Moreover, out of 5 OIC-LDCs, only Bangladesh and Togo could increase their share by more than 1 percentage-point from 2000 to 2018 (Figure 31). Therefore, significant investment is needed in the OIC-LDCs to boost technological progress and economic growth.
As to the OIC countries group, the MVA share in GDP have seen an increase in 19 OIC countries between 2000 and 2018. Among these countries, Bangladesh, Oman, Turkmenistan, Saudi Arabia, Iran, and Pakistan increased their share by more than 3 percentage-points. At the individual country level, in 2018, the ratio of MVA to GDP was over 20% in only 4 OIC countries including Turkmenistan, Malaysia, Indonesia, and Bangladesh. The ratio was observed between 10% and 20% in 22 OIC countries, and it was less than 10% in the remaining 31 OIC countries in 2018 (Figure 31).
Figure 31: Manufacturing Value Added as a Proportion of GDP, Percent, 2000 vs. 2018
Source: SESRIC staff calculations based on data extracted between 16/05-13/06/2019 from United Nations Statistics Division (UNSD), Global SDG Indicators Database. Please see Appendix 1 for exceptions and details.
0 5 10 15 20 25 30 35 40
TurkmenistanTajikistanMalaysia
UzbekistanIndonesia
KyrgyzstanBenin
SurinameTunisiaBrunei
AfghanistanMorocco
EgyptWorld
CameroonMali
TurkeyCote d'Ivoire
SenegalBangladesh
JordanOIC
KazakhstanGuinea-Bissau
GuineaBahrain
MauritaniaPalestine
GuyanaQatar
UgandaMozambiqueBurkina Faso
SudanPakistan
AzerbaijanIran
UAELebanon
YemenSaudi Arabia
ChadTogoLibya
NigeriaNiger
KuwaitGambia
ComorosOman
AlbaniaAlgeria
IraqDjiboutiGabon
MaldivesSierra Leone
SomaliaSyria
2000 2018

Towards the Achievement of Prioritised Sustainable Development Goals in OIC Countries: A Progress Report by SESRIC 31
Although expenditures on research and development have grown across the OIC countries in general, all OIC countries lag behind the World average
Research and development (R&D) expenditure as a proportion of GDP is the amount of R&D expenditure divided by the total output of the economy. The indicator is a direct measure of R&D spending referred to in SDG target 9.5. R&D expenditure is a key enabling factor for sustainable and inclusive growth as it is a vital contributor to human capital development by creating knowledge and improving skills (UNSD, SDG 9.5 metadata).
The OIC economies can increase their competitiveness with other countries and regions in the world by strengthening their scientific and technological base. However, expenditure on R&D in relation to GDP of the OIC countries group has shown only limited growth during the past 17 years since 2000. Moreover, in the OIC countries group, 0.4% of GDP was devoted to R&D in 2017, compared to 1.7% in the world in 2016 (Figure 32).
At the individual OIC country level, 22 out of 33 OIC countries with available data increased their R&D spending in GDP between 2000 and 2017. Nevertheless, only Malaysia, exceeded an R&D expenditure above 1% of GDP during this time period across the OIC countries. Moreover, as Figure 32 clearly indicates all OIC countries with data available are lagging behind the world average in R&D spending in GDP in 2017. Thus, more concerted efforts in R&D are urgently needed to enhance research capabilities of the OIC countries.
Despite improvements, OIC countries showed considerable variation in higher-tech manufacturing
The proportion of medium and high-tech industry (MHT) value added in total MVA is a ratio value between the value added of MHT industry and MVA. Industrial development requires a structural transition from resource-based and low technology activities to MHT activities. A modern, highly complex production structure based on R&D and innovation offers better opportunities for skills development and economic growth. MHT activities, in this regard, are the high value addition industries of manufacturing. Increasing the share of MHT sectors reflects both the impact of innovation and R&D activities (UNSD, SDG metadata).
The share of medium and high-tech industries in total MVA increased by 3 percentage-points from 29.6% in 2000 to 32.6% in 2016 in the OIC countries group. The increase recorded by the world, on the other hand, was 4.1 percentage-points from 40.5% in 2000 to 44.7% in 2016 (Figure 33). This is indicative of the continued need for strong and efficient policy support for R&D and innovation activities in the OIC countries in order to reduce the development disparities between the OIC countries and the rest of the world.
In 39 out of 57 OIC countries with available data, the proportion of MHT industries in total MVA increased by more than 10 percentage-points in 6 OIC countries including Qatar, Kuwait, Saudi Arabia, Tunisia, UAE, and Oman. Overall, while the share of higher-tech manufacturing increased in 17 OIC countries, it stagnated in 8 OIC countries and decreased in 14 OIC countries during the 2000-2016 period.
Figure 32: Research and Development Expenditure as a Proportion of GDP, Percent, 2000 vs. 2017
Source: SESRIC staff calculations based on data extracted between 16/05-13/06/2019 from United Nations Statistics Division (UNSD), Global SDG Indicators Database. Please see Appendix 1 for exceptions and details.
0.0 0.2 0.4 0.6 0.8 1.0 1.2 1.4 1.6 1.8 2.0
World
Morocco
Tunisia
Iran
UAE
Qatar
Malaysia
Sudan
Turkey
Gabon
Mozambique
Senegal
Uganda
Uzbekistan
Azerbaijan
Jordan
OIC
Togo
Algeria
Mali
Palestine
Burkina Faso
Egypt
Kazakhstan
Kyrgyzstan
Oman
Kuwait
Pakistan
Albania
Tajikistan
Indonesia
Saudi Arabia
Iraq
Brunei
Gambia
2000 2017

Towards the Achievement of Prioritised Sustainable Development Goals in OIC Countries: A Progress Report by SESRIC 32
At the individual country level, only Qatar and Iran had a higher share of higher-tech manufacturing than the world average in 2016 (Figure 33). This is clearly an indication of accelerated actions needed to be taken by the OIC countries to support R&D and innovation for a sustainable technological progress.
A general decrease was observed in emissions intensity of manufacturing across OIC countries
Carbon dioxide (CO2) emissions per unit of MVA is an indicator computed as ratio between CO2 emissions from fuel combustion and MVA. It is measured in kg of CO2 equivalent per unit of MVA in constant 2010 USD. CO2 emissions per unit of MVA measures the carbon intensity of the manufacturing economic output and its trends. Even though manufacturing industries are generally improving their emission intensity as countries move to higher levels of industrialisation, emission intensities can also be reduced through structural changes and product diversification in manufacturing (UNSD, SDG 9.4 metadata).
CO2 emissions per unit of MVA in constant 2010 USD was estimated as 0.7 kg in the OIC countries group in 2016, compared to a 0.2 kg decline from 2000. However, this promising recovery was not reflected in the global emissions intensity level. The world average of CO2 emissions per unit of MVA was stagnant at around 0.5 kg CO2 per USD during the period 2000-2016 (Figure 34).
Between 2000 and 2016, majority of the OIC countries showed a decline in CO2 emissions from manufacturing per unit of MVA. In 41 OIC countries with available data, CO2 emissions per unit of MVA decreased in 22 countries. It only increased more than 0.5 kg CO2 per USD in 5 OIC countries including Libya, Oman, Iraq, Kuwait, and Senegal. At the country level, 14 out those 41 OIC countries were observed to have CO2 emissions per unit of MVA over 1 kg CO2 per USD, 10 OIC countries were observed to be between 0.5 and 1 kg CO2 per USD, and 17 OIC countries were observed to be below 0.5 kg CO2 per USD (Figure 34).
Coverage by a mobile cellular signal has become almost universal in most OIC countries
Proportion of population covered by a mobile network refers to the percentage of people living within range of a mobile-cellular signal, irrespective of whether or not they are mobile phone subscribers or users. Third-generation (3G) mobile technology provide increasingly high-speed, reliable and high-quality access to the Internet and its increasing amount of information, content, services, and applications. In this regard, higher speed mobile networks are essential to overcoming infrastructure barriers, helping people join the information society and benefit from the potential of information and communication technologies (ICTs), in particular in least developed and rural areas (UNSD, SDG 9.c metadata).
Mobile cellular services have spread much faster than anticipated. Figure 35 clearly indicates that the 3G mobile coverage has improved very fast between 2007 and 2017 across the OIC countries. By 2017, over 90% of people in 25 OIC countries could access the Internet through a 3G network, which delivers higher speed access to ICTs. Moreover, the proportion of population covered by a 3G network was between 50% and 90% in 19 OIC countries, and it was under 50% in 12 OIC countries in 2017 (Figure 35).
However, many living within range of mobile-cellular networks across the OIC countries does not mean that all people are able to take advantage of them. Greater efforts are still needed to expand particularly the coverage of 3G or higher-quality network to rural and remote parts of the areas in all countries. Moreover, these services need to be provided to the most disadvantaged and at-risk population groups with the affordable prices.

Towards the Achievement of Prioritised Sustainable Development Goals in OIC Countries: A Progress Report by SESRIC 33
Figure 33: Proportion of Medium & High-Tech Industry Value Added in Total Value Added of Manufacturing, Percent, 2000 vs. 2016
Source: SESRIC staff calculations based on data extracted between 16/05-13/06/2019 from United Nations Statistics Division (UNSD), Global SDG Indicators Database. Please see Appendix 1 for exceptions and details.
Figure 34: CO2 Emissions per Unit of Manufacturing Value Added, Kilograms of CO2 per Constant 2010 USD, 2000 vs. 2016
Source: SESRIC staff calculations based on data extracted between 16/05-13/06/2019 from United Nations Statistics Division (UNSD), Global SDG Indicators Database. Please see Appendix 1 for exceptions and details.
0 5 10 15 20 25 30 35 40 45 50 55 60
Malaysia
Niger
Iran
World
Indonesia
Nigeria
OIC
Turkey
Senegal
Pakistan
Jordan
Saudi Arabia
Qatar
Syria
Bangladesh
Morocco
Tunisia
Azerbaijan
Cote d'Ivoire
Afghanistan
Suriname
UAE
Bahrain
Algeria
Uganda
Mozambique
Lebanon
Oman
Albania
Kuwait
Palestine
Kyrgyzstan
Yemen
Gabon
Kazakhstan
Brunei
Tajikistan
Maldives
Cameroon
Iraq
Gambia
2000 2016
0 2 4 6 8 10 12 14 16
SyriaIraq
UzbekistanKazakhstanAzerbaijan
UAEPakistan
KuwaitSaudi Arabia
OmanIran
TogoGabon
AlbaniaQatar
JordanSuriname
EgyptKyrgyzstan
LibyaOIC
YemenAlgeriaTurkeyTunisia
LebanonMalaysiaMorocco
IndonesiaWorld
BangladeshSenegalNigeriaSudan
Cote d'IvoireNiger
TurkmenistanMozambique
BeninBrunei
CameroonBahrain
Tajikistan
2000 2016

Towards the Achievement of Prioritised Sustainable Development Goals in OIC Countries: A Progress Report by SESRIC 34
Figure 35: Proportion of Population Covered by a Mobile Network, 3G, Percent, 2000-2017
Source: SESRIC staff calculations based on data extracted between 16/05-13/06/2019 from United Nations Statistics Division (UNSD), Global SDG Indicators Database. Please see Appendix 1 for exceptions and details.

Towards the Achievement of Prioritised Sustainable Development Goals in OIC Countries: A Progress Report by SESRIC 35
SDG 13: Take Urgent Action to Combat Climate Change and Its ImpactsSDG 13 embarks on taking urgent action to tackle climate change and its impacts. Numerous human activities ranging from pollution, deforestation and other environment unfriendly activities tantamount to climate change and such activities are threatening the way we live and the future of our planet. As such, every country is at risk of experiencing irreversible consequences of global warming. However, addressing climate change, will directly contribute not only to SDG 13 but also to the other SDGs as well as attaining a sustainable environment for everyone.
According to World Meteorological Organization (WMO), which is also the co-custodian of SDG 13, the global average temperature in 2016 was about 1.1°C higher than the pre-industrial period and such high temperatures have also been experienced between 2013 and 2017. The alarming rise in global temperatures have resulted into fall of global sea ice level to 4.14 million km2 in 2016, the second lowest on record. The rising sea levels are affecting the poor and vulnerable, as well as marginalized groups like women, children, and the elderly across the globe.
It is possible to address the issue of climate change by having strong political will among the OIC countries and the whole world at large, integrating disaster risk measures, increasing investment levels in renewable energy, and transformation of our existing technology to limit global temperature rise to well below 2°C above pre-industrial levels and even further to 1.5°C. However, this requires urgent and ambitious collective action. In light with this, the world took a significant first step by adopting the historic Paris Agreement to provide an opportunity for countries to strengthen the global response to the threat of climate change.
Despite the Paris Agreement and continuous devastating impacts of climate change, globally nothing much has been done. In the Survey conducted by SESRIC in 2018 on Tendency Survey on the SDGs Priorities of OIC countries, 14 out of 26 respondent countries gave a “High” priority for SDG 13. At the target level, 15 countries assigned SDG 13.1 (Strengthening resilience and adaptive capacity to climate-related hazards and natural disasters in all countries) a “High” priority. Most OIC countries based on their geographic locations are susceptible to different effects of climate change. Those located in desert areas suffer from extreme high temperatures, prolonged drought and eventually leading to famine.
On the other side, those located close to shores of seas face threat of rising sea level due to the global warming. Mozambique was the recent OIC country to have suffered from one of the worst tropical cyclones on record to affect Africa and the Southern Hemisphere. In line with the 2017 UN report on SDGs, 1.6 million people died due to natural disasters from 1990 to 2015 and the number continues to rise despite the efforts put in implementing disaster risk reduction strategies.
OIC countries observed a decline in the number of persons affected by disasters in the past two decades
The persons directly affected by disasters refers to a group of people who have suffered injury, illness or other health effects; who were evacuated, displaced, relocated; or have suffered direct damage to their livelihoods, economic, physical, social, cultural and environmental assets. The consequences can be of a short-term or long-term depending on the severity and frequency of the natural disaster occurrences.
In 2017, the number of directly affected persons attributed to disasters in the OIC countries group reduced from 641 in 2000 to 200 in 2017 per 100,000 population.
The number of directly affected persons attributed to disasters between 2005 and 2017 greatly reduced in 5 OIC countries, namely; Guyana, Yemen, Pakistan, Maldives, and Albania with decreases between 400 and 7,950 persons per 100,000 population. Senegal, Iran, Turkey, Uganda, and Burkina Faso followed this with decreases between 40 and 250 persons per 100,000 population.
In contrary, 3 OIC countries including Malaysia with (1,264), Mozambique with (984) and Togo with (211) per 100,000 population had the highest number of directly affected persons attributed to disasters between 2005 and 2017. In addition to this, number of directly affected persons attributed to disasters in 5 OIC countries, namely; Palestine, Jordan, Sierra Leone, Kazakhstan and Mali increased between 40 and 100 persons per 100,000 population. Nevertheless, 5 OIC countries, namely; Morocco, Guinea, Niger, Tunisia, and Lebanon registered no directly affected persons attributed to disasters between 2005 and 2017 (Figure 36).

Towards the Achievement of Prioritised Sustainable Development Goals in OIC Countries: A Progress Report by SESRIC 36
Figure 36: Number of Directly Affected Persons Attributed to Disasters per 100,000 population, 2000-2017
Source: SESRIC staff calculations based on data extracted between 16/05-13/06/2019 from United Nations Statistics Division (UNSD), Global SDG Indicators Database. Please see Appendix 1 for exceptions and details.

Towards the Achievement of Prioritised Sustainable Development Goals in OIC Countries: A Progress Report by SESRIC 37
References United Nations Statistics Division (UNSD), Global SDG Indicators Database.
United Nations Statistics Division (UNSD), National Accounts Main Aggregates Online Database.
World Bank, Doing Business Indicators Online Database.
SDG Center for Africa and Sustainable Development Solutions Network (2019): Africa SDG Index and Dashboards Report 2019. Kigali and New York: SDG Center for Africa and Sustainable Development Solutions Network.
Eurostat (2019), Sustainable development in the European Union — Monitoring report on progress towards the SDGs in an EU context, Publications Office of the European Union, Luxembourg.

Towards the Achievement of Prioritised Sustainable Development Goals in OIC Countries: A Progress Report by SESRIC 38
Appendices
Appendix 1: Technical Notes
The estimations found in this Report are based on the data accessed from the UN Global SDG Indicators Database and duly considered the UN SDG Metadata Repository.
Weighted aggregate values of indicators are preferred at the OIC level to provide more robust estimates and avoid the bias, although when the weighted estimations are not possible, unweighted averages are used to provide a meaningful picture.
In producing the OIC aggregate estimates, total population or GDP data for the same year were generally used as a weight. The world aggregate values were accessed from the UN Global SDG Indicators Database to preserve the consistency.
No estimations have been made for missing data. When data on a defined SDG indicator is not sufficiently available, we have selected two reference points, laying furthest away from each other over the period from 2000 to 2018, in order to estimate the trend of progress concerning each OIC country.
Two reference points are the base year which is generally 2000 and the last year 2018. For the base year, in the cases where 2000 data is not available, the earliest data from 2001 and onwards was used. For generating data for the reference year 2018, in the cases where 2018 data is not available, the latest year data starting from 2017 and backwards was used. The dataset generated through the aforementioned method was also used for calculating the OIC aggregate values.
Tables 3-12 provide information which year data was used for each OIC country for selected indicators analysed in this Report.
Selection of indicators
Indicators for each prioritised SDG were selected based on the following criteria:
Data should be available for 29 OIC member countries out of 57 and at least 50% of the countries globally.
Data should be available for at least two time periods, base year and the last year.
Every target is represented at least by one indicator.
Each goal is represented by at least three targets, except for SDGs 5 and 13 (due to insufficient number of indicators).
It should be among the indicators suggested by UNSD to set the target value transparently and made available at UN Global SDG Indicators Database.
There should be clear and concise metadata.
Goal specific notes and exceptions
SDG 1: In Figure 3, the OIC average for “proportion of population below the international poverty line” was estimated using the total population data as the weight, accessed from the World Bank, WDI Database.
In Figure 4, no OIC or World aggregates can be meaningfully measured for the indicator “proportion of the population living below the national poverty line” as each country uses different
definitions and methodologies to calculate national poverty rates.
In Figure 5, OIC and world aggregate values were measured for the indicator “direct economic loss attributed to disasters” in two reference points, the base year 2005 and the last year 2017. The results were discussed in the text but cannot be presented in the time series figure.
SDG 2: In Figure 7, the OIC average for “prevalence of undernourishment” is weighted using the data on the number of undernourished people accessed at UN Global SDG Indicators Database and total population data accessed at World Bank, WDI Database.
In Figure 8, the OIC average for “proportion of children moderately or severely stunted” was weighted using total population data aged 0-4, accessed from UNPD World Population Prospects 2019.
In Figure 9, total number of species data accessed at UN Global SDG Indicators Database was used as a weight in order to calculate the OIC and world aggregate values for “proportion of local breeds classified as being at unknown level of risk of extinction”, “proportion of local breeds classified as known being at risk”, and “proportion of local breeds classified as known being not at risk”. As the level of risk of extinction for 42 OIC countries is “unknown”, it was found sufficient to present the
values of only 8 countries together with OIC and world aggregates.
In Figure 10, the sum of the total official flows to agriculture sector to OIC countries represents the OIC aggregate value.
SDG 3: In Figure 11, the OIC average for “maternal mortality ratio” was estimated using total population as the weight.
In Figure 12, the OIC average for “under-five mortality rate”, total population aged 0-4 for both sexes combined data was used as the weight, accessed from the United Nations Population Division.
In Figure 13, the OIC average for “tuberculosis incidence per 100,000-population” was estimated using the total population data as the weight, accessed at the United Nations Population Division.
In Figure 14, the OIC average for “the mortality rate attributed to cardiovascular disease, cancer, diabetes or chronic respiratory disease for ages 30-70 both sexes” was weighted with the total population estimate for ages 30-69 data accessed at the United Nations Population Division.
In Figure 15, the OIC average for “suicide mortality rate” was weighted with the total population data accessed at the United Nations Population Division.
In Figure 16, the OIC average for “alcohol consumption per capita within a calendar year (ages 15+)” was weighted with the total population (ages 15+) data accessed at the United Nations Population Division.
In Figure 17, the OIC average for “women of reproductive age who have their need for family planning satisfied with modern methods” was estimated using female population ages 15-49 accessed from the UN Global SDG Indicators Database.

Towards the Achievement of Prioritised Sustainable Development Goals in OIC Countries: A Progress Report by SESRIC 39
SDG 4: In Figure 20, regarding “participation rate in organized learning (one year before the official primary entry age)”, by sex, world aggregate value was accessed from the UN Global SDG Indicators Database. As the data for the world between 2000 and 2008 was not available, for the base year 2009 and for the last year 2017 data were used. Unweighted average method was used to estimate the OIC value for this indicator.
In Figure 21, the OIC aggregate for “total official flows for scholarships”, by recipient countries is the sum of the total official flows for scholarships to all OIC countries with available data.
SDG 5: In Figure 25, “proportion of seats held by women in national parliaments” for OIC and the world was calculated using the total number of seats in the national parliaments as the weight.
SDG 8: In Figure 26, the OIC average for “annual growth rate of real GDP per capita” was estimated using the total population data as the weight, accessed from the United Nations Population Division. Sudan's values for 2000-2007 correspond to Sudan (former) based on the UN National Accounts Main Aggregates Online Database.
In Figure 27, the OIC average for “annual growth rate of real GDP per employed person” was weighted by the total employment estimates data accessed from the International Labour Organization.
In Figure 28, the OIC average for “unemployment rate” was an unweighted average of the OIC countries with available data.
In Figure 29, the OIC average for “proportion of adults with an account at a financial institution or mobile money-service provider” was weighted with the population data aged 15+
accessed from the World Bank World Development Indicators Database.
In Figure 30, the OIC average for “domestic material consumption per capita” was weighted with the total population estimates data accessed from the United Nations Population Division.
SDG 9: In Figure 31, the OIC average for “manufacturing value added as a proportion of GDP” was weighted with the total GDP in constant 2010 USD, accessed from the National Accounts Main Aggregates Online Database. In constructing weights, the year 2017 was taken instead of 2018 due to unavailability of GDP in constant 2010 USD data for 2018.
In Figure 32, the OIC average for “research and development expenditure as a proportion of GDP” was calculated using the unweighted average method.
In Figure 33, the OIC average for “medium and high-tech industry value added in total value added of manufacturing” was weighted with the manufacturing value added in constant 2010 USD accessed from the National Accounts Main Aggregates Online Database.
In Figure 34, the OIC average for “carbon dioxide emissions per unit of manufacturing value added” was estimated using the manufacturing value added in constant 2010 USD as the weight, accessed from the National Accounts Main Aggregates Online Database.
In Figure 36, the OIC average for “Number of Directly Affected
Persons Attributed to Disasters per 100,000 population” was
estimated using the total population data as the weight, accessed at the World Bank World Development Indicators Database.

Towards the Achievement of Prioritised Sustainable Development Goals in OIC Countries: A Progress Report by SESRIC 40
Table 3: Reference Years Used for Selected Indicators for Evaluating the Progress of OIC Countries Towards SDG 1
COUNTRY Proportion of Population
below International Poverty Line
Proportion of Population Living below the
National Poverty Line
Direct Economic Loss Attributed to Disasters
Relative to GDP
Proportion of Total Government Spending
on Education Base Year / Last Year 2000 2017 2000 2017 2005 2017 2005 2017 Afghanistan 2007 2011 2010 2017 Albania 2002 2012 2002 2012 2005 2016 2000 2016 Algeria 2008 2008 Azerbaijan 2001 2005 2001 2012 2017 2000 2016 Bahrain 2006 2017 Bangladesh 2000 2016 2000 2016 2000 2016 Benin 2003 2015 2006 2015 2000 2016 Brunei 2000 2016 Burkina Faso 2003 2014 2003 2014 2005 2016 2005 2015 Cameroon 2001 2014 2001 2014 2000 2017 Chad 2003 2011 2002 2011 2000 2013 Comoros 2004 2013 2004 2014 2005 2014 2002 2015 Cote d'Ivoire 2002 2015 2002 2015 2000 2017 Djibouti 2002 2013 2005 2012 2000 2010 Egypt 2004 2015 2004 2015 2016 2017 2003 2008 Gabon 2005 2017 2000 2014 Gambia 2003 2015 2017 2000 2016 Guinea 2002 2012 2002 2012 2014 2015 2000 2017 Guinea-Bissau 2002 2010 2002 2010 2017 2010 2013 Guyana 2005 2013 2000 2017 Indonesia 2000 2017 2000 2017 2001 2015 Iran 2005 2014 2005 2011 2000 2017 Iraq 2006 2012 2006 2012 Jordan 2002 2010 2008 2010 2005 2017 2016 2017 Kazakhstan 2001 2015 2001 2015 2005 2017 2002 2017 Kuwait 2017 2001 2006 Kyrgyzstan 2000 2016 2006 2016 2005 2016 2000 2017 Lebanon 2005 2014 2001 2013 Libya Malaysia 2004 2015 2002 2014 2016 2017 2000 2017 Maldives 2002 2009 2002 2009 2005 2017 2002 2016 Mali 2001 2009 2001 2009 2005 2014 2000 2016 Mauritania 2000 2014 2000 2014 2002 2016 Morocco 2000 2013 2000 2007 2005 2014 2008 2009 Mozambique 2002 2014 2002 2014 2005 2017 2004 2013 Niger 2005 2014 2011 2014 2005 2014 2000 2017 Nigeria 2003 2009 2003 2009 Oman 2000 2017 Pakistan 2001 2015 2001 2013 2005 2014 2000 2017 Palestine 2004 2016 2010 2011 2005 2013 Qatar 2000 2017 Saudi Arabia 2000 2008 Senegal 2001 2011 2001 2011 2005 2015 2000 2017 Sierra Leone 2003 2011 2003 2011 2006 2015 2000 2017 Somalia 2017 Sudan 2000 2009 Suriname Syria 2004 2007 2005 2009 2001 2009 Tajikistan 2003 2015 2013 2015 2000 2015 Togo 2006 2015 2006 2015 2005 2014 2000 2016 Tunisia 2000 2010 2000 2015 2005 2013 2000 2015 Turkey 2002 2016 2002 2015 2005 2017 2000 2015 Turkmenistan 2012 Uganda 2002 2016 2002 2012 2005 2017 2000 2017 UAE Uzbekistan 2012 2013 2017 2013 2017 Yemen 2005 2014 2005 2014 2005 2010 2000 2008
*Values in the cells indicate which year data has been used for the base year 2000/2005 and for the last year 2017

Towards the Achievement of Prioritised Sustainable Development Goals in OIC Countries: A Progress Report by SESRIC 41
Table 4: Reference Years Used for Selected Indicators for Evaluating the Progress of OIC Countries Towards SDG 2
COUNTRY Prevalence of
Undernourishment Proportion of Children
Moderately or Severely Stunted
Proportion of Children Moderately or Severely
Overweight
Proportion of Children Moderately or Severely
Wasted Base Year / Last Year 2000 2016 2000 2016 2000 2016 2000 2016 Afghanistan 2000 2016 2004 2013 2004 2013 2004 2013 Albania 2000 2016 2000 2009 2000 2009 2000 2009 Algeria 2000 2016 2000 2012 2000 2012 2000 2012 Azerbaijan 2000 2016 2000 2013 2000 2013 2000 2013 Bahrain Bangladesh 2000 2016 2000 2014 2000 2014 2000 2014 Benin 2000 2016 2001 2014 2001 2014 2001 2014 Brunei 2000 2016 2009 Burkina Faso 2000 2016 2003 2016 2003 2016 2003 2016 Cameroon 2000 2016 2004 2014 2004 2014 2004 2014 Chad 2000 2016 2000 2015 2000 2015 2000 2015 Comoros 2000 2012 2000 2012 2000 2012 Cote d'Ivoire 2000 2016 2006 2016 2006 2016 2006 2016 Djibouti 2000 2016 2002 2012 2002 2012 2002 2012 Egypt 2000 2016 2000 2014 2003 2014 2003 2014 Gabon 2000 2016 2000 2012 2000 2012 2000 2012 Gambia 2000 2016 2000 2013 2000 2013 2000 2013 Guinea 2000 2016 2005 2016 2005 2016 2005 2016 Guinea-Bissau 2000 2016 2000 2014 2000 2014 2000 2014 Guyana 2000 2016 2000 2014 2000 2014 2000 2014 Indonesia 2000 2016 2000 2013 2000 2013 2000 2013 Iran 2000 2016 2004 2011 2004 2011 Iraq 2000 2016 2000 2011 2000 2011 2000 2011 Jordan 2000 2016 2002 2012 2002 2012 2002 2012 Kazakhstan 2000 2016 2006 2015 2006 2015 2006 2015 Kuwait 2000 2016 2001 2015 2001 2015 2001 2015 Kyrgyzstan 2000 2016 2006 2014 2006 2014 2006 2014 Lebanon 2000 2016 2004 Libya 2007 Malaysia 2000 2016 2006 2016 2015 2016 Maldives 2000 2016 2001 2009 2001 2009 2001 2009 Mali 2000 2016 2001 2015 2001 2015 2001 2015 Mauritania 2000 2016 2000 2015 2000 2015 2000 2015 Morocco 2000 2016 2003 2011 2003 2011 2003 2011 Mozambique 2000 2016 2001 2011 2003 2011 2001 2011 Niger 2000 2016 2000 2016 2000 2012 2000 2016 Nigeria 2000 2016 2003 2016 2003 2016 2003 2016 Oman 2000 2016 2009 2014 Pakistan 2000 2016 2001 2012 2001 2012 2001 2012 Palestine 2002 2014 2007 2014 2002 2014 Qatar Saudi Arabia 2000 2016 2005 Senegal 2000 2016 2000 2016 2000 2016 2000 2016 Sierra Leone 2000 2016 2000 2013 2000 2013 2000 2013 Somalia 2000 2009 2000 2009 Sudan 2012 2016 2006 2014 2006 2014 2006 2014 Suriname 2000 2016 2000 2010 2000 2010 2000 2010 Syria 2000 2009 2001 2009 2000 2009 Tajikistan 2000 2012 2005 2012 2000 2012 Togo 2000 2016 2006 2014 2006 2014 2006 2014 Tunisia 2000 2016 2000 2012 2006 2012 2000 2012 Turkey 2000 2016 2004 2013 2004 2013 2004 2013 Turkmenistan 2000 2016 2000 2015 2006 2015 2000 2015 Uganda 2000 2016 2000 2016 2000 2016 2000 2016 UAE 2001 2016 Uzbekistan 2000 2016 2002 2006 2002 2006 2002 2006 Yemen 2000 2016 2003 2013 2003 2013 2003 2013
*Values in the cells indicate which year data has been inputted for the base year 2000 and for the last year 2016

Towards the Achievement of Prioritised Sustainable Development Goals in OIC Countries: A Progress Report by SESRIC 42
Table 5: Reference Years Used for Selected Indicators for Evaluating the Progress of OIC Countries Towards SDG 2 (cont.)
COUNTRY
Total Official Flows to Agriculture sector,
Millions of Constant 2016 USD
Proportion of Local Breeds Classified as
Being at Unknown Level of Risk of Extinction
Proportion of Local Breeds Classified as Known Being at Risk
Proportion of Local Breeds Classified as Known Being Not at
Risk Base Year / Last Year 2000 2016 2000 2018 2000 2018 2000 2018 Afghanistan 2000 2016 2010 2018 2000 2018 2000 2018 Albania 2000 2016 2000 2018 2000 2018 2000 2018 Algeria 2000 2016 2000 2018 2000 2018 2000 2018 Azerbaijan 2000 2016 2000 2018 2000 2018 2000 2018 Bahrain 2000 2003 2010 2018 2000 2018 2000 2018 Bangladesh 2000 2016 2000 2018 2000 2018 2000 2018 Benin 2000 2016 2000 2018 2000 2018 2000 2018 Brunei Burkina Faso 2000 2016 2000 2018 2000 2018 2000 2018 Cameroon 2000 2016 2000 2018 2000 2018 2000 2018 Chad 2000 2016 2000 2018 2000 2018 2000 2018 Comoros 2000 2016 2005 2018 2000 2018 2000 2018 Cote d'Ivoire 2000 2016 2000 2018 2000 2018 2000 2018 Djibouti 2000 2016 2010 2018 2000 2018 2000 2018 Egypt 2000 2016 2000 2018 2000 2018 2000 2018 Gabon 2000 2016 2010 2018 2000 2018 2000 2018 Gambia 2000 2016 Guinea 2000 2016 2000 2018 2000 2018 2000 2018 Guinea-Bissau 2000 2016 2000 2018 2000 2018 2000 2018 Guyana 2000 2016 2010 2018 2000 2018 2000 2018 Indonesia 2000 2016 2000 2018 2000 2018 2000 2018 Iran 2000 2016 2000 2018 2000 2018 2000 2018 Iraq 2000 2016 2000 2018 2000 2018 2000 2018 Jordan 2000 2016 2000 2018 2000 2018 2000 2018 Kazakhstan 2000 2016 2000 2018 2000 2018 2000 2018 Kuwait Kyrgyzstan 2000 2016 2000 2018 2000 2018 2000 2018 Lebanon 2000 2016 2000 2018 2000 2018 2000 2018 Libya 2005 2016 2000 2018 2000 2018 2000 2018 Malaysia 2000 2016 2000 2018 2000 2018 2000 2018 Maldives 2000 2016 2000 2018 2000 2018 2000 2018 Mali 2000 2016 2000 2018 2000 2018 2000 2018 Mauritania 2000 2016 2000 2018 2000 2018 2000 2018 Morocco 2000 2016 2000 2018 2000 2018 2000 2018 Mozambique 2000 2016 2000 2018 2000 2018 2000 2018 Niger 2000 2016 2000 2018 2000 2018 2000 2018 Nigeria 2000 2016 2000 2018 2000 2018 2000 2018 Oman 2000 2010 2000 2018 2000 2018 2000 2018 Pakistan 2000 2016 2000 2018 2000 2018 2000 2018 Palestine 2000 2016 Qatar Saudi Arabia 2000 2006 2010 2018 2000 2018 2000 2018 Senegal 2000 2016 2000 2018 2000 2018 2000 2018 Sierra Leone 2000 2016 Somalia 2000 2016 2000 2018 2000 2018 2000 2018 Sudan 2000 2016 2000 2018 2000 2018 2000 2018 Suriname 2000 2016 2010 2018 2000 2018 2000 2018 Syria 2000 2016 2000 2018 2000 2018 2000 2018 Tajikistan 2000 2016 2000 2018 2000 2018 2000 2018 Togo 2000 2016 2000 2018 2000 2018 2000 2018 Tunisia 2000 2016 2000 2018 2000 2018 2000 2018 Turkey 2000 2016 2000 2018 2000 2018 2000 2018 Turkmenistan 2000 2016 2000 2018 2000 2018 2000 2018 Uganda 2000 2016 2000 2018 2000 2018 2000 2018 UAE Uzbekistan 2000 2016 2000 2018 2000 2018 2000 2018 Yemen 2000 2016 2000 2018 2000 2018 2000 2018
*Values in the cells indicate which year data has been inputted for the base year 2000 and for the last year 2018

Towards the Achievement of Prioritised Sustainable Development Goals in OIC Countries: A Progress Report by SESRIC 43
Table 6: Reference Years Used for Selected Indicators for Evaluating the Progress of OIC Countries Towards SDG 3
COUNTRY
Maternal Mortality Ratio (Per 100,000
Live Births)
Under-Five Mortality Rate (Deaths per 1,000 Live Births)
Tuberculosis Incidence (Per
100,000 Population)
Mortality Rate Attributed to Cardiovascular Disease, Cancer, Diabetes or Chronic Respiratory
Disease (Probability), Ages 30-70 Base Year / Last Year 2000 2015 2000 2017 2000 2017 2000 2016 Afghanistan 2000 2015 2000 2017 2000 2017 2000 2016 Albania 2000 2015 2000 2017 2000 2017 2000 2016 Algeria 2000 2015 2000 2017 2000 2017 2000 2016 Azerbaijan 2000 2015 2000 2017 2000 2017 2000 2016 Bahrain 2000 2015 2000 2017 2000 2017 2000 2016 Bangladesh 2000 2015 2000 2017 2000 2017 2000 2016 Benin 2000 2015 2000 2017 2000 2017 2000 2016 Brunei 2000 2015 2000 2017 2000 2017 2000 2016 Burkina Faso 2000 2015 2000 2017 2000 2017 2000 2016 Cameroon 2000 2015 2000 2017 2000 2017 2000 2016 Chad 2000 2015 2000 2017 2000 2017 2000 2016 Comoros 2000 2015 2000 2017 2000 2017 2000 2016 Cote d'Ivoire 2000 2015 2000 2017 2000 2017 2000 2016 Djibouti 2000 2015 2000 2017 2000 2017 2000 2016 Egypt 2000 2015 2000 2017 2000 2017 2000 2016 Gabon 2000 2015 2000 2017 2000 2017 2000 2016 Gambia 2000 2015 2000 2017 2000 2017 2000 2016 Guinea 2000 2015 2000 2017 2000 2017 2000 2016 Guinea-Bissau 2000 2015 2000 2017 2000 2017 2000 2016 Guyana 2000 2015 2000 2017 2000 2017 2000 2016 Indonesia 2000 2015 2000 2017 2000 2017 2000 2016 Iran 2000 2015 2000 2017 2000 2017 2000 2016 Iraq 2000 2015 2000 2017 2000 2017 2000 2016 Jordan 2000 2015 2000 2017 2000 2017 2000 2016 Kazakhstan 2000 2015 2000 2017 2000 2017 2000 2016 Kuwait 2000 2015 2000 2017 2000 2017 2000 2016 Kyrgyzstan 2000 2015 2000 2017 2000 2017 2000 2016 Lebanon 2000 2015 2000 2017 2000 2017 2000 2016 Libya 2000 2015 2000 2017 2000 2017 2000 2016 Malaysia 2000 2015 2000 2017 2000 2017 2000 2016 Maldives 2000 2015 2000 2017 2000 2017 2000 2016 Mali 2000 2015 2000 2017 2000 2017 2000 2016 Mauritania 2000 2015 2000 2017 2000 2017 2000 2016 Morocco 2000 2015 2000 2017 2000 2017 2000 2016 Mozambique 2000 2015 2000 2017 2000 2017 2000 2016 Niger 2000 2015 2000 2017 2000 2017 2000 2016 Nigeria 2000 2015 2000 2017 2000 2017 2000 2016 Oman 2000 2015 2000 2017 2000 2017 2000 2016 Pakistan 2000 2015 2000 2017 2000 2017 2000 2016 Palestine 2000 2015 2000 2017 2000 2017 Qatar 2000 2015 2000 2017 2000 2017 2000 2016 Saudi Arabia 2000 2015 2000 2017 2000 2017 2000 2016 Senegal 2000 2015 2000 2017 2000 2017 2000 2016 Sierra Leone 2000 2015 2000 2017 2000 2017 2000 2016 Somalia 2000 2015 2000 2017 2000 2017 2000 2016 Sudan 2000 2015 2000 2017 2000 2017 2000 2016 Suriname 2000 2015 2000 2017 2000 2017 2000 2016 Syria 2000 2015 2000 2017 2000 2017 2000 2016 Tajikistan 2000 2015 2000 2017 2000 2017 2000 2016 Togo 2000 2015 2000 2017 2000 2017 2000 2016 Tunisia 2000 2015 2000 2017 2000 2017 2000 2016 Turkey 2000 2015 2000 2017 2000 2017 2000 2016 Turkmenistan 2000 2015 2000 2017 2000 2017 2000 2016 Uganda 2000 2015 2000 2017 2000 2017 2000 2016 UAE 2000 2015 2000 2017 2000 2017 2000 2016 Uzbekistan 2000 2015 2000 2017 2000 2017 2000 2016 Yemen 2000 2015 2000 2017 2000 2017 2000 2016
*Values in the cells indicate which year data has been inputted for the base year 2000 and for the last year 2015, 2016 or 2017

Towards the Achievement of Prioritised Sustainable Development Goals in OIC Countries: A Progress Report by SESRIC 44
Table 7: Reference Years Used for Selected Indicators for Evaluating the Progress of OIC Countries Towards SDG 3 (cont.)
COUNTRY
Suicide Mortality Rate, Both Sexes
(Deaths per 100,000 Population)
Alcohol Consumption per capita within a
Calendar Year, Ages 15+
Women of Reproductive Age who have Their Need for
Family Planning Satisfied with Modern Methods, Ages 15-49
Health Worker Density, Medical
Doctors (Per 100,000 Population)
Base Year / Last Year 2000 2016 2000 2016 2000 2018 2000 2018 Afghanistan 2000 2016 2000 2016 2001 2016 Albania 2000 2016 2000 2016 2009 2018 2010 2016 Algeria 2000 2016 2000 2016 2006 2013 2002 2016 Azerbaijan 2000 2016 2000 2016 2001 2006 2010 2014 Bahrain 2000 2016 2000 2016 2000 2015 Bangladesh 2000 2016 2000 2016 2000 2014 2001 2017 Benin 2000 2016 2000 2016 2001 2018 2004 2016 Brunei 2000 2016 2000 2016 2000 2015 Burkina Faso 2000 2016 2000 2016 2003 2018 2004 2016 Cameroon 2000 2016 2000 2016 2004 2014 2004 2011 Chad 2000 2016 2000 2016 2004 2015 2000 2016 Comoros 2000 2016 2000 2016 2004 2012 Cote d'Ivoire 2000 2016 2000 2016 2012 2018 2004 2014 Djibouti 2000 2016 2000 2016 2004 2014 Egypt 2000 2016 2000 2016 2000 2014 2003 2017 Gabon 2000 2016 2000 2016 2000 2012 2004 2016 Gambia 2000 2016 2000 2016 2010 2013 2003 2015 Guinea 2000 2016 2000 2016 2005 2016 2000 2016 Guinea-Bissau 2000 2016 2000 2016 2010 2014 2004 2015 Guyana 2000 2016 2000 2016 2009 2014 2000 2018 Indonesia 2000 2016 2000 2016 2003 2017 2003 2017 Iran 2000 2016 2000 2016 2004 2015 Iraq 2000 2016 2000 2016 2011 2018 2010 2017 Jordan 2000 2016 2000 2016 2002 2018 2000 2017 Kazakhstan 2000 2016 2000 2016 2011 2018 2010 2014 Kuwait 2000 2016 2000 2016 2006 2015 Kyrgyzstan 2000 2016 2000 2016 2012 2014 2008 2014 Lebanon 2000 2016 2000 2016 2001 2017 Libya 2000 2016 2000 2016 2007 2014 2004 2017 Malaysia 2000 2016 2000 2016 2000 2015 Maldives 2000 2016 2000 2016 2004 2016 Mali 2000 2016 2000 2016 2001 2015 2004 2016 Mauritania 2000 2016 2000 2016 2001 2015 2004 2017 Morocco 2000 2016 2000 2016 2004 2018 2004 2017 Mozambique 2000 2016 2000 2016 2004 2015 2004 2017 Niger 2000 2016 2000 2016 2006 2018 2004 2014 Nigeria 2000 2016 2000 2016 2003 2018 2003 2013 Oman 2000 2016 2000 2016 2008 2014 2000 2017 Pakistan 2000 2016 2000 2016 2001 2018 2000 2015 Palestine 2010 2014 Qatar 2000 2016 2000 2016 2005 2017 Saudi Arabia 2000 2016 2000 2016 2000 2016 Senegal 2000 2016 2000 2016 2005 2017 2004 2016 Sierra Leone 2000 2016 2000 2016 2008 2017 2004 2011 Somalia 2000 2016 2000 2016 2006 2014 Sudan 2000 2016 2010 2016 2010 2014 2004 2015 Suriname 2000 2016 2000 2016 2000 2018 Syria 2000 2016 2000 2016 2000 2016 Tajikistan 2000 2016 2000 2016 2012 2017 2000 2014 Togo 2000 2016 2000 2016 2010 2014 2004 2015 Tunisia 2000 2016 2000 2016 2001 2012 2000 2016 Turkey 2000 2016 2000 2016 2004 2013 2000 2014 Turkmenistan 2000 2016 2000 2016 2000 2016 2002 2014 Uganda 2000 2016 2000 2016 2001 2018 2004 2015 UAE 2000 2016 2000 2016 2000 2016 Uzbekistan 2000 2016 2000 2016 2009 2014 Yemen 2000 2016 2000 2016 2006 2013 2004 2014
*Values in the cells indicate which year data has been inputted for the base year 2000 and for the last year 2016/2018

Towards the Achievement of Prioritised Sustainable Development Goals in OIC Countries: A Progress Report by SESRIC 45
Table 8: Reference Years Used for Selected Indicators for Evaluating the Progress of OIC Countries Towards SDG 4
COUNTRY
Proportion of Teachers in Primary Education who have Received at
least the Minimum Organized Teacher Training
Total Official Flows for Scholarships, by Recipient Countries (Millions of Constant
2016 USD)
Gender Parity Index for Participation Rate
in Organized Learning (One Year Before the Official Primary Entry Age)
Participation Rate in Organized Learning
(One Year Before the Official Primary Entry
Age)
Base Year / Last Year 2000 2018 2006 2016 2000 2018 2000 2018 Afghanistan 2006 2016 Albania 2008 2016 2000 2015 2000 2015 Algeria 2000 2015 2006 2016 2003 2010 2003 2010 Azerbaijan 2000 2017 2007 2016 2000 2017 2000 2017 Bahrain 2011 2017 2000 2017 2000 2017 Bangladesh 2005 2017 2006 2016 2009 2010 2009 2010 Benin 2000 2017 2006 2016 2011 2016 2011 2016 Brunei 2005 2017 2006 2017 2006 2017 Burkina Faso 2001 2017 2006 2016 2001 2017 2001 2017 Cameroon 2003 2017 2006 2016 2011 2017 2008 2017 Chad 2009 2013 2006 2016 2015 2016 Comoros 2008 2011 2006 2016 2017 2017 Cote d'Ivoire 2000 2017 2007 2016 2000 2017 2000 2017 Djibouti 2006 2018 2006 2016 2000 2018 2000 2018 Egypt 2006 2016 2000 2017 2000 2017 Gabon 2001 2003 2006 2016 Gambia 2000 2018 2006 2016 Guinea 2005 2016 2006 2016 2004 2016 2004 2016 Guinea-Bissau 2000 2010 2006 2016 Guyana 2000 2012 2006 2016 2003 2012 2003 2012 Indonesia 2006 2016 2013 2017 Iran 2001 2017 2006 2016 2003 2016 2003 2016 Iraq 2000 2004 2006 2016 2000 2007 2000 2007 Jordan 2014 2017 2006 2016 2000 2004 Kazakhstan 2014 2018 2006 2016 2017 2018 Kuwait 2000 2015 2007 2017 2007 2017 Kyrgyzstan 2003 2017 2006 2016 2000 2017 2000 2017 Lebanon 2006 2016 2000 2017 2000 2017 Libya 2006 2016 Malaysia 2000 2017 2006 2016 2002 2015 2000 2015 Maldives 2000 2017 2006 2016 2000 2017 2000 2017 Mali 2008 2011 2006 2016 2009 2017 2009 2017 Mauritania 2004 2016 2006 2016 Morocco 2005 2017 2006 2016 2000 2017 2000 2017 Mozambique 2005 2017 2006 2016 Niger 2000 2017 2006 2016 2000 2017 2000 2017 Nigeria 2003 2010 2006 2016 Oman 2000 2017 2009 2017 2009 2017 Pakistan 2004 2015 2006 2016 Palestine 2000 2017 2006 2016 2000 2017 2000 2017 Qatar 2008 2009 2000 2017 2000 2017 Saudi Arabia 2007 2016 2013 2015 Senegal 2003 2017 2006 2016 2009 2017 2009 2017 Sierra Leone 2011 2015 2006 2016 2012 2017 2012 2017 Somalia 2006 2016 Sudan 2002 2009 2006 2016 Suriname 2008 2017 2007 2016 2008 2017 2008 2017 Syria 2006 2016 2000 2013 2000 2013 Tajikistan 2001 2017 2006 2016 2010 2017 2010 2017 Togo 2010 2015 2006 2016 2001 2007 2000 2007 Tunisia 2012 2016 2006 2016 2000 2002 Turkey 2006 2016 2013 2016 Turkmenistan 2006 2016 Uganda 2006 2016 2010 2010 UAE 2004 2016 2000 2013 2000 2013 Uzbekistan 2006 2017 2006 2016 2009 2017 2009 2017 Yemen 2006 2016 2010 2013
*Values in the cells indicate which year data has been inputted for the base year 2000/2006 and for the last year 2016/2018

Towards the Achievement of Prioritised Sustainable Development Goals in OIC Countries: A Progress Report by SESRIC 46
Table 9: Reference Years Used for Selected Indicators for Evaluating the Progress of OIC Countries Towards SDG 8
COUNTRY
Annual Growth Rate of Real GDP per Capita
Annual Growth Rate of Real GDP
per Employed Person
Unemployment Rate, 15+ Both
Sexes
Proportion of Adults with an Account at a Financial Institution or Mobile-
Money-Service Provider 15+
Domestic Material Consumption per Capita, All Raw
Materials
Base Year / Last Year 2000 2017 2000 2018 2000 2017 2000 2017 2000 2017 Afghanistan 2000 2017 2000 2018 2011 2017 2000 2017 Albania 2000 2017 2000 2018 2007 2017 2011 2017 2000 2017 Algeria 2000 2017 2000 2018 2000 2016 2011 2017 2000 2017 Azerbaijan 2000 2017 2000 2018 2000 2017 2011 2017 2000 2017 Bahrain 2000 2017 2000 2018 2010 2012 2011 2017 2000 2017 Bangladesh 2000 2017 2000 2018 2000 2017 2011 2017 2000 2017 Benin 2000 2017 2000 2018 2010 2011 2011 2017 2000 2017 Brunei 2000 2017 2000 2018 2000 2017 Burkina Faso 2000 2017 2000 2018 2011 2017 2000 2017 Cameroon 2000 2017 2000 2018 2007 2014 2011 2017 2000 2017 Chad 2000 2017 2000 2018 2011 2017 2000 2017 Comoros 2000 2017 2000 2018 2000 2017 Cote d'Ivoire 2000 2017 2000 2018 2012 2016 2014 2017 2000 2017 Djibouti 2000 2017 2000 2018 2000 2017 Egypt 2000 2017 2000 2018 2000 2017 2011 2017 2000 2017 Gabon 2000 2017 2000 2018 2005 2010 2011 2017 2000 2017 Gambia 2000 2017 2000 2018 2000 2017 Guinea 2000 2017 2000 2018 2011 2017 2000 2017 Guinea-Bissau 2000 2017 2000 2018 2000 2017 Guyana 2000 2017 2000 2018 2002 2017 2000 2017 Indonesia 2000 2017 2000 2018 2014 2017 2011 2017 2000 2017 Iran 2000 2017 2000 2018 2002 2017 2011 2017 2000 2017 Iraq 2000 2017 2000 2018 2007 2017 2011 2017 2000 2017 Jordan 2000 2017 2000 2018 2000 2016 2011 2017 2000 2017 Kazakhstan 2000 2017 2000 2018 2000 2017 2011 2017 2000 2017 Kuwait 2000 2017 2000 2018 2000 2016 2011 2017 2000 2017 Kyrgyzstan 2000 2017 2000 2018 2000 2017 2011 2017 2000 2017 Lebanon 2000 2017 2000 2018 2004 2009 2011 2017 2000 2017 Libya 2000 2017 2000 2018 2000 2017 Malaysia 2000 2017 2000 2018 2000 2017 2011 2017 2000 2017 Maldives 2000 2017 2000 2018 2000 2016 2000 2017 Mali 2000 2017 2000 2018 2004 2016 2011 2017 2000 2017 Mauritania 2000 2017 2000 2018 2011 2017 2000 2017 Morocco 2000 2017 2000 2018 2000 2016 2000 2017 Mozambique 2000 2017 2000 2018 2000 2017 Niger 2000 2017 2000 2018 2001 2011 2011 2017 2000 2017 Nigeria 2000 2017 2000 2018 2011 2016 2011 2017 2000 2017 Oman 2000 2017 2000 2018 2008 2016 2000 2017 Pakistan 2000 2017 2000 2018 2006 2016 2011 2017 2000 2017 Palestine 2000 2017 2000 2018 2000 2017 2011 2017 Qatar 2000 2017 2000 2018 2004 2017 2000 2017 Saudi Arabia 2000 2017 2000 2018 2000 2017 2011 2017 2000 2017 Senegal 2000 2017 2000 2018 2002 2015 2011 2017 2000 2017 Sierra Leone 2000 2017 2000 2018 2004 2014 2011 2017 2000 2017 Somalia 2000 2017 2000 2018 2000 2017 Sudan 2000 2017 2000 2018 2008 2009 2011 2014 2012 2017 Suriname 2000 2017 2000 2018 2004 2015 2000 2017 Syria 2000 2017 2000 2018 2001 2010 2000 2017 Tajikistan 2000 2017 2000 2018 2011 2017 2000 2017 Togo 2000 2017 2000 2018 2006 2015 2011 2017 2000 2017 Tunisia 2000 2017 2000 2018 2000 2017 2014 2017 2000 2017 Turkey 2000 2017 2000 2018 2000 2017 2011 2017 2000 2017 Turkmenistan 2000 2017 2000 2018 2011 2017 2000 2017 Uganda 2000 2017 2000 2018 2003 2017 2011 2017 2000 2017 UAE 2000 2017 2000 2017 2011 2017 2000 2017 Uzbekistan 2000 2017 2000 2018 2007 2016 2011 2017 2000 2017 Yemen 2000 2017 2000 2018 2004 2014 2011 2014 2000 2017
*Values in the cells indicate which year data has been inputted for the base year 2000 and for the last year 2017/2018

Towards the Achievement of Prioritised Sustainable Development Goals in OIC Countries: A Progress Report by SESRIC 47
Table 10: Reference Years Used for Selected Indicators for Evaluating the Progress of OIC Countries Towards SDG 9
COUNTRY
Manufacturing Value Added as a Proportion of
GDP
Research and Development
Expenditure as a Proportion of
GDP
Proportion of Medium and High-
tech Industry Value Added in
Total Value Added
Carbon Dioxide Emissions per Unit of Manufacturing Value
Added (Kgs of CO2 per Constant 2010 USD)
Proportion of Population
Covered by a Mobile Network,
3G Base Year / Last Year 2000 2018 2000 2017 2000 2016 2000 2016 2007 2017 Afghanistan 2000 2018 2000 2016 2013 2017 Albania 2000 2018 2007 2008 2000 2016 2000 2016 2011 2017 Algeria 2000 2018 2001 2017 2000 2016 2000 2016 2013 2017 Azerbaijan 2000 2018 2000 2017 2000 2016 2000 2016 2009 2017 Bahrain 2000 2018 2000 2016 2000 2016 2009 2017 Bangladesh 2000 2018 2000 2016 2000 2016 2012 2017 Benin 2000 2018 2000 2016 2007 2017 Brunei 2000 2018 2002 2004 2000 2016 2000 2016 2012 2017 Burkina Faso 2000 2018 2001 2014 2007 2017 Cameroon 2000 2018 2000 2016 2000 2016 Chad 2000 2018 2014 2017 Comoros 2000 2018 2015 2017 Cote d'Ivoire 2000 2018 2000 2016 2000 2016 2009 2017 Djibouti 2000 2018 2009 2017 Egypt 2000 2018 2000 2017 2000 2016 2014 2017 Gabon 2000 2018 2007 2009 2000 2016 2000 2016 2014 2017 Gambia 2000 2018 2008 2011 2000 2016 2009 2017 Guinea 2000 2018 2014 2017 Guinea-Bissau 2000 2018 2015 2017 Guyana 2000 2018 2007 2017 Indonesia 2000 2018 2000 2013 2000 2016 2000 2016 2014 2017 Iran 2000 2018 2001 2013 2000 2016 2000 2016 2010 2017 Iraq 2000 2018 2007 2017 2000 2016 2000 2016 2012 2017 Jordan 2000 2018 2002 2016 2000 2016 2000 2016 2010 2017 Kazakhstan 2000 2018 2000 2016 2000 2016 2000 2016 2012 2017 Kuwait 2000 2018 2000 2017 2000 2016 2000 2016 2012 2017 Kyrgyzstan 2000 2018 2000 2017 2000 2016 2000 2016 2011 2017 Lebanon 2000 2018 2000 2016 2000 2016 2009 2017 Libya 2000 2018 2000 2016 2014 2017 Malaysia 2000 2018 2000 2015 2000 2016 2000 2016 2009 2017 Maldives 2000 2018 2000 2016 2009 2017 Mali 2000 2018 2007 2017 2014 2017 Mauritania 2000 2018 2014 2017 Morocco 2000 2018 2001 2010 2000 2016 2000 2016 2008 2017 Mozambique 2000 2018 2002 2015 2000 2016 2000 2016 2012 2017 Niger 2000 2018 2000 2016 2000 2016 2014 2017 Nigeria 2000 2018 2000 2016 2000 2016 2014 2017 Oman 2000 2018 2011 2017 2000 2016 2000 2016 2007 2017 Pakistan 2000 2018 2000 2015 2000 2016 2000 2016 2012 2017 Palestine 2000 2018 2007 2013 2000 2016 2010 2016 Qatar 2000 2018 2012 2015 2000 2016 2000 2016 2007 2017 Saudi Arabia 2000 2018 2003 2013 2000 2016 2000 2016 2009 2017 Senegal 2000 2018 2008 2015 2000 2016 2000 2016 2014 2017 Sierra Leone 2000 2018 2014 2017 Somalia 2000 2018 2010 2017 Sudan 2008 2018 2000 2005 2008 2016 2009 2017 Suriname 2000 2018 2000 2016 2000 2016 2012 2017 Syria 2000 2018 2000 2016 2000 2016 2009 2017 Tajikistan 2000 2018 2001 2017 2000 2016 2000 2016 2014 2017 Togo 2000 2018 2010 2014 2000 2016 2010 2017 Tunisia 2000 2018 2002 2016 2000 2016 2000 2016 2010 2017 Turkey 2000 2018 2000 2015 2000 2016 2000 2016 2007 2017 Turkmenistan 2000 2018 2000 2016 2012 2017 Uganda 2000 2018 2002 2014 2000 2016 2010 2017 UAE 2000 2018 2011 2016 2000 2016 2000 2016 2010 2017 Uzbekistan 2000 2018 2000 2017 2000 2016 2012 2017 Yemen 2000 2018 2000 2016 2000 2016 2012 2017
*Values in the cells indicate which year data has been inputted for the base year 2000/2007 and for the last year 2016/2017/2018

Towards the Achievement of Prioritised Sustainable Development Goals in OIC Countries: A Progress Report by SESRIC 48
Table 11: Reference Years Used for Selected Indicators for Evaluating the Progress of OIC Countries Towards SDGs 5 and 13
COUNTRY Proportion of seats held by women in national parliaments
Number of directly affected persons attributed to disasters per 100,000 population
Base Year/Last year 2000 2018 2005 2017 Afghanistan 2006 2018 Albania 2000 2018 2005 2016 Algeria 2000 2018 Azerbaijan 2000 2018 2017 Bahrain 2003 2018 Bangladesh 2000 2018 Benin 2000 2018 Brunei 2017 2018 Burkina Faso 2000 2018 2005 2016 Cameroon 2000 2018 Chad 2000 2018 Comoros 2005 2018 2005 2014 Cote d'Ivoire 2000 2018 Djibouti 2000 2018 2005 2012 Egypt 2016 2018 2016 2017 Gabon 2000 2018 Gambia 2000 2018 2017 Guinea 2000 2018 2014 2015 Guinea-Bissau 2000 2018 2017 Guyana 2000 2018 2006 2013 Indonesia 2000 2018 Iran 2000 2018 2005 2011 Iraq 2000 2018 Jordan 2000 2018 2005 2017 Kazakhstan 2000 2018 2005 2017 Kuwait 2000 2018 2017 Kyrgyzstan 2000 2018 2005 2016 Lebanon 2000 2018 2005 2014 Libya 2006 2018 Malaysia 2000 2018 2016 2017 Maldives 2000 2018 2005 2017 Mali 2000 2018 2005 2014 Mauritania 2000 2018 Morocco 2000 2018 2005 2014 Mozambique 2000 2018 2005 2017 Niger 2000 2018 2005 2014 Nigeria 2001 2018 Oman 2005 2018 Pakistan 2003 2018 2005 2014 Palestine 2005 2013 Qatar 2006 2018 Saudi Arabia 2004 2018 Senegal 2000 2018 2005 2015 Sierra Leone 2000 2018 2006 2015 Somalia 2006 2018 2017 Sudan 2000 2018 Suriname 2000 2018 Syria 2000 2018 2005 2009 Tajikistan 2000 2018 Togo 2000 2018 2005 2014 Tunisia 2000 2018 2005 2013 Turkey 2000 2018 2005 2017 Turkmenistan 2000 2018 Uganda 2000 2018 2005 2017 UAE 2000 2018 Uzbekistan 2000 2018 2017 Yemen 2000 2018 2005 2010
*Values in the cells indicate which year data has been inputted for the base year 2000/2005 and for the last year 2017/2018

Towards the Achievement of Prioritised Sustainable Development Goals in OIC Countries: A Progress Report by SESRIC 49
Table 12: Reference Years Used for Additional Indicators Selected for Evaluating the Progress of OIC Countries Towards SDGs
COUNTRY
Agriculture Orientation Index for Government
Expenditures
Death Rate due to Road Traffic
Injuries, per 100,000
Population
Mortality Rate Attributed to Unintentional
Poisonings, Both Sexes, Deaths per 100,000 Population
Proportion of the Target Population with Access to 3
Doses of Diphtheria-Tetanus-Pertussis (DTP3), Percent
Average of 13 International
Health Regulations (IHR) Core Capacities
Base Year/ Last Year 2000 2017 2000 2013 2000 2016 2000 2017 2010 2017 Afghanistan 2003 2015 2000 2013 2000 2016 2000 2017 2010 2017 Albania 2002 2017 2000 2013 2000 2016 2000 2017 Algeria 2006 2009 2000 2013 2000 2016 2000 2017 2010 2017 Azerbaijan 2008 2015 2000 2013 2000 2016 2000 2017 2010 2014 Bahrain 2001 2008 2000 2013 2000 2016 2000 2017 2010 2017 Bangladesh 2001 2016 2000 2013 2000 2016 2000 2017 2010 2017 Benin 2000 2013 2000 2016 2000 2017 2010 2017 Brunei 2000 2013 2000 2016 2000 2017 2010 2017 Burkina Faso 2004 2017 2000 2013 2000 2016 2000 2017 2012 2017 Cameroon 2000 2013 2000 2016 2000 2017 2010 2017 Chad 2000 2013 2000 2016 2000 2017 2011 2017 Comoros 2000 2013 2000 2016 2000 2017 2013 2017 Cote d'Ivoire 2009 2014 2000 2013 2000 2016 2000 2017 2011 2017 Djibouti 2000 2013 2000 2016 2000 2017 2012 2017 Egypt 2004 2017 2000 2013 2000 2016 2000 2017 2010 2017 Gabon 2000 2013 2000 2016 2000 2017 2011 2017 Gambia 2000 2013 2000 2016 2000 2017 2010 2017 Guinea 2000 2013 2000 2016 2000 2017 2011 2017 Guinea-Bissau 2009 2015 2000 2013 2000 2016 2000 2017 2014 2017 Guyana 2000 2013 2000 2016 2000 2017 2010 2017 Indonesia 2004 2013 2000 2013 2000 2016 2000 2017 2010 2017 Iran 2002 2009 2000 2013 2000 2016 2000 2017 2010 2017 Iraq 2000 2013 2000 2016 2000 2017 2010 2017 Jordan 2012 2016 2000 2013 2000 2016 2000 2017 2010 2017 Kazakhstan 2001 2017 2000 2013 2000 2016 2000 2017 2011 2015 Kuwait 2001 2015 2000 2013 2000 2016 2000 2017 2010 2017 Kyrgyzstan 2001 2016 2000 2013 2000 2016 2000 2017 Lebanon 2001 2016 2000 2013 2000 2016 2000 2017 2010 2017 Libya 2000 2013 2000 2016 2000 2017 2010 2017 Malaysia 2001 2017 2000 2013 2000 2016 2000 2017 2010 2016 Maldives 2001 2017 2000 2013 2000 2016 2000 2017 2010 2017 Mali 2001 2011 2000 2013 2000 2016 2000 2017 2011 2017 Mauritania 2000 2013 2000 2016 2000 2017 2010 2017 Morocco 2006 2012 2000 2013 2000 2016 2000 2017 2010 2017 Mozambique 2001 2016 2000 2013 2000 2016 2000 2017 2010 2017 Niger 2000 2013 2000 2016 2000 2017 2013 2017 Nigeria 2003 2013 2000 2013 2000 2016 2000 2017 2011 2017 Oman 2001 2014 2000 2013 2000 2016 2000 2017 2010 2017 Pakistan 2001 2016 2000 2013 2000 2016 2000 2017 2010 2017 Palestine 2005 2017 2000 2013 2000 2016 2000 2017 Qatar 2004 2005 2000 2013 2000 2016 2000 2017 2010 2017 Saudi Arabia 2000 2013 2000 2016 2000 2017 2010 2017 Senegal 2000 2013 2000 2016 2000 2017 2011 2017 Sierra Leone 2000 2013 2000 2016 2000 2017 2010 2017 Somalia 2000 2013 2000 2016 2000 2017 2013 2017 Sudan 2000 2013 2000 2016 2000 2017 2010 2017 Suriname 2000 2013 2000 2016 2000 2017 2011 2017 Syria 2007 2009 2000 2013 2000 2016 2000 2017 2010 2017 Tajikistan 2000 2013 2000 2016 2000 2017 2011 2015 Togo 2012 2016 2000 2013 2000 2016 2000 2017 2010 2017 Tunisia 2001 2012 2000 2013 2000 2016 2000 2017 2011 2017 Turkey 2006 2017 2000 2013 2000 2016 2000 2017 2010 2017 Turkmenistan 2000 2013 2000 2016 2000 2017 2011 2014 UAE 2012 2015 2000 2013 2000 2016 2000 2017 2010 2017 Uganda 2001 2016 2000 2013 2000 2016 2000 2017 2010 2017 Uzbekistan 2011 2016 2000 2013 2000 2016 2000 2017 2011 2014 Yemen 2000 2013 2000 2016 2000 2017 2012 2017
*Values in the cells indicate which year data has been inputted for the base year 2000/2005 and for the last year 2017/2018

Towards the Achievement of Prioritised Sustainable Development Goals in OIC Countries: A Progress Report by SESRIC 50
Appendix 2: List of Indicators Selected for Assessment and Methodology of Progress towards the SDGs
Goal 1: End poverty in all its forms everywhere
Indicator Short Name Source Indicator Target Value
Extreme poverty UNSD Proportion of Population below International Poverty Line, Percent 0
National poverty UNSD Proportion of Population Living below the National Poverty Line, Percent
Reducing at least by half
Economic losses from disasters UNSD Direct Economic Loss Attributed to Disasters Relative to GDP, Percent None
Resources mobilization for education UNSD Proportion of Total Government Spending on Essential Services, Education, Percent None
Goal 2: End hunger, achieve food security and improved nutrition and promote sustainable agriculture
Indicator Short Name Source Indicator Target Value Prevalence of undernourishment UNSD Prevalence of Undernourishment, Percent 0
Prevalence of stunting UNSD Proportion of Children Moderately or Severely Stunted, Percent 0
Investment in agriculture UNSD Agriculture Orientation Index for Government Expenditures None
Goal 3: Ensure healthy lives and promote well-being for all at all ages
Indicator Short Name Source Indicator Target Value
Maternal mortality UNSD Maternal Mortality Ratio, per 100,000 Live Births 70
Child mortality UNSD Under-Five Mortality Rate, Both Sexes (Deaths per 1,000 Live Births) 25
Tuberculosis incidence UNSD Tuberculosis Incidence, per 100,000 Population 0
Suicide mortality UNSD Suicide Mortality Rate, Both Sexes, Deaths per 100,000 Population None
Alcohol consumption UNSD Alcohol Consumption per capita within a Calendar Year, Ages 15+, Litres of Pure Alcohol None
Road traffic deaths UNSD Death Rate due to Road Traffic Injuries, per 100,000 Population
Halving the number
Reproductive health UNSD
Proportion of Women of Reproductive Age who have their Need for Family Planning Satisfied with Modern Methods, Ages 15-49, Percent 100
Unintentional poisoning deaths UNSD
Mortality Rate Attributed to Unintentional Poisonings, Both Sexes, Deaths per 100,000 Population None
Immunization coverage UNSD
Proportion of the Target Population with Access to 3 Doses of Diphtheria-Tetanus-Pertussis (DTP3), Percent 100
Medical doctor density UNSD Health Worker Density, Medical Doctors, per 10,000 Population None
Regulations’ core capacities UNSD Average of 13 International Health Regulations (IHR) Core Capacities, Percent None

Towards the Achievement of Prioritised Sustainable Development Goals in OIC Countries: A Progress Report by SESRIC 51
Goal 4: Ensure inclusive and equitable quality education and promote lifelong learning opportunities for all
Indicator Short Name Source Indicator Target Value
Participation in early childhood education UNSD
Participation Rate in Organized Learning (one year before the official primary entry age), Both Sexes, Percent 100
Equal access to early childhood education UNSD
Gender Parity Index for Participation Rate in Organized Learning (one year before the official primary entry age) 1
Qualified teachers UNSD
Proportion of Teachers in Primary Education who have Received at least the Minimum Organized Teacher Training None
Goal 5: Achieve gender equality and empower all women and girls
Indicator Short Name Source Indicator Target Value
Women’s representation in national parliaments UNSD
Proportion of Seats Held by Women in National Parliaments, (% of total number of seats), Percent None
Goal 8: Promote sustained, inclusive and sustainable economic growth, full and productive employment and decent work for all
Indicator Short Name Source Indicator Target Value
Per capita economic growth UNSD Annual Growth Rate of Real GDP per Capita, Percent
OIC-LDCs: 7 Non OIC-LDCs: 5
Growth in labour productivity UNSD Annual Growth Rate of Real GDP per Employed Person, Percent
OIC-LDCs: 7 Non OIC-LDCs: 5
Resource efficiency in consumption UNSD Domestic Material Consumption per Capita, All Raw Materials, Tonnes None
Unemployment rate UNSD Unemployment Rate, 15+ Both Sexes, Percent None
Proportion of bank account holders UNSD
Proportion of Adults with an Account at a Financial Institution or Mobile-Money-Service Provider, 15+ Both Sexes, Percent 100
Goal 9: Build resilient infrastructure, promote inclusive and sustainable industrialization and foster innovation
Indicator Short Name Source Indicator Target Value
Manufacturing value added UNSD Manufacturing Value Added as a Proportion of GDP, Percent
OIC-LDCs: Doubling the share
Non OIC-LDCs: None
Carbon dioxide emissions UNSD
Carbon Dioxide Emissions per Unit of Manufacturing Value Added, Kilograms of CO2 per Constant 2010 USD None
Research and development expenditure UNSD Research and Development Expenditure as a Proportion of GDP, Percent None
Higher-tech manufacturing UNSD
Proportion of Medium and High-tech Industry Value Added in Total Value Added of Manufacturing, Percent None
Third-generation (3G) mobile coverage UNSD Proportion of Population Covered by a Mobile Network, 3G, Percent None


STATISTICAL, ECONOMIC AND SOCIAL RESEARCHAND TRAINING CENTRE FOR ISLAMIC COUNTRIES
Kudüs Cad. No:9 Diplomatik Site 06450 ORAN-Ankara, TurkeyTel: (90-312) 468 61 72-76 Fax: (90-312) 468 57 26Email: [email protected] Web: www.sesric.org
SESRICSESRICSESRIC