towards the development of a supercritical carbon dioxide
TRANSCRIPT

https://openaccess.leidenuniv.nl
License: Article 25fa pilot End User Agreement
This publication is distributed under the terms of Article 25fa of the Dutch Copyright Act (Auteurswet) with explicit consent by the author. Dutch law entitles the maker of a short scientific work funded either wholly or partially by Dutch public funds to make that work publicly available for no consideration following a reasonable period of time after the work was first published, provided that clear reference is made to the source of the first publication of the work.
This publication is distributed under The Association of Universities in the Netherlands (VSNU) ‘Article 25fa implementation’ pilot project. In this pilot research outputs of researchers employed by Dutch Universities that comply with the legal requirements of Article 25fa of the Dutch Copyright Act are distributed online and free of cost or other barriers in institutional repositories. Research outputs are distributed six months after their first online publication in the original published version and with proper attribution to the source of the original publication.
You are permitted to download and use the publication for personal purposes. All rights remain with the author(s) and/or copyrights owner(s) of this work. Any use of the publication other than authorised under this licence or copyright law is prohibited.
If you believe that digital publication of certain material infringes any of your rights or (privacy) interests, please let the Library know, stating your reasons. In case of a legitimate complaint, the Library will make the material inaccessible and/or remove it from the website. Please contact the Library through email: [email protected]
Article details Yu M., Sediq A.S., Zhang S., Nejadnik M.R., Every H.A., Jiskoot W. & Witkamp G.-J. (2018), Towards the development of a supercritical carbon dioxide spray process to coat solid protein particles, Journal of Supercritical Fluids 141: 49-59. Doi: 10.1016/j.supflu.2017.12.014

Contents lists available at ScienceDirect
The Journal of Supercritical Fluids
journal homepage: www.elsevier.com/locate/supflu
Towards the development of a supercritical carbon dioxide spray process tocoat solid protein particlesMiao Yua,⁎, Ahmad S. Sediqb, Shiduo Zhanga, M. Reza Nejadnikb, Hayley A. Everyc, Wim Jiskootb,Geert-Jan Witkampa
a Department of Biotechnology, Delft University of Technology, Van der Maasweg 9, 2629 HZ, Delft, The NetherlandsbDivision of Drug Delivery Technology, Cluster BioTherapeutics, Leiden Academic Centre for Drug Research (LACDR), Leiden University, Einsteinweg 55, 2333 CC Leiden,The Netherlandsc FeyeCon Development & Implementation B.V., Rijnkade 17-A, 1382 GS, Weesp, The Netherlands
G R A P H I C A L A B S T R A C T
A R T I C L E I N F O
Keywords:Supercritical carbon dioxideLysozymeDextran sulphateDrug delivery systemsProteins
A B S T R A C T
The aim of this study was to develop a supercritical carbon dioxide (scCO2) spray process to coat solid proteinparticles with a hydrophilic polymer. The final purpose is to manufacture drug particles exhibiting controlledrelease behaviour in patients. Lysozyme microparticles (about 20 μm) were suspended in a vessel into which adextran sulphate (DS) solution was dispersed by scCO2 via a nozzle. Upon interaction with the droplets, DS wasdeposited onto or mixed with suspended lysozyme particles. Particles of about 100 μm were obtained. The zeta-potential analysis and elemental analysis indicated that the top layer of the particles consisted of both lysozymeand DS. Some of the produced particulate materials showed retarded lysozyme release when exposed to water orphosphate buffered saline, holding promise for future production of controlled drug delivery systems for ther-apeutic proteins.
1. Introduction
Protein therapeutics are successfully applied to treat chronic andlife-threatening diseases owing to their high specificity and potency.One drawback of these drugs is that they have to be administeredparenterally, i.e., intravenously, subcutaneously or intramuscularly,and often require frequent injections or continuous infusion due torapid clearance from the bloodstream [1]. One way to overcome this is
to encapsulate these drugs in an implantable macroscopic or injectablemicroparticulate drug delivery system (DDS) from which they areslowly released after administration. However, the development of aneffective DDS for proteins remains a challenge, as reflected by the lownumber of such products on the market [2–5].
Up to now, polymers such as polylactic acid (PLA) and poly(lactic-co-glycolic) acid (PLGA) have been used as carriers to encapsulateproteins [6]. The use of these polymers, however, comes with
https://doi.org/10.1016/j.supflu.2017.12.014Received 3 October 2017; Received in revised form 3 December 2017; Accepted 9 December 2017
⁎ Corresponding author at: Hanze University of Applied Sciences, Zernikeplein 11, 9747 AS, Groningen, The Netherlands.E-mail address: [email protected] (M. Yu).
The Journal of Supercritical Fluids 141 (2018) 49–59
Available online 11 December 20170896-8446/ © 2017 Elsevier B.V. All rights reserved.
T

disadvantages such as denaturation of proteins during production be-cause of contact with the polymers, organic solvents and interfaces, andthe formation of acidic degradation products causing a local drop in pHduring release, leading to protein aggregation and incomplete proteinrelease [7].
As an alternative to the conventionally used polymers, hydrophilicpolymers could be employed, which are more protein friendly. In thepast decades, the interest for natural or chemically modified poly-saccharide-based polymers in the development of controlled drug de-livery systems has increased due to their stability, safety, non-toxicity,hydrophilicity and biodegradability [8–12]. Charged polymers likepolyelectrolytes are widely applied in food, biotechnology, pharma-ceutical and cosmetic industry and are used as dispersing agent, pur-ification reagent, conditioner, etc. [13–15]. In addition to these appli-cations, polyelectrolytes have been studied as coating material for foodand pharmaceutical purposes [16,22] with a number of advantages[18]. One of them is that the coating process can be performed in anaqueous environment under mild conditions without the use of organicsolvents, which helps to preserve the bioactivity of sensitive biomole-cules like proteins. Proteins can be easily incorporated within poly-electrolyte materials, because they are natural polyelectrolytes them-selves, and due to their amphotericity the protein charge can bechanged through a well-chosen shifted pH [19,20]. The complex for-mation with the polyelectrolyte might however affect the proteinstructure and activity [18].
For the purpose of controlled protein release, polyelectrolytes maybe employed to build up multi-layer coatings (LbL (layer by layer)) bythe application of alternating positively-charged and negatively-charged polyelectrolytes [16]. Compared with conventional en-capsulation methods like emulsion-solvent extraction/evaporation[6,21], i) LbL coating does not require harmful organic solvents; ii)avoids the use of thermal evaporation steps which can damage theprotein; iii) the protein release behaviour can be adjusted by selectingthe proper types of polyelectrolytes, arranging the number of coatinglayers and modifying the interactions among the charged polymers[16,18,22].
It would be even more advantageous if we were able to carry outprotein coating by polyelectrolytes in supercritical carbon dioxide(scCO2). ScCO2 has been examined as a solvent to process proteinpharmaceuticals because of its mild critical temperature and pressure,nontoxicity, the absence of solvent/water interfaces and it does notleave traces in the product [23]. ScCO2 can be applied as a dryingmedium for the proteins and for the production of formulated protein-containing microparticles [24]. In addition, via changes in the kineticsof CO2 depressurization, the particle morphology can be controlled togenerate materials of variable density and surface roughness [25].
Protein encapsulation for controlled release using scCO2 has beeninvestigated before [25–32]. In these studies, hydrophobic materialssuch as PLA, PLGA and lipids, were usually selected as the coatingmaterials, and in some cases organic solvents were applied. As far as weknow, there have been no studies on protein coating using polyelec-trolytes in scCO2 processes.
The selection of polymer-based coating methods for microparticleencapsulation depends on many factors like the desired final coatinglayer thickness and product particle size. Spraying coating involvesbringing core particles in contact with the sprayed polymer-containingdroplets. Conventionally, this coating process provides many ad-vantages such as uniform coating, coating layer thickness control, andmultilayer coating [33,34]. By combining the aforementioned ad-vantages of spray coating and scCO2 processes including drying undermild conditions, a novel approach can be developed for producingcontrolled release protein formulations.
This paper reports on an exploratory study aimed at evaluating thepossibility of developing a scCO2 process to coat dry protein-containinghydrophilic micro-sized core particles with a shell of a single type ofbiodegradable and hydrophilic polyelectrolyte. In this study lysozyme
was chosen as a model protein and dextran sulphate (DS) as the coatingmaterial. The obtained dry microparticles were characterised for par-ticle morphology, residual moisture content, protein release profile,zeta-potential and surface composition.
2. Experimental
2.1. Materials and preparations of feed solutions
Hen egg white lysozyme (∼70000 U/mg, Sigma-Aldrich, St. Louis,USA) was dissolved in ultrapure water (purified using a Milli-Q ultra-pure water system, Millipore™, Molsheim, France) and was used for theproduction of lysozyme core microparticles via a scCO2 spray dryingprocess (see 2.2). DS (dextran sulphate) (Sigma-Aldrich, St. Louis, USA)solution (10% w/w) was also prepared in ultrapure water for the spraycoating onto lysozyme core particles. For the in vitro study on theprotein release performance, a phosphate buffer was prepared withphosphate salts (Na2HPO4 and NaH2PO4) and sodium chloride (NaCl)(Sigma-Aldrich, St. Louis, USA). All liquid formulations were filteredthrough a 0.22 μm cellulose filter (Whatman, GE Healthcare, Freiburg,Germany) before experiments. For all the scCO2 related processes, CO2
(99% purity) was purchased from Linde group (Linde Gas Benelux BV,The Netherlands).
2.2. Preparation of lysozyme core particles
Prior to the coating experiments, solid spray-dried lysozyme coremicroparticles were prepared according to previous methods, with auniform spherical morphology with a relatively narrow size distribution[24]. Briefly described, lysozyme solution (10% w/w) was preparedwith ultrapure water as the solvent. An amount of 20 ml of this solutionwas sprayed into a 4-litre scCO2 spray drying vessel via a co-axialnozzle (inner liquid diameter 0.05 cm and outer scCO2 diameter0.24 cm) at a solution flow rate of 0.2 ml/min, scCO2 flow rate of 30 kg/h, a temperature of 37 °C and a pressure of 130 bar.
2.3. Particle suspension & spray coating (PSSC) process
2.3.1. Experimental set-upFig. 1 illustrates the scheme of the scCO2 spray coating process. The
scCO2 was supplied by a diaphragm pump (LEWA, Leonberg, Germany)to a half-litre pressure vessel.
During the process, an amount of solid lysozyme core particles wasplaced in the vessel, followed by warming and pressurization with theCO2. With the help of the agitator (a shaft with both disk turbine andpitched-blade turbine mounted), the lysozyme powder was suspendedin the vessel. DS solution was fed into the vessel by a high-pressurepiston pump (ISCO, Lincoln, USA). By means of a nozzle-contained T-mixer in which single-hole nozzles were placed, DS solution and scCO2
were mixed and sprayed into the vessel, which is explained in detailbelow. Products from the process were collected at the bottom of thevessel where paper filters were placed. The paper filter was prepared bycutting normal printing paper fitting the inner bottom of the vessel. Tenlayers of the paper were fixed at the bottom of the vessel. The paperfilter remained intact after the spray coating process.
In order to conveniently describe the process developed in ourstudy, it is named particle suspension & spray coating (PSSC) process.
2.3.2. Nozzle configurationsThese experiments aimed to investigate the influence of different
nozzle configurations on the dispersion of the DS liquid. Four types ofnozzle arrangements in the T-mixer, named C1, C2, C3 and C4, re-spectively, as shown in Fig. 2, were tested to evaluate the influence ofthe nozzle configuration on the dispersion of polymer droplets. C1, C2and C3 had configurations that bend the scCO2 flow while C4 had aconfiguration of straight flow. First the vessel was filled with CO2. In all
M. Yu et al. The Journal of Supercritical Fluids 141 (2018) 49–59
50

Fig. 1. Sketch of the PSSC experimental set-up. ScCO2 was pressurized and heated to supercritical state (in this study to 130 bar and 37 ° C), and introduced into the spray & coating vesselvia a nozzle-contained T-mixer, in which the high-speed scCO2 flow atomizes the DS solution (introduced by an ISCO pump) into tiny droplets. A disk turbine and pitched-blade turbinewere placed in the spray & coating vessel to mix the core particles (placed in the vessel before pressurization) and the atomized polymer droplets.
Fig. 2. Scheme of the configurations (C1, C2, C3 and C4) of the nozzle-contained T-mixers applied in the PSSC process. Nozzles (shown as the hole embedded in the blue cylinders) withdifferent sizes were connected in T-mixers made by cylinder tubes (about 9.5 mm inner diameter). The arrows show the direction of the fluids. The nozzle wall plate thickness was about1- 2 mm (For interpretation of the references to colour in this figure legend, the reader is referred to the web version of this article.)
M. Yu et al. The Journal of Supercritical Fluids 141 (2018) 49–59
51

these experiments, a scCO2 flow rate of 300 g/min was applied duringthe spraying process. The operating conditions were maintained at atemperature of 37 ° C and a pressure of 130 bar. Ten ml DS solution(10% w/w) was introduced into the vessel at a flow rate of 0.2 ml/min.The agitator rotated at a rate of 500 rpm. The liquid drops were dried asthe result of quick mass transfer between water and scCO2. After theinjection of DS solution, the vessel was flushed for 30 min at 300 g/minwith fresh scCO2 to avoid making products with a high residualmoisture content.
2.3.3. Processing conditionsSeveral experiments were performed to evaluate the applicability of
the PSSC process for the coating of lysozyme core particles (seeTable 1).
During these experiments, 1 g lysozyme core particles was sus-pended in scCO2 in the half-litre pressure vessel with an agitation at500 rpm, which is higher than the minimum required agitation speed(about 170 rpm) for solid suspension based on an classical equationpioneered by Zwietering [35]. The vessel was pressurized with scCO2,and was regulated at a flow rate of 300 g/min at 130 bar and 37 ° C.Once the pressure was stable, 10 ml DS solution (10% w/w) was ato-mized into the vessel together with the scCO2 via the T-mixer nozzle.The overall mass ratio of lysozyme to DS during this process was 1:1.The feeding rate of DS was varied to learn about the influence of thisparameter on the coating of the core particles. After the injection of DSsolution, the vessel was flushed with scCO2 (300 g/min) for 30 min withagitation for further contact of particles and sprayed DS droplets, aswell as the removal of the residual water from the vessel. After de-pressurization, the product was recovered from the filter on the bottomof the vessel for further analysis.
The samples collected with different operating conditions arenamed as Control, S1, S2 and S3, respectively.
2.4. Particle characterisation
2.4.1. Particle size distributionDS solution was atomized using different nozzle configurations (see
2.3.2) and dried in the vessel. The particle size distribution of the spraydried DS microparticles was measured by the tri-laser diffraction lightscattering technique using a Microtrac S3500 particle analyser (Mi-crotrac S3500, Montgomeryville, USA). Microtrac FLEX software (ver-sion 10.3.14) was used to calculate the particle size distribution. Thedevice offers two operating modes, i.e., a wet (fluid dispersion) modeand a dry (air dispersion) mode. In the wet mode, the liquid-particleshear and implemented sonification help the homogenisation of thesamples; in the dry mode, air flow is used for powder dispersion. Interms of the measurement size range, the wet mode has a lower de-tection limit (about 0.02 um) than the dry mode (about 0.2 um). Thewet mode seems to be better for particle size determination. However, aproper liquid medium is needed to avoid sample dissolution and sampleinteraction.
Methanol was used as the liquid medium as it is a non-solvent forDS. Sonification (2 min at an ultrasound power of 25 W) was used toimprove the homogeneity of the suspension. A refractive index value of1.59 for particles and 1.33 for methanol was used. A measurement sizerange of 0.02–1408 μm was selected. Each sample was measured in
duplicate and the averaged particle size distribution (each measure-ment itself was the average of triplicated recycling measurements) wasreported.
The size distribution of particles obtained from the PSSC processwas measured by the same device in the dry (air dispersion) mode tomaintain the solid state of the collected particles and to avoid re-dis-solution (as lysozyme can be dissolved in solvents like methanol) andunexpected inter-particle interaction. During the measurement, the drypowder was blown through the beam by means of pressure and suckedinto a vacuum cleaner. During the dry mode measurement, the sizerange of 0.2–1408 um was used and each sample was measured once.
2.4.2. Scanning electron microscope and energy dispersive spectroscopyA scanning electron microscope (SEM), integrated with Energy
Dispersive Spectroscopy (EDS) (JSM-6010LA, JEOL, Tokyo, Japan) wasused to examine the morphology of the microparticles as well as theelemental composition of the microparticle surface. Conductive doublesided tape was used to fix the particles to the specimen holder beforesputtering them with a thin layer of Au-Pd. All the samples were ana-lysed in map mode during EDS analysis, where the distribution andintensity of elements were measured in the scanned area and a sum-marised elemental composition of the scanned area was reported.
The EDS analysis was performed for lysozyme, DS, Control, S1, S2and S3 at the accelerating voltages of 10 kV), counting rate higher than1000 cps and dead time lower than 4%. Elemental carbon (C), nitrogen(N), oxygen (O) and sulphur (S) were measured as feature elements todistinguish lysozyme and DS. For the EDS analysis, at least 3 differentparticles were chosen for elemental composition analysis. The averagevalues of the elemental compositions of the measured particles togetherwith their standard deviations are reported.
The influence of different accelerating voltages on the detectedelemental composition was investigated. S3 was selected for this mea-surement for its relatively high detected sulfur content (see 3.5). Oneparticle of S3 was selected; three different positions on the particle weremeasured for elemental content in the sequence of 5, 10, 15 and 20 kV.The average value of the measured elemental compositions of the threedetected positions under each accelerating voltage is reported.
2.4.3. Zeta-potential analysisZeta-potential measurements are commonly employed to determine
whether the electrical charge on the surface of a particles is positive ornegative, and is used as a means of monitoring the deposition of surfacelayers [36].
A polar liquid medium has to be used for the zeta-potential mea-surement. Zeta-potential of the product was measured in ethanol (ra-ther than methanol to avoid the possible dissolution of lysozyme [37]),in which lysozyme and DS are only sparingly soluble, via electro-phoretic light scattering (ELS) combined with phase analysis lightscattering (PALS) (Zetasizer Nano ZS, Malvern Instruments, Malvern,UK). About 0.01 g sample powder was put in a cuvette filled with 1 mlethanol, followed by immediate measurement. Refractive indices of1.36 and 1.59 were used for ethanol and particles, respectively. Avoltage of 5 V was applied during the measurement. Each sample wasmeasured in triplicate and the mean zeta-potential value, standarddeviation of the triplicated measurement and zeta-deviation, whichreflects the width of the charge distribution obtained in the experiment[38] and was calculated by Malvern Zetasizer Software v7.11, werereported.
2.4.4. Moisture content analysisThe moisture content measurements of the samples were conducted
with a Karl-Fischer coulometer (Metrohm 756F, Herisau, Switzerland).An amount of powder (about 0.01 g) was weighed in a chromatographyvial, which was sealed after loading the powder, followed by the ad-dition of 1 ml methanol. After half an hour water extraction by me-thanol, 0.1 ml of the water-methanol mixture was injected into the
Table 1Operating conditions used for the PSSC process.
Sample DS concentration (w/w) Flow rate (ml/min) Nozzle configuration
Control 0% 1 C4S1 10% 0.2 C4S2 10% 0.5 C4S3 10% 1 C4
M. Yu et al. The Journal of Supercritical Fluids 141 (2018) 49–59
52
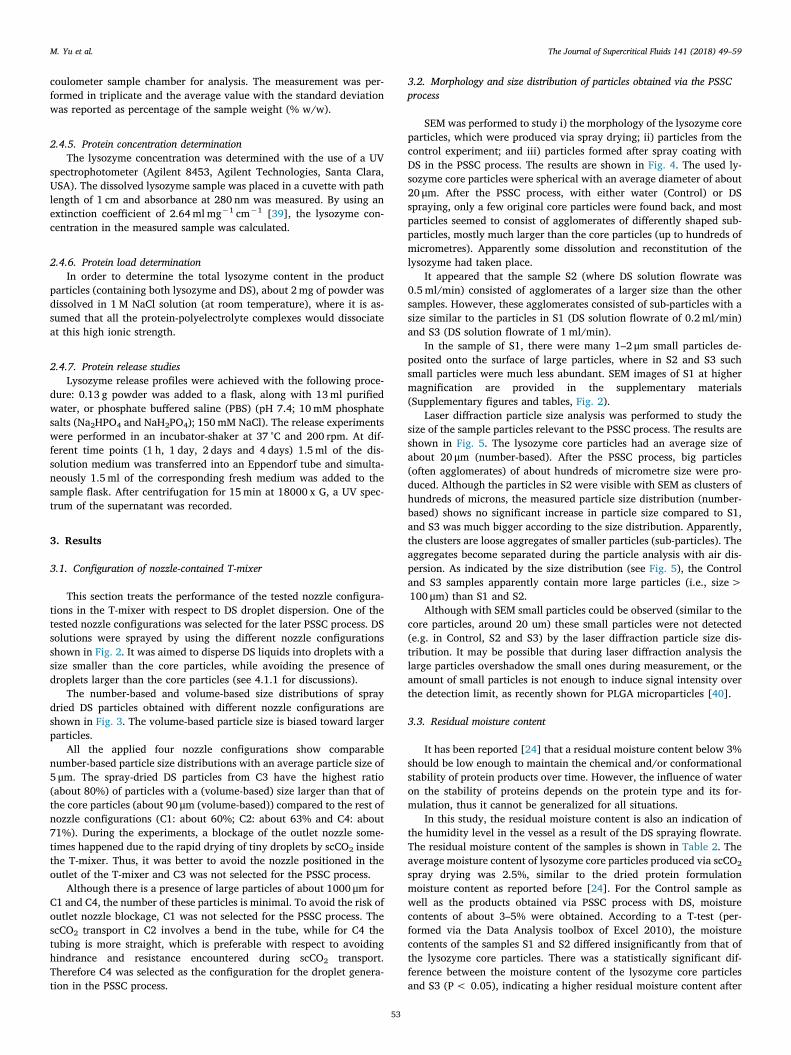
coulometer sample chamber for analysis. The measurement was per-formed in triplicate and the average value with the standard deviationwas reported as percentage of the sample weight (% w/w).
2.4.5. Protein concentration determinationThe lysozyme concentration was determined with the use of a UV
spectrophotometer (Agilent 8453, Agilent Technologies, Santa Clara,USA). The dissolved lysozyme sample was placed in a cuvette with pathlength of 1 cm and absorbance at 280 nm was measured. By using anextinction coefficient of 2.64 ml mg−1 cm−1 [39], the lysozyme con-centration in the measured sample was calculated.
2.4.6. Protein load determinationIn order to determine the total lysozyme content in the product
particles (containing both lysozyme and DS), about 2 mg of powder wasdissolved in 1 M NaCl solution (at room temperature), where it is as-sumed that all the protein-polyelectrolyte complexes would dissociateat this high ionic strength.
2.4.7. Protein release studiesLysozyme release profiles were achieved with the following proce-
dure: 0.13 g powder was added to a flask, along with 13 ml purifiedwater, or phosphate buffered saline (PBS) (pH 7.4; 10 mM phosphatesalts (Na2HPO4 and NaH2PO4); 150 mM NaCl). The release experimentswere performed in an incubator-shaker at 37 °C and 200 rpm. At dif-ferent time points (1 h, 1 day, 2 days and 4 days) 1.5 ml of the dis-solution medium was transferred into an Eppendorf tube and simulta-neously 1.5 ml of the corresponding fresh medium was added to thesample flask. After centrifugation for 15 min at 18000 x G, a UV spec-trum of the supernatant was recorded.
3. Results
3.1. Configuration of nozzle-contained T-mixer
This section treats the performance of the tested nozzle configura-tions in the T-mixer with respect to DS droplet dispersion. One of thetested nozzle configurations was selected for the later PSSC process. DSsolutions were sprayed by using the different nozzle configurationsshown in Fig. 2. It was aimed to disperse DS liquids into droplets with asize smaller than the core particles, while avoiding the presence ofdroplets larger than the core particles (see 4.1.1 for discussions).
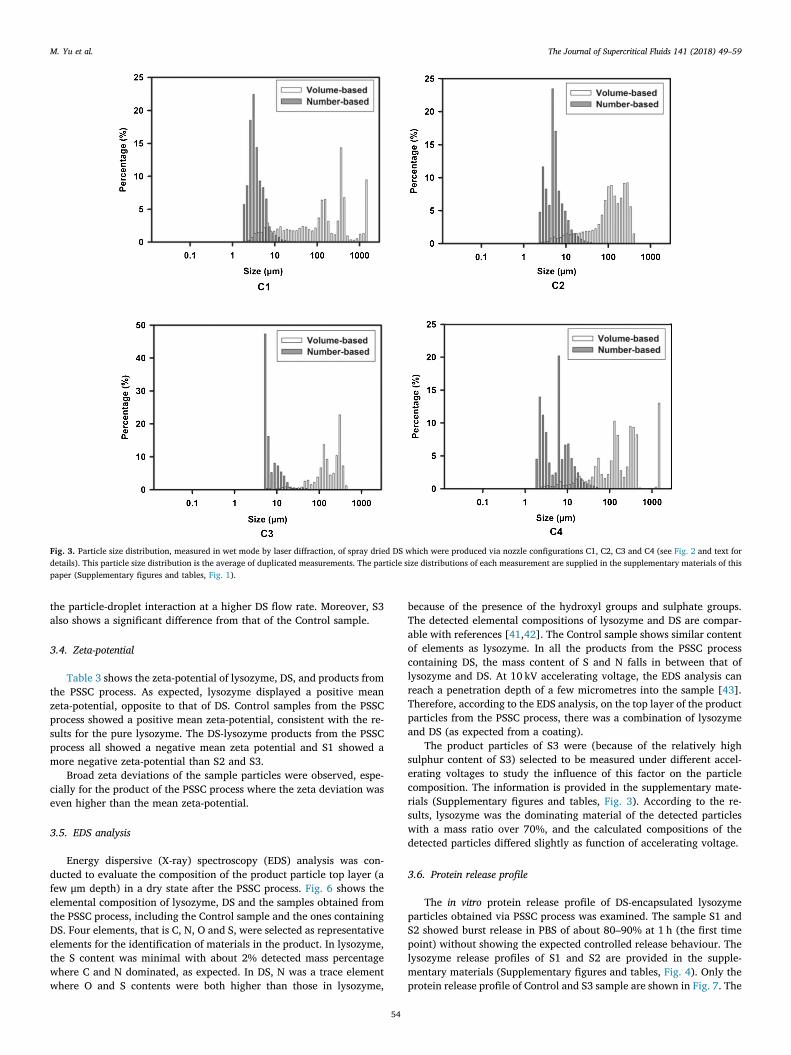
The number-based and volume-based size distributions of spraydried DS particles obtained with different nozzle configurations areshown in Fig. 3. The volume-based particle size is biased toward largerparticles.
All the applied four nozzle configurations show comparablenumber-based particle size distributions with an average particle size of5 μm. The spray-dried DS particles from C3 have the highest ratio(about 80%) of particles with a (volume-based) size larger than that ofthe core particles (about 90 μm (volume-based)) compared to the rest ofnozzle configurations (C1: about 60%; C2: about 63% and C4: about71%). During the experiments, a blockage of the outlet nozzle some-times happened due to the rapid drying of tiny droplets by scCO2 insidethe T-mixer. Thus, it was better to avoid the nozzle positioned in theoutlet of the T-mixer and C3 was not selected for the PSSC process.
Although there is a presence of large particles of about 1000 μm forC1 and C4, the number of these particles is minimal. To avoid the risk ofoutlet nozzle blockage, C1 was not selected for the PSSC process. ThescCO2 transport in C2 involves a bend in the tube, while for C4 thetubing is more straight, which is preferable with respect to avoidinghindrance and resistance encountered during scCO2 transport.Therefore C4 was selected as the configuration for the droplet genera-tion in the PSSC process.
3.2. Morphology and size distribution of particles obtained via the PSSCprocess
SEM was performed to study i) the morphology of the lysozyme coreparticles, which were produced via spray drying; ii) particles from thecontrol experiment; and iii) particles formed after spray coating withDS in the PSSC process. The results are shown in Fig. 4. The used ly-sozyme core particles were spherical with an average diameter of about20 μm. After the PSSC process, with either water (Control) or DSspraying, only a few original core particles were found back, and mostparticles seemed to consist of agglomerates of differently shaped sub-particles, mostly much larger than the core particles (up to hundreds ofmicrometres). Apparently some dissolution and reconstitution of thelysozyme had taken place.
It appeared that the sample S2 (where DS solution flowrate was0.5 ml/min) consisted of agglomerates of a larger size than the othersamples. However, these agglomerates consisted of sub-particles with asize similar to the particles in S1 (DS solution flowrate of 0.2 ml/min)and S3 (DS solution flowrate of 1 ml/min).
In the sample of S1, there were many 1–2 μm small particles de-posited onto the surface of large particles, where in S2 and S3 suchsmall particles were much less abundant. SEM images of S1 at highermagnification are provided in the supplementary materials(Supplementary figures and tables, Fig. 2).
Laser diffraction particle size analysis was performed to study thesize of the sample particles relevant to the PSSC process. The results areshown in Fig. 5. The lysozyme core particles had an average size ofabout 20 μm (number-based). After the PSSC process, big particles(often agglomerates) of about hundreds of micrometre size were pro-duced. Although the particles in S2 were visible with SEM as clusters ofhundreds of microns, the measured particle size distribution (number-based) shows no significant increase in particle size compared to S1,and S3 was much bigger according to the size distribution. Apparently,the clusters are loose aggregates of smaller particles (sub-particles). Theaggregates become separated during the particle analysis with air dis-persion. As indicated by the size distribution (see Fig. 5), the Controland S3 samples apparently contain more large particles (i.e., size >100 μm) than S1 and S2.
Although with SEM small particles could be observed (similar to thecore particles, around 20 um) these small particles were not detected(e.g. in Control, S2 and S3) by the laser diffraction particle size dis-tribution. It may be possible that during laser diffraction analysis thelarge particles overshadow the small ones during measurement, or theamount of small particles is not enough to induce signal intensity overthe detection limit, as recently shown for PLGA microparticles [40].
3.3. Residual moisture content
It has been reported [24] that a residual moisture content below 3%should be low enough to maintain the chemical and/or conformationalstability of protein products over time. However, the influence of wateron the stability of proteins depends on the protein type and its for-mulation, thus it cannot be generalized for all situations.
In this study, the residual moisture content is also an indication ofthe humidity level in the vessel as a result of the DS spraying flowrate.The residual moisture content of the samples is shown in Table 2. Theaverage moisture content of lysozyme core particles produced via scCO2
spray drying was 2.5%, similar to the dried protein formulationmoisture content as reported before [24]. For the Control sample aswell as the products obtained via PSSC process with DS, moisturecontents of about 3–5% were obtained. According to a T-test (per-formed via the Data Analysis toolbox of Excel 2010), the moisturecontents of the samples S1 and S2 differed insignificantly from that ofthe lysozyme core particles. There was a statistically significant dif-ference between the moisture content of the lysozyme core particlesand S3 (P < 0.05), indicating a higher residual moisture content after
M. Yu et al. The Journal of Supercritical Fluids 141 (2018) 49–59
53
the particle-droplet interaction at a higher DS flow rate. Moreover, S3also shows a significant difference from that of the Control sample.
3.4. Zeta-potential
Table 3 shows the zeta-potential of lysozyme, DS, and products fromthe PSSC process. As expected, lysozyme displayed a positive meanzeta-potential, opposite to that of DS. Control samples from the PSSCprocess showed a positive mean zeta-potential, consistent with the re-sults for the pure lysozyme. The DS-lysozyme products from the PSSCprocess all showed a negative mean zeta potential and S1 showed amore negative zeta-potential than S2 and S3.
Broad zeta deviations of the sample particles were observed, espe-cially for the product of the PSSC process where the zeta deviation waseven higher than the mean zeta-potential.
3.5. EDS analysis
Energy dispersive (X-ray) spectroscopy (EDS) analysis was con-ducted to evaluate the composition of the product particle top layer (afew μm depth) in a dry state after the PSSC process. Fig. 6 shows theelemental composition of lysozyme, DS and the samples obtained fromthe PSSC process, including the Control sample and the ones containingDS. Four elements, that is C, N, O and S, were selected as representativeelements for the identification of materials in the product. In lysozyme,the S content was minimal with about 2% detected mass percentagewhere C and N dominated, as expected. In DS, N was a trace elementwhere O and S contents were both higher than those in lysozyme,
because of the presence of the hydroxyl groups and sulphate groups.The detected elemental compositions of lysozyme and DS are compar-able with references [41,42]. The Control sample shows similar contentof elements as lysozyme. In all the products from the PSSC processcontaining DS, the mass content of S and N falls in between that oflysozyme and DS. At 10 kV accelerating voltage, the EDS analysis canreach a penetration depth of a few micrometres into the sample [43].Therefore, according to the EDS analysis, on the top layer of the productparticles from the PSSC process, there was a combination of lysozymeand DS (as expected from a coating).
The product particles of S3 were (because of the relatively highsulphur content of S3) selected to be measured under different accel-erating voltages to study the influence of this factor on the particlecomposition. The information is provided in the supplementary mate-rials (Supplementary figures and tables, Fig. 3). According to the re-sults, lysozyme was the dominating material of the detected particleswith a mass ratio over 70%, and the calculated compositions of thedetected particles differed slightly as function of accelerating voltage.
3.6. Protein release profile
The in vitro protein release profile of DS-encapsulated lysozymeparticles obtained via PSSC process was examined. The sample S1 andS2 showed burst release in PBS of about 80–90% at 1 h (the first timepoint) without showing the expected controlled release behaviour. Thelysozyme release profiles of S1 and S2 are provided in the supple-mentary materials (Supplementary figures and tables, Fig. 4). Only theprotein release profile of Control and S3 sample are shown in Fig. 7. The
Fig. 3. Particle size distribution, measured in wet mode by laser diffraction, of spray dried DS which were produced via nozzle configurations C1, C2, C3 and C4 (see Fig. 2 and text fordetails). This particle size distribution is the average of duplicated measurements. The particle size distributions of each measurement are supplied in the supplementary materials of thispaper (Supplementary figures and tables, Fig. 1).
M. Yu et al. The Journal of Supercritical Fluids 141 (2018) 49–59
54

Control sample, protein without DS, showed an immediate lysozymerelease both in water and in PBS, where 100% protein release was al-ready measured at first time point. In water, where the ionic strength islow, the release of lysozyme from the S3 particles was limited to about
20% after 4 days, while in PBS, a quick lysozyme burst release of about70% was detected after 1 h and a cumulative release up to 90% wasreached after 4 days.
Fig. 4. SEM images of core lysozyme parti-cles to be coated in the PSSC process (seeFig. 1 and text for details), Control sample(with water spraying instead of DS spraying)and products from PSSC process (sample S1,S2 and S3) with DS spraying. A magnifiedimage of S1 shows that there are smallparticles deposited onto the surface of largeparticles. The magnified image of S2 showsthat the big particles are clusters of particleswith a size in the same magnitude order asthat in S1 and S3. SEM images of S1 athigher magnifications are provided in thesupplementary materials (Supplementaryfigures and tables, Fig. 2).
M. Yu et al. The Journal of Supercritical Fluids 141 (2018) 49–59
55

4. Discussion
4.1. Influence of the spraying conditions on particle coating
4.1.1. Optimal spraying droplet sizeA small (DS) droplet size with a homogeneous size distribution of
Fig. 5. Particle size distribution, measured in dry mode by laser diffraction, of lysozyme core particles, Control sample and sample S1, S2 and S3 produced via PSSC process.
Table 2Residual moisture content of samples of the PSSC process.
Sample Moisture content (%)
Lysozyme core particles 2.5 ± 1.1Control 3.0 ± 0.7S1 3.4 ± 1.1S2 3.1 ± 0.8S3 4.9 ± 0.5
Table 3Zeta-potential of lysozyme, DS and product of PSSC process.
Mean zeta potential(mV)a
Standard deviation(mV)b
Zeta deviation(mV)c
Lysozyme 34.4 7.6 19.2DS −42.6 2.3 19.7Control 16.0 5.9 25.5S1 −20.8 3.5 21.3S2 −6.4 2.4 30.9S3 −5.9 1.5 42.6
a Average zeta-potential of triplicate measurements.b Standard deviation of the mean zeta-potential of triplicate measurements.c A zeta-potential deviation reported by Malvern Nano-zetasizer, representing the
distribution of zeta-potential contributed from differently charged particles [38].
M. Yu et al. The Journal of Supercritical Fluids 141 (2018) 49–59
56

dissolved coating material is expected to give optimal coating[33,44–46]. According to previous literature [47] on the correlationbetween spraying droplet size and favourable particle coating, it ispredicted that the size of droplets must be smaller than that of the coreparticle (micrometre range) in order to obtain the coating of the coreparticles with relatively little agglomeration.
Due to the closed high-pressure system, the droplet size could not beobserved directly. Therefore, an effort was made here to derive the
droplet size indirectly. The size of the dispersed DS droplets was de-termined based on the size of the spray-dried DS particles. When as-suming that one droplet creates one primary DS particle by the processof drying, a mass balance allows calculating the original droplet size.
According to the number based particle size distribution, the ma-jority of the spray dried DS particles ranged in size from 2 to 15 μm,with an average size of about 5 μm. DS particles have a density of about1.96 g/cm3 [48] and the 10% (w/w) DS solution has a measured den-sity of about 1.05 g/cm3 (via an Anton Paar DMA 5000 density meter(data not included)). If it is assumed that both the droplets and thespray-dried particles have a spherical shape, the size of the dispersed DSdroplets can be calculated to be been between 5 and 40 μm.
In order to assess whether the dispersed DS droplets had been al-ready completely dried before their contact with the core particles, asimple mass transfer simulation based on Fick’s law using ComsolMultiphysics software was conducted, using the diffusion coefficients ofwater and scCO2 in the corresponding medium that were reported be-fore [49,50]. The simulation results are displayed in the supplementarymaterials (Supplementary figures and tables, Fig. 5). Based on this si-mulation, theoretically in fresh scCO2, it takes about 0.5 ms to 20 ms forthe sprayed DS droplet to be dried. The spraying scCO2 flow rate isabout 30 m/s at the nozzle tip, and the travel distance for the disperseddroplets for the contact with suspending particles is about 10 cm, cor-responding to a residence time of approximately 3 ms. This means thatpart of the DS particles may be pre-dried before their contact with thesolid core lysozyme particles.
A small number fraction of the spray dried DS particles has a largesize of hundreds of micrometres, suggesting that the original dropletsize is even bigger. These large droplets should dry slowly in scCO2 andmay be one of the factors leading to possible re-dissolution and mis-shaping of micro core particles or formation of bridges and agglomer-ates among them, as reflected by the SEM images of the samples (seeFig. 4).
The average size of the sprayed DS droplets (number-based) is abouthalf the average size of the core particles (about 20 μm). This suggeststhat the majority of the dispersed droplets are smaller than those of thecore particle, which should be favourable for the coating of core par-ticles [47].
4.1.2. DS spraying flow rate and residual moisture contentThis study aims to produce DS-encapsulated lysozyme particles with
the help of scCO2. In the PSSC process, the scCO2 flow rate was always300 g/min while the DS solution injection flow rate was varied from0.2 ml/min to 1 ml/min in the different experiments. In general, atsmall volumes of liquid with large volumes of gas using twin-fluidnozzles, a higher liquid flow rate tends to lead to larger droplet sizes[51], implying that the droplet size can be controlled by varying thegas-to-liquid mass ratio (GLR) through the nozzle [52]. From this weexpect to generate larger droplets at higher DS solution flow rates.
Larger droplets may also form by coalescence of the disperseddroplets before drying and the larger droplets will take longer to drydue to the limited mass transfer in the water-scCO2 binary system. If thedroplets cannot leave the system through the paper filter at the bottomof the vessel (something which is not known), this might lead to anincrease of the hold-up of water in the vessel.
These combined phenomena resulted in a higher residual moisturecontent of the particles at a DS flow rate of about 1 ml/min(GLR ≈ 300) (about 5% (w/w) moisture content) compared to that atflow rate of 0.2 and 0.5 ml/min (GLR = 1500 and 600, respectively;about 3-3.5% moisture content; see Table 2).
At equal flow rates (1 ml/min), the residual moisture content of theparticles for the Control experiment with only water spraying is lower(about 3%) than for that of S3 (about 5%). This is probably related tothe approximately 20% higher viscosity, and slightly lower (about 6%)surface tension of the 10% DS solution (see Supporting figures andtables, Table 1), giving rise to larger droplets during the atomisation
Fig. 6. Elemental composition of lysozyme, DS and products of PSSC process detected byEDS at an accelerating voltage of 10 kV.
Fig. 7. Lysozyme release profile from the Control and S3 sample particles in water andPBS at 37 ° C.
M. Yu et al. The Journal of Supercritical Fluids 141 (2018) 49–59
57

and to reduced transport rates. Moreover, the amount of water bound toDS may also contribute to the difference of the residual moisture. Lessthan 2 water molecules are bound per sugar ring onto DS [48], re-presenting an amount of residual water of less than 0.08 g for the 1 g ofsprayed DS. This would theoretically add maximally 4% to the moisturecontent of the (complex) protein particles, so this might explain thehigher moisture content of S3 compared to the Control (no DS).
4.2. Composition of produced particles and efficacy of the coating
The present study was meant to learn whether lysozyme core par-ticles could be coated with DS through the PSSC process. According tothe SEM images, spherical core lysozyme particles (see Fig. 4) ag-glomerate into larger particles during the PSSC process. Only few ori-ginal lysozyme particles are still present in the Control sample (with theaddition of just water in the absence of DS), and mainly new, ag-glomerated particles are visible in which the original spherical shapesof the lysozyme core particles are hardly present anymore. This mightbe explained from a dissolution-growth mechanism. Such a processprobably also takes place in the presence of DS (see Fig. 4, S1, S2 andS3), in addition to the coating of the core lysozyme by DS.
Whether the protein core particles were indeed coated by DS wasevaluated by both the zeta-potential and the elemental composition onthe top layer of the product microparticles.
Zeta-potentials of the samples from the PSSC process were measured(in ethanol) and compared with the measured values for lysozyme(about +34 mV) and DS (about −43 mV). The reverse of the zeta-po-tential from positive to negative values indicates that there is DS pre-sent at the particle surface.
For S1, a low DS injection flow rate was used. According to thediscussion in 4.1.1, this low DS flow rate may lead to a pre-drying of DSbefore it comes in contact with or coats the lysozyme core particles (seeSupplementary figures and tables, Fig. 2). During the zeta-potentialmeasurement, those DS particles which were more loosely attached tothe agglomerates, contribute to the broad zeta-deviation and tend toshift the mean zeta-potential to more a negative value. The samplesfrom the PSSC process contain particles that differ greatly in size,morphology and composition (i.e., lysozyme to DS ratio), which willgive rise to different zeta-potential values.
EDS analyses were performed to learn whether the particles fromthe PSSC process were partly coated by DS. In this study, S was re-garded as the representative element of DS. DS has a theoretical Scontent of 15% (w/w) compared to 2% for lysozyme, and the measuredvalues were 30% and 2%, respectively. Theoretically lysozyme contains20% N with 29% measured. Through calculations based on the S and Nmass contents and the mass ratios of C and O to the representativeelements, a mixture of DS and lysozyme was detected on the top layerof the S1, S2 and S3 sample particles whereby the detected DS contentof S3 was higher than that of S1 and S2.
Based on the morphology of the product samples, the zeta-potentialand EDS analysis, it can be concluded that mixed particles can beproduced consisting of lysozyme and DS. However, a conclusion on thehomogeneity and completeness of the core particle coating in the PSSCprocess cannot be drawn yet.
4.3. Protein release behaviour from the produced particles
Retarded protein release is the final target of the DS coated lyso-zyme particles obtained via the PSSC process. When suspending the DS-containing PSSC processed particles (S3) in PBS, after one hour about70% of the lysozyme was released in the solution. When placed inwater, however, this initial release was much less (about 10%). Onefactor causing the burst release of lysozyme is the dissolution of pureprotein particles. The product particles of S3 exhibited about 10% lessinitial (i.e. after 1 h) burst release in PBS than those of S1 and S2 (seeSupplementary figures and tables, Fig. 4), where S3 had a higher DS
content than S1 and S2. The protein Control sample without DS dis-solved completely in one hour.
The much faster release at the higher ionic strength of the PBS,compared to water was expected [1] and is probably due to a weakenedelectrostatic interaction between lysozyme and DS.
After the initial burst release, a slow release stage followed. Sincethe Control sample did not have such a slow phase, this slow releasestage has to be related to the DS. It apparently hampers the dissolutionor the diffusion of the protein, by binding to it or by forming a layeraround the protein particle [53–55]. Such a shell type layer would swellwhen the particle comes into contact with the water and forms a dif-fusion barrier.
As for the lysozyme release in S1 and S2, after exposing the particlesin vitro to PBS for about two days, a decrease of free dissolved lysozymewas detected (see Supplementary figures and tables, Fig. 4). Com-plexation of released lysozyme with free polyelectrolyte may accountfor the detected decrease of the lysozyme concentration [56].
The product particles from the PSSC process formulated with DSshow some slow release behaviour. To prolong the release of lysozyme,a next step could be to treat the DS formulated particles with a cationichydrophilic polymer such as DEAE-dextran (diethylaminoethyl-dextranhydrochloride). This polymer might form a layer on top of a possible DSlayer of the current product particles and the newly-formed particlesare expected to exhibit slower release profiles. Thicker layers might beconstructed by repeated DS-DEAE-dextran layer deposition.
5. Conclusion
In this study, a scCO2 spray coating process was developed to de-monstrate the possibility of coating lysozyme core particles by hydro-philic polyelectrolyte. Core microparticles agglomerated into largerparticles during the process, pointing at the interaction between solidprotein particles and polymer droplets. Zeta-potential and EDS analysisindicate that DS was deposited onto or mixed with lysozyme in theagglomerated product particles. In some cases, a reduced lysozymerelease rate was observed for the product particles, compared to theControl (no DS). This study lays the foundation for the achievement oflayer-by-layer encapsulation of protein particles via scCO2 processes.
Acknowledgement
This work was supported by the Netherlands Organisation forScientific Research (NWO) Domain Applied and Engineering Sciences(TTW) [grant number 12144], which is partly funded by the Ministry ofEconomic Affairs.
Appendix A. Supplementary data
Supplementary data associated with this article can be found, in theonline version, at https://doi.org/10.1016/j.supflu.2017.12.014.
References
[1] N. Kamiya, A.M. Klibanov, Controling the rate of protein release from polyelec-trolyte complexes, Biotechnol. Bioeng. 82 (2003) 590–594.
[2] T.M. Allen, P.R. Cullis, Drug delivery systems: entering the mainstream, Science 303(2004) 1818–1822.
[3] V. Sinha, A. Trehan, Biodegradable microspheres for protein delivery, J. ControlledRelease 90 (2003) 261–280.
[4] Z. Antosova, M. Mackova, V. Kral, T. Macek, Therapeutic application of peptidesand proteins: parenteral forever? Trends Biotechnol. 27 (2009) 628–635.
[5] S. Mitragotri, P.A. Burke, R. Langer, Overcoming the challenges in administeringbiopharmaceuticals: formulation and delivery strategies,Nature reviews, DrugDiscovery 13 (2014) 655.
[6] Y. Yeo, N. Baek, K. Park, Microencapsulation methods for delivery of protein drugs,Biotechnol. Bioproc. Eng. 6 (2001) 213–230.
[7] M. van de Weert, W.E. Hennink, W. Jiskoot, Protein instability in poly (lactic-co-glycolic acid) microparticles, Pharm. Res. 17 (2000) 1159–1167.
[8] J. Patil, M. Kamalapur, S. Marapur, D. Kadam, Ionotropic gelation and
M. Yu et al. The Journal of Supercritical Fluids 141 (2018) 49–59
58

polyelectrolyte complexation: the novel techniques to design hydrogel particulatesustained, modulated drug delivery system: a review, Digest J. Nanomater.Biostruct. 5 (2010) 241–248.
[9] Z. Liu, Y. Jiao, Y. Wang, C. Zhou, Z. Zhang, Polysaccharides-based nanoparticles asdrug delivery systems, Adv. Drug Deliv. Rev. 60 (2008) 1650–1662.
[10] M. Prabaharan, J. Mano, Chitosan-based particles as controlled drug delivery sys-tems, Drug Deliv. 12 (2004) 41–57.
[11] O. Pillai, R. Panchagnula, Polymers in drug delivery, Curr. Opin. Chem. Biol. 5(2001) 447–451.
[12] W.R. Gombotz, D.K. Pettit, Biodegradable polymers for protein and peptide drugdelivery, Bioconjugate Chem. 6 (1995) 332–351.
[13] T. Yamaguchi, Lipid microspheres as drug carriers: a pharmaceutical point of view,Adv. Drug Deliv. Rev. 20 (1996) 117–130.
[14] M. Hall, C. Ricketts, The use of dextran sulphate as a blood anticoagulant in bio-logical research, J. Clin. Pathol. 5 (1952) 366–366.
[15] H.M. Bugg, P.H. King, C.W. Randall, Polyelectrolyte conditioning of alum sludges,J. (Am. Water Works Assoc.) (1970) 792–795.
[16] R. Bijlsma, A. Van Well, M.C. Stuart, Characterization of self-assembled multilayersof polyelectrolytes, Physica B 234 (1997) 254–255.
[18] A.L. Becker, A.P. Johnston, F. Caruso, Layer-By-Layer-Assembled capsules and filmsfor therapeutic delivery, Small 6 (2010).
[19] Y. Lvov, K. Ariga, I. Ichinose, T. Kunitake, Layer-by-layer architectures of con-canavalin A by means of electrostatic and biospecific interactions, Journal of theChemical Society, Chem. Commun. (1995) 2313–2314.
[20] F. Caruso, D.N. Furlong, K. Ariga, I. Ichinose, T. Kunitake, Characterization ofpolyelectrolyte- protein multilayer films by atomic force microscopy, scanningelectron microscopy, and Fourier transform infrared reflection- absorption spec-troscopy, Langmuir 14 (1998) 4559–4565.
[21] N.K. Varde, D.W. Pack, Microspheres for controlled release drug delivery, ExpertOpin. Biol. Ther. 4 (2004) 35–51.
[22] S. Lankalapalli, V. Kolapalli, Polyelectrolyte complexes: a review of their applic-ability in drug delivery technology, Indian J. Pharm. Sci. 71 (2009) 481.
[23] N. Jovanović, A. Bouchard, G.W. Hofland, G.-J. Witkamp, D.J. Crommelin,W. Jiskoot, Stabilization of proteins in dry powder formulations using supercriticalfluid technology, Pharm. Res. 21 (2004) 1955–1969.
[24] O. Nuchuchua, H. Every, G. Hofland, W. Jiskoot, Scalable organic solvent free su-percritical fluid spray drying process for producing dry protein formulations, Eur. J.Pharm. Biopharm. 88 (2014) 919–930.
[25] M.J. Whitaker, J. Hao, O.R. Davies, G. Serhatkulu, S. Stolnik-Trenkic, S.M. Howdle,K.M. Shakesheff, The production of protein-loaded microparticles by supercriticalfluid enhanced mixing and spraying, J. Controlled Release 101 (2005) 85–92.
[26] K. Mishima, K. Matsuyama, D. Tanabe, S. Yamauchi, T.J. Young, K.P. Johnston,Microencapsulation of proteins by rapid expansion of supercritical solution with anonsolvent, AIChE J. 46 (2000) 857–865.
[27] I.R. Dos Santos, J. Richard, B. Pech, C. Thies, J. Benoit, Microencapsulation ofprotein particles within lipids using a novel supercritical fluid process, Int. J.Pharm. 242 (2002) 69–78.
[28] F. Jordan, A. Naylor, C. Kelly, S. Howdle, A. Lewis, L. Illum, Sustained release hGHmicrosphere formulation produced by a novel supercritical fluid technology: in vivostudies, J. Controlled Release 141 (2010) 153–160.
[29] Y. Kang, C. Yang, P. Ouyang, G. Yin, Z. Huang, Y. Yao, X. Liao, The preparation ofBSA-PLLA microparticles in a batch supercritical anti-solvent process, Carbohydr.Polym. 77 (2009) 244–249.
[30] T.J. Young, K.P. Johnston, K. Mishima, H. Tanaka, Encapsulation of lysozyme in abiodegradable polymer by precipitation with a vapor-over-liquid antisolvent, J.Pharm. Sci. 88 (1999) 640–650.
[31] L.S. Tu, F. Dehghani, N. Foster, Micronisation and microencapsulation of pharma-ceuticals using a carbon dioxide antisolvent, Powder Technol. 126 (2002) 134–149.
[32] J. Kluge, F. Fusaro, N. Casas, M. Mazzotti, G. Muhrer, Production of PLGA micro-and nanocomposites by supercritical fluid extraction of emulsions: i. Encapsulationof lysozyme, J. Supercrit. Fluids 50 (2009) 327–335.
[33] A. Palamanit, S. Prachayawarakorn, P. Tungtrakul, S. Soponronnarit, Performanceevaluation of top-Spray fluidized bed coating for healthy coated rice production,Food Bioprocess Technol. 9 (2016) 1317–1326.
[34] S.R. Werner, J.R. Jones, A.H. Paterson, R.H. Archer, D.L. Pearce, Air-suspensionparticle coating in the food industry: part I—State of the art, Powder Technol. 171(2007) 25–33.
[35] T.N. Zwietering, Suspending of solid particles in liquid by agitators, Chem. Eng. Sci.8 (1958) 244–253.
[36] F. Caruso, H. Möhwald, Protein multilayer formation on colloids through a stepwiseself-assembly technique, J. Am. Chem. Soc. 121 (1999) 6039–6046.
[37] L.E. Bromberg, A.M. Klibanov, Transport of proteins dissolved in organic solventsacross biomimetic membranes, Proc. Natl. Acad. Sci. 92 (1995) 1262–1266.
[38] U. Nobbmann, Zeta deviation larger than the mean – how can that be? (2015) [cited2017 18 September]; Available from: http://www.materials-talks.com/blog/2015/09/24/zeta-deviation-larger-than-the-mean-how-can-that-be/.
[39] A. Sophianopoulos, C. Rhodes, D. Holcomb, K. Van Holde, Physical studies of ly-sozyme I. characterization, J. Biol. Chem. 237 (1962) 1107–1112.
[40] M.M. van Beers, C. Slooten, J. Meulenaar, A.S. Sediq, R. Verrijk, W. Jiskoot, Micro-Flow Imaging as a quantitative tool to assess size and agglomeration of PLGA mi-croparticles, Eur. J. Pharm. Biopharm. 117 (2017) 91–104.
[41] H. Nagendra, C. Sudarsanakumar, M. Vijayan, An X-ray analysis of native mono-clinic lysozyme. A case study on the reliability of refined protein structures and acomparison with the low-humidity form in relation to mobility and enzyme action,Acta Crystallogr., Sect D: Biol. Crystallogr. 52 (1996) 1067–1074.
[42] Dextran Sulphate Product Information, Sigma-Aldrich, 2017.[43] U. Cheema, Standardisation in Cell and Tissue Engineering: Methods and Protocols,
Woodhead publishing, 2013.[44] S. Maronga, On the Optimization of the Fluidized Bed Particulate Coating Process,
Kemiteknik, 1998.[45] V. Saini, Fluidized bed processing for multiparticulates, J. Chem 2 (2009) 447–450.[46] K. Dewettinck, A. Huyghebaert, Top-spray fluidized bed coating: effect of process
variables on coating efficiency, LWT-Food Sci. Technol. 31 (1998) 568–575.[47] M. Mishra, Handbook of Encapsulation and Controlled Release, CRC Press, 2015.[48] S. Lüsse, K. Arnold, Water binding of polysaccharides NMR and ESR studies,
Macromolecules 31 (1998) 6891–6897.[49] B. Xu, K. Nagashima, J.M. DeSimone, C.S. Johnson, Diffusion of water in liquid and
supercritical carbon dioxide: an NMR study, J. Phys. Chem. A 107 (2003) 1–3.[50] S.P. Cadogan, G.C. Maitland, J.M. Trusler, Diffusion coefficients of CO2 and N2 in
water at temperatures between 298.15K and 423.15K at pressures up to 45MPa, J.Chem. Eng. Data 59 (2014) 519–525.
[51] K. Omer, N. Ashgriz, Spray nozzles, Handbook of Atomization and Sprays, Springer,2011, pp. 497–579.
[52] K. Masters, Spray Drying Handbook, Spray Drying Handbook, (1985).[53] M. George, T.E. Abraham, Polyionic hydrocolloids for the intestinal delivery of
protein drugs: alginate and chitosan—a review, J. Controlled Release 114 (2006)1–14.
[54] I.-C. Liao, A.C. Wan, E.K. Yim, K.W. Leong, Controlled release from fibers ofpolyelectrolyte complexes, J. Controlled Release 104 (2005) 347–358.
[55] S. Shu, C. Sun, X. Zhang, Z. Wu, Z. Wang, C. Li, Hollow and degradable polyelec-trolyte nanocapsules for protein drug delivery, Acta Biomater. 6 (2010) 210–217.
[56] S. Mehrotra, D. Lynam, R. Maloney, K.M. Pawelec, M.H. Tuszynski, I. Lee, C. Chan,J. Sakamoto, Time controlled protein release from layer-by-Layer assembled mul-tilayer functionalized agarose hydrogels, Adv. Funct. Mater. 20 (2010) 247–258.
M. Yu et al. The Journal of Supercritical Fluids 141 (2018) 49–59
59