towards wellbeing: monitoring poverty in malinau, indonesia · towards wellbeing: monitoring...
TRANSCRIPT
Towards Wellbeing: Monitoring Poverty in Malinau, Indonesia
Poverty is a persistent problem throughout Indonesia . With decentralization, local governments had a new direct role in alleviating poverty and local wellbeing. At the same time they could do so in accordance with local realities and development needs. Yet, there is little improvement in the wellbeing of rural people. Local governments may lack the necessary capacity and experience to reduce poverty effectively. This report shows how a local specific monitoring system can be developed and applied. The results of its application in Malinau provides an indicative view of poverty and shows which aspects of wellbeing are in critical condition and where interventions are most urgently needed. The report analyses povery causes and gives practical recommendations to help local government improve its development planning and poverty reduction.
This publication is one of three site reports from the study ‘Making local government more responsive to the poor: Developing indicators and tools to support sustainable livelihood development under decentralization’, conducted by CIFOR and partners in the districts of Kutai Barat and Malinau, Indonesia, and in the department of Pando, Bolivia. The reports analyse the impact of decentralisation on human wellbeing in forest-dependent communities and provide practical suggestions to improve local governments’ poverty alleviation policies and actions. The site reports are peer reviewed and published simultaneously on the web in downloadable format (www.cifor.cgiar.org/publications). Contact the project at [email protected] to request a copy.
Review of poverty alleviation and its indicators of forest-dependent rural poor
KABUPATEN MALINAU
I N T I M U N G
Towards W
ellbeing: Monitoring Poverty In M
alinau, IndonesiaM
oira Moeliono | G
odwin Lim
berg | Christian Gönner | Eva W
ollenberg | Ramses Iw
an
Towards WellbeingMonitoring Poverty in Malinau, Indonesia
Moira MoelionoGodwin LimbergChristian GönnerEva WollenbergRamses Iwan
ISBN 978-979-1412-45-2
Towards Wellbeing: Monitoring Poverty in Kutai Barat, Indonesia
01 a
Towards Wellbeing: Monitoring Poverty in Malinau, Indonesia
02 a
Towards Wellbeing: Forest Governance and Rural Change in Sena, Bolivia
03
SERIES
Menuju Kesejahteraan: Memantau Kemiskinan di Malinau, Indonesia
02 b
Menuju Kesejahteraan: Pemantauan Kemiskinan di Kutai Barat, Indonesia
01 b


Towards WellbeingMonitoring Poverty in Malinau, Indonesia
Moira MoelionoGodwin LimbergChristian GönnerEva WollenbergRamses Iwan

© 2007 Center for International Forestry Research (CIFOR)
All rights reserved. No part of this publication may be reproduced, stored in a retrieval system, or transmitted, in any form or by any means (electronic, mechanical, photocopying, recording or otherwise) without the prior permission of the publishers. Proper citation is requested:
ISBN 978-979-1412-45-2
Moeliono, M., Limberg, G., Gönner, C. ,Wollenberg, E. and Iwan, R. 2007. Towards Wellbeing: Monitoring Poverty in Malinau, Indonesia. Center for International Forestry Research (CIFOR), Bogor, Indonesia. 74p.
CABI thesaurus: 1. rural communities 2. households 3. poverty 4. wellbeing 5. decentralisation 6. local government 7. natural resources 8. East Kalimantan 9. Indonesia.
Photo cover by Eko PriantoAll photos by Godwin Limberg and Stefan Seitz except where specified otherwise.
Published by Center for International Forestry ResearchMailing address: P.O. Box 0113 BOCBD, Bogor 16000, IndonesiaOffice address: Jalan CIFOR, Situ Gede, Bogor Barat 16115, IndonesiaTel.: +62 (251) 622 622; Fax +62 (251) 622 100Email: [email protected]: http://www.cifor.cgiar.org

iii
Contents
Glossary and Abbreviations vAcknowledgements viiExecutive Summary viiiChapter 1. Introduction 1
The Problem of Poverty in Indonesia 1Chapter 2. Malinau District, East Kalimantan 4
CIFOR and Poverty Alleviation in Malinau District 10Chapter 3. Poverty and Wellbeing: A New Concept 13
Poverty or Wellbeing? 13Poverty is More Than Low Income 13Poverty and Wellbeing Have Many Dimensions 14Poverty is Dynamic 16Trade-offs Between Poverty Spheres 16
Chapter 4. Methods 17Multistakeholder Workshop 19Baseline Study 20Establishment of a Monitoring Team at District Level and Development of a Monitoring System 21Indicator Development and Drafting of the Questionnaires 22Trials 24Data Entry and Analysis 25Community Assessment of Local Government Programme Impact 25Mainstreaming the Systems 29Why was Poverty Monitoring Not Adopted? 29
Chapter 5. The Status of Poverty and Wellbeing in Malinau 31Chapter 6. Why are People Poor in Malinau? 35
Other Causes of Poverty 36Chapter 7. What Has Been Done in Malinau? 41
More Recent Efforts to Address Poverty 47

iv | Towards Wellbeing: Monitoring Poverty in Malinau, Indonesia
Chapter 8. Conclusions 49Chapter 9. Recommendations 51
Use NESP for More Effective Poverty Monitoring 51Improve Planning 51Improve the Enabling Environment 52
Endnotes 57References 59Annexes 63Annex 1. List of products of the Decentralization and Poverty Project in Malinau 65Annex 2. Villages included in first trial of poverty monitoring in Malinau District 67Annex 3. Villages included in second trial of poverty monitoring in Malinau District 68Annex 4. Questionnaire used for household survey 69

v
GLossARY AnD ABBReVIAtIons
ABK Anggaran Berbasis Kinerja (Perfomance-based Budget Allocation)
AKU Arah Kebijakan Umum (general policy direction)
APBD Anggaran Pendapatan dan Belanja Daerah (Local Government Budget, can be province or district)
APBN Anggaran Pendapatan dan Belanja Nasional (National State Budget)
Bappeda Badan Perencanaan Pembangunan Daerah (District Planning and Development Agency)
BIOMA Biosfer dan Manusia, environmental and development NGO, based in Samarinda
BKKBN Badan Koordinasi Keluarga Berencana Nasional (National Family Planning Coordination Agency)
BMZ Bundesministerium für Wirtschaftliche Zusammenarbeit und Entwicklung (Federal Ministry for Economic Cooperation and Development, Germany)
BPS Badan Pusat Statistik (National Statistics Agency)
BTL Bantuan Langsung Tunai (Direct Cash Subsidies)
Bupati District head
ca. circa, about
cempedak Local fruit species Artocarpus integer
CIFOR Center for International Forestry Research
DAK-DR Dana Alokasi Khusus – Dana Reboisasi (Special Allocated Funds – Reafforestation Funds)
DAU Dana Alokasi Umum (General Allocation Funds)
DPM Dinas Pemberdayaan Masyarakat (Community Empowerment Service)
DPRD Dewan Perwakilan Rakyat Daerah, District Assembly
FoMMA Forum Musyawarah Masyarakat Adat (Forum for Indigenous People, of Kayan Mentarang National Park)
Gerbang Dema Gerakan Pembangunan Desa Mandiri (Self Reliant Village Movement)
GDP Gross Domestic Product
HPH Hak Pengusahaan Hutan (Commercial Forestry Concession)
IHPH Iuran Hak Pengusahaan Hutan (Fee for Forest Exploitation)
IMF International Monetary Fund
IPPK Izin Pemungutan dan Pemanfaatan Kayu (Timber Extraction and Utilisation Permit)

vi | Towards Wellbeing: Monitoring Poverty in Malinau, Indonesia
IUPHHK Izin Usaha Pemanfaatan Hasil Hutan Kayu (Forest Timber Product Utilisation Permit)
KBNK Kawasan Budidaya Non Kehutanan (Non Forestry Cultivation Zone)
kCal kilocalories
kecamatan subdistrict
KPK Komite Penanggulangan Kemiskinan (Poverty Alleviation Committee)
MDG Millennium Development Goals
MoU Memorandum of Understanding
NESP Nested Spheres of Poverty
p.a. per annum
PAD Pendapatan Asli Daerah (Locally Generated Revenues)
Perda Peraturan Daerah (Local Government Act)
PDRB Produk Domestik Regional Bruto (Gross Regional Domestic Product)
PMD Pemberdayaan Masyarakat Desa (Community Empowerment Service)
PMDH Pembinaan Masyarakat Desa Hutan (Rural Forest Community Development)
PP Peraturan Pemerintah (Government Regulation)
PRS Poverty Reduction Strategy
PRSP Poverty Reduction Strategy Papers
PSDH Provisi Sumber Daya Hutan (Royalty for Timber Production)
rambutan Local fruit Nephelium sp.
raskin Beras Miskin (Subsidised Rice for the Poor)
Renstra Rencana Strategis (Strategic Plan)
Rp Indonesian rupiah
RPJM Rencana Pembangunan Jangka Menengah (medium-term development plan)
Sekda Sekretaris Daerah (District secretary)
SK Surat Keputusan (Decree)
SWB Subjective Wellbeing
SUSENAS Survei Sosial Ekonomi Nasional (National Socioeconomic Survey)
USD United States dollars

vii
This report is the outcome of work done in close cooperation among the District Government of Malinau, the CIFOR–BMZ Poverty and Decentralization Project and numerous enthusiastic persons from all over the District of Malinau. In particular, we want to thank Marthin Billa, (the late) Encik Muh. Yunus, Jansen TP, Djalung Merang, (the late) Yermia Bumbu, Jusuf Rapa and Sudarsono from the district government of Malinau. Mathias Henry, Sole Liang, Aan Hartono, Fadliansyah, Dollop Mamung, Dody Hernawan, Abdon Ucan and Adau
Ipu who participated in the baseline survey. Saparuddin, S. Manullang, Andarias Padan, Karmani, Yonathan Yahuda and Armansyah of the monitoring team. The assessors of the first and second trial survey teams in mid-2005, including Sumiati Njau, Yurita Bid, Luhat Adjang, Sarkawi, Karmani, Mathias Henry, Dorothy Buing, Marten Dermawan, Aan Hartono, Dhani Subroto, Ahmad Chari Syafaadi, Iksan Hadi, Kasransyah, Antonius Mangiwa, Taufiq, Agustinus Are and Lengkan Baya, Bayu.
ACknowLeDGements

viii
exeCutIVe summARY
In 2003, CIFOR and its partners, with funding from Bundesministerium für Wirtschaftliche Zusammenarbeit und Entwicklung (BMZ), started a project to provide tools to help local governments respond to their new roles in alleviating poverty and enhancing rural livelihoods. Two case study sites were selected: the districts of Malinau and Kutai Barat, Indonesia—both remote districts in forested areas.
The overall goal of the project is to support the local government in developing more responsive policies aimed at alleviating poverty and improving the wellbeing of poor people in rural areas, especially in forested areas. To this end, the primary focus was on the development of a monitoring system, using locally specific indicators, to monitor changes in poverty and the impact of government programmes on poverty and poor people, especially those living in and around forested areas. Several other studies informed the process and provided supplementary information on various aspects and perceptions on poverty. Agus Andrianto did a study on the role of district government in poverty alleviation using case studies in Malinau and West Kutai Districts, East Kalimantan, Indonesia, which included a survey on perceptions of poverty among
district officials. Erna Rositah did a study on poverty in rural forest communities in Malinau, and Oding Affandi looked specifically at decentralisation policies and their impact on the livelihoods of forest communities. Included in this latter study was a specific look at the Timber Extraction and Utilisation Permit (IPPK) and Forest Timber Product Utilisation Permit (IUPHHK) policies of the district during the early decentralisation period.
The main effort, however, was aimed at the development of a monitoring system. To capture all facets of poverty and wellbeing, the monitoring system was developed within the multidimensional framework of Nested Spheres of Poverty (NESP) model (Gönner et al. 2007). In the NESP model, poverty and wellbeing are constituted by different spheres, or aspects of daily life. The central sphere of the model is subjective wellbeing. The core spheres that influence this subjective wellbeing are health, wealth and knowledge. These—and therefore indirectly also subjective wellbeing—are influenced by context spheres. By these we mean natural, economic, social and political aspects of life that directly or indirectly influence the core spheres. The context spheres, in turn, are influenced by external infrastructure and services.

Executive Summary | ix
The model frames the development and final selection of appropriate indicators to be used in the monitoring. The monitoring system itself was developed and tried out following eight main steps: 1. Laying the groundwork: a
multistakeholder workshop involving local government and NGOs;
2. Baseline survey; 3. Establishment of a monitoring team
at District level; 4. Development of indicators and
questionnaires; 5. Field testing of the system; 6. Data entry and analysis; 7. Mainstreaming of poverty monitoring
in the local government’s routine programme.
8. Development and try-out of a system for community monitoring.
The results were monitoring systems appropriate for use at district level. However, in Malinau the system was not adopted completely. The local government has retained the strong sectoral approach and rigid bureaucratic way of working (despite new opportunities provided by political reform) of the past, where change occurs slowly when a champion for change emerges. Poverty alleviation has to be linked to the overall planning, but there are limited incentives for the local government to invest in good planning, as the final decisions are often beyond their control.
Although the monitoring system was not adopted completely, there have been several positive impacts. First, capacity building for the staff involved. The activities and discussions have resulted in increased awareness that poverty is multifaceted and needs a cross-sectoral or holistic approach. There has been an increased understanding on the need for locally specific indicators. On one occasion, some of the poverty indicators developed were adopted in a government survey. Field activities have increased knowledge and firsthand experience of conditions in the communities and their concerns regarding poverty alleviation.
In addition, the information from the baseline survey and two poverty monitoring surveys provide an indicative view of the conditions of poverty. The most conspicuous result is that the index for the economic sector is perceived as critical in all subdistricts except S. Boh.1 Kayan Hulu and Malinau Barat are shown to be the least well off. The natural sector was given a low score as well, despite the fact that there is still some 90% of forest cover. The low score given for the natural sphere indicates people’s perception of the degradation of the natural resources (especially timber) as a result of rapid exploitation in 2000–2003. Influence of distance and travel difficulties do not affect all aspects equally. There were clear differences between perceptions of health or education conditions relative to remoteness.
Comparing results from the baseline survey in 2003 and the monitoring surveys in 2004–2005, it is clear that local communities recognise that access to education and training has improved, that the level of services and infrastructure has increased, that access to healthcare and fulfilment of basic food needs is relative good.
The surveys confirmed our view that measuring only one aspect of poverty is not sufficient to show the status of poverty. Poverty is multidimensional and includes basic needs aspects as well as the larger enabling context with perceptions of individuals on these aspects being subjective and influenced by the context. This subjectivity also shows the need for locally specific criteria, especially since differences in livelihoods and resources drive different ways of coping.
Using the multidimensional poverty model or NESP, we gained a more complete understanding of poverty and developed the monitoring system accordingly. The various causes of poverty noted by stakeholders can be linked back to aspects of the model. Although not articulated explicitly, there is an understanding among the stakeholders

x | Towards Wellbeing: Monitoring Poverty in Malinau, Indonesia
about the various aspects in the model, and that poverty is often locally specific and requires locally specific indicators. Although local government has attempted to adjust national poverty alleviation programmes to local conditions (e.g. rice distribution), this requires an adaptability not possible within the existing government bureaucracy. Thus, government interventions are mainly targeted at the fulfilment of basic needs, such as subsidised rice, health insurance and cash subsidies, while the development of an environment enabling people to overcome their own poverty is neglected.
The government also tends to treat poverty from the village perspective, while our study shows different levels of poverty. At the household level, for example, people are poor because lack of material wealth or knowledge. But also, people might have sufficient resources to cope, but might be vulnerable to external crisis, such as drop
in prices of commodities (such as gaharu or rubber) or an increase in fuel price. Not all households have sufficient alternatives (connections, alternative sources of income, savings) nor is a social safety net always available. The shift from an economy of need towards an economy of greed resulted in a split between ‘original’ inhabitants and ‘newcomers’, and eroded social cohesion and cooperation.
As regards the monitoring system, local government is supportive, but involving multiple services and agencies is difficult. Political support for poverty alleviation is not translated into action. The position of the Poverty Alleviation Committee (KPK) as coordination body for poverty alleviation efforts remains weak due to lack of leadership, fund allocation, and clear coordinated poverty alleviation strategy or programme.

�
ChApteR 1IntRoDuCtIon
The Problem of PoverTy in indonesia
In August 2006, the President of Indonesia announced that poverty had been reduced from 23.4% in 1999 to 16% in 2006 (Anon. 2006a). This announcement came on the heels of a year of hardship with fuel price increases, which logically was felt to have increased poverty. The result was a re-emergence of the discussion of poverty figures and definition of poverty (Anon. 2006a, b, c; Khomsan 2006; Agusta 2006; Lesmana 2006; Sugema 2006). Confusion over poverty figures and the definition of poverty arises from the use of at least three parallel information systems for determining who is poor:
National Statistics Agency (BPS), uses regionally determined poverty lines related to household consumption, e.g. Rp 114 841 per capita per month for extreme poverty and Rp 136 847 per capita per month for poverty; The former National Family Planning Coordination Agency (BKKBN) measured poverty in terms of a family’s basic needs, such as clothing, housing and food consumption, and described as levels of prosperity, e.g. pre-prosperity, prosperity I, prosperity II, etc.
•
•
District’s own data collection in support for their self-sufficiency movements, which define villages as self-supporting, self-developing or self-sufficient, based largely on village heads’ reports.
In all three systems, poverty in remote areas is significantly underrepresented (Ediawan et al. 2005), resulting in policies which do not address the specific problems of poor people in remote areas, usually the people living in and around forests. Indeed, poverty in forest areas is almost invisible, since poverty alleviation is not considered the mandate of the forestry agencies.
With a less than clear definition of poverty, it is not surprising that the Indonesian Government’s efforts since the mid 1970s have been unsuccessful in eradicating poverty. Poor people remain highly vulnerable to changes in economic, social and political conditions and natural disasters occurring in different regions. Weaknesses have been: centralised policies, too much focus on charity, a focus on macroeconomic growth, an economy orientated viewpoint of poverty, positioning communities as objects, and assumptions that poverty problems and management are uniform throughout the country (KPK 2003).
•

� | Towards Wellbeing: Monitoring Poverty in Malinau, Indonesia
The economic crisis did not help. In 1998, the number of poor people in Indonesia rose to approximately 24.2% of the total population compared to only 11.3% in 1996 (Figure 1). This sharp increase, resulting from the economic and political crises of 1998–1999, forced the Indonesian Government to drastically change economic policies and reform the governance systems. The decentralisation policy of 1999 was the part of these reforms. With decentralisation, local governments were given the authority but also the responsibility for poverty alleviation in their districts.
At national level, succeeding presidents issued a series of poverty alleviation policies that have now been coalesced into three types of policies shaping districts’ current interest in poverty. (1) The national drive to develop and implement a Poverty Reduction Strategy (PRS) as imposed by the IMF. Among other things, the PRS established Poverty Alleviation Committees responsible for creating poverty alleviation strategies at the district, provincial and national levels. (2) National assistance programmes intended to promote food security and reduce economic vulnerability.
The national assistance programmes provide important subsidies, such as for rice, relying on the district to distribute benefits fairly. In the forestry sector, the Forest and Land Rehabilitation Project, funded by National Reforestation Funds, subsidises individuals to plant trees. (3) Districts’ own interest in creating self-sufficient, prosperous villages to maintain the financial viability of the district. The districts’ interest in improving village self-sufficiency has caused districts to lead empowerment and prosperity movements and community forestry programmes. These, however, are not necessarily targeted at specific groups of the poor, but rather are a drive for general economic development.
Local governments thus have a new direct role in alleviating poverty and enhancing local wellbeing. At the same time, they have the opportunity to address locally specific problems according to local perceptions and priorities, and test appropriate locally specific interventions. But, how can districts target the poor if they are not sure of who is poor and why they are poor? How can districts develop good policies where such confusion and lack of information exists,
Figure 1. Percentage of poor people in Indonesia, 1976–2003.2 Source: BPS Jakarta (2004a, b).
0%
10%
20%
30%
40%
50%
1976 1978 1980 1981 1984 1987 1990 1993 1996 1998 1999 2000 2001 2002 2003
Year
Pove
rty
Rate

Introduction | �
where information is based on a mix of units (household, family and village), with criteria and authority spread over multiple agencies? How will districts implement their PRSs in line with the provincial and national PRS as imposed by IMF?
The role of local government can only be expected to grow in coming years. Given the urgent problems and opportunities associated with strong local government, CIFOR and its partners started a project to provide tools to help local governments
respond to their new roles in alleviating poverty and enhancing rural livelihoods.
Malinau was one district selected as case study site. As a new district established under the new decentralisation regime, Malinau offers important lessons in the development of local governance. In addition, Malinau exemplifies a remote forested area where rich resources are inaccessible to its people. Yet much remains unknown about poverty in forest areas such as Malinau.
New office of Malinau’s District Head (Photo: Stefan Seitz)
New office of Malinau’s local parliament (Photo: Stefan Seitz)

�
ChApteR 2mALInAu DIstRICt, eAst kALImAntAn
Established in 1999, Malinau is a new district formed from the interior part of the Bulungan District. Located in a remote area against the border with Sarawak, it can only be reached by plane or by boat up either the Sesayap River or the Kayan River. Because of its inaccessibility, this area has remained one of the last forested areas with the richest remnants of dipterocarp forest in East Kalimantan (Figure 2). Indeed, forest was and still is Malinau’s main asset, with 83% of Malinau District designated state forest land (Bappeda dan BPS Kabupaten Malinau 2005). Not all of this land, however, is available for cultivation, as rugged topography prevents access and 1 million hectares was set aside as Kayan Mentarang National Park in the 1990s. The remaining forest areas were organised into large timber concessions of about 50 000–200 000 ha that were logged through centrally assigned timber concessions starting in the 1960s. These included parastatal logging operations such as Inhutani I and II. Timber, forest land and protected areas were under the central control of the Ministry of Forestry and Soeharto’s cronies.3
Reforms starting in 1998 initiated a process of decentralisation and democratisation, which changed the political landscape of
districts, especially the newly established ones such as Malinau. Although decentralisation only took effect legally in January 2001, changes on the ground began immediately with the organisation of local governments (Rhee 2000). The first district leader was appointed by the Ministry of Interior, the second was elected by the district assembly, and the third (present) was directly elected by the people in 2004. As elsewhere in Indonesia, Malinau seized the opportunity to staff itself with local people, rather than be dominated by appointed officials from elsewhere as had occurred in the past. As a result, nearly all district employees are local residents. The new staff arrangements meant that direct family ties between government authorities and local people are common. More local people have more influence in a more influential local government, while ethnic affiliations gained new importance in local governance.
Malinau benefited enormously from the reforms. For the first time people in remote forest areas were able to directly access government authorities and more government resources were channelled into remote regions. Districts were required to generate their own income4 through sources identified by the law 25 on fiscal balancing (Depdagri 1999). In those first

Malinau District, East Kalimantan | �
years of autonomy, districts made decisions completely in their own interest, often to the detriment of neighbouring districts and ignoring the wider province. As a result, the law on regional autonomy was revised with the province re-established as having a coordinating and supervisory function. In the revised regional autonomy law 33 (Depdagri 2004), the financial balancing was more clearly defined with the district entitled to a set percentage of all fees and royalties from natural resources exploitation in the district and province.5 For Malinau, this meant that the annual budget rocketed from just over Rp 100 billion in 2001 (BPS Kabupaten Malinau 2002) to over Rp 1000 billion in 2007 (Kaltim Post 2007). However, the percentage of locally generated revenues has been steadily decreasing.
At the time of its establishment, Malinau had a population of 36 632 people (BPS 2001). Regional autonomy and the opportunities it promised resulted in a high rate of immigration. Some were local people returning hoping for government position, some were people from other parts of Indonesia looking for better economic opportunities. Data from 2002 show 41 170 people and the voters lists compiled in 2003 shows 46 671 people. Early 2006 figures show a population of 53 820 (BPS 2006) (see Figure 3).
As many as 21 ethnic groups live in the district, including Borneo’s largest group of hunter–gatherers, the Punan. District government has had to give attention to maintaining its legitimacy through balanced representation of powerful ethnic groups—the Kenyah, Lundaye and Tidung—in
Box 1. malinau at a glance
Official establishment of district October 1999
Population 53 820 (BPS 2006), 42 620 (BPS 2004b)
Area 42 000 km2
Population density 1.2 people/km2
Population growth ca. 8 % p.a. (2000–2006)
Number of subdistricts 12
Number of villages 106
Land status 83% of area is state forest land
Literacy Rate 96.5%
GDP per capita per year Rp 14 200 000 (USD 1577*)
Poverty (BPS) 62% (SK Bupati 2005)
Poverty (BKKBN) 48%
Poverty (BTL) 82% (BPS, 2006b)
Economy Swidden agriculture, forest use; timber, coal mining
GDP (2004) Rp 683billion (USD 75.9 million) p.a. (half comes from mining industry).
Annual district budget (2003) Rp 520.4 billion (USD 57.8 million)
Source: CIFOR–BMZ Poverty and Decentralization Project, 2006.* 1 USD = Rp 9000 (April 2006).

� | Towards Wellbeing: Monitoring Poverty in Malinau, Indonesia
Figure 2. Map of Malinau District.

Malinau District, East Kalimantan | �
key positions. In a survey of poor villages, ethnic differences suggest that the Kenyah district leader may be giving some groups more attention than others, as shown by the percentage of households in each ethnic group that reported they were better off in 2003: Punan (53%), Merap (50%), Lundaye (37%) and Kenyah (96%).7 Few Punan officials have been hired in the new district government since 1999. Ethnic affiliations have become an important political tool. District officials seek the support not only of parties, but also of the new ethnic associations within the district, such as the Lembaga Adat Punan, Lembaga Adat Tidung and Lembaga Adat Lundaye, and even at the provincial level (Persekutuan Dayak Kalimantan Timur). Representatives from these associations are routinely invited to public district events and officials participate in events of the associations.
While most rural households rely on swidden agriculture, the forest supplies a large part of additional income through hunting and gathering products such as gaharu (a fragrant fungal infection of
Aquilaria sp. sold for perfume and incense). For a short while (from 2000–2002), the district government allowed small-scale logging, which resulted in significant financial benefits to both government and some community members. Although the main source of income is farming, this subsector contributes only about 5% to the district economy. The forest sector, on the other hand, contributed 58% to the GDP of the district in 2002 (BPS Kabupaten Malinau 2003). Paradoxically, the large area of forest is also seen as a main constraint for development. The government would rather see its conversion into ‘more productive’ uses such as oil palm or mining, while the local communities are eager to gain monetary profit from this resource. In fact, over the past couple of years, the forest area has already been reduced from 95% (Barr et al. 2001) to 83% (Bappeda dan BPS Kabupaten Malinau 2005).8
Malinau’s vision of the future is that by 2010 all villages in the district will be self-reliant or self-sufficient through the Movement to Develop Self-Reliant Villages (Gerakan Pembangunan Desa Mandiri
Figure 3. Population of Malinau District, 2000–20066
30 000
40 000
50 000
60 000
2000 2002 2003 2006
Year
No.
Peo
ple

� | Towards Wellbeing: Monitoring Poverty in Malinau, Indonesia
Tabl
e 1.
Eco
nom
ic s
truc
ture
of M
alin
au D
istr
ict a
nd v
alue
add
ed g
ener
ated
Sect
or20
0120
0220
0320
04
%Va
lue
(bill
ion
Rp)
%Va
lue
(bill
ion
Rp)
%Va
lue
(bill
ion
Rp)
%Va
lue
(bill
ion
Rp)
Agric
ultu
re,
incl
udin
g fo
rest
ry
63.4
925
3,87
557
.24
275,
941
54.7
632
0,51
553
.39
364,
829
Min
ing
11.0
043
,987
13.8
766
,857
9.60
56,2
007.
5851
,791
Proc
essi
ng
indu
stry
0.
0623
90.
0628
10.
0530
00.
0532
0
Elec
tric
ity, g
as
and
wat
er0.
1455
70.
1675
90.
171,
011
0.18
1,23
1
Cons
truc
tion
1.26
5,04
73.
7017
,857
6.72
39,3
129.
5865
,482
Trad
e 14
.17
56,6
7714
.21
68,5
0316
.31
95,4
5417
.36
118,
614
Tran
spor
t 0.
763,
041
1.21
5,84
01.
549,
021
1.68
11,4
96
Fina
nce
0.10
413
0.16
755
0.17
1,00
90.
171,
153
Serv
ices
9.
0136
,027
9.40
45,2
9810
.68
62,5
0110
.01
68,3
79
Tota
l10
0.00
399,
863
100.
0048
2,09
110
0.00
585,
323
100.
0068
3,29
5
Sour
ce: B
appe
da d
an B
PS K
abup
aten
Mal
inau
(200
5)

Malinau District, East Kalimantan | �
or Gerbang Dema). This is to be achieved through development of a ‘sistem ekonomi kerakyatan’ or people-based economy based on sustainable use of natural resources, improving regional equity, and increasing the role of the private sector.
While the first two of these components are lagging far behind, the role of the private sector has increased almost without active government intervention. The private sector learned fast and responded quicker than all other stakeholders in making use of the new opportunities created by decentralisation. Within a few years, many companies were also able to strengthen their position by building close links to the elite within the government as well as within the communities. Thus, while poverty reduction remains high on the agenda, it has been subsumed by the emphasis on economic development driven by the private sector.
Private companies having a permit to extract timber or coal, for example, are required to negotiate with local communities and support local development. However, no significant monitoring or control occurs. While local communities do receive a share, it is not always significant in comparison to the profit made (Palmer, personal communication; Limberg 2004) and often does not compensate for the environmental damage they have to bear.
As forests are Malinau’s main asset, it was the first to experiment with private company–community relations. The 2000–2001 IPPK logging boom led to unsustainable logging of over some 56 000 hectares and provided substantial, albeit short-term, cash benefits to many communities, and more importantly strengthened community and individual ownership over resources in their traditional use area (Limberg et al. 2005; Affandi 2005; Barr et al. 2001; Wollenberg et al. in press). Fees based on the amount of timber cut, compensation payments and contributions from the logging companies became part of life. Despite the realisation that most payments are short term, many communities remain eager for this income.
Malinau was one of the first districts to shift towards a better organised system called IUPHHK, which is modelled after the Indonesian Selective Logging system of large concessions, but limited to a maximum of 50 000 hectares per concession in production forest. Legally (Peraturan Pemerintah 34,9 2002, Article 42), these permits are to be issued by the Minister on recommendation by the district, but in Malinau, the permits were issued by the Bupati prior to the issuance of PP 34. Despite a questionable legal status, 11 permits covering 363 925 hectares were issued between December 2001 and March 2002, though only five had started operations in 2004 (Affandi 2005). The permits come with a set of rules and the requirement to negotiate with local people; however, there is as yet neither an effective monitoring system, nor real support for local communities to negotiate better and enforce the resulting agreements.
After timber, mining was opened to local permits. However, this proved more difficult as mining involves higher technical input and more environmental and social disruption. As reported in the Kabupaten Malinau dalam Angka (Malinau District in figures) 2004/2005, ‘under normal production processes, coal production would increase annually … from 2001 to 2002 production increased by 31.11 percent. In 2003 production decreased by 19% because the running contract had expired. In 2004 production decreased another 75%’ (Bappeda dan BPS Kabupaten Malinau 2005). Decreasing production is partly due to problems with local communities and partly due to the difficulty of extracting coal along river banks, as well as mismanagement by the operator. Similar to forest exploitation, coal exploitation is now linked to fees, compensation payment and other contributions given to local communities, although there are no data available on the amount actually received.
A third focus to drive economic development, also dependent on the private sector, is oil palm development. Malinau considers

�0 | Towards Wellbeing: Monitoring Poverty in Malinau, Indonesia
itself lucky that a Malaysian company was interested to invest and has signed a Memorandum of Understanding (MoU) accordingly. However, up to September 2007 no oil palm plantation has been established. Oil palm is considered a lucrative business as it is relatively easy to grow and quick producing, and the added attraction is the profit obtained from land clearing activities in forested regions. In fact, in many cases throughout Indonesia, companies often only take the timber and ‘forget’ to plant the oil palm.
Meanwhile, an overarching compulsion by the government is improving access to stimulate economic development. Many villages in Malinau are remote and difficult to reach. Villages on the upper Bahau, for example, can still only be reached by plane or boat. The government is already subsidising flights to remote villages, but is even more keen to construct roads. With limited funds but much forest, Malinau solved the problem of funding road construction by paying the contractors in kind, allowing them to extract timber along the road to be constructed. In this way, it was planned to build some 150 km of road linking the villages of Tanjung Nanga, Long Alango and Pujungan to Malinau town (see Figure 2). Some 50 km was constructed, consisting of old logging roads, unpaved before the logging company abandoned operations as it hit stretches that remained impassable due to the difficult topography. Nevertheless, these roads are already making a difference in people’s view of life.
Still, road construction is a contentious issue. The government sees roads as a basic necessity leading automatically to economic development. Most communities want roads, although some have doubts on the way these are built. On top of that, the Ministry of Forestry considers this process illegal, as it requested the local government of Malinau to stop the contractor constructing the road (Menhut 2004).
With no monitoring, logging along the roads has often exceeded the 1–2 km limit (each side of the road) agreed upon. In some cases, communities were not aware of the agreement and demanded fees and compensation for the timber extracted. There have not been any environmental impact studies and, when the terrain is too difficult, contractors might take the timber and leave the road unfinished. In addition, the implications on maintenance costs and technical expertise have not been adequately considered. Despite various problems associated with road construction, the government is pushing ahead and plans to continue road construction to link all subdistrict towns to Malinau town.
Cifor and PoverTy alleviaTion in malinau disTriCT
What is the status of poverty in Malinau District? As mentioned earlier, different sources give different figures. Until late 2004, Malinau did not produce official data on poverty. One BKKBN report shows that between 1999 and 2002, poverty levels were never below 24%, with the highest level being in the subdistrict of Kayan Hulu (81% in 2000). Figures for 2001 show 76 villages with more than 50% of the households being poor (BKKBN 2001),10 indicating that 58% of all villages in Malinau are poor (Andrianto 2006). In 2000, some 48% of households were considered poor according to the BKKBN standards of basic needs requirement in food, clothing and shelter (BKKBN 2001). The 2003 Poverty Reduction Strategy Document for Malinau uses figures compiled by the Community Empowerment Service (PMD) with BPS input using the national classification of villages in different levels of welfare. According to this document, 127 of the 135 villages existing at that time were considered poor (Andrianto 2006).
In 2005, as a result of pressure to provide figures for poverty to determine levels of subsidy, a district decree stated that the number of poor people in Malinau reached 32,429 people (58.5%), some 4906 of these living in Malinau town (SK Bupati No. 144, 2005).

Malinau District, East Kalimantan | ��
Tabl
e 2.
Cla
ssifi
cati
on o
f vill
ages
per
sub
dist
rict
in M
alin
au D
istr
ict
Subd
istr
ict
Clas
sific
atio
n of
wel
fare
(1)
Popu
lati
onin
200
4 (2
)A
rea
(tho
usan
d ha
) (3)
Swad
aya
Self-
supp
orti
ngSw
akar
yaSe
lf-de
velo
ping
Swas
emba
daN
ot s
elf-
supp
orti
ngTo
tal
Kaya
n H
ulu
72
110
4,01
0
424
Kaya
n H
ilir
31
15
1
,380
1292
Puju
ngan
191
121
3
,183
1155
Mal
inau
Kot
a0
31
4
11,0
3411
47
Mal
inau
Uta
ra23
11
25
6,7
76
2
15
Mal
inau
Bar
at4
11
6
5,4
65
51
Mal
inau
Sel
atan
202
224
6
,317
211
Men
tara
ng
305
136
6
,104
710
Sung
ai B
oh3
10
4
1,6
36
1
57
Tota
l10
917
913
5
45,9
05
42
62
Sour
ce:
1. P
MD
Mal
inau
200
3.
2. P
enda
ftar
an P
emili
h da
n Pe
ndat
aan
Pend
uduk
Ber
kela
njut
an (P
4B),
2004
.
3. B
PS K
abup
aten
Mal
inau
(200
2).

�� | Towards Wellbeing: Monitoring Poverty in Malinau, Indonesia
The Malinau District Statistics reports (Kabupaten Malinau dalam Angka) do not show a figure for poverty, although they include indicators for health service and education.
As mentioned earlier, the three agencies provide different figures based on different indicators and calculations. Thus, it is unclear whether the increase between 2000 (BKKBN 2001) and 2005 (Bappeda dan BPS Kabupaten Malinau 2005) is due to inaccurate statistics, different definitions of poverty, or that poverty has increased since decentralisation. It is also unclear whether and how decentralisation has affected poverty in Malinau. In fact, the status of poverty and wellbeing itself is as yet unclear, while understanding poverty and its underlying causes is essential if local government is to act effectively.
For this reason, the Center for International Forestry Research (CIFOR) and the Government of the District of Malinau represented by the Community Empowerment Service (PMD) agreed to collaboratively implement an action research programme on poverty and decentralisation with the intention to strengthen the government’s capacity and commitment to improve the wellbeing of its people. The overall goal of the project is to support the local government in developing more responsive policies aimed at alleviating poverty and improving the wellbeing of poor people in rural areas, especially in forested areas. To this end, the main focus was on the development of monitoring systems using locally specific indicators, to monitor changes in poverty and the impact of government programmes on poverty and poor people, especially those living in and around forested areas.
The first system is designed to be implemented by government agencies and is based on a formal survey. In addition, a system for community monitoring was developed and tested. Communities are the target and beneficiaries of many government programmes. In many cases,
government programmes aim at improving communities’ conditions or increasing their wellbeing. On the other hand, communities often complain about programmes not meeting their needs or substantially improving their circumstances. It was expected that decentralisation would assist in addressing this problem by increasing the responsiveness of local government due to demand and feedback.
Decentralisation has not automatically solved the problem. Local governance has to be learned and there has been little time. Although, in the 1990s, the Ministry of Home Affairs already developed a manual on participatory village development planning and conducted training in applying the methods, bottom-up planning was never really implemented (Depdagri 1996). The local government also seldom collects information on how far their programmes actually contribute to improving communities’ conditions. Their main concern is upward (financial) accountability in implementation of the programmes. They use physical and financial indicators to measure programme success.
Involving communities in assessing government programmes could provide important information on actual impacts on the target group. Communities are the ones who best know what happens on the ground. It would provide an opportunity for communities to present their views and give them more voice. Their involvement would also add multiple views to the monitoring process and cross-checks government claims. The community feedback on programmes already implemented can assist the government and can feed into government decision-making processes, especially as legal options often exist.
These two monitoring systems were complemented by other research to analyse poverty, poverty causes, and the roles of different agencies and organisations in alleviating poverty.

��
ChApteR 3poVeRtY AnD weLLBeInG: A new ConCept
PoverTy or Wellbeing?
Understanding wellbeing and poverty is the first step to reducing poverty. Meaningful definitions are important in order to identify the causes of poverty, the objectives of poverty reduction, and the scope of what should be done.
Declining poverty means increasing wellbeing. Both terms are interwoven and look at the same problem from two different sides. A broad definition of poverty comes very close to ‘a lack of wellbeing’. So both terms are used almost interchangeably. For instance, people who completely lack wellbeing are in poverty. On the other hand, if people are in a state of high wellbeing, their lives are characterized by prosperity, happiness and satisfaction.
Although this definition is not conventional, it is useful when combining different national concepts and helpful when assessing and analysing various dimensions of poverty. Furthermore, ‘poverty’ often has a negative connotation of passivity, incompetence or backwardness and the use of the term can be offensive or demeaning. The term ‘wellbeing’ allows discussion of poverty in more positive terms. Hence, ‘poverty’ should be read as ‘lack of wellbeing’ and ‘wellbeing’ as ‘reduced poverty’.
PoverTy is more Than loW inCome
For many years, being poor was defined as not having enough money. Many countries continue to measure poverty only in terms of income, consumption or access to services. Even today, one of the most well-known poverty definitions is the poverty line of a minimum income of US$ 1 per day. The World Bank continues to use this standard for its global comparison of poverty (World Bank 2000/01, 2002).
Of course, money is important. It is used to pay for food, medicine and education. But money alone is not sufficient. Families could have enough income relatively, but lack access to healthcare, clean drinking water or formal education. In other cases, a family may have little cash income, but meet all of its subsistence needs. Does this automatically mean that the family is poor?
Since the mid-1980s, poverty concepts have changed from the simple consideration of income or consumption to definitions that include multiple dimensions of deprivation and wellbeing. Today, despite the $1 index mentioned above, leading development organisations like the World Bank and

�� | Towards Wellbeing: Monitoring Poverty in Malinau, Indonesia
UNDP also apply poverty definitions that comprise aspects like basic needs, self-determined lifestyles, choice, assets, capabilities, social inclusion, inequality, human rights, entitlement, vulnerability, empowerment and subjective wellbeing.12
PoverTy and Wellbeing have many dimensions
Poverty is a lack of various things. It may mean a lack of sufficient income to meet household needs or a shortage of assets to provide stability or cope with changes such as the loss of a job, illness or other crises. It may mean that other basic needs, such as health, education or housing, are inadequate. But poverty is also subjective, and may be caused by feelings of, for example, deprivation, vulnerability, exclusion, shame or pain. People can feel poor if their wellbeing declines, or if they compare themselves to others who are better off.
Poverty is most severe when one not only feels poor, but also lacks the means to get out of poverty. Poverty is not only ‘having no fish’, it is also ‘not knowing how to fish’, ‘not knowing where to fish’, ‘not having a rod and line’ or ‘lacking the right to fish’. In addition, often there simply are no fish, because there is no pond, or the pond has dirty water. For many poor people, capabilities, opportunities or the freedom
to escape poverty do not exist: they are trapped in poverty.
To capture all these facets of poverty and wellbeing, a multidimensional concept is necessary. One approach is the Nested Spheres of Poverty (NESP) model (Gönner et al. 2007). In the NESP model, poverty and wellbeing are constituted by different spheres, or aspects of daily life. The central sphere of the model is subjective wellbeing. The core spheres that influence this subjective wellbeing are health, wealth and knowledge. These—and therefore indirectly also subjective wellbeing—are influenced by context spheres. By these we mean nature, economic, social and political aspects of life
Box 2. who is officially poor?
At the global scale, the World Bank and the UN define extreme economic poverty as having an income of less than US$ 1 per day in purchasing power parity. The Human Development Index (HDI) of UNDP (e.g. UNDP 2005) measures three fields: longevity, knowledge and decent standard of living. Longevity is measured by the percentage of people who die before age 40; knowledge is measured by adult literacy combined with the gross enrolment ratio for primary, secondary and tertiary schools; and standard of living is measured by real GDP per capita. The Human Poverty Index (HPI) uses the same fields, but measures standards of living in terms of access to safe water and healthcare, and by the percentage of underweight children younger than 5 years.
In Indonesia, including Malinau, the poor are defined by poverty lines of 2100 kCal of daily food consumption (plus non-food consumption) equalling about Rp 136–150,000 of monthly per capita consumption (BPS). Wellbeing was defined by BKKBN using five ‘prosperity’ (kesejahteraan) strata using a basic needs approach. Families living in the ‘Pra Sejahtera’ stratum were considered as extremely poor, those in ‘Sejahtera I’ as poor (Cahyat 2004).
Figure 4. Nested spheres of poverty (NESP).
SWBWealthHealth
Knowledge
Natural
Sphere
EconomicSphere
SocialSphere Politi
cal
Sphere
Infrastructure
Services

Poverty and Wellbeing: A New Concept | ��
The core of the model includes ‘basic needs’, such as food, health, housing and education. It also comprises general individual capabilities (i.e. skills and physical condition) to get out of poverty. In the NESP model, basic needs and individual capabilities are aggregated into three categories: health, adequate wealth and knowledge (both formal and informal or traditional). The core is also what most local people in the Indonesian study expressed as the principal aspects of poverty. Together with subjective wellbeing, it is a good measure of the poverty or wellbeing of a household.
The context consists of five spheres. The natural sphere includes availability and quality of natural resources. The economic sphere covers economic opportunities and safety nets. Social capital and cohesion, but also trust and conflicts make up the social sphere. The political sphere comprises rights and participation or representation in decision making, empowerment and
that directly or indirectly influence the core spheres. The context spheres, in turn, are influenced by external infrastructure and services.
Graphically the NESP idea can be represented as a series of concentric circles (see Figure 4). The centre is formed by subjective wellbeing (SWB), surrounded by core aspects of poverty, including basic needs, and the context that enables the poor to escape from poverty.
Subjective wellbeing (SWB) is highly individual and emotional. It does not have a constant value, but varies with moods and circumstances. People compare their standard of living with that of others or with their own prior wellbeing. Personal feelings of happiness, safety, inclusion and contentedness also contribute to the overall subjective wellbeing. It also includes other forms of wellbeing like bodily wellbeing, social wellbeing, having self respect or feeling safe and secure.
Degradation of natural sphere (Photo: Stefan Seitz)

�� | Towards Wellbeing: Monitoring Poverty in Malinau, Indonesia
freedom. The outer layer of the NESP model is the fifth sphere, which influences the other four: services and infrastructure, often provided by government agencies, NGOs, development projects or the private sector. The context is the enabling environment for supporting self-driven attempts to escape poverty.
The categories presented in the NESP model are intentionally comprehensive. For any given setting, a local government may wish to define the spheres and their indicators according to their own priorities.
PoverTy is dynamiC
The dynamics and causal links between the spheres of poverty is reflected by the different layers of the NESP model. Subjective wellbeing has a very momentary nature. It often fluctuates due to many influences. But subjective wellbeing is also correlated with the combined core aspects. Hence, improvement of core wellbeing generally leads to improved subjective wellbeing. By the same token, low wellbeing in the core usually means low subjective wellbeing.
On a longer time scale, both core wellbeing and subjective wellbeing are influenced by the context. For instance, knowledge increases as a result of improved education, health problems grow because of environmental pollution, subjective wellbeing declines due to social conflict. Hence, there is a strong causal link from the outside towards the centre.
Successful poverty reduction needs to address the dynamics of poverty. Sustaining
wellbeing means creating opportunities and ‘freedom for development’ (Sen 1999) for people, but it also means reducing vulnerability to prevent people from falling (back) into poverty and becoming chronically trapped.
Trade-offs beTWeen PoverTy sPheres
In many cases, economic development is not sustainable and comes at the expense of the natural or social sphere. Such trade-offs become easily visible in the NESP representation and can optically alert decision makers. Figure 5 shows an illustrative example from a village in Kutai Barat where the positive economic sphere is accompanied by a critical natural sphere, critical health, wealth and subjective wellbeing.
Figure 5. Trade-offs among wellbeing spheres.
I & S
K
HW
PS
EN
SWB

��
ChApteR 4methoDs
Our basic assumption is that through systematic monitoring, local government officials would be able to better address poverty issues. This project has therefore focused on designing, developing and implementing a poverty monitoring system using a participatory learning approach. This has meant that each step of the process was done with extensive consultation and collaboration with the local government partners.
Malinau and Kutai Barat were selected as examples of forested areas where large numbers of people increasingly depend on the actions of local governments. Both also exemplify the new style district formed after decentralisation and developed as autonomous districts with full mandates for their development, including poverty alleviation and the provision of basic services. A monitoring system would provide relatively fast and accurate information on the impact of local government efforts.
However, such a monitoring system would be effective only if locally specific indicators could be developed and used. Thus, one key activity was the development of such a set of indicators agreed on by all stakeholders. In the process, Kutai Barat was ahead of Malinau; consequently, the Malinau
monitoring system build on the experiences in Kutai Barat.
While the formal monitoring system is based on a formal survey carried out by trained government staff, the community monitoring system is designed for use by communities facilitated by government staff, preferably at subdistrict level, and based on more informal focused discussion groups. The resulting monitoring systems would show the causes of poverty, the effectiveness of local government programmes, and how to better target efforts. In addition, the project would also develop additional tools to help local governments develop, implement and evaluate programmes to improve the wellbeing of poor, forest-dependent people.
Several other studies informed the process and provided supplementary information on the different aspects and perceptions on poverty. Agus Andrianto (2006) did a study on the role of district government in poverty alleviation using case studies in Malinau and West Kutai, which included a survey on perceptions of poverty among various officials.
Erna Rositah (2005) did a study on poverty in rural forest communities in Malinau, and

�� | Towards Wellbeing: Monitoring Poverty in Malinau, Indonesia
Oding Affandi (2005) looked specifically at decentralisation policies and their impact on the livelihoods of forest communities. Included in his study was a specific look at the IPPK and IUPHHK policies of the district during the early decentralisation period.
Using our NESP conceptual model, an approach to monitoring of poverty was developed. The development of the
monitoring systems was conducted in eight main steps. Each step involved difficult consultations and discussions with the local government. Although local government’s mandate includes alleviation of poverty, their interest and goals were not necessarily in line with ours. In addition, the local government is tied within a bureaucratic structure and we were often not able to synchronise our (CIFOR’s) schedule with theirs.
Table 3. Project activities in Malinau May 2003 to April 2007
Activity Date(s)
Official start of the CIFOR–BMZ Poverty and Decentralization Project May 2003
First official contact between CIFOR and Malinau Jun 2003
Compiling poverty data Aug–Dec 2003
First workshop on poverty alleviation activities and poverty definitions in Malinau
Oct 2003
Analysis of local government organisation (structure, budgeting, monitoring system, etc.)
Sep 2003 to Feb 2004
Baseline survey in 14 poor villages and data processing Oct–Dec 2003
Meeting of CIFOR team and Bupati with signing of MoU Oct 2003
Compiling Malinau data (local regulations, budget, forestry trends, etc.) Nov 2003 to Mar 2004
Preparation of village profiles Feb–May 04
Annual meeting of the Indonesia team in Bogor Apr 2004
Development of the NESP poverty and wellbeing concept Apr–Aug 2004
Initial discussion on local adapted poverty indicators Sep – Nov 2004
Workshop on results of baseline survey and monitoring concept Dec 2004
Workshop to develop monitoring system Mar 2005
Annual meeting of the Indonesia team in Bogor Mar 2005
Basic statistics and SPSS training of monitoring team Mar 2005
Training of monitoring team May 2005
First monitoring trial May 2005
Second training of monitoring team July 2005
Second monitoring trial July 2005
Data entry training July 2005
First trial for community monitoring July–Aug 2005
Analysis of monitoring trial data Nov 2005 to Mar 2006
Annual meeting of the Indonesia team in Bukit Bangkirai Mar 2006
Second trial of community monitoring July–Aug 2006
Preparation of final site report Nov 2006 to Feb 2007
Project closing Apr 2007

Methods | ��
The eight steps are as follows:1. Laying the groundwork: a
multistakeholder workshop involving local government and NGOs.
2. Baseline survey. Together with local government staff a baseline study was conducted in 14 villages in Malinau and 20 villages in Kutai Barat.
3. Establishment of a monitoring team at District level and development of a monitoring system.
4. Development of indicators and questionnaires.
5. Testing the system in the field.6. Data entry and analysis.7. Development and testing of a system
for community monitoring. 8. A final step would be mainstreaming
monitoring for poverty in the local government’s routine programme.
The complete list of activities is shown in Table 3. The implementation of each step and its results are briefly reported in the following section, while the substantive results of the survey are presented in Part 5. For more detailed information, please refer to the published products listed in Annex 1.
mulTisTakeholder WorkshoP
The project started with a workshop on ‘Decentralization and Poverty’ held in Malinau and attended by representatives from the following agencies (mostly district based):
Forestry and PlantationHealthCommunity Empowerment ServiceThe economics section within the District OfficePlanningThe public relations and protocol section within the District OfficeIndustry, trade and cooperativesNational Statistics Agency (BPS)EducationWWF Kayan MentarangThe Forum for Indigenous People (FoMMA)
••••
••
•••••
Community representativesCIFOR.
The workshop was intended to explore local perceptions about poverty and the role of local government in dealing with poverty issues. Unfortunately, most of the participants were government officials and the voices of the two or three community representatives were drowned in government perceptions. Three main questions were discussed: What are the causes of poverty? Who are the stakeholders interested in or influencing poverty? How should we measure the effectiveness of efforts to alleviate poverty?
Participants grouped the different causes of poverty under three headings:
Lack of work ethics and motivation of communitiesLow awareness and interest in educationLow competitiveness.
Aware of its generality, participants agreed on the need for further study, especially with regard to the interlinkages between factors. This was emphasised by the vice head of the district in his opening speech, where he also stated the need to consider the impacts of government policies.
The workshop reflected the perception of government officials on how poverty is a problem of and with the people and the need for it to be solved by the local government. The main roles in alleviating poverty are assigned to the District head (Bupati), District Assembly (DPRD), Assistant II, Community Empowerment Service (PMD) and District Planning and Development Agency (Bappeda). The Bupati is seen as being the centre and having the highest stake—the ultimate responsibility for the district’s performance in poverty alleviation as well as general governance is with the Bupati. However, the positioning of the Bupati as a central figure is also an outcome of others not wanting or being afraid to take responsibility. It is also a general effect of regional autonomy. In an autonomous
••
•
•
•

�0 | Towards Wellbeing: Monitoring Poverty in Malinau, Indonesia
district, the Bupati makes the final decision. Consequently, the person of the Bupati, his vision and way of working have tremendous influence on the way a district develops. Unfortunately, this also meant that the poor communities are considered least important in the decision making process.
In discussing the role of government programmes, the lack of coordination was obvious. Most officials were only aware of poverty alleviation programmes in their own sectors and even then only the part they were personally involved in. Nobody seemed to know the complete district programme, even less its effectiveness or the standards against which to measure it. Nevertheless, all participants agreed that there is need for coordination and measuring the outcome and impacts of the programmes. Participants then suggested a long list of indicators, but no agreement on local specificity was reached.
The workshop produced two main results: awareness of the importance of discussing poverty issues, and support for the subsequent activities. At the end, there was also general agreement that poverty comprised several dimensions: basic needs (clothing, food and shelter), sociocultural needs (education, technical skills) and a structural dimension formed by development policies (roads and markets).
The workshop also resulted in a first list of indicators. For the most part, these referred to BKKBN and BPS indicators, while sociocultural indicators were under-represented.
baseline sTudy
The baseline survey was conducted in November 2003 in order to gain an up-to-date overview of the state of wellbeing in Malinau, the status of poverty and local perceptions of poverty. There were three parts: (1) a survey on household conditions, (2) interviews with key respondents, and (3) focus group discussions.
Samples were selected from the 76 villages where more than 50% of the households were identified as being poor according to BKKBN data of 2001,13 making sure of proportional representation of different ethnic groups and geographic distribution (based on distance from Malinau town), as well as larger and smaller villages.
Between 30% and 50% of households were sampled, with a minimum of 10 households in villages with less than 20 households. From the 14 villages surveyed, only Pelancau (19 households sampled) and Long Uro (13 households) could be considered large villages. In the other villages, 10 households were interviewed. In addition, we also interviewed key informants, namely:
Customary leaderVillage HeadHead of the Village Representative BodySchool headOne poor householdOne medical technicianA small shop owner.
Adjusting to the different situations in each village, these key respondents were sometimes replaced by other key respondents who were also considered knowledgeable.
After the individual interviews, in each village focus group discussions were held, involving groups of local elites/leaders, regular villagers and women, to gain an insight into the local perception of poverty.14
The main questions referred to local community perceptions of poverty and aspects affecting poverty or wellbeing. At the same time, this survey comprised an initial experience with developing questionnaires covering the multifacetted aspects of poverty in forested areas.
The survey team involved three government officials from the Community Empowerment Service and BPS, two NGO staff (Yayasan Adat Punan and BIOMA), two people from local communities and
•••
••••

Methods | ��
three CIFOR staff. Experience from implementation provided some important lessons for future work:
Implementing proper sampling methods was difficult because many respondents were not home, were unable or refused to be interviewed;Finding the right timing is difficult—for rural people, the survey should be conducted during the off-season; involvement of government officials will depend on their schedules, especially if various services are involved;Survey needs to be based on accurate (and up-to-date) information on accessibility;Involving government staff requires payment of honorarium in accordance with government standards;Respondents are increasingly tired of being surveyed.
The analysis was done by CIFOR and the results have been written up (Limberg et al. 2005). The most obvious result was the expressed need by people for increased and improved market opportunities. People
•
•
•
•
•
recognised that increased economic welfare would enable them to address other aspects of wellbeing.
esTablishmenT of a moniToring Team aT disTriCT level and develoPmenT of a moniToring sysTem
The monitoring team will consist of officials from different government agencies (including both senior and field staff). The district secretary (Sekda) will oversee the team, while the Community Empowerment Service (PMD), Bappeda and local branch of BPS will take leading roles in implementing different parts of the programme. The district Poverty Alleviation Committee (KPK) will serve to coordinate efforts among all agencies.
The suggested monitoring system is illustrated in Figure 6. Local government’s support for this monitoring system has been mixed, some government officials are strong supporters, others are opposed. This has
Figure 6. Design of poverty monitoring system in Malinau District, division of responsibilities and implementation.
Coordinatingdata
collection
Data collectionin the field
Community EmpowermentService (PMD)
(as secretariat of KPK)
District Secretary(as head of KPK)
Presentation of result topolicy makers
Field coordinator
Supervisor
Enumerator
Bappeda/BPS
Data entry(trained personnel)
Data analysis
Meeting of KPK
Head of Bappeda+ KPK
Coordinatingdata analysis
Results ofdata entry& analysis

�� | Towards Wellbeing: Monitoring Poverty in Malinau, Indonesia
resulted in some delays in implementation. In addition, the programme has been hampered by turnover of staff.
Three steps will be necessary for the monitoring system to be successful:1. Field data collection2. Analysis3. Policy makers’ use of data in making
decisions.
Field operations will be supervised by a field coordinator from PMD or KPK, with teams consisting of three enumerators and one person to check results. Staff will be recruited individually from village and kecamatan (subdistrict) levels, as well as from those available in Malinau (staff from the district, subdistrict, agricultural extension workers, statistics field workers, medical technicians, women’s organisation, health support posts and consultants). Trainers will be lead by PMD/KPK with Bappeda providing assistance on the substance of the questionnaires and BPS on statistical techniques and field methods. CIFOR will assist in the early trials.
Like the government-established poverty alleviation committee before them, this team experienced the problem of lack of coordination and cooperation across sectors. The KPK established by official decree was not effective, even less a poverty monitoring field team with no formal recognition. Despite the stated commitment by the district government (with an MoU), the monitoring team was never formally established, and therefore lacked the authority to operate effectively. Another major problem was the reliance on one champion within the government, who unfortunately passed away.
indiCaTor develoPmenT and drafTing of The QuesTionnaires
Development of the indicator set was done in several stages to result in 25–35 locally specific indicators. A long list was produced based on results from the October
2003 workshop, discussions with local government (December 2004), discussions during a workshop in March 2005, the set of indicators used in the baseline survey and the set produced in Kutai Barat. These were then compared with government standards set out in AKU, ABK and RPJM.
Twenty-five indicators used in the first trial in Kutai Barat were further discussed in small groups during the March 2005 workshop. Table 4 summarises recommendations drafted by each group. A next step is to link these to the planning process (ABK, Renstra) and make sure that all sectors are equally represented. Questions based on these indicators were further developed by CIFOR, including the assignment of weights, and submitted to the team for comments, improvements and approval.
Additional indicators proposed were:19. Access to Malinau town (road condition and public transport) 20. Use of TV/Radio/newspaper/Letters from local government (2+3)21. Health clinics and its services (1)22. Toilet (2+3)Access to junior high school (< 1 hour) (combined with indicator 11 in table)23. Infant and mother mortalitySchool attendance (combined with indicator 11 in table)24. Area of productive and unused land (agricultural production) Consumption: carbohydrate, protein, vitamin (combined with indicator 1+2 in table) 25. Clothing: number of new clothes purchased annually.
The district government has long recognised the need for locally specific indicators. Government officials often quoted the inappropriateness of dirt floors used in national surveys as an indicator of poverty, since all local houses are built on stilts. In the survey to identify poor people entitled to free health insurance (2005), some of the indicators developed in our project were included. However, indicators for the social and natural spheres were deemed irrelevant
•
•
•••
••
•
•
•

Methods | ��
Table 4. Locally specific indicators recommended by the Malinau monitoring team†
No. Indicator GroupI
GroupII
Group III Remarks
1 Protein consumption Yes Yes Yes Combine 1 and 2* Consumption of carbohydrates, protein and vitamins
2 Lack of staple food (rice or protein)
Yes – Yes
3 Serious illness of household member
? Yes Yes
4 Condition of housing Yes Yes Yes (2) Differences exist between urban and rural area
5 Assets (motorbike or outboard engine)
Yes Yes Yes (2) Outboard engine in rural areas /motorbike in urban areas
6 Material assets (chainsaw or refrigerator)
Yes Yes Yes (2) Chainsaw in rural areas
X 7 Fear (of violence or criminality)
Yes – –
8 Subjective wellbeing Yes Yes – * included
X 9 Self esteem Yes – – (1) self respect
10 Formal education of adults Yes Yes Yes (1) delete formal
11 Education of children Yes Yes Yes (1) availability of books, teachers; (2) availability of infrastructure
12 Informal knowledge of household members
– Yes Yes * included
13 Forest condition Yes Yes – Asked at village level(2) Urban environment (pollution), * differentiate between urban and rural
X 14 Extreme exploitation of resources
Yes – – Measured at village level (3)?
X 15 (biodiversity) Presence of hornbills
– Yes – Measured at village level (3)?
16 Level of self help Yes Yes – Measured at village level (3)?
X 17 Mutual trust – – – Measured at village level (3)?
18 Conflict resolution Yes Yes – Measured at village level (3)? (2) conflict intensity
19 Alternative sources of income
Yes Yes Yes
20 Investments Yes Yes Yes (2) assets: orchards, rice huller, second house
21 Savings Yes – Yes * owns goods that are easily converted into money
22 (Economic security) availability of rice
Yes Yes Yes (3) + (2) + (1) ease to obtain basic goods (2) + include cassava
23 Participation in village decision-making process
? – Yes * To be included in first trial
24 Feeling of secure land tenure
Yes Yes – * To be included in first trial
X 25 Use of local regulations Yes – –
† 3 groups discussed the proposed indicators and indicated their approval or disapproval and suggested additional indicators.X = indicator not used.Source: Field data.

�� | Towards Wellbeing: Monitoring Poverty in Malinau, Indonesia
to wellbeing or too difficult to measure. Also not everybody agreed to the need to include subjective wellbeing.
At the same time that the project developed the set of indicators, several government efforts to address poverty were also under way. Unfortunately the two activities could not be coordinated. The approach used by the research team to produce the final indicator set was time consuming, using participatory approaches and considering scientific rigour to develop indicators that are representative and link to poverty aspects. The district government was faced with the immediate need to produce a list of poor people, and could not or was not willing to wait for the development of the indicators as required by the project. Another problem was the fear of the district government that the use of different sets of indicators would create conflicting figures on poverty level, which shows how political poverty is.
Trials
Two trials were conducted to test the poverty monitoring system and indicator set. The first was conducted in May 2005. The survey was preceded by a training session involving the whole survey team of 13 officials from five agencies and three subdistricts. All of the questions were discussed in depth to make sure that all team members had the same understanding of their meaning.
Discussions also included the level of sampling. In the end, it was decided to conduct the first trial in 9 villages in 5 subdistricts (Annex 2) interviewing at household level. For villages with fewer than 50 households, a minimum of 10 households was to be sampled (i.e. 20%). For this first trial, 149 households were interviewed.
The sampling procedure was difficult to follow rigorously. In one village, all of the inhabitants were out in the fields; in another village some people refused to be
interviewed. Sometimes, one house was inhabited by 2–4 households who might share a kitchen.
The interviewing itself faced problems of raising expectations of subsidies, language barriers and the fact that often only the head of household was willing or able to provide the requested information.
A second trial was conducted in July 2005, covering 18 villages in 8 subdistricts, excluding Malinau town (Annex 3). A 2 day preparatory training course was held to accommodate some replacement and additional members to the team. A total of 334 interviews were conducted.
Some delays occurred with the interviews in the subdistricts Malinau Barat and Malinau Utara, because the subdistrict staff were also occupied with other tasks. In addition, the number of households was larger (Malinau Barat 63 households, Malinau Utara 87 households). The quality, however, was the best.
The indicator list was not changed significantly between the two trials. The team edited a number of questions, however, to increase the clarity and ease of interviewing. Though the second trial was more ambitious and covered more villages and households, difficulties in reaching the remoter areas resulted in their exclusion. Also, due to the change in leadership within the district planning agency, the second trial was not analysed by staff of the planning agency.
Improvements compared to the first trial were noticeable. The number of questionnaires filled in without mistakes improved from 22% to 34%. Incomplete questionnaires decreased from 1.4% to 0.4%. However, other kinds of errors (such as circling one answer but writing down another) increased, suggesting more training needed in these areas.
The implementation of the two trial surveys did not encounter any technical problems.

Methods | ��
Training and trials proved to increase capacity, resulting in better quality data. Implementing a survey involving staff from different services is possible when facilitated by an outside party, but when initiated from within the district government it faces several obstacles, e.g. habit of sectoral approach, hierarchy, problem of coordination.
daTa enTry and analysis
The original plan was for BPS to oversee data entry and checking and, together with Bappeda, to take lead responsibility for the analysis. KPK was also to have input. To aid the process, CIFOR would provide a customised form using SPSSX and training in SPSS would be provided.
Analysis would include determining:Poverty level of families, villages, kecamatan and districtWho is poor: what are the features of poor families and villages? Features of poverty: by sector, core and context: including averages, ranges, distribution (frequency) Relationship of programmes and their targets to poverty levels and featuresRelationship of programme budgets to poverty levels and features.
An effort will be made to look not just at physical targets, but also at the quality of programme outcomes and impacts on families.
Data quality will be maintained through:Nightly field checking by the team checker during village visitsReview of questionnaires (checked twice) by data enterer5% of questionnaires’ data entries will be checked after the completion of all data entries.
To aid future work by local government, training on the use of SPSS statistical software package was held in Bogor in May 2005. The training involved one Bappeda staff, one from PMD and one from the
•
•
•
•
•
•
•
•
Agency for Population, Civil Registration and Labour. In July 2005, CIFOR staff worked together with these three staff to enter data and start with the analysis.
Unfortunately, by July the staff were occupied with their main tasks and interest had waned. Replacement staff were insufficiently trained and the CIFOR staff were consequently forced to provide additional training. In the end, CIFOR did most of the data entry and analysis. Because the consultant then took another job, analysis was delayed by a full year and the local government has been only marginally involved.
Meanwhile, the plans for a full survey funded and implemented by the local government as a first step towards routine monitoring has been put on hold because of lack of budget. Instead, the government was willing to provide a (smaller) budget for poverty mapping.
CommuniTy assessmenT of loCal governmenT Programme imPaCT
As an additional approach, we developed a community assessment of government programmes for community development and poverty alleviation. Communities are the target and beneficiaries of many government programmes. In many cases, the programmes aim at improving communities’ conditions or increasing their wellbeing. On the other hand, communities complain about programmes not meeting their needs or improving their circumstances substantially. It was expected that decentralisation would assist in addressing this problem by increasing the responsiveness of local government due to demand and feedback.
This paradigm shift does not automatically solve the problem. Local government officials have little experience with bottom-up planning. In Indonesia, the department of interior affairs has developed a manual on

�� | Towards Wellbeing: Monitoring Poverty in Malinau, Indonesia
participatory village development planning and conducted training in applying the methods. However, the method is not widely implemented as it takes more time than the conventional method of planning by requesting proposals for village heads. Local government also seldom collects information on how far their programmes actually contribute to improving communities’ conditions. Their main concern is upward (financial) accountability in implementation of the programmes. They use physical and financial indicators to measure programme success.
Involving communities in assessing government programmes could provide important information on impacts on the target group, since communities are the ones who best know what happens on the ground. It will provide an opportunity for communities to present their views and it gives them more of a voice. Their involvement also adds multiple views to the monitoring process and cross-checks government claims. Community feedback on programmes already implemented can assist the government and feed into
government decision-making processes, especially as legal options often exist.
The possibility of monitoring by communities as an alternative mechanism for feedback on impact of government programmes on poverty, was discussed on several occasions with the government. A first trial was directly implemented by the government data-collection team in July–August 2005. A simple matrix developed with the local government monitoring team was used. This matrix had the government sectors most important to community development on one axis and the impact on important aspects of wellbeing according to local perception on the other (see Figure 7). The idea was that the village leader, possibly with some other informal leaders, would fill in the matrix after receiving a brief explanation from government staff. This approach was too ambitious. Eventually, the government staff assisted the village leaders in filling in the matrix. Despite the involvement of district and subdistrict officials, the results of the trial were encouraging.15
SouRCE IMPACT
SECToR Project
Gov
ernm
ent
Priv
ate
sect
or
Inco
me
Hea
lth
Tran
spor
tati
on
Ava
ilabi
lity
of
good
s
Info
rmat
ion
&
com
mun
icat
ion
Cohe
sion
wit
hin
com
mun
ity
Har
mon
y w
ithi
n co
mm
unit
y
Education 1 Free school uniforms
2
3
4
Health 1 Health insurance
2 Immunisation
3
4
Figure 7. Example of matrix used for initial trial of community assessment of development programmes

Methods | ��
This approach had mixed results, but proved that to obtain credible results community monitoring should be more independent of local government, although it eventually feeds into local government system. An alternative approach has been tested by focus group discussion facilitated by a CIFOR team using similar forms.
The CIFOR team conducted a second trial using small group discussion in two villages. The same matrix, but enlarged, was used, enabling all participants of group discussion to contribute. An open voting system was used with small cards (positive, neutral and negative). Villagers were aware of the ‘social pressure’ to conform with the opinion of (informal) leaders and suggested to use a closed voting system.
On the basis of these two experiences and more discussions on data collection methods, a final trial was conducted to test two methods: focus group discussion facilitated by subdistrict staff (in 4 communities), and facilitation of focus group by village head (in six communities). Afterwards the matrix was simplified, still using the same government sectors but asking only about the implementation and impact of the programmes (see Table 5).
The subdistrict staff facilitated three groups in each community: village leaders, women, and youth. For the second method, the guidelines were distributed to village heads and it was suggested that they facilitate one focus group with representatives of village leaders, women and youth.
For the individual projects, the participants scored the implementation and the impact by using small cards. The score cards consisted of ‘+’ (positive/good implementation or impact), ‘0’ (neutral) and ‘–’ (negative/bad). Although participants were typically sitting close to one another on the floor, cards were turned upside down to enable secret voting. The votes were then counted and written in the matrix. Once votes were obtained for implementation and impact of a given project the participants were asked for comments.
After initial reluctance by the subdistrict staff, they took on their role well and were able to facilitate the process. The presence of subdistrict staff did not influence participants’ confidence to give their opinion. The subdistrict staff did to some extend try to influence voting, but not only towards positive answers. In known cases of bad or failed programmes, the subdistrict staff tended to emphasise the project’s failure. As the subdistrict staff had no role in project implementation, they could put the blame on the district-level agencies. Observation showed that their attempts to guide groups towards positive or negative answers did not necessarily influence the voting—in some instances the answers were indeed mainly positive or negative but on other occasions votes were mixed.
At present, within the Indonesian Government structure, the subdistrict government is basically a liaison office, with limited authority or direct involvement in projects. Thus, villagers might feel that
Table 5. Simplified matrix used in final trial community assessment of government programmes
Sector Project Source Implementation Impact Remarks
e.g. Education e.g. free school uniforms
Health care
Source: Field data.
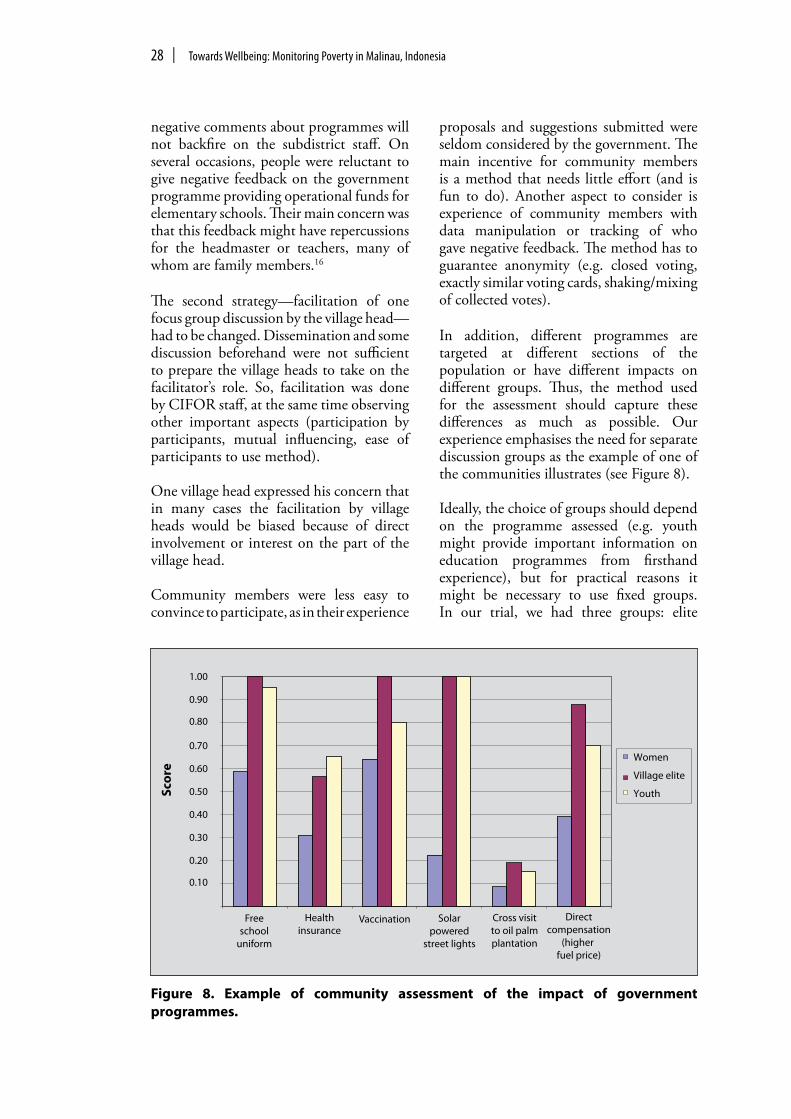
�� | Towards Wellbeing: Monitoring Poverty in Malinau, Indonesia
negative comments about programmes will not backfire on the subdistrict staff. On several occasions, people were reluctant to give negative feedback on the government programme providing operational funds for elementary schools. Their main concern was that this feedback might have repercussions for the headmaster or teachers, many of whom are family members.16
The second strategy—facilitation of one focus group discussion by the village head—had to be changed. Dissemination and some discussion beforehand were not sufficient to prepare the village heads to take on the facilitator’s role. So, facilitation was done by CIFOR staff, at the same time observing other important aspects (participation by participants, mutual influencing, ease of participants to use method).
One village head expressed his concern that in many cases the facilitation by village heads would be biased because of direct involvement or interest on the part of the village head.
Community members were less easy to convince to participate, as in their experience
proposals and suggestions submitted were seldom considered by the government. The main incentive for community members is a method that needs little effort (and is fun to do). Another aspect to consider is experience of community members with data manipulation or tracking of who gave negative feedback. The method has to guarantee anonymity (e.g. closed voting, exactly similar voting cards, shaking/mixing of collected votes).
In addition, different programmes are targeted at different sections of the population or have different impacts on different groups. Thus, the method used for the assessment should capture these differences as much as possible. Our experience emphasises the need for separate discussion groups as the example of one of the communities illustrates (see Figure 8).
Ideally, the choice of groups should depend on the programme assessed (e.g. youth might provide important information on education programmes from firsthand experience), but for practical reasons it might be necessary to use fixed groups. In our trial, we had three groups: elite
Figure 8. Example of community assessment of the impact of government programmes.
0.10
0.20
0.30
0.40
0.50
0.60
0.70
0.80
0.90
1.00
Scor
e
Women
Village elite
Youth
Freeschool
uniform
Healthinsurance
Vaccination Solarpowered
street lights
Cross visitto oil palmplantation
Directcompensation
(higher fuel price)

Methods | ��
men, women, and youth. As in general youth involvement in community affairs is limited, we recommend including one group of nonelite men as they have direct involvement and interest in programmes.
Simple presentation will increase the user friendliness of the results. However, care has to be taken that results are not overinterpreted. For example, the votes (positive, neutral and negative) can be converted into a score, or expressed as a percentage. Some programmes are implemented in many communities, so the scores could be compared across communities or an average for that programme produced. Although a score is attractive, the remarks during the discussion about the programmes are equally important, as they provide clues for improvements.
Some comments might be very specific, but consistent patterns may be observed. These observations can assist in improving these programmes that are implemented in many communities (increasing efficiency and effectiveness). In our case, two major problems identified with government programmes were a lack of information about the programme and lack of follow up (e.g. providing planting or livestock breeding material without technical assistance).
mainsTreaming The sysTems
The final step of mainstreaming the monitoring systems is still in progress, with mixed results as it is very much dependent on the local political setting. In Malinau, at one stage local government partners submitted a budget request of Rp 600 million for full-scale monitoring in 2006, of which only Rp 40 million was approved. In 2005, however, the national programme for providing subsidies to compensate for fuel price increases forced the government to ‘quick and dirty’ determination of poor people. In May 2005, the government passed a decree adopting a set of indicators proposed by Community Empowerment
Service (PMD) and, based on these indicators, 32 429 people were declared poor by a decree of June 2005 (SK Bupati No. 144, 2005). Thus, officially 59% of Malinau’s population is poor and is therefore eligible to receive health insurance for poor people. Thus, while we are pleased at the attention to poverty levels and the project’s efforts appear to have supported the design of the indicators used, the poverty level has now been ‘fixed’ by the districts and efforts to produce scientifically based numbers are being undermined.
Meanwhile, with the small budget made available, the focus of activity changed to poverty mapping. However, a new effort was made to apply for a budget for full-scale poverty monitoring in 2007, again without success. In Kutai Barat, the district allocated Rp 600 million to implement a district-wide census using the poverty indicators, although in the end the budget was not sufficient and the survey was conducted in all villages based on 30% sample.
One way of mainstreaming the results of the project was through annual workshops involving local government officials. An initial workshop on perceptions of poverty and wellbeing was held with the district government in September 2003. Annual meetings including representatives of DPM/PMD and the monitoring team were held in March–April 2004, March 2005 and March 2006. These meetings were mainly used for reviewing project progress and refining the conceptual framework.
Why Was PoverTy moniToring noT adoPTed?
At beginning of the process in 2003, poverty was not yet a high-profile issue, although performance of local government was judged on reduction of poverty among other things. Due to outside attention to poverty (international pressure, PRSP, MDGs; national pressure, PRS, economic impacts of decrease of fuel subsidy), this attitude quickly changed. Poverty became

�0 | Towards Wellbeing: Monitoring Poverty in Malinau, Indonesia
a tool for local governments to obtain additional funding through poverty alleviation programmes. This provided perverse incentives for both government and local people to declare themselves poor: poor districts, poor villages, poor households/people. Poverty monitoring is only possible if poverty is apolitical.
To have an impact on poverty alleviation efforts, cooperation with local governments is essential. However, cooperation is not easy. In the case of Malinau, the local government is newly established and uncertain or unclear about its role; it has inherited a strong sectoral approach and rigid bureaucratic way of working (despite new opportunities provided by political reform). The initial assumption that political reform provided many opportunities to develop appropriate, creative strategies and programmes to address locally specific causes of poverty was too optimistic. In practice, the old hierarchical, bureaucratic system is still in place. People have little or no experience with other forms of government, so they are more comfortable to continue in the old ways. In such situations, change can occur when championed internally. In Malinau, such a champion was found in the figure of the head of the Community Empowerment Service. With his support, the project had a good start. Later, this official was transferred to the Planning Agency, which was even better for the project. Unfortunately, at the
moment that his influence was most critical, he passed away and his replacements in both offices were less strong and supportive.
Any poverty alleviation effort has to be linked to government planning. However, there are limited incentives for the local government to invest in good planning, as often the final decisions are beyond their control. Although with decentralisation districts are autonomous, local revenue constitutes only a small proportion of the district budget. Malinau remains highly dependent on the national government and, although slowly improving, budget allocation is still mainly decided by the national government.
Although the monitoring system was not adopted completely, there have been several positive impacts. First, capacity building for the staff involved. The activities and discussions have resulted in increased awareness that poverty is multifaceted and needs a cross-sectoral or holistic approach. There has been an increased understanding on the need for locally specific indicators. On one occasion some of the poverty indicators developed were adopted in a government survey.
And finally, field activities have increased knowledge and firsthand experience with conditions in the communities and their concerns regarding poverty alleviation.

��
Earlier it was mentioned that more than half of Malinau’s population is officially poor. While the poverty monitoring surveys in eight subdistricts17 do not define a poverty level, the results show that people do perceive themselves as being poor. Despite the efforts to understand poverty as a totality of the different spheres, poverty is felt most in the economic and material spheres. Table 6 presents the information of the two poverty monitoring surveys. The most conspicuous result is that the index for the economic sector is perceived as critical in all subdistricts except S. Boh.18 In the baseline survey, villagers stated that they perceived lack of capital (savings or productive assets) and low produce prices (limited income generating choices) as important factors contributing to poverty. Kayan Hulu and Malinau Barat are the least well off, with five of the nine indices being in critical condition.
Surprisingly, the score for the natural sphere is also low, despite the fact that some 90% of the area is still forested area (good quality logged forest or primary forest). The lowest scores are for the three subdistricts nearest the district capital (Malinau Selatan, Malinau Utara and Malinau Barat). Logging
ChApteR 5the stAtus of poVeRtY AnD weLLBeInG In mALInAu
started in these areas and, especially during the latest small-scale logging boom, all logging has been concentrated in these areas. It is more difficult to explain why people in the Pujungan, Sungai Boh and Kayan Hilir subdistricts rate the natural sphere as intermediate. These three subdistricts have the smallest populations and lowest population density, and limited or no logging going on. The scores indicate peoples’ perception of the degradation of the natural resources (especially timber) due to the rapid exploitation in 2000–2003. Although compared to other areas, forest resources in most villages are still abundant.
Influence of distance and travel difficulties does not affect all aspects equally. The three remotest subdistricts (Sungai Boh, Kayan Hulu and Kayan Hilir) have the lowest score for the health sector and perceive this as being in a critical (bad) condition (Table 6). In the knowledge sector, three of the four remotest subdistricts (Pujungan, Kayan Hulu and Kayan Hilir) gave the lowest score, although these are still in an intermediate condition.
The social sphere (measured as existence of self help, mutual trust and conflict resolution within the community) and the political

�� | Towards Wellbeing: Monitoring Poverty in Malinau, Indonesia
Table 6. Indices for individual aspects of NESP model per subdistrict
Subdistrict SWB H W K E N S P Service Index
Pujungan 26.5432 58.4821 30.8642 51.5873 25.4545 48.6111 76.0000 72.0000 57.6923
Sungai Boh 36.2319 53.2609 58.5859 72.5000 42.4242 39.2593 99.2754 84.8485 62.8571
K. Hulu 11.6667 42.2535 34.2723 47.0000 20.9957 27.3504 92.0188 77.6995 65.4839
K. Hilir 41.1111 40.4167 44.4444 52.6515 19.9134 55.5556 64.5161 61.4943 54.2857
M. Barat 28.4038 57.4653 38.8889 57.1181 26.5152 31.7460 78.9352 82.6190 56.5000
M. Utara 43.3090 71.3393 48.4127 59.6065 35.6749 32.6087 78.2238 76.7901 71.2329
Mentarang 39.9225 71.3068 50.0000 67.7419 38.5580 77.7778 89.0152 87.2093 69.1429
M. Selatan 27.2300 59.5486 45.0617 61.3095 31.7125 27.0655 90.6393 92.7536 54.3243
Total 32.2034 59.6354 43.7193 57.5169 29.7880 36.8421 83.2983 79.5349 64.3946
Source: Field data.Notes: Red = critical; yellow = intermediate; green = good. SWB = subjective wellbeing; H = health; W = wealth; K = knowledge; N = natural sphere;E = economic sphere; S = social sphere; P = political sphere; I&S = infrastructure and services.
junior high school or higher, yet 36% of the households included an illiterate household member. Most likely this is one of the older generations who missed the opportunity of formal schooling. Responses indicate that the presence of teachers in primary schools is high: 80% of respondents with children of primary school age stated that teachers are always present. Availability of books is lower, as 77% of respondents said that school books are available ‘to some extent’. Main sources of information for households are the television (63%) and letters from the local government (34%). Supporting evidence shows that letters from the government provide a somewhat reliable source of information, as it is often read by the village head at public occasions. Other sources of information, such as newspapers (24%) and radio (22%) are less available or less popular.
Despite the relative positive index for the health sphere, 36% of the households interviewed stated that during the last year one of their members had been seriously ill. However, only 17% had had household members hospitalised. The general positive score for the health sphere is related to the composition of the index: a combined
sphere (conflict resolution in general, land tenure security and participation in community meetings) scored high. To some extend this can be explained by the still existing need to cooperate among community members due to a lack of alternatives. Conflicts with other parties and pressure on land are still low in many parts of Malinau, resulting in the high score for the political sphere.
We will now examine in more detail the outcome of the survey. First, forest dependence. Forty-five per cent of the respondents stated that they regularly make trips to the forest and 19% collect aloewood (gaharu). Of the respondents regularly making trips to the forest,19 around half of them stated that four nonseasonal forest resources are important to their household. The availability of two resources mainly used for household consumption (leaves used for thatch and sunhat, and rattan to make utensils) was judged to be higher than of the two resources that are mainly traded (deer for meat and dipterocarps for timber). The highest education level within the household for 50% of the respondents was

The Status of Poverty and Wellbeing in Malinau | ��
score based on illness and medical care and separate scores for fulfilment of staple food, protein and vitamins. The health service was rated as fairly good: 57% of the respondents stated that medicine and staff are always available at the subdistrict health centres and 34% said sometimes. One government programme to make healthcare available to poor households is by providing them with free health insurance. However, transport costs to get to health facilities in these remote areas are high and not covered by the insurance, and are beyond the reach of these households.
Despite the low index for the economic sphere, when the indicators are examined more closely some interesting facts were shown: 18% of the respondents had some sort of regular income and another 6% received an honorarium. These figures may seem high. However, village administrators (5 people) and traditional leaders (3) receive regular stipends from the local government. Also almost every village has two or more primary school teachers. Thus, given the small size of villages, the percentage of people with a regular income can be quite high. Another 37% of the respondents had only sporadic incomes. On the other hand, the number of households with savings was quite high: 26% had small savings in the form of valuable goods (e.g. gold jewellery), 11% owned land outside their villages, and 13% owned a well-built hut or second house. Another important factor within the economic sphere is the self-sufficiency
in rice (the staple food for the majority of the people in Malinau). Forty-two per cent of the respondents said they produced sufficient rice for their household needs.
The government has tried to address the limited cash opportunities by providing training and cross visits to show alternative income generating activities, as well as sometimes providing planting material of new crops. However, the scale has been limited and the lack of marketing opportunities (and networks) makes community members reluctant or hesitant to develop new activities.
As some of the indicators were included in the baseline survey (2003) and the poverty monitoring (2005), we can compare some of the information. Table 7 shows some of the indicators related to material wealth and economic opportunities.
The percentage of people with a regular income had decreased, due to closure of logging companies and reduced activities of the mining company. Also the merging of administration of villages in one settlement reduced the number of village administrators.20
A coping strategy is to rely more on occasional cash earning opportunities. Collecting of aloewood, however, has become a less available option as shown by the decrease of people collecting it. Since the mid-1990s, the resource has been overexploited and become increasingly difficulty to find. In addition, prices have been relative low.
Table 7. Comparison of changes of some indicators for the economic and material wealth sphere between 2003 and 2005
Indicator 2003 2005
Households with regular income 24.4% 18.16%
Households with occasional income 31.6% 37.03%
Households collecting aloewood (gaharu) 34.2% 19.42%
Households with access to electricity 83% 64.32%
Households that own chainsaw or refrigerator 29% (chainsaw only) 31.8%
Survey 2003: 14 village with 152 respondents.Survey 2005: 27 villages with 483 respondents.

�� | Towards Wellbeing: Monitoring Poverty in Malinau, Indonesia
Decrease in access to electricity is also due to closure of logging companies, as they used to provide free fuel to neighbouring communities. Communities are not organised enough or lack the financial means to run electricity independently.
In general, the index clearly reflects the local (community) perception of the existing conditions. They recognise that access to education and training has improved, that the level of services and infrastructure has increased, that access to healthcare and fulfilment of basic food needs is relative good.
The survey itself confirmed our view that measuring only one aspect of poverty is not sufficient to show the status of poverty. Poverty is multidimensional and includes basic needs aspects as well as the larger enabling context, with perceptions of individuals on these aspects being subjective and influenced by the context. This subjectivity also shows the need for locally specific criteria, especially since differences in livelihoods and resources drive different ways of coping.
A house in Malinau (Photo: Stefan Seitz)

��
ChApteR 6whY ARe peopLe pooR In mALInAu?
The district workshop held in November 2003 highlighted the fact that all stakeholders had different perceptions of why people are poor, although all agreed on the necessity to view poverty from different aspects and multiple dimensions. It is not only a question of basic food, shelter and clothing requirements, but also encompasses social and cultural issues. Poverty in Malinau District is thus caused by ignoring the social–cultural aspects as occurred during the centralised, Java-centric and top-down policies of the New Order.
Although agreeing to the multidimensional character of poverty, most officials perceive poverty from the perspective of their own agencies. Thus, a person from agriculture sees poverty as a condition where people are unable to fulfil their everyday needs, and cannot guarantee a decent yield from their efforts. Forestry people see poverty as being caused by the lack of facilities and roads in forested areas making it difficult for communities to market their produce while they must buy food at high prices. According to the head of the Socioeconomics Division, one reason that communities in Malinau are still poor is their geographic isolation making it difficult for them to obtain their food and clothing requirements, and also to fulfil their health and education needs.
Poverty is also seen as a persistent problem due to the lack of investments. Investment will increase economic growth and in turn increase community livelihoods. The conclusion drawn from comparative studies and visits to other regions, was that the more investment a region receives, the more developed and economically progressive it will become. This was disputed by a businessman who blamed persistent poverty on the development programme priorities and the conduct of bureaucrats. Yet another opinion sees poverty as a mental and cultural issue. Efforts to eradicate poverty should be undertaken by removing the culture of being poor, of being wasteful, ignorant of saving, and using money irrationally.
Clearly, district government staff perceptions of poverty and its causes were diverse and partly reflected the scope of their positions (see Table 8). District governments considered poor communities to be homogeneous and did not distinguish among target groups with specific characteristics. Poverty was analysed primarily at the village level, resulting in field interventions that focused on physical infrastructure in the villages instead of people’s livelihoods.

�� | Towards Wellbeing: Monitoring Poverty in Malinau, Indonesia
Table 8. District government perceptions of poverty and community evaluations of government agencies
Government institution What is poverty? Poverty causes Alternative solutions
Socioeconomics Division
Poor in terms of infrastructure and economic opportunities
Centralistic policiesGeographic isolationToo little investment
SubsidiesInfrastructure developmentAttract investment
Bappeda Unable to fulfil basic needs, social and spiritual needs
Centralistic policiesLow human resources Lack of capacity
Optimize KPKCapacity buildingImprove district planning
Community Empowerment Service
Unable to fulfil basic needs and sociocultural needs
Centralistic policiesGeographic isolation
Targeted and participatory programmes Develop better poverty indicators
Education Service
Lack of access to education
Centralistic policiesLack of education
Recruit more teachersDevelop infrastructureIncrease competence of teachers Provide free education
Agricultural Service
Unable to meet a decent standard of living
Unclear business environment
Develop agribusiness
Forestry Service Incapable and no capital for managing forest resources
Centralistic policiesNot enough financial benefits from forest resources
Facilitate permits for community forestrySupport vegetable gardens
Legislative District Assembly
Lack of infrastructureNo economic capacity
Lack of investment PromotionCreate investment opportunities
Source: Project data, October–December 2004.
The sum of explanations of poverty given by district authorities is not too different from the reasons mentioned by local people themselves. Also, villagers tend to define poverty as unfulfilled basic needs and the lack of economic opportunities. In addition, they explicitly emphasised the importance of social relations for subjective wellbeing.
oTher Causes of PoverTy
Our own analysis shows four historical causes of Malinau’s poverty at the district level. These are:
Physical isolationLimited cash benefits from valuable natural resources such as forests
••
Limited biophysical and human capacities for economic diversification, cash generation or investmentWeak cooperation among social groups.
Each has continued to be an important driver of poverty through the decentralisation period, despite local government efforts to address each of them. They are fundamental to the causes of poverty at the village and household level (Wollenberg et al. 2004).
Rositah (2005), from her study in two villages in Malinau, specifically focuses on the weak human resources capital. She sees the low level of education and awareness as a major factor in the low ability of local people to stand up against more powerful parties interested in exploiting their resources. At
•
•

Why are People Poor in Malinau? | ��
the same time, the rich and accessible resources are seen as having developed a consumptive culture with no awareness of saving income for the future.
In addition, a wide range of external factors and events, as well as internal constraints has substantially contributed to the persistence of poverty. These include:
Wealth in natural resources (especially coal, oil, gas and timber) does not necessarily lead to benefits at the household level;Monopsony position of many enterprises (e.g. logging and oil palm concessions) with negative impact on villagers’ bargaining position;Volatile resource prices due to boom–bust cycles (e.g. gaharu);Various economic and monetary crises which have affected all aspects of the economy (e.g. the 1997/98 monetary crisis, but also the latest one following the abolition of fuel subsidies in October 2005);
•
•
•
•
Limited capacities for economic diversification due to weak, uncompetitive and distant markets, lack of access to investment capital, limited skill levels, unclear land status and uncertain business environment;Population pressures from increasing numbers of outsiders crowding out some Malinau communities, with the logical consequence of growing demands for space and land and more extensive utilisation of forest land;Decreasing quality of natural environment due to logging, mining and oil palm plantations with impacts on water quality and abundance of natural resources for local livelihoods;Poor access to health and education facilities, as well as to information in many remote areas due to lack of roads and bridges, great distances, rugged topography, and expensive transportation costs;Weak trust and social cooperation due to diverse ethnicities, decline in socioeconomic interdependence, historical enmities, dispersed settlements, and prejudice;
•
•
•
•
•
A poor house in Malinau (Photo: Stefan Seitz)

�� | Towards Wellbeing: Monitoring Poverty in Malinau, Indonesia
Box 3. main dimensions of poverty identified during malinau District workshop (2003)
Basic needs listed include: • Clothing, food, housing, education and concern for the environment• Food security• Health• Recreation.
Sociocultural needs include:• Education• The dilemma between need for externally obtained knowledge and loss of local knowledge• Low technological skills• Disempowered communities.
Structural and development policies issues raised in the discussions were:• Difficulties in marketing agricultural products• Difficulties in transportation due to lack of infrastructure and facilities• Lack of information• Lack of ‘freedom’ to fulfil basic needs (local people are incapable of identifying and making use of
opportunities, the rights of local people are unclear)• Government’s roles and programmes are not implemented effectively• High incidence of corruption.
Table 9. Basic problems at the village level identified by communities in Malinau
Aggregate of the 3 groups
Women group Ranking Nonelite
group Ranking Elite group Ranking
Education/human resources
17.8% 18.6% (1) 20% (1) 15.4% (1)
Health 13% 13.6% (2) 17.8% (2) 9.2% (3)
Housing 8.9% 10.2% (3) 6.7% (5) 9.2% (3)
Capital 8.3% 6.8% (5) 11.1% (3) 10.8% (2)
Low produce prices
7.1% 5.1% (8) 4.4% (8) 10.8% (2)
Access to natural resources
7.1% 5.1% (8) 6.7% (5) 9.2% (3)
Results from group discussions in 14 villages in Malinau.Source: Limberg et al. (2005).
The villager resettlement programme in Malinau in the past resulted in people losing their rights to traditional resources without adequate compensation. In their new locations, the resettled people have often been marginalised and in conflict with local people. This has been exacerbated with local autonomy when people became aware of the cash value of resources.
• All these poverty causes interfere with local government programmes. In some cases, local governments started mitigating these constraints, e.g. by constructing new roads or subsidising air transport. In other cases, district policies aggravated the problems, for instance through the unbalanced support of investors, such as mining companies or oil palm plantations. While generating economic opportunities for some people,

Why are People Poor in Malinau? | ��
the negative impacts on the natural and social spheres frequently outweighed the economic short-term benefits.
Although district governments only have limited influence on some of these factors (e.g. natural calamities), they can help in creating enabling environments that offer opportunities and minimise vulnerabilities. So far, such strategic measures are still missing.
In the 2003 workshop, participants from the government concluded that poverty has three main dimensions: basic needs, social needs, and development policies.21
These factors fit quite well into the NESP model developed by CIFOR, and should have become the basis of further analysis. Unfortunately, the time constraints of a workshop did not allow a deeper analysis and, while admitting the need for further analysis, the preliminary results only showed poverty as being caused by low capacity of the people rather than the structural problems highlighted—i.e. low competitiveness, low motivation of people, low awareness and concern for education. Interestingly, from a different survey in two villages in 2004, poverty was perceived as being more a matter of shortage of basic needs (food, clothing, housing; Box 3) and caused by a set of similar reasons focused on the people rather than the context (Rositah 2005).
Meanwhile, during the baseline survey (November 2003), representative from local communities showed a different set of priorities for which they want government intervention: education, health and housing (see Table 9). Other frequently mentioned problems related to poverty at household level were lack of capital, low prices for agricultural and forest products, and lack of access to natural resources.
As shown during several group discussions in the villages during the first survey, local priorities also include the hope for more sources of regular income. Although they value the income from logging fees and occasional labour, many people are aware that these are short term. Indeed, some people expressed concern that these short-term windfalls would jeopardise food security, as people shift their energies and attention from rice cultivation to forest exploitation. From the surveys, one overarching reason that people perceive themselves as being poor is the isolation and remoteness of their homes from the government and economic centres in the district. While the distance was reduced when Malinau became a district, knowing that the physical distance is not so great but being unable to cross it influences the perception of isolation.


��
ChApteR 7whAt hAs Been Done In mALInAu?
Poverty alleviation has been off and on the government agenda for several decades, the last wave pushed by the international attention to poverty. Despite this huge effort, results have been largely disappointing. Lack of coordination remains persistent at all levels of government structures. Each sector plans and implements its own programmes without adequate links to other programmes, often without considering the shared target groups. Thus, there is only a weak link between agriculture and cooperatives, or between agricultural projects run by the Community Empowerment Service (PMD) and the Agricultural Service (Dinas Pertanian). This is further exacerbated by unclear division of roles in alleviating poverty among the different stakeholders, i.e. central and local governments, the private sector and society. The result is that projects often fail to reach their target, especially since they are focused on symptoms and not causes. Providing free or cheap rice, for example, only provides relief from short-term hunger but does not help to improve long-term wellbeing.
The development policy for Malinau follows the formal national process of having a written Regional Development Programme (Propeda),22 and strategic plan,23which is then elaborated in the annual planning of projects.
This strategic plan is a product of Bappeda and has involved deliberation with numerous government agencies, technical agencies, offices, subdistricts and NGOs. It was revised by Bappeda to reflect the 2004–2009 national priorities: (1) the eradication of illegal logging, (2) optimising the Poverty Alleviation Committee, and (3) care for poor farmers (see Table 10).
The budget to implement development is derived largely from the national government in the form of balancing funds,24 supplemented by district self-generated revenue (PAD),25 and other legitimate earnings. Malinau District revenue in 2002 was around Rp 405.3 billion (BPS Kabupaten Malinau 2003) and in 2003 it was Rp 520.5 billion (BPS Kabupaten Malinau 2004). A large proportion is allocated for routine spending to pay the salaries of approximately 1200 civil servants, and government operational costs (see Table 11).
Development spending for 2002 was about Rp 200 billion and for 2003 it was a little over Rp 300 billion. Most of this went to develop physical infrastructure, especially the district government office, civil servant and district government housing estates, a sports hall, hospital, and new roads (interviews with Malinau District Government officials, December 2004).

�� | Towards Wellbeing: Monitoring Poverty in Malinau, Indonesia
Table 10. Malinau District Government strategies
ExternalEnvironment
Analysis
Internal EnvironmentAnalysis
Strengths Weaknesses
1. Applicable regulations 2. Large areas of land available for
potential development in the agriculture sector
3. Natural resources 4. Effective cooperation between
legislative and executive branches of government
1. Lack of government and community competence
2. Market potential yet to be realised
3. Economy dependent on outside parties
4. Incomplete database on regional potential
5. Limited infrastructure, social and public facilities
6. Increased illegal logging activity7. Large numbers of families remain
poor
opportunities1. Opportunity for
a free market economy
2. Malinau District’s geographic location and proximity to Brunei and Malaysia enable regional cooperation
3. Establish district–village cooperation
1. Utilise legislation to strive for free market opportunities
2. Utilisation of potential human resources could spur district/town and overseas cooperation
3. Empower relatively large population growth to strive for free market opportunities as well as regional and international cooperation
4. Utilise good relations between executive and legislative bodies to increase levels of prosperity for civil servants and communities as well as increasing cooperation with other districts and towns
1. Improve the capacity of government apparatus by making an MoU with other district and town administrations
2. Increase cooperation with neighbouring countries in developing infrastructure, public and social facilities
3. Tackle illegal logging through cooperation between the district and town administrations and neighbouring countries
Threats1. Rapid advances
in technology 2. Influx of
high-quality, competitively priced imported goods
3. Districts competing with the same commodities
4. Ongoing economic crisis
5. Difficult access to border areas
1. Utilise prevailing legislation to spur technological progress
2. Utilise potential human resources to increase output of prime district products
3. Utilise potential human resources in non-oil, non-gas sectors to tackle the economic crisis
4. Work together with other districts to increase principal commodities
5. Utilise the relatively large population growth and advances in technology to output principal products
6. Optimise the function and role of the Poverty Management Committee
1. Increase competence for advances in technology
2. Realise market potential by using technology to create high-quality products
3. Finalise database on regional potential in line with advances in technology
4. Increase infrastructure development to overcome competition with other regions with the same commodities
5. Pay more attention to poor subsistence farmers
Source: Renstra Pemkab Malinau (2004).
Malinau’s big aim is to achieve self-sufficient villages by 2010 (see Box 4). This aim is to be achieved by the movement to develop self-sufficient villages (Gerbang Dema), which is a programme spearheaded by PMD. Applying a regional approach, Malinau is divided into three regions: Region I (Malinau Town, West Malinau, North
Malinau and South Malinau subdistricts), Region II (Mentarang and Pujungan subdistricts), and Region III (Kayan Hulu, Kayan Hilir and Sungai Boh subdistricts). These three regions will later become development centres26 for surrounding villages and subdistricts (Malinau District Regulation No. 2/2002).

What Has Been Done in Malinau? | ��
Table 11. Developments in Malinau District budget realisation
Malinau budget realisation 2002(Rp million)
2003(Rp million)
Revenue
Remaining budget from the previous year 75 478 75 593
District own-source revenue 11 021 29 537
Balancing funds 299 384 362 360
Other legitimate sources 19 422 52 559
Loans 94 729
Total Income 405 305 520 427
Expenditure
Routine 141 677 171 619
Development 200 444 303 102
District expenses 21 000
Total Expenditure 342 111 494 721
Source: Bappeda dan BPS Kabupaten Malinau (2005).
Box 4. steps towards village self-sufficiency
1. Pre self-sufficient: a traditional village, no outside influences, low productivity with earnings only from the primary sector.
2. Partially self-sufficient: a village that is one stage more advanced than a pre self-sufficient village, where customs and traditions are undergoing transition, outside influences have begun to appear in the village causing more progressive thinking and increased employment, with villagers’ incomes beginning to develop from the primary to secondary sectors. Productivity increases along with improved village infrastructure.
3. Self-sufficient: a village that is one stage more advanced than a partially self-sufficient village, where customs involve more rational interpersonal relationships, villagers’ incomes have become more diversified, moving to tertiary sectors, new technology is being utilised; high productivity is balanced by sufficient infrastructure.
Source: Gerbang Dema Strategy General Guidelines.
Gerbang Dema was conceptualised following a seminar held in October 2002 by the Community Empowerment Service (PMD). It was adopted by the district head as a flagship programme and consequently became very popular with government officials. This was apparent during district surveys, when every official kept using the term Gerbang Dema. However, as discussions developed, it also became clear
that perceptions regarding Gerbang Dema were highly diverse and different from the principles included in the Gerbang Dema itself. This extended to more detailed explanations as to its meaning where some respondents said Gerbang Dema is like a one-size-fits-all shirt, meaning that all district government and agencies’ programmes could use the label Gerbang Dema.

�� | Towards Wellbeing: Monitoring Poverty in Malinau, Indonesia
Tabl
e 12
. Ger
bang
Dem
a Pr
ogra
mm
e, 2
002
(Rp
billi
on)
Subd
istr
ict
Prod
ucti
on S
ecto
rTr
ansp
orta
tion
Sec
tor
Soci
al S
ecto
rEc
onom
ics
Sect
orVi
llage
Infr
astr
uctu
re
Sect
orTo
tal
No.
pro
ject
sVa
lue
No.
Pro
ject
sVa
lue
No.
Pro
ject
sVa
lue
No.
Pro
ject
sVa
lue
No.
Pro
ject
sVa
lue
No.
Pro
ject
sVa
lue
Kaya
n H
ulu
20.
80
–5
3.3
10.
26
5.6
149.
9
Sung
ai B
oh0
–2
1.5
33.
00
–0
–5
4.5
Kaya
n H
ilir
10.
22
14
01
0.2
41.
712
3.1
Puju
ngan
0–
31.
27
3.4
10.
27
5.5
1810
.3
Mal
inau
0–
0–
0–
0–
0–
0–
Sout
h M
alin
au0
–3
6.5
31.
90
–2
2.1
810
.5
Wes
t Mal
inau
0–
26.
04
1.1
0–
10
77.
1
Nor
th M
alin
au0
–6
9.3
87.
10
–3
2.1
1718
.5
Men
tara
ng2
0.6
24.
64
1.9
10.
26
3.4
1510
.7
Tota
l5
1.6
2030
.138
21.7
40.
829
20.4
9674
.6
Sour
ce: B
PS K
abup
aten
Mal
inau
(200
3)

What Has Been Done in Malinau? | ��
Table 13. Malinau District Agriculture office Projects, 2003
Project Budget (Rp million) other units
Improving rice intensification and enlarging planting areas (APBN) 1748.9
Community food security development (APBN) 199.2
Developing beef cattle agribusinesses (APBN) 340.0
Empowering agricultural extensions officers (APBN) 124.0
Developing rural fish farming (APBN) 292.0
Horticulture for cempedak and rambutan (Provincial Budget) 50 ha
Building farming roads in Mentarang Subdistrict (Provincial Budget) 2200 metres
Fish farming (Provincial Budget) 15.0
Operational assistance with agricultural inputs (District Budget) 255.0
Fish farming (District Budget) 310.0
Routine (District Budget) 228.9
Source: Dinas Pertanian Kabupaten Malinau (2003).
Table 14. Forestry concession developments in Malinau District
Year
Concessions
HPH IPPK IuPHHK
Total Area (ha) Total Area (ha) Total Area (ha)
1996 11 1 610 050 – – – –
1997 12 1 636 750 – – – –
1998 12 1 636 750 – – – –
1999 18 1 152 699 – – – –
2000 18 1 776 350 15 42 350 – –
2001 18 1 776 350 46 56 000 – –
2002 18 1 776 350 – – 11 363 925
Source: Dinas Kehutanan dan Perkebunan Kabupaten Malinau (2004)
Table 15. Forest utilisation developments in Malinau District
Forest TypeArea (ha)
2001 2003
Protected Forest 714 000 744 647
Nature/wildlife reserves 1 176 000 1 030 170
Permanent production forest27 336 000 453 653
Limited production forest28 1 813 000 1 280 836
Other conversion forests/KBNK 166 000 752 763
Total 4 206 000 4 262 069
Sources: 2001: BPS Kabupaten Malinau (2002). 2003: Bappeda dan BPS Kabupaten Malinau (2005).

�� | Towards Wellbeing: Monitoring Poverty in Malinau, Indonesia
Despite a substantial amount being spent, many respondents felt these programmes had not been either participatory or transparent in their implementation. There were many questions from respondents in communities in South Malinau and West Malinau subdistricts. These questions showed that the principles of Gerbang Dema (being accountable, participatory and transparent) were not being implemented. Communities commonly felt the programme was ineffective, wasteful and inappropriate to the needs of the communities it involved.
Meanwhile, as part of the national campaign to alleviate poverty, Malinau established its KPK in September 2002. The KPK is a multisectoral body chaired by the office of PMD. PMD is responsible for empowering village communities. As such, it has a central role in running Gerbang Dema and poverty management. Apart from its role in strengthening community and village organisations, the PMD office is also the secretariat of the KPK. In August 2003, one year after its formation, the committee finished drafting its Regional Poverty Management Strategic Plan, which comprises 28 programmes for tackling poverty issues in Malinau.
In carrying out its duties, the KPK is constrained by two main issues. The first relates to the issue of mainstreaming poverty. KPK programmes were designed separately and in 2004 were not included in the district budget. Therefore the same programmes were proposed again for 2005, but still remain separate from the overall programme. According to Malinau District Government policy, the KPK should channel General Allocation Funds (DAU) into poverty alleviation programmes in Malinau. This means that, in fact, the Malinau KPK should have had funds of Rp 78 billion in 2002 and Rp 94 billion in 2003 for making poverty management programmes. The second issue is organisational, related to structural problems and hierarchical attitudes among tiers and echelons. With
unclear roles and status and no operational budget, the KPK is easily dismissed.
With the KPK not operational, poverty alleviation efforts are implemented sectorally by individual agencies according to their own vision. The Agriculture Office, for example, envisions the establishment of modern, sturdy and efficient farming communities. This vision is translated into the following missions: (1) Increasing government performance and farming innovations in providing a service to farmers; (2) Developing self-sufficiency and food commodities; (3) Developing village-based farming commodities towards agribusiness and agro-industry.
As more than 80% of its land is designated forest estate, the office of Forestry and Plantations is also a key stakeholder in poverty alleviation. The forestry subsector provides a large contribution to PAD and PDRB (regional GDP) in Malinau District, collected through taxes, regional levies and third-party contributions.
Malinau Forestry Office statistics only record log production. No data has been collected on other forest products such as gaharu, medicines, rattan and game. The same is true for companies’ PMDH reports and various land rehabilitation projects paid for by DAK-DR. Log production was relatively stable from 2001 to 2003 at approximately 550 thousand cubic metres a year. This production was from 18 commercial forest concessions (HPH) and 46 Timber Extraction and Utilisation Permits (IPPK) in 2001, and 18 HPHs and 11 Forest Timber Product Utilisation Permits (IUPHHK) since 2002 (Table 14).
Beside the changes in types of forest concessions, large-scale changes in land status have taken place in the district. Large areas of permanent forest have been turned into conversion forest. We found that the area of forested land in Malinau District fell by 600 thousand hectares between 2001 and 2003 to become nonforestry cultivation areas (Table 15).

What Has Been Done in Malinau? | ��
The Malinau District Government Socioeconomics and Investment Division, housed under the District Secretariat, provides services to economic players and channels aid directly to individual community members or groups. Direct subsidies to address poverty consists of: (1) subsidised rice for the poor (Raskin), (2) subsidised flights, (3) transportation subsidies, (4) provision of electricity, and (5) clean water for rural areas.
Rice for the poor29 is only provided in five subdistricts. The other four: (1) Malinau Utara, (2) Kayan Hulu, (3)Kayan Hilir, and (4)Sungai Boh do not receive a rice quota. The district government made this decision on the basis of high transport costs (interview with the head of the Socioeconomics and Investment Division).
In 2002, some 105 tonnes of rice was provided, while in 2003 it was only 45.5 tonnes (Andrianto 2006). Respondents admitted there was no data regarding the number of Raskin recipient families, or the conditions of those families receiving it. The distribution of rice for the poor is left to subdistrict and village authorities. Poor families are entitled to 20 kg per family per month. They have to come to the subdistrict office to collect the rice. However, costs to collect subsidised rice in the subdistrict capital (by motorised canoe) can be higher than the price difference between 20 kg nonsubsidised and subsidized rice. Subdistrict staff mentioned that initially rice was transported to the villages, but irregular payments of rice or lack of interest to buy subsidised rice resulted in discontinuation of this service. The villagers themselves explained that subsidised rice is not needed throughout the year as after the rice harvest people have access to their own higher-quality products.
To address the problem of physical isolation, the Malinau District Government provided substantial subsidies for airline flights and transportation. This policy also helps to stabilise prices, so that remote communities can manage to buy basic necessities.
Flights and transportation were subsidised by the national budget (APBN) and provincial budget (APBD) until 2001. From 2002 to 2004, subsidies were provided through the provincial and district budgets. Subsidies increased from Rp 4.6 billion in 2002 to almost Rp 7.7 billion in 2003 (Andrianto 2006). District government rules state that those eligible for subsidies must register beforehand with the airline after requesting explanatory letters from the village and subdistrict authorities. Once these conditions are met, the person making the request is eligible to receive a subsidised ticket. The district government cooperates with airlines for these subsidised flights, so that the airlines can afford to keep running flights to those areas.
more reCenT efforTs To address PoverTy
To counter the impact of the sharp increase in fuel price, the national government designed several programmes targeted at poor people channelled through local governments. The first programme was a health insurance providing free health care for poor people. This programme was implemented in mid-2005. It was in preparation of this programme that the Community Empowerment Service (PMD) developed a list of local poverty indicators, conducted a survey and established the number of 32 429 persons. One problem faced by this programme (also faced by some of the other programmes) is the very limited time for preparation. Senior staff in PMD said the central government already had fixed the number of poor people at 11 000, based on a figure from the district government in an earlier report. Thus, to cover all 32 429 poor people the difference would have to be covered from the district budget.
During the community monitoring, community members mentioned some problems with the implementation of the programme. Starting form the procedure that needs to be followed: patients have to

�� | Towards Wellbeing: Monitoring Poverty in Malinau, Indonesia
go the local health centre and obtain a letter referring the patient for further medical attention to the district hospital. Given the geography of Malinau, people might have to travel 4 hours upstream to obtain this letter, whereas the travel time from the village to the hospital is only 2 hours. This requirement also sometimes incurs extreme high costs (of several hundred thousand rupiah).
The second programme was direct financial assistance to poor families at Rp 100 000 per family per month, disbursed once every three months. This programme started in September 2005 for a one year period. This nationwide programme was channelled through post offices. This programme also faced the problem of identifying eligible families. BPS was in charge of surveying poor households to compose the lists of eligible families. National indicators were used, but the district BPS offices could add local indicators if deemed necessary.
However, in Malinau there are only post offices at subdistrict level, and not even all subdistricts have one. Again, travel costs from village to post office can be almost as high as the amount of money to be collected. Fortunately, despite the national guideline that individual families should collect the money, post office staff accepted people to represent all the families in one village, thus reducing the travel costs.
To provide temporary employment, a third programme was designed—rural village infrastructure development. This national programme was channelled through the district Public Works agency. The programme of Rp 250 million per village aimed at improving village infrastructure, constructed by villagers, who can thus earn some income. As many villages in Malinau are classified as poor, a total of 56 villages received this assistance. Community members were pleased with this programme, as it had several positive aspects: income generation (through labour or sale of locally available construction material), improved village infrastructure (cemented paths,
water facilities, or landing places along the river) and also empowerment (as the whole programme was designed, implemented and partly supervised by community members).
To increase the access of poor families to education, subsidies were provided to all state schools. This programme started in 2005–06 school year and continued for the 2006–07 school year. This subsidy is directly transferred to the individual schools, and intended for the purchase of additional schoolbooks, uniforms and the salary of honorary teachers. However, community members complained of the lack of information about this programme resulting in suspicion on the use of these funds.
Several respondents said that the Socioeconomics Division is looking into the possibility of working with investors from Malaysia to develop oil palm plantations, coal mines and roads to connect subdistricts in Malinau District.
Rural village infrastructure development (Photo: Godwin Limberg)

��
ChApteR 8ConCLusIons
In this report we have tried to explain how poverty can be monitored in an effective manner. We reported the results of the trials and through several supporting studies we also looked at poverty itself and tried to analyse the causes and major constraints and opportunities that hamper or facilitate efficient poverty alleviation in Malinau. Using the multidimensional poverty model or NESP, we gained a more complete understanding of poverty and developed the monitoring system accordingly. The various causes of poverty listed by various stakeholders can be linked back to aspects of the model. Although not articulated explicitly, there is an understanding among the stakeholders of the various aspects mentioned in the model.
While perceptions on poverty differ among the different sectoral agencies, collectively they include a much more complete set of factors to define poverty than is used at national level. For example, while there is an agreement that poverty is a lack of basic needs, people also admitted that lack of knowledge and lack of freedom are important aspects of poverty. Similarly, structural problems of government services are mentioned as part of the problem.
In addition, there is an understanding that
poverty is often locally specific and requires locally specific indicators to determine its status. Although local government has attempted to adjust national poverty alleviation programmes to local conditions (e.g. rice distribution), adjusting programmes to local situations requires an adaptability not possible within the existing government bureaucracy. Thus, government interventions are mainly targeted at the fulfilment of basic needs such as subsidised rice, health insurance and cash subsidies, while the development of an environment enabling people to overcome their own poverty is neglected.
The government also tends to treat poverty from the village perspective, while our study shows different levels of poverty. At the household level, for example, people are poor because of lack of material wealth or knowledge. However, people might have sufficient resources to cope, but might be very vulnerable to external crisis, such as drop in prices of commodities such as gaharu or rubber, or an increase in fuel price. Not all households have sufficient alternatives (connections, alternative sources of income, savings) neither is a social safety net always available. The shift from an economy of need towards an economy of greed resulted in a split between ‘original’ inhabitants and

�0 | Towards Wellbeing: Monitoring Poverty in Malinau, Indonesia
‘newcomers’, and eroded social cohesion and cooperation.
Forests might act as safety nets, but degraded forest (as a result of intensive exploitation) offers limited options for alternative livelihoods. Resettlement closer to government services has increased the distance to this safety net and hence the accessibility.
At village level, isolation and remoteness result in difficulties in getting adequate services for healthcare and education, as well as poor access to information and markets. At the same time, these conditions make service provision by the local government more expensive and difficult (e.g. unwillingness of staff to work in remote locations).
At district level, poverty is also caused by lack of sustainable economic opportunities which would reduce vulnerability.
Poverty alleviation efforts are not mainstreamed within the overall
development efforts. Poverty alleviation remains a separate programme, while the agriculture office, for example, does not specifically target poor farmers and treats all farmers similarly. Interventions from this office include extension, technical assistance and developing agribusiness with farmer groups, all of which benefit the well-off farmers who are more capable of using these opportunities. As there is a lack of cooperation among people, there is also lack of cooperation and coordination among the different sectoral agencies. The problem with programme delivery is further constrained by lack of incentives, low skills and capability of government staff.
As regards the monitoring system, local government is supportive, but involving multiple services and agencies is difficult. Political support for poverty alleviation is not translated into action. The position of KPK as coordination body for poverty alleviation efforts remains weak due to lack of leadership, fund allocation, and clearly coordinated poverty alleviation strategy or programme.
Community meeting on poverty monitoring (Photo: Godwin Limberg)

��
ChApteR 9ReCommenDAtIons
use nesP for more effeCTive PoverTy moniToring
As a multidimensional local poverty monitoring system, NESP provides comprehensive and relevant information important for district and subdistrict planning. The core and context information can help planning agencies like Bappeda to:
Alert the local government on poverty hotspots Alert responsible government sectorsIdentify needs for addressing acute poverty (basic needs)Anticipate future impoverishment caused by an unfavourable contextIdentify strategic entry points to reduce chronic povertyIdentify strategic entry points to strengthen the enabling environment (context)Identify priority areas for regionally more balanced developmentIdentify which poverty alleviation measures have worked and which have notTrack changes of poverty data over time.
Through these actions the local government can get answers to the following key questions.
•
••
•
•
•
•
•
•
Who are the poor?How poor are they?Where do they live?Why are they poor?How are these facts changing over time?
imProve Planning
NESP flags critical conditions and helps identify priority areas and sectors. This can make development planning far more effective. The monitoring approach initiated in 2005/06 can be linked to the existing annual planning system as shown in Figure 9.
•••••
Figure 9. Suggested monitoring and planning cycle in Malinau.
NESP Monitoring
SubdistrictSubdistrict Planning
Village PlanningTechnical Agencies
Future Development

�� | Towards Wellbeing: Monitoring Poverty in Malinau, Indonesia
The monitoring results should be distributed to subdistricts and villages, where the findings are checked for plausibility by comparing rankings of the NESP spheres at village level.
Based on the poverty analysis at the district level, Bappeda should prepare draft priorities by sector as well as by area. This prioritisation should become the basis for establishing budget ceilings by local government affairs and organisations, as well as by area (village and subdistrict). By consulting additional data, Bappeda can then prepare standard costs and prices for government expenditures. Budget ceilings and price standards should be distributed to villages and subdistricts before the local planning sessions start.
Villages and subdistricts can then rank their own proposed activities and projects based on the monitoring results (i.e. critical spheres) along with the cost estimates. For instance, if the health condition is critical in Village A and the villagers agree on this fact, it becomes a top priority for planning the development activities of the next year(s). As the monitoring system does not explain why health is critical, the village assembly conducts a basic causal analysis and elaborates suitable measures which are proposed to the subdistrict level. Here, the proposals are collected from all villages and discussed by the subdistrict government, related technical agencies and the members of DPRD from the respective subdistrict. At the subdistrict planning session—where the villages are also represented—an annual development plan is prepared and submitted to the district government. In addition, information can be requested from other government agencies, or from researchers and civil society organisations familiar with the area.
Since all relevant stakeholders are present in the local planning sessions (including the local DPRD representative), all proposals can be finalised in subdistrict assembly. By this approach, prioritisation will be more transparent and the likelihood that
community proposals get accepted should increase.If these steps are conducted properly, a revised poverty alleviation strategy should reflect the spatial and sectoral priorities that emerge from monitoring. Such a strategy would need to address basic needs, as well as contextual constraints and opportunities in order to facilitate self-driven poverty alleviation.
imProve The enabling environmenT
What does it take to increase or maintain wellbeing? How can conditions in the different spheres of NESP be improved? Poverty and wellbeing are not static. They can change over time. Local governments should be interested in how to improve the wellbeing of the poor and sustain those gains.
Capabilities of the poor should be utilised and strengthened. These capabilities include five capitals that support people’s livelihoods: financial, human, social, physical and natural.30
The local government should assess existing local livelihood strategies and create an institutional framework that supports sustainable self-driven strategies for improving wellbeing.
Opportunities and support are needed to make the best use of people’s own capabilities. However, capabilities and assets are not enough. People also need a general environment that enables and supports their efforts. The poor need economic opportunities, such as jobs or markets, but also political opportunities for greater participation and empowerment. Local governments, working together with other levels of government and the private sector, have a clear role in providing these kinds of opportunities. Combined with the poor’s own strategies and political support, these kinds of opportunities can become a powerful driver of the pathway out of poverty.

Recommendations | ��
In addition, vulnerability needs to be reduced. The pathway out of poverty can be steep and risky, and the poor need security. Some groups of the poor are vulnerable to falling back into poverty or getting trapped there chronically. Decision makers and the poor have to think about how to reduce this vulnerability. This can be through public safety net functions like free health insurance or free education and subsidised food, but also through private measures, such as family- or community-based safety nets, income diversification to avoid risk and dependence on reciprocity through extended social networks.
Finally, sustainability is required to ensure the long-term success of poverty reduction. Sacrificing the environment or social cohesion for economic short-term gains does not improve wellbeing. Balancing the trade-offs among the NESP spheres is essential, though a tough challenge for every local government.
Figure 10 illustrates how wellbeing can be improved based on these principles: utilising and strengthening capabilities, creating opportunities, providing support, reducing vulnerability and achieving sustainability.
Efforts can be made to improve district government’s opportunities and interests in
poverty alleviation at the national, provincial and district levels. With the current national drive for poverty alleviation and districts’ interests in building their capacities, new initiatives would be timely. Starting points for action include the following.
1. Central and provincial governments allow districts to define poverty locally, identify their own priorities and develop their own approaches to developing more integrated poverty programmes across district agencies. While district capacities and incentives are still weak, the centre may need to provide the legal mandate, funding, influence and training to make poverty alleviation programmes operational. Central government should not interfere with nationally designed poverty alleviation programmes as they are implemented by local governments. National and provincial government should support district government to adhere to and implement performance-based budgeting.
2. District government makes poverty more of a priority. Coordination of poverty alleviation is placed with an influential government body and with an influential person in charge. Planning, budgets, implementation and evaluation take place through mainstream district mechanisms.
District leaders show their commitment through the programme and budget decisions they support, the types of villages in which they spend time, and the values they communicate to district offices.More recognition and incentives are given to officials who effectively promote poverty alleviation.
3. District develops a clear policy. District policy-makers have a clear idea based on reliable data of:
Who is to be assisted, i.e. who are the different groups of poor, where
•
•
•
Figure 10. Some principles for improving wellbeing. Wellbeing can be improved by utilising
and strengthening capabilities, creating opportunities,
providing support, reducing vulnerability and achieving
sustainability.
Wellbeing
Time
Opportunities Vulnerability
Sustainability
CapabilitiesSupport

�� | Towards Wellbeing: Monitoring Poverty in Malinau, Indonesia
they are located, how many people need assistance, and which groups receive priorityWhat are the causes of their poverty? What are the means for reducing their poverty and what are the centre, province, district and community roles in doing so? Are these means for meeting immediate needs only, or for addressing longer-term economic opportunities? What roles exist for other parties?Why poverty alleviation is essential to the overall wellbeing and economic aims of the district.
The resulting framework should reflect local conditions in the district and provide locally relevant criteria for assessing poverty. It is created in consultation with different groups of the poor in their villages, as well as with government officials responsible for implementing and assessing projects.
The framework provides focus and direction to policy decisions and enables better coordination. It enables poverty alleviation to happen outside of designated ‘poverty’ programmes. It is simple enough that people can remember its main elements.
4. District institutions responsible for poverty programmes are well coordinated. Poverty alleviation committees are reorganised, revitalised and better integrated with existing coordination bodies such as the District Planning and Development Agencies (Bappeda). The committees and their programmes have a budget allocated from the district budget (APBD) and, if necessary, a legal district mandate to support them. The committee is able to allocate funds independently of individual agencies to encourage intersectoral cooperation. The committees are open to input from interested community members and organisations.
•
•
•
All parties receive adequate information. Government agencies, technical agencies and offices and district government secretariats continually update information about programme proposals, implementation of ongoing programmes and their impacts.
5. District policy creates an enabling environment for people to work their way out of chronic poverty by supporting more diverse economic opportunities, generating more environmentally and economically sustainable options, and reducing vulnerability. It does this through providing more support to strengthen existing local livelihood strategies, helping local people diversify their cash sources of income, providing good-quality education and training opportunities, building on existing efforts of community-based resource management and supporting local efforts to provide social safety nets. It should avoid centrally driven, uniform programmes, as those do not enable people to meet their own interests.
6. District decision makers communicate with the poor and are responsive to their needs and interests. Officials conduct participatory village and subdistrict planning sessions to facilitate better two-way communication with villages, and local officials assist villages to know what is feasible to request and communities communicate to officials about their needs and report back on the progress of poverty alleviation efforts.
Communities receive information about government programmes so they can decide on their involvement, be aware of their roles and responsibilities, and understand the benefits they would get from being involved in the programme. Increased transparency makes officials more accountable for delivering project benefits.

Recommendations | ��
7. Monitoring occurs by government and communities. District monitors poverty and impacts of government policies at village and household levels. Analysis is done at the household or family level, and not just at the village level. Checks are provided to ensure credible data. Data are checked or collected directly by district representatives, and not only reported by the village head. Distribution of benefits per capita from national, provincial and district programmes is monitored across subdistricts and villages.
Communities have formal responsibility to monitor government programmes independently, and do so with the assistance of nongovernmental organisations and the media.
8. Local capacities for poverty alleviation are stronger. A critical mass of district officials have experience, training and exposure to understanding different ways of tackling poverty, how to measure and monitor
programme impacts on the poor, and how to involve poor people in decision making. Building such capacities does not mean providing scholarships for people to pursue higher degrees to add to their own qualifications, but providing substantive training in skills related to poverty alleviation.
The district governments’ roles in poverty alleviation are in transition. While significant efforts are underway, they fall short of their potential to make an impact. Changes in the specific attitudes, behaviour and capacities mentioned in this report would help district officials to reach the district’s full potential. No one is going to eliminate poverty overnight. But as poverty alleviation programmes continue to grow and consolidate, now is the time to invest in changing the fundamental conditions that could better help them reach their potential.
Physical isolation, Malinau District (Photo: Godwin Limberg)


��
enDnotes
1 Indicators for the economic sphere are self-sufficiency in staple food, number of income-generating activities, savings and productive assets (orchards, rice huller).
2 The first figures are from 1984 with measurements covering the years 1976 to 1984 using the Survei Sosial Ekonomi Nasional (Susenas) consumption module. Poverty was defined as the inability to fulfill basic requirements, using poverty line measurement. The national poverty line measurement is the number of Rupiah needed by individuals to consume the equivalent of 2100 kilocalories per person per day and to fulfil non-food requirements such as clothing, healthcare, education, transport and a number of other goods and services. With ever-changing patterns of consumption and rising prices, the poverty line was adjusted every year to keep up with developments.
3 In contrast, valuable nontimber forest products such as gaharu and birds’ nests were managed through informal trader networks and largely escaped government regulation.
4 In practice, however, the majority of funds have continued to come from Jakarta.
5 This consists of 64% of the fee (IHPH), 32% of the production-based royalties (PSDH) and 40% of the reforestation funds; for the mining sector, the allocation varies from 32% for general minerals (e.g. coal, sand) to 12% for gas and 6% for oil. Districts also receive a small percentage of revenues generated in districts in the same province.
6 Calculated from various reports of the National Statistics Agency (BPS).
7 Differences among ethnic groups were highly significant (p<0.001, using Pearson chi-square test).
8 More recently, in an attempt to gain support as a ‘Conservation District’, forest area coverage has been set at over 90%.
9 A revised regulation (PP 6, 2007) returns the authority to issue permits for the various use of forest and forest land to the Bupati for areas within the districts.
10 includes some guesswork as recent data for Kayan hilir and Kayan hulu were not available
11 In 2002, only 8357 people.
12 The capability approach was developed by Nobel Prize Laureate Amartya Sen (e.g. Sen 1993, 1997, 1999). The approach was also used by Narayan et al. (2000a, b, 2002) in the World Bank’s ‘Voices of the Poor’ study.
13 BKKBN (National Family Planning Coordination Agency) uses family head, whereas the BPS uses household in the sense of all persons living under one roof and sharing one kitchen.
14 Results of household interviews and focus group discussions are reported separately.
15 Results of the trial in 18 villages: Six cases complete feedback, both positive and negative, on community development programmes (of the previous year); in another six cases complete information, but only positive, was obtained; and in six cases very limited information was obtained (of these six cases five were implemented by one team).

�� | Towards Wellbeing: Monitoring Poverty in Malinau, Indonesia
16 One other example of the influence of direct involvement occurred when in one village the health worker was present during the (mixed) group discussion. Scores on health programmes were higher than in the other villages, and in the neighbouring village served by the same health worker participants made many negative comments on health programmes.
17 One sub-district, Malinau Kota, was not included as it is an urban area.
18 Indicators for the economic sphere are self-sufficiency in staple food; number of income generating activities; savings and productive assets (orchards, rice huller).
19 Some respondents who said that they were not making regular trips to the forest still provided answers on the importance and availability of forest resources. The accuracy of this information is difficult to judge.
20 Before becoming a separate district, villages defined themselves by having an SK, an official decree. Because of migration, some villages settled in places of existing villages but retained their status. Thus, there have been cases of one location inhabited by 2–7 villages. In March 2005, most of these multiple villages in one location were merged, making 97 villages from the 135 former villages. In early 2006, some of the larger villages were split bringing the total to 106.
21 Interestingly these dimensions are already much more inclusive than those used by either BPS or BKKBN.
22 The 2001–2006 Regional Development Programme (Propeda) for Malinau District, ratified through District Regulation No. 2/2002.
23 The Malinau District Strategic Plan for 2002–2006 was ratified in 2002 through District Regulation No. 3/2002.
24 Funds originating from the National state budget (APBN) and allocated to regions to fund their requirements in implementing decentralisation.
25 Revenue collected within the region based on regional regulations issued in accordance with prevailing legislation.
26 Malinau District Regulation No. 2/2002 on the Malinau District Development Programme for 2001–2006.
27 Forest areas assigned for producing forest timber products, where trees with diameters exceeding 50 cm may be felled.
28 Forest areas assigned for producing forest timber products, where trees with diameters exceeding 60 cm may be felled.
29 Subsidised rice for poor families. According to district government rules, each poor family is entitled to receive 20 kg of rice per month at a price of Rp 1000 per kg.
30 These capitals or assets are an essential element of the sustainable livelihood approach (e.g. Chambers and Conway 1991; DFID 1999).

��
RefeRenCes
Affandi, O. 2005. Analisis Kebijakan Desentralisasi Pengelolaan Hutan dan Pengaruhnya Terhadap Perekonomian Masyarakat sekitar Hutan. (Studi Kasus Kabupaten Malinau Kalimantan Timur) [Analysis of forest management decentralization policy and its influence on local people’s livelihoods (Case study of Malinau District, East Kalimantan)]. MS Thesis. Forestry Department, Mulawarman University, Samarinda, Indonesia
Agusta, I. 2006. Kemiskinan dan Kebijakan. Opini. Kompas, 22 Agustus. http://www.kompas.com/kompas-cetak/0608/22/opini/2894551.htm accessed 27 September 2007
Andrianto, A. 2006. The role of district government in poverty alleviation: case studies in Malinau and West Kutai districts, East Kalimantan, Indonesia. CIFOR, Bogor, Indonesia. http://www.cifor.cgiar.org/Publications/Detail?pid=2094
Andrianto, A., Wollenberg, E., Cahyat, A., Gönner, C., Moeliono, M., Limberg, G. and Iwan. R. 2006. District governments and poverty alleviation in forest areas in Indonesia. Governance Brief No. 30. CIFOR, Bogor, Indonesia http://www.cifor.cgiar.org/Publications/Detail?pid=2001
Anon. 2006a. Data soal Kemiskinan Diragukan: Wapres: Angka-angka Itu Benar. Kompas, 19 Agustus. http://www.kompas.com/kompas-cetak/0608/19/utama/2891993.htm
Anon. 2006b. Data Kemiskinan: Anggurnya Baru Kantongnya Lama... Kompas, 23 Agustus. http://www.kompas.com/kompas- cetak/0608/23/Politikhukum/2900103.htm
Anon. 2006c. Sajikan Data Sebenarnya: BPS Laporkan Mutasi Kemiskinan yang Terjadi Sejak Maret 2006. Kompas, 25 Agustus. http://www.kompas.com/kompas-cetak/0608/25/ekonomi/2903590.htm
Bappeda dan BPS Kabupaten Malinau 2005. Kabupaten Malinau Dalam Angka Tahun 2004-2005. Badan
Perencanaan Pembangunan Daerah (Bappeda) dan Badan Pusat Statistik (BPS), Malinau, Indonesia
Barr, C., Wollenberg, E., Limberg, G., Anau, N., Iwan, R., Sudana, I.M., Moeliono, M. and Djogo, T. 2001. The Impacts of Decentralization on Forests and Forest-Dependent Communities in Malinau District, East Kalimantan. Case Studies on Decentralisation and Forests in Indonesia. Case Study 3. CIFOR, Bogor, Indonesia
BKKBN 2001. Laporan intern Badan Koordinasi Keluarga Berencana Nasional Perwakilan Kabupaten Malinau. Badan Koordinasi Keluarga Berencana Nasional (BKKBN), Malinau, Indonesia
BPS 2001. Penduduk Indonesia: Hasil sensus penduduk tahun 2000 = Population of Indonesia: results of the 2000 population census. Badan Pusat Statistik (BPS), Jakarta, Indonesia
BPS 2004a. Data dan Informasi Kemiskinan Tahun 2003. Buku 1 Propinsi. Badan Pusat Statistik (BPS), Jakarta, Indonesia
BPS 2004b. Data dan Informasi Kemiskinan Tahun 2003. Buku 2 Kabupaten. Badan Pusat Statistik (BPS), Jakarta, Indonesia
BPS 2006. Peta Kemiskinan & Wilayah Tertinggal Kabupaten Malinau Tahun 2006. Badan Pusat Statistik (BPS), Jakarta, Indonesia
BPS Kabupaten Malinau 2002. Kabupaten Malinau Dalam Angka Tahun 2001. Badan Pusat Statistik (BPS), Malinau, Indonesia
BPS Kabupaten Malinau 2003. Kabupaten Malinau Dalam Angka Tahun 2002. Badan Pusat Statistik (BPS), Malinau, Indonesia
BPS Kabupaten Malinau 2004. Kabupaten Malinau Dalam Angka Tahun 2003. Badan Pusat Statistik (BPS), Malinau, Indonesia
Cahyat, A. 2004. Bagaimana kemiskinan diukur? Beberapa model penghitungan kemiskinan di Indonesia. Governance Brief No. 2. CIFOR, Bogor, Indonesia

�0 | Towards Wellbeing: Monitoring Poverty in Malinau, Indonesia
Chambers, R. and Conway, G.R. 1991. Sustainable rural livelihoods. Practical concepts for the 21st century. IDS Discussion Paper 296
Depdagri 1996. Perencanaan Partisipatif Pembangunan Masyarakat Desa (P3MD), Buku I, II dan III. Departemen Dalam Negeri RI, Direktorat Jenderal Pembangunan Masyarakat Desa, 1996. Departemen Dalam Negeri, Jakarta
Depdagri 1999. Undang-undang Republik Indonesia Nomor 25 Tahun 1999 tentang Perimbangan Keuangan antar Pemerintah Pusat dan Pemerintah Daerah. Departemen Dalam Negeri, Jakarta
Depdagri 2004. Undang-Undang Republik Indonesia Nomor 33 Tahun 2004 tentang Perimbangan Keuangan antara Pemerintah Pusat dan Pemerintah Daerah. Departemen Dalam Negeri, Jakarta
DFID 1999. Sustainable Livelihoods Guidance Sheets, 1-8, London, UK. http://www.livelihoods.org
Dinas Kehutanan dan Perkebunan Kabupaten Malinau 2004. Annual Report. Malinau, Indonesia
Dinas Pertanian Kabupaten Malinau 2003. Annual Report. Malinau, Indonesia
Ediawan, A., Wells, A. and Shepherd, G. 2005. Keterkaitan Kemiskinan dan Kehutanan di Indonesia: Apa Buktinya? Bagaimana Menguatkan Targeting terhadap Masyarakat Miskin di Dalam dan Sekitar Hutan? Briefing Paper No. 2. Center for Economic and Social Studies (CESS) and Overseas Development Institute (ODI), Jakarta
Gönner, C., Haug, M., Cahyat, A., Wollenberg, E., de Jong, W., Limberg, G., Cronkleton, P., Moeliono, M. and Becker, M. 2007. Capturing nested spheres of poverty: a model for multidimensional poverty analysis and monitoring. Occasional Paper No. 46. CIFOR, Bogor, Indonesia. http://www.cifor.cgiar.org/Publications/Detail?pid=2255
Kaltim Post 2007. APBD 2007 Tembus Rp. 1,1 T – Digunakan belanja langsung Rp. 890 M. Kaltim Post, 1 Februari 2007 http://www.kaltimpost.web.id/berita/index.asp?Berita=Malinau&id=196209 accessed 1 October 2007
Khomsan, A. 2006. Yang disebut orang miskin. Opini. Kompas, 25 Agustus. http://www.kompas.com/kompas-cetak/0608/25/opini/2903405.htm accessed 27 September 2007
Komite Penanggulangan Kemiskinan (KPK) 2003. Dokumen Interim Strategi Penanggulangan Kemiskinan, Sebuah Kerangka Proses Penyusunan Strategi Penanggulangan Kemiskinan Jangka Panjang. Komite Penanggulangan Kemiskinan (KPK), Jakarta, Indonesia
Lesmana, T. 2006. Tidak Ada Data Sahih di Republik Ini. Opini. Kompas, 24 Agustus. http://www.kompas.com/kompas-cetak/0608/24/opini/2895600.htm
Limberg, G. 2004. It’s not fair, where is our share? The implications of small-scale logging on communities’ access to forests in Indonesia. Paper to 10th Meeting of the International Association for the Study of Common Property, Oaxaca, Mexico, 9–13 August 2004
Limberg, G., Iwan, R., Sudana, M., Hartono, A., Henry, M., Hernawan, D., Sole, Mamung, D., Wollenberg, E. and
Moeliono, M. 2005. Profil Desa-Desa di Kabupaten Malinau: Kondisi social ekonomi desa-desa. CIFOR, Bogor, Indonesia http://www.cifor.cgiar.org/scripts/newscripts/publications/detail.asp?pid=1744
Malinau District Regulation No. 2/2002, Peraturan Daerah nomor 2 Tahun 2002 tentang Program Pembangunan Daerah Kabupaten Malinau.(District regulation 2 concerning Malinau District Development Programme)
Menhut 2004. SK.477/Menhut-II/2004 tentang Pembatalan Keputusan Bupati Malinau Nomor 522.21/Kpts.08/Dkpml/Xii/2001 Tanggal 22 Desember 2001 Tentang Izin Usaha Pemungutan Hasil Hutan Kayu PT. Wana Yasa Kahuripan Indonesia
Narayan, D. and Petesch, P. 2002. Voices of the Poor: From Many Lands. World Bank and Oxford University Press, New York
Narayan, D., Chambers, R., Kaul Shah, M. and Petesch, P. 2000a. Voices of the Poor: Crying Out For Change. Published for the World Bank, Oxford University Press, New York
Narayan, D., Patel, R., Schafft, K., Rademacher, A. and Koch-Schulte, S. 2000b. Voices of the Poor: Can Anyone Hear Us? Published for the World Bank, Oxford University Press, New York
Peraturan Pemerintah 34, 2002 tentang Tata Hutan dan Penyusunan Rencana Pengelolaan Hutan serta Pemanfaatan Hutan dan Penggunaan Kawasan Hutan, Article 42.(Government regulation 34 / 2004 on Forest Designation and Planning of forest Management and Use of Forested Areas, article 34)
Renstra Pemkab Malinau 2002-2006, revised draft October 2004. Malinau, Indonesia
Rhee, S. 2000. De facto decentralization and the management of natural resources in East Kalimantan during a period of transition. Asia Pacific Community Forestry Newsletter 13(2): 34-40 http://www.recoftc.org/site/fileadmin/docs/publications/APCF_Newsletter/Volumn_13_No.2/Defacto_rhee.pdf
Rositah, E. 2005. Kajian Kemiskinan Masyarakat Desa Sekitar Hutan dan Upaya Penanggulangannya di Kabupaten Malinau Propinsi Kalimantan Timur [A Study of Forest Village Poverty and Efforts in Poverty Alleviation in Malinau. East Kalimantan]. MS Thesis. Forestry Department, Mulawarman University, Samarinda, Indonesia
Sen, A.K. 1993. Capability and wellbeing. In: Nussbaum M.C. and Sen, A.K. (eds.) The quality of life, 30–53. Clarendon Press, Oxford, UK
Sen, A.K. 1997. Editorial: Human capital and human capability. World Development 25(12): 1959–1961
Sen, A.K. 1999. Development as freedom. Oxford University Press, Oxford, UK
Shepherd, G., Wells, A. and Ediawan, A. 2005. Kemiskinan Kronis, Keterpencilan, dan Pentingnya Hutan. Briefing Paper No.1. Center for Economic and Social Studies (CESS) and Overseas Development Institute (ODI), Jakarta
SK Bupati No. 144 2005. Keputusan Bupati Malinau Nomor 144 tahun 2005 Tentang Penetapan jumlah keluarga miskin Kabupaten Malinau

References | ��
Sugema, I. 2006. Data yang Mematikan. Opini. Kompas, 22 Agustus. http://www.kompas.com/kompas-cetak/0608/22/opini/2894501.htm. accessed 27 September 2007
UNDP (United Nations Development Programme) 2005. Human Development Report. Oxford University Press, New York
Wollenberg, E., Belcher, B., Sheil, D., Dewi, S. and Moeliono, M. 2004. Why are forest areas relevant to reducing poverty in Indonesia? Governance Brief No. 4, CIFOR, Bogor, Indonesia. 6p http://www.cifor.cgiar.org/publications/pdf_files/govbrief/GovBrief0404.pdf
Wollenberg, E., Moeliono, M., Iwan R., Limberg, G., Sudana, M. and Rhee S. (eds.) Forthcoming. Riding the Rapids in Malinau: Local Governance, Forests and Conflicts in Indonesian Borneo. Draft Manuscript. CIFOR, Bogor, Indonesia.
World Bank 2000/01. World Development Report (WDR) 2000/2001: Attacking Poverty. World Bank, Washington, DC
World Bank 2002. A Sourcebook for Poverty Reduction Strategies. World Bank, Washington, DC


Annexes


��
Annex 1LIst of pRoDuCts of the DeCentRALIzAtIon AnD poVeRtY pRojeCt In mALInAuPoliCy briefs
Cahyat, A. 2004. Bagaimana kemiskinan diukur? Beberapa model pengukuran kemiskinan di Indonesia [How to measure poverty? Some models for calculation of poverty in Indonesia]. Governance Brief No. 2. CIFOR, Bogor, Indonesia. http://www.cifor.cgiar.org/Publications/Detail?pid=1641
Cahyat, A. 2004 Sistem pengawasan terhadap penyelenggaraan pemerintah daerah kabupaten. Pembahasan peraturan perundangan di bidang pengawasan [Monitoring systems for running district government. A review of monitoring regulations]. Governance Brief No. 3. CIFOR, Bogor, Indonesia.
Wollenberg, E., Belcher, B., Sheil, D., Dewi, S. and Moeliono, M. 2004 Why are forest areas relevant to reducing poverty in Indonesia? Governance Brief No. 4. CIFOR, Bogor, Indonesia. http://www.cifor.cgiar.org/publications/pdf_files/govbrief/GovBrief0612.pdf [Also available in Indonesian].
Affandi, O. 2005 Dampak Kebijakan IPPK dan IUPHHK Terhadap Perekonomian Masyarakat di Kabupaten Malinau [Impact of district logging policies on village economy in Malinau District]. Governance Brief No. 12. CIFOR, Bogor, Indonesia. http://www.cifor.cgiar.org/publications/pdf_files/govbrief/GovBrief0508.pdf [English summary also available].
Rositah, E. 2005 Kemiskinan Masyarakat Desa Sekitar Hutan dan Penanggulangannya: Studi Kasus Di Kabupaten Malinau [Poverty of villagers near forests and its reduction in Malinau District]. Governance Brief No. 14. CIFOR Bogor, Indonesia. http://www.cifor.cgiar.org/publications/pdf_files/govbrief/GovBrief0602.pdf [English summary also available].
Cahyat, A. 2005 Perubahan Perundangan Desentralisasi:
Apa yang berubah?, Bagaimana dampaknya pada upaya penanggulangan kemiskinan?; Dan, Apa yang perlu dilakukan? [Changes in decentralization laws: What has changed?, What is the impact on poverty alleviation?; and What shall we do?]. Governance Brief No. 22. CIFOR, Bogor, Indonesia. http://www.cifor.cgiar.org/publications/pdf_files/govbrief/GovBrief0610.pdf
Cahyat, A. and Wibowo, S. 2005 Masyarakat Mengawasi Pembangunan Daerah: Bagaimana agar dapat efektif? [Communities monitor local development: how to make it effective]. Governance Brief No. 23. CIFOR, Bogor, Indonesia. http://www.cifor.cgiar.org/publications/pdf_files/govbrief/GovBrief0611.pdf
Cahyat, A. 2005 Perubahan Perundang-undangan Keuangan Daerah Tahun 2004 Bagaimana Pengaruhnya Pada Program Penanggulangan Kemiskinan Daerah? [Changes in laws and regulation on local government finance system by the year of 2004: What is the impact on poverty alleviation programmes?]. Governance Brief No. 24. CIFOR, Bogor, Indonesia. http://www.cifor.cgiar.org/publications/pdf_files/govbrief/GovBrief0612.pdf
Moeliono, M. and Cahyat, A. 2005 Pengarusutamaan Kemiskinaan: Apa, Mengapa dan Bagaimana? [Poverty mainstreaming: What, Why and How?]. Governance Brief No. 25. CIFOR, Bogor, Indonesia. http://www.cifor.cgiar.org/publications/pdf_files/govbrief/GovBrief0613.pdf
Andrianto, A., Wollenberg, E., Cahyat, A., Gönner, C., Moeliono, M., Limberg, G. and Iwan, R. 2006 District Governments and Poverty Alleviation in Forest Areas in Indonesia. Governance Brief Number 30. CIFOR, Bogor, Indonesia. http://www.cifor.cgiar.org/Publications/Detail?pid=2001

�� | Towards Wellbeing: Monitoring Poverty in Malinau, Indonesia
oThers
Cahyat, A. 2005. Pendataan Kemiskinan [Poverty Monitoring]. Kaltim Post Daily News, 19 September.
Cahyat, A., Gönner, C., and Haug, M. 2007. Assessing household poverty and wellbeing: a manual with examples from Kutai Barat, Indonesia. Center for International Forestry Research (CIFOR), Bogor, Indonesia. http://www.cifor.cgiar.org/Publications/Detail?pid=2265
masTer’s sTudenTs’ Theses Affandi, O. 2005 Analisis Kebijakan Desentralisasi
Pengelolaan Hutan dan Pengaruhnya Terhadap Perekonomian Masyarakat sekitar Hutan. (Studi Kasus Kabupaten Malinau Kalimantan Timur) [Analysis of forest management decentralization policy and its influence on local people’s livelihoods (Case study of Malinau District, East Kalimantan)]. MS Thesis. Forestry Department, Mulawarman University, Samarinda, Indonesia.
Rositah, E. 2005 Kajian Kemiskinan Masyarakat Desa Sekitar Hutan dan Upaya Penanggulangannya di Kabupaten Malinau Propinsi Kalimantan Timur [A Study of Forest Village Poverty and Efforts in Poverty Alleviation in Malinau. East Kalimantan]. MS Thesis. Forestry Department, Mulawarman University, Samarinda, Indonesia.

��
Annex 2VILLAGes InCLuDeD In fIRst tRIAL of poVeRtY monItoRInG In mALInAu DIstRICt
Subdistrict Village
Kayan Hulu Long NawangLong Temuyat Long Payau
Malinau Selatan LangapPaya SeturanMetut
Mentarang Long Bisai
Malinau Barat Punan Bengalun
Malinau Utara Malinau Seberang

��
Subdistrict Village
Malinau Barat SesuaLong Bila
Malinau Utara SalapSembuak WarodKaliamok
Malinau Selatan Laban NyaritPunan Gong SolokPunan Setarap
Mentarang PakingHarapan MajuLidung Keminci
Pujungan Long AlangoLong Uli
Kayan Hilir Long SuleLong PipaLidung PayauMetulang
Sungai Boh Mahak Baru
Annex 3VILLAGes InCLuDeD In seConD tRIAL of poVeRtY monItoRInG In mALInAu DIstRICt

��
Annex 4QuestIonnAIRe useD foR househoLD suRVeY
Household Questionnaire Monitoring of Community WellbeingCo-operation between Malinau District Government & CIFOR–BMZName of household (Z1) : ____________________________ Village (Z2) : ____________________________ Interviewer (Z3) : ____________________________ Date of interview (Z4) : ____________________________ Subdistrict (Z5) : 1.Pujungan 3.Kayan Hulu 5.Malinau Barat 7.Mentarang2.Sungai Boh 4.Kayan Hilir 6.Malinau Utara 8.Malinau Selatan
Fill this questionnaire by circling number (for closed questions) or write down answer (open questions) based on respondents answer and fill in box next to question.
household members
Z6. How many household members live in this house? _____ peopleZ7. How many household members in this house are adults (≥ 17 years)?
_____ people Z8. How many children (< 17 years) in this family? _____ pers.
Core QuesTions
C. Subjective WellbeingC1. What was the wellbeing of this family during the last year?
1. Insufficient 2. Medium 3. Good
Z5
Z6
Z7Z8
C1

�0 | Towards Wellbeing: Monitoring Poverty in Malinau, Indonesia
A. HealthA1. Was any household member so ill during the last year that they could not work/
attend school for 2 weeks or more? 1. Yes 2. No
A2. Did any household member seek medical care at the health clinic during the last year? 1. Yes 2. No
A3. Did any household member seek medical care at the hospital during the last year? 1. Yes 2. No
A4. Did this family ever experience a shortage of staple food during the last year? 1. Ever 2. Never
A5. How many times per week on average did this family consume meat or eggs or fish or chicken during the last month? 1. ≤ 2 times 2. 3–5 times 3. ≥ 6 times
A6. How many times did this family consume vegetables or fruit per week during the last month? 1. ≤ 2 times 2. 3–5 times 3. ≥ 6 times
B. WealthB1. Does this family have: a. Toilet (inside the house)? 1. no 2. yes b. Outboard engine or motorbike? 1. no 2. yes c. Chainsaw or refrigerator? 1. no 2. yesB2. Condition of house (Interviewer can observe, does not need to ask)
1. Below village standard 2. Standard (average) 3. Above village standard
B3. Does this house have electricity? 1. No 2. Yes, but out of order 3. Yes and functioning
B4. During the last year did any household member purchase new clothes? 1. No 2. Yes, 1–2 times 3. Yes, > 2 times
C. Subjective WellbeingC2. Compared to other households in this village, how is the wellbeing of this household?
1. Less than others 2. Same 3. Better than others
D. ServicesD1. How is the availability of school books?
1. Not available 3. Complete 2. Partly available 9. Not relevant
D2. How is the presence of teachers in elementary school? 1. Low (more often absent) 3. Always present 2. Sometimes present (more often present) 9. Not relevant
D3. How is the presence of medical staff and availability of medicines in the closest health clinic? 1. Absent/Not available 3. Always present/available 2. Sometimes present/available 9. Not relevant
A3
A4
A5
A6
B1aB1bB1cB2
B3
B4
C2
D1
A2
A1
D2
D3

Annexes | ��
D4. How were village development assistance programmes from the district government implemented (e.g. development funds, reforestation, agricultural assistance etc.) during the last year? 1. Never implemented 2. Implemented but disappointing, because _____________________________ _____________________________________________________________ 3. Satisfying, because ______________________________________________ _____________________________________________________________
99. Do not know should be indented a bit, now it looks like question numberD5. How useful were district government aid programmes for your family during the last
year? 1. Not useful 3. Useful 2. Not based on need 99. Do not know
E. KnowledgeE1. What is the highest level of education of adults in this family?
1. Not completed elementary school 2. Completed elementary school 3. Completed junior high school 4. Completed senior high school 5. Higher level than senior high school (college/university)
E2. Are there children of school going age (elementary or junior high school)? 1. No 2. Yes
E3. If the answer E2 is ‘Yes’, how is school attendance? 1. Never attending 3. Always attending 2. Sometimes attending 9. Not relevant
E4. Has any household member ever attended training or a course? 1. No 2. Yes
E5. Has any household member special skills that can generate income? e.g. midwifery, shaman, sowing, smithing, massage 1. No 2. Yes
E6. Are there any household members that are illiterate? 1. Yes 2. No
E7. During the last month have you: a. watched the news on TV? 1. No 2. Yes b. listened to news on the radio? 1. No 2. Yes c. read a newspaper 1. No 2. Yes d. read or heard letters/information or announcements from the district government?
1. No 2. Yes
environmenT
F. Economy F1. How many tins of rice did you plant on your swidden last year? _____ tinsF2. How many tins of rice did you plant on your paddy last year? _____ tinsF3. How many hectares of fallow do you own? _____ hectares
D4
D5
E1
E2
E3
E4
E5
E6
E7aE7bE7cE7d
F3
F1F2

�� | Towards Wellbeing: Monitoring Poverty in Malinau, Indonesia
F4. Does any household member have a regular income? 1. No 2. Yes
F5. What other sources of income did you have during the last year? a. Sale of vegetables, >5 times per month? 1. No 2. Yes b. Sale of livestock (chicken, pig, etc.), >5 times per year? 1. No 2. Yes c. Sale of homemade food (e.g. snacks, sago, drinks) more than 5 times per month?
1. No 2. Yes d. Sale of home industry (e.g. machete, carving, sowing, tools) > 5 times per year?
1. No 2. Yes e. Sale of minimum 100 kg of rice, during the last year? 1. No 2. Yes f. Sale of fish, bushmeat or forest products > 5 times?
1. No 2. Yes g. Collecting gaharu, > 3 times? 1. No 2. Yes h. Rent of outboard engine, chainsaw or other equipment? 1. No 2. Yes i. Honorarium? 1. No 2. Yes F5i j. Irregular jobs (chainsaw operator, boatman, farmhand, cook, medicine man,
masseur etc.)? Or other irregular salary? 1. No 2. Yes k. Remittance from children/family that live elsewhere? 1. No 2. Yes l. Other, _________________________________ 1. No 2. YesF6. Was the rice harvest enough for household consumption during the last year?
1. Not enough 3. More than enough 2. Enough 9. Not relevant
F7. Was the cassava yield enough for household consumption during the last year? 1. Not enough 2. Yes 9. Not relevant
F8. How easy was it to purchase basic goods during the last year? 1. Not available in this village 2. Sometimes available 3. Always available
F9. Does this family own: a. Tree crops, cacao, coffee, pepper, cinnamon, etc. (even only small)?
1. No 2. Yes b. Rice huller? 1. No 2. Yes c. Second house (incl. Good huts)? 1. No 2. Yes d. Land in Malinau, Tanjung Selor, Samarinda or elsewhere?
1. No 2. YesF10. Does any household member own valuable goods (e.g.; savings in bank, CU, gold)?
1. No 2. Yes
G. Natural EnvironmentG1. Does any household member make regular forest trips (more than once a month)?
1. No 2. Yes
If answer G1 ‘No, go directly to question H1.If answer G1 ‘Yes’, what products are important for your family’s wellbeing?
(Show the cards, circle appropriate answer. If answer to a is Yes [Y], ask part b and c!)
F4
F5aF5bF5c
F5iF5j
F5k
F6
F7
F8
F9a
F5d
F5eF5f
F5gF5h
F5l
F9d
F10
G1
F9cF9b

Annexes | ��
Product
a. Important Y – Yes N – No NA – Not available in our forest
b. Condition of product during last year in this village 1 Limited2 Enough for
household need
3 More than enough
c. Change of damage/extinction in next year 1 high2 Medium3 Low
G2 Deer Y N NA 1 2 3 1 2 3
G3 Rattan (sega or other species) Y N NA 1 2 3 1 2 3
G4 Sang leaves sang/nyelae/jalae Y N NA 1 2 3 1 2 3
G5 Kapur (kapun, ngai) or Meranti (tenak, hnaya, loop)
Y N NA 1 2 3 1 2 3
G6. Was there any logging in the village territory (by logging companies or big groups of outsiders) resulting in forest destruction during the last year? 1. Yes 2. No
H. Social EnvironmentH1. What is the level of self help (gotong royong) in this village?
1. Weak: when called most people do not participate or donate 2. Average: when called only few people do not participate or donate 3. Strong: when called most people participate or donate
H2. How is mutual trust in this village? 1. No trust (there are conflicts between groups) 2. Average, some level of trust 3. Strong mutual trust (unities)
H3. Were there any conflicts between villagers and outsiders during the last year? 1. Yes, resulting in material damage, people getting wounded or killed 2. There were tensions 3. No, there were no conflicts
I. Political EnvironmentI1. How were conflicts resolved in this village during the last year?
1. Seldom properly resolved, conflict still exists 2. Sometimes fully resolved 3. Fully resolved; quick and all parties satisfied
I2. How is tenure of your land (swidden, paddy and gardens)? 1. Weak: there is big chance that other people will take the land 2. Average: only small chance other people will take land 3. Strong: long-term tenure security
I3. If there is a village meeting, how do your household members participate? 1. Seldom participate in village meetings 2. Attend meeting, but seldom give opinion 3. Attend meeting and often give opinion
C. Subjective WellbeingC3. Do people in this family feel that you are well off?
1. No/Not yet 2. Average 3. Yes
G6
H1
H2
H3
I1
I2
I3
C3

�� | Towards Wellbeing: Monitoring Poverty in Malinau, Indonesia
Signature of interviewer: ____________________
Remarks:

CIFOR is a leading international forestry research organisation established in 1993 in response to global concerns about the social, environmental, and economic consequences of forest loss and degradation. CIFOR is dedicated to developing policies and technologies for sustainable use and management of forests, and for enhancing the well-being of people in developing countries who rely on tropical forests for their livelihoods. CIFOR is one of the 15 centres of the Consultative Group on International Agricultural Research (CGIAR). With headquarters in Bogor, Indonesia, CIFOR has offices in Brazil, Bolivia, Burkina Faso, Cameroon, Ethiopia, India, Zambia and Zimbabwe, and it works in over 30 other countries around the world.
DonorsCIFOR receives its major funding from governments, international organizations, private foundations and regional organizations. In 2006, CIFOR received financial support from Australia, Asian Development Bank (ADB), African Wildlife Foundation, Belgium, Canada, Carrefour, Cecoforma, China, Centre de coopération internationale en recherche agronomique pour le développement (CIRAD), Convention on Biological Diversity, Cordaid, Conservation International Foundation (CIF), European Commission, Finland, Food and Agriculture Organization of the United Nations (FAO), Ford Foundation, France, German Agency for Technical Cooperation (GTZ), German Federal Ministry for Economic Cooperation and Development (BMZ), German Foundation for International Cooperation, Global Forest Watch, Indonesia, Innovative Resource Management (IRM), International Institute for Environment and Development, International Development Research Centre (IDRC), International Fund for Agricultural Development (IFAD), International Tropical Timber Organization (ITTO), Israel, Italy, the World Conservation Union (IUCN), Japan, Korea, MacArthur Foundation, Netherlands, Norway, Netherlands Development Organization, Overseas Development Institute (ODI), Peruvian Secretariat for International Cooperation (RSCI), Philippines, Spain, Sweden, Swedish University of Agricultural Sciences (SLU), Switzerland, The Overbrook Foundation, The Tinker Foundation Incorporated, The Nature Conservancy (TNC), Tropical Forest Foundation, Tropenbos International, United States, United Kingdom, United Nations Environment Programme (UNEP), United Nations Educational, Scientific and Cultural Organization (UNESCO), United Nations Forum on Forests (UNFF), Wageningen International, World Bank, World Resources Institute (WRI) and World Wide Fund for Nature (WWF).

Towards Wellbeing: Monitoring Poverty in Malinau, Indonesia
Poverty is a persistent problem throughout Indonesia . With decentralization, local governments had a new direct role in alleviating poverty and local wellbeing. At the same time they could do so in accordance with local realities and development needs. Yet, there is little improvement in the wellbeing of rural people. Local governments may lack the necessary capacity and experience to reduce poverty effectively. This report shows how a local specific monitoring system can be developed and applied. The results of its application in Malinau provides an indicative view of poverty and shows which aspects of wellbeing are in critical condition and where interventions are most urgently needed. The report analyses povery causes and gives practical recommendations to help local government improve its development planning and poverty reduction.
This publication is one of three site reports from the study ‘Making local government more responsive to the poor: Developing indicators and tools to support sustainable livelihood development under decentralization’, conducted by CIFOR and partners in the districts of Kutai Barat and Malinau, Indonesia, and in the department of Pando, Bolivia. The reports analyse the impact of decentralisation on human wellbeing in forest-dependent communities and provide practical suggestions to improve local governments’ poverty alleviation policies and actions. The site reports are peer reviewed and published simultaneously on the web in downloadable format (www.cifor.cgiar.org/publications). Contact the project at [email protected] to request a copy.
Review of poverty alleviation and its indicators of forest-dependent rural poor
KABUPATEN MALINAU
I N T I M U N G
Towards W
ellbeing: Monitoring Poverty In M
alinau, IndonesiaM
oira Moeliono | G
odwin Lim
berg | Christian Gönner | Eva W
ollenberg | Ramses Iw
an
Towards WellbeingMonitoring Poverty in Malinau, Indonesia
Moira MoelionoGodwin LimbergChristian GönnerEva WollenbergRamses Iwan
ISBN 978-979-1412-45-2
Towards Wellbeing: Monitoring Poverty in Kutai Barat, Indonesia
01 a
Towards Wellbeing: Monitoring Poverty in Malinau, Indonesia
02 a
Towards Wellbeing: Forest Governance and Rural Change in Sena, Bolivia
03
SERIES
Menuju Kesejahteraan: Memantau Kemiskinan di Malinau, Indonesia
02 b
Menuju Kesejahteraan: Pemantauan Kemiskinan di Kutai Barat, Indonesia
01 b