town of hampton falls, nh
TRANSCRIPT
This Project was funded by a grant from the New Hampshire Estuaries Project, as authorized by the U.S. Environmental
Protection Agency pursuant to Section 320 of the Clean Water Act.
;
;
;
;
S T R E A M B U F F E R C H A R A C T E R I Z A T I O N S T U D Y
Coos
Grafton Carroll
Merrimack
Cheshire Hillsborough
SullivanBelknap
70°56'15"W
70°56'15"W
70°52'30"W
70°52'30"W
70°48'45"W
70°48'45"W
42°5
2'30"N
42°5
2'30"N
42°5
6'15"N
42°5
6'15"N
43°0
'0"N
43°0
'0"N
S T R E A M B U F F E R C H A R A C T E R I Z A T I O N S T U D Y
Complex Systems Research CenterInstitute for the Study of Earth, Oceans and SpaceUniversity of New Hampshire, DurhamJune, 2006
- Stream Buffers were created from 1:24,000-scaleNew Hampshire National Hydrography Dataset (NHNHD) stream centerlines (2005)- Impervious Surface data was generated from Landsat 5 TM (30m resolution) imagery (1990, 2000, 2005)- Land Use data was created from 1998 USGSDigital Orthophotoquads- Conservation Lands were based on April, 2006 version of GRANIT data layer
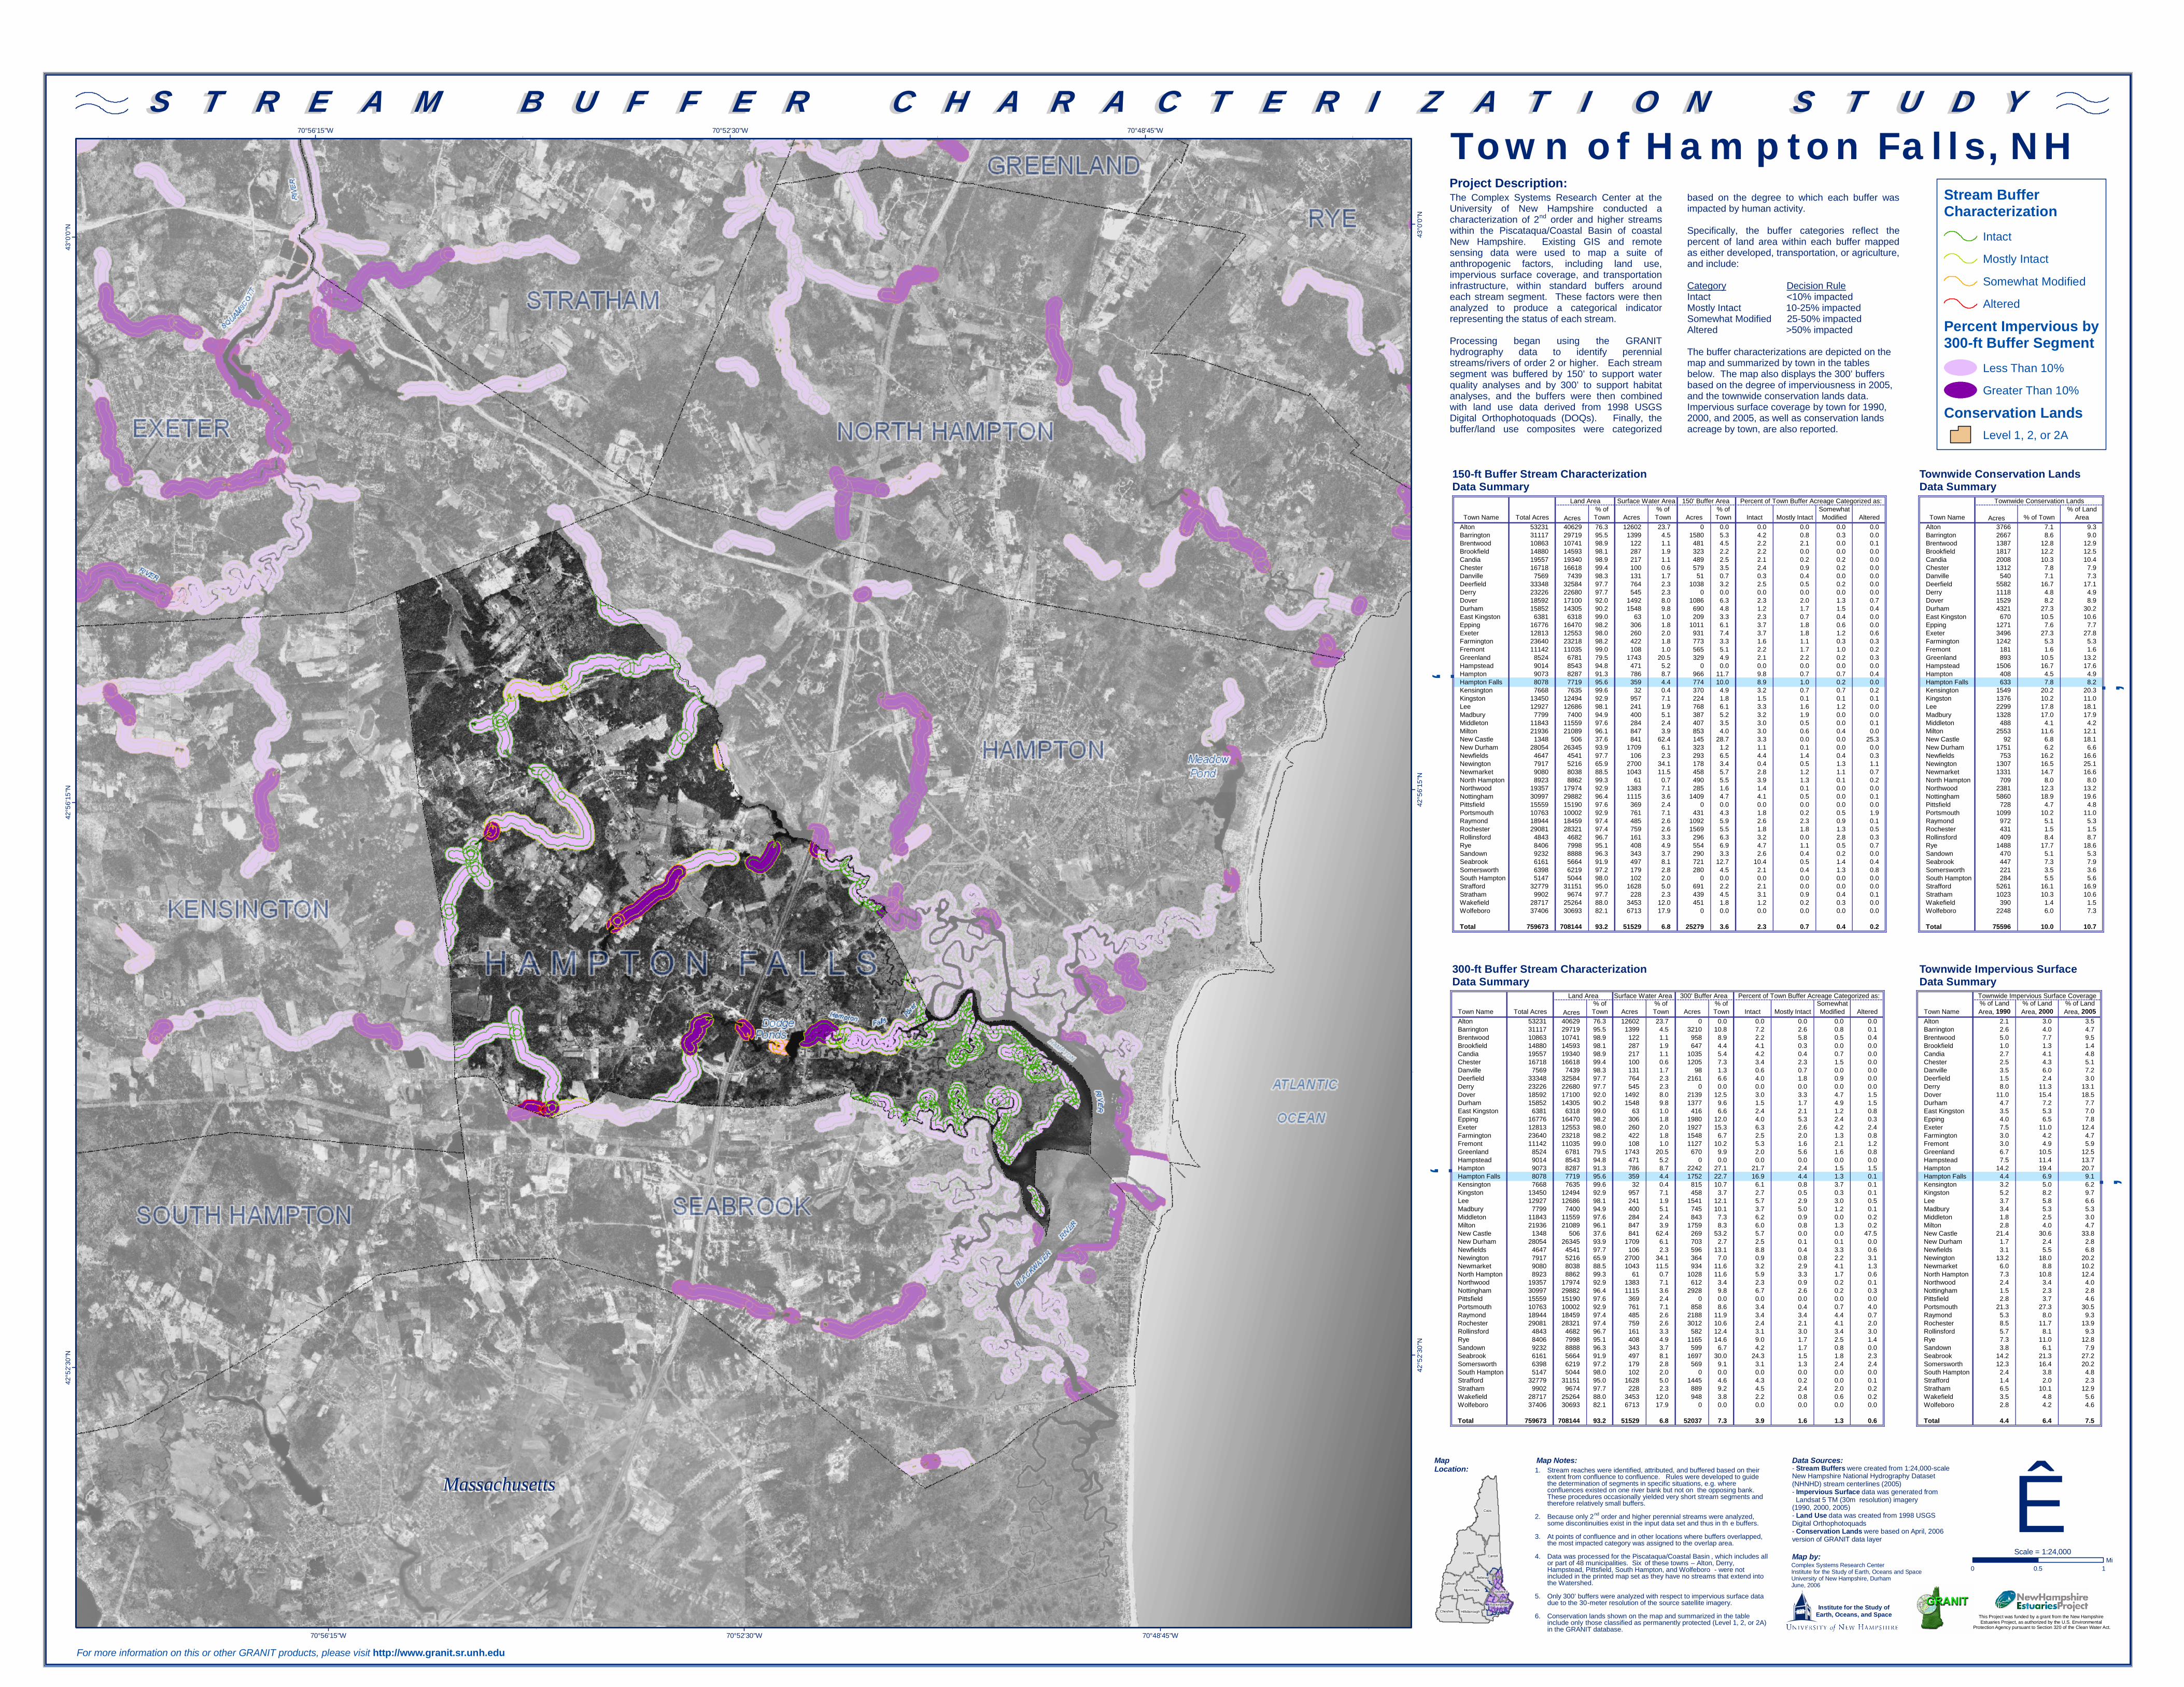
The Complex Systems Research Center at the University of New Hampshire conducted a characterization of 2nd order and higher streams within the Piscataqua/Coastal Basin of coastal New Hampshire. Existing GIS and remote sensing data were used to map a suite of anthropogenic factors, including land use, impervious surface coverage, and transportation infrastructure, within standard buffers around each stream segment. These factors were then analyzed to produce a categorical indicator representing the status of each stream. Processing began using the GRANIT hydrography data to identify perennial streams/rivers of order 2 or higher. Each stream segment was buffered by 150’ to support water quality analyses and by 300’ to support habitat analyses, and the buffers were then combined with land use data derived from 1998 USGS Digital Orthophotoquads (DOQs). Finally, the buffer/land use composites were categorized
based on the degree to which each buffer was impacted by human activity. Specifically, the buffer categories reflect the percent of land area within each buffer mapped as either developed, transportation, or agriculture, and include: Category Decision Rule Intact <10% impacted Mostly Intact 10-25% impacted Somewhat Modified 25-50% impacted Altered >50% impacted The buffer characterizations are depicted on the map and summarized by town in the tables below. The map also displays the 300’ buffers based on the degree of imperviousness in 2005, and the townwide conservation lands data. Impervious surface coverage by town for 1990, 2000, and 2005, as well as conservation lands acreage by town, are also reported.
Town of Hampton Falls, NH
Ê
Project Description:
Map Notes:
150-ft Buffer Stream Characterization Data Summary
300-ft Buffer Stream Characterization Data Summary
For more information on this or other GRANIT products, please visit http://www.granit.sr.unh.edu
1. Stream reaches were identified, attributed, and buffered based on their extent from confluence to confluence. Rules were developed to guide the determination of segments in specific situations, e.g. where confluences existed on one river bank but not on the opposing bank. These procedures occasionally yielded very short stream segments and therefore relatively small buffers.
2. Because only 2nd order and higher perennial streams were analyzed,
some discontinuities exist in the input data set and thus in th e buffers. 3. At points of confluence and in other locations where buffers overlapped,
the most impacted category was assigned to the overlap area. 4. Data was processed for the Piscataqua/Coastal Basin , which includes all
or part of 48 municipalities. Six of these towns – Alton, Derry, Hampstead, Pittsfield, South Hampton, and Wolfeboro - were not included in the printed map set as they have no streams that extend into the Watershed.
5. Only 300’ buffers were analyzed with respect to impervious surface data
due to the 30-meter resolution of the source satellite imagery. 6. Conservation lands shown on the map and summarized in the table
include only those classified as permanently protected (Level 1, 2, or 2A) in the GRANIT database.
Townwide Conservation Lands Data Summary
Townwide Impervious SurfaceData Summary
Data Sources:
Map by:
Map Location:
Surface Water Area
Town Name Total Acres Acres% of Town Acres
% of Town Acres
% of Town Intact Mostly Intact
Somewhat Modified Altered Town Name
% of Land Area, 1990
% of Land Area, 2000
% of Land Area, 2005
Alton 53231 40629 76.3 12602 23.7 0 0.0 0.0 0.0 0.0 0.0 Alton 2.1 3.0 3.5Barrington 31117 29719 95.5 1399 4.5 3210 10.8 7.2 2.6 0.8 0.1 Barrington 2.6 4.0 4.7Brentwood 10863 10741 98.9 122 1.1 958 8.9 2.2 5.8 0.5 0.4 Brentwood 5.0 7.7 9.5Brookfield 14880 14593 98.1 287 1.9 647 4.4 4.1 0.3 0.0 0.0 Brookfield 1.0 1.3 1.4Candia 19557 19340 98.9 217 1.1 1035 5.4 4.2 0.4 0.7 0.0 Candia 2.7 4.1 4.8Chester 16718 16618 99.4 100 0.6 1205 7.3 3.4 2.3 1.5 0.0 Chester 2.5 4.3 5.1Danville 7569 7439 98.3 131 1.7 98 1.3 0.6 0.7 0.0 0.0 Danville 3.5 6.0 7.2Deerfield 33348 32584 97.7 764 2.3 2161 6.6 4.0 1.8 0.9 0.0 Deerfield 1.5 2.4 3.0Derry 23226 22680 97.7 545 2.3 0 0.0 0.0 0.0 0.0 0.0 Derry 8.0 11.3 13.1Dover 18592 17100 92.0 1492 8.0 2139 12.5 3.0 3.3 4.7 1.5 Dover 11.0 15.4 18.5Durham 15852 14305 90.2 1548 9.8 1377 9.6 1.5 1.7 4.9 1.5 Durham 4.7 7.2 7.7East Kingston 6381 6318 99.0 63 1.0 416 6.6 2.4 2.1 1.2 0.8 East Kingston 3.5 5.3 7.0Epping 16776 16470 98.2 306 1.8 1980 12.0 4.0 5.3 2.4 0.3 Epping 4.0 6.5 7.8Exeter 12813 12553 98.0 260 2.0 1927 15.3 6.3 2.6 4.2 2.4 Exeter 7.5 11.0 12.4Farmington 23640 23218 98.2 422 1.8 1548 6.7 2.5 2.0 1.3 0.8 Farmington 3.0 4.2 4.7Fremont 11142 11035 99.0 108 1.0 1127 10.2 5.3 1.6 2.1 1.2 Fremont 3.0 4.9 5.9Greenland 8524 6781 79.5 1743 20.5 670 9.9 2.0 5.6 1.6 0.8 Greenland 6.7 10.5 12.5Hampstead 9014 8543 94.8 471 5.2 0 0.0 0.0 0.0 0.0 0.0 Hampstead 7.5 11.4 13.7Hampton 9073 8287 91.3 786 8.7 2242 27.1 21.7 2.4 1.5 1.5 Hampton 14.2 19.4 20.7Hampton Falls 8078 7719 95.6 359 4.4 1752 22.7 16.9 4.4 1.3 0.1 Hampton Falls 4.4 6.9 9.1Kensington 7668 7635 99.6 32 0.4 815 10.7 6.1 0.8 3.7 0.1 Kensington 3.2 5.0 6.2Kingston 13450 12494 92.9 957 7.1 458 3.7 2.7 0.5 0.3 0.1 Kingston 5.2 8.2 9.7Lee 12927 12686 98.1 241 1.9 1541 12.1 5.7 2.9 3.0 0.5 Lee 3.7 5.8 6.6Madbury 7799 7400 94.9 400 5.1 745 10.1 3.7 5.0 1.2 0.1 Madbury 3.4 5.3 5.3Middleton 11843 11559 97.6 284 2.4 843 7.3 6.2 0.9 0.0 0.2 Middleton 1.8 2.5 3.0Milton 21936 21089 96.1 847 3.9 1759 8.3 6.0 0.8 1.3 0.2 Milton 2.8 4.0 4.7New Castle 1348 506 37.6 841 62.4 269 53.2 5.7 0.0 0.0 47.5 New Castle 21.4 30.6 33.8New Durham 28054 26345 93.9 1709 6.1 703 2.7 2.5 0.1 0.1 0.0 New Durham 1.7 2.4 2.8Newfields 4647 4541 97.7 106 2.3 596 13.1 8.8 0.4 3.3 0.6 Newfields 3.1 5.5 6.8Newington 7917 5216 65.9 2700 34.1 364 7.0 0.9 0.8 2.2 3.1 Newington 13.2 18.0 20.2Newmarket 9080 8038 88.5 1043 11.5 934 11.6 3.2 2.9 4.1 1.3 Newmarket 6.0 8.8 10.2North Hampton 8923 8862 99.3 61 0.7 1028 11.6 5.9 3.3 1.7 0.6 North Hampton 7.3 10.8 12.4Northwood 19357 17974 92.9 1383 7.1 612 3.4 2.3 0.9 0.2 0.1 Northwood 2.4 3.4 4.0Nottingham 30997 29882 96.4 1115 3.6 2928 9.8 6.7 2.6 0.2 0.3 Nottingham 1.5 2.3 2.8Pittsfield 15559 15190 97.6 369 2.4 0 0.0 0.0 0.0 0.0 0.0 Pittsfield 2.8 3.7 4.6Portsmouth 10763 10002 92.9 761 7.1 858 8.6 3.4 0.4 0.7 4.0 Portsmouth 21.3 27.3 30.5Raymond 18944 18459 97.4 485 2.6 2188 11.9 3.4 3.4 4.4 0.7 Raymond 5.3 8.0 9.3Rochester 29081 28321 97.4 759 2.6 3012 10.6 2.4 2.1 4.1 2.0 Rochester 8.5 11.7 13.9Rollinsford 4843 4682 96.7 161 3.3 582 12.4 3.1 3.0 3.4 3.0 Rollinsford 5.7 8.1 9.3Rye 8406 7998 95.1 408 4.9 1165 14.6 9.0 1.7 2.5 1.4 Rye 7.3 11.0 12.8Sandown 9232 8888 96.3 343 3.7 599 6.7 4.2 1.7 0.8 0.0 Sandown 3.8 6.1 7.9Seabrook 6161 5664 91.9 497 8.1 1697 30.0 24.3 1.5 1.8 2.3 Seabrook 14.2 21.3 27.2Somersworth 6398 6219 97.2 179 2.8 569 9.1 3.1 1.3 2.4 2.4 Somersworth 12.3 16.4 20.2South Hampton 5147 5044 98.0 102 2.0 0 0.0 0.0 0.0 0.0 0.0 South Hampton 2.4 3.8 4.8Strafford 32779 31151 95.0 1628 5.0 1445 4.6 4.3 0.2 0.0 0.1 Strafford 1.4 2.0 2.3Stratham 9902 9674 97.7 228 2.3 889 9.2 4.5 2.4 2.0 0.2 Stratham 6.5 10.1 12.9Wakefield 28717 25264 88.0 3453 12.0 948 3.8 2.2 0.8 0.6 0.2 Wakefield 3.5 4.8 5.6Wolfeboro 37406 30693 82.1 6713 17.9 0 0.0 0.0 0.0 0.0 0.0 Wolfeboro 2.8 4.2 4.6
Total 759673 708144 93.2 51529 6.8 52037 7.3 3.9 1.6 1.3 0.6 Total 4.4 6.4 7.5
Townwide Impervious Surface CoverageLand Area 300' Buffer Area Percent of Town Buffer Acreage Categorized as:
Town Name Total Acres Acres% of Town Acres
% of Town Acres
% of Town Intact Mostly Intact
Somewhat Modified Altered Town Name Acres % of Town
% of Land Area
Alton 53231 40629 76.3 12602 23.7 0 0.0 0.0 0.0 0.0 0.0 Alton 3766 7.1 9.3Barrington 31117 29719 95.5 1399 4.5 1580 5.3 4.2 0.8 0.3 0.0 Barrington 2667 8.6 9.0Brentwood 10863 10741 98.9 122 1.1 481 4.5 2.2 2.1 0.0 0.1 Brentwood 1387 12.8 12.9Brookfield 14880 14593 98.1 287 1.9 323 2.2 2.2 0.0 0.0 0.0 Brookfield 1817 12.2 12.5Candia 19557 19340 98.9 217 1.1 489 2.5 2.1 0.2 0.2 0.0 Candia 2008 10.3 10.4Chester 16718 16618 99.4 100 0.6 579 3.5 2.4 0.9 0.2 0.0 Chester 1312 7.8 7.9Danville 7569 7439 98.3 131 1.7 51 0.7 0.3 0.4 0.0 0.0 Danville 540 7.1 7.3Deerfield 33348 32584 97.7 764 2.3 1038 3.2 2.5 0.5 0.2 0.0 Deerfield 5582 16.7 17.1Derry 23226 22680 97.7 545 2.3 0 0.0 0.0 0.0 0.0 0.0 Derry 1118 4.8 4.9Dover 18592 17100 92.0 1492 8.0 1086 6.3 2.3 2.0 1.3 0.7 Dover 1529 8.2 8.9Durham 15852 14305 90.2 1548 9.8 690 4.8 1.2 1.7 1.5 0.4 Durham 4321 27.3 30.2East Kingston 6381 6318 99.0 63 1.0 209 3.3 2.3 0.7 0.4 0.0 East Kingston 670 10.5 10.6Epping 16776 16470 98.2 306 1.8 1011 6.1 3.7 1.8 0.6 0.0 Epping 1271 7.6 7.7Exeter 12813 12553 98.0 260 2.0 931 7.4 3.7 1.8 1.2 0.6 Exeter 3496 27.3 27.8Farmington 23640 23218 98.2 422 1.8 773 3.3 1.6 1.1 0.3 0.3 Farmington 1242 5.3 5.3Fremont 11142 11035 99.0 108 1.0 565 5.1 2.2 1.7 1.0 0.2 Fremont 181 1.6 1.6Greenland 8524 6781 79.5 1743 20.5 329 4.9 2.1 2.2 0.2 0.3 Greenland 893 10.5 13.2Hampstead 9014 8543 94.8 471 5.2 0 0.0 0.0 0.0 0.0 0.0 Hampstead 1506 16.7 17.6Hampton 9073 8287 91.3 786 8.7 966 11.7 9.8 0.7 0.7 0.4 Hampton 408 4.5 4.9Hampton Falls 8078 7719 95.6 359 4.4 774 10.0 8.9 1.0 0.2 0.0 Hampton Falls 633 7.8 8.2Kensington 7668 7635 99.6 32 0.4 370 4.9 3.2 0.7 0.7 0.2 Kensington 1549 20.2 20.3Kingston 13450 12494 92.9 957 7.1 224 1.8 1.5 0.1 0.1 0.1 Kingston 1376 10.2 11.0Lee 12927 12686 98.1 241 1.9 768 6.1 3.3 1.6 1.2 0.0 Lee 2299 17.8 18.1Madbury 7799 7400 94.9 400 5.1 387 5.2 3.2 1.9 0.0 0.0 Madbury 1328 17.0 17.9Middleton 11843 11559 97.6 284 2.4 407 3.5 3.0 0.5 0.0 0.1 Middleton 488 4.1 4.2Milton 21936 21089 96.1 847 3.9 853 4.0 3.0 0.6 0.4 0.0 Milton 2553 11.6 12.1New Castle 1348 506 37.6 841 62.4 145 28.7 3.3 0.0 0.0 25.3 New Castle 92 6.8 18.1New Durham 28054 26345 93.9 1709 6.1 323 1.2 1.1 0.1 0.0 0.0 New Durham 1751 6.2 6.6Newfields 4647 4541 97.7 106 2.3 293 6.5 4.4 1.4 0.4 0.3 Newfields 753 16.2 16.6Newington 7917 5216 65.9 2700 34.1 178 3.4 0.4 0.5 1.3 1.1 Newington 1307 16.5 25.1Newmarket 9080 8038 88.5 1043 11.5 458 5.7 2.8 1.2 1.1 0.7 Newmarket 1331 14.7 16.6North Hampton 8923 8862 99.3 61 0.7 490 5.5 3.9 1.3 0.1 0.2 North Hampton 709 8.0 8.0Northwood 19357 17974 92.9 1383 7.1 285 1.6 1.4 0.1 0.0 0.0 Northwood 2381 12.3 13.2Nottingham 30997 29882 96.4 1115 3.6 1409 4.7 4.1 0.5 0.0 0.1 Nottingham 5860 18.9 19.6Pittsfield 15559 15190 97.6 369 2.4 0 0.0 0.0 0.0 0.0 0.0 Pittsfield 728 4.7 4.8Portsmouth 10763 10002 92.9 761 7.1 431 4.3 1.8 0.2 0.5 1.9 Portsmouth 1099 10.2 11.0Raymond 18944 18459 97.4 485 2.6 1092 5.9 2.6 2.3 0.9 0.1 Raymond 972 5.1 5.3Rochester 29081 28321 97.4 759 2.6 1569 5.5 1.8 1.8 1.3 0.5 Rochester 431 1.5 1.5Rollinsford 4843 4682 96.7 161 3.3 296 6.3 3.2 0.0 2.8 0.3 Rollinsford 409 8.4 8.7Rye 8406 7998 95.1 408 4.9 554 6.9 4.7 1.1 0.5 0.7 Rye 1488 17.7 18.6Sandown 9232 8888 96.3 343 3.7 290 3.3 2.6 0.4 0.2 0.0 Sandown 470 5.1 5.3Seabrook 6161 5664 91.9 497 8.1 721 12.7 10.4 0.5 1.4 0.4 Seabrook 447 7.3 7.9Somersworth 6398 6219 97.2 179 2.8 280 4.5 2.1 0.4 1.3 0.8 Somersworth 221 3.5 3.6South Hampton 5147 5044 98.0 102 2.0 0 0.0 0.0 0.0 0.0 0.0 South Hampton 284 5.5 5.6Strafford 32779 31151 95.0 1628 5.0 691 2.2 2.1 0.0 0.0 0.0 Strafford 5261 16.1 16.9Stratham 9902 9674 97.7 228 2.3 439 4.5 3.1 0.9 0.4 0.1 Stratham 1023 10.3 10.6Wakefield 28717 25264 88.0 3453 12.0 451 1.8 1.2 0.2 0.3 0.0 Wakefield 390 1.4 1.5Wolfeboro 37406 30693 82.1 6713 17.9 0 0.0 0.0 0.0 0.0 0.0 Wolfeboro 2248 6.0 7.3
Total 759673 708144 93.2 51529 6.8 25279 3.6 2.3 0.7 0.4 0.2 Total 75596 10.0 10.7
Townwide Conservation LandsLand Area 150' Buffer Area Percent of Town Buffer Acreage Categorized as:Surface Water Area
0 10.5Mi
Scale = 1:24,000
Strafford
Rockingham
MassachusettsMassachusetts
Institute for the Study ofEarth, Oceans, and Space
Stream BufferCharacterization
IntactMostly IntactSomewhat ModifiedAltered
Percent Impervious by300-ft Buffer Segment
Less Than 10%Greater Than 10%
Conservation LandsLevel 1, 2, or 2A