town of lexington economic development summit
TRANSCRIPT

Town of LexingtonEconomic Development Summit
2017
Joint Meeting Board of Selectmen & Planning BoardPresented by the Economic Development Office and EDAC – June 22, 2017
1

Meeting Objectives
1. Data review on the Town’s commercial environment
2. Discuss options the Town might consider to support and enhance the commercial environment
2

3
Population = 32,700
Average Age = 45.3
Owner occupied = 75%
Largest group = Female 45-54
Smallest group = Male 20-24
Lexington’s Profile
Source: ESRI Business Analyst, 2017
100%
4
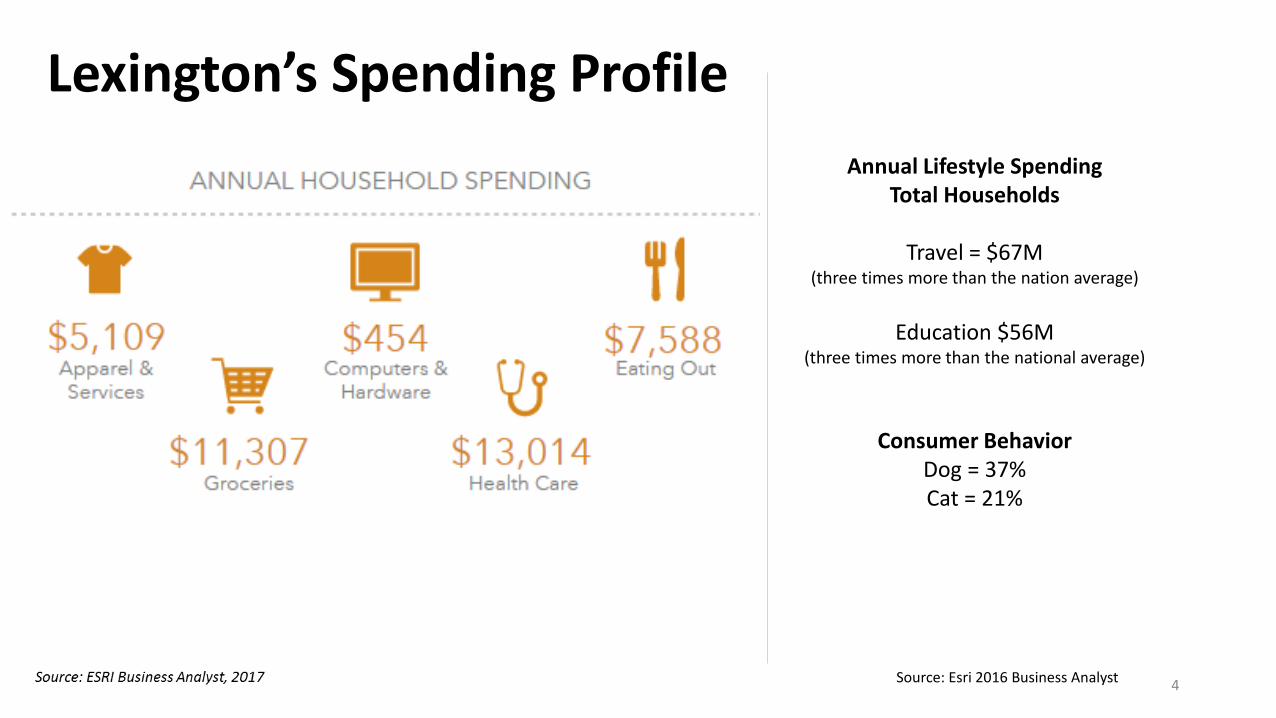
Lexington’s Spending Profile
Annual Lifestyle Spending Total Households
Travel = $67M (three times more than the nation average)
Education $56M (three times more than the national average)
Consumer BehaviorDog = 37%Cat = 21%
Source: Esri 2016 Business Analyst

5
Daytime Population: 38,747
Largest Sector: Science and Health Care
Lexington, Workforce
Top Employers in Town:
Company Name Product/Function Employees
MIT Lincoln Laboratory Research/Communications 3,500
Shire Pharmaceuticals Biotech & Pharmaceutical 2,400
BAE Systems Sensor Systems 530
Brookhaven at Lexington Health Care 220
Cotting School Education 182
Beth Israel Deaconess Medical Center/Children's Hospital Health Care 175

Lexington’s Organizing Principals
Lexington
Education
PhysicalCharacter
Economic Health
Diversity
Services
Environ-ment
6

Challenges
7
CostsMajor school and public safety investments will reduce the Capital Stabilization Fund to zero in by 2024
High Property ValuesFactors: Regional housing storage, strong demand given proximity to inner core, reputable school system, and desirable housing
Stagnate Commercial Factors: Limited commercial land, restrictive zoning, and shifts in market preferences have contributed to a decrease in proportion of commercial values

Lexington’s Proposed Capital Projects & Costs
8
$200 Million in Projects
6 school-related projects = $142.2M2 public safety projects = $45.8M1 community center project = $8M
Future projects may also include: A new high school or renovation & additional capacity for elementary

Proposed Debt Mitigated with Capital Stabilization Fund
9
Planning ahead & saving a
portion of the annual tax levy led
to $26M
Current projects will deplete the
Capital Stabilization
Fund by FY2024

Impact on Residential Tax Bill
10
• Board of Selectmen do not have a written policy on the range targeted for increases• Annual Average Increase 2.8% for the next 9 years (assumes FY16 values as constant)

11
9,1099,584
10,03210,441
10,906
11,481
12,191
12,95513,506
$0
$2,000
$4,000
$6,000
$8,000
$10,000
$12,000
$14,000
$16,000
2008 2009 2010 2011 2012 2013 2014 2015 2016 2017 2018
Year
TAX BILL FOR AVERAGE SINGLE-FAMILY HOUSELexington 2009-2017
Single Family Tax Bill
48% increase between
2009 to 2017on the average SF
tax billFY17 = $13,506

0
20000000
40000000
60000000
80000000
100000000
120000000
140000000
2006 2007 2008 2009 2010 2011 2012 2013 2014 2015 2016
PROPERTY TAX LEVY COLLECTED 2006 - 2016RESIDENTIAL CIP
Residential $129M
CIP$33.7M

13
2010 2011 2012 2013 2014 2015 2016
Levy Growth from New Residential Construction $1,206,197 $1,112,487 $1,222,142 $1,400,099 $1,451,904 $1,686,061 $1,712,987
Levy Growth from New Industrial/Commercial Construction $206,414 $1,208,359 $960,174 $1,297,354 $635,052 $408,312 $197,429
$0
$200,000
$400,000
$600,000
$800,000
$1,000,000
$1,200,000
$1,400,000
$1,600,000
$1,800,000
Fiscal Year
NEW GROWTH TREND FOR COMMERCIAL vs. RESIDENTIAL2010 - 2016
Levy Growth from New Residential Construction Levy Growth from New Industrial/Commercial Construction

Lexington Commercial Compared Source: MA Department of Revenue
14
0
500000000
1E+09
1.5E+09
2E+09
2.5E+09
3E+09
3.5E+09
Bedford Burlington Lexington Waltham
Commercial, Industrial, and Property Assessed Values 2009 - 2016
Bedford, Burlington, Lexington and Waltham
2009 2010 2011 2012 2013 2014 2015 2016
Percent Increase since 2009
Burlington = 24%Waltham = 21%Lexington = 14%
Bedford = 1%

15
12% CIP Value, FY16
Decreased by Half
1986 CIP Value = 24%

16
1986$0.31
2007$0.20
2017$0.21

17

Existing Built Environment
Total number buildings:
10,693
Total number of commercial buildings:
463
18
85%
4%
9%
2% 0%
Lexington's Real Property Classifications FY17
Single Family Homes
Commercial/Industrial Buildings
Condos
Two-Family and Three Family
Apartments/Multi-buildings

19
Lexington’s Commercial Districts
Total Town Area: 16.6 Square Miles
Commercially designated land:6%(approx. 1 square mile)

Commercial Construction
• 1960 – 1970’sMost commercial built
• Significant drop after the 1980’s

Change in Land Use Polices
Prior to 1980s
No FAR restrictions
1984
Restrict height to 2 stories in Town Center
CM & CRO FAR Limited to .25
By Planning Board
1987
FAR changed to 0.15 by Citizen’s Petition
Adopted “Transportation Trip
Wire” = High Threshold for
Mitigation
2009
FAR in the Hartwell increased to .35
Source: Town Meeting Members Association, Warrant Information Reports21
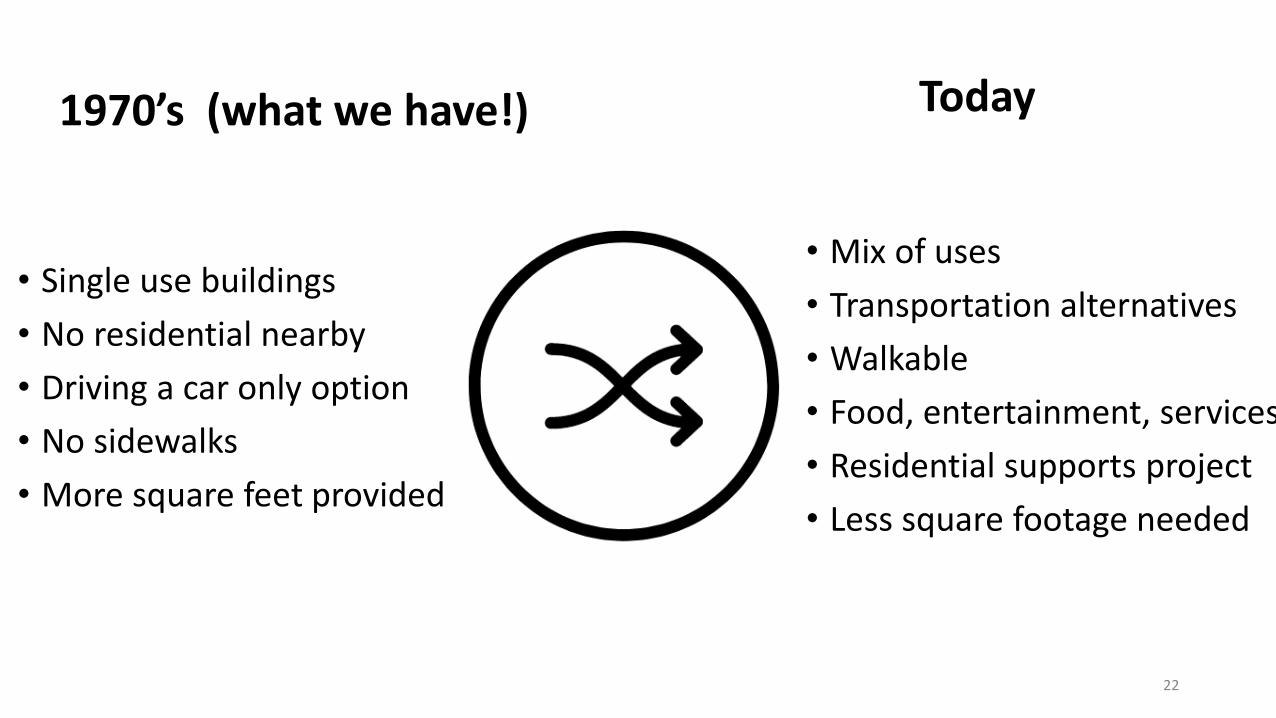
1970’s (what we have!)
• Single use buildings
• No residential nearby
• Driving a car only option
• No sidewalks
• More square feet provided
Today
• Mix of uses
• Transportation alternatives
• Walkable
• Food, entertainment, services
• Residential supports project
• Less square footage needed
22

23

24

25

Lack of Investment
26
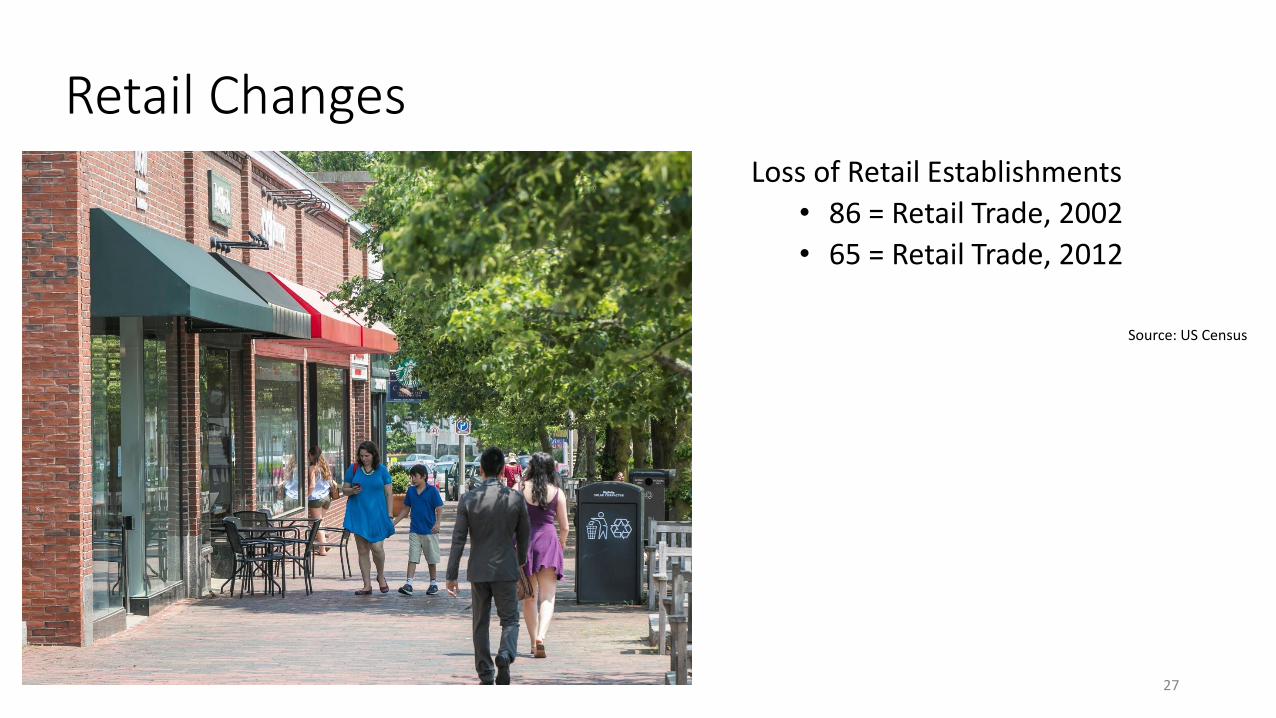
Retail ChangesLoss of Retail Establishments
• 86 = Retail Trade, 2002
• 65 = Retail Trade, 2012
Source: US Census
27
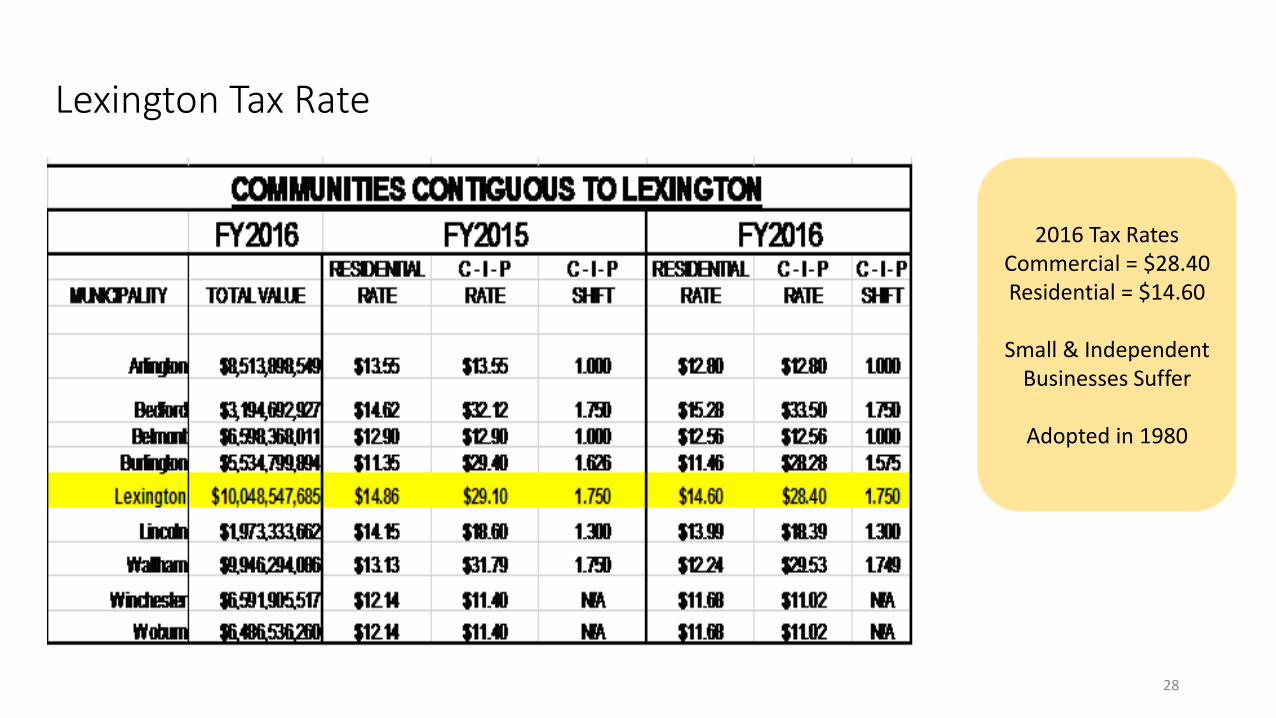
Lexington Tax Rate
28
2016 Tax RatesCommercial = $28.40Residential = $14.60
Small & Independent Businesses Suffer
Adopted in 1980

29
FY2016
Square Feet Assessed Value %of AV
CD = PLANNED COMMERCIAL
2,212,250 $410,691,000 40%
CM = MANUFACTURING
1,854,680 $250,817,000 24%
CRO = REGIONAL OFFICE
1,216,600 $156,446,000 15%
CB = CENTRAL BUSINESS
488,300 $85,816,000 8%
CR = RETAIL SERVICE
425,130 $74,172,000 7%
CLO = LOCAL OFFICE
273,360 $28,862,000 3%
CN = NEIGHBORHOOD BUSINESS
104,410 $18,485,000 2%
CS = SERVICE BUSINESS
49,640 $7,439,000 1%
TOTAL 6,624,370 $1,032,728,000
30
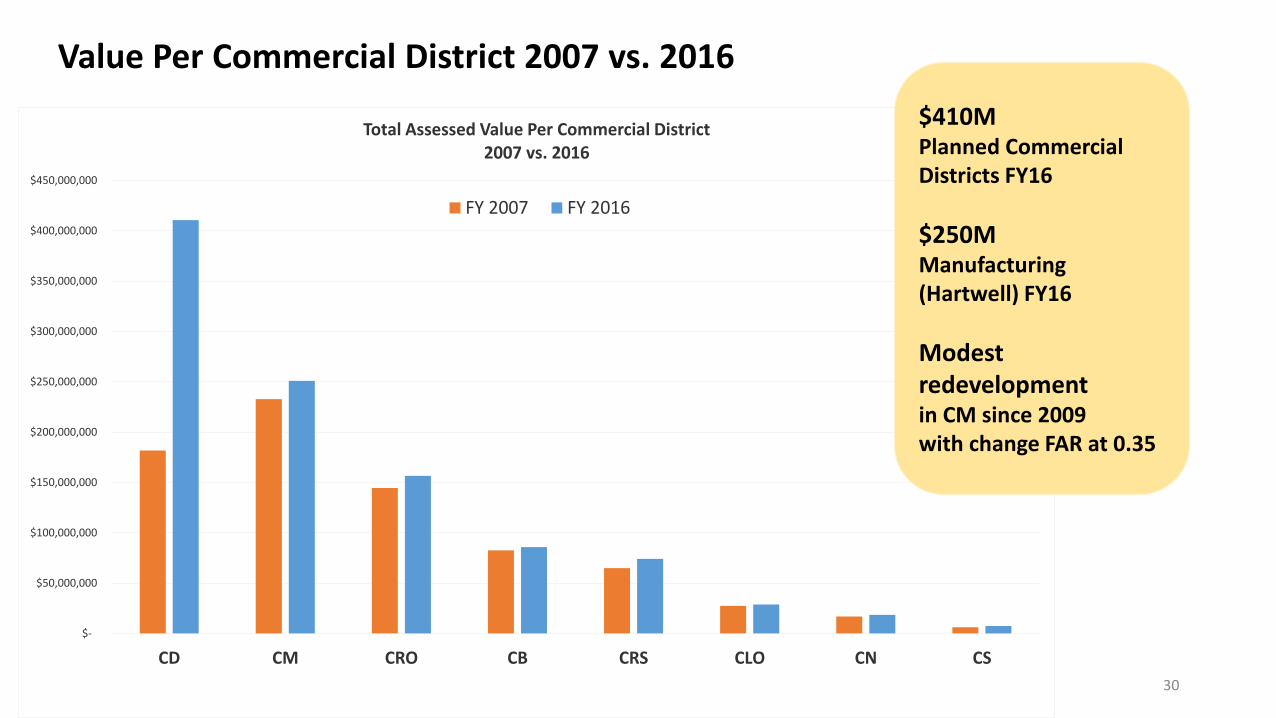
$-
$50,000,000
$100,000,000
$150,000,000
$200,000,000
$250,000,000
$300,000,000
$350,000,000
$400,000,000
$450,000,000
CD CM CRO CB CRS CLO CN CS
Total Assessed Value Per Commercial District2007 vs. 2016
FY 2007 FY 2016
Value Per Commercial District 2007 vs. 2016
$410MPlanned Commercial Districts FY16
$250M Manufacturing (Hartwell) FY16
Modest redevelopment in CM since 2009 with change FAR at 0.35

Options to Enhance Commercial Potential Today
31
32
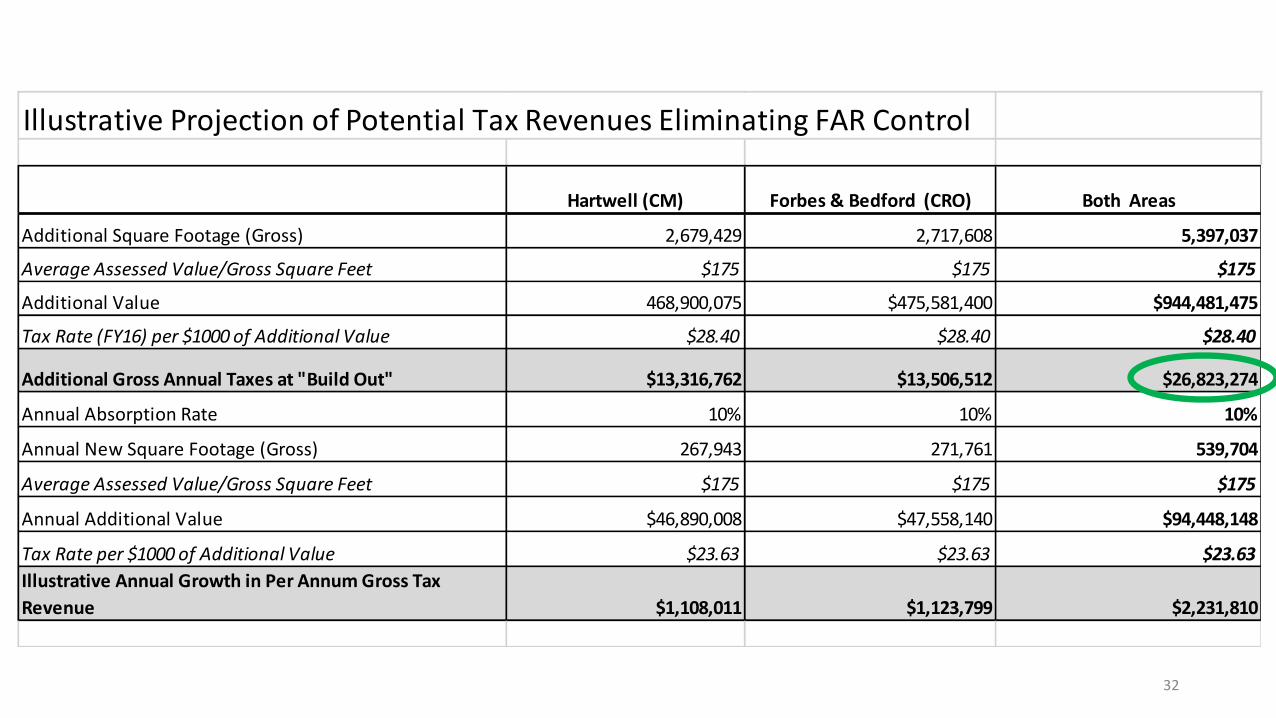
Illustrative Projection of Potential Tax Revenues Eliminating FAR Control
Hartwell (CM) Forbes & Bedford (CRO) Both Areas
Additional Square Footage (Gross) 2,679,429 2,717,608 5,397,037
Average Assessed Value/Gross Square Feet $175 $175 $175
Additional Value 468,900,075 $475,581,400 $944,481,475
Tax Rate (FY16) per $1000 of Additional Value $28.40 $28.40 $28.40
Additional Gross Annual Taxes at "Build Out" $13,316,762 $13,506,512 $26,823,274
Annual Absorption Rate 10% 10% 10%
Annual New Square Footage (Gross) 267,943 271,761 539,704
Average Assessed Value/Gross Square Feet $175 $175 $175
Annual Additional Value $46,890,008 $47,558,140 $94,448,148
Tax Rate per $1000 of Additional Value $23.63 $23.63 $23.63
Illustrative Annual Growth in Per Annum Gross Tax
Revenue $1,108,011 $1,123,799 $2,231,810
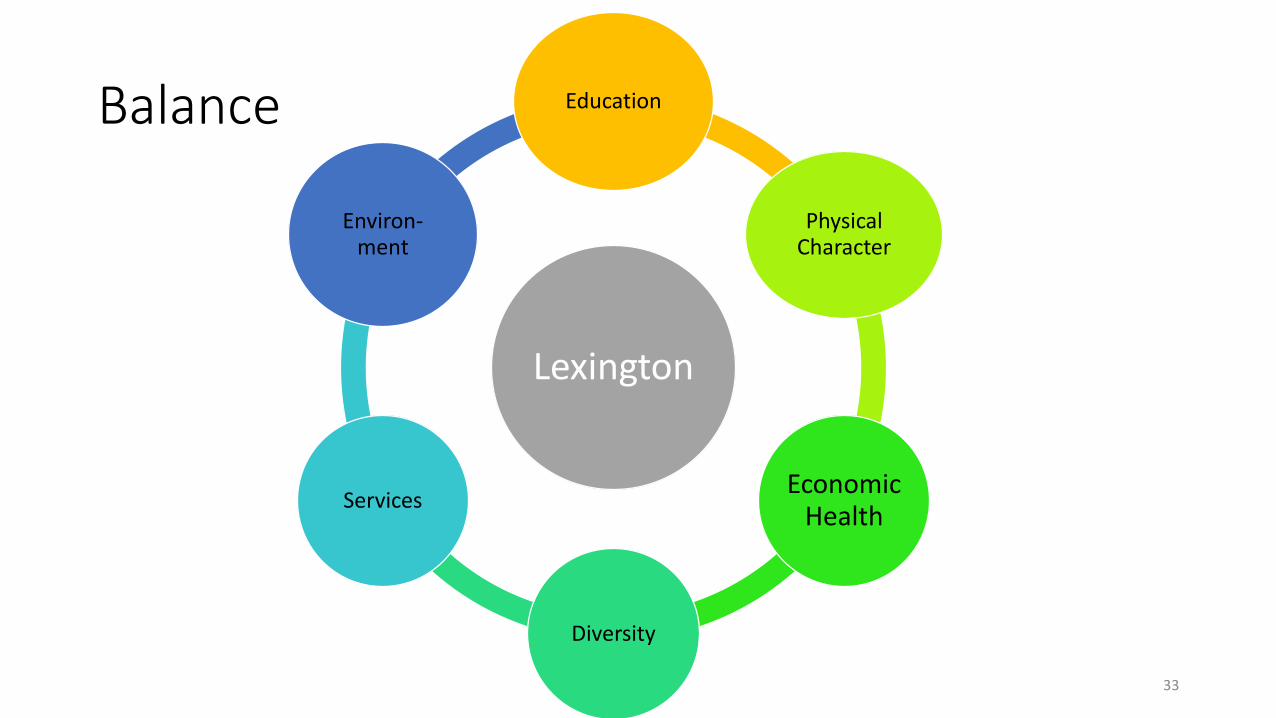
Balance
Lexington
Education
PhysicalCharacter
Economic Health
Diversity
Services
Environ-ment
33

34
Hartwell, Forbes, & Spring

Hartwell, Forbes, & Spring
Invest
• Hire a real estate analyst and coordinate with property owners run proformas to test zoning alternatives
• Contribute to the REV operations annually
• Develop a brand identity for commercial areas and coordinate with a marketing consultant – life sciences cluster
• Invest in transportation infrastructure
Adopt New Zoning
•Eliminate the FAR in the CM and CRO and allow for mixed use by-right
• Support private efforts that included infill development and housing options
Prioritize Staff Efforts
• Identify a team who can champion economic development with EDAC and EDO
• Create a life sciences collaborative with local residents who are leaders in the field to inform Town officials of trends in the industry
• Explore TIF, DIF and MassWorkGrants to fund transportation infrastructure
35

36
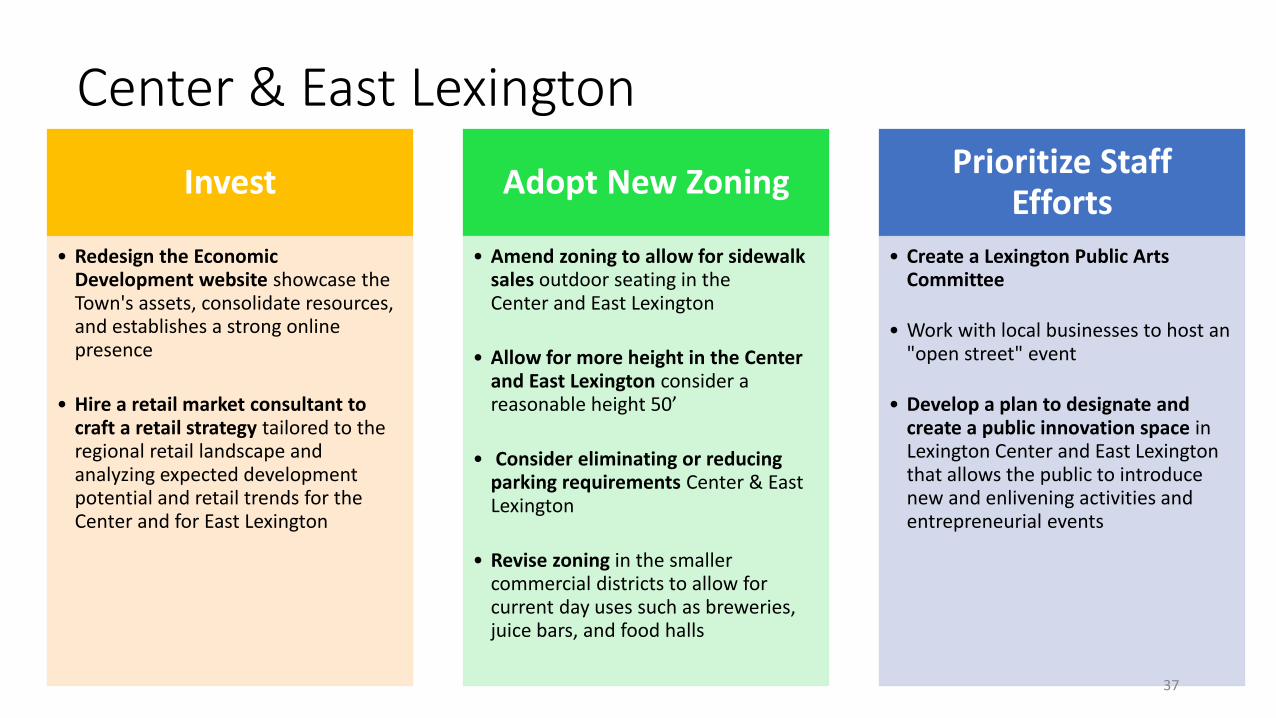
Center & East Lexington
Center & East Lexington
Invest
• Redesign the Economic Development website showcase the Town's assets, consolidate resources, and establishes a strong online presence
• Hire a retail market consultant to craft a retail strategy tailored to the regional retail landscape and analyzing expected development potential and retail trends for the Center and for East Lexington
Adopt New Zoning
• Amend zoning to allow for sidewalk sales outdoor seating in the Center and East Lexington
• Allow for more height in the Center and East Lexington consider a reasonable height 50’
• Consider eliminating or reducing parking requirements Center & East Lexington
• Revise zoning in the smaller commercial districts to allow for current day uses such as breweries, juice bars, and food halls
Prioritize Staff Efforts
• Create a Lexington Public Arts Committee
• Work with local businesses to host an "open street" event
• Develop a plan to designate and create a public innovation space in Lexington Center and East Lexington that allows the public to introduce new and enlivening activities and entrepreneurial events
37

Trade-offsBenefits
• Increased Revenue
• Alleviate Tax Burden for Seniors & Working-class residents
• New Housing Options
• Support Local Businesses
Impacts
• People & school-age
• Traffic
• Alter Suburban Character
38

Questions and Discussion
39
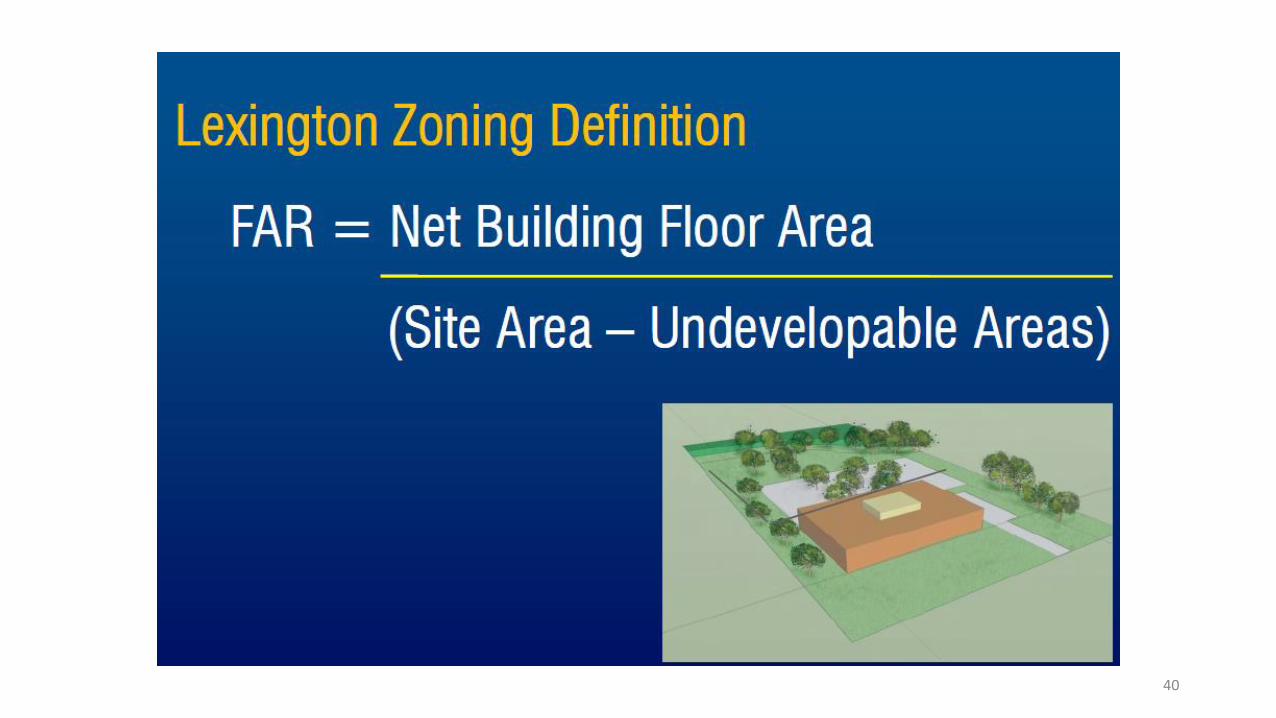
40

FAR @ .15
Model Existing Building
41

FAR @ 0.9
Model Existing Building
42