town of stonington coastal resilience plan · town of stonington coastal resilience plan update...
TRANSCRIPT
Town of Stonington Coastal Resilience Plan
Update with new
image – front of
resilience plan
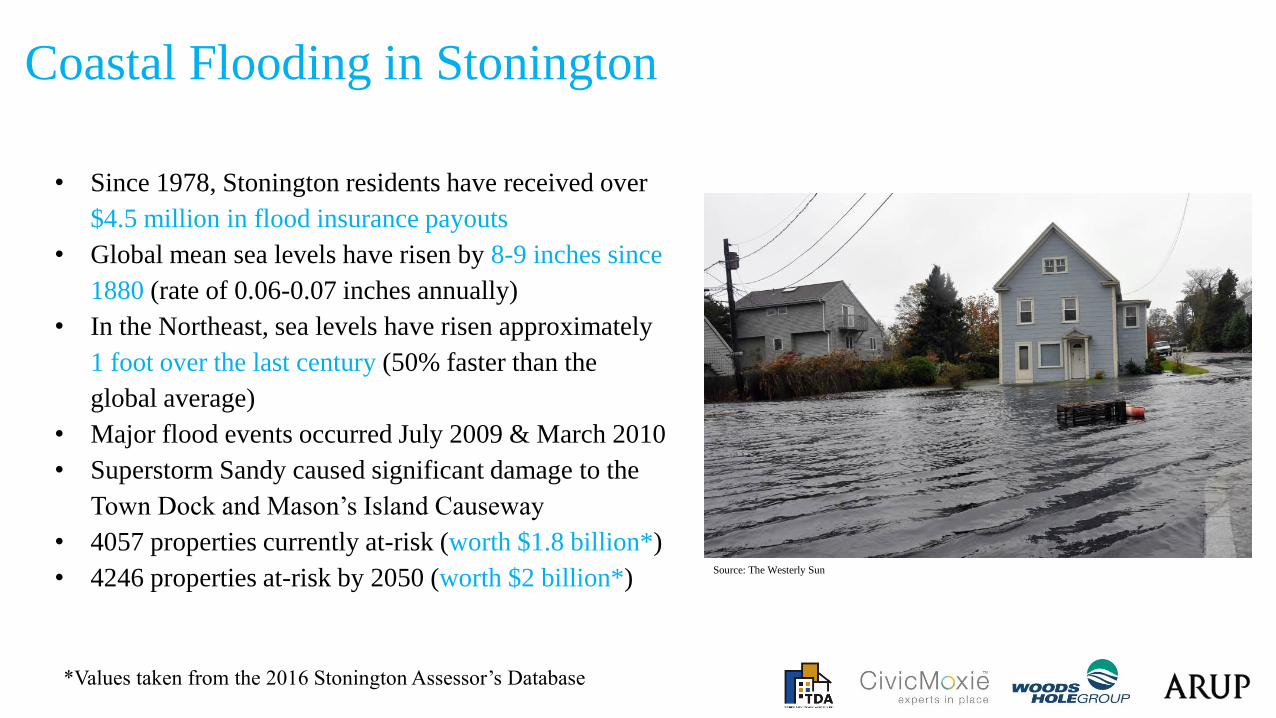
Coastal Flooding in Stonington
• Since 1978, Stonington residents have received over
$4.5 million in flood insurance payouts
• Global mean sea levels have risen by 8-9 inches since
1880 (rate of 0.06-0.07 inches annually)
• In the Northeast, sea levels have risen approximately
1 foot over the last century (50% faster than the
global average)
• Major flood events occurred July 2009 & March 2010
• Superstorm Sandy caused significant damage to the
Town Dock and Mason’s Island Causeway
• 4057 properties currently at-risk (worth $1.8 billion*)
• 4246 properties at-risk by 2050 (worth $2 billion*)Source: The Westerly Sun
*Values taken from the 2016 Stonington Assessor’s Database
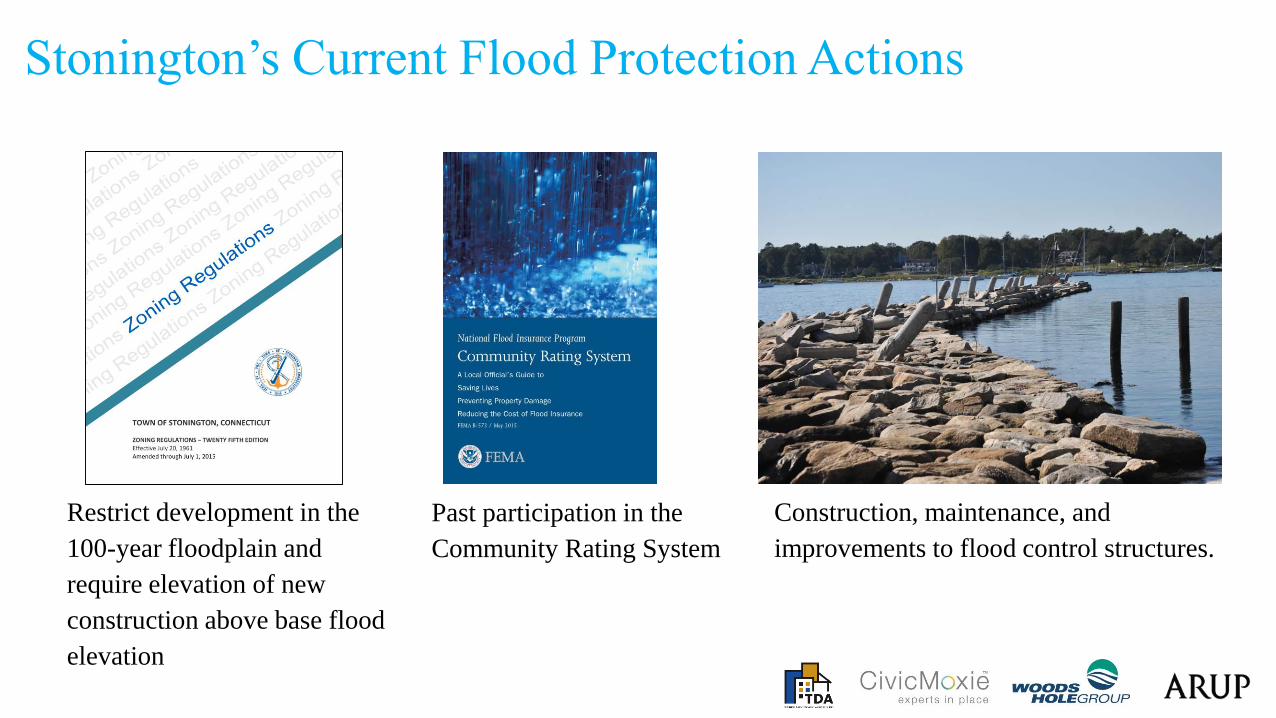
Stonington’s Current Flood Protection Actions
Restrict development in the
100-year floodplain and
require elevation of new
construction above base flood
elevation
Construction, maintenance, and
improvements to flood control structures.
Past participation in the
Community Rating System
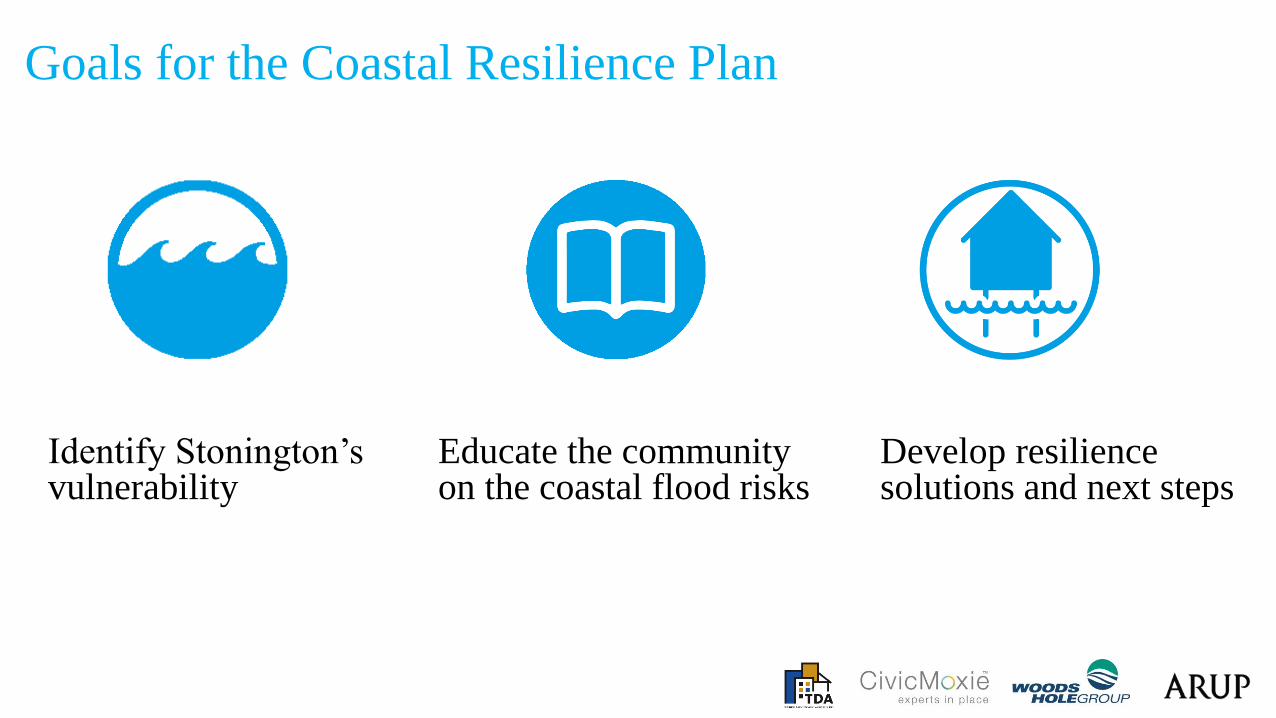
Goals for the Coastal Resilience Plan
Identify Stonington’s vulnerability
Educate the community on the coastal flood risks
Develop resilience solutions and next steps
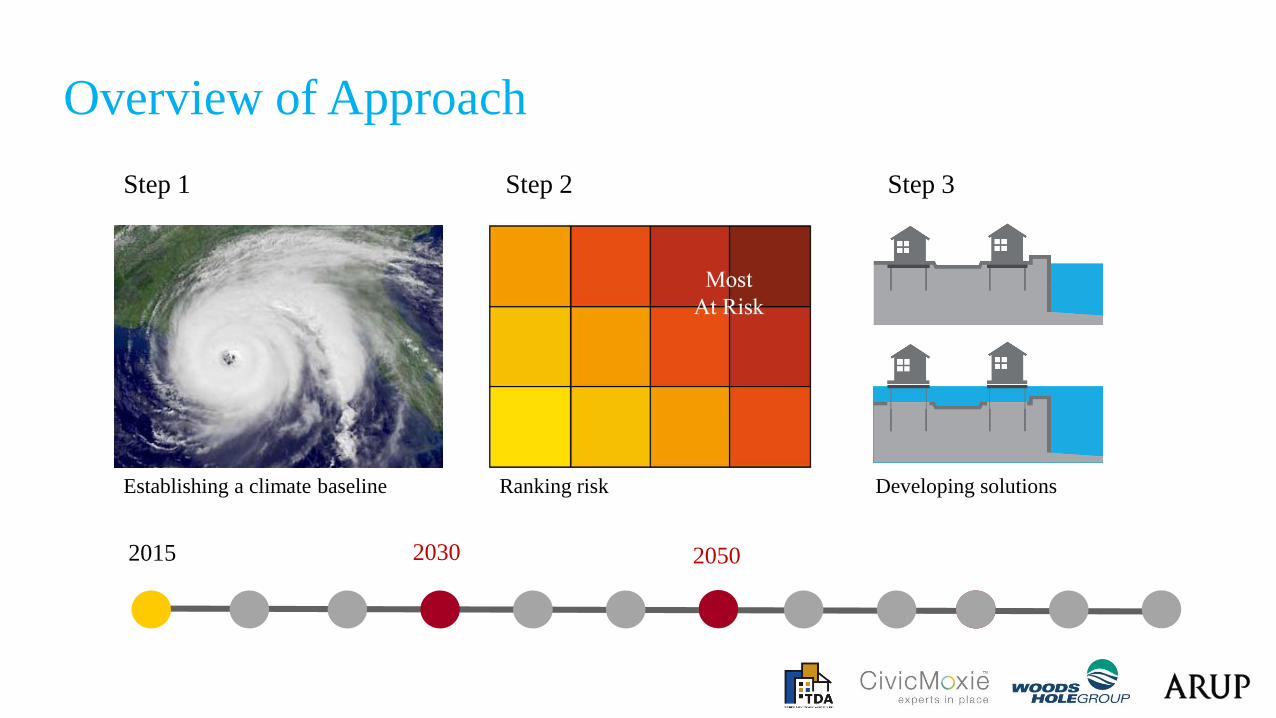
Overview of Approach
Step 1 Step 2 Step 3
Establishing a climate baseline Ranking risk Developing solutions
2015 2030 2050
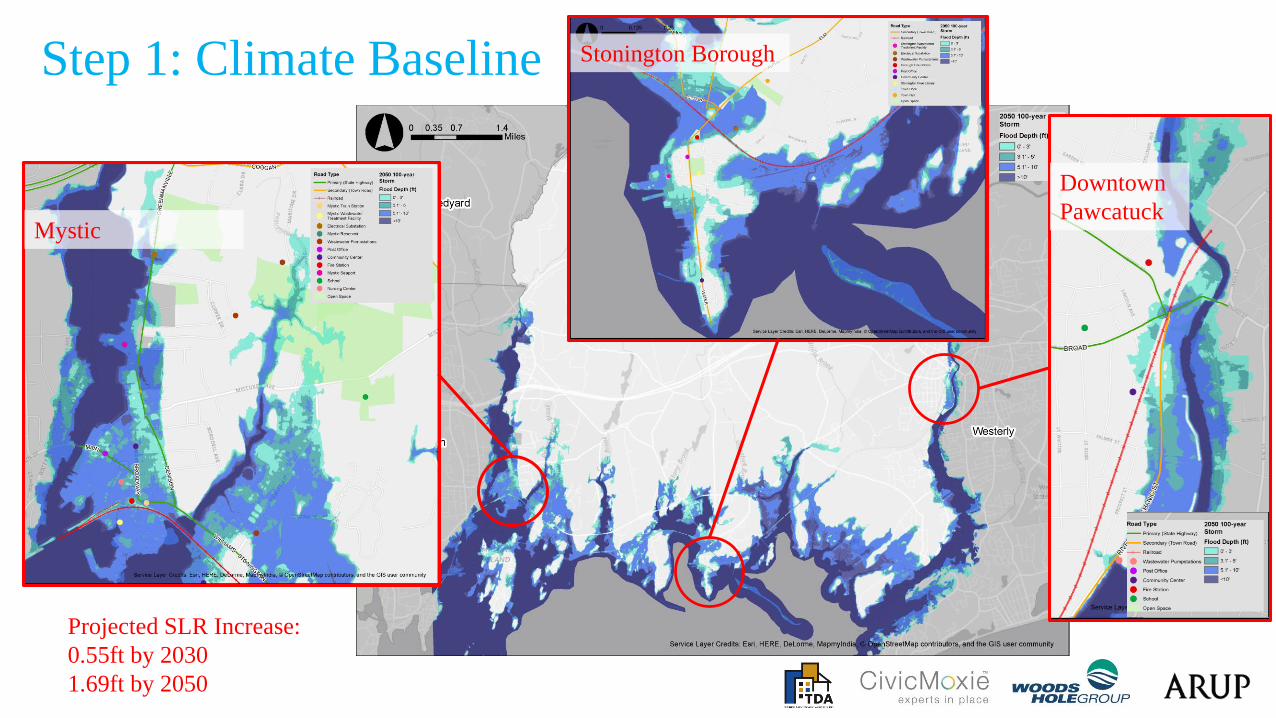
Step 1: Climate Baseline
Mystic
Stonington Borough
Downtown
Pawcatuck
Projected SLR Increase:
0.55ft by 2030
1.69ft by 2050
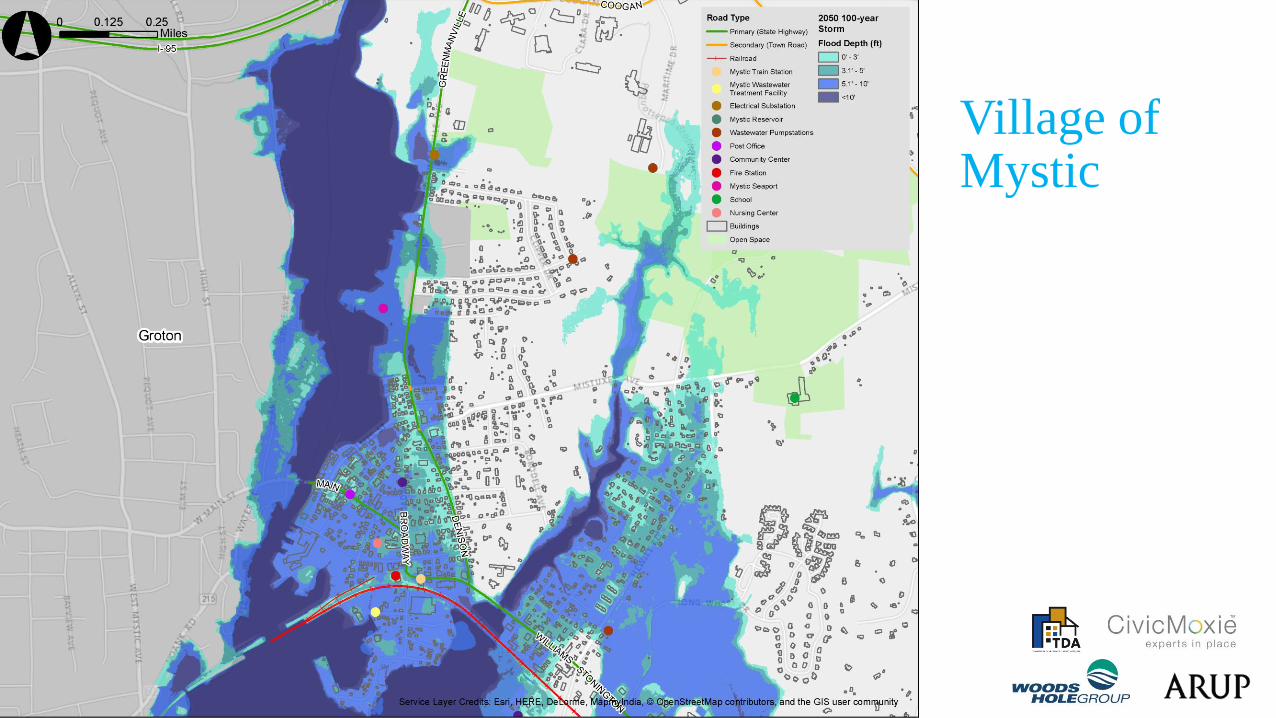
Village of Mystic
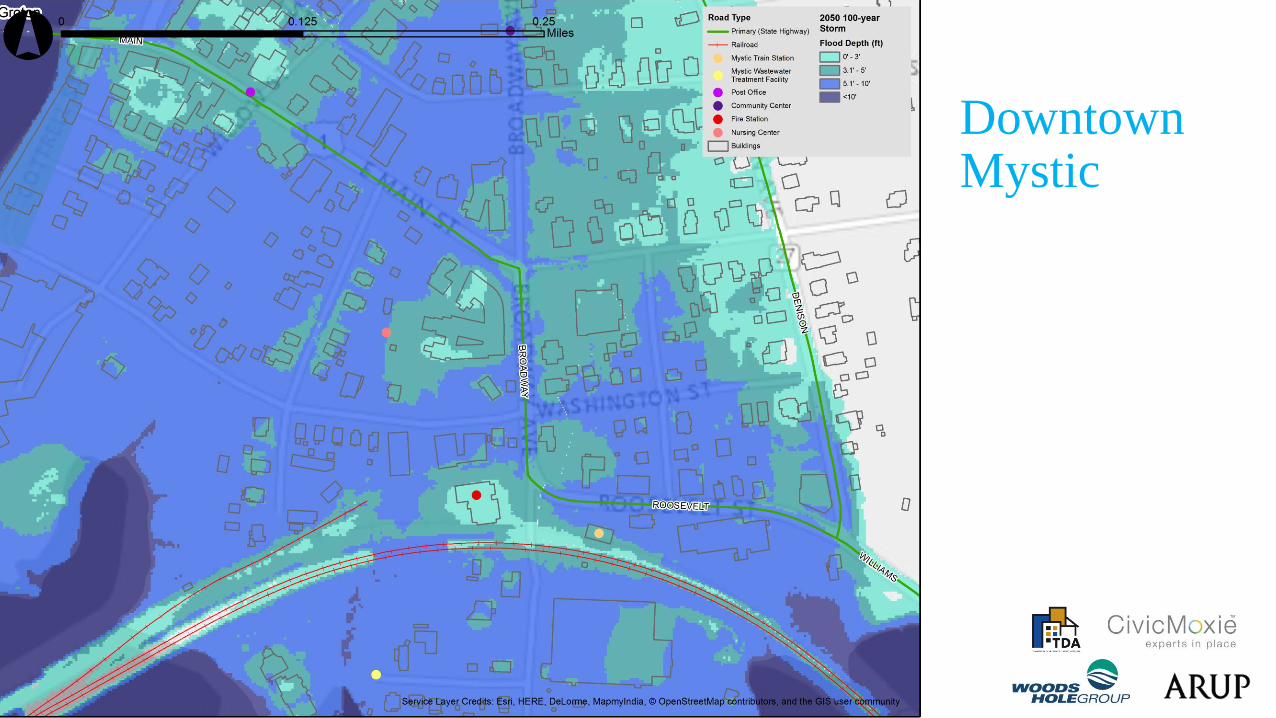
Downtown Mystic
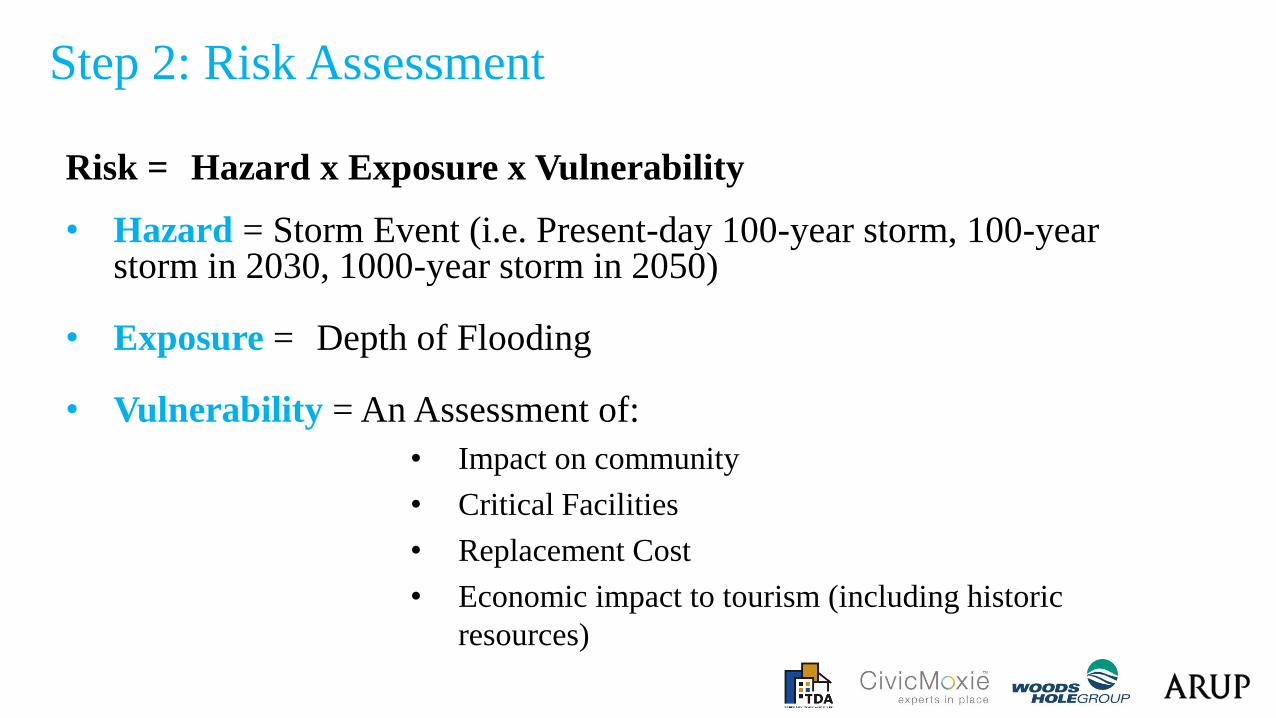
Step 2: Risk Assessment
Risk = Hazard x Exposure x Vulnerability
• Hazard = Storm Event (i.e. Present-day 100-year storm, 100-year storm in 2030, 1000-year storm in 2050)
• Exposure = Depth of Flooding
• Vulnerability = An Assessment of:
• Impact on community
• Critical Facilities
• Replacement Cost
• Economic impact to tourism (including historic
resources)
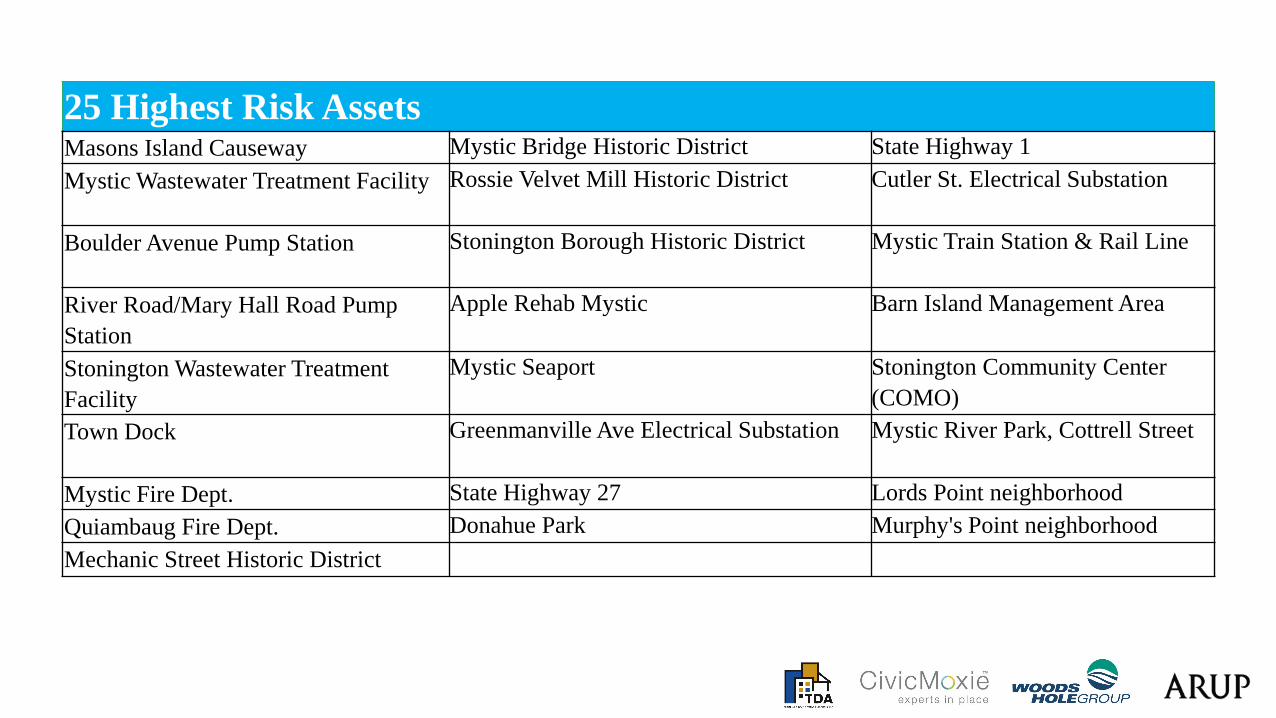
25 Highest Risk AssetsMasons Island Causeway Mystic Bridge Historic District State Highway 1
Mystic Wastewater Treatment Facility Rossie Velvet Mill Historic District Cutler St. Electrical Substation
Boulder Avenue Pump Station Stonington Borough Historic District Mystic Train Station & Rail Line
River Road/Mary Hall Road Pump
Station
Apple Rehab Mystic Barn Island Management Area
Stonington Wastewater Treatment
Facility
Mystic Seaport Stonington Community Center
(COMO)
Town Dock Greenmanville Ave Electrical Substation Mystic River Park, Cottrell Street
Mystic Fire Dept. State Highway 27 Lords Point neighborhood
Quiambaug Fire Dept. Donahue Park Murphy's Point neighborhood
Mechanic Street Historic District
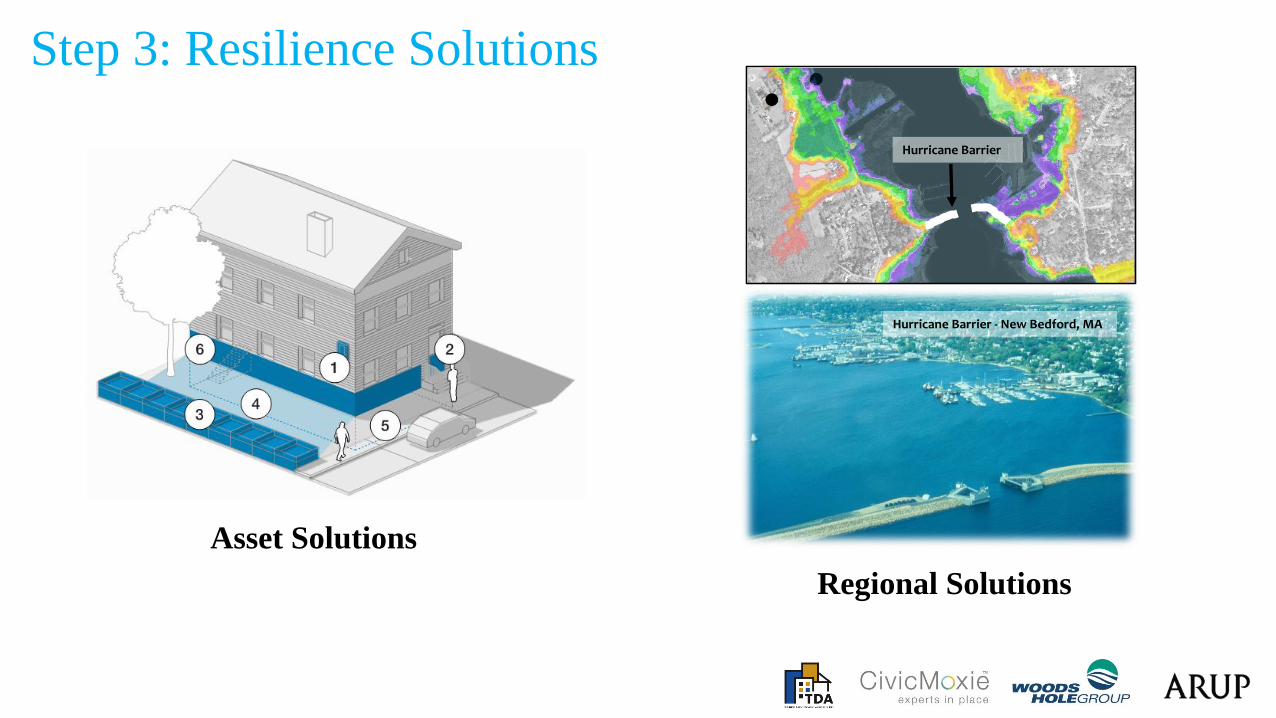
Step 3: Resilience Solutions
Asset Solutions
Hurricane Barrier - New Bedford, MA
Hurricane Barrier
Regional Solutions
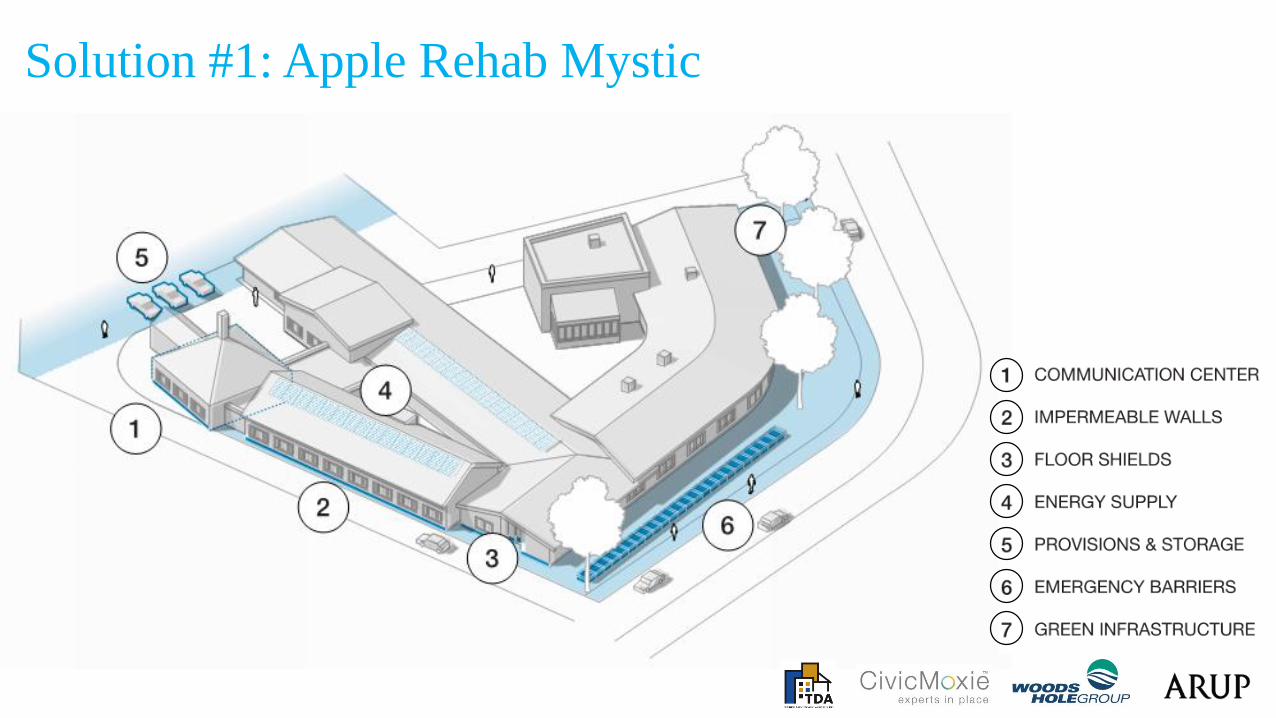
Solution #1: Apple Rehab Mystic
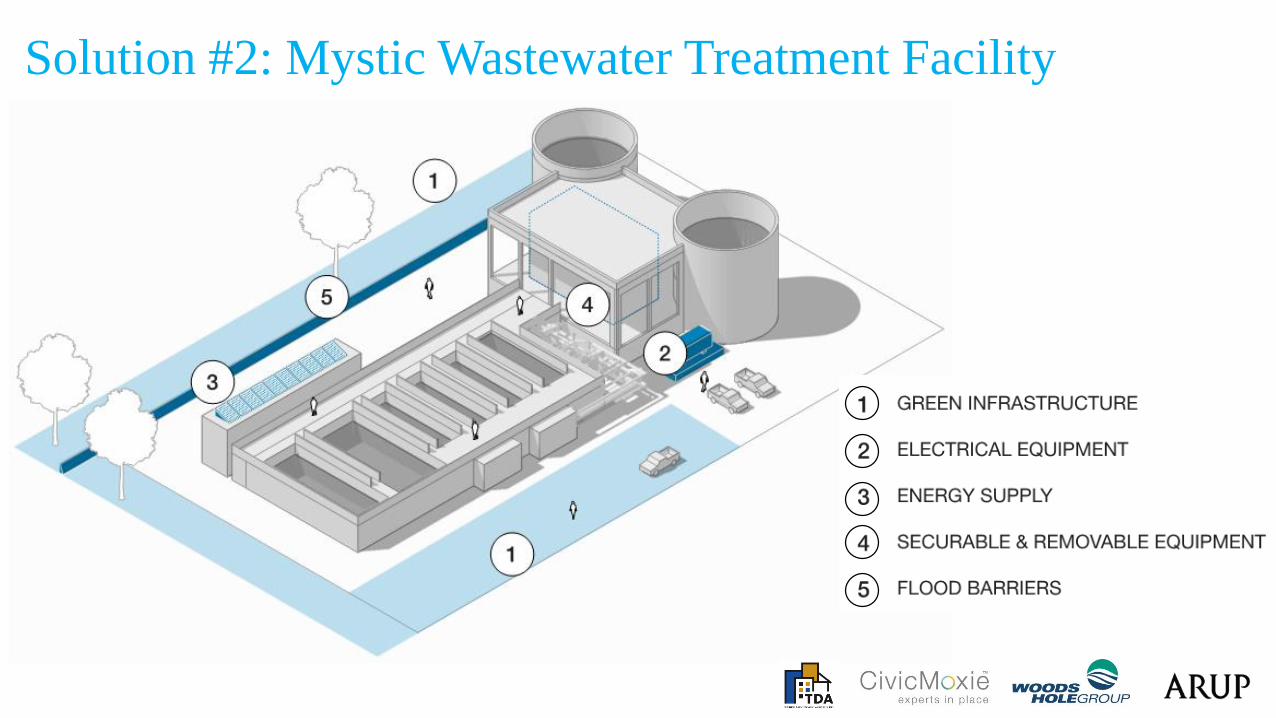
Solution #2: Mystic Wastewater Treatment Facility
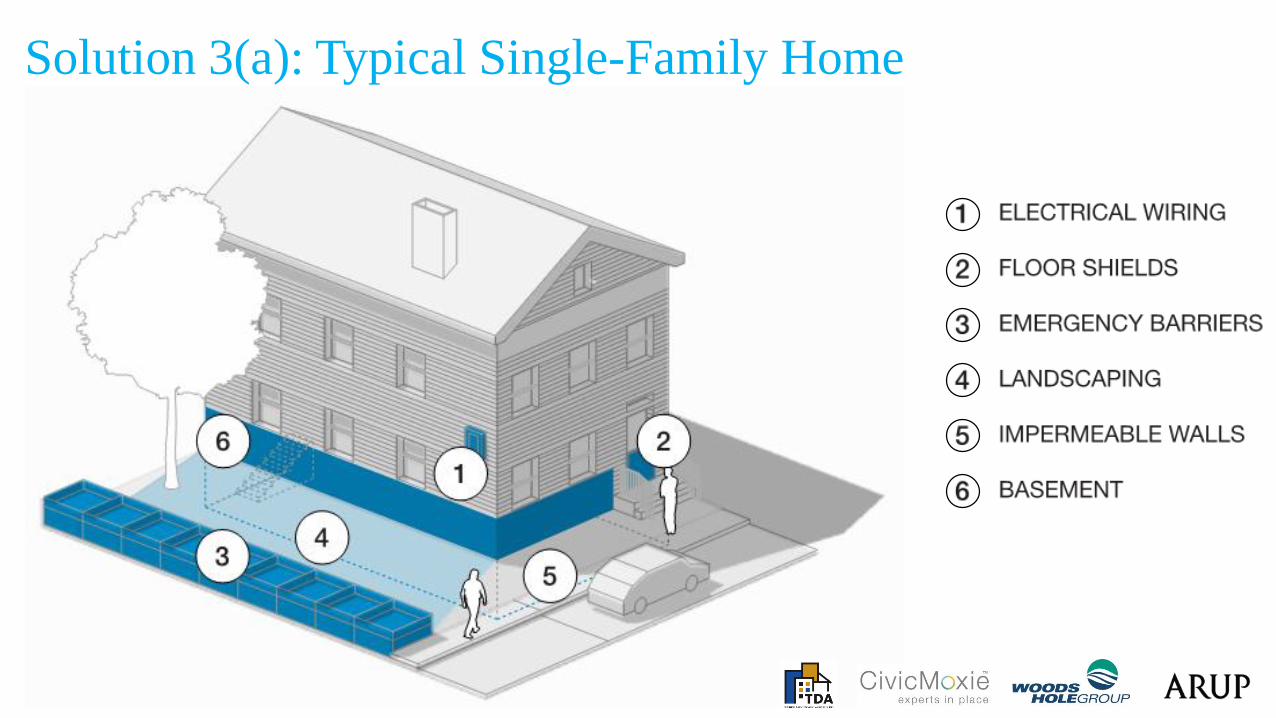
Solution 3(a): Typical Single-Family Home
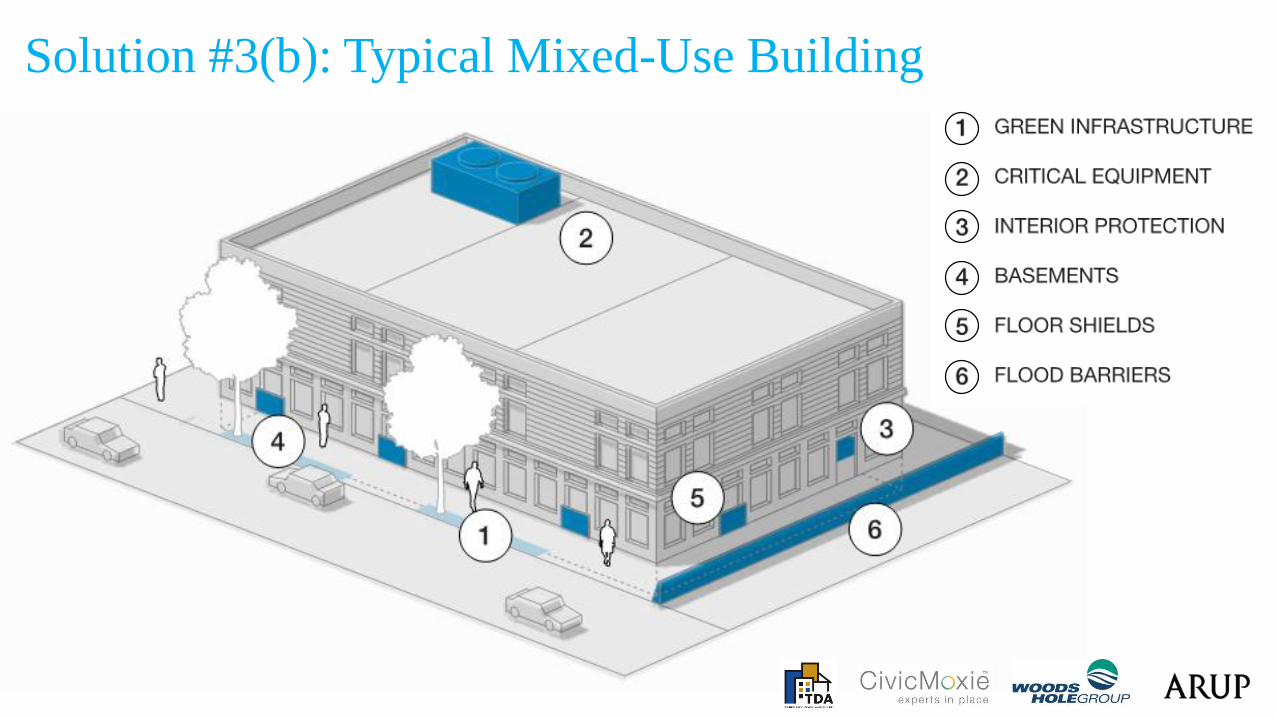
Solution #3(b): Typical Mixed-Use Building
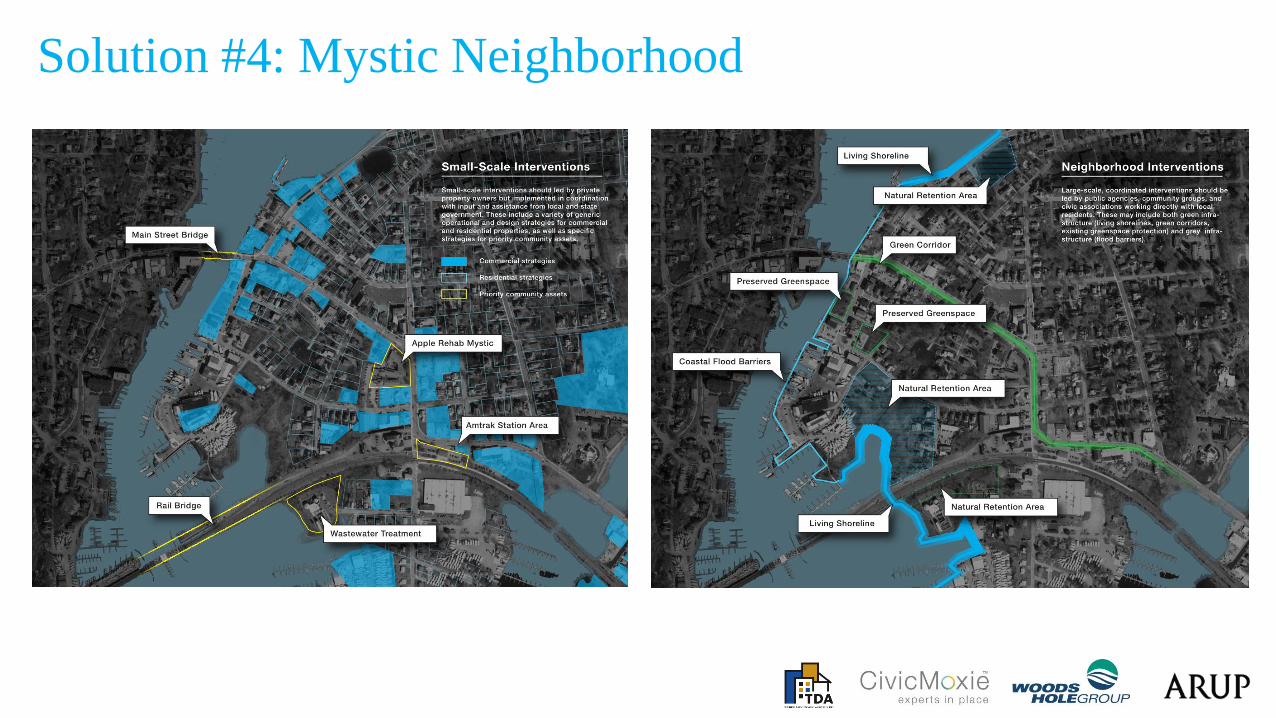
Solution #4: Mystic Neighborhood
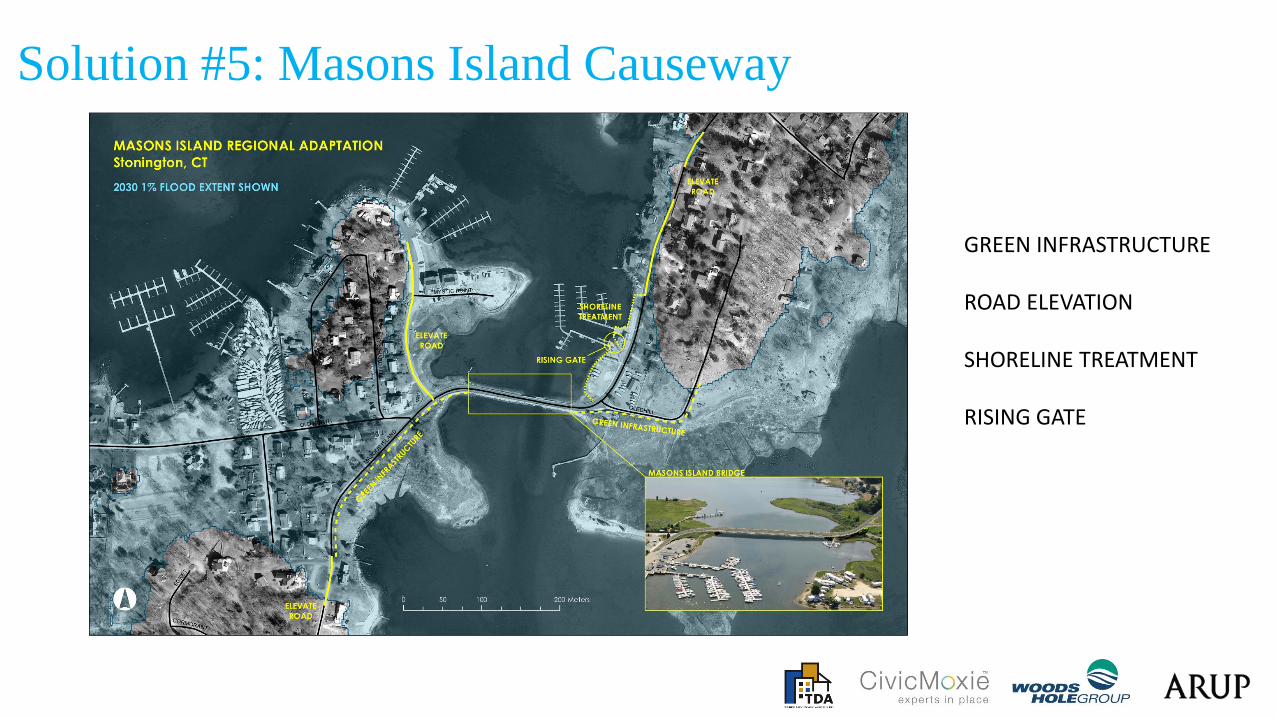
Solution #5: Masons Island Causeway
GREEN INFRASTRUCTURE
ROAD ELEVATION
SHORELINE TREATMENT
RISING GATE
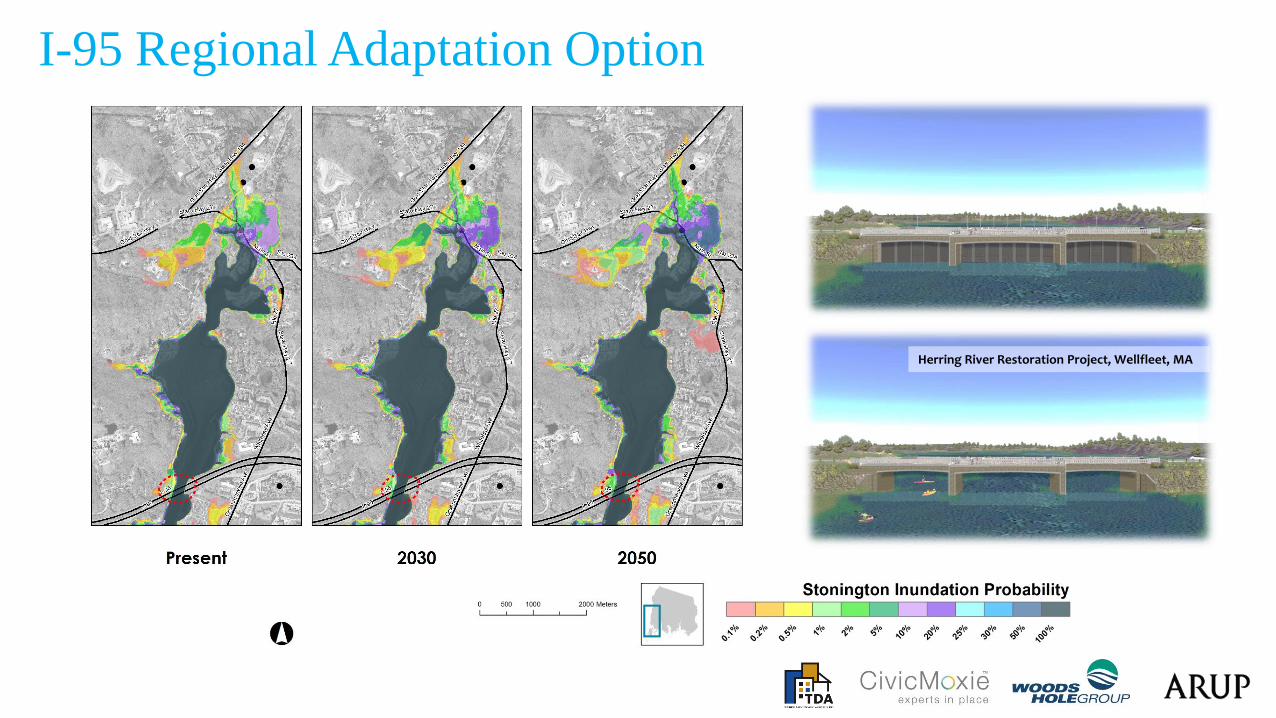
I-95 Regional Adaptation Option
Herring River Restoration Project, Wellfleet, MA
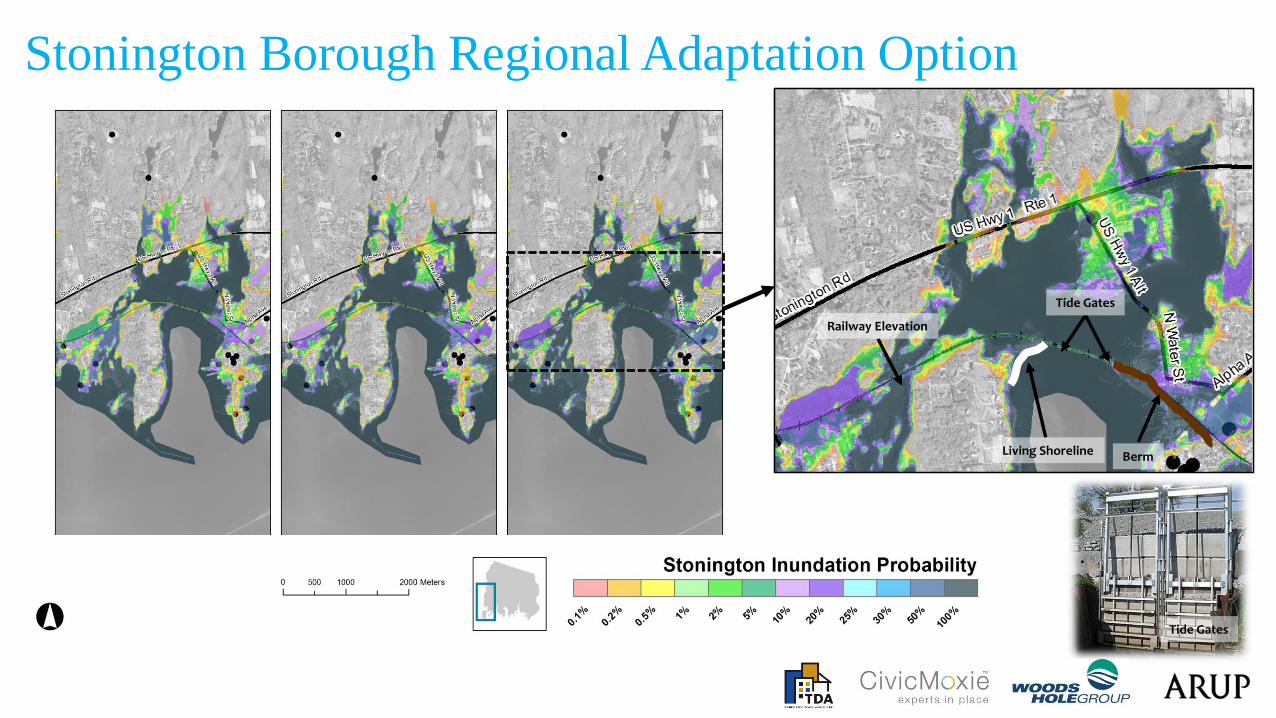
Stonington Borough Regional Adaptation Option
Living Shoreline
Tide Gates
Berm
Railway Elevation
Tide Gates
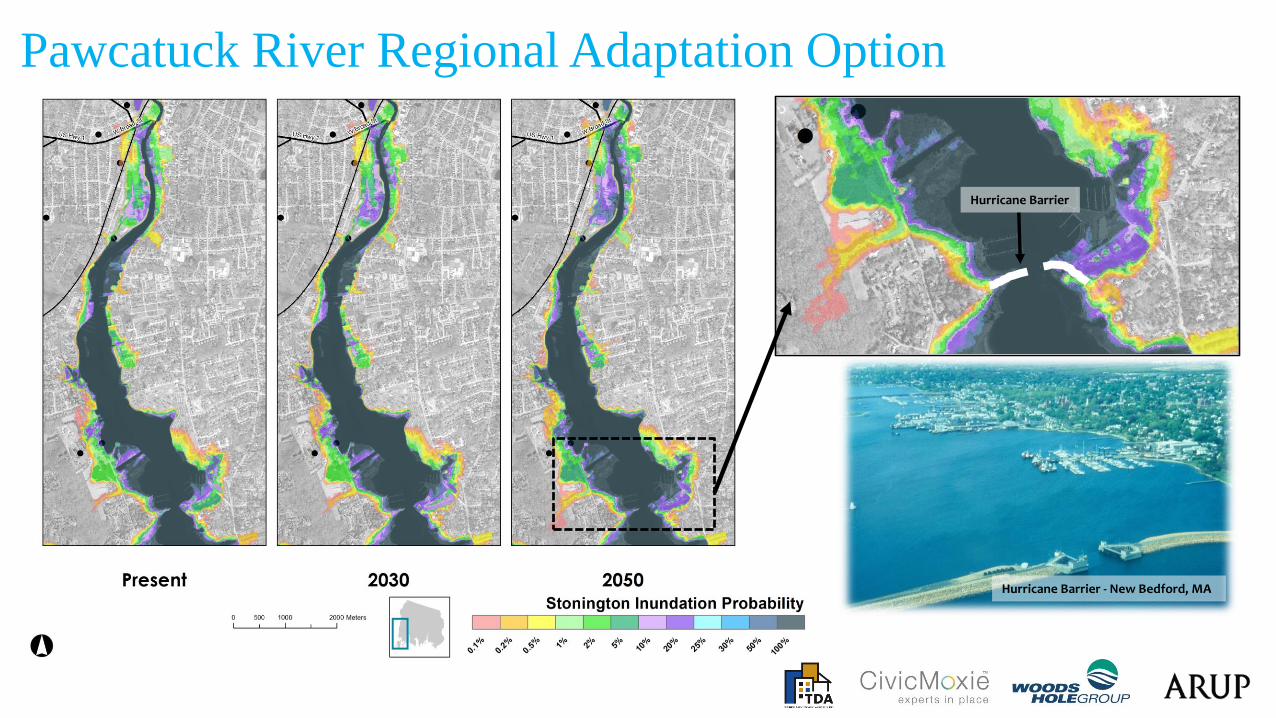
Pawcatuck River Regional Adaptation Option
Hurricane Barrier - New Bedford, MA
Hurricane Barrier
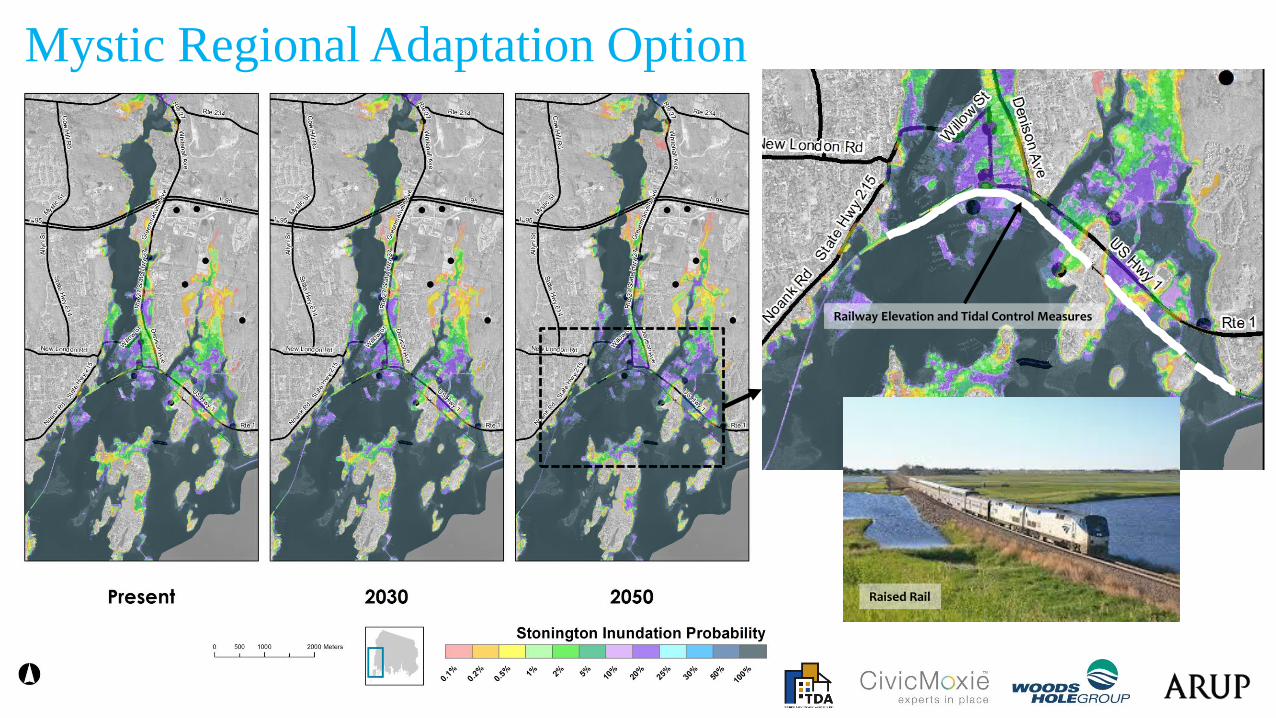
Mystic Regional Adaptation Option
Railway Elevation and Tidal Control Measures
Raised Rail
Key Priorities & Next Steps
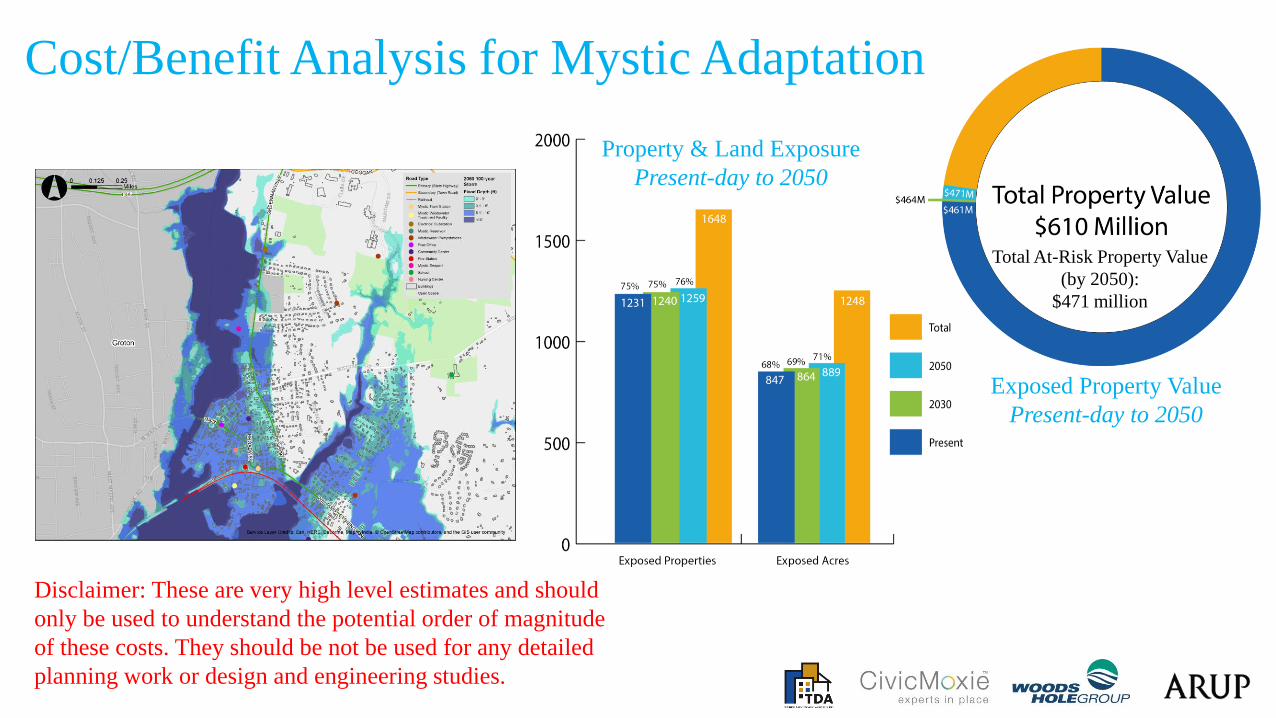
Cost/Benefit Analysis for Mystic Adaptation
Exposed Property Value
Present-day to 2050
Property & Land Exposure
Present-day to 2050
Total At-Risk Property Value
(by 2050):
$471 million
Disclaimer: These are very high level estimates and should
only be used to understand the potential order of magnitude
of these costs. They should be not be used for any detailed
planning work or design and engineering studies.
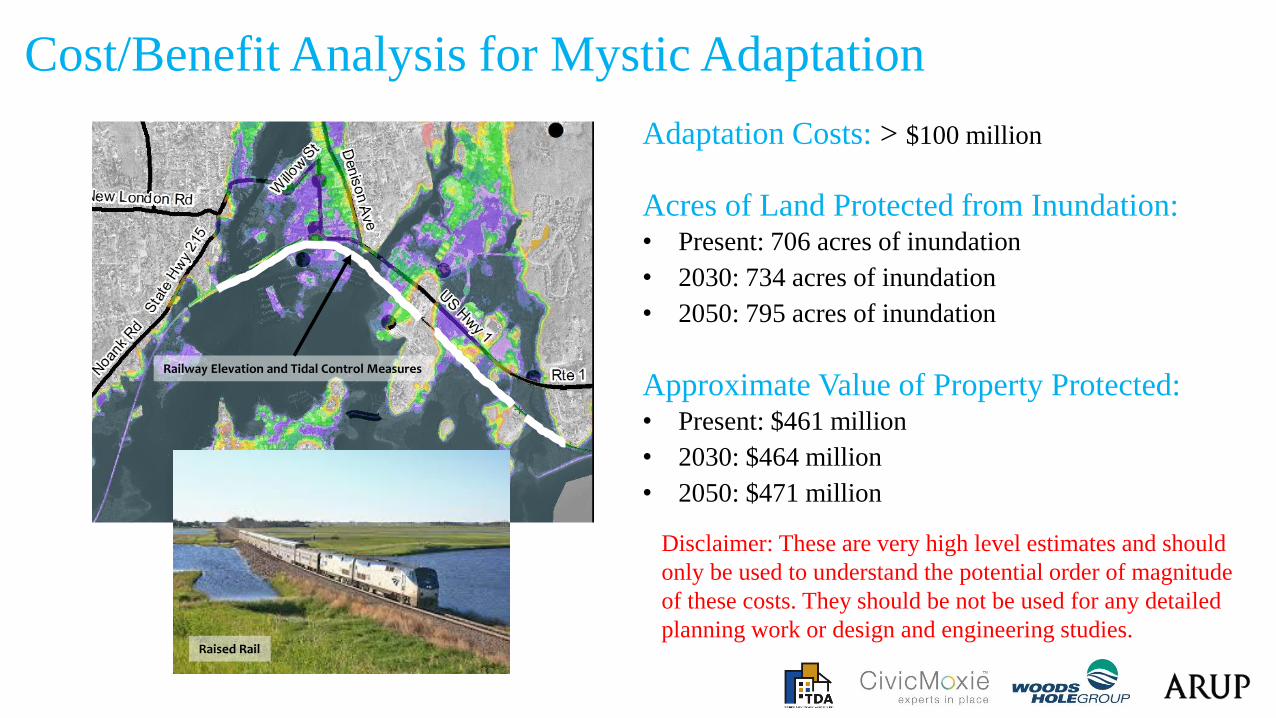
Cost/Benefit Analysis for Mystic Adaptation
Adaptation Costs: > $100 million
Acres of Land Protected from Inundation:• Present: 706 acres of inundation
• 2030: 734 acres of inundation
• 2050: 795 acres of inundation
Approximate Value of Property Protected:• Present: $461 million
• 2030: $464 million
• 2050: $471 million
Railway Elevation and Tidal Control Measures
Raised Rail
Disclaimer: These are very high level estimates and should
only be used to understand the potential order of magnitude
of these costs. They should be not be used for any detailed
planning work or design and engineering studies.
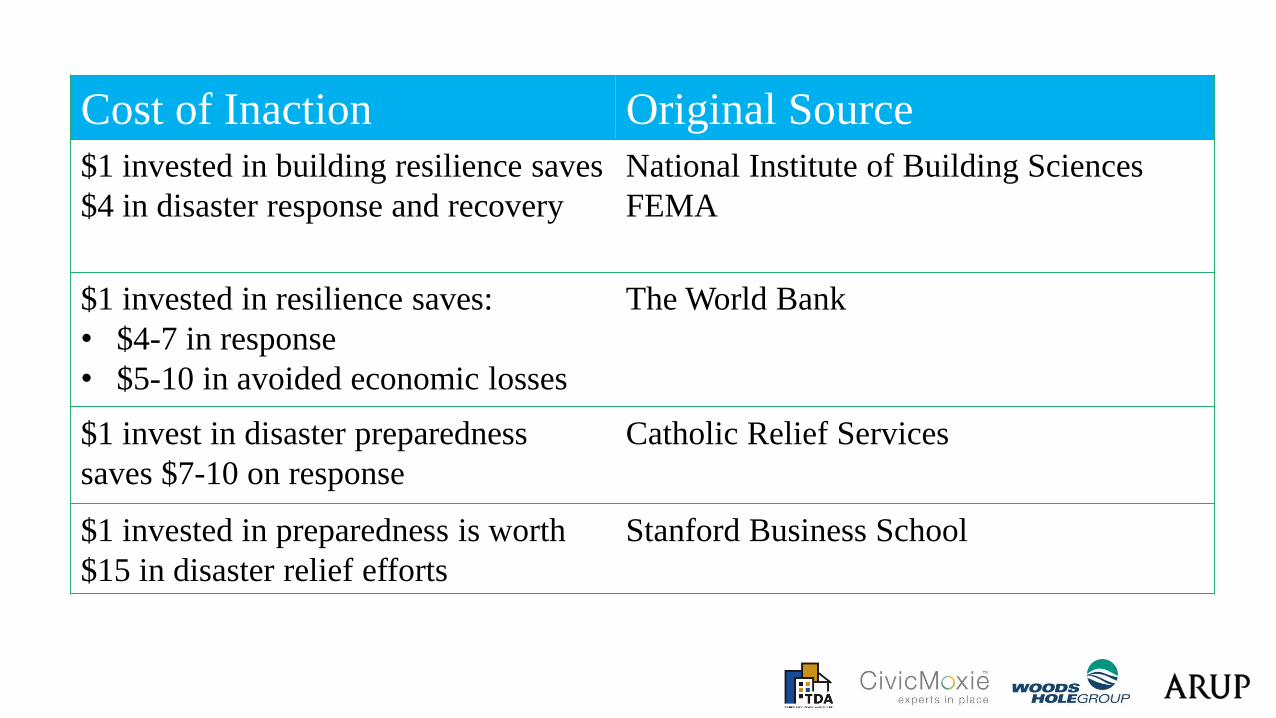
Cost of Inaction Original Source
$1 invested in building resilience saves
$4 in disaster response and recovery
National Institute of Building Sciences
FEMA
$1 invested in resilience saves:
• $4-7 in response
• $5-10 in avoided economic losses
The World Bank
$1 invest in disaster preparedness
saves $7-10 on response
Catholic Relief Services
$1 invested in preparedness is worth
$15 in disaster relief efforts
Stanford Business School
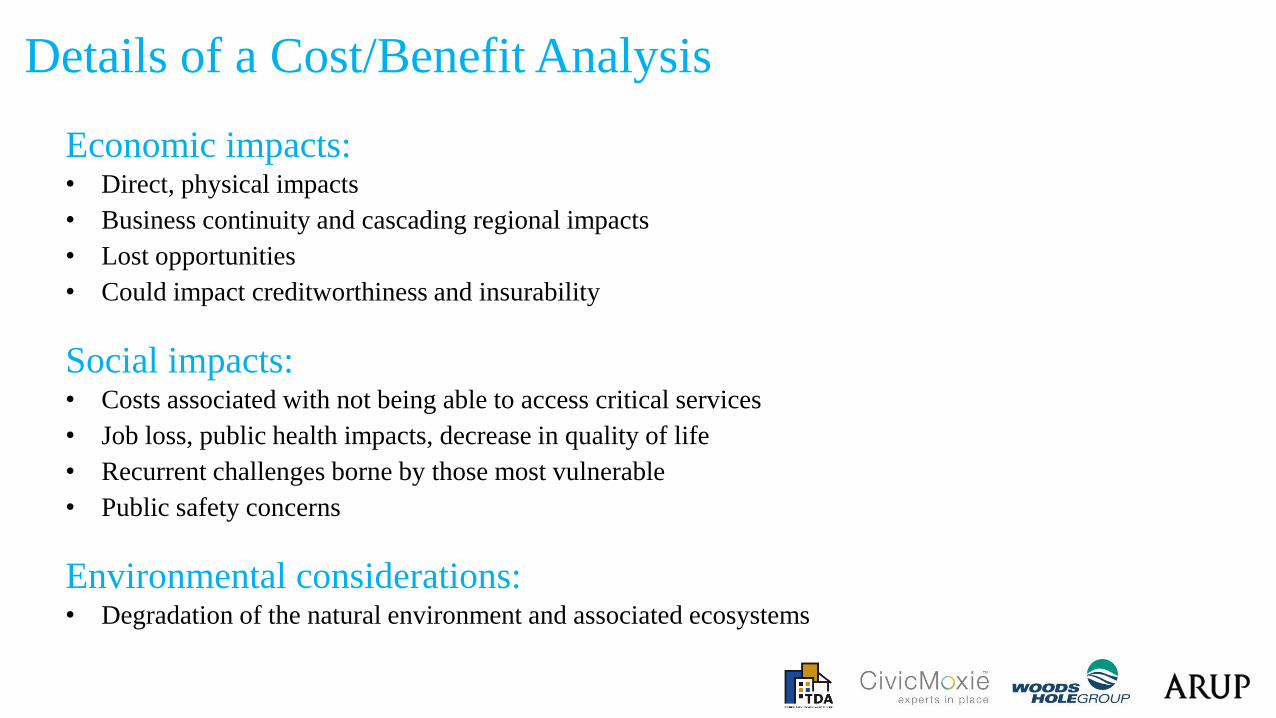
Details of a Cost/Benefit Analysis
Economic impacts:• Direct, physical impacts
• Business continuity and cascading regional impacts
• Lost opportunities
• Could impact creditworthiness and insurability
Social impacts:• Costs associated with not being able to access critical services
• Job loss, public health impacts, decrease in quality of life
• Recurrent challenges borne by those most vulnerable
• Public safety concerns
Environmental considerations:• Degradation of the natural environment and associated ecosystems
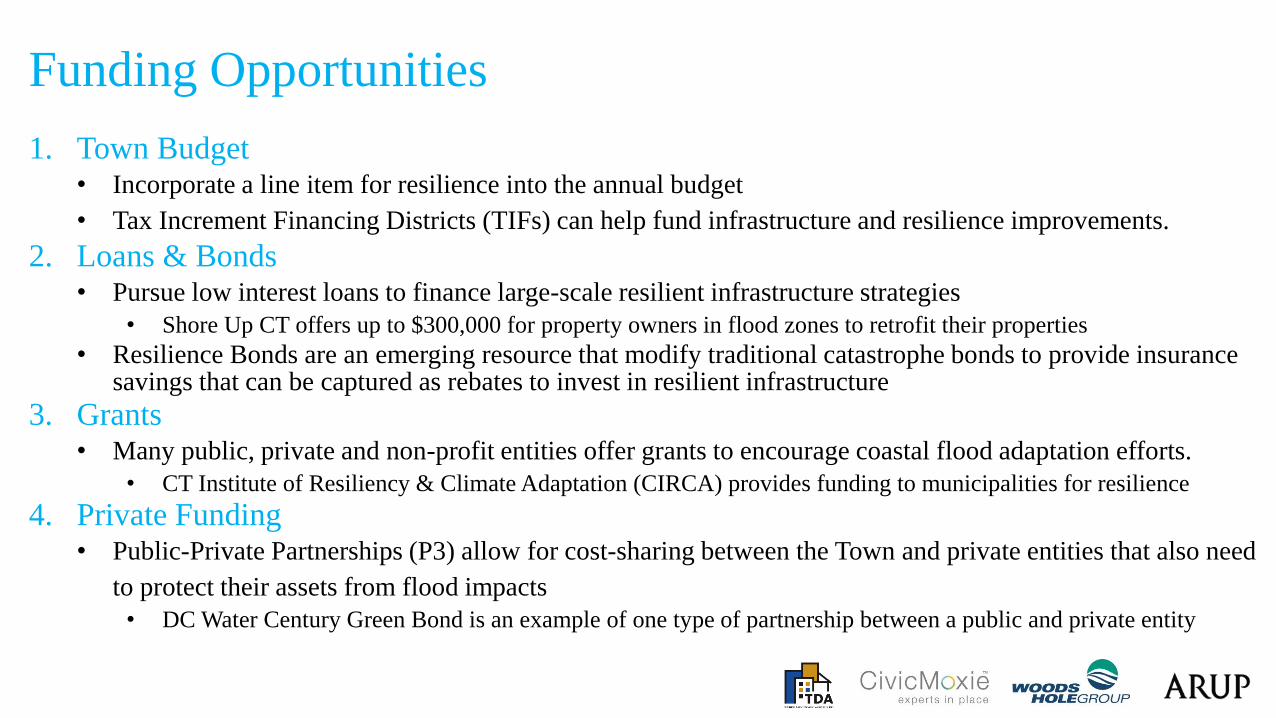
Funding Opportunities
1. Town Budget• Incorporate a line item for resilience into the annual budget
• Tax Increment Financing Districts (TIFs) can help fund infrastructure and resilience improvements.
2. Loans & Bonds• Pursue low interest loans to finance large-scale resilient infrastructure strategies
• Shore Up CT offers up to $300,000 for property owners in flood zones to retrofit their properties
• Resilience Bonds are an emerging resource that modify traditional catastrophe bonds to provide insurance savings that can be captured as rebates to invest in resilient infrastructure
3. Grants• Many public, private and non-profit entities offer grants to encourage coastal flood adaptation efforts.
• CT Institute of Resiliency & Climate Adaptation (CIRCA) provides funding to municipalities for resilience
4. Private Funding• Public-Private Partnerships (P3) allow for cost-sharing between the Town and private entities that also need
to protect their assets from flood impacts
• DC Water Century Green Bond is an example of one type of partnership between a public and private entity
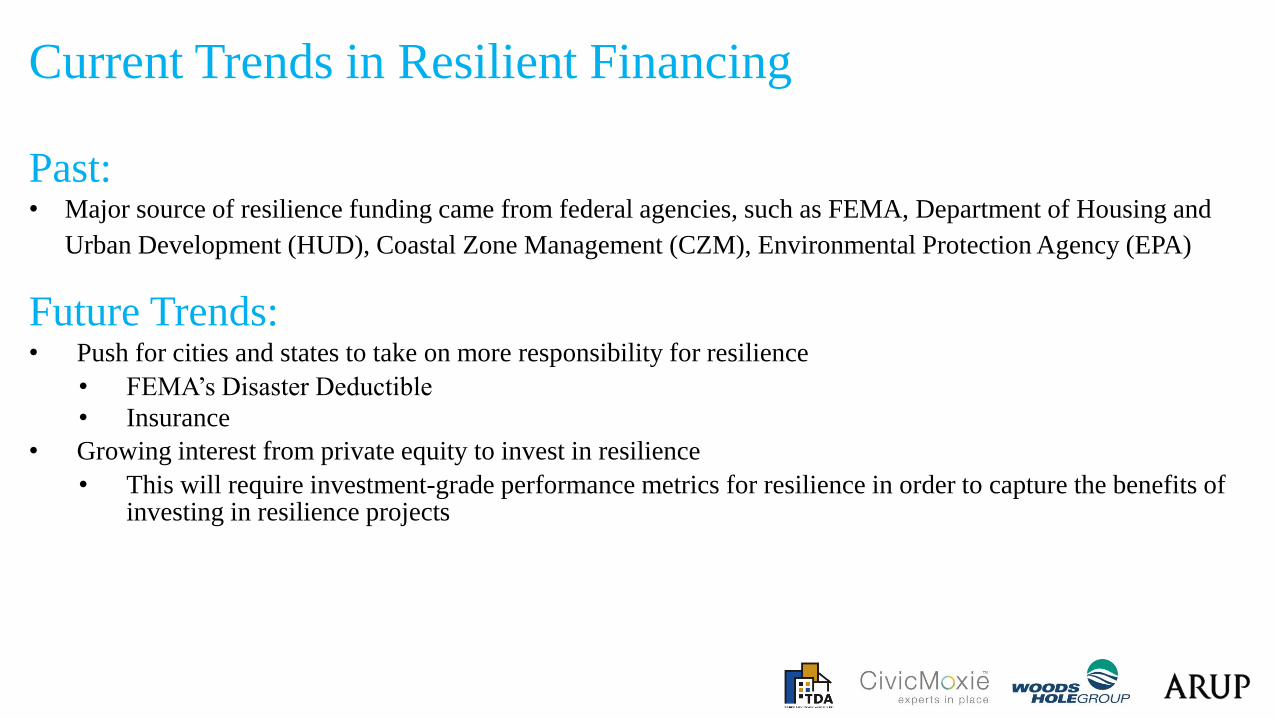
Current Trends in Resilient Financing
Past:• Major source of resilience funding came from federal agencies, such as FEMA, Department of Housing and
Urban Development (HUD), Coastal Zone Management (CZM), Environmental Protection Agency (EPA)
Future Trends:• Push for cities and states to take on more responsibility for resilience
• FEMA’s Disaster Deductible
• Insurance
• Growing interest from private equity to invest in resilience
• This will require investment-grade performance metrics for resilience in order to capture the benefits of investing in resilience projects
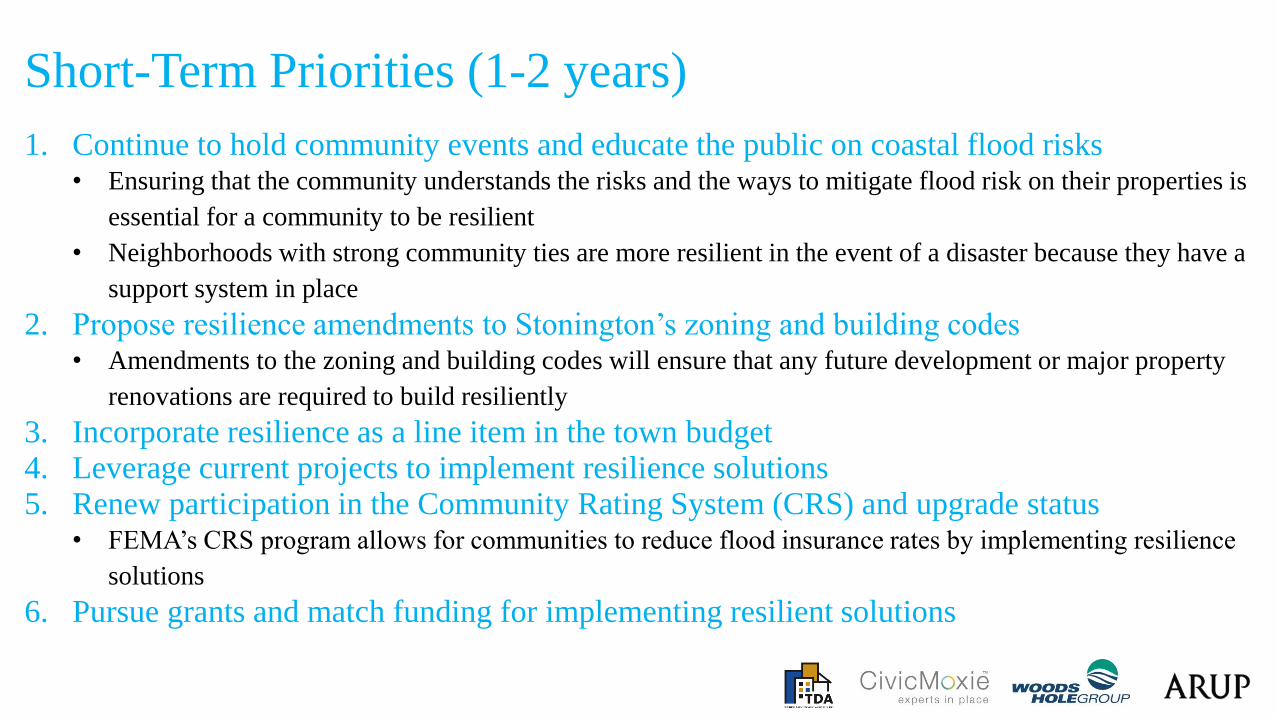
Short-Term Priorities (1-2 years)
1. Continue to hold community events and educate the public on coastal flood risks• Ensuring that the community understands the risks and the ways to mitigate flood risk on their properties is
essential for a community to be resilient
• Neighborhoods with strong community ties are more resilient in the event of a disaster because they have a
support system in place
2. Propose resilience amendments to Stonington’s zoning and building codes• Amendments to the zoning and building codes will ensure that any future development or major property
renovations are required to build resiliently
3. Incorporate resilience as a line item in the town budget4. Leverage current projects to implement resilience solutions5. Renew participation in the Community Rating System (CRS) and upgrade status
• FEMA’s CRS program allows for communities to reduce flood insurance rates by implementing resilience
solutions
6. Pursue grants and match funding for implementing resilient solutions
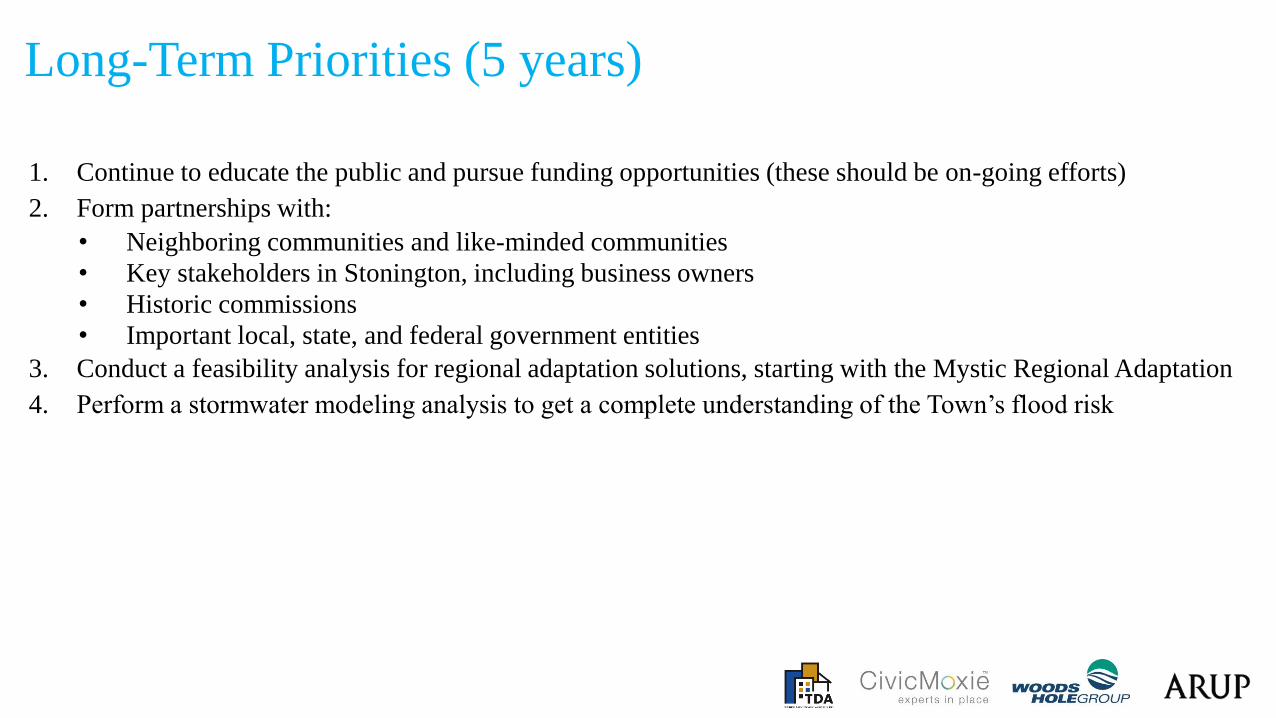
Long-Term Priorities (5 years)
1. Continue to educate the public and pursue funding opportunities (these should be on-going efforts)
2. Form partnerships with:
• Neighboring communities and like-minded communities
• Key stakeholders in Stonington, including business owners
• Historic commissions
• Important local, state, and federal government entities
3. Conduct a feasibility analysis for regional adaptation solutions, starting with the Mystic Regional Adaptation
4. Perform a stormwater modeling analysis to get a complete understanding of the Town’s flood risk
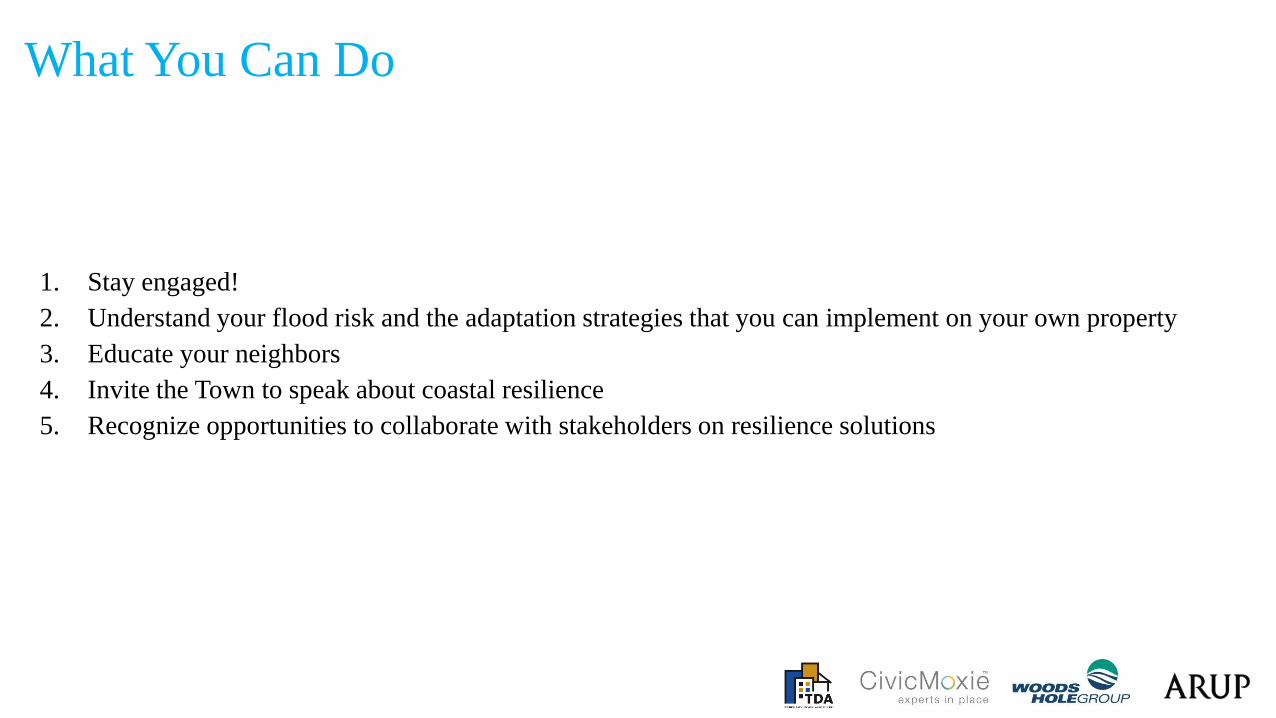
What You Can Do
1. Stay engaged!
2. Understand your flood risk and the adaptation strategies that you can implement on your own property
3. Educate your neighbors
4. Invite the Town to speak about coastal resilience
5. Recognize opportunities to collaborate with stakeholders on resilience solutions
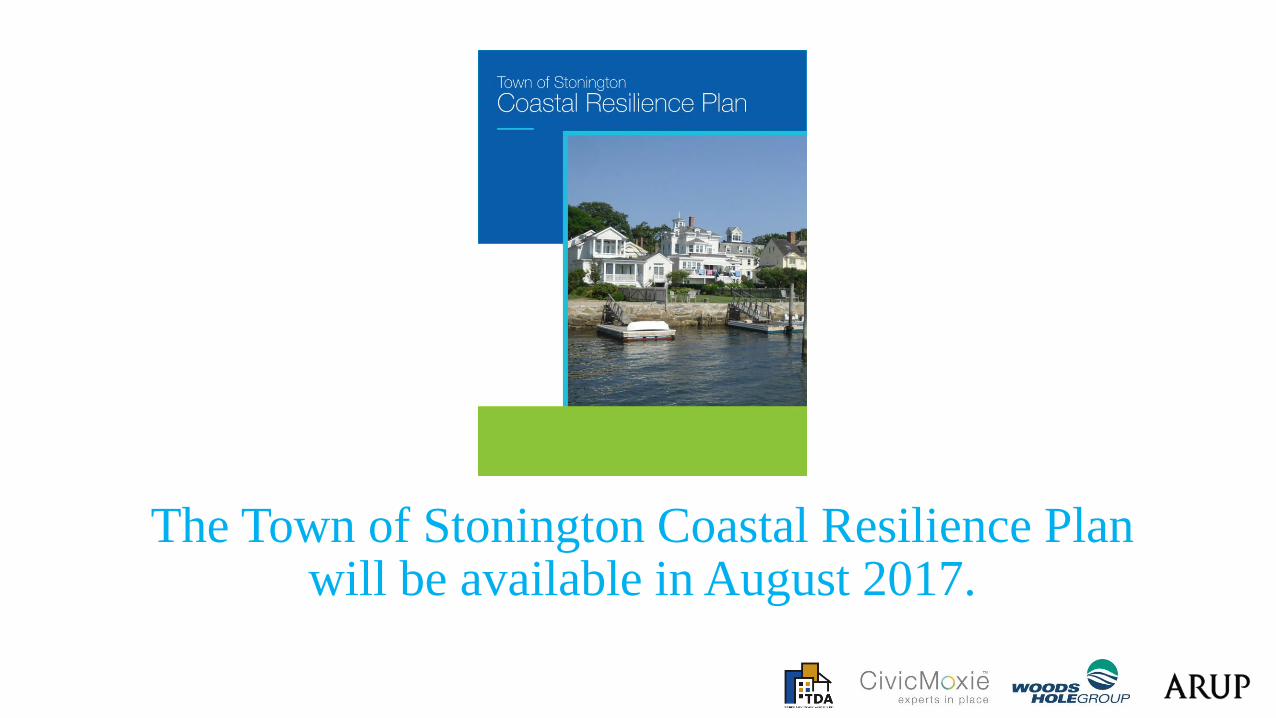
The Town of Stonington Coastal Resilience Plan will be available in August 2017.