towns north of colombo water supply project external ... · 1 sri lanka towns north of colombo...
TRANSCRIPT

1
Sri Lanka
Towns North of Colombo Water Supply Project
External Evaluator:Tomoko Tamura
(Kaihatsu Management Consulting Inc.)
Field Survey: From February 2009 to April 2009
1. Project Description and Outline of the ODA Loan Assistance
Map of the project area Tower and pump house in Mahara
(Entire Sri Kanka) distribution center
1.1 Background
Sri Lanka is an island country located 30km southeast of India. The total area of the country
is approximately 0.8 times the size of Hokkaido in Japan. The target area of the project in
Towns North of Colombo1 has a total extent of 14.3 km2 and a total population of 530,000.
The population is similar to the population of Meguro-ku in Tokyo, and the extent of the area is
similar to the area of Himeji City in Hyogo Prefecture in Japan.
Most of the residents of the target area used wells or common taps as only small-scale water
supply systems from springs and wells or extensions of neighboring water supply systems were
available in the area. Some wells in the area, especially in the industrial area, were
contaminated by industrial waste water, and others in the coastal area were often contaminated
by salt water. The area has a lot of industrial estates; however, the unavailability of stable
water supply was an obstacle to production activities.
In this way, the absence of water supply was a burden for residents and a hindrance to
economic development of the area. Therefore, it was urgently necessary to construct water
transmission and distribution facilities and enhance water supply capacity in the area.
1 “Towns North of Colombo” is not an administrative area of the government of Sri Lanka but an administrative area of the National Water Supply and Drainage Board. It is in Gampaha District and bordered on the south by Colombo City. The target area of the project was a part of the Towns North of Colombo. See the map in Annex 1 for details.

2
1.2 Objective
The objective of this project is to enhance the water supply capacity of Towns North of
Colombo, where there is increasing water demand, by constructing transmission and distribution
facilities, thereby contributing to the industrial development and improvement of public health
in the area.
1.3 Borrower/Executing agency
Democratic Socialist republic of Sri Lanka/ National Water Supply and Drainage
Board (NWSDB)
1.4 Outline of the Loan Agreement
Approved amount/ Disbursed
amount
5,308 million yen/ 5,122 million yen
Exchange of Notes/ Loan Agreement May 1996/ October 1996
Terms and Conditions
-Interest rate, Repayment Period,
(Grace period) -Procurement
2.1%, 30 years (10 years) -General untied
Final Disbursement Date February 2007
Main Contractor(Over 1 billion yen) Beijing Municipal Engineering Corporation (China)
Main Consultant(Over 100
million yen)
Nihon Suido Consultants Co. Ltd.
Feasibility Study (F/S), etc. 1995 : Proposal : NWSDB
2.Evaluation Results (Rating: B)
2.1 Relevance (Rating: a)
This project has been highly relevant with national policies of Sri Lanka and development
needs at the times of both appraisal and ex-post evaluation, therefore its relevance is high.
2.1.1. Relevance with national and scrotal policies
The Government of Sri Lanka implemented various water supply projects actively at the time
of project appraisal. The target at that time was to provide piped water supply to all the
population by 2000. The project was listed as the first priority in the water supply master plan
updated in 1991 and was identified as the most urgent task in the water supply sector.
The water supply was also a highly prioritized issue in national development policies at the
time of the ex-post evaluation. The Millennium Development Plan for the country stated that
the government was planning to provide the piped water supply to all the urban population by
2015.
3
2.1.2. Relevance with needs
The need for water supply services and urgency of its expansion were high in the target area
at the time of project appraisal as well as the ex-post evaluation, as the population was
increasing and industrialization was accelerating.
2.1.3. Relevance of the project planning
It was agreed at the time of the project appraisal that an overall review of the F/S, review of
water demand for the entire Colombo North area, selection of the most urgent target area,
determination of project scope and detailed design of the facility should be conducted by
consulting services during the early stage of the project, before starting civil work. The
reasons for these determinations were as follows:
There was a limitation on the amount of treated water supplied to Colombo North area at
the time of appraisal. Therefore, water demand of the area should be minimized until an
additional water source is ensured.
Investment in the project should be minimized in order not to worsen the financial status
of NWSDB, which would need further investment for the development of new
water-sources in the future.
Designed criteria of maximum day demand and maximum hour demand specified in the
F/S should be reviewed. Water demand in each distribution area and capacity of
reservoirs and towers specified in the F/S should also be reviewed.
In this way, the loan agreement for the project was signed before a final decision of the
project scope was made. This arrangement enabled the project to select the most urgent
needs of the area, which was developing rapidly, whereas it had only limited negative influence
on the progress of the project.
2.2 Efficiency (Rating: b)
Although the overall project cost was almost as planned, the project period was longer than
planned; therefore efficiency of the project is fair.
2.2.1 Output
(1) Transmission and distribution facilities
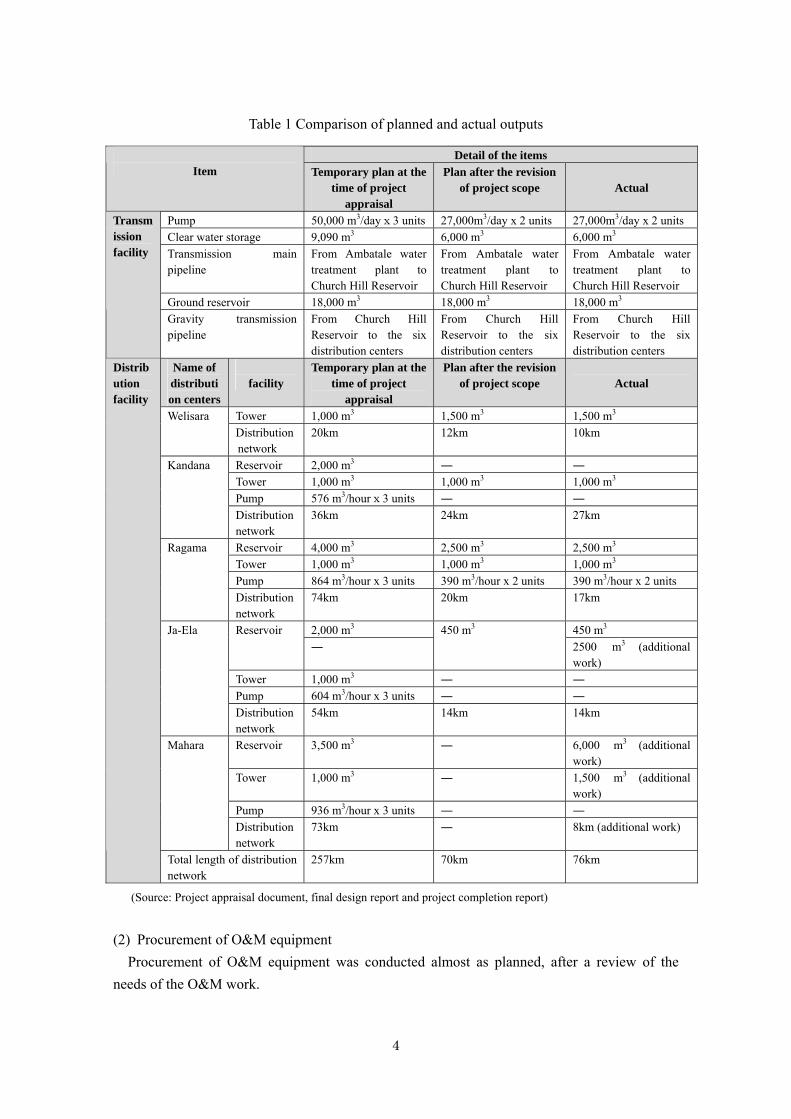
As Table 1 shows, all the planned works for transmission and distribution facilities were
conducted almost as planned. At the time of the change of the project scope, the anticipated
scope was divided into two, “Stage I” and “Stage II”. Considering the limited amount of yen
loans as well as the time period, it was decided that the project would implement only the work
in “Stage I”. However, a part of “Stage II”, which was urgent, was also conducted under the
project.
4
Table 1 Comparison of planned and actual outputs
(Source: Project appraisal document, final design report and project completion report)
(2) Procurement of O&M equipment
Procurement of O&M equipment was conducted almost as planned, after a review of the
needs of the O&M work.
Detail of the items Item Temporary plan at the
time of project appraisal
Plan after the revision of project scope
Actual
Pump 50,000 m3/dayx3 units 27,000m3/day x 2 units 27,000m3/day x 2 units
Clear water storage 9,090 m3 6,000 m3 6,000 m3
Transmission main pipeline
From Ambatale water treatment plant to Church Hill Reservoir
From Ambatale water treatment plant to Church Hill Reservoir
From Ambatale water treatment plant to Church Hill Reservoir
Ground reservoir 18,000 m3 18,000 m3 18,000 m3
Transmission facility
Gravity transmission pipeline
From Church Hill Reservoir to the six distribution centers
From Church Hill Reservoir to the six distribution centers
From Church Hill Reservoir to the six distribution centers
Name of distribution centers
facility
Temporary plan at the time of project
appraisal
Plan after the revision of project scope
Actual
Tower 1,000 m3 1,500 m3 1,500 m3 Welisara
Distribution network
20km 12km 10km
Reservoir 2,000 m3 ― ―
Tower 1,000 m3 1,000 m3 1,000 m3
Pump 576 m3/hourx3 units ― ―
Kandana
Distribution network
36km 24km 27km
Reservoir 4,000 m3 2,500 m3 2,500 m3
Tower 1,000 m3 1,000 m3 1,000 m3
Pump 864 m3/hour x 3 units 390 m3/hour x 2 units 390 m3/hour x 2 units
Ragama
Distribution network
74km 20km 17km
2,000 m3 450 m3 Reservoir
―
450 m3
2500 m3 (additional work)
Tower 1,000 m3 ― ―
Pump 604 m3/hour x 3 units ― ―
Ja-Ela
Distribution network
54km 14km 14km
Reservoir 3,500 m3 ― 6,000 m3 (additional work)
Tower 1,000 m3 ― 1,500 m3 (additional work)
Pump 936 m3/hour x 3 units ― ―
Mahara
Distribution network
73km ― 8km (additional work)
Distribution facility
Total length of distribution network
257km 70km 76km

5
(3) Consulting Services
Review of F/S, detail design, supervision of construction and training were planned under the
consulting services. The services were conducted as planned. Planned and actual MM of the
services were somewhat different, as the actual MM was longer than the planned MM, due to
extension of the project period.
Plan: Foreign: 91MM, Local: 190MM
Actual: Foreign: 101.3MM, Local: 270MM
2.2.2. Project period
The implementation period of the project was planned as 68 months, i.e. from October 1996
to May 2002. The actual period was 98 months, i.e. from October 1996 to November 2004.
The additional work was completed in November 2006. Consequently, the actual period was
longer than the planned (144%), even without counting the period spent for the additional work.
A 35-month delay in the commencement of the civil work was the main reason for the delay of
the project period. The delay in the civil work occurred because of a contractor cancellation and
the necessity of holding a re-bidding to select another civil contractor. There was also a little
delay in the process of the selection of a consultant; revision of project scope and detailed
design.
2.2.3. Project cost
The planned project cost was 6,245 million yen, including 5,308 million of yen-loan portion.
The actual project cost was 6,474 million yen, including 5,122 million of yen-loan portion.
The actual cost was thus 104% of the planned cost. The actual cost should be considered
almost as planned, as it was 94% of the planned cost if the cost of the additional work is
excluded. The funds for the additional works became available as there was a balance of
approximately 400 million yen in the project budget due to the effective procurement
procedures that ensured competitive bidding. Efficient project management, such as timely
instructions to the contractor, frequent progress monitoring at the sites, rejection of
unreasonable claims, etc. also contributed to the reduction of the project cost.
2.3. Effectiveness (Rating: b)
The rating for the effectiveness of the project could have been “c: low”, as the size of the
population newly-connected to water supply and the average water consumption per day were
less than half of that planned. However, considering the various factors mentioned below, this
project has somewhat achieved its objectives, therefore its effectiveness is fair.
Firstly, the above-mentioned low level of achievement of targets was caused by a factor
which can be controlled by project. That factor was the limited amount of water supplied to
the area, due to the long delay in the construction of the Kelani River Right Bank Water
Treatment Plant, which should have been constructed in parallel with the project. Secondly,
6
the project created various positive impacts. For example, water supply services for the
existing customers were significantly improved by the extension of water supply hours and an
increase in water pressure. There were a positive impact to the industries in the area and an
improvement in the sanitation and living conditions of the people in the area.
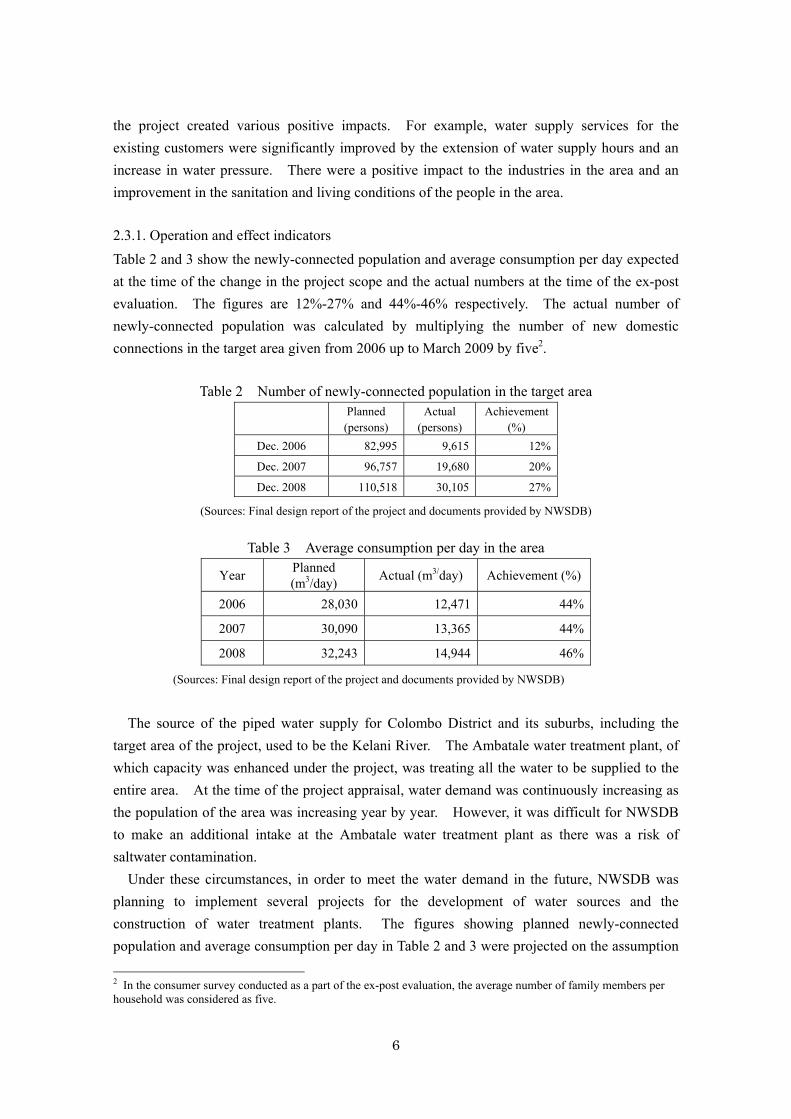
2.3.1. Operation and effect indicators
Table 2 and 3 show the newly-connected population and average consumption per day expected
at the time of the change in the project scope and the actual numbers at the time of the ex-post
evaluation. The figures are 12%-27% and 44%-46% respectively. The actual number of
newly-connected population was calculated by multiplying the number of new domestic
connections in the target area given from 2006 up to March 2009 by five2.
Table 2 Number of newly-connected population in the target area
Planned (persons)
Actual (persons)
Achievement(%)
Dec. 2006 82,995 9,615 12%
Dec. 2007 96,757 19,680 20%
Dec. 2008 110,518 30,105 27%
(Sources: Final design report of the project and documents provided by NWSDB)
Table 3 Average consumption per day in the area
Year Planned (m3/day)
Actual (m3/day) Achievement (%)
2006 28,030 12,471 44%
2007 30,090 13,365 44%
2008 32,243 14,944 46%
(Sources: Final design report of the project and documents provided by NWSDB)
The source of the piped water supply for Colombo District and its suburbs, including the
target area of the project, used to be the Kelani River. The Ambatale water treatment plant, of
which capacity was enhanced under the project, was treating all the water to be supplied to the
entire area. At the time of the project appraisal, water demand was continuously increasing as
the population of the area was increasing year by year. However, it was difficult for NWSDB
to make an additional intake at the Ambatale water treatment plant as there was a risk of
saltwater contamination.
Under these circumstances, in order to meet the water demand in the future, NWSDB was
planning to implement several projects for the development of water sources and the
construction of water treatment plants. The figures showing planned newly-connected
population and average consumption per day in Table 2 and 3 were projected on the assumption
2 In the consumer survey conducted as a part of the ex-post evaluation, the average number of family members per household was considered as five.
7
that the following projects would be realized in time.
(a) Construction of Kalu Ganga water treatment plant
As a part of the Kalu Ganga (Kalu River) Development Project, the Kalu Ganga water
treatment plant will be constructed. After the completion of the plant, treated water from the
Kalu Ganga plant will be supplied to South Colombo which is located near the Kalu Ganga.
Therefore, the Ambatale plant will be able to reserve its capacity, and a larger volume of water
will be sent to North Colombo, including the target area of the project. Eventually, the amount
of treated water supplied to the project area will increase.
(b) Construction of Kelani River Right Bank water treatment plant
The Kelani River Right Bank water treatment plant will be constructed with financial
assistance from the Government of Denmark. The volume of treated water supplied to the
Towns North of Colombo area, including the target area of the project, will greatly increase, as
the plant, in addition to the Ambatale water treatment plant, will supply treated water to the
area.
(c) Implementation of the stage II of the Towns North of Colombo Water Supply Project
The stage II of the Towns North of Colombo Water Supply Project will be implemented in
parallel to the project (Stage I). Facilities to be constructed in Stage II will be commissioned
from 2005 onwards, and thereafter, the number of connected households will increase
dramatically.
However, the volume of treated water supplied to the target area did not increase as expected,
as only a part of the above-mentioned assumptions were realized at the time of the ex-post
evaluation, as explained as follows, and there is still a limitation on the capacity of the Ambatale
water treatment plant due to the risk of salt water contamination, as mentioned earlier.
(a) Construction of Kalu Ganga water treatment plant
The Kalu Ganga Development Project was postponed due to the financial situation of
NWSDB. At present, the phase I of this project (Kalu Ganga Water Supply for Greater
Colombo Project; L/A signed in 1996), which was implemented with the support of an ODA
loan from JICA (former JBIC), has been completed. However, the phase II (Water Sector
Development Project II; L/A signed in 2008), including the construction of a water treatment
plant, has just commenced. Therefore, the Ambatale water treatment plant does not have the
extra capacity to supply more water to the target area.
(b) Construction of Kelani River Right Bank water treatment plant
Construction of Kelani River Right Bank water treatment plant became more urgent for
NWSDB as construction of the Kalu Ganga water treatment plant was delayed as mentioned
above. This project was funded by the Government of Denmark as planned. However,
construction of the plant was delayed for five years due to problems in the process of the
procurement of a civil contractor. Currently, the construction of the plant has not been
completed; therefore, water supply from the plant to the Towns North of Colombo area has not
started.
8
(c) Implementation of the stage II of the Towns North of Colombo Water Supply Project
The stage II of the Towns North of Colombo Water Supply Project was not implemented in
parallel to the stage I, as the implementation of the project (the stage II) was not considered to
be urgent, because the above-mentioned (a) and (b) projects delayed. At the moment, the
project is being implemented with the assistance of an ODA loan from JICA as a part of the
Water Sector Development Project I, signed in 2007, and the facility which will be constructed
by the project is planned to be commissioned in 2011.
NWSDB considers that the delay in the construction of the Kalu Ganga water treatment plant,
which was supposed to supply a large volume of water to the target area, should be the main
reason behind the shortage of treated water in the area. NWSDB has stopped the extension of
the distribution network and the provision of new connections at present due to the shortage of
the treated water. Therefore, it is not in a position to improve the levels of achievement shown
in Table 2 and 3.
2.3.2 Results of Financial Internal Rate of Return (FIRR)
The Financial Internal Rate of Return (FIRR) calculated at the time of the project appraisal
was 7.6% with the following conditions:
Cost: Project cost, cost of O&M and water treatment.
Benefit: Income from water bill payments by consumers
Project life: 33 years (40 years from the commencement of the project)
The FIRR recalculated at the time of the ex-post evaluation was 4.1%. The FIRR decreased
mainly because there was a delay in the creation of benefits for the period of around three years,
including the period for additional works, due to the delay in the completion of the project, and
because benefits from the project were less than expected, as income from water bill payments
by consumers was limited due to the limitation of the volume of treated water supplied to the
area.
2.3.3. Qualitative effects
To examine qualitative effects of the project, a consumer survey of 250 selected households
in the area was conducted. The results of the survey confirmed that water supply services for
the existing customers, such as service hours and water pressure, were improved drastically by
the project.
In response to the question of “Do you think water supply services were improved after the
project?”, 81% of the respondents answered “Yes”, while only 13% chose the response, “There
was no need for improvement as the services were good before the project.” Only 6% replied,
“No”. Those who replied “Yes” to the question cited “an increase of service hours” and “an
increase of water pressure” as examples for the improvement of the services.
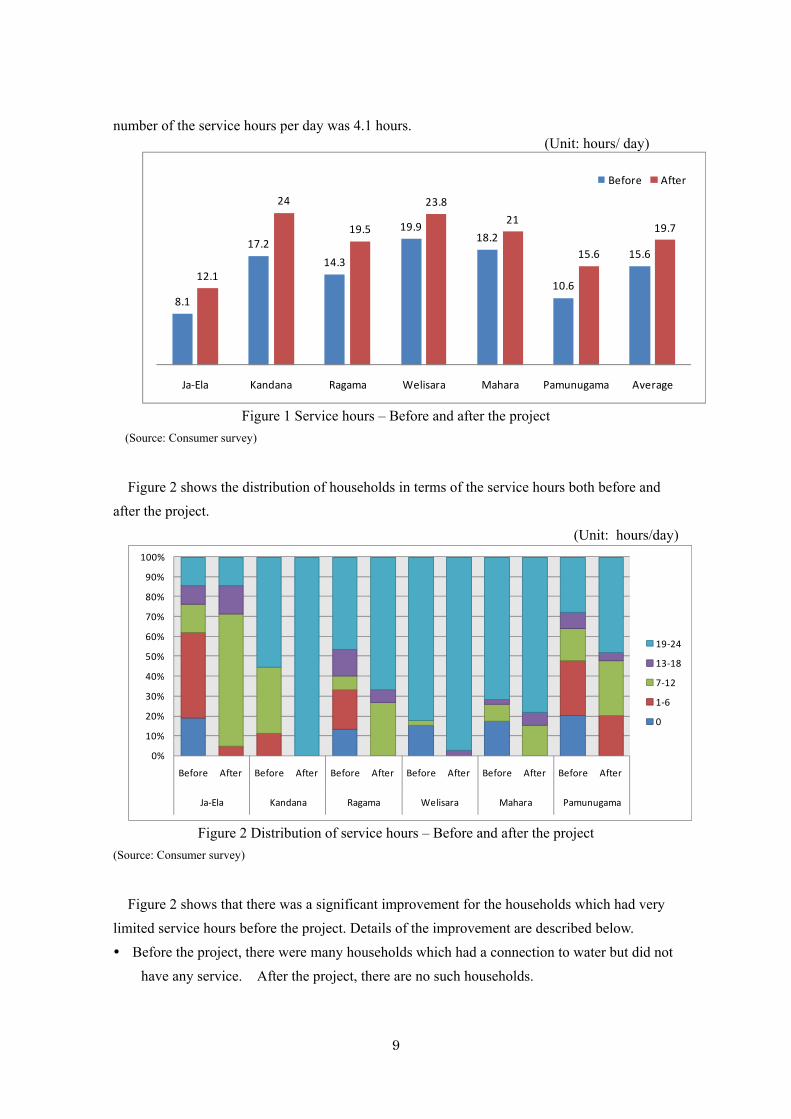
As shown in Figure 1, the service hours in the entire target area increased after the project by
three to seven hours, compared with the figures before the project. The average increase in the
9
number of the service hours per day was 4.1 hours. (Unit: hours/ day)
8.1
17.2
14.3
19.918.2
10.6
15.6
12.1
24
19.5
23.8
21
15.6
19.7
Ja‐Ela Kandana Ragama Welisara Mahara Pamunugama Average
Before After
Figure 1 Service hours – Before and after the project
(Source: Consumer survey)
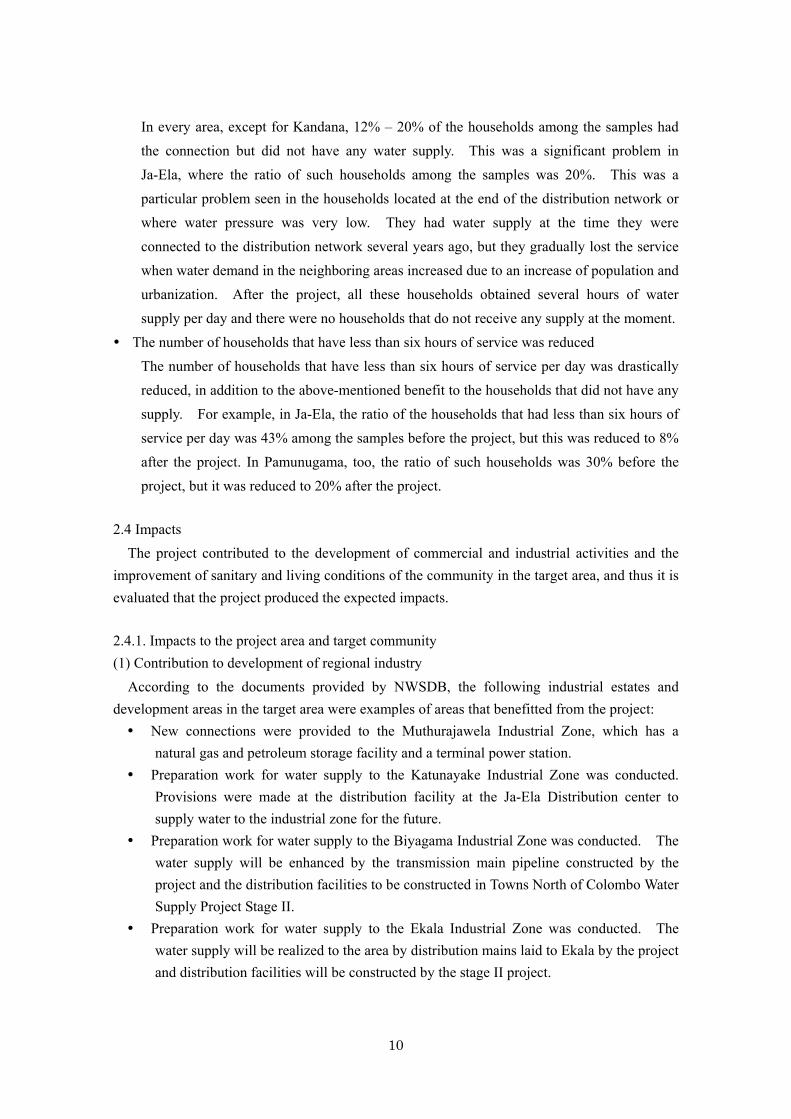
Figure 2 shows the distribution of households in terms of the service hours both before and
after the project.
(Unit: hours/day)
0%
10%
20%
30%
40%
50%
60%
70%
80%
90%
100%
Before After Before After Before After Before After Before After Before After
Ja‐Ela Kandana Ragama Welisara Mahara Pamunugama
19‐24
13‐18
7‐12
1‐6
0
Figure 2 Distribution of service hours – Before and after the project
(Source: Consumer survey)
Figure 2 shows that there was a significant improvement for the households which had very
limited service hours before the project. Details of the improvement are described below.
Before the project, there were many households which had a connection to water but did not
have any service. After the project, there are no such households.
10
In every area, except for Kandana, 12% – 20% of the households among the samples had
the connection but did not have any water supply. This was a significant problem in
Ja-Ela, where the ratio of such households among the samples was 20%. This was a
particular problem seen in the households located at the end of the distribution network or
where water pressure was very low. They had water supply at the time they were
connected to the distribution network several years ago, but they gradually lost the service
when water demand in the neighboring areas increased due to an increase of population and
urbanization. After the project, all these households obtained several hours of water
supply per day and there were no households that do not receive any supply at the moment.
The number of households that have less than six hours of service was reduced
The number of households that have less than six hours of service per day was drastically
reduced, in addition to the above-mentioned benefit to the households that did not have any
supply. For example, in Ja-Ela, the ratio of the households that had less than six hours of
service per day was 43% among the samples before the project, but this was reduced to 8%
after the project. In Pamunugama, too, the ratio of such households was 30% before the
project, but it was reduced to 20% after the project.
2.4 Impacts
The project contributed to the development of commercial and industrial activities and the
improvement of sanitary and living conditions of the community in the target area, and thus it is
evaluated that the project produced the expected impacts.
2.4.1. Impacts to the project area and target community
(1) Contribution to development of regional industry
According to the documents provided by NWSDB, the following industrial estates and
development areas in the target area were examples of areas that benefitted from the project:
New connections were provided to the Muthurajawela Industrial Zone, which has a
natural gas and petroleum storage facility and a terminal power station.
Preparation work for water supply to the Katunayake Industrial Zone was conducted.
Provisions were made at the distribution facility at the Ja-Ela Distribution center to
supply water to the industrial zone for the future.
Preparation work for water supply to the Biyagama Industrial Zone was conducted. The
water supply will be enhanced by the transmission main pipeline constructed by the
project and the distribution facilities to be constructed in Towns North of Colombo Water
Supply Project Stage II.
Preparation work for water supply to the Ekala Industrial Zone was conducted. The
water supply will be realized to the area by distribution mains laid to Ekala by the project
and distribution facilities will be constructed by the stage II project.
11
At the moment, NWSDB gives priority to the benefits for general consumers, and could not
answer requests from factories in the area for new connections due to the limitations on the
amount of treated water. Meanwhile, the following case study confirmed that a factory in the
target area, which already had a connection, benefitted from the project because of the increase
of service hours and improvement of water pressure.
A Case Study – Sanmyan Lanka Ceramic (a ceramic factory)
(The followings are the summary of an interview with a production manager of Sanmyan
Lanka Ceramic)
Sanmyan Lanka Ceramic is a ceramic production factory with Korean capital and located in
“Aniyakanda Industrial Estate” in Kandana City. The factory produces ceramic ornaments to
be exported mainly to Japan, England and U.S.A. It was established around 16 years ago.
Ground water was not available by digging a well in and around the industrial estate.
Therefore, factories in the estate depended on piped water supplied by NWSDB. The factory
had a connection of the piped water; however, water pressure was very low. Water came out
from a tap like a thread when opening a tap. As service hour was limited, the factory stored
water to an underground storage, however, the amount of water supplied for a day was far from
enough to necessary amount for a daily production, hand wash and toilet use by staff of the
factory.
The factory needs a large amount of water during the production process. For example, they
need to pour water continuously into a mill at the time processing ingredients. Until several
years ago, the factory used to purchase water from a private company. The company bought
water from bowsers. They usually need a bowser or two for a day, according to the amounts to
be produced. The production manager used to wait for the bowsers eagerly at the gate of the
factory, as the delivery was always delayed. It was a serious problem for the management of
the factory that the production schedule was often disturbed when bowser comes late, that the
quality of water from bowsers was not good, and that the cost of water from bowsers was
expensive.
After 2007, soon after the commissioning of the distribution facility in the Kandana
distribution center by the project, water supply became available to the factory 24 hours a day.
Since then, they have not had any problems with water pressure and quality. In this way, their
water problems were solved completely by the project. Currently, they do not need any
additional supplies from the bowsers. Their water needs are completely fulfilled by the piped
water supply. The production manager highly appreciates the project as production efficiency
of the factory has improved very much owing to the project.
(2) Improvement of sanitary and living condition of residents
In addition to the consumer survey of 250 households mentioned above, to study the impact
produced by the project on sanitary and living conditions of the residents in the target area, the
external evaluator conducted interviews with 39 households which may have problems with
12
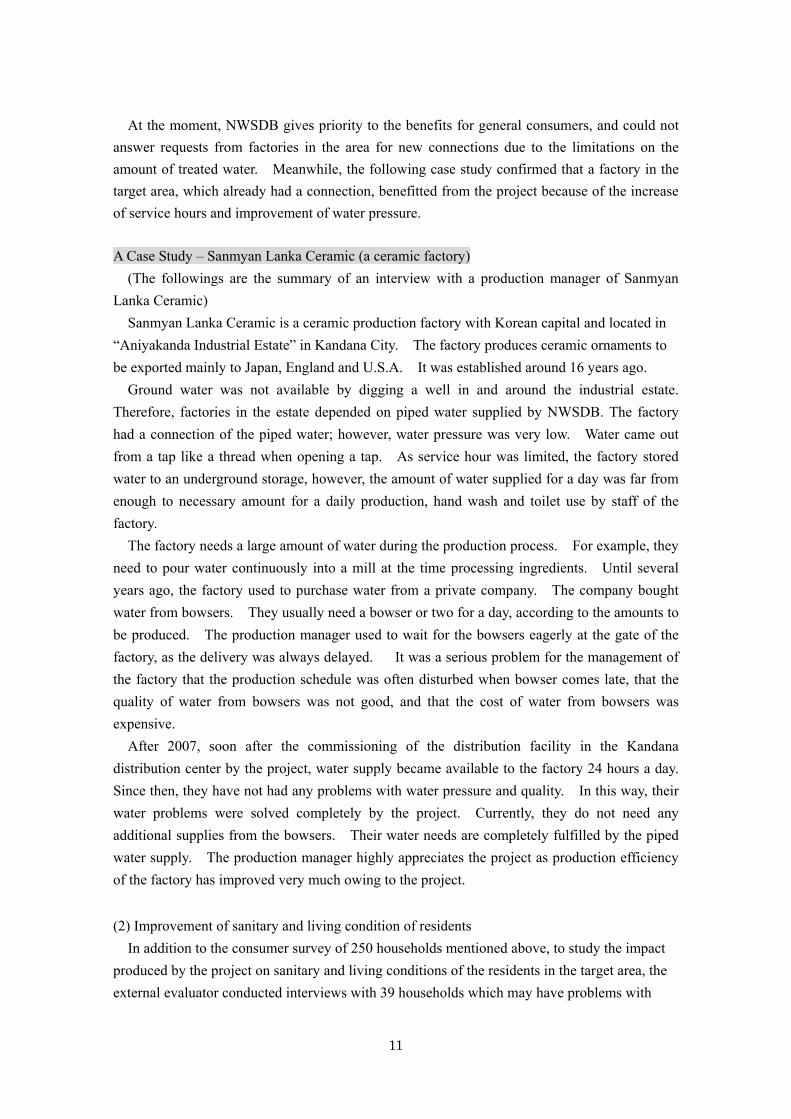
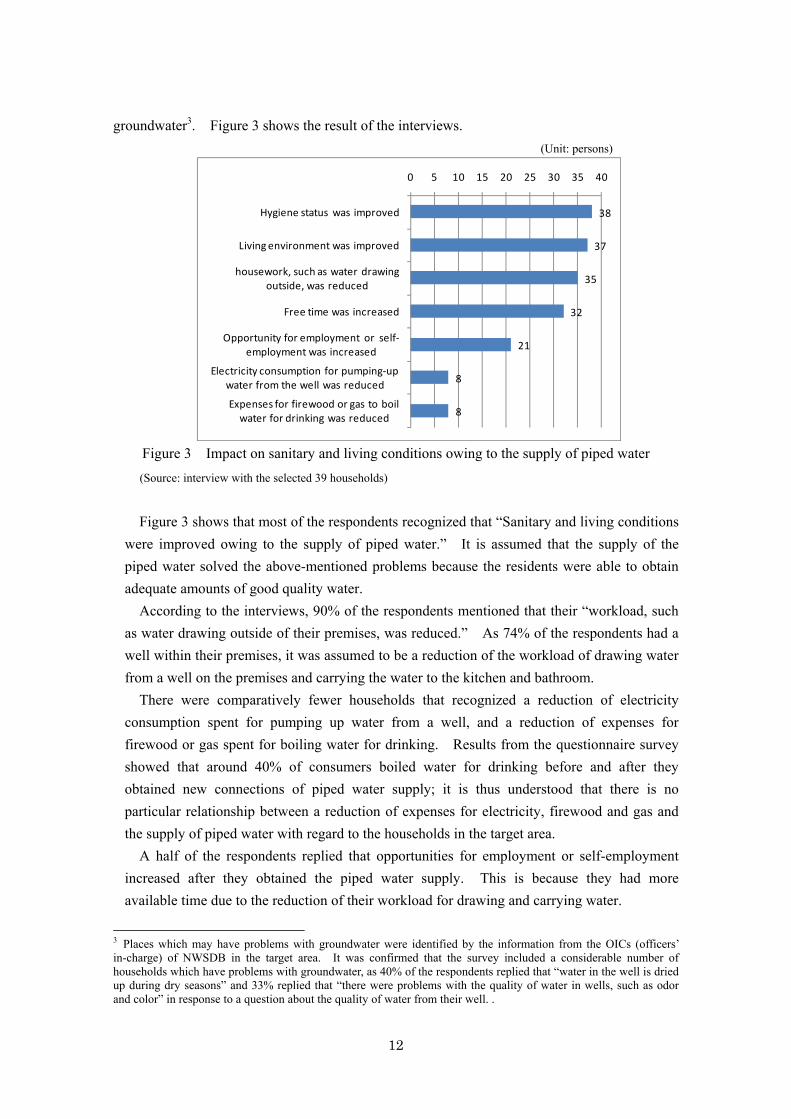
groundwater3. Figure 3 shows the result of the interviews.
(Unit: persons)
38
37
35
32
21
8
8
0 5 10 15 20 25 30 35 40
Hygiene status was improved
Living environment was improved
housework, such as water drawing outside, was reduced
Free time was increased
Opportunity for employment or self‐employment was increased
Electricity consumption for pumping‐up water from the well was reduced
Expenses for firewood or gas to boil water for drinking was reduced
Figure 3 Impact on sanitary and living conditions owing to the supply of piped water
(Source: interview with the selected 39 households)
Figure 3 shows that most of the respondents recognized that “Sanitary and living conditions
were improved owing to the supply of piped water.” It is assumed that the supply of the
piped water solved the above-mentioned problems because the residents were able to obtain
adequate amounts of good quality water.
According to the interviews, 90% of the respondents mentioned that their “workload, such
as water drawing outside of their premises, was reduced.” As 74% of the respondents had a
well within their premises, it was assumed to be a reduction of the workload of drawing water
from a well on the premises and carrying the water to the kitchen and bathroom.
There were comparatively fewer households that recognized a reduction of electricity
consumption spent for pumping up water from a well, and a reduction of expenses for
firewood or gas spent for boiling water for drinking. Results from the questionnaire survey
showed that around 40% of consumers boiled water for drinking before and after they
obtained new connections of piped water supply; it is thus understood that there is no
particular relationship between a reduction of expenses for electricity, firewood and gas and
the supply of piped water with regard to the households in the target area.
A half of the respondents replied that opportunities for employment or self-employment
increased after they obtained the piped water supply. This is because they had more
available time due to the reduction of their workload for drawing and carrying water.
3 Places which may have problems with groundwater were identified by the information from the OICs (officers’ in-charge) of NWSDB in the target area. It was confirmed that the survey included a considerable number of households which have problems with groundwater, as 40% of the respondents replied that “water in the well is dried up during dry seasons” and 33% replied that “there were problems with the quality of water in wells, such as odor and color” in response to a question about the quality of water from their well. .
13
(3) Benefit for medical institutions
The following case study shows that the project improved water supply services to a main
medical institution in the target area.
A case study – Ragama Teaching Hospital
(The following is a summary of an interview with the nursing staff of Ragama Teaching
Hospital)
Ragama Teaching Hospital is one of the largest general hospitals in the Gampaha District. It
has 1,350 beds and treats around 1,200 outpatients per day. The hospital first obtained piped
water supply in 1987 by a water supply scheme for “Ragama hospitals water supply scheme”. A
distribution main was laid to the area from the Welisara Reservoir. In 1993, the volume of
water supply was increased by the stage II of the same scheme. A gravity transmission main
was laid and a water storage tank and a water pump were installed in the hospital.
After a while, because of a population increase, urbanization and industrialization, water
demand in and around the area increased steadily. Distribution networks under the scheme
were extended and new connections were provided. In the hospital, too, water consumption
continued increasing as new hospital wards and medical facilities were added.
In this way, as water demand increased, the volume of water supplied to the area and the
capacity of the distribution facility became insufficient at all to meet the demands. The hospital
had a serious water shortage problem. The water supply was disrupted from around 10 o’clock
at night until 4 o’clock in the morning every day. They did not have enough water necessary
for the management of the hospital during the daytime as water pressure was low and the
volume of supply was insufficient. For example, they often could not use operating theaters,
flush water in toilets, wash their hands after nursing services and wash linens for inpatients. In
particular, water outage at night disrupted emergency surgeries and treatment of emergency
patients. They sometimes had turbid water during dry seasons.
The project constructed a water tower at the Ragama distribution center. The project also
laid a gravity main to the center, which permitted gravity transmission from Church Hill to the
Ragama area. Due to these improvements, the hospital has been enjoying a daily 24-hour
water supply since 2007. The head nurse at the hospital confirmed that the hospital has been
freed from the problems of water supply, and that the improved water supply is contributing
much to the efficient management of the hospital.
(4) Benefit to non-target area
Water supply services to the Pamunugama area were improved by the project. The area is
located northwest of the target area and was not included in the target area of the project.
NWSDB recognized the urgent needs of the community in Pamunugama and connected a
transmission line constructed by the project to distribution networks of the area. The volume
of water supply to the area was subsequently increased by the arrangement.
14
A case study – Talahena village in Pamunugama area
(The following is a summary of interviews with residents in Talahena village)
Talahena is a coastal village located northwest of the target area. It was not included in the
project area. Ground water under the village has been contaminated with mud and become
turbid and brownish in color from long ago. Residents of the village pumped up the ground
water from wells in the garden, filtered it and used it for domestic use. They used hand-made
filters made of gravel and pebbles. They said that the filtered water can be used for domestic
use, but it is not suitable to use for drinking at all.
The village obtained piped water supply around 15 years ago. However, from around 2000,
the water pressure and volume of water were extremely reduced due to an increase of demand
caused by the growing population and increase in the number of connections in the area. From
around 2002 onwards, the water was not supplied at all to the households located at the end of
the distribution network. In other words, these households had connections, but did not
receive even a drop of water from the supply. Other households in the village also had very
low water pressure. Water was not delivered up to taps in kitchens and bathrooms due to the
low pressure. They had to dig out a pipe laid under the gardens, attach a tap, and obtain water at
night and store it in a tank for drinking. If they could not obtain water by such means, they had
to bring water from a common tap several kilometers away from their residences. This
situation continued for around five years.
NWSDB recognized the serious problem of the residents, and made an arrangement to
connect a transmission line constructed by the project to the distribution network of the area.
The volume of water supplied to the area was subsequently increased by the arrangement. As a
result, the villagers were again able to obtain water supply for several hours a day. Households
located at the end of the distribution network were able to obtain water for drinking. Other
households became able to obtain water even for kitchens and bathrooms.
However, some of the residents still have to store water at night from a tap attached to a pipe
in the ground, store it in a tank and pump it to the taps in the house, as water pressure is still
very low. The residents use water from wells, too, as the volume of piped water supply is not
sufficient. They greatly hope the volume of piped water supply will increase soon, so that they
can become freed from the costly and troublesome work of pumping muddy water from a well,
filtering it, and pumping it again to the house. There are several households that do not have
connections to the piped water supply, and they must obtain water for drinking from
neighboring households. They are eagerly awaiting connections to the piped water supply.
<Reference>
Assumed number of direct beneficiaries:Around 130,000 persons (water supply–connected
domestic population in the target area)
Assumed number of indirect beneficiaries:Around 200,000 persons (users of hospitals,
schools, factories, shops, government institutions, religious facilities, etc.)
15
2.4.2. Impact on Natural Environment
(1) Impact by the construction work
There was no impact on the natural environment caused by the construction work of the
project.
(2) Saltwater contamination
Saltwater contamination in Kelani River, which is a source of water supply to the target area, is a serious problem, which happens every year during the dry season due to a reduction of the flow pressure of the river. As a countermeasure, NWSDB used to provide sandbag-protection every year. However, such a temporary solution does not solve the problem, and the construction of a “rubber dam system” has been planned as a permanent solution. A part of the plan is under construction at the moment.
(3) Increase of discharged water
There has been no increase of discharged sewerage water in the project area, as the number of connections and volume of consumption are limited.
(4) Deterioration of water quality of water source
The deterioration of the water quality of the Kelani River is a serious problem. The Ministry
of Environment has appointed a committee to carry out periodical monitoring of the water
quality of the Kelani River and facilitate responsible local authorities in conducting on-site
investigations of discharges of polluted water from factories and illegal connections to
sewerages.
2.4.3. Land acquisition and resettlement
Two unauthorized houses beside the Kelani River were relocated at the time of construction
of the gravity transmission mains. The relocation was conducted lawfully by the local
authority in the area. No issues arose due to the affected people. Land acquisition was carried
out in accordance with the Land Acquisition Act of Sri Lanka to obtain land for construction of
the distribution facility. There were no houses or establishments on the acquired land, and
appropriate compensatory payment was made to the land owner.
2.5. Sustainability (Rating: a)
No major problem has been observed in the capacity neither of the executing agency nor its
operation and maintenance system, therefore sustainability of the project is high.
2.5.1. Executing agency
(1) Structural aspects of operation and maintenance
The Ambatale Production Unit of NWSDB under the Deputy Manager of Western Province is
in charge of water treatment and transmission. Distribution is undertaken by each OIC office
16
and Area Engineer’s Office of NWSDB. The manager of Towns North of Colombo Manager’s
Office has the overall responsibility for distribution. Around 200 staff in total are engaged in
O&M work for the target area, including treatment, transmission and distribution of water.
There are no particular issues with regard to institutional aspects of O&M. Responsibilities of
the above-mentioned production unit and offices for distribution are clearly defined, and the
organizational structure for O&M is well established.
(2) Technical aspects of operation and sustainability
Two posts for mechanics and one post for an electrician were not fulfilled at the Ambatale
Production Unit. NWSDB is going to fill these posts very soon. Posts for technical staff
necessary for O&M work were filled at the offices in charge of distribution, such as OIC offices,
Area Engineer’s Office and Manager’s Office of Towns North of Colombo. NWSDB
considers that the technical level of their staff is adequate, and there have been no problems in
this regard. The pumps installed in the Ambatale treatment plant were the biggest pumps
NWSDB had ever used. The project conducted a training course on operation of these pumps as
a part of consulting services. Currently, staff members of NWSDB are operating the pumps
without any problem.
(3) Financial aspects of operation and sustainability
(a) Cost of O&M and financial revenue generated by payment of service charges
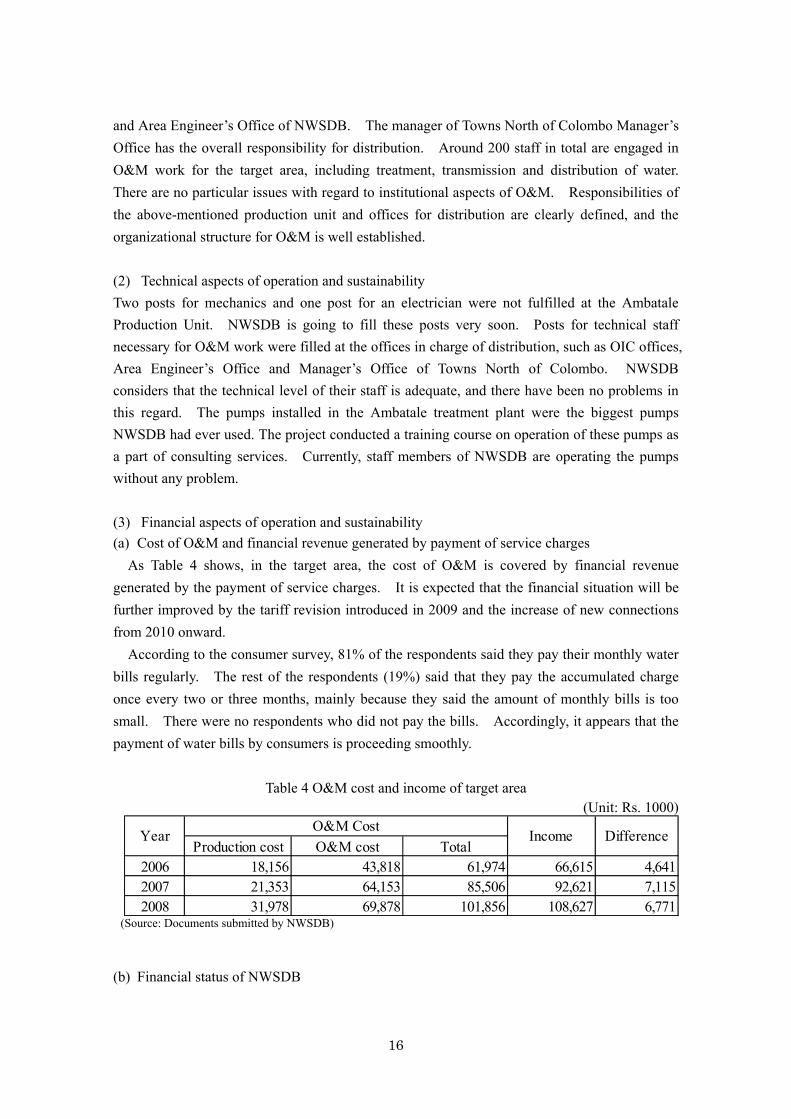
As Table 4 shows, in the target area, the cost of O&M is covered by financial revenue
generated by the payment of service charges. It is expected that the financial situation will be
further improved by the tariff revision introduced in 2009 and the increase of new connections
from 2010 onward.
According to the consumer survey, 81% of the respondents said they pay their monthly water
bills regularly. The rest of the respondents (19%) said that they pay the accumulated charge
once every two or three months, mainly because they said the amount of monthly bills is too
small. There were no respondents who did not pay the bills. Accordingly, it appears that the
payment of water bills by consumers is proceeding smoothly.
Table 4 O&M cost and income of target area (Unit: Rs. 1000)
Production cost O&M cost Total2006 18,156 43,818 61,974 66,615 4,6412007 21,353 64,153 85,506 92,621 7,1152008 31,978 69,878 101,856 108,627 6,771
YearO&M Cost
Income Difference
(Source: Documents submitted by NWSDB)
(b) Financial status of NWSDB

17
The financial status of NWSDB had been improving until 2006. However, in 2007, the
financial status, such as operating profit, net profit and assets-operation income ratio, suffered a
reverse mainly because the cost of inputs, such as electricity, chemicals, fuel and salaries,
became extremely high. According to an interview with senior officials of NWSDB, the
financial status in 2008, which was not officially revealed, did not show improvement. The
Water Sector Development Project, for which an agreement for a Japanese ODA loan was
signed in 2007, is assisting the enhancement of the management and financial capacity building
of NWSDB.
(c) Increase of water tariff
The water tariff has been increased every three years. Increases realized in 1999, 2002 and 2005 in recent years. However, the tariff was not revised in 2008. In February 2009, NWSDB introduced a new tariff, as the financial status of NWSDB will definitely become more fragile if there is no revision of the tariff.
(d) Non-Revenue Water Ratio
Table 5 shows the Non-Revenue Water (NRW) ratio of Towns North of Colombo, including
the target area. The ratio is lower than that for the Colombo Municipal Council area and
Greater Colombo, but it needs improvement. NRW ratios were worsened in 2006 and 2007
because there was a temporary loss of water at the time of the pipe-laying work and the
connection of the new system to the old system by the project. NWSDB does not measure the
NWR ratio only for the target area.
Table 5 Non-Revenue Water (NRW) Ratio for Towns North of Colombo
(Unit : %)
Year 2003 2004 2005 2006 2007 2008
NRW 24.3 20.1 20.5 27.5 24.8 21.7
(Source: Document submitted by NRW unit of NWSDB)
Table 6 shows NRW ratio for Colombo Municipal Council area and for Greater Colombo.
They are slightly improving, but they are still very high.
Table 6 Non-Revenue Water Ratio for Colombo City and Greater Colombo
(Unit :%) Year 1997 2000 2005 2007
Colombo Municipal Council area
57.0 53.7 51.3 52.7
Greater Colombo 47.0 38.7 35.9 37.84
(Source: Document submitted by NWSDB)
The Water Sector Development Project II, for which a Japanese ODA loan agreement was
18
signed, is going to assist NWSDB in improving the NRW ratios by implementing civil
construction in the city. A technical cooperation project of JICA for the improvement of the
NRW ratios will be implemented from late 2009 onwards for a period of three years.
2.5.2. Current status of operation and maintenance
(1) O&M for distribution facility
At present, the distribution of water is conducted by gravity as the number of connections is
still limited. Therefore, the pumps installed at the distribution centers are not operated, and
O&M for electrical and mechanical parts has not been necessary. The reservoirs constructed
by the project were also not used for the same reason as mentioned above.
The Area Manager’s offices and OIC offices are conducting the following O&M work based
on public complaints: observation of meter readers and analysis of bills, leakage repairs of pipe
lines and water meters, replacement of water meters and investigation and disconnection of
illegal connections. The offices are conducting disconnection programmes once every three
months to encourage consumers to pay their bills regularly. Under the programme, consumers
are given notice to settle their bills immediately to avoid disconnection. Water Towers are
operated by care-takers. The main task of the operator is to operate valves to avoid
overflowing of water. Towers are cleaned around once every three months.
(2) O&M conducted at water treatment plant
Preventive maintenance of the pumps is carried out at the Ambatale water treatment plant in
accordance with the planned schedule.
(3) Usage of vehicles for O&M procured by the project
All the vehicles provided by the project for O&M activities are utilized well by staff of
NWSDB at the Manager’s office of Towns North of Colombo, Ambatale Water Treatment Plant
and Head Office.
(4) Water leakage at water pipe bridges
Leakages were found in the water pipe bridge at the time of sudden and frequent power failures. As a result of the study conducted by the consultant team and NWSDB, it was found that the flywheels fitted to new pumps were not able to fully counteract high upsurge pressures and that the 90-degree dimensional pipe configurations adopted at the crossings had less endurance to the pressure.
NWSDB repaired the pipe joints and stopped the leakages at the crossings. Two pressure vessels were fabricated and installed at a location 70 meters downstream from the pump house to supplement the function of existing flywheels and enhance endurance to the upsurge pressures at the time of power failures. NWSDB believes that the leakages will be completely stopped once the pressure vessels are commissioned by the middle of May 2009.
(5) Conversion of the pumps installed at Ambatale Water Treatment Plant and gravity
19
transmission mains from Ambatale to Church Hill
Treated water will be supplied to the target area of the project mainly from the Kelani River
Right Bank Water Treatment Plant once it is completed. NWSDB is working out a plan for
future usage of the two pumps installed at the Ambatale Water Treatment Plant and the
transmission mains from Ambatale to Church Hill. There is an idea to use the pumps to
enhance water supply to the Greater Colombo area under the Greater Colombo Water Supply
Improvement project, which is one of the components of the Water Sector Development Project
currently being implemented with the financial support of an ODA loan from Japan. There is
an idea to use a part of the transmission mains from Ambatale to Church Hill to transmit water
from the Kelani River Right Bank Water Treatment Plant to the Church Hill Reservoir and the
rest of them to transmit water from the Kelani River Right Bank Water Treatment Plant to the
Ambatale Water Treatment Plant for water supply to the Colombo City area. NWSDB has to
study technical viability of these ideas in due course.
<Reference> Level of satisfaction of consumers to water supply services
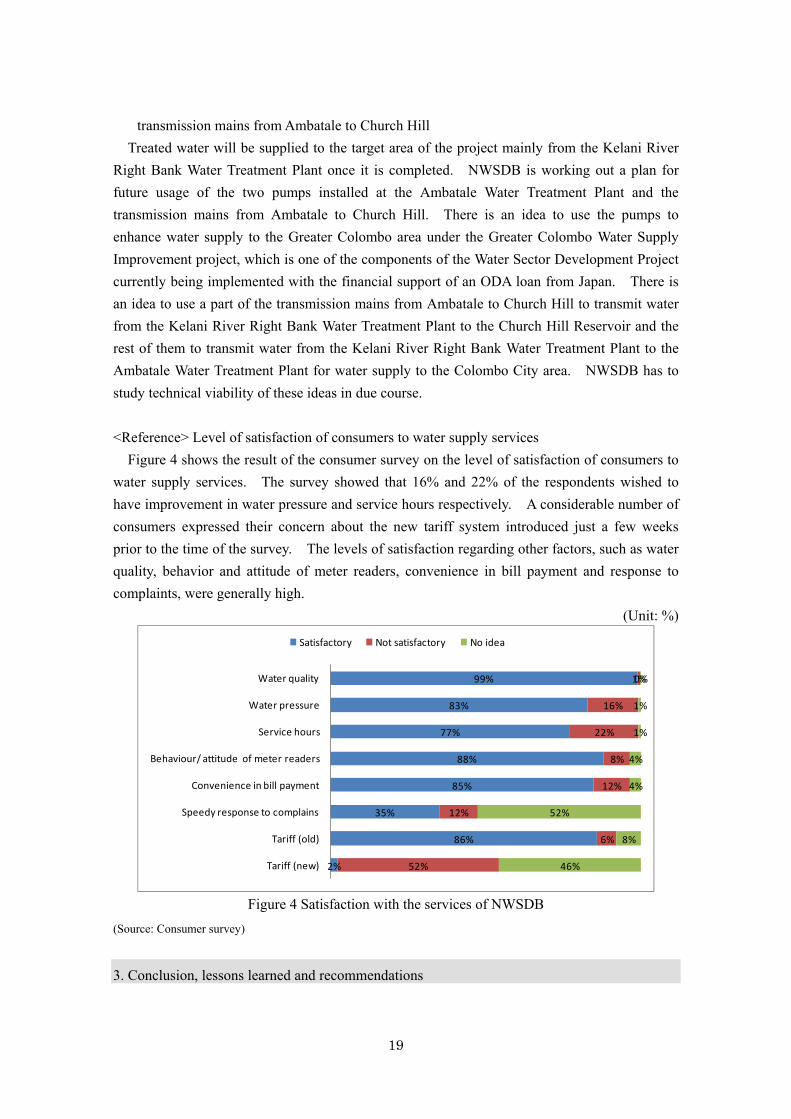
Figure 4 shows the result of the consumer survey on the level of satisfaction of consumers to
water supply services. The survey showed that 16% and 22% of the respondents wished to
have improvement in water pressure and service hours respectively. A considerable number of
consumers expressed their concern about the new tariff system introduced just a few weeks
prior to the time of the survey. The levels of satisfaction regarding other factors, such as water
quality, behavior and attitude of meter readers, convenience in bill payment and response to
complaints, were generally high.
(Unit: %)
2%
86%
35%
85%
88%
77%
83%
99%
52%
6%
12%
12%
8%
22%
16%
1%
46%
8%
52%
4%
4%
1%
1%
0%
Tariff (new)
Tariff (old)
Speedy response to complains
Convenience in bill payment
Behaviour/ attitude of meter readers
Service hours
Water pressure
Water quality
Satisfactory Not satisfactory No idea
Figure 4 Satisfaction with the services of NWSDB
(Source: Consumer survey)
3. Conclusion, lessons learned and recommendations
20
3.1. Conclusion
Although the effectiveness and the efficiency of the project were moderate, the relevance and
the sustainability of the project were high. In light of the above, this project is evaluated to be
satisfactory.
3.2. Lessons learned
Some expected effects of the project were not produced, as several projects, which were
planned to be implemented in parallel to the project, especially construction of the water
treatment plants, were delayed. It is crucial in water supply projects to implement
integrated efforts as scheduled, including projects for the development of water sources,
water treatment, transmission and distribution, in order to meet increasing demand.
A review of planned target figures or achievement forecasts could be made by the
conducting of a mid-term review of the project, in case important assumptions or external
conditions of the project were drastically changed during the period of project
implementation due to delays of other projects and other factors.
3.3 Recommendations
It is recommended that the effects and impacts of the project and status of usage of the
facility constructed by the project should be studied after completion of the Kelani River
Right Bank Water Treatment Plant and the phase II of Towns North of Colombo Water
Supply Project4, when effects of the project will be fully realized.
It is recommended that the improvement of the financial status of NWSDB and the NRW
ratios also should be confirmed by continuous monitoring in the future as well, even though
several measures have already been taken.
4 Signed in 2007 as one of the components of the Water Sector Development Project, which is financed by a Japanese ODA loan.
21
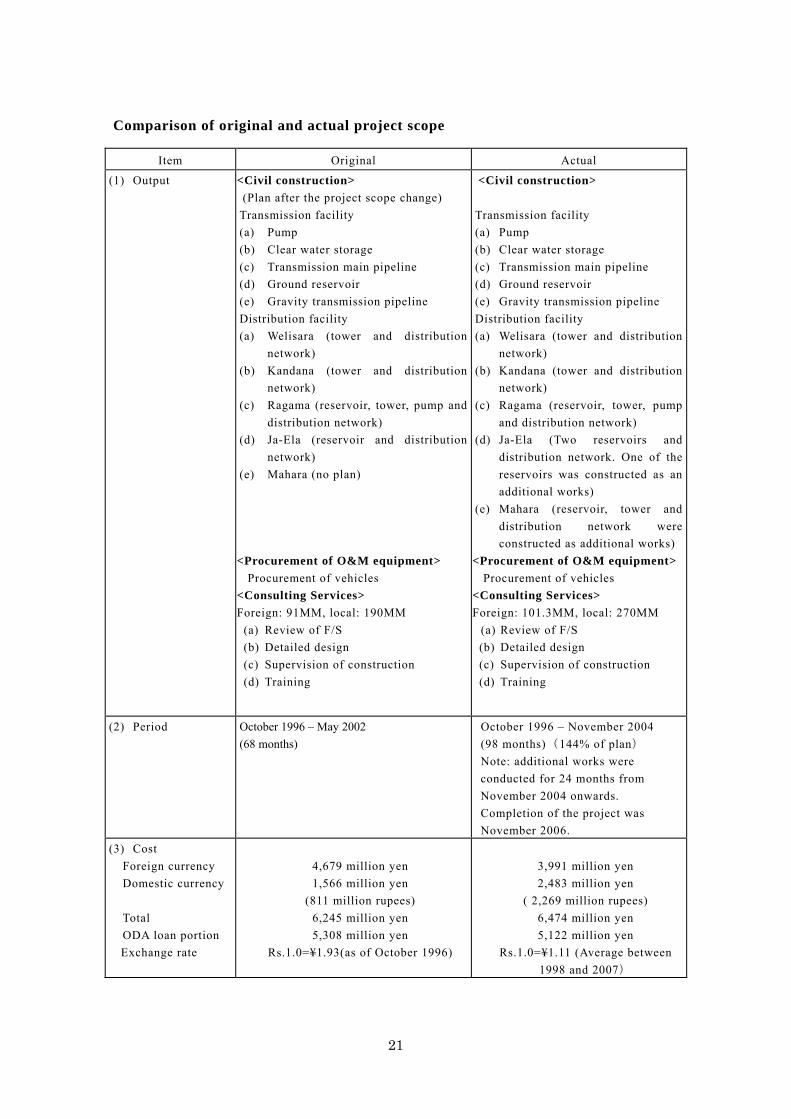
Comparison of original and actual project scope
Item Original Actual
(1) Output <Civil construction>
(Plan after the project scope change)
Transmission facility
(a) Pump
(b) Clear water storage
(c) Transmission main pipeline
(d) Ground reservoir
(e) Gravity transmission pipeline
Distribution facility
(a) Welisara (tower and distribution
network)
(b) Kandana (tower and distribution
network)
(c) Ragama (reservoir, tower, pump and
distribution network)
(d) Ja-Ela (reservoir and distribution
network)
(e) Mahara (no plan)
<Procurement of O&M equipment>
Procurement of vehicles
<Consulting Services>
Foreign: 91MM, local: 190MM
(a) Review of F/S
(b) Detailed design
(c) Supervision of construction
(d) Training
<Civil construction>
Transmission facility
(a) Pump
(b) Clear water storage
(c) Transmission main pipeline
(d) Ground reservoir
(e) Gravity transmission pipeline
Distribution facility
(a) Welisara (tower and distribution
network)
(b) Kandana (tower and distribution
network)
(c) Ragama (reservoir, tower, pump
and distribution network)
(d) Ja-Ela (Two reservoirs and
distribution network. One of the
reservoirs was constructed as an
additional works)
(e) Mahara (reservoir, tower and
distribution network were
constructed as additional works)
<Procurement of O&M equipment>
Procurement of vehicles
<Consulting Services>
Foreign: 101.3MM, local: 270MM
(a) Review of F/S
(b) Detailed design
(c) Supervision of construction
(d) Training
(2) Period
October 1996 – May 2002
(68 months)
October 1996 – November 2004
(98 months)(144% of plan)
Note: additional works were
conducted for 24 months from
November 2004 onwards.
Completion of the project was
November 2006.
(3) Cost
Foreign currency
Domestic currency
Total
ODA loan portion
Exchange rate
4,679 million yen
1,566 million yen
(811 million rupees)
6,245 million yen
5,308 million yen
Rs.1.0=¥1.93(as of October 1996)
3,991 million yen
2,483 million yen
( 2,269 million rupees)
6,474 million yen
5,122 million yen
Rs.1.0=¥1.11 (Average between
1998 and 2007)