toxic and terminal - environmental justice australia
TRANSCRIPT

Toxic and terminal
How the regulation of coal-fired power stations fails Australian communities

Lead authors: Bronya Lipski, Nicola Rivers and James Whelan
Contributors: Dr Brad Smith, Josh Meadows
Many thanks to all those who have assisted us with this report, in particular the community members who shared their stories with us and the power station and air pollution experts who informed and advised us.
About Environmental Justice AustraliaEnvironmental Justice Australia is a not-for-profit public interest legal practice. Funded by donations and independent of government and corporate funding, our legal team combines a passion for justice with technical expertise and a practical understanding of the legal system to protect the environment.
We act as advisers and legal representatives to the environment movement, pursuing court cases to protect our shared environment. We work with community-based environment groups, regional and state environmental organisations, and larger environmental NGOs. We provide strategic and legal support to their campaigns to address climate change, protect nature and defend the rights of communities to a healthy environment.
While we seek to give the community a powerful voice in court, we also recognise that court cases alone will not be enough. That’s why we campaign to improve our legal system. We defend existing, hard-won environmental protections from attack. We also pursue new and innovative solutions to fill the gaps and fix the failures in our legal system to clear a path for a more just and sustainable world.
For further information on this report please contact:Nicola Rivers, Director of Advocacy and Research, Environmental Justice AustraliaEmail: [email protected]
Environmental Justice AustraliaTelephone: 03 8341 3100/1300 336 842Facsimile: 03 8341 3111Email: [email protected]: www.envirojustice.org.auPost: PO Box 12123, A’Beckett Street VIC 8006Address: Level 3, the 60L Green Building, 60 Leicester Street, Carlton
Community rights in relation to power station pollution are summarised in our factsheets Your rights and coal-fired power stations in Victoria1 and Your rights and Coal-fired power stations in NSW2.
Produced & published by Environmental Justice AustraliaABN 74 052 124 375Publication date: 7 August 2017 Cover photo: Yallourn power station. Photo by Max Philips

Community voices
Dr Ben Ewald, Newcastle GP 13Mike Campbell OAM, community leader, NSW central coast 21Bev Smiles, Hunter Communities Network 26Graeme Wilson, Latrobe Valley Resident 31Charmian Eckersley, Eraring Resident 41Gary Blaschke OAM, community disability advocate, NSW central coast 45Irene Proebsting, Latrobe Valley resident 49
Contents
1 Executive summary and recommendations 2
2 Introduction 62.1 About this report 7
3 Health impacts of coal-fired power stations 93.1 The impact on local and distant communities 103.2 Pollutants and their impacts on health 123.3 The health benefits of reducing air pollution 12
4 Toxic emissions from Australian power stations 144.1 Coarse particle pollution (PM10) 164.2 Fine particle pollution (PM2.5) 174.3 Sulfur dioxide (SO2) 184.4 Oxides of nitrogen (NOx) 19
5 How are power stations regulated? 225.1 National air pollution standards 235.2 State regulation of power stations 25 5.2.1 Emission limits 25 5.2.2 Are the limits adequate? 25 5.2.3 Problems with the lack of a national
approach 255.3 Is air pollution monitoring and reporting adequate? 27 5.3.1 Power station emissions monitoring 27 5.3.2 Public reporting of emissions data 27 5.3.3 National Pollutant Inventory Reporting 295.4 Health costs borne by the community not
the polluter 325.5 What does this all mean? 32
6 Controlling toxic emissions from coal-fired power stations 33
6.1 Pollution reduction technologies 346.2 Do new power stations reduce toxic emissions? 36
7 Do power stations comply with the law? 377.1 Finding out about power station licence breaches 387.2 Breaches of toxic pollution licence conditions 387.3 Are regulators doing their job? 39
8 Decommissioning and rehabilitating power stations 42
8.1 Poor management now and later? Land and water contamination from ash ponds 43
8.2 Bonds and financial assurances 46 8.2.1 Financial assurances in Victoria 48 8.2.2 Financial assurances in Queensland 48 8.2.3 Financial assurances in NSW 48
9 Conclusions 50
10 Power station profiles 53 Power station: Vales Point 54 Power station: Eraring 56 Power station: Bayswater 58 Power station: Liddell 60 Power station: Mt Piper 62 Power station: Gladstone 64 Power station: Stanwell 66 Power station: Loy Yang A 68 Power station: Yallourn 70 Power station: Loy Yang B 72
12 Appendix 74
13 References 76
1
Environmental Justice Australia
1
Executive summary and recommendations
2
Environmental Justice Australia

Australia has one of the oldest and least efficient fleets of coal-fired power stations in the world.3 Australia’s power stations release more than a million tonnes of toxic pollution into the air each year, affecting not just communities that live near the power stations, but also those further away, such as Sydney. Toxic pollution can travel great distances, so the pollution from Australia’s power stations is breathed in by millions of Australians. However, the health impacts of this toxic pollution are unfairly imposed most heavily on communities closest to power stations.
This report focuses primarily on the four pollutants that have been monitored most extensively and have well-established regulations and standards: coarse particles (PM10), fine particles (PM2.5), sulfur dioxide (SO2) and oxides of nitrogen (NOx). These pollutants are extremely harmful to health, causing and worsening a range of medical conditions such as asthma, respiratory problems, stroke, angina, heart attack and cancer.4 They irritate and inflame the lungs, leading to chronic lung disease and restricted lung growth in children.5 Children and elderly people are particularly affected.
For this report we reviewed the emissions data, licences, community complaints, compliance records and rehabilitation plans of ten of Australia’s most toxic coal-fired power stations in NSW, Victoria and Queensland.
The following are just some of our many significant discoveries.
• Coal-fired power stations emit more than 30 toxic substances that have serious impacts on the communities that live near them including heart attack, stroke, asthma, lung cancer, respiratory and cardiovascular disease, irritation of the eyes, nose and throat, choking and coughing, headache, general discomfort and anxiety, wheezing, colds, flu and bronchitis, coughing, shortness of breath, tiredness and nausea.
• Coal-fired power stations are the biggest source of PM2.5, SO2 and oxides of nitrogen in Australia.
• In almost all cases the emissions limits applied to Australian power stations are significantly less stringent than the standards in the European Union, United States and China. For example the Victorian and Queensland power stations’ particle limits are less strict than all three international limits. Loy Yang A’s particle limit is eight times China’s limit. The mercury limits for some NSW power stations are 666 times higher than the US limits. This is unacceptable.
• Pollution reduction technologies that have been available for many years and are frequently used overseas could significantly reduce power station emissions but are not being used in Australia. All power stations are emitting significantly more pollution than they would if they had currently available pollution reduction technologies installed.
• There are significant problems with the monitoring and reporting of power station emissions. For example, at the Yallourn power station a representative admitted to EPA Victoria that at times of excessive pollution it ‘simplified’ its reporting by
stating that it was emitting at levels that correspond with its licence limits. Reports to the National Pollutant Inventory for some NSW power stations appear to be wildly in error.
• No power station in Victoria, NSW or Queensland has been prosecuted for any offence in the past ten years.
• None of the ten power stations has rehabilitation bonds or financial assurances imposed on it to ensure decommissioning and rehabilitation will occur if the operator does not adequately rehabilitate after closure.
We have found that state government regulators in each state have allowed power station operators to continue to emit unacceptable levels of pollution. How does this happen? Their emission limits have been lax when compared to international standards; the monitoring and reporting they require from power stations is inadequate; they have not required power stations to implement pollution reduction technologies that many power stations overseas have installed; and they do not strictly enforce the law. As a result, communities are exposed to excessive and preventable levels of toxic pollution.
Building new coal-fired power stations is not the answer. New coal-fired power stations, even those described as ‘ultra-super critical’ or ‘HELE’ (high efficiency, low emission) only marginally reduce toxic emissions. Constructing new coal-fired power stations to replace Australia’s old, inefficient fleet would still result in millions of tonnes of toxic pollution being released into our air, water and land.
Australia’s state and national governments are ill-prepared for power station closure, decommissioning and rehabilitation. This is illustrated by the absence of rehabilitation bonds or financial assurances imposed on any of the power stations we reviewed. Failing to plan for closure maximises the social and economic harm in the very communities that have lived for decades with the pollution from these power stations.
Figure 1 represents some of the key findings of our research.
So what should be done? Strong regulation is critical to reduce the toxic burden power station pollution gives to people who live nearby. Communities, especially communities living in the shadow of power stations, have little control over the air they breathe. They rely on strong regulation to protect their health. All governments must acknowledge the toxic burden power station emissions leave with Australian communities and should regulate power stations accordingly.
Governments should impose stricter emissions standards that in turn will give companies the incentive to install better pollution reduction technologies and improve their operating practices.
Ultimately though, the only way to avoid the death and disease that coal-fired power stations impose on Australian communities is to avoid the pollution in the first place. This requires a transition away from coal-fired power stations to renewable energy generation, which produces no toxic pollution.
3
Environmental Justice Australia

More than 1 milliontonnes of toxic pollution emitted every year
Limited community access to pollution monitoring
Pollution reduction technologies not installed
Emissions limits weaker than international standards
Non-compliance with licence conditions; minimal enforcement
Inadequate plans for closure and rehabilitation
Toxic ash dams close to communities
Errors in pollution reporting
Figure 1Australia’s coal-fired power stations: toxic and under-regulated
4
Environmental Justice Australia

Recommendations
1. That the Federal Government commission a comprehensive and independent assessment of the health impacts of Australia’s coal-fired power stations.
2. That the Federal Government recognise the need for a strong and consistent national approach to the regulation of air pollution and develop and implement binding national emission standards for coal-fired power stations that require international best practice.
3. That Australia’s state governments require mandatory continuous monitoring of stack emissions from all stacks of all major power stations and the data be reported publicly in real time.
4. That Australia’s state governments subject all power stations to an emissions reduction program for PM2.5, PM10, SO2 and NOx to reduce their toxic pollution in line with Best Available Techniques to reduce the toxic health burden imposed on the community.
5. That Australian governments develop and implement a national load-based licencing scheme with fees that reflect the health impacts and other externalities of power stations, ideally led by the Federal Government through the National Environment Protection Council.
6. That the Federal Government commission an independent audit of reporting to the National Pollutant Inventory and instruct power stations on how to improve the accuracy and rigour of their reporting.
7. That federal and state energy ministers undertake a national audit to assess the costs of decommissioning and rehabilitating Australia’s coal-fired power stations, consistent with best practice, and impose bonds or financial assurance requirements on all coal-fired power stations, their ash dams and associated infrastructure.
8. That in light of the level of toxic emissions released by all coal-fired power stations regardless of their age, all Australian governments commit to not build, finance or approve any new coal-fired power stations in Australia and instead invest in the development of renewable energy technologies to progressively replace Australia’s aging power station fleet.
5
Environmental Justice Australia

2
Introduction
6
Environmental Justice Australia

Australia has 17 commercially operating coal-fired power stations, located in NSW, Queensland, Victoria and Western Australia.6 Australia has one of the oldest and most inefficient fleets of power stations in the world,7 with 89% of our power stations classed as ‘subcritical’ – the oldest type of power station.8 Half of Australia’s power stations are at least 30 years old. The oldest – Liddell in NSW – is 46 years old.
Australia’s power stations release more than a million tonnes of toxic pollution into the air each year, affecting not just communities living near the power stations but also communities further away. Toxic pollution can travel great distances, so the pollution from Australia’s power stations is breathed in by millions of Australians, particularly those in Sydney who end up with a large chunk of the Hunter Valley’s pollution. Power stations are the largest source of sulfur dioxide (SO2), oxides of nitrogen (NOx) and fine particulate matter (PM2.5) in Australia – three toxic pollutants that cause death and disease in humans and harm the environment.9
Although power station emissions are regulated by state governments, regulators have allowed power station operators to continue to emit unacceptable levels of pollution in several ways:
• they have imposed lax emission limits compared to international standards;
• the monitoring and reporting they require from power stations is inadequate;
• they have not required power stations to implement pollution reduction technologies that many power stations overseas have installed; and
• they do not strictly enforce the law.
As a result, communities are exposed to excessive and preventable levels of toxic pollutants that cause and make worse a range of health impacts such as lung cancer, heart attack, stroke, asthma and respiratory disease.10
Building new power stations is not the answer to our toxic pollution woes. ‘Ultra-super critical’ power stations with newer technology barely reduce the toxic emissions they emit and would still result in over a million tonnes of toxic pollution being released into our air, water and land.
Instead, our current fleet of power stations must be regulated much more strictly, with stricter emissions standards applied which leads to the need for pollution reduction technologies to be installed and operating practices to be improved.
Strong regulation is critical to reducing the toxic burden placed on the community by power station pollution. Communities, especially communities living in the shadow of power stations, have little control over the air they breathe. They rely on strong regulation to protect their health. The International Energy Agency recently noted that in those countries where air pollution is being controlled strong government regulation is the primary reason.11
It must be noted though that there is no ‘safe’ level of air pollution – health impacts are found even at low levels of pollution. Ultimately the only way to avoid death and disease from power station pollution is to move to renewable energy generation, which produces no toxic pollution. Even the highly conservative International Energy Agency notes in its recent report on energy and air pollution, ‘Policies and measures that lead to an avoidance of air pollution emissions tend to be associated with the broader transformation of the energy sector into one that is more efficient and less reliant on fossil fuels: over the longer term, the simplest way to tackle air pollution is not to produce the pollutants in the first place’.12
2.1 About this reportIn this report we focus on the toxic pollution and regulatory failures of ten of Australia’s coal-fired power stations (see figure 2). These power stations have been chosen due to their high levels of toxic emissions and close proximity to communities. In the second half of this report we include a profile on each of these power stations to highlight specific issues with each. Western Australia has not been included as the largest and most polluting of WA’s three commercial power stations is due to close over the next twelve months.13
Toxic pollution from power stations impacts groundwater and surface water and contaminates land, however we have focused primarily on their air pollution as it is this type of pollution which has the biggest impact on human and environmental health.
In order to produce this report we sought out and reviewed thousands of pages of documents from publicly available sources, regulators and power stations themselves. In some cases we conducted Freedom of Information requests to access information that the regulator or power station owner would not allow access to, however most of our information comes from publicly available – although hard to find – sources. We also gathered information from local community members who have been living with these power stations for many decades and are grateful to those who shared their stories.
At the end of this report we outline eight recommendations that should be implemented immediately by state and federal governments to begin to reduce the toxic burden power stations place on Australian communities.
7
Environmental Justice Australia

Figure 2Location, age and capacity of power stations analysed in this report
24 YRS OLD
Stanwell
1460MW
41 YRS OLD
Gladstone
1680MW
Bayswater32 YRS OLD
2640MW
Yallourn43 YRS OLD
1480MW
Loy Yang B24 YRS OLD
953MW
Mt Piper25 YRS OLD
1400MW
46 YRS OLD
Liddell
2000MW
35 YRS OLD
Eraring
2880MW
39 YRS OLD
Vales Point
1320MW
Loy Yang A33 YRS OLD
2210MW
BROWN COAL
BLACK COAL
8
Environmental Justice Australia

3
Health impacts of coal-fired power stations
9
Environmental Justice Australia

Coal-fired power stations emit more than 30 toxic substances that have serious impacts on the communities that live near them.14 Many of these pollutants are carcinogens that accumulate in the environment and in human bodies and even a small amount can harm human health.15 Figure 3 shows the key toxic substances emitted by Australian coal-fired power stations.
This report focuses primarily on the four pollutants that have been monitored most extensively and have well-established regulations and standards: coarse particles (PM10), fine particles (PM2.5), sulfur dioxide (SO2) and oxides of nitrogen (NOx). These pollutants are extremely harmful to health, causing and worsening a range of medical conditions such as asthma, respiratory problems, stroke, angina, heart attack, and cancer.16 They irritate and inflame the lungs leading to chronic lung disease and restricted lung growth in children.17 Children and elderly people are particularly affected.
3.1 The impact on local and distant communitiesPower stations are generally the main source of air pollution in nearby communities. For example, 95% of air pollution in the Latrobe Valley in Victoria is from burning coal.18 In the Hunter Valley in NSW, studies indicate 30–40% of fine particle pollution is caused by power stations.19 Although some pollutants such as fine particle pollution can travel great distances, local communities suffer the most significant exposure. People who live within 50kms of coal-fired power stations face a risk of premature death as much as three to four times that of people living further away.20 It has been estimated that the air pollution from Hazelwood power station alone caused 18 premature deaths a year in the Latrobe Valley.21 The scale of the community health damage from the five coal-fired power stations in the Hunter Valley can be seen in their associated annual healthcare costs, estimated at around $600 million per annum.22 The annual health costs of coal-fired power stations across Australia has been estimated at about A$2.6 billion a year.23
Communities living further away are also affected. Air pollutants from coal-fired power stations travel long distances. Much of the SO2, NOx and PM2.5 found in Sydney’s air is emitted by power stations in the Hunter Valley and Central Coast as can be seen in figures 4a and 4b.24
Figure 3Toxic substances emitted by coal-fired power stations
AmmoniaArsenic & compoundsBeryllium & compoundsBoron & compoundsCadmium & compoundsCarbon monoxideChlorine & compoundsChromium (III) compoundsChromium (VI) compoundsCobalt & compoundsCopper & compoundsCumene (1-methylethylbenzene)Fluoride compoundsHydrochloric acidLead & compoundsManganese & compoundsMercury & compoundsNickel & compoundsOxides of NitrogenParticulate Matter 10.0Particulate Matter 2.5Polycyclic aromatic hydrocarbonsSulfur dioxideSulfuric acidToluene (methylbenzene)Total Volatile Organic CompoundsXyleneZinc and compounds
10
Environmental Justice Australia

Figure 4aSources of oxides of nitrogen in Sydney's air
17% Other 54% Electricity generation
3% Ships
7% Heavy duty commercial diesel
Figure 4b Sources of sulfur dioxide in Sydney's air
3% Other87% Electricity generation
2% Ships
3% Iron or steel production
5% Aluminium production
9% Passenger vehicle petrol
10% Industrial vehicles and equipment
Source: EPA (2012), 2008 Calendar Year Air Emissions Inventory for the Greater Metropolitan Region in NSW, Technical Report No.1 (pp.171; 156)
11
Environmental Justice Australia

3.2 Pollutants and their impacts on healthCoarse particles (PM10) measure up to 10 micrometres (or microns) in diameter. For comparison, a human hair generally measures 50-70 microns in diameter. Coarse particles are produced by mechanical processes including coal mining and transport. Fine particles (PM2.5) measure up to 2.5 micrometres in diameter. They are generally produced through combustion processes such as power stations and motor vehicles. All particulate matter can trigger heart attacks and strokes and has been deemed carcinogenic by the World Health Organisation.25 Fine particles travel deep into the lungs and pass into the bloodstream, posing a risk of stroke and heart attacks.26 There is no threshold below which particle pollution exposure is not harmful to health.27
Exposure to SO2 causes irritation of the eyes, nose and throat, choking, coughing, headache, general discomfort and anxiety. The symptoms are exacerbated for people with impaired heart or lung function and asthmatics. Repeated or prolonged exposure to even moderate concentrations may cause inflammation of the respiratory tract, wheezing and lung damage.28
NOx can contribute to respiratory problems such as wheezing and bronchitis. Exposure can irritate the eyes, nose, throat and lungs, possibly leading to coughing, shortness of breath, tiredness and nausea.29
Further information about the specific health impacts associated with each of these toxic pollutants can be found on the National Pollutant Inventory website www.npi.gov.au.
3.3 The health benefits of reducing air pollutionThere are health benefits for every tonne of pollution that is reduced and that a community is not exposed to, especially when particulate pollution is controlled, and the health benefits continue to increase as pollution decreases.30 Controlling pollution can result in immediate health benefits such as lower asthma rates and fewer hospital visits as well as reduction in disease and death generated from long-term exposures.31
Larynx
Heart
Areoli
Bronchioles
Right lobes
Diaphragm
Rib
Trachea
Brain
Brain PM2.5
Lungs Heart
Throat
Nasal cavity
Mouth
Mouth
PM10-2.5
PM10
PM2.5
Figure 5Where in the body does particle pollution go?
12
Environmental Justice Australia

‘Optimised for profitability, not public health’Dr Ben Ewald, Newcastle GP
‘The pollution from these power stations travels across the Hunter Valley, but it also travels as far as Sydney,’ says Newcastle GP and public health academic Dr Ben Ewald. ‘Even though those power stations are 80 or 100 or 160 kilometres away from Sydney, the pollution travels long distances and does affect people in all the populated areas of the state.’
Dr Ewald says some of the monitoring stations in the Hunter Valley have recorded annual averages for fine particles that are higher than the national standard. ‘Beresfield, near Newcastle, has quite often been over the eight micrograms per cubic metre limit. Muswellbrook, in the Upper Hunter, has been over eight micrograms per cubic metre ever since monitoring commenced.
‘The people up in Muswellbrook have a problem with SO2 pollution. It doesn’t go past the Australian standard, but the Australian standard is very out of date. It’s ten times higher than what the World Health Organisation thinks should be the standard. If you use the WHO standard, Muswellbrook has already had 20 or 30 exceedances of that daily standard this year.
‘Some of the health statistics show high rates of asthma (in Muswellbrook). I think the sulfur dioxide would be contributing towards that.
‘I think there’s a very strong argument that people in the town of Muswellbrook – which hosts large coal mines and coal-fired electricity production industries – those people should be protected, especially children in those communities – they’re not making money out of burning coal – they should be protected from these air pollution exposures that we know are bad for their health.
‘The way these coal-fired power stations and mines are managed is not optimised to look after public health. They are optimised for profitability. If these companies running these facilities had an incentive to run them more cleanly, they could do so.’
Dr Ewald says NSW’s load-based licencing system – which charges fees in proportion to the amount of pollution produced – could be an effective polluter-pays scheme, but the fees are set so low the companies find it cheaper to pay the fee than to clean up their act.
‘If those fees were brought up to a higher level, where it gave companies a real finance incentive to clean up production, I’m sure there’s a lot they could do.
‘I’ve heard one of the power station engineers from Muswellbrook say the first thing they do when the sulfur dioxide at the chimney exceeds the permitted amount is dilute it by blowing a whole lot of air up the chimney. Well of course that doesn’t reduce the amount of pollution, it just adds some air to the mix. The next thing they do is they have a special supply of low sulfur coal that they can throw in the boilers if they have to bring down the pollution level. That obviously begs the question, if you can burn low sulfur coal sometimes, why can’t they burn low sulfur coal all the time? It would be slightly more expensive for them, but I think the health of the community is worth it.’
13
Environmental Justice Australia

4
Toxic emissions from Australian power stations
14
Environmental Justice Australia

This section outlines the pollution profiles of the ten Australian power stations we studied, focusing on PM10, PM2.5, SO2 and NOx. Most of the data was obtained from the National Pollutant Inventory, the only publicly available source of power station emissions data. National Pollutant Inventory data is based on an annual estimate of pollution generated, which is calculated by the power station operators themselves and self-reported.
This section compares emissions in two ways:
1. total annual emissions per power station. This shows the total pollution load the power station is emitting onto the local community and further afield; and
2. emissions per megawatt hour of energy generated. This shows a power station’s emissions intensity, to see which power stations generate the same amount of electricity with more or less pollution.
15
Environmental Justice Australia
Yallourn power station. Photo by Nicola Rivers

Figure 6aTotal emissions of PM10 (kg) of ten Australian power stations in 2015/16
Stanwell 1,085,500
146,800
774,147
3,607,075
2,108,976
43,000
56,000
351,806
552,813
958,873
Gladstone
Loy Yang B
Loy Yang A
Yallourn
Mt Piper
Vales Point
Eraring
Liddell
Bayswater
0 1,000,000 2,000,000 3,000,000 4,000,000
Figure 6bEmission intensity (kg per MWh) for PM10 of ten Australian power stations in 2015/16
Stanwell 0.12
0.02
0.09
0.23
0.18
0.01
0.01
0.02
0.07
0.05
Gladstone
Loy Yang B
Loy Yang A
Yallourn
Mt Piper
Vales Point
Eraring
Liddell
Bayswater
0 0.05 0.1 0.15 0.2 0.25
Note: The red line indicates the average emission intensity of these ten power stations Source: National Pollutant Inventory data 2015/16
4.1 Coarse particle pollution (PM10)Power stations and the coal mines that supply them are massive sources of coarse particle pollution. Loy Yang A in Victoria emits more PM10 than the nine other power stations we examine in this report, reporting 3.6 million kilograms in the 2015–16 National Pollutant Inventory. Comparing emissions from power stations in Victoria to those in other states is complicated by the fact that National Pollutant Inventory reports in Victoria include both the power stations and the mines that supply coal to them – no other state does this. The mechanical processes of coal mining are a major source of coarse particle pollution, so the Victorian power stations may in fact emit less PM10 than Stanwell and other interstate power stations.
Expressing PM10 emissions in terms of emissions per kilograms per megawatt hour of energy generated, Loy Yang A also has the worst (highest) emissions intensity of all ten power stations (0.23kg/MWh compared to the average of 0.08). The Mount Piper and Vales Point power stations in NSW appear to have the lowest emissions and emissions intensity, but their reports are under investigation by the NSW EPA and are unlikely to be accurate. Mount Piper reported an unexplained 83% reduction in PM10 emissions between 2014–15 and 2015–16, Eraring a 59% reduction and Vales Point 15%. The figures under investigation are shaded in red in the graphs.
16
Environmental Justice Australia

4.2 Fine particle pollution (PM2.5)Fine particle (PM2.5) pollution is produced through combustion. In regions where power stations are located, they are a dominant source of PM2.5 emissions. Fine particles can disperse over long distances. Yallourn emits the most PM2.5 of the ten power stations, followed by the other two Latrobe Valley power stations. The three Victorian generators have the highest emissions intensity – that is, they emit the most PM2.5 per MWh. As noted above, these estimates include emissions from their mines, whereas mines report separately in other states, although coal mines don’t tend to emit much PM2.5 so the mines’ contribution might not be significant. Stanwell power station in Central Queensland also has a higher than average PM2.5 emissions intensity.
As with the PM10 reporting discussed above, three of the NSW power stations reported dramatic and unexplained reductions in their PM2.5 emissions in 2015–16. Mt Piper reported that their PM2.5 emissions had dropped from 130,000kg to 10,000kg, a reduction of 92% in just one year. Eraring and Vales Point also reported reductions of 60% and 37% which are not credible without significant investment in emission controls (which was not reported). These reports are under investigation. The figures under investigation are shaded in red in the graphs.
Figure 7bEmission intensity (kg per MWh) for PM2.5 of ten Australian power stations in 2015/16
0.04
0.01
0.06
0.05
0.07
0
0
0.01
0.02
0.01
Figure 7aTotal emissions of PM2.5 (kg) of ten Australian power stations in 2015/16
337,656
49,664
525,883
720,137
834,769
10,000
12,000
175,530
173,334
173,317
Stanwell
Gladstone
Loy Yang B
Loy Yang A
Yallourn
Mt Piper
Vales Point
Eraring
Liddell
Bayswater
0 200,000 400,000 600,000 800,000 1,000,000
0 0.01 0.02 0.03 0.04 0.05 0.06 0.07 0.08
Stanwell
Gladstone
Loy Yang B
Loy Yang A
Yallourn
Mt Piper
Vales Point
Eraring
Liddell
Bayswater
Note: The red line indicates the average emission intensity of these ten power stations Source: National Pollutant Inventory data 2015/16
17
Environmental Justice Australia

Figure 8aTotal emissions of SO2 (kg) of ten Australian power stations in 2015/16
Figure 8bEmission intensity (kg per MWh) for SO2 of ten Australian power stations in 2015/16
33,900,007
22,800,004
23,791,560
61,024,762
21,254,868
23,000,000
16,000,000
28,954,362
30,775,765
63,470,164
Stanwell
Gladstone
Loy Yang B
Loy Yang A
Yallourn
Mt Piper
Vales Point
Eraring
Liddell
Bayswater
0 200,000 400,000 600,000 800,000
3.73
3.30
2.82
3.88
1.83
3.17
2.08
1.98
3.87
3.54
Stanwell
Gladstone
Loy Yang B
Loy Yang A
Yallourn
Mt Piper
Vales Point
Eraring
Liddell
Bayswater
0 0.5 1 1.5 2 2.5 3 3.5 4 4.5
4.3 Sulfur dioxide (SO2)Power stations are the primary source of SO2 nationally, accounting for 47% (491.3 million kilograms) of Australia’s total national SO2 emissions, followed by non-ferrous metal manufacturing (38%). SO2 can disperse over great distances. Emissions from the five NSW power stations account for 87% of Sydney’s SO2 emissions.32
AGL’s coal-fired power stations dominate SO2 emission profiles. Bayswater and Loy Yang power stations rank #1 and #2 in absolute terms. These two and AGL’s Liddell power station are three of the four highest SO2-emitting power stations, along with Stanwell (ranked #3).
Note: The red line indicates the average emission intensity of these ten power stations Source: National Pollutant Inventory data 2015/16
18
Environmental Justice Australia

0 10,000,000 20,000,000 30,000,000 40,000,000 50,000,000
Figure 9aTotal emissions of NOx (kg) of ten Australian power stations in 2015/16
Stanwell
Gladstone
Loy Yang B
Loy Yang A
Yallourn
Mt Piper
Vales Point
Eraring
Liddell
Bayswater
17,608,850
30,001,040
14,844,486
20,524,237
15,216,102
18,000,000
21,000,000
17,832,027
17,493,537
41,596,143
Figure 9bEmission intensity (kg per MWh) for NOx of ten Australian power stations in 2015/16
0 0.5 1 1.5 2 2.5 3 3.5 4 4.5
Stanwell
Gladstone
Loy Yang B
Loy Yang A
Yallourn
Mt Piper
Vales Point
Eraring
Liddell
Bayswater
1.94
4.35
1.76
1.31
1.31
2.48
2.73
1.22
2.20
2.32
4.4 Oxides of nitrogen (NOx)Power stations are the primary source of oxides of nitrogen nationally, accounting for 27% (363.3 million kilograms) of Australia’s total national NOx emissions, followed by motor vehicles (25%). Bayswater emits more NOx than any other power station analysed in this report. Gladstone has the second highest NOx emissions in absolute terms but by far the highest emissions intensity (4.35kg/MWh compared with the average 2.16).
Note: The red line indicates the average emission intensity of these ten power stations Source: National Pollutant Inventory data 2015/16
19
Environmental Justice Australia

Munmorah power station decommissioning. Photo by Nicola Rivers

‘This terrific torrent of pollution’Mike Campbell OAM, community leader, NSW central coast
In the mid-1980s, when the NSW electricity commission wanted to add two new coal-fired power stations on the state’s central coast, Mike Campbell was president of the ratepayers’ association.
‘In the Lake Munmorah area particularly, between the two existing power stations – Munmorah and Vales Point – children were suffering asthma. The people of Munmorah had been screaming about this.’
Mike heard about a study by three professors from Newcastle that identified the area between the two power stations as having critical levels of sulfur dioxide. Mike set about getting his hands on a copy of the professors’ research.
‘Once I had that document I then proceeded to hunt out the doctors of Munmorah. They were kind enough to verify what the community had said – that asthma was twice the national average for children and bronchitis was higher in old people. I asked them to put it on paper, which they did. We presented those two explosive documents to the commission in the middle of their assessment of the two new power station proposals. When this hit the table, from left field, it blew them out of the water. The upshot was they decided to pull back from the proposals.’
Thirty years later Mike remains concerned about the sulfur dioxide, heavy metals and what he describes as ‘this terrific torrent of materials that emanates from these power stations and which the community absorbs’.
He rates the NSW EPA’s performance on protecting the community from air pollution as ‘poor’. ‘We’ve still got only one monitoring station in this region, apart from the power stations’ self-monitoring,’ he says.
Why are politicians reluctant to take up this issue? ‘The coal industry is very powerful,’ Mike says. ‘You’re seeing them fight back now. Even bringing coal into the federal parliament. The coal lobby is massive. The Minerals Council of NSW is a very powerful body. (The companies) give money to the parties.’
21
Environmental Justice Australia

5
How are power stations regulated?
Environmental Justice Australia
22

5.1 National air pollution standardsStrong regulation is critical to reducing the toxic burden placed on the community by power station pollution. Communities, especially communities living in the shadow of power stations, have little control over the air they breathe. They rely on strong regulation to protect their health. The International Energy Agency recently noted that in those countries where air pollution is being controlled strong government regulation is the primary reason.33
In Australia, neither regulation nor enforcement could be characterised as ‘strong’.
Air pollution is regulated by state governments. Although Australia has national air pollution standards for six key pollutants which are known to be harmful to people and the environment, the standards have limited effect.34 States are only required to monitor and report their emissions against the standards – there is no requirement to reduce emissions to remain under the standards, and no consequences when air pollution concentrations exceed the national standards. In NSW, the annual average concentration of fine particle pollution (PM2.5) has exceeded the national standard every year since monitoring began, yet the NSW Government has continued to approve new polluting industries and imposed no additional controls on existing polluters.
States decide themselves whether to regulate emissions to achieve the standards, or whether they regulate to some other limit. Queensland’s approach demonstrates some of these problems. Queensland does adopt the national standards into its regulation. However despite new standards being adopted at the national level in 2003 (which Queensland finally incorporated into its laws in 2008), and despite there being further new national standards adopted in 2015, Queensland has not updated licence conditions of the facilities it regulates and so is still operating on pre-2003 limits.35
There are also no national limits specifically for power station emissions as occurs in other jurisdictions such as the United States and the European Union. Therefore each Australian state and territory regulates power station emissions differently, using different standards and limits.
5.2 State regulation of power stationsOur research has revealed that power stations in Australia are not regulated in way that adequately protects human health or the environment. Some of the key problems with their regulation are discussed in this section.
Power stations are regulated through state environment protection laws to control the toxic emissions they release.36 As significant polluters, power stations require an environment protection licence or permit which sets their emission limits, and conditions that specify how to manage their waste. Pollution controls for power stations can also sometimes be found in other regulation such as state environment protection policies, or special legislation set up specifically for the power station.37 Power stations must not conduct any activity except in accordance with a licence and can be charged with an offence if they exceed pollution limits.
5.2.1 Emission limits
It is very difficult to compare the emission limits across the different power stations in Australia. Emission limits vary for each state and each power station. Victoria uses a system similar to the United States of setting emission limits based on a maximum mass of the pollutant that can be emitted per unit of generated energy. In Victoria these limits have been set at a level that is designed to be an ‘acceptable’ level of pollution concentration at ground level, where the pollutants will be breathed in by nearby communities. NSW and Queensland use a limit similar to the European Union and China, which is a maximum mass of each toxic pollutants per cubic metre of gas emitted from the power station – in other words a maximum emission concentration as it comes out of the stack.
In Victoria, the power stations burn brown coal which is less efficient and in general creates higher emissions per MWh than black coal. Victoria’s power stations are therefore allowed to emit more particle pollution than those in other States. Australia’s power stations also vary in age with older power stations generally being more polluting. For all these reasons, plus others not mentioned here, emission limits in the licences are different for each power station.
In order to conduct a comparison of the limits applied to Australian power stations compared with each other, and to overseas limits, we have conducted some calculations to standardise the Australian power station limits and the international limits. Figure 10 shows the pollution limits for four of the pollutants that are of most concern from power stations for the ten power stations we have analysed, as compared to the power station emissions limits for China, the European Union and the United States. All international limits are for existing power stations at times comparable to when the Australian power stations were built. For example the US limits we have used are for power stations built before 1978. Power stations built after that time (which includes the majority of Australian power stations) would have even stricter limits applied. Notes on how the limits were converted are in Appendix 1.
23
Environmental Justice Australia

Figure 10 Emissions limits for the Australian power stations compared to limits set in the United States, European Union and China
Particles Sulfur dioxide Nitrogen oxides MercuryUnited States 125 mg/m3 1517 mg/m3 875 mg/m3 1.5 μg/m3 (black coal)
14 μg/m3 (brown coal)
European Union 50 mg/m3 (black coal) 100 mg/m3 (brown coal)
400 mg/m3 200 mg/m3 30 μg/m3 (Germany only, no EU standard)
China 30 mg/m3 200 mg/m3 (400 mg/m3 for four provinces with high sulfur coal)
200 mg/m3 30 μg/m3
VictoriaLoy Yang A (2210 MW capacity, brown coal)
258 mg/m3 2370 mg/m3 677 mg/m3 No limit in licence
Yallourn (1480 MW capacity, brown coal)
190 mg/m3 820 mg/m3 407 mg/m3 No limit in licence
Loy Yang B (953MW capacity, brown coal)
149 mg/m3 2692 mg/m3 678 mg/m3 No limit in licence
New South WalesBayswater (2640 MW capacity)
100 mg/m3 1716 mg/m3 1500 mg/m3 1000 μg/m3
Mt Piper (1400 MW capacity)
50 mg/m3 1716 mg/m3 1500 mg/m3 200 μg/m3
Vales Point (1320 MW capacity)
100mg/m3 1716 mg/m3 1500 mg/m3 1000 μg/m3
Eraring (2880 MW capacity)
50 mg/m3 1716 mg/m3 1100 mg/m3 200 μg/m3
Liddell (2000 MW capacity)
100mg/m3 1716 mg/m3 1500 mg/m3 1000 μg/m3
QueenslandStanwell (1460 MW capacity)
230mg/m3 No emissions limit. Sulfur content of fuel burned must not exceed 1.5%
1300mg/m3 No limit in licence
Gladstone (1680 MW capacity)
150 mg/m3 No emissions limit. Sulfur content of coal burnt must not exceed 0.8%
2800mg/m3 No limit in licence
24
Environmental Justice Australia

5.2.2 Are the limits adequate?
Figure 10 shows that in almost all cases the emissions limits applied to Australian power stations are significantly less stringent than the standards in the European Union, United States and China.
The mercury limits are particularly striking. Mercury is deadly, causes significant harm to humans and the environment, and builds up (bio-accumulates) over time resulting in greater damage.38 The US in particular has very strict limits for mercury which has had a huge impact on the operation of US power stations. Some of the NSW mercury limits are 666 times higher than the US limits. This is unacceptable. Even for the less stringent EU and China requirements, these NSW mercury limits are still 33 times their limit – 1000 ug/m3 compared to 30 ug/m3. Even worse, Victoria and Queensland have no mercury limits in their licences39 at all, despite coal-fired power stations being the second biggest source of man-made mercury emissions in Australia.40
All Victorian power stations’ particle limits are less strict than all three international limits. Loy Yang A’s particle limit, for example, is eight times China’s limit. All the NSW power stations’ limits are less stringent than China’s particle limits, and three power stations’ limits are less stringent than the EU limits. Stanwell and Gladstone’s particle limits are also less stringent than all three international limits – Stanwell’s is almost double the 1978 US limit. All Victoria’s SO2 limits are less stringent than the EU and China limits, and two of them are far less strict even the 1978 US limit. The NSW licences did not contain SO2 limits (they used SO3 which we could not compare) so instead we have included the ‘reportable limit’ from the NSW licences which appears to be used by the power stations as a de facto SO2 limit.41 This limit is less strict than all three international limits. The nitrogen oxide licence limits for all three Victorian power stations are stricter than the US (1978) limits, but up to three times the limits set by the EU and China.
There are also key omissions in licences. For example none of the power stations has an emission limit specifically for PM2.5 – the pollutant from power stations that is generally considered the most damaging to human health.42 Fine particle pollution exposure is responsible for 1590 premature deaths each year in Sydney, Melbourne, Brisbane and Perth. Australian governments have identified reducing exposure to fine particle pollution as the highest priority for air pollution control.43 However they only have limits for total particles, which includes larger, less harmful particles. Power stations are not even required to monitor for PM2.5.
44 In the 1970s and 1980s when many of Australia’s power stations were built the dangers of PM2.5 were not well known and so limits on PM2.5 were not included. Since then, however, significant research has been done and all Australian governments are well aware of its deadly effects.45 The International Energy Agency now urges stricter monitoring and regulation of power station’s PM2.5 emissions specifically.46 PM2.5 limits and monitoring of PM2.5 from power stations should be required as a priority on all power stations.
Different states put emissions limits on different pollutants which also creates confusion and difficulty comparing their adequacy. As noted above, the NSW power stations have no limits for SO2 but instead includes a limit for SO3. Queensland uses coal sulfur content levels rather than an emissions limit. Some use nitrogen oxides and some use nitrogen dioxide. The table in figure 10 tries to take account of these differences and develop a credible comparison, but the differences do cause serious problems for analysis.
5.2.3 Problems with the lack of a national approach
As noted above, the lack of a national standard for power station emissions has led to each state regulating its power stations differently and avoided a significant layer of scrutiny that should be applied to power stations. This is unacceptable. The emissions limits set on power stations are critically important for human health – there is a significant difference in health outcomes from adopting higher or lower emission limits. For example, the EU concluded that it could save an extra 5700 lives a year by adopting the lower end of the limit range proposed in its recent review of emissions limits as opposed to the higher end.47 However in Australia there has been no national assessment by governments of whether our power stations have limits imposed on them to properly protect human and environmental health. This has led to inadequate standards and assumptions being adopted in power station regulation. For example in NSW, the standard applied to power station emission limits by the NSW EPA reflect ‘reasonably available technology taking the age of the plant into consideration’48 – clearly not a standard that requires power stations to improve their practices or reduce the toxic burden they are placing on local communities.
Binding national standards are required in Australia. The Australian situation differs greatly to the experience in other countries and jurisdictions where national and regional limits have been set, including wide-ranging discussion and public scrutiny of what limits should be. For example, the newly adopted European Union limits incorporate an assessment of what emissions are possible based on ‘Best Available Techniques’ – that is, technologies already employed in existing coal-fired power plants in the EU.49 These standards will drive power stations to impose new pollution reduction technologies that will significantly reduce toxic pollution. Stronger standards imposed in the United States have proved their effectiveness by major reductions in pollution from power stations as some of the dirtiest power stations have been required to install pollution reduction technologies or close.50
25
Environmental Justice Australia
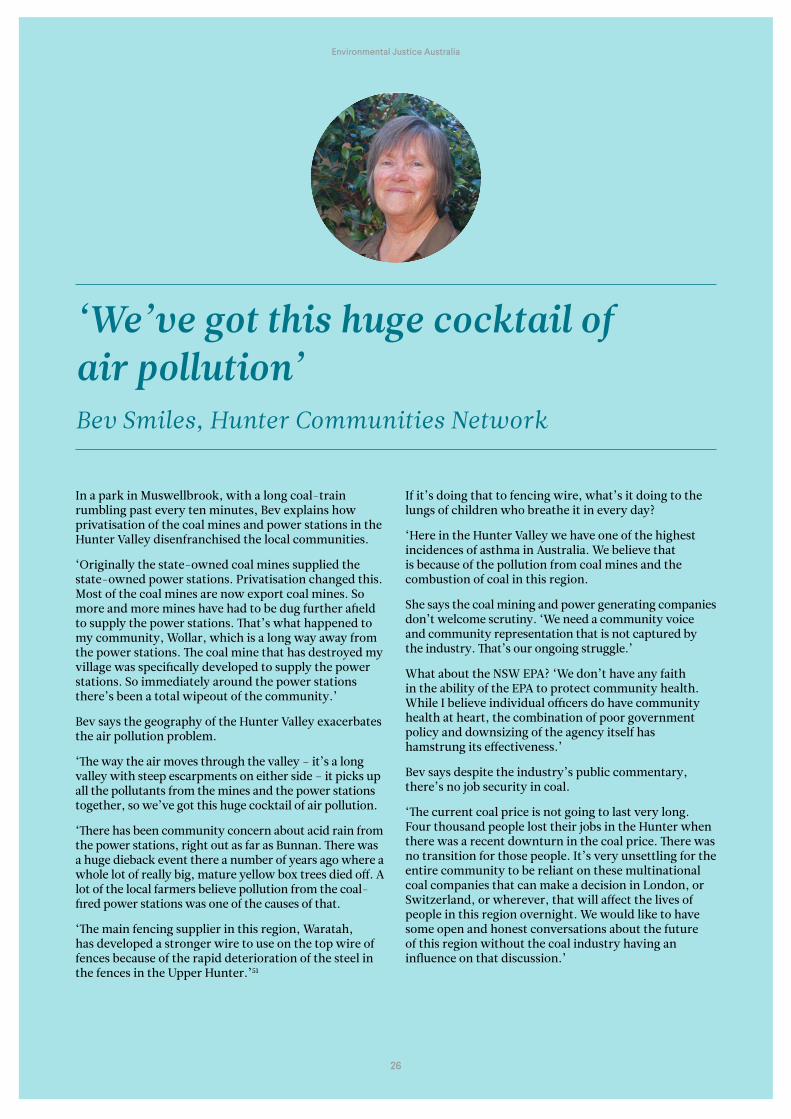
‘We’ve got this huge cocktail of air pollution’Bev Smiles, Hunter Communities Network
In a park in Muswellbrook, with a long coal-train rumbling past every ten minutes, Bev explains how privatisation of the coal mines and power stations in the Hunter Valley disenfranchised the local communities.
‘Originally the state-owned coal mines supplied the state-owned power stations. Privatisation changed this. Most of the coal mines are now export coal mines. So more and more mines have had to be dug further afield to supply the power stations. That’s what happened to my community, Wollar, which is a long way away from the power stations. The coal mine that has destroyed my village was specifically developed to supply the power stations. So immediately around the power stations there’s been a total wipeout of the community.’
Bev says the geography of the Hunter Valley exacerbates the air pollution problem.
‘The way the air moves through the valley – it’s a long valley with steep escarpments on either side – it picks up all the pollutants from the mines and the power stations together, so we’ve got this huge cocktail of air pollution.
‘There has been community concern about acid rain from the power stations, right out as far as Bunnan. There was a huge dieback event there a number of years ago where a whole lot of really big, mature yellow box trees died off. A lot of the local farmers believe pollution from the coal-fired power stations was one of the causes of that.
‘The main fencing supplier in this region, Waratah, has developed a stronger wire to use on the top wire of fences because of the rapid deterioration of the steel in the fences in the Upper Hunter.’51
If it’s doing that to fencing wire, what’s it doing to the lungs of children who breathe it in every day?
‘Here in the Hunter Valley we have one of the highest incidences of asthma in Australia. We believe that is because of the pollution from coal mines and the combustion of coal in this region.
She says the coal mining and power generating companies don’t welcome scrutiny. ‘We need a community voice and community representation that is not captured by the industry. That’s our ongoing struggle.’
What about the NSW EPA? ‘We don’t have any faith in the ability of the EPA to protect community health. While I believe individual officers do have community health at heart, the combination of poor government policy and downsizing of the agency itself has hamstrung its effectiveness.’
Bev says despite the industry’s public commentary, there’s no job security in coal.
‘The current coal price is not going to last very long. Four thousand people lost their jobs in the Hunter when there was a recent downturn in the coal price. There was no transition for those people. It’s very unsettling for the entire community to be reliant on these multinational coal companies that can make a decision in London, or Switzerland, or wherever, that will affect the lives of people in this region overnight. We would like to have some open and honest conversations about the future of this region without the coal industry having an influence on that discussion.’
26
Environmental Justice Australia
5.3 Is air pollution monitoring and reporting adequate?
5.3.1 Power station emissions monitoring
Community members who live and work close to coal-fired power stations have a right to know what they are breathing. However, this is often difficult, if not impossible, under current regulation.
In general, power station operators are required to monitor their own emissions as a condition of their licence. But there is very little independent government monitoring of power stations. Government monitoring tends to be of general air pollution levels away from any particular pollution source. For example, on the central coast near the Eraring and Vales Point power stations, the NSW Office of Environment and Heritage operate just one monitoring station at the Wyong racecourse, more than 25km from the power stations.
Industry monitoring under power station licence conditions is woefully inadequate, with some power stations only required to record some of their emissions once or twice a year. Figure 11 below shows how often power stations are required to test for emissions.
A significant omission is the lack of requirement on power stations to monitor PM2.5 emissions specifically, as opposed to all particles which includes the larger, less harmful particles. As noted above, the International Energy Agency urges monitoring and control of PM2.5 from power stations.52 The NSW EPA states that PM2.5 is instead monitored at their own ambient monitoring stations away from power stations.53 However this cannot be seen as a substitute for emissions monitoring at power stations, as pollution at those locations may be from a range of sources and cannot be attributed solely to the power station, therefore it is unknown how much PM2.5 they are producing. Further if the national PM2.5 standard at those sites is exceeded, there are no repercussions for power stations as the national standards are not binding on them.
Most power stations are not required to provide their monitoring data to the regulator as part of their licence requirements, they are merely required to do limited monitoring and be able to show the regulator they are complying if they are asked. There is therefore no continual or even semi-regular assurance that emissions are not exceeding licence requirements. While conducting research for this report, a former engineer at Bayswater power station came forward to inform us
that the practice at Bayswater power station up until at least 2010 was to put lower sulfur content coal into the one unit that had air pollution monitoring, in order to avoid triggering pollution reporting requirements to the regulator.54 Bayswater’s new owner AGL states that the practice does not currently occur.55
These kinds of practices, combined with apparent inaccuracies in power stations’ National Pollutant Inventory emissions reporting (discussed below), and the monitoring and reporting issues we discovered when reviewing the compliance information for the power stations (also discussed below), give little assurance that monitoring and reporting for the purposes of licence compliance is accurate.
5.3.2 Public reporting of emissions data
There is no real-time public reporting of emissions from power stations in Australia. In the communities closest to Victoria’s three coal-fired power stations, residents seeking access to air pollution monitoring data must apply to the industry group that conducts the monitoring – the Latrobe Valley Monitoring Network56 – to obtain the data, which in our experience can take months, and a lot of persistence. The Latrobe Valley Monitoring Network is not required by law to provide the data to the community. In NSW power station operators are required by law to provide the data to any person on request within two weeks.57 However this is still inadequate. Power station operators publish monitoring data on their website, but often weeks afterwards and not in a format that can be analysed to identify long term trends and not necessarily for all pollutants they monitor.
Power stations are the biggest source of PM2.5, SO2 and NOx pollution in Australia. They should be required by law to publish their emissions in real time. A neighbouring community member in poor health is entitled to know whether they are at risk from high pollution on any given day. Lack of real-time monitoring and reporting of power station pollution means that there is no way for the community to tell what a power station is actually emitting, whether it’s complying with its licence, or whether it is emitting excessively high levels of pollutants on a particular day which could lead to respiratory and other health problems. It also means that the operators of the electricity grid don’t have access to data, don’t know which power stations are most (or least) emission intensive and can’t manage supply to minimise toxic emissions.
27
Environmental Justice Australia

Figure 11 Frequency of stack monitoring at power stations required by state government regulators
SO2 and NOx Particles Mercury & other toxics
Bayswater SO2 and NOx – continuous on one stack; once a year on the other 3 stacks
Total particles – once a yearPM2.5 – noneUndifferentiated particulates – continuous
Mercury – once a year
Liddell SO2 and NOx – continuous Total particles – once a yearPM2.5 – noneUndifferentiated particulates – continuous
Mercury – noneOther toxics – once a year
Mt Piper SO2 and NOx – 4 times a year Total particles – once a yearPM2.5 – none
Mercury – once a year
Vales Point SO2 and NOx – continuous Total particles – once a yearPM2.5 – noneUndifferentiated particulates – continuous
Mercury – once a year
Eraring SO2 and NOx – continuous Total particles – once a yearPM2.5 – noneUndifferentiated particulates – continuous
Mercury – once a year
Loy Yang A Unknown – licence does not specify particular monitoring requirements
Unknown – licence does not specify particular monitoring requirements
Unknown – licence does not specify particular monitoring requirements
Loy Yang B Licence does not specify particular monitoring requirementsNOx – frequency unknown but not continuousEJA advised by Engie that stack emissions are monitored on a continuous basis for sulfur dioxide58
Licence does not specify particular monitoring requirementsPM2.5 – unknownEJA advised by Engie that stack emissions are monitored on a continuous basis for particulates59
Licence does not specify particular monitoring requirementsMercury – frequency unknown but not continuous
Yallourn Licence does not specify particular monitoring requirementsYallourn does not appear to have any continuous emissions monitoring
Licence does not specify particular monitoring requirementsYallourn does not appear to have any continuous emissions monitoring
Licence does not specify particular monitoring requirementsYallourn does not appear to have any continuous emissions monitoring
Gladstone Unknown. Licence does not specify particular monitoring requirements
Unknown. Licence does not specify particular monitoring requirements
Unknown. Licence does not specify particular monitoring requirements
Stanwell NOx – continuous SO2 – unknown. Licence does not specify any requirements
Particles – continuous Unknown. Licence does not specify particular monitoring requirements
Note: The monitoring requirements highlighted in red are considered inadequate Source: environment protection licences for each power station.
28
Environmental Justice Australia

5.3.3 National Pollutant Inventory Reporting
All power stations are also required to self-report an estimate of their air pollution emissions annually to the National Pollutant Inventory. This is in recognition of the community’s right to know what toxic pollutants are being emitted into their air, water and land.
There are significant problems with the National Pollutant Inventory however. This annual data is based on an estimate of emissions rather than recorded emissions. Industry wrote the handbooks on how emissions should be calculated and each power station calculates its own emissions data and reports it to governments. In our experience these annual reports are rarely checked and verified by government. EPA Victoria conducted an audit of the Victorian power station emissions reporting to the National Pollutant Inventory in 2016 which picked up a number of errors, however the EPA has not released the detail of what the errors were or what power stations should do to fix them.60 We have repeatedly asked the EPA to provide us with the audit report but it has not been provided. Most recently we have been informed that we would need to lodge a Freedom of Information request to see the results of the audit as it contains ‘potentially commercially sensitive information’.61
Our investigations over a number of years into National Pollutant Inventory data show reports which appear to be wildly in error,62 however state governments rarely require power stations to fix their data. There is also a major lag between when emissions occurred and when they are reported, with reports released up to 18 months after the emissions occurred.
Our recent investigation found enormous discrepancies in the emissions reported by power stations in NSW from one year to the next. In the case of the Mount Piper power station, operators reported that PM2.5 emissions had dropped by 92% between the 2014–15 to 2015–16 reporting years, while energy output had increased by 16%. In the same year, Eraring and Vales Point claimed to have reduced their PM2.5 emissions by 60% and 37% respectively, while generating more electricity. Figure 12 shows the PM2.5 emissions that NSW power stations reported to the National Pollutant Inventory over the last eight years. Reported pollution for all power stations drops significantly over time, with the 2015–16 year showing results that are difficult to reconcile with previous years.
None of these companies reported installing new pollution reduction technologies that could explain this drop. In fact, the power stations had reported installing pollution control technologies many years ago and nothing significant more recently. We reported these anomalies to the environmental regulators in NSW, Victoria and Queensland, prompting investigation into the power stations in all three states. We are waiting on the results of those investigations.
2008-09 2009-10 2010-11 2011-12 2012-13 2013-14 2014-15 2015-16
200,000
0
400,000
600,000
800,000
1,000,000
Figure 12PM2.5 emissions to air from electricity generation (kg)
Source: National Pollution Inventory reports 2008-09 to 2015-16
Eraring
Bayswater
Liddell
Mount Piper
Vales Point
29
Environmental Justice Australia

Hazelwood power station one week before closure in March 2017. Photo by Nicola Rivers

‘There was absolutely no communication about air pollution’Graeme Wilson, Latrobe Valley resident
Graeme Wilson lives at Delburn, about 15km south of the recently closed Hazelwood coal-fired power station in the Latrobe Valley. He has seen an improvement in his family’s health since Hazelwood closed in April.
‘Up until this year, myself, my wife and the kids, before they left home, used to get respiratory problems and runny noses on a regular basis. Occasionally when there was a north wind, you’d wake up with a sore throat.
‘I have personally noticed an improvement in my health since the closure of Hazelwood. My sinuses have improved, I have had no respiratory problems or runny noses at all this season. I have felt much healthier.
‘We are located on the first ridge that surrounds the valley. Most of the time we enjoy clean air, with winds usually blowing from the south-east, or north-west.
‘On occasions when there is a north wind, it is usually hot, the power stations are at full power and we often used to get soot fallout, smoke haze from the valley. This was evidenced by the build up of black, sooty muck in our roof gutters. This seems to have all but disappeared since Hazelwood closed down.’
The fall-out reached extreme levels when the Hazelwood mine caught fire and burned for 45 days straight in 2014.
‘On the days when the wind was blowing from the north, the smoke and ash was blown towards our area. It did not really dissipate and disappear as the EPA would like people to believe. Our house and cars were covered in ash and a fine brown sulfur dust.
‘The brown dust was clearly in the air inside our house and we had no option but to breathe it. Every horizontal surface in the house was covered in dust.
‘I reported this to the authorities who had set up the Government Health Services in Morwell, but there was never any follow up. I tried reporting it to the EPA. They also did no follow up.
‘There was absolutely no communication about air pollution. The EPA didn’t monitor out our way. They wanted to pretend it was just around Morwell.
‘We’re on tank water. Our roof was covered in ash. The surface of the water was covered in an oily film. Whether it’s toxic or not, I don’t know. We did manage to get the Health Officer from the Baw Baw Shire to test our water but she only tested two samples taken from kitchen taps. This water is pumped from the bottom of the tank. What was on the surface?
‘I often wonder what chemicals were deposited on surrounding potato crops and whether the ash contained carcinogens from the mine fire that may have entered the food chain. I have been told anecdotally that local soils are more alkaline than they were before the mine fire.’
31
Environmental Justice Australia

5.4 Health costs borne by the community not the polluterAs discussed above, there are significant health impacts on the community from the toxic pollution that coal-fired power stations emit. This has a direct impact on the quality of people’s lives, and puts an enormous health cost burden on all Australians as through our taxes we pay for the health care required to assist those people.
The Australia-wide cost is estimated at $2.6 billion just for SO2, NOx and particulate pollution from power stations alone, with a health damage cost of around $13.20/MWh.63 These costs are not factored into wholesale electricity prices or licence fees, and are therefore borne by the community rather than affecting the profits of the power station owners. In NSW, load-based licencing fees are imposed on power stations – power stations are required to pay a fee based on how much they pollute. However Doctors for the Environment Australia have calculated that to properly reflect the health costs caused by power stations, load-based licencing fees would have to be nearly 50 times their current levels.64
5.5 What does this all mean?Regulators appear to be stuck in the 1980s. Liddell, now Australia’s oldest power station, was built in 1973. It was followed closely by Yallourn in 1974. Most of Australia’s other operating power stations were built in the 1980s. For the most part, regulators have not required the power stations to reduce emissions since the 1970s and 1980s, despite much greater knowledge of the deadly impacts of coal-fired power station pollution on the community and pollution controls such as wet scrubbers or catalytic reduction becoming readily available. There is no requirement for continuous improvement in emission reduction, no new post-combustion emission reduction technologies have been required by the regulators for decades, and power stations are allowed to continue business as usual. For power stations that are approaching or beyond the technical end of their life such as Yallourn, toxic emissions can actually increase as the old pollution reduction technologies applied to them begin to fail, and more regular start up and shut downs of the power station are required to maintain the plant which emit excessive levels of pollution. As a result, communities are exposed to excessive and preventable levels of toxic pollutants.
This has to change. Power stations must be regulated much more strictly, with stricter emissions standards applied which in turn leads to the need for pollution reduction technologies to be installed and operating practices improved.
32
Environmental Justice Australia

6
Controlling toxic emissions from coal-fired power stations
33
Environmental Justice Australia

6.1 Pollution reduction technologiesAs discussed above, power stations are required to keep their emissions below the limits set out in their licences and other applicable regulations. There are various ways that toxic emissions from power stations can be reduced and controlled. These are referred to as pre-combustion, in-combustion and post-combustion controls. Examples are using coal with a lower sulfur content, crushing coal pre-combustion, changing combustion temperatures and injecting sorbents into the flame.65 In this report we focus on the post-combustion control technologies used by power stations, as these have a very significant impact on emissions, and their lack of use in Australia is surprising.
There are pollution reduction technologies that have been available for many years and are frequently used overseas that would significantly reduce power station emissions yet are currently not being used in Australia. The key ones are:
• wet scrubbers, or flue gas desulfurisation which can remove up to 99% of sulfur pollution;66
• selective catalytic reduction methods which can be added to power stations to reduce significant amounts of oxides of nitrogen from emissions;67 and
• bag/fabric filters which capture ash and fine particles.68
All Australian power stations report the pollution controls they have installed to the National Pollutant Inventory each year. Our review of these statements reveals a surprising lack of post-combustion pollution reduction technologies being used. We therefore wrote to each power station operator asking whether
other pollution controls had been installed and if not, why not. We received responses from AGL (only regarding Bayswater and Liddell), Origin (Eraring), EnergyAustralia (Yallourn and Mount Piper) and Engie (Loy Yang B). The other four operators did not respond.69 Most gave partial answers on what pollution controls they employed. Not one of the power station operators explained or justified why they hadn’t installed other pollution controls. All power station operators referred to pollution monitoring as one of their pollution reduction methods, which it clearly isn’t.
Figure 13 shows what post-combustion pollution reduction technologies are currently used by the ten power stations. None of the ten power stations have wet scrubbers to reduce SOx, none has selective catalytic reduction to reduce NOx, and none of the Victorian power stations has fabric filters to more effectively reduce particle pollution. All power stations are emitting significantly more pollution than they would if they had these technologies installed. The Victorian power stations use electrostatic precipitators rather than fabric filters to reduce their particle pollution, which are an older and less effective technology. Loy Yang B reported to the NPI that it has had wet scrubbers installed for many years however their SO2 emissions indicate otherwise – we have sought confirmation from them but have not received a response.
The fault lies with government. The lack of adequate emissions standards applied to the power stations by their regulators allows them to continue polluting excessively (as discussed in Part 5.2.2) and unnecessarily harming people’s health. Emissions limits applied to the power stations in their licences must be reduced to force the power stations to install better pollution reduction technologies.
34
Environmental Justice Australia
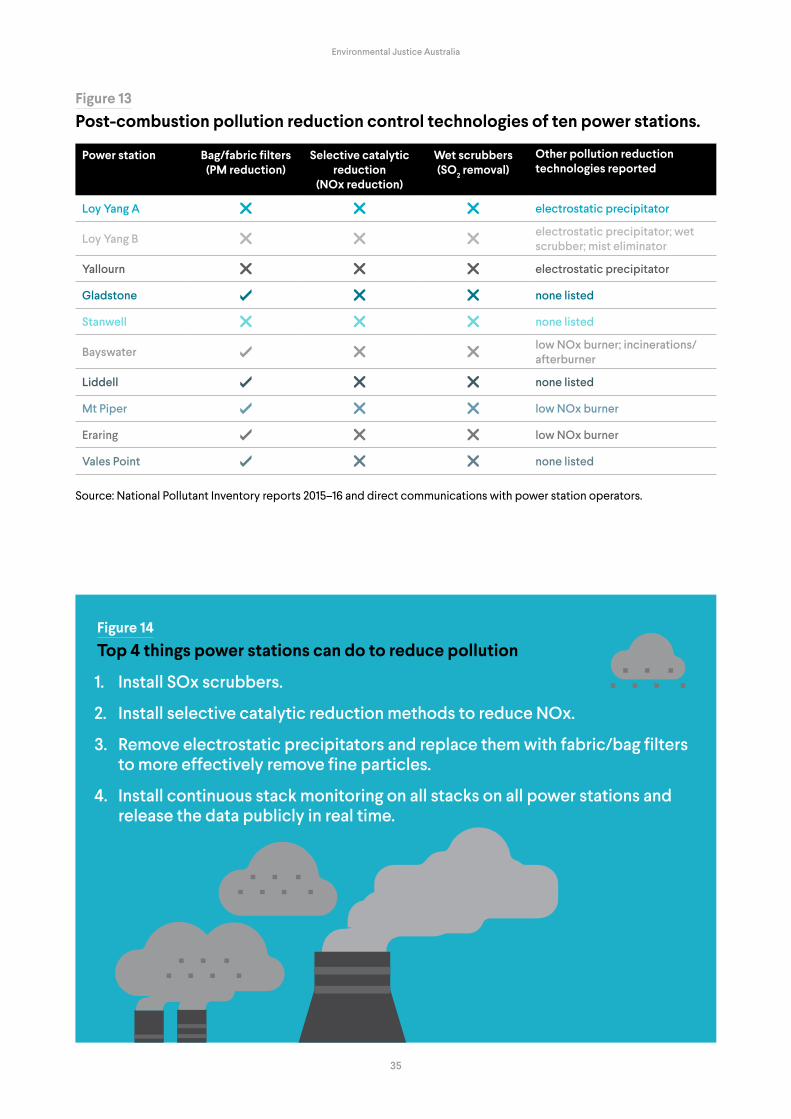
Figure 13Post-combustion pollution reduction control technologies of ten power stations.
Power station Bag/fabric filters (PM reduction)
Selective catalytic reduction
(NOx reduction)
Wet scrubbers (SO2 removal)
Other pollution reduction technologies reported
Loy Yang A electrostatic precipitator
Loy Yang B electrostatic precipitator; wet scrubber; mist eliminator
Yallourn electrostatic precipitator
Gladstone none listed
Stanwell none listed
Bayswater low NOx burner; incinerations/afterburner
Liddell none listed
Mt Piper low NOx burner
Eraring low NOx burner
Vales Point none listed
Source: National Pollutant Inventory reports 2015–16 and direct communications with power station operators.
Figure 14Top 4 things power stations can do to reduce pollution
1. Install SOx scrubbers.
2. Install selective catalytic reduction methods to reduce NOx.
3. Remove electrostatic precipitators and replace them with fabric/bag filters to more effectively remove fine particles.
4. Install continuous stack monitoring on all stacks on all power stations and release the data publicly in real time.
35
Environmental Justice Australia

6.2 Do new power stations reduce toxic emissions?The overwhelming majority of Australia’s coal-fired power station fleet are very old subcritical generators, and we have no power stations that use ‘ultra-supercritical’ technology.70 There are claims that new power stations with updated technology – so-called ‘ultra-supercritical’ or ‘high efficiency low emission’ (HELE) power stations will produce slightly less greenhouse gas emissions than their aging counterparts and therefore are a suitable replacement for energy generation over the next 30 years. Although ultra-supercritical power stations can reduce greenhouse emissions slightly, the reductions are nowhere near enough to achieve Australia’s emission reduction targets and so are not a solution to global warming.71 In addition, ultra-supercritical power stations do not fix the problem of toxic emissions.
Regardless of whether a power station is subcritical, supercritical or ultra-supercritical, if other pollution controls are not installed then toxic emissions hardly diminish.72 The best improvement ultra-supercritical technology can offer over subcritical is about a 14%
reduction in pollution emissions.73 While this is a slight advance, it is hardly an answer to our toxic legacy from coal pollution – it still leaves millions of kilograms of pollution being released into the atmosphere, with all the resulting health impacts. Compared with renewable energy sources, which release no toxic pollution, it is an inferior choice.
As an example, figure 15 below shows the SO2 emissions of a subcritical or supercritical coal-fired power station (as we have in Australia) versus the emissions from an ultra-supercritical power station. As is clearly seen there is no great leap in pollution reduction between subcritical and ultra-supercritical coal-fired power stations. The graph shows the SO2 reductions that could be achieved with our existing aging subcritical power stations merely by tightening their regulation requiring SO2 scrubbers to be installed. There would be barely any decrease in toxic emission reduction between ultra-supercritical and subcritical power stations if pollution reduction technology were installed. It is clear which option would have the most effect on reducing toxic pollution – we need to fix the power stations we have rather than build new ones that will continue to burn coal for another 40 years.
Figure 15SO2 emissions from a 1,000 MW coal-fired power plant
Subcritical, no SO2
controls
Supercritical, no SO2
controls
Ultra-supercritical, no SO2
controls
Subcritical, strong SO2 regulation
Supercritical, strong SO2 regulation
Ultra-supercritical, strong SO2 regulation
4500
0
500
1000
1500
2000
2500
3000
3500
4000
Source: Myllyvirta, L 2017, How much do ultra-critical coal plants really reduce air pollution? RenewEconomy, New South Wales
36
Environmental Justice Australia

7
Do power stations comply with the law?
37
Environmental Justice Australia

7.1 Finding out about power station licence breachesIt is almost impossible for the public to know whether power stations are complying with their pollution licences and pollution laws. There is no central, publicly available record where the community can go to find out how many complaints have been made against power stations, whether they have had licence breaches, what investigations the regulator is undertaking, what enforcement actions the regulator has taken, and what prosecutions have occurred. The NSW and Victorian EPAs gather some of this information in a central place,74 however it is still only partial, with key documents and details not available. This does not satisfy reasonable expectations for the community’s right to know and is entirely ineffective as an arrangement to minimise toxic emissions.
Power station operators in each state are required to submit an annual compliance statement to their regulator which details licence breaches that they have committed each year. These are not publicly available in any state, however. EPA Victoria will release them on request, but NSW and Queensland require a Freedom of Information request and charge a fee. These documents are industry self-reporting documents and it is not possible to verify whether all breaches are being reported, although our view, based on a comparison of different sources, is that they are not. Queensland offers the least information on compliance and enforcement, with Queensland power stations’ annual compliance reports giving little to no information on breaches that have occurred and no publicly available information on what compliance action the regulator may have taken against power stations.75
Consequently, a member of the public must go to several different sources to gather information on prosecutions, fines, breaches and pollution abatement notices, and would have to do a time-consuming (and sometimes costly) Freedom of Information request for other documents, such as community complaints and EPA investigations of breaches. Freedom of Information requests can be blocked by the power station, citing ‘commercial in confidence’ concerns, which can result in the information not being released at all.
As a result very few community members try in the first place – possibly the intended result.
For this report we conducted searches of all publicly available information, combined with requests to the regulators for information held by them, along with Freedom of Information requests in some circumstances.
7.2 Breaches of toxic pollution licence conditionsThe power stations we investigated had varying levels of compliance with their licence conditions. The Queensland power stations stood out because it was extremely rare for them to self-report licence breaches. Two power stations76 reported not a single breach in the five years of data we gathered and the remainder reported very few. This contrasted starkly with power
stations in the other states which all reported breaches and makes the Queensland situation less believable.
The power station with the most reported licence breaches by far is the now closed Hazelwood power station, which reflects the difficulties involved in keeping an aging and failing power station operating. These breaches ranged from a major pollution event – the Hazelwood mine fire – to numerous medium-level issues such as pipes bursting spilling toxic ash water,77 electrical and coal fires,78 and illegal discharges or spills into the Morwell River.79 Hazelwood reported breaching air pollution limits in four of the five years we investigated.80 Our research shows Hazelwood committed at least 48 licence breaches in the five years from 2011 to 2016. It is unclear what enforcement action, if any, EPA Victoria took against these breaches. No prosecutions occurred during those five years and only four pollution abatement notices were issued, all in 2016, but with no detail as to what they were issued for.81 The EPA took more than two years to bring charges against Hazelwood’s owners for the 2014 mine fire. That case is due to be heard later this year.
Yallourn power station in Victoria – Australia’s second-oldest running power station – has had some significant breaches that indicate it too is becoming increasingly difficult to operate. For example:
• in 2015 an ash pipeline ruptured, spilling 8.6 million litres of ash slurry into the Morwell and Latrobe Rivers.82 Despite EPA Victoria finding its owner Energy Australia was responsible for ‘a number of failures’ and could have prevented the spill had it taken proper action, the EPA fined the company just $7584;83
• an audit conducted in 2015 for EPA Victoria found groundwater had been contaminated by leachate from Yallourn’s ash landfill, in contravention of its licence, and may have been discharging into the Latrobe River.84 We could not find any evidence that the EPA took enforcement against Energy Australia for this breach;
• in January 2017 we discovered that EPA Victoria had for some time been investigating a number of serious breaches at Yallourn power station. This included significant and ongoing problems with its air pollution monitoring, which was likely to result in significant inaccuracies in its emission reporting. Unbelievably, a Yallourn representative admitted to the EPA that at times of excessive pollution it ‘simplified’ its reporting by stating it was emitting at levels that correspond with its licence limits.85 EPA Victoria has since issued Yallourn with three pollution abatement notices for these licence breaches, for its air pollution reporting failures and for discharging saline water into the Morwell River. We understand its investigations are ongoing.86 Yallourn has not been fined; and
• we have also been informed by numerous local residents that over the past few months they have made complaints to EPA Victoria about Yallourn emitting excessive amount of coal ash, to the point where washing hanging in their backyards is covered in ash. This nuisance emission of coal ash is a breach of Yallourn’s licence, however as far as we are aware no action has been taken by the EPA.
38
Environmental Justice Australia

7.3 Are regulators doing their job?According to our research, no power station in Victoria, NSW or Queensland has been prosecuted for any offence in the past ten years.87 Penalties for non-compliance are occasionally issued by the regulator, however they are more likely to issue warnings or notices requiring the pollution to be fixed than financial penalties. From our research of the available data our conclusion is that regulators appear very reluctant to fine companies for non-compliance: fines are usually only issued when there is an outcry from the community or it is a very serious pollution event that can’t be ignored. When fines are issued the penalty is very low in light of the pollution caused.
We can use one power station as an example of whether sufficient enforcement is taking place. Eraring power station at Lake Macquarie in NSW is Australia’s largest power station. The power station and its massive ash dam are located in a residential area. It is owned by Origin Energy and is 35 years old. Our examination of Origin Energy’s annual compliance reports for the past ten years (since 2006), NSW EPA audits and news reports indicate that Eraring has breached its licence conditions at least 23 times. Breaches included an explosion at the power station that caused 8,000 litres of oil to explode and leak into Lake Macquarie,88 the unlawful discharge of hundreds of litres of ferrous chloride,89 and a number of instances of its ash dams not being managed properly.90 In 2016 a significant pollution event occurred, when toxic ash from the ash dam blew away in strong winds and covered nearby neighbourhoods with ash. During that ten-year period the EPA issued only one penalty infringement notice – for the ash pollution incident. The EPA had prior knowledge of the problems with Eraring’s management of the ash dam, noting that Eraring had not complied with a previous recommendation to improve its practices, but did not issue a penalty notice or remediation notice that may have helped prevent the pollution event.91 Eraring was fined $15,000 for the incident. At the time local residents and the NSW peak conservation organisation criticised the small penalty as being completely inadequate.92
Vales Point in NSW also gives an insight into issues with compliance and enforcement. In the four years from 2009 to 2013 its owner Delta Electricity (then a NSW State Government corporation) reported nine breaches
of licence conditions in its annual compliance statement to the NSW EPA.93 However, in the four years from 2013 to the present, Vales Point did not report a single licence breach.94 It was sold to private investor Sunset International Power in 2015, which continued to operate it as Delta Electricity. Delta’s monthly pollution reports from January 2013 to January 2017 state there has not been a single exceedance of its 164 emissions monitoring requirements in that time.95 From our research, the likelihood that an aging power station such as Vales Point has not breached a single licence condition in four years is low. This is supported by the fact that an EPA audit of just the power station’s coal ash ponds, completed in October 2015, found eight instances of non-compliance (none of which were reported by Delta Electricity in its annual compliance statements).96 No compliance action was taken against Delta Electricity for any of the breaches found in its audit.
In February 2017, while visiting Vales Point power station we observed coal trucks dumping thousands of tonnes of coal at the power station from the adjacent mine, rather than transporting the coal via an enclosed conveyer.97 Dumping coal in extremely hot, windy conditions created clouds of coal dust which spread to nearby residential areas, in breach of the power station’s licence. We reported the breach to the NSW EPA for investigation. The EPA’s response confirmed that Vales Point is the only NSW power station where coal is transported by truck rather than an enclosed conveyor system. The EPA stated that coal trucks must be covered and watering trucks were controlling dust. However we observed uncovered coal trucks and did not observe water trucks. Delta responded to our complaint, asserting that it is subject to ‘strict environmental licence conditions’ and ‘on this occasion, no dust left the stockpile site, and there was no licence non-compliance’.98 Our observations and photographs show this is not correct, and the incident breached conditions of the Vales Point licence.
We were informed by the NSW EPA that Vales Point was due to begin using a conveyer system by 31 April 2017 and no further action would be taken by the EPA. However on our follow-up visit in June 2017 we saw that the coal dumping was still occurring. Delta Electricity had also put up a metal screen to obscure public view. Delta Electricity has not been fined for this ongoing breach of its licence conditions.
Vales Point power station February 2017 Vales point power station June 2017
39
Environmental Justice Australia

Sulfur dioxide from Yallourn's stack. Photo by Nicola Rivers
40

‘People should know before they purchase in this area’Charmian Eckersley, Eraring resident
The bush blocks in Eraring are large and there are plenty of birds and marsupials in the trees and the understorey. Charmian Eckersley has lived here since 1993. ‘It’s so beautiful, it’s not heavily populated, the lake’s nearby and there are lots of trees. Because of the space and the bush, you are drawn to an area like this.’
Since 1989 Eraring has also been home to Australia’s largest coal-fired power station.
‘In the last four or five years I’ve noticed more fallout of particulate matter on the back veranda,’ Charmian says. ‘Maybe I notice it more now that I’m retired and spend more time at home. I wouldn’t put out clothes without wiping the grime off the clotheshorse first.
Charmian only recently researched the mix of toxic materials that come out of coal-fired power station chimneys. ‘I was blown away when I found out about all the stuff that is coming out of the power station stacks.
‘I consciously shut doors and windows quite a lot, thinking to keep out the particles. My partner has got asthma. Now that I’ve been thinking about it a bit, it’s probably not the best place for him to be living,’ she says.
She’s not aware of the power station operator communicating with the community about air quality. ‘I haven’t heard a thing. I know people from the power station because they give me animals – I do wildlife caring – and if they’ve got something in distress there, they’ll always bring it. The people up there are fine. But communications on air quality? It’s a black hole really.
‘I think people should know before they purchase in this area.
‘I believe there’s a huge role here for the EPA. People should be able to know, for instance, today is a really bad day for air pollution, today you should shut your windows, go somewhere else for the day, it’s not a good day to be outside doing the gardening. Best to be inside.
‘It’s basic, it’s fair, it’s really what our government needs to do for its people is look after their health.’
Environmental Justice Australia
41

8
Decommissioning and rehabilitating power stations
42
Environmental Justice Australia

There has been significant public attention to mine site rehabilitation over the past few years. However there is very little focus on power station decommissioning and rehabilitation. Decommissioning power stations includes cleaning and dismantling equipment, disposing of highly toxic substances and materials, and preparing waste disposal sites for capping and remediation.
Power stations are often built, internally and externally, with materials such as asbestos cladding, which requires careful removal and disposal. Millions of litres of oil must be removed from boilers and other machinery. Equipment has to be washed – the boilers, which are full of ash and other materials, the coal mills, which store pulverised coal for combustion, raw coal bunkers and other equipment.99
Power station sites contain ‘ash ponds’ in which waste ash (also known as fly ash or coal ash) from the combustion process is delivered to a storage facility, usually an open pit in the ground. This ash contains a toxic mixture of heavy metals and other substances that are known to have harmful impacts on health, ground water, land and air. Quite often this ash is mixed with waste saline water, creating a toxic sludge that sits in an exposed pit, simultaneously evaporating into the air and, if not adequately monitored and managed, leaching into the land and water tables.100
Capping of ash ponds during rehabilitation with a glue-like substance to suppress dust is considered standard industry practice, according to the Environment Manager of the Hazelwood Closure Project.101 This type of capping has occurred at the Hazelwood ash ponds,102 where it will remain that way for 12 months before other rehabilitation measures are undertaken.
8.1 Poor management now and later? Land and water contamination from ash pondsThe poor and unregulated management of coal ash dams and ponds during the operating life of power stations gives little hope for rigorous pollution control during the decommissioning and rehabilitation of closed power stations.
Ash pond management at the Yallourn and Mount Piper power stations, both owned by EnergyAustralia, has been found to be inadequate by separate environmental audits.103 As noted above, in February 2015, a rupture in an ash disposal pipeline at Yallourn led to 8.6 megalitres of ash liquid being dumped into the Morwell River (equivalent to about 3.5 Olympic swimming pools’ worth of water). The EPA Victoria investigation found EnergyAustralia was in breach of its license and it was subsequently fined $7584.104 The most recent publicly available environmental audit on the EPA’s website found groundwater had been contaminated by leachate from the Yallourn ash landfill and this leachate impacted groundwater from ash landfill could be contaminating the Latrobe River.105 The Latrobe River is an important water source for the Ramsar-listed Gippsland Lakes. The auditors have also reported that the power station does not comply or only partially complies with both its licence conditions and verified monitoring programs.106
One of the ash ponds at the Loy Yang A site is listed on EPA Victoria’s priority contaminated site register. In regard to sites on the register the EPA states that ‘typically these are sites where pollution of land and/or groundwater presents a potential risk to human health or to the environment. The condition of these sites is not compatible with the current or approved use of the site without active management to reduce the risk to human health and the environment.’107 There are two current remedial notices (clean up notices or pollution abatement notices) listed for the Loy Yang A ash pond. We sought further information from the EPA on the detail of these notices as they are not publicly available and were informed that the notices were from 2001 and so were not readily accessible.108 In short, the Loy Yang A operators have failed to control pollution from the power station’s ash dam for 16 years, causing unacceptable and preventable risks for environmental and human health. This is a significant failure of both EPA Victoria and Loy Yang A’s operator and must be addressed as a priority.
43
Environmental Justice Australia

Port Augusta’s experience with power station remediationIn May 2016 the Northern power station in Port Augusta, South Australia closed. Its owner Alinta Energy stated the closure was due to the costs of maintaining the aging plant and inability to compete with renewable energy.109 In January 2017, temporary dust suppression measures taken at the power stations’ ash pond failed and strong winds carried a thick plume of ash dust to nearby residents at Port Augusta.110 For several days people reported breathing difficulties, coughing, and significant increases in asthma incidents including the hospitalisation of children with asthma. The local community expressed high levels of anger and frustration at the delays in fixing the problem.111 Remediation of the ash dam has begun but is still not completed.112 This highlights the problem that can occur when power stations close without adequate legal requirements in place to ensure sites are properly remediated immediately on closure.
Ash dam at the Northern power station in Port Augusta. Photo by Greenpeace / Ella Colley
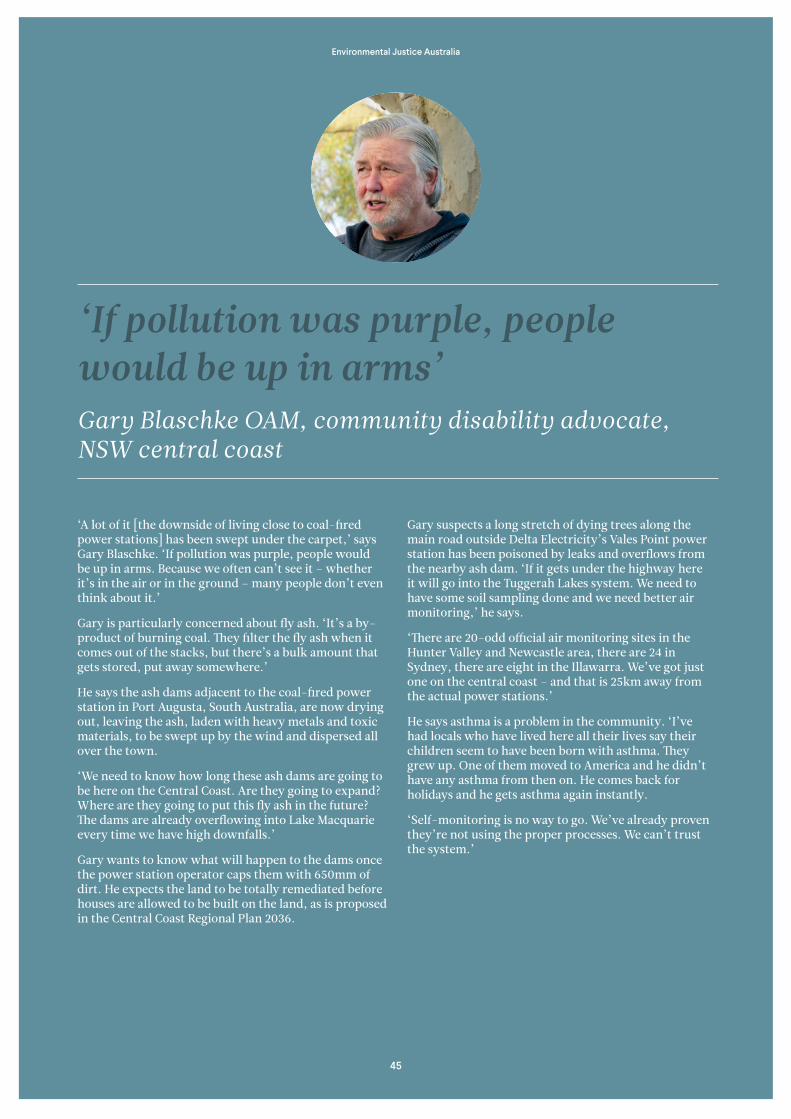
‘If pollution was purple, people would be up in arms’Gary Blaschke OAM, community disability advocate, NSW central coast
‘A lot of it [the downside of living close to coal-fired power stations] has been swept under the carpet,’ says Gary Blaschke. ‘If pollution was purple, people would be up in arms. Because we often can’t see it – whether it’s in the air or in the ground – many people don’t even think about it.’
Gary is particularly concerned about fly ash. ‘It’s a by-product of burning coal. They filter the fly ash when it comes out of the stacks, but there’s a bulk amount that gets stored, put away somewhere.’
He says the ash dams adjacent to the coal-fired power station in Port Augusta, South Australia, are now drying out, leaving the ash, laden with heavy metals and toxic materials, to be swept up by the wind and dispersed all over the town.
‘We need to know how long these ash dams are going to be here on the Central Coast. Are they going to expand? Where are they going to put this fly ash in the future? The dams are already overflowing into Lake Macquarie every time we have high downfalls.’
Gary wants to know what will happen to the dams once the power station operator caps them with 650mm of dirt. He expects the land to be totally remediated before houses are allowed to be built on the land, as is proposed in the Central Coast Regional Plan 2036.
Gary suspects a long stretch of dying trees along the main road outside Delta Electricity’s Vales Point power station has been poisoned by leaks and overflows from the nearby ash dam. ‘If it gets under the highway here it will go into the Tuggerah Lakes system. We need to have some soil sampling done and we need better air monitoring,’ he says.
‘There are 20-odd official air monitoring sites in the Hunter Valley and Newcastle area, there are 24 in Sydney, there are eight in the Illawarra. We’ve got just one on the central coast – and that is 25km away from the actual power stations.’
He says asthma is a problem in the community. ‘I’ve had locals who have lived here all their lives say their children seem to have been born with asthma. They grew up. One of them moved to America and he didn’t have any asthma from then on. He comes back for holidays and he gets asthma again instantly.
‘Self-monitoring is no way to go. We’ve already proven they’re not using the proper processes. We can’t trust the system.’
45
Environmental Justice Australia
8.2 Bonds and financial assurancesRehabilitation bonds and financial assurances are a financial security that operators must pay to the government while a facility is still operating to ensure that the government can cover the costs of rehabilitation after closure if the operator does not do so. Unlike mining legislation that requires a bond for mine rehabilitation,113 there is no legal obligation for power station operators to pay a bond for a power station site.
Instead, the government agency that administers a State’s relevant environmental protection (pollution) laws can – if it chooses to – impose a financial assurance on the pollution licence for the power station. Financial assurances operate in a similar way to a mine bond; they are held in the event that a power station does not or cannot clean up pollution or adequately rehabilitate industrial waste or contaminated land.
Through our investigations we have discovered that there are no financial assurances imposed on any of the currently operating power stations in NSW, Victoria and Queensland.
This is a huge concern. There are high risks of either a company abandoning its liabilities once a power station is closed – potentially by selling the asset, winding up or declaring itself insolvent – or of the costs of decommissioning and rehabilitation being significantly more than any assurance or the assets of the company. Abandoned mines and other toxic sites around Australia are testimony to these risks. Communities living near operating power stations should be informed of the risks associated with ongoing exposure to toxic pollution such as abandoned ash dams, the methods and costs of best practice decommissioning and rehabilitation, and the bonds that companies have been required to commit. The alternative is an unacceptable and unquantifiable risk of ongoing toxic pollution.
EPA Victoria has taken initial steps to require a financial assurance on the pollution licences of Victoria’s power stations. The requirement is limited, and only covers the landfills that the power station operates such as ash ponds and asbestos dumps, rather than the entire decommissioning of the power station. However protracted negotiation over many years between the EPA and the power stations to determine the type and amount of financial assurances means that at time of writing, no financial assurance is actually held by the EPA for any of the Victorian power stations despite it being a licence condition for each of them.114
Engie, the owner of Hazelwood power station and mine, estimated that decommissioning and rehabilitating the power station site would cost at least $304 million, nearly half of the $743 million it estimates is necessary to rehabilitate the entire Hazelwood site – if not more.115 The Victorian Resources Minister has required Engie to increase its mine rehabilitation bond from $15 million to $73.4 million which is grossly inadequate by the company’s own estimates, and is applicable only to the mine site, not the power station.116 There is a process underway to review this figure to take account of Engie’s new assessment of rehabilitation costs, although at the time of writing that review had not been finalised.117
There are several reasons why it is unacceptable that states do not require a separate remediation bond for the decommissioning, demolition, and rehabilitation of power station sites while they are still operating:
• power station sites, and in particular their ash dams and landfill sites, present a significant toxic legacy. If power station sites are abandoned by their former operator, sites will either be left in an unremediated state or the taxpayer faces a significant rehabilitation bill;
• penalties for causing pollution are generally inadequate, so that it is often more economical to breach environmental laws and pay the paltry fine incurred that it is to adequately rehabilitate power station sites;
• the environmental risk posed by the decommissioning and rehabilitation of power station sites is significant regardless of embedded rehabilitation plans – agreed rehabilitation plans are sometimes simply inadequate. National standards for ‘best practice’ decommissioning and rehabilitation need to be adopted and upheld;
• ash ponds and other landfill sites can contaminate land and water tables over extended periods of time making ongoing monitoring of these sites over many decades necessary to ensure environmental and health protection. The companies that have operated power stations can wind up to avoid responsibility for monitoring, leaving the financial obligation on the state government and ultimately the taxpayer.
46
Environmental Justice Australia

Figure 16News headlines of the significant increase in cost estimates for the rehabilitation of the Hazelwood power station and coal mine
47
Environmental Justice Australia

8.2.1 Financial assurances in Victoria
EPA Victoria usually requires operators of landfills to pay a financial assurance which is intended to cover caretaker costs in the event the landfill is abandoned or the result of an uninsured pollution event. The EPA can claim on a financial assurance if it incurs costs for pollution or industrial waste clean-up,118 or to reimburse a third party who conducts a clean-up but who did not cause the problem.119 Loy Yang A, Yallourn, Hazelwood and Anglesea power station sites 120 all include a landfill (for example, an ash pond) where ash waste products, asbestos and general wastes are dumped.121 Their licences include a requirement to maintain a financial assurance.
The calculation of financial assurance for ash ponds is determined in consultation between the power station owner and EPA Victoria.122 We have been told by the EPA that proposals for financial assurances were due to be submitted by 31 May 2017 for both Yallourn and Loy Yang A power stations, to be finalised in December 2017.123 The financial assurance proposal submitted by Engie for the Hazelwood site is currently being assessed by the EPA and is due to be finalised by September 2017. Therefore at the time of Hazelwood’s closure there was no financial assurance.
EPA Victoria has stated that it is holding an ‘adequate’ financial assurance for landfills at the former Alcoa power station site at Anglesea, Victoria.
8.2.2 Financial assurances in Queensland
Under the Environmental Protection Act 1994, the Queensland Department of Environment and Heritage Protection (EHP) can impose a financial assurance on a power station environmental licence to ensure compliance with licence conditions and to cover potential rehabilitation costs that arise as a result of electricity production.124 However EHP will only impose such a condition if it is satisfied this condition is justified in light of the degree of environmental harm, the likelihood the rehabilitation work will be necessary, and the environmental record of the holder of the environmental authority.125
Power stations in Queensland have to apply to EHP to surrender their licence.126 These applications must contain a rehabilitation report if the power station is required to rehabilitate any aspect of its activities. Both environmental authorities for Stanwell and Gladstone contain conditions for ash pond rehabilitation. The Gladstone power station is also subject to the Gladstone Power Station Agreement Act 1993 which contains additional rehabilitation requirements and the preparation of a separate Ash Management Agreement.127
We wrote to EHP to ask if either Stanwell or Gladstone power stations had financial assurances imposed on their licence. EHP confirmed that no financial assurances are imposed. EHP informed us that, ‘The costs associated with post closure management will be borne by the operator, and no liability removed (for example, by surrender) until authorised by the department.’128
Ultimately, however, there are no legal obligations in place that the power stations must hold a financial assurance for rehabilitation for decommissioning and site remediation.
8.2.3 Financial assurances in NSW
Under the Protection of the Environment Operations Act 1997, the NSW EPA can impose a financial assurance on a pollution licence to ensure adequate funds are available for carrying out of works or programs that are required under a licence (for example remediation or pollution reduction programs).129 The EPA can also impose a condition that power stations hold insurance cover for payment of costs incurred in clean-up actions or for compensation of damages resulting from pollution caused in connection with the power station.130 None of the NSW power stations licences contain financial assurances or are required to hold insurance cover on their pollution licences.
We met with NSW Environment Minister Gabrielle Upton on 10 April this year and (when we were unable to secure this information from the Minister) subsequently wrote to the NSW EPA asking it to confirm whether it has required financial assurances of the power stations. At time of writing, we have not received a response.
It appears that the practice in NSW is to require an operator to submit a remediation plan when a power station is decommissioned, to be approved by the NSW EPA, who may impose financial assurances on the subsequent pollution licence for the rehabilitation phase. Ultimately however, the power to impose financial assurances is discretionary and something that the EPA does not impose on pollution licences for power stations.
48
Environmental Justice Australia

‘It will be great when the Latrobe Valley can move on to other things’Irene Proebsting, Latrobe Valley resident
Living on two acres of beautiful bushland on a ridge at the edge of the Latrobe Valley, Irene Proebsting enjoys visits from wallabies, wombats, goannas, cockatoos and eagles. She also gets a bird’s eye view of the smog from the valley’s coal-fired power stations, Yallourn, Loy Yang A and B, and Hazelwood – until it closed in April this year.
‘The air hangs in the valley and sometimes we’re at eye level with the pollution,’ she says. ‘It’s like a toxic yellow haze that just hangs there.’
The natural beauty of the hills makes it a great place to live, but the air quality presents dilemmas for people with respiratory problems.
‘One of my neighbours has got a really bad lung condition and he said when he goes away to Merimbula he feels a lot better. But he said ‘what do you do?’ He doesn’t want to move away. He lives on a beautiful bush block next to me.’
The pollution varies according to wind direction and cloud cover, but when something goes wrong at the power stations or adjoining coal mines – like when the Hazelwood mine caught fire in February 2014 and burned for 45 days – it’s bad.
‘That was terrible,’ Irene says of that time. ‘My partner was really distressed because he has a chronic health condition. He doesn’t travel well so we couldn’t go anywhere. We even rang people in Boolarra and said ‘what’s the air like over there?’ and they said ‘it’s terrible’. My partner gets very distressed if he can’t open the windows for fresh air.’
Irene says the Hazelwood mine fire sparked anger – and a newfound political engagement for many in the community. The previously safe Nationals seat of Morwell became marginal when independent Tracie Lund gained almost 11% of the vote.
‘People from the valley were really angry and upset. It has caused a change in the politics here.’
Since Hazelwood closed Irene says the air quality seems to have improved.
‘The other day I was going for a walk and the air was clear. And I thought, what a beautiful valley! I thought, gee, it will be great when they all close eventually and the Latrobe Valley has moved on to other things.’
49
Environmental Justice Australia

9
Conclusions
50
Environmental Justice Australia
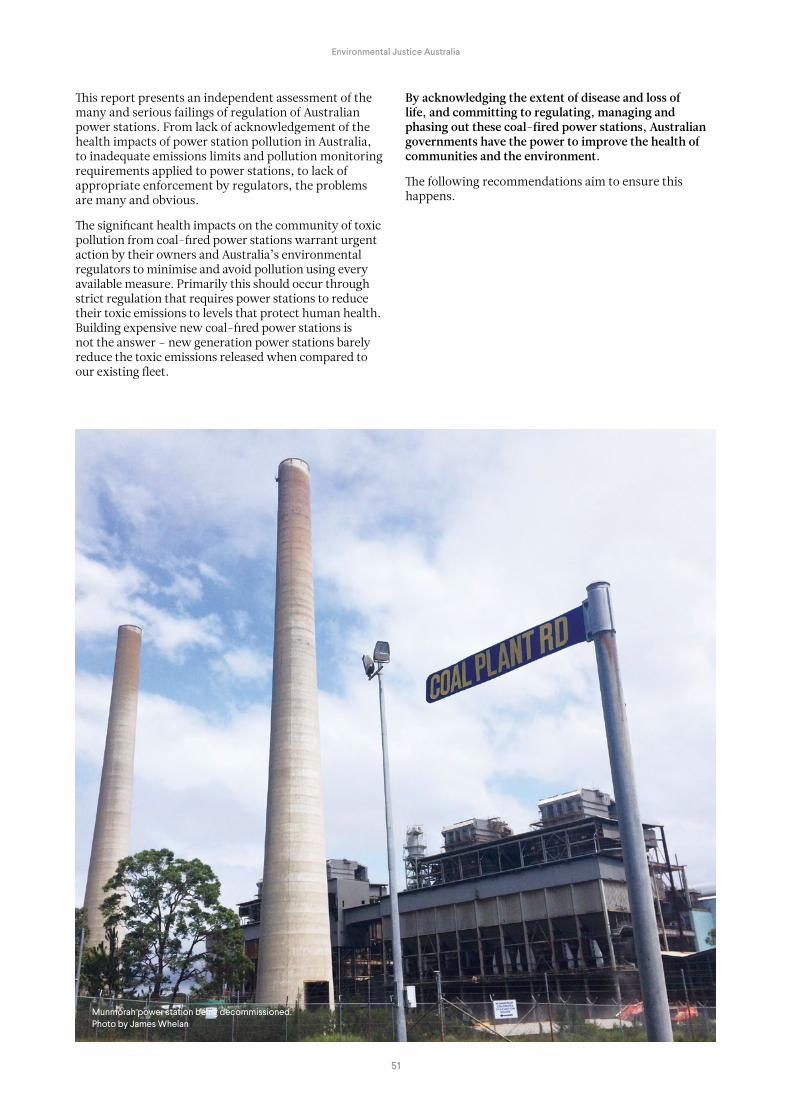
This report presents an independent assessment of the many and serious failings of regulation of Australian power stations. From lack of acknowledgement of the health impacts of power station pollution in Australia, to inadequate emissions limits and pollution monitoring requirements applied to power stations, to lack of appropriate enforcement by regulators, the problems are many and obvious.
The significant health impacts on the community of toxic pollution from coal-fired power stations warrant urgent action by their owners and Australia’s environmental regulators to minimise and avoid pollution using every available measure. Primarily this should occur through strict regulation that requires power stations to reduce their toxic emissions to levels that protect human health. Building expensive new coal-fired power stations is not the answer – new generation power stations barely reduce the toxic emissions released when compared to our existing fleet.
By acknowledging the extent of disease and loss of life, and committing to regulating, managing and phasing out these coal-fired power stations, Australian governments have the power to improve the health of communities and the environment.
The following recommendations aim to ensure this happens.
Munmorah power station being decommissioned. Photo by James Whelan
51
Environmental Justice Australia

Recommendations
In light of the significant failures and weaknesses of Australia’s regulation of power stations we recommend the following be implemented immediately by federal and state governments.
1. That the Federal Government commission a comprehensive and independent assessment of the health impacts of Australia’s coal-fired power stations.
2. That the Federal Government recognise the need for a strong and consistent national approach to the regulation of air pollution and develop and implement binding national emission standards for coal-fired power stations that require international best practice.
3. That Australia’s state governments require mandatory continuous monitoring of stack emissions from all stacks of all major power stations and the data be reported publicly in real time.
4. That Australia’s state governments subject all power stations to an emissions reduction program for PM2.5, PM10, SO2 and NOx to reduce their toxic pollution in line with Best Available Techniques to reduce the toxic health burden imposed on the community.
5. That Australian governments develop and implement a national load-based licencing scheme with fees that reflect the health impacts and other externalities of power stations, ideally led by the Federal Government through the National Environment Protection Council.
6. That the Federal Government commission an independent audit of reporting to the National Pollutant Inventory and instruct power stations on how to improve the accuracy and rigour of their reporting.
7. That federal and state energy ministers undertake a national audit to assess the costs of decommissioning and rehabilitating Australia’s coal-fired power stations, consistent with best practice, and impose bonds or financial assurance requirements on all coal-fired power stations, their ash dams and associated infrastructure.
8. That in light of the level of toxic emissions released by all coal-fired power stations regardless of their age, all Australian governments commit to not build, finance or approve any new coal-fired power stations in Australia and instead invest in the development of renewable energy technologies to progressively replace Australia’s aging power station fleet.
52
Environmental Justice Australia

10
Power station profiles
53
Environmental Justice Australia

LOCATIONCentral Coast NSW (35km south of Newcastle, 30km north of Wyong)
POPULATION OF LOCAL GOVERNMENT AREA327,736 (Central Coast)131, 197,371 (Lake Macquarie)132
FEDERAL ELECTORATEShortland (Joel Fitzgibbon, ALP)
STATE ELECTORATESwansea (Yasman Catley, ALP)
LOCAL GOVERNMENTCentral Coast Council (previously Gosford and Wyong councils). Under an administrator pending elections in September 2017.
OWNERSunset Power International trading as Delta Energy133 – private company
BOUGHTNovember 2015 from the NSW State Government for $1M
COMMISSIONED1978 (39 years old)
EXPECTED CLOSURE2022. End of technical life 2028. Life could extend out to 2030s.
COMPANY POLICY ON CLOSUREThe new owners have stated they intend to operate Vales Point until at least 2022.
CAPACITY1320 MW; two 660MW generators. Vales Point also uses biomass and diesel co-generation.
ELECTRICITY GENERATED 2015–16 7,703,255 MWh
COAL SUPPLYVales Point is supplied by Mannering and Newstan (Centennial Coal) and Chain Valley Colliery (Lake Coal).
ENVIRONMENTAL PROTECTION LICENCENSW EPA has issued EPL 761134
‘Two investors have bought one of NSW’s largest coal-fired power stations for the price of a nice suburban house. Brisbane-based energy consultant Trevor St Baker and coal baron Brian Flannery paid the princely sum of $1 million to the NSW government for the Vales Point Power Station.’135
Power station
Vales Point
39 YRS OLD
54
Environmental Justice Australia

Air pollution issues & impacts
The NSW Office of Environment and Heritage has only one monitoring station on the Central Coast which is 25km south, at Wyong racecourse. Delta are required to monitor a range of pollutants and to make this data available on their website.136 This data provides a limited picture of local air pollution however, as most pollutants are monitored only quarterly or yearly, and PM10 and PM2.5 are measured in terms of ‘undifferentiated particulates’, with no defined licence limit.
Delta Electricity appears to be under-reporting to the National Pollutant Inventory. The company estimated PM2.5 emissions from Vales Point to be just 12,000kg during 2015–16. This is unlikely to be accurate. Eraring, Bayswater and Liddell all reported emitting more than 170,000kg during the same year, 17 times as much as Vales Point. By contrast, in the previous National Pollutant Inventory (2014–15) Vales Point reported emitting a comparable amount of NOx and hydrochloric acid to Eraring which generates more than twice as much electricity.
Pollution controls: details of control technology installed
Vales Point has fabric/bag filters to reduce particle pollution. It does not have wet scrubbers for SO2 removal or selective catalytic reduction for NOx reduction.137
Regulatory problems
Vales Point’s emission limits for SO2, NOx, particles and mercury far exceed the European Union and China standards.
Is this power station a good neighbour?
The Vales Point Power Station is arguably Australia’s most urban power station. It is located in a residential area with almost half a million people living in the cities of Newcastle and Lake Macquarie (to the north) and 300,000 on the Central Coast (to the south). This power station is not a good neighbour.
In February 2017, we visited Vales Point to observe whether the company was in compliance with its licence. We observed a fleet of coal trucks dumping coal beside the power station in hot, dry, windy conditions. We lodged a pollution complaint with the NSW EPA immediately, requesting an investigation. The EPA stated that coal trucks must be covered and that watering trucks were controlling dust. We observed uncovered coal trucks and did not observe water trucks. The EPA stated that coal would be transported by underground conveyors by 31 April when a new underground conveyor system becomes operational. But coal was still being delivered and dumped by truck when we conducted a follow-up visit on 8 June 2017.
Community members in Mannering Park, the suburb closest to Vales Point, have expressed concern that a recently approved 30% increase in coal mining at the two collieries that supply the power station will impact on coal dust pollution, subsidence and trucks on the roads.138
EJA and local residents have requested access to the 450ha dam where coal ash from Vales Point is dumped to inspect measures that might prevent ash drying and being windblown.
Photo by Nicola Rivers
55

LOCATIONDora Creek, Lake Macquarie
POPULATION OF LOCAL GOVERNMENT AREA327,736 (Central Coast)139, 197,371 (Lake Macquarie)140
FEDERAL ELECTORATEHunter (Joel Fitzgibbon, ALP)
STATE ELECTORATELake Macquarie (Greg Piper IND)
LOCAL GOVERNMENTLake Macquarie City Council
OWNEROrigin Energy141 – publicly listed company
BOUGHTJuly 2013
AGE/OPENED1982–84 (35 years old)
EXPECTED CLOSUREearly 2030s
COMPANY POLICY ON CLOSUREOrigin Energy has committed to closing Eraring by the early 2030s and not investing in any future fossil fuel assets.142
CAPACITY2880 MW – Australia’s largest power station
ELECTRICITY GENERATED 2015–1614,631,565MWh
ENVIRONMENTAL PROTECTION LICENCENSW EPA has issued EPL1429143
Origin Energy purchased Eraring for just $50 million. The NSW Government agreed to pay Origin $300 million compensation for the right to break a contract guaranteeing Eraring cheap coal supplied from the Cobbora mine.144
Power station
Eraring
35 YRS OLD
56
Environmental Justice Australia

Air pollution issues and impacts
Eraring is Australia’s largest coal-fired power station. Both the power plant and its massive coal ash dam are located in a residential area between Lake Macquarie and the Central Coast, with several suburbs within 5km.
In the mid 1980s, two additional coal-fired power stations were proposed for the NSW Central Coast. Community opposition sparked a Commission of Inquiry which revealed that local communities already experienced rates of respiratory disease much higher than the state average. Evidence presented to the Inquiry led to the rejection of the proposed power plants.
Pollution controls: details of control technology installed
According to Origin, Eraring has a fabric filter system installed on each of its generating units capable of removing 99.99% of particulates and modified low NOx burners which help to reduce nitrogen oxide emissions by 40%. It does not have wet scrubbers for SO2 removal or selective catalytic reduction for NOx reduction.145
Regulatory problems
Eraring’s licence conditions set stricter stack limits than other coal-fired power stations in NSW for cadmium (0.2 mg/m3 compared to 1mg/m3 for all other power stations); mercury (0.2 mg/m3 compared to 1 mg/m3 for three others) and particle pollution 50 mg/m3 compared to 100 mg/m3 for three others). Eraring’s emission limits are stricter than those required by the European Union but less strict than licence limits in China. Its
SO2 reportable limit and NOx limits far exceed all three international limits with its NOx limit being more than five time above the EU and China limits.
There is no air pollution monitoring within 30km of the Eraring and Vales Point power stations, so it is impossible to know what concentrations of toxic pollution nearby communities live with. Community leaders including state MLA Greg Piper146 and former Mayor of Lake Macquarie Jodie Harrison (now state MP for Charlestown) have advocated for local air pollution monitoring. The NSW EPA justify their refusal to establish monitoring stations near Eraring and Vales Point power stations by referring to a short-term study several years ago that suggested pollution concentrations are generally less than the national standards.
Is this power station a good neighbour?
Eraring’s neighbours regularly complain about local air pollution impacts. Resident and scientist Dr Terry Annable’s house at Cooranbong is ‘regularly blanketed in ultra-fine black particles‘ from Eraring. He believes Eraring should be shut down ahead of schedule.147
In September 2016, Eraring’s massive ash dam dried out and coal ash blew over residents in Wangi and other nearby suburbs. Scores of complaints prompted the NSW EPA to investigate, then prosecute Origin. The $15,000 fine was criticised by Kate Smolski, CEO of the NSW Conservation Council, who said it ‘does nothing’ as a deterrent and that, ‘Tougher fines and stronger rules are needed’.148
Photo by Zephyr L'Green
57

LOCATIONMuswellbrook, Hunter Valley (16km from Muswellbrook; 28km from Singleton)
POPULATION OF LOCAL GOVERNMENT AREA16,086 (Muswellbrook)149 ; 22,987 (Singleton)150
FEDERAL ELECTORATEHunter (Joel Fitzgibbon, ALP)
STATE ELECTORATEUpper Hunter (Michael Johnsen, Nationals)
LOCAL GOVERNMENTMuswellbrook Shire Council
OWNERAGL Macquarie151 – publicly listed company
BOUGHTSeptember 2014
COMMISSIONED (AGE)1985–86 (32 years old)
EXPECTED CLOSURE2035
COMPANY POLICY ON CLOSURE ‘AGL will not build, finance or acquire new conventional coal-fired power stations in Australia. AGL will not extend the operating life of any of its existing coal-fired power stations. By 2050, AGL will close all existing coal-fired power stations in its portfolio.’152
CAPACITY2640 MW; 35% of NSW energy demand; 4 x 660 bituminous coal turbo alternators
ELECTRICITY GENERATED 2015-1617,914,930 MWh
ENVIRONMENTAL PROTECTION LICENCE NSW EPA has issued EPL779153
‘Muswellbrook is a proud mining community which has helped provide affordable and reliable energy to NSW for over 100 years through the thermal coal and energy generation industries. We know that our economy is going to need to transition to a low carbon future and we continue to call on the Federal Government to provide a clear investment path for renewable energy generation. The Muswellbrook community wants to play an active role in that transition and to continue to provide affordable and reliable energy generation from increasingly renewable sources. We are keen to get renewable energy projects underway.’
– Cr Martin Rush, Mayor of Muswellbrook
Power station
Bayswater
32 YRS OLD
58
Environmental Justice Australia

Air pollution issues and impacts
In the 2015–16 National Pollutant Inventory, Bayswater reported emitted more SO2 and NOx than any other Australian power station. The power station emitted 3.54kg of SO2 for every megawatt of power generated, a much higher emission intensity than the average of the ten power stations in this report (2.89kg/MWh).
The annual average concentration of toxic fine particle pollution in nearby Muswellbrook has exceeded the national standard every year since the Upper Hunter air pollution monitoring network began monitoring PM2.5 in 2010, ranging from 8.4µg/m3 to 10µg/m3 compared to the NEPM standard of 8µg/m3 and the 7µg/m3 standard that Australian governments have committed to meeting by 2025.
Muswellbrook also experiences elevated concentrations of SO2, a powerful respiratory irritant that triggers asthma in susceptible people. Doctors for the Environment Australia spokesperson Dr Ben Ewald recently commented that, ‘Comparing the air quality in Muswellbrook with the current World Health Organisation standard shows that there have been 22 exceedances already this year.’154
Pollution controls: details of control technology installed
AGL’s licence requires only annual stack monitoring on three of its units. The company has voluntarily installed continuous SOx and NOx monitors on all units at both the Bayswater and Liddell power stations,155 though this data is not reported publicly. A summary of each month’s monitoring is uploaded to AGL’s website the following month.
Bayswater has bag filter systems on stacks to minimise particulate emissions, and low NOx burners to reduce NOx. It does not have wet scrubbers for SO2 removal or selective catalytic reduction for NOx reduction.156
Regulatory problems
Bayswater has been prosecuted several times for pollution events relating to their fly ash and wastewater management.
• In August 2015 AGL was fined $15,000 for discharging approximately 100 litres of ammoniated water into a stormwater drain which flowed into Tinkers Creek.157
• In January 2016, AGL received a $30,000 fine for allowing 6,000 litres of sulfuric acid to enter two stormwater drains and subsequently flowed to Tinkers Creek.158
• In March 2016, AGL was prosecuted for a coal ash spill, receiving an official caution. A pipeline used to transfer fly ash to Ravensworth mining complex failed.159
The NSW EPA amended AGL's licence to require AGL to develop an improved ash slurry containment system by March 2020.
Bayswater’s emissions limits are much less strict than those required in the European Union, China and the United States, apart from the 1978 US particle limit (Bayswater would in fact be subject to a stricter US limit as it was built after 1978). The licence limits set for emissions of mercury are 33 times higher than those set in China and the EU.
Is Bayswater a good neighbour?
AGL has been described as ‘Australia’s single largest polluter’ due to the total toxic emissions from their fleet of coal and gas generators and their growing CO2 emissions.160 Communities as far away as Newcastle and Sydney are impacted by toxic emissions from Bayswater.
In the past, Bayswater management instructed its operators to blend coal in order to produce a lower estimate of stack emissions than is likely to be representative of annual emissions. Coal with higher sulfur content was burnt in units that were not being monitored.161
Photo by Zephyr L'Green
59

LOCATIONMuswellbrook, Hunter Valley (16km from Muswellbrook; 28km from Singleton)
POPULATION OF LOCAL GOVERNMENT AREA16,086 (Muswellbrook)162 ; 22,987 (Singleton)163
FEDERAL ELECTORATEHunter (Joel Fitzgibbon, ALP)
STATE ELECTORATEUpper Hunter (Michael Johnsen, Nationals)
LOCAL GOVERNMENTMuswellbrook Shire Council
OWNERAGL Macquarie164 – publicly listed company
BOUGHTSeptember 2014
COMMISSIONED1971–73 (46 years old). Australia’s oldest running power station
EXPECTED CLOSUREMarch 2022
COMPANY POLICY ON CLOSURE‘AGL will not build, finance or acquire new conventional coal-fired power stations in Australia. AGL will not extend the operating life of any of its existing coal-fired power stations. By 2050, AGL will close all existing coal-fired power stations in its portfolio.’165
AGL supports payments to be made to ‘encourage coal-fired power stations to exit the market to make more room for renewables, address over-supply, and help wholesale prices to recover.’166
CAPACITY2000 MW
ELECTRICITY GENERATED 2015-167,955,425 MWh
ENVIRONMENTAL PROTECTION LICENCE NSW EPA has issued EPL2122167
‘The NSW government are effectively selling Liddell to avoid liability associated with the cost of remediation when they close it.’
– Tim Buckley, Institute of Energy Economics and Financial Analysis168
Power station
Liddell
46 YRS OLD
60
Environmental Justice Australia

Air pollution issues and impacts
Although Liddell generates only two-thirds as much power as Bayswater or Eraring, it emits a comparable amount of PM2.5, NOx and SO2. Liddell has the highest SO2 emissions intensity of all Australia’s power stations (3.87kg/MWh, compared to the average of the ten power stations in this report – 2.89 kg/MWh).
At 46 years old, Liddell is the oldest power station in NSW and is expected to be the next to close.
Pollution controls: details of control technology installed
SO2 and NOx emissions from Liddell’s stacks are monitored continuously, though this data is not reported publicly. A summary of each month’s monitoring is uploaded to AGL’s website the following month.
Liddell has bag filter systems on stacks to minimise particulate emissions. It does not have wet scrubbers for SO2 removal or selective catalytic reduction for NOx reduction.169
Liddell’s licence requires the operators to prepare an Emission Reduction program to identify options to reduce NOx emission concentrations to 800mg/m3, 500mg/m3 and below 500mg/m3 (International Best Practice). This was due to be submitted to the NSW EPA by 3 July 2017. It is unknown if this has been done. At the time of writing it had not been released publicly by the EPA.
Regulatory problems
Liddell has had a number of non-compliance issues over the past five years, particularly in relation to pollution from its ash dump including:
• water from the power station accidentally released into an Endangered Ecological Community in October 2015;170
• ash water overflowing from the Liddell ash dump into Tinkers Creek on three occasions in 2014;171 and
• two occasions of ash slurry leaking into waterways due to pipeline and pump failures in 2015.172
The NSW EPA issued a warning letter and requirement to fix the issues but no fine for non-compliance.
Liddell’s emissions limits far exceed all EU and China limits.
Is this power station a good neighbour?
Liddell received national media attention in mid 2016 when warm water discharged from the power station into Lake Liddell contributed to an infestation of the deadly virus naegleria fowleri (or brain-eating amoeba). The lake, which has served as a popular recreational facility for the nearby Muswellbrook community, has been permanently closed.173 AGL’s publications still describe the lake as ‘a water recreation source and unique habitat for a variety of wildlife‘.
With Liddell’s closure in March 2022 beyond doubt, the primary concern for neighbours is the decommissioning and remediation of the power station and its massive ash dam. Muswellbrook Mayor Martin Rush has expressed grave concern that the NSW Government sold the power station to AGL without insisting on commitments regarding its closure and rehabilitation.174
Photo by James Whelan
61

LOCATIONPortland NSW (19kms from Lithgow, 46kms from Bathurst)
POPULATION OF LOCAL GOVERNMENT AREABathurst – 41,300175. Lithgow – 21,090176
FEDERAL ELECTORATECalare (Andrew Gee, Nationals)
STATE ELECTORATEBathurst (Paul Toole, Nationals)
LOCAL GOVERNMENTLithgow
OWNEREnergyAustralia177 – private company owned by Hong Kong-based CLP Group.
BOUGHT2013
COMMISSIONED1992–93 (25 years old)
EXPECTED CLOSURE2050
COMPANY POLICY ON CLOSUREMark Collette, from EnergyAustralia: ‘We support an orderly, realistic transition from large, older coal-fired power stations to cleaner forms of energy‘.178 ‘The community and investors view coal as a legacy technology that would eventually be replaced.’179
CAPACITY1400 MW
ELECTRICITY GENERATED 2015-167,259,195 MWh
COAL SOURCESpringvale mine
ENVIRONMENTAL PROTECTION LICENCE EPA NSW has issued EPL13007
Mt Piper and Wallerawang (Central Coast) were purchased for $160M.180 This sale included transfer of $200M in potential liabilities. Wallerawang has been subsequently decommissioned.
Power station
Mt Piper
25 YRS OLD
62
Environmental Justice Australia

Air pollution issues and impacts
The NSW EPA conducts no routine air pollution monitoring near Mt Piper or the nearby communities of Portland and Lithgow.
Pollution controls: details of control technology installed
Mt Piper has bag filter systems on stacks to minimise particulate emissions, low NOx burners to reduce NOx. It does not have wet scrubbers for SO2 removal or selective catalytic reduction for NOx reduction.181
Regulatory problems
Mt Piper reported emitting just 10,000kg of PM2.5 and 56,000kg of PM10 in 2015–16. This is not a credible estimate. Based on the energy Mt Piper generated during this period, it is probable their emissions were 10–20 times higher, as they have been throughout the last decade. When we brought this to the attention of the NSW EPA, EPA head Barry Buffier’s response was to justify the unusually low emission estimate by explaining that Mt Piper has a fabric filter which effectively capture most fine particles. The filter was installed in 1993. This provides no explanation for the extraordinary recent reduction in emissions.
Mt Piper’s emissions limits meet the EU limits for particle pollution but far exceed the European Union and China limits for NOx, SO2 and mercury.
Is this power station a good neighbour?
The region’s communities are concerned about air pollution. Residents state that Mt Piper is causing significant harm to the local environment including water pollution and air pollution.182 Communities from Mt Piper to the Blue Mountains have campaigned vigorously for coal trains to be covered and for the state’s air pollution monitoring network to be expanded to include their region.
In 2016 local environment group 4Nature appealed the expansion of the nearby Springvale mine which supplies coal to Mt Piper, and in particular the discharge of large amounts of mine water into the river system that forms part of Sydney’s drinking water catchment.183 The appeal was heard in May 2017 and a judgement is pending.184
Photo by Zephyr L'Green
63

LOCATIONGladstone, Central Queensland
POPULATION OF LOCAL GOVERNMENT AREAGladstone – 61,640185
FEDERAL ELECTORATEFlynn (Ken O’Dowd, LNP)
STATE ELECTORATEGladstone (Glenn Butcher, ALP)
LOCAL GOVERNMENTGladstone Regional Council
OWNERRio Tinto Aluminium, US company NRG Energy Inc186 and three Japanese companies (SLMA GPS, Ryowa II GPS and YKK GPS)
BOUGHTSold by Queensland state government in 1994
COMMISSIONED1976 (41 years old)
EXPECTED CLOSURE2026
COMPANY POLICY ON CLOSUREUnknown
CAPACITY1680 MW
ELECTRICITY GENERATED 2015–166,900,339 MWh
COAL SUPPLYPrimarily from Rolleston and Callide coal mines
ENVIRONMENTAL PROTECTION LICENCEQueensland Department of Environment and Heritage Protection has issued permit EPPR 00973013. Only available to the public by submitting a Freedom of Information request and paying a fee. (Note: pollution licences are freely available in other states.)
‘Many years ago the Gladstone Power Station emitted copious amounts of waste over the houses many miles away. The local council at the time forced the power station to place filters in the stacks. These made a great improvement. One house owner said that she had to sweep the stairs on her way down to place a load of washing in the automatic machine and in that short time would then have to sweep her way up the stairs again.’
– Post from a Gladstone resident on our Facebook page
Power station
Gladstone
41 YRS OLD
64
Environmental Justice Australia
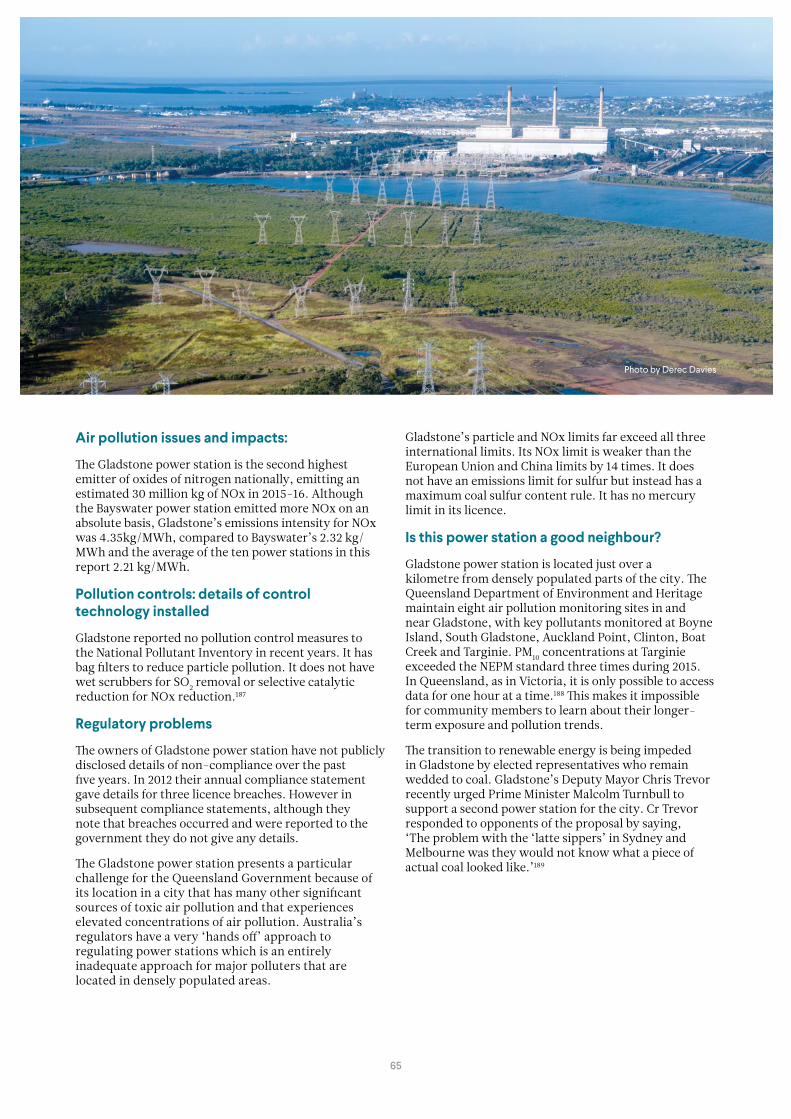
Air pollution issues and impacts:
The Gladstone power station is the second highest emitter of oxides of nitrogen nationally, emitting an estimated 30 million kg of NOx in 2015-16. Although the Bayswater power station emitted more NOx on an absolute basis, Gladstone’s emissions intensity for NOx was 4.35kg/MWh, compared to Bayswater’s 2.32 kg/MWh and the average of the ten power stations in this report 2.21 kg/MWh.
Pollution controls: details of control technology installed
Gladstone reported no pollution control measures to the National Pollutant Inventory in recent years. It has bag filters to reduce particle pollution. It does not have wet scrubbers for SO2 removal or selective catalytic reduction for NOx reduction.187
Regulatory problems
The owners of Gladstone power station have not publicly disclosed details of non-compliance over the past five years. In 2012 their annual compliance statement gave details for three licence breaches. However in subsequent compliance statements, although they note that breaches occurred and were reported to the government they do not give any details.
The Gladstone power station presents a particular challenge for the Queensland Government because of its location in a city that has many other significant sources of toxic air pollution and that experiences elevated concentrations of air pollution. Australia’s regulators have a very ‘hands off’ approach to regulating power stations which is an entirely inadequate approach for major polluters that are located in densely populated areas.
Gladstone’s particle and NOx limits far exceed all three international limits. Its NOx limit is weaker than the European Union and China limits by 14 times. It does not have an emissions limit for sulfur but instead has a maximum coal sulfur content rule. It has no mercury limit in its licence.
Is this power station a good neighbour?
Gladstone power station is located just over a kilometre from densely populated parts of the city. The Queensland Department of Environment and Heritage maintain eight air pollution monitoring sites in and near Gladstone, with key pollutants monitored at Boyne Island, South Gladstone, Auckland Point, Clinton, Boat Creek and Targinie. PM10 concentrations at Targinie exceeded the NEPM standard three times during 2015. In Queensland, as in Victoria, it is only possible to access data for one hour at a time.188 This makes it impossible for community members to learn about their longer-term exposure and pollution trends.
The transition to renewable energy is being impeded in Gladstone by elected representatives who remain wedded to coal. Gladstone’s Deputy Mayor Chris Trevor recently urged Prime Minister Malcolm Turnbull to support a second power station for the city. Cr Trevor responded to opponents of the proposal by saying, ‘The problem with the ‘latte sippers’ in Sydney and Melbourne was they would not know what a piece of actual coal looked like.’189
Photo by Derec Davies
65

LOCATIONGracemere (23km southwest of Rockhampton, Central Queensland)
POPULATION OF LOCAL GOVERNMENT AREA79,726 (Rockhampton region)190
FEDERAL ELECTORATECapricornia (Michelle Landry, LNP)
STATE ELECTORATERockhampton (Bill Bryne, ALP)
LOCAL GOVERNMENTFitzroy region
OWNERStanwell Corporation191 (Queensland Government-owned)
COMMISSIONED1993–96 (24 years old)
EXPECTED CLOSUREUnknown
COMPANY POLICY ON CLOSURE The Stanwell Group is wholly owned by the Queensland Government. Stanwell operate three coal-fired stations (Stanwell, Tarong and Tarong North) along with one diesel, two gas and four hydro power plants and two coal mines. The company has no apparent policy on closure. The Queensland Government recently announced a $53 million upgrade to the power station and so is unlikely to have closure plans in the near future.192
CAPACITY1460MW
ELECTRICITY GENERATED 2015-169,089,362 MWh
COAL SUPPLYWesfarmers Curragh Coal (Blackwater)
ENVIRONMENTAL PROTECTION LICENCEQueensland Department of Environment and Heritage Protection has issued permit EPPR 00708913. Only available to the public by submitting a Freedom of Information request and paying a fee. (Note: pollution licences are freely available in other states.)
Power station
Stanwell
24 YRS OLD
66
Environmental Justice Australia

Air pollution issues and impacts
Stanwell has the third-highest emission intensity for SOx of all the power stations in this report: 3.73kg/MWh compared to the average 2.89kg/MWh. Despite generating significantly less power than Gladstone power station, Stanwell reported emitting significantly more PM10, PM2.5 and SO2 than Gladstone in 2015–16.
Stanwell’s fine particle (PM2.5) emissions have increased steadily during the last decade and reached the highest level recorded (337,656kg) in 2015–16, making it the sixth-highest emitter after Tarong (1,680,432kg) and the four Victorian power stations.
Pollution controls: details of control technology installed
Stanwell Corporation claims to burn low sulfur coal, to have fitted low nitrogen oxide (NOx) burners, and to have ‘an efficient operating regime.’193 Stanwell uses electrostatic precipitators to reduce particle pollution. These are not considered Best Available Techniques and are significantly less efficient than bag/fabric filters. Stanwell does not have wet scrubbers for SO2 removal or selective catalytic reduction for NOx reduction.194 In June 2017 the Queensland Government recently announced a $53m upgrade to Stanwell to overhaul two of its boiler units and update its control system which it claims will ‘maintain the power station’s efficiency’.195
In 2010 the Queensland Government abandoned the $4.3 billion ZeroGen carbon capture and storage project for Stanwell power station that it had initiated in conjunction with private operators and the federal government. It lost $96.3 million on the project and granted a further $6.3 million of the funds to the industry-run Australian Coal Association.196 ‘The Government was advised to withdraw from ZeroGen after a report described it as ‘speculative.’197 The project started in 2006 and was due to be operational by 2020.
Regulatory problems
Stanwell’s self-reported annual compliance statements contain a surprising absence of non-compliance issues when compared to other power stations. It is therefore not clear what its level of compliance is with its pollution licence.
Stanwell’s particle limit is far less strict than all three international limits and is almost double the 1978 United States limit. Its NOx limit is also far less strict than all three international limits and is six times the European Union and China limits.
Is this power station a good neighbour?
The Stanwell power station is located less than 25km south-west of the Central Queensland cities of Rockhampton (population 79,000) and Gracemere (population 8,500). Stanwell reported emitting 337,656kg of fine particle pollution (PM2.5) in 2015–16, the fifth-highest total of all Australian power stations. The Queensland Government conducts no routine air pollution monitoring in Rockhampton, so community members have no independent data on pollutant concentrations near the power station.
The Capricorn Conservation Council has expressed concerns over impacts of the ash dump on local streams and aquifer.
Photo by People's Climate March
67

LOCATIONTraralgon, Victoria
POPULATION OF LOCAL GOVERNMENT AREA73,257 (Latrobe City).198 42983 (Wellington Shire)199
FEDERAL ELECTORATEGippsland (Darren Chester, Nationals)
STATE ELECTORATEMorwell (Russell Northe, NAT)
LOCAL GOVERNMENTLatrobe City Council
OWNERAGL Macquarie200 – publicly listed company
BOUGHT2012
AGE/OPENED1984 (33 years old)
EXPECTED CLOSURENotional closure date of 2048. Due for major capital investment around 2030/2035 if it is to keep running.201
COMPANY POLICY ON CLOSURE ‘AGL will not build, finance or acquire new conventional coal-fired power stations in Australia. AGL will not extend the operating life of any of its existing coal-fired power stations. By 2050, AGL will close all existing coal-fired power stations in its portfolio.’202
CAPACITY2210MW203
ELECTRICITY GENERATED 2015–1615,715,547 MWh
COAL SUPPLYLignite (brown coal) from Loy Yang open-cut mine adjacent to power station.
ENVIRONMENT PROTECTION LICENCE EPA Victoria has issued licence 11149204
Power station
Loy Yang A
33 YRS OLD
68
Environmental Justice Australia

Air pollution issues & impacts
In 2015–16, AGL reported that Loy Yang A emitted 3.6 million kilograms of PM10, 0.23kg/MWh. This would make the power station both the biggest source of PM10 of all power stations examined in this report and also the most emissions intensive (for PM10). However, a significant problem with the National Pollutant Inventory reports is that the Victorian power stations report their mine and power station pollution as one, and therefore much of this PM10 is likely to be from the mine. To compare the toxic pollution reported by AGL for Loy Yang A with emissions from power stations in other states would require National Pollutant Inventory reports that separate mine and power plant emissions.
Loy Yang A also reports the second-highest SO2 emissions (61 million kilograms in 2015–16) of our ten power stations. The power station has the highest SO2 emissions intensity (3.88kg/MWh compared to the average of 3kg/MWh). The vast majority of the reported SO2 emissions would be from the power station, as coal mines do not emit much SO2.
In the Latrobe Valley, many residents warn against leaving tools outdoors overnight if you live around Rosedale, because the sulfur from the Loy Yang power stations will rust anything left in the open air. SO2 and rain (H2O) combine to form sulfuric acid, a highly corrosive acid.
Pollution controls: details of control technology installed
Loy Yang A has an electrostatic precipitator to reduce its particle pollution. Precipitators are not as effective as the bag/fabric filters that are fitted to all NSW power stations. It does not have wet scrubbers for SO2 removal or selective catalytic reduction for NOx reduction.205
Regulatory problems
Loy Yang A’s emissions limits for particles, SO2 and NOx are less strict than all three international limits apart from the 1978 United States limit for NOx. (In fact Loy Yang A would be subject to a much stricter NOx standard in the US as it was built after 1978.)
Is this power station a good neighbour?
Loy Yang A’s 2015–16 National Pollutant Inventory report shows that the power station emits nearly the same amount of SO2 as all the other Latrobe Valley power stations combined – including Hazelwood. SO2 exposure has some of the most immediate health impacts including itching eyes, wheezing and onset of asthma attacks and headaches. With Hazelwood’s closure, Loy Yang A has become the highest emitter of oxides of nitrogen and PM10. Despite this, the only pollution reduction controls the power station has installed are electrostatic precipitators – an inefficient pollution control compared to bag/fabric filters.
Photo by Nicola Rivers
69

LOCATIONYallourn North, Victoria
POPULATION OF LOCAL GOVERNMENT AREA73,257 (Latrobe City).206 Includes Moe, Yallourn North, Morwell and Traralgon
FEDERAL ELECTORATEGippsland (Darren Chester, Nationals)
STATE ELECTORATEMorwell (Russell Northe, NAT)
LOCAL GOVERNMENTLatrobe City Council
OWNEREnergyAustralia207 – private company owned by Hong Kong-based CLP Group.
BOUGHT2012
COMMISSIONED1974–82 (43 years old)
EXPECTED CLOSURE2032
COMPANY POLICY ON CLOSURE‘We see a social responsibility to keep [Yallourn] open… but it could close earlier‘ – EnergyAustralia Executive of Energy Mark Collette.208
CAPACITY1480 MW
ELECTRICITY GENERATED 2015–1611,588,110 MWh
COAL SUPPLYCoal is supplied from the Yallourn mine. This mine is not expected to expand beyond its current licence which is due to expire in 2032.
ENVIRONMENTAL PROTECTION LICENCE EPA Victoria has issued licence 10961209
Power station
Yallourn
43 YRS OLD
70
Environmental Justice Australia
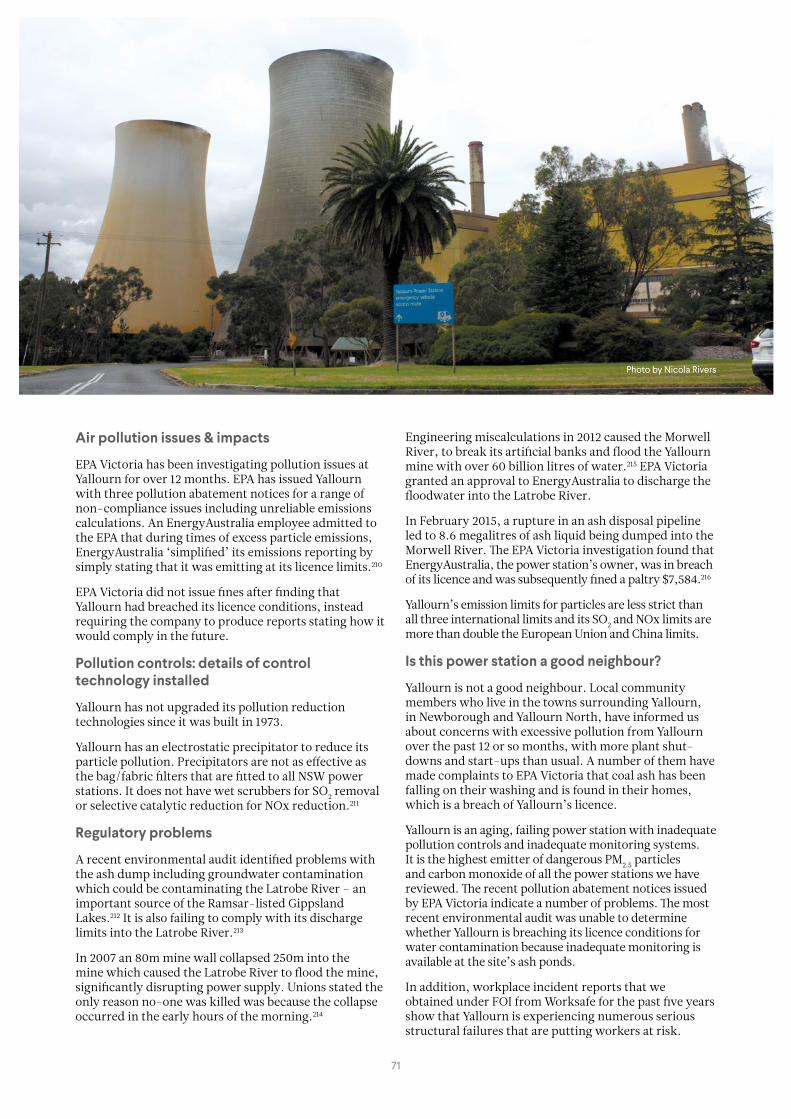
Air pollution issues & impacts
EPA Victoria has been investigating pollution issues at Yallourn for over 12 months. EPA has issued Yallourn with three pollution abatement notices for a range of non-compliance issues including unreliable emissions calculations. An EnergyAustralia employee admitted to the EPA that during times of excess particle emissions, EnergyAustralia ‘simplified’ its emissions reporting by simply stating that it was emitting at its licence limits.210
EPA Victoria did not issue fines after finding that Yallourn had breached its licence conditions, instead requiring the company to produce reports stating how it would comply in the future.
Pollution controls: details of control technology installed
Yallourn has not upgraded its pollution reduction technologies since it was built in 1973.
Yallourn has an electrostatic precipitator to reduce its particle pollution. Precipitators are not as effective as the bag/fabric filters that are fitted to all NSW power stations. It does not have wet scrubbers for SO2 removal or selective catalytic reduction for NOx reduction.211
Regulatory problems
A recent environmental audit identified problems with the ash dump including groundwater contamination which could be contaminating the Latrobe River – an important source of the Ramsar-listed Gippsland Lakes.212 It is also failing to comply with its discharge limits into the Latrobe River.213
In 2007 an 80m mine wall collapsed 250m into the mine which caused the Latrobe River to flood the mine, significantly disrupting power supply. Unions stated the only reason no-one was killed was because the collapse occurred in the early hours of the morning.214
Engineering miscalculations in 2012 caused the Morwell River, to break its artificial banks and flood the Yallourn mine with over 60 billion litres of water.215 EPA Victoria granted an approval to EnergyAustralia to discharge the floodwater into the Latrobe River.
In February 2015, a rupture in an ash disposal pipeline led to 8.6 megalitres of ash liquid being dumped into the Morwell River. The EPA Victoria investigation found that EnergyAustralia, the power station’s owner, was in breach of its licence and was subsequently fined a paltry $7,584.216
Yallourn’s emission limits for particles are less strict than all three international limits and its SO2 and NOx limits are more than double the European Union and China limits.
Is this power station a good neighbour?
Yallourn is not a good neighbour. Local community members who live in the towns surrounding Yallourn, in Newborough and Yallourn North, have informed us about concerns with excessive pollution from Yallourn over the past 12 or so months, with more plant shut-downs and start-ups than usual. A number of them have made complaints to EPA Victoria that coal ash has been falling on their washing and is found in their homes, which is a breach of Yallourn’s licence.
Yallourn is an aging, failing power station with inadequate pollution controls and inadequate monitoring systems. It is the highest emitter of dangerous PM2.5 particles and carbon monoxide of all the power stations we have reviewed. The recent pollution abatement notices issued by EPA Victoria indicate a number of problems. The most recent environmental audit was unable to determine whether Yallourn is breaching its licence conditions for water contamination because inadequate monitoring is available at the site’s ash ponds.
In addition, workplace incident reports that we obtained under FOI from Worksafe for the past five years show that Yallourn is experiencing numerous serious structural failures that are putting workers at risk.
Photo by Nicola Rivers
71

LOCATIONTraralgon, Victoria
POPULATION OF LOCAL GOVERNMENT AREA73,257 (Latrobe City)217. 42,983 (Wellington Shire)218
FEDERAL ELECTORATEGippsland (Darren Chester, Nationals)
STATE ELECTORATEMorwell (Russell Northe, Nationals)
LOCAL GOVERNMENTLatrobe City Council
OWNERIPM operation and management. Jointly owned by Engie219 (70%) (a French company formally known as GDF Suez) and Mitsui and Co Ltd, a Japanese company. Engie is part-owned by the French government. Engie also owns Hazelwood.
In 2014 GDF Suez was ordered by Italian courts to shut down two of its coal-fired power units in Italy after it was found that the units were responsible for hundreds of premature deaths and thousands of cases of heart and lung disease.220 Engie is currently facing prosecution by Worksafe and EPA Victoria for the Hazelwood mine fire which occurred in 2014.221
BOUGHT2004
COMMISSIONEDUnit 1 – 1993 (24 years old), Unit 2 – 1996 (21 years old)
EXPECTED CLOSURE unknown
COMPANY POLICY ON CLOSUREEngie has stated that it is withdrawing from fossil fuels globally and is negotiating the sale of Loy Yang B.222
In January 2017, IPM was granted a works approval from EPA Victoria to upgrade Loy Yang’s turbines. This upgrade will increase generating capacity by 8%. IPM claims the turbine upgrade will increase efficiency and drive down emissions intensity. However it will also use an additional 323,000 tonnes of coal per annum, making the gains in emissions intensity redundant in the long term.
CAPACITY953 MW223 (post-upgrade capacity will be 1140 MW)
ELECTRICITY GENERATED 2015-168,451,503 MWh
COAL SUPPLYLignite supplied from Loy Yang mine currently owned by AGL.
ENVIRONMENTAL PROTECTION LICENCE EPA Victoria has issued licence 3987224
After announcing its intention to withdraw from fossil fuel power generation globally, Engie has put Loy Yang B on the market with a $1 billion price tag.225
Power station
Loy Yang B
24 YRS OLD
72
Environmental Justice Australia

Air pollution issues & impacts
Loy Yang B has the third highest emissions of PM2.5 by total of the ten power stations we researched and is the second-highest levels of PM2.5 emissions by emissions intensity.
Pollution controls: details of control technology installed
Loy Yang B is described by its owner as ‘Victoria’s newest and most efficient coal-fired power station’.226 It has electrostatic precipitators to reduce particle pollution. Loy Yang B started reporting to the National Pollutant Inventory from the 2013–14 reporting year onwards that it had installed wet scrubbers in 1993. If this is true it would be the only power station in Australia with this technology installed. When we wrote to Engie asking for more information about the pollution reduction technologies installed at Loy Yang B the company did not acknowledge the scrubbers, and did not respond to our question about the discrepancy. Given that the power station emitted nearly 24 million kilograms of SO2 into the atmosphere in 2015–16 – more than Yallourn and Hazelwood’s emissions combined – it appears unlikely that Loy Yang B has such pollution reduction measures installed.
Regulatory problems
Loy Yang B’s particle and SO2 emissions limits exceed all three international limits. Its NO2 limit is lower than the 1978 United States limit (however it would well exceed the US limit that would actually be applied to this power station as it was built in the 1990s when US emissions limits were reduced by a further 70%). Its NO2 limits are more than three times the China and European Union limit.
Is this power station a good neighbour?
Engie markets itself as a world leader in clean energy in Europe but in the Latrobe Valley it owned the dirtiest power station in the country until Hazelwood closed, and has repeatedly tried to avoid taking responsibility for its failings.227
Loy Yang B is a very high emitter of PM2.5 which is particularly harmful to human health.
Photo by Nicola Rivers
73

12
Appendix
74
Environmental Justice Australia

APPENDIX 1 Notes on the calculation of the emissions limits in Figure 10a. All Australian power station emission limits were
taken from their individual pollution licences. Where necessary, limits were converted to mg/m3, using the methods described below. Methods used by jurisdictions to calculate pollution rates vary, so the results of these conversions are intended to allow an approximate comparison of standards only.
b. In the USA, multiple standards exist, so we have presented the least stringent standard (the one applied to power stations built before 1978). Readers should keep in mind that many US power stations have far stricter limits.
c. Victoria’s g/min standards were converted to mg/m3 using full-load capacity as stated in table, HHV sent-out thermal efficiencies of 27.2%, 26.6% and 24.2% for Loy Yang A, Loy Yang B and Yallourn respectively as per ACIL Allen 2014228 and Energy Australia 2014229 and the US EPA fuel factor of 345.6 m3/GJ for brown coal230. All standards at STP, i.e. 273.15K and 101.3 kPa, unless otherwise specified.
d. We have calculated all US and Victorian limits using a reference Oxygen concentration of 6% O2 to match EU and China standards. However we note that emis sion rates for the Australian power stations listed are variously corrected for flue gas with 7% O2 or 12% CO2. Conversions are therefore accurate within +/-10%.
e. US limits are converted from heat input-based limits specified in ng/J using US EPA fuel factors of 342.79 m3/GJ for black coal and 345.6 m3/GJ for lignite (brown coal)231.
f. The EU standards have been sourced from the following document – World Resources Institute, China Adopts World-Class Pollutant Emissions Standards for Coal Power Plants 15 June 2012.232
g. China’s limits are sourced from International Energy Agency Clean Coal Centre, Emissions Standards China 1 October 2015.233
h. NSW power stations do not have a SO2 limit but instead have a sulfuric acid mist and sulfur trioxide limit of 100 mg/m3. They do have a SO2 reportable limit of 600ppm though, which converts to 1716 mg/m3 which we have used for the purposes of this table. Power stations try to keep their SO2 emissions under this reportable limit so they do not have to report to the EPA.
i. Mercury limits – one μg (one microgram) is 10-6 grams.
75
Environmental Justice Australia

13
References
76
Environmental Justice Australia

REFERENCES
1. https://envirojustice.org.au/sites/default/files/files/EJA_fact_sheet_rights_and_coal-fired_power_stations_Vic.pdf
2. https://envirojustice.org.au/submissions-and-issues-papers/your-rights-and-coal-fired-power-stations-in-nsw
3. Andrew Stock, ‘Australia’s Electricity Sector: Ageing, inefficient and unprepared’ (Research Report, Climate Council, 2014) <http://www.climatecouncil.org.au/uploads/f9ba30356f697f238d0ae54e913b3faf.pdf >.
4. William M Casteleden et al, ‘The mining and burning of coal: effects on health and the environment’ (2011) 195(6) MJA 333-335.
5. David Shearman, Why coal-fired power stations need to shut on health grounds, (28 November 2016) The Conversation <https://theconversation.com/why-coal-fired-power-stations-need-to-shut-on-health-grounds-68809>.
6. Western Australia’s biggest coal-fired power station – Muja – is set to close next year leaving 16 power stations in operation.
7. Andrew Stock, ‘Australia’s Electricity Sector: Ageing, inefficient and unprepared’ (Research Report, Climate Council, 2014) pinpoint <http://www.climatecouncil.org.au/uploads/f9ba30356f697f238d0ae54e913b3faf.pdf >.
8. Ben Caldecott, Gerard Dericks and James Mitchell, ‘Subcritical Coal in Australia: Risks to Investors and Implications for Policymakers’ (Working Paper, Smith School of Enterprise and the Environment, Oxford University, March 2015) <http://www.smithschool.ox.ac.uk/research-programmes/stranded-assets/Subcritical%20Coal%20in%20Australia_Investors&Policymakers.pdf>.
9. See National Pollutant Inventory (2017) Department of Environment and Energy, Australian Government, <http://www.npi.gov.au/home> for reports 2015/16 for sulfur dioxide, oxides of nitrogen and PM2.5.
10. William M Casteleden et al, ‘The mining and burning of coal: effects on health and the environment’ (2011) 195(6) MJA 333-335.
11. Ali Al-Saffar et al, ‘Energy and Air Pollution: World Energy Outlook Special Report’ (Report, International Energy Agency, 2016) <https://www.International Energy Agency.org/publications/freepublications/publication/WorldEnergyOutlook SpecialReport2016EnergyandAirPollution.pdf>.
12. Ali Al-Saffar et al, ‘Energy and Air Pollution: World Energy Outlook Special Report’ (Report, International Energy Agency, 2016) p61 <https://www.International Energy Agency.org/publications/freepublications/publication/WorldEnergyOutlook SpecialReport2016EnergyandAirPollution.pdf>.
13. Shannon Wood ‘Muja AB set to close four units’, Collie Mail (online), 11 May 2017) <http://www.colliemail.com.au/story/4642339/muja-unit-closure/>.
14. National Pollutant Inventory (2017) Department of Environment and Energy, Australian Government <http://www.npi.gov.au/home>.
15. Erica Burt, Peter Orris and Susan Buchanan, ‘Scientific Evidence of Health Effects from Coal Use in Energy Generation’ (White Paper, Healthcare Research Collaborative, University of Illinois, April 2013) <https://noharm-uscanada.org/sites/default/files/documents-files/828/Health_Effects_Coal_Use_Energy_Generation.pdf>.
16. William M Casteleden et al, ‘The mining and burning of coal: effects on health and the environment’ (2011) 195(6) MJA 333-335.
17. David Shearman, Why coal-fired power stations need to shut on health grounds, (28 November 2016) The Conversation <https://theconversation.com/why-coal-fired-power-stations-need-to-shut-on-health-grounds-68809>.
18. Bernard Teague, John Catford and Anita Roper, ‘Hazelwood Mine Fire Inquiry Report 2015/2016 Volume III – Health Improvement’ (Report no 82, Hazelwood Mine Fire Inquiry, 29 January 2016) 71 <http://hazelwoodinquiry.vic.gov.au/201516-report/volume-iii-health-improvement/>.
19. Mark Hibberd and David Cohen, ‘Upper Hunter Valley Particle Characterisation Study Final Report’ (Research Report, CSIRO, 17 September 2013) <http://www.environment.nsw.gov.au/resources/aqms/UHFPCSFinal.pdf>.
20. Paul R Epstein, Testimony for the Kentucky General Assembly, House of Representatives Committee on Health and Welfare (25 February 2010) Kentuckians for the Commonwealth <http://www.kftc.org/sites/default/files/docs/resources/dr._epstein_testimony.pdf>.
21. Jordan Ward J and Mick Power, ‘Cleaning up Victoria’s Power Sector: the full social cost of Hazelwood power station’ (Report, Harvard Kennedy School of Government, 24 February 2015) <http://environmentvictoria.org.au/newsroom/report/cleaning-victoria%E2%80%99s-power-sector#.VTR2TSGeDRY>.
22. Fiona Armstrong, ‘Coal and health in the Hunter: Lessons from one valley for the world’ (Report, Climate and Health Alliance, February 2015). <http://www.caha.org.au/projects/hunter-coal/>.
23. Tom Biegler, ‘The Hidden Costs of Electricity: Externalities of Power Generation in Australia’ (Report, Australian Academy of Technological Sciences and Engineering, March 2009) <www.atse.org.au/Documents/Publications/Reports/Energy/ATSE%20Hidden%20Costs%20Electricity%202009.pdf>.
24. NSW Environmental Protection Authority and Office of Environment and Heritage, State of New South Wales , ‘Consultation Paper: Clean Air for NSW’ , (Consultation Paper No 2016/0415, State of NSW, October 2016,) 29 <http://www.epa.nsw.gov.au/resources/air/clean-air-nsw-160415.pdf>.
25. World Health Organisation, Outdoor air pollution a leading environmental cause of cancer deaths, (17 October 2013) <http://www.euro.who.int/en/health-topics/environment-and-health/urban-health/news/news/2013/10/outdoor-air-pollution-a-leading-environmental-cause-of-cancer-deaths> .
26. Neil Hime, Christine Cowie and Guy Marks, Woolcock Institute of Medical Research, Centre for Air Quality and Health Research and Evaluation (CAR), ‘Review of the health impacts of emission sources, types and levels of particulate matter air pollution in ambient air in NSW: Produced for NSW Environment Protection Authority and NSW Ministry of Health’ (Report, Woolcock Institute of Medical Research, Centre for Air Quality and Health Research and Evaluation (CAR), December 2015) <http://www.car-cre.org.au/images/content/Health%20impacts%20of%20PM%20report_final%20for%20web.pdf>.
27. Neil Hime, Christine Cowie and Guy Marks, Woolcock Institute of Medical Research, Centre for Air Quality and Health Research and Evaluation (CAR), ‘Review of the health impacts of emission sources, types and levels of particulate matter air pollution in ambient air in NSW: Produced for NSW Environment Protection Authority and NSW Ministry of Health’ (Report, Woolcock Institute of Medical Research, Centre for Air Quality and Health Research and Evaluation (CAR), December 2015) <http://www.car-cre.org.au/images/content/Health%20impacts%20of%20PM%20report_final%20for%20web.pdf>.
28. Department of Environment and Heritage, Sulfur Dioxide (SO2) Air quality fact sheet (2005) Australian Department of Environment and Energy <http://www.environment.gov.au/protection/publications/factsheet-sulfur-dioxide-so2>.
29. Department of Environment and Heritage, Nitrogen Dioxide (NO2) Air Quality fact sheet (2005) Department of Environment and Energy, Australian Government <http://www.environment.gov.au/protection/publications/factsheet-nitrogen-dioxide-no2>.
30. See eg, National Environment Protection Council, Draft Variation to the National Environment Protection (Ambient Air Quality) Measure Impact Statement (July 2014) Department of Environment and Energy, Australian Government <http://www.environment.gov.au/protection/nepc/nepms/ambient-air-quality/variation-2014/impact-statement> and Department of Infrastructure and Transport, Final Regulation Impact Statement for Review of Euro 5/6 Light Vehicle Emissions Standards (November 2010) Department of Infrastructure and Regional Development, Australian Government 55-57 <http://www.infrastructure.gov.au/roads/environment/files/Final_RIS_Euro_5_and_6_Light_Vehicle_Emissions_Review.pdf>.
31. Woolcock Institute of Medical Research, Centre for Air Quality and Health Research and Evaluation (CAR), Review of the health impacts of emission sources, types and levels of particulate matter air pollution in ambient air in NSW. Produced for NSW Environment Protection Authority and NSW Ministry of Health, Environmental Health Branch, December 2015.
77
Environmental Justice Australia

32. NSW Environmental Protection Authority and Office of Environment and Heritage, State of New South Wales , ‘Consultation Paper: Clean Air for NSW’ , (Consultation Paper No 0415, State of NSW, October 2016,) 29 <http://www.epa.nsw.gov.au/resources/air/clean-air-nsw-160415.pdf>.
33. Ali Al-Saffar et al, ‘Energy and Air Pollution: World Energy Outlook Special Report’ (Report, International Energy Agency, 2016) pinpoint <https://www.International Energy Agency.org/publications/freepublications/publication/WorldEnergyOutlook SpecialReport2016EnergyandAirPollution.pdf>.
34. National standards for sulphur dioxide, nitrogen dioxide, PM10, PM2.5, Ozone, Carbon Monoxide and Lead are found in the National Environment Protection Measure (Ambient Air Quality).
35. New Acland Coal Pty Ltd v Ashman & Ors and Chief Executive, Department of Environment and Heritage Protection (No. 4) [2017] QLC 24.
36. Protection of the Environment Operations Act 1997 (NSW); Environment Protection Act 1979 (Vic); Environmental Protection Act 1994 (Qld).
37. For example, the Latrobe Valley is identified as an Air Quality Control Region in Victorian air quality management law. See State Environment Protection Policy (Air Quality Management) cls 29-32 (Management of Air Quality in Control Regions). All Queensland power stations have pollution requirements in special legislation as well as their licences.
38. Australian Government Department of Environment and Energy, Mercury and Compounds National Pollutant Inventory <http://www.npi.gov.au/resource/mercury-compounds>.
39. The Victorian State Environment Protection Policy (Air Quality Management) has a maximum limit of 10000 ug/m3 for mercury and other toxics combined for stationary emissions sources such as power stations which is clearly excessive.
40. Neil Hime, Christine Cowie and Guy Marks, Woolcock Institute of Medical Research, Centre for Air Quality and Health Research and Evaluation (CAR), ‘Review of the health impacts of emission sources, types and levels of particulate matter air pollution in ambient air in NSW: Produced for NSW Environment Protection Authority and NSW Ministry of Health’ (Report, Woolcock Institute of Medical Research, Centre for Air Quality and Health Research and Evaluation (CAR), December 2015) <http://www.car-cre.org.au/images/content/Health%20impacts%20of%20PM%20report_final%20for%20web.pdf>.
41. All NSW power station licences direct the licencee to report to the NSW EPA if sulfur dioxide at any time exceeds 600ppm, despite their being no direct limit on those emissions and therefore no penalty if that level is exceeded. Power stations appear to try to remain under that limit though, to avoid having to report to the EPA.
42. Joint WHO/Convention Task Force on Health Aspects of Air Pollution, ‘Health Effects of Particulate Matter: Policy Implications for countries in eastern Europe, Caucasus and central Asia’ (Research Paper, World Health Organization, 2013). <http://www.euro.who.int/__data/assets/pdf_file/0006/189051/Health-effects-of-particulate-matter-final-Eng.pdf>.
43. National Environment Protection Council, Draft Variation to the National Environment Protection (Ambient Air Quality) Measure Impact Statement, (July 2014) p.xviii
44. Power station licences in Victoria, NSW and Queensland require monitoring of ‘particles’, ‘total solid particles’ or ‘undifferentiated particles’ which includes PM10 and PM50 as well as PM2.5.
45. National Environment Protection Council, Draft Variation to the National Environment Protection (Ambient Air Quality) Measure Impact statement July 2014. <http://www.environment.gov.au/protection/nepc/nepms/ambient-air-quality/variation-2014/impact-statement>
46. International Energy Agency Clean Coal Centre, Emission standards and control of PM2.5 from coal-fired power plant, July 2016.
47. Christian Shcaible et al, ‘Lifting Europe’s Dark Cloud’ (Research Report, European Environmental Bureau, Climate Action Network, HEAL, WWF, Sandbag, October 2016) 9 <http://www.caneurope.org/docman/coal-phase-out/3033-lifting-europe-s-dark-cloud-how-cutting-coal-saves-lifes-1/file> .
48. Presentation by NSW EPA Regional Director (North) Adam Gilligan at community workshop, Wyee NSW, 19 April 2017.
49. Christian Shcaible et al, ‘Lifting Europe’s Dark Cloud’ (Research Report, European Environmental Bureau, Climate Action Network, HEAL, WWF, Sandbag, October 2016) 9 <http://www.caneurope.org/docman/coal-phase-out/3033-lifting-europe-s-dark-cloud-how-cutting-coal-saves-lifes-1/file> .
50. Bobby Magill, Flurry of Coal Power Plant Shutdowns Expected by 2016 (19 February 2014) Climate Central <http://www.climatecentral.org/news/flurry-of-coal-power-plant-shutdowns-expected-by-2016-17086>; James Bruggers, ‘LG&E power plants slash toxic-air pollution’, Courier Journal (online), 18 January 2017 <http://www.courier-journal.com/story/tech/science/environment/2017/01/18/lge-power-plants-slash-toxic-air-pollution/96710364/>
51. Sulfur dioxide (SO2) and rain or water vapour (H2O) react to form sulfuric acid (H2SO4), which is highly corrosive to metal and to skin, eyes, throat, mouth and mucus membranes.
52. International Energy Agency Clean Coal Centre, ‘Executive Summary: Emission standards and control of PM2.5 from coal-fired power plant’ (Report No 37, International Energy Agency Clean Coal Centre, July 2016) pinpoint <http://www.International Energy Agency-coal.org.uk/documents/83882/9684/Emission-standards-and-control-of-PM2.5-from-coal-fired-power-plant,-CCC/267>.
53. Pers comm NSW EPA via email dated 30 June 2017.
54. Pers Comm, former employee at Bayswater power station, April 2017. Also reported in Peter Hannam, ‘Bayswater power station’s pollution masking lasted decades, documents show’, Sydney Morning Herald (online), 14 May 2017 <http://www.smh.com.au/environment/bayswater-power-stations-pollution-masking-lasted-decades-documents-show-20170514-gw4k0o.html>.
55. Peter Hannam, ‘Bayswater power station’s pollution masking lasted decades, documents show’, Sydney Morning Herald (online), 14 May 2017 <http://www.smh.com.au/environment/bayswater-power-stations-pollution-masking-lasted-decades-documents-show-20170514-gw4k0o.html>.
56. See Welcome to the Latrobe Valley Air Monitoring Network (LVAMN) website, Latrobe Valley Air Monitoring Network 2017 <http://lvamninc.com.au/>.
57. Protection of the Environment Operations Act 1997 (NSW) s 66(1)
58. Pers comm, Engie representative, letter dated 19 May 2017.
59. Pers comm, Engie representative, letter dated 19 May 2017.
60. EPA conducts National Pollutant Inventory audit of Latrobe Valley power generators (15 April 2016) Environmental Protection Authority Victoria <http://www.epa.vic.gov.au/about-us/news-centre/news-and-updates/news/2016/april/15/epa-conducts-npi-audit-of-latrobe-valley-power-generators>.
61. Pers comm EPA Victoria representative via email 7 July 2017.
62. Peter Hannam, ‘’Mindblowing’: NSW EPA probes over pollution claims’, Sydney Morning Herald (online), 14 May 2017 <http://www.smh.com.au/environment/mindblowing-nsw-epa-probes-coalfired-power-plants-over-pollution-claims-20170510-gw26lb.html>.
63. Tom Biegler, ‘The Hidden Costs of Electricity: Externalities of Power Generation in Australia’ (Report, Australian Academy of Technological Sciences and Engineering, March 2009) <www.atse.org.au/Documents/Publications/Reports/Energy/ATSE%20Hidden%20Costs%20Electricity%202009.pdf>.
64. Doctors for the Environment Australia, Submission to NSW EPA, Review of the load-based licensing scheme, December 2016, <https://www.dea.org.au/images/uploads/submissions/NSW_-_Review_of_the_load-based_licensing_scheme_submission_12-16.pdf>.
65. International Energy Agency Clean Coal Centre, ‘Executive Summary: Emission standards and control of PM2.5 from coal-fired power plant’ (Report No 37, International Energy Agency Clean Coal Centre, July 2016). <http://www.International Energy Agency-coal.org.uk/documents/83882/9684/Emission-standards-and-control-of-PM2.5-from-coal-fired-power-plant,-CCC/267>.
66. Leon Walker, Wet Scrubbing ‘Most Versatile, Cost Effective Air Pollution Control, (21 January 2014) Environmental Leader <https://www.environmentalleader.com/2014/01/wet-scrubbing-most-versatile-cost-effective-air-pollution-control/ >.
78
Environmental Justice Australia

67. Clean Air Technology Center, Technical Bulletin: Nitrogen Oxides (NOx), Why and How They are Controlled (1999) United States Environmental Protection Agency <https://www3.epa.gov/ttncatc1/dir1/fnoxdoc.pdf>.
68. Pratik Mehta, ‘Comparison of Fabric Filters and Electrostatic Precipitators for Coal-Fired Thermal Plants to Achieve Stringent Particulate Emissions Limits’ (Paper presented at POWER-GEN Asia Conference, Bangkok, 2 October 2013). <http://pennwell.sds06.websds.net/2013/bangkok/pga/papers/T2S5O3-paper.pdf>.
69. Power station operators that did not respond were Delta Electricity (Vales Point), AGL (for Loy Yang A), the Queensland Government’s Stanwell Corporation (Stanwell) and NRG Gladstone (Gladstone)
70. Ben Caldecott, Gerard Dericks and James Mitchell, ‘Subcritical Coal in Australia: Risks to Investors and Implications for Policymakers’ (Working Paper, Smith School of Enterprise and the Environment, Oxford University, March 2015) 6 <http://www.smithschool.ox.ac.uk/research-programmes/stranded-assets/Subcritical%20Coal%20in%20Australia_Investors&Policymakers.pdf>.
71. See for example Lynette Molyneaux, ‘Is Clean Coal Power the Answer the Australia’s Emissions Targets?’ (25 January 2017) The Conversation <http://theconversation.com/is-clean-coal-power-the-answer-to-australias-emissions-targets-71785>
72. Lauri Myllyvirta, How much do ultra-critical coal plants really reduce air pollution? (22 June 2017) RenewEconomy <http://reneweconomy.com.au/how-much-do-ultra-supercritical-coal-plants-really-reduce-air-pollution-70678/>.
73. Lauri Myllyvirta, How much do ultra-critical coal plants really reduce air pollution? (22 June 2017) RenewEconomy <http://reneweconomy.com.au/how-much-do-ultra-supercritical-coal-plants-really-reduce-air-pollution-70678/>.
74. NSW EPA has a searchable public register which has some enforcement information. Go to – Environmental Protection Authority New South Wales 2017, Search for Environment protection licences, applications, notices audits or pollution studies and reduction programs <http://www.epa.nsw.gov.au/prpoeoapp/>.
75. Numerous Queensland annual compliance reports state that a breach occurred and was reported the regulator, but do not state what it was, making it impossible for the community to know what breaches are occurring. See eg, Gladstone power station reports from 2013 to 2016. The Department of Environment and Heritage Protection is the Queensland regulator.
76. Millmeran and Tarong power stations.
77. Hazelwood Annual Performance Statement to the EPA 2012-2013.
78. ENGIE, ‘Hazelwood Dredger 24 fire’ (Media statement, 22 August 2016) <http://www.gdfsuezau.com/media/newsitem/Hazelwood-mine-Dredger-24-fire>; ENGIE, ‘Raw coal bunker incident at Hazelwood power station’ (Media statement, 24 May 2016) <http://www.gdfsuezau.com/media/newsitem/Raw-coal-bunker-incident-at-Hazelwood-power-station>.
79. Hazelwood Annual Performance Statements to the EPA 2011-2012, 2012-2013, 2015-2016.
80. Hazelwood Annual Performance Statements to the 2011-2012, 2012-2013, 2014-2015, 2015-16.
81. EPA Victoria compliance and enforcement search: Remedial notices and directions (1 July 2016) Environmental Protection Authority Victoria <http://www.epa.vic.gov.au/our-work/compliance-and-enforcement/remedial-notices-and-directions>.
82. Environmental Protection Authority Victoria, ‘EPA fines Energy Australia for ash slurry spill’ (Media Statement, 28 July 2015) <http://www.epa.vic.gov.au/about-us/news-centre/news-and-updates/news/2015/july/28/epa-fines-energy-australia-for-ash-slurry-spill>.
83. Yallourn Annual Performance Statement to the EPA 2014-2015 and Environmental Protection Authority Victoria, ‘EPA fines Energy Australia for ash slurry spill’ (Media Statement, 28 July 2015) <http://www.epa.vic.gov.au/about-us/news-centre/news-and-updates/news/2015/july/28/epa-fines-energy-australia-for-ash-slurry-spill>.
84. Golder Associates, ‘Yallourn Landfills, 53V Audit, Yallourn Ash Landfill, Hard Waste Landfill and Asbestos Landfill’ (Audit Report No 117616111-015-R-Rev3, Golder Associates, 17 September 2015) < http://apps.epa.vic.gov.au/EnvAuditFiles/53V/71329-2/71329-2_c.pdf>.
85. EPA Victoria, Pollution Abatement Notice 24/01/2017 Notice ID: 90007403.
86. EPA Victoria, Pollution Abatement Notice 24/01/2017 Notice ID: 90007403, 90007404 and 90007405.
87. EPA Victoria has charged four companies with offences in relation to the Hazelwood mine fire, however it is in relation to the mine not the power station and the case has not yet been heard.
88. ‘Millions to fix disaster at Eraring power station’, The Daily Telegraph (online), 29 October 2011 <http://www.dailytelegraph.com.au/news/nsw/millions-to-fix-disaster-at-eraring-power-station/news-story/477dd6fb5e99d20704012b1fb33186ad>.
89. NSW EPA POEO public register for licence 1429 annual returns non-compliance list 2011/2012.
90. Environment Protection Authority NSW, ‘Compliance Audit Program: Coal Ash Dams And Emplacements Final Compliance Audit Report Eraring Energy Eraring Power Station EPL 1429’ (Report No 2017/0276, NSW EPA, May 2016) <http://www.epa.nsw.gov.au/resources/complianceaudits/EnvironmentcompliancereportCoalashdams170276.pdf>.
91. Environment Protection Authority NSW, ‘Compliance Audit Program: Coal Ash Dams And Emplacements Final Compliance Audit Report Eraring Energy Eraring Power Station EPL 1429’ (Report No 2017/0276, NSW EPA, May 2016) <http://www.epa.nsw.gov.au/resources/complianceaudits/EnvironmentcompliancereportCoalashdams170276.pdf>.
92. Scott Bevan, ‘Lakepower station dust fine slammed as not enough’, Newcastle Herald (online), 7 February 2017 <http://www.theherald.com.au/story/4452383/dust-fine-for-eraring-criticised/>.
93. Licence Summary: Summary Licence No: 761, NSW Environmental Protection Authority <http://www.epa.nsw.gov.au/prpoeoapp/Detail.aspx?id=761&option=licence&range=POEO%20licence&searchrange=audit >.
94. Licence Summary: Summary Licence No: 761, NSW Environmental Protection Authority <http://www.epa.nsw.gov.au/prpoeoapp/Detail.aspx?id=761&option=licence&range=POEO%20licence&searchrange=audit >.
95. Vales Point Power Station Monitoring Data (24 August 2016) Delta Electricity <http://www.de.com.au/Environment/Environmental-Licences---Monitoring/Vales-Point-Power-Station-Monitoring-Data/default.aspx>.
96. Licence Summary: Summary Licence No: 761, Environmental Protection Authority New South Wales <http://www.epa.nsw.gov.au/prpoeoapp/Detail.aspx?instid=761&id=761&option= licence&searchrange=licence&range=POEO%20licence&prp=no&status=Issued>.
97. See eg, Jackie Pearson, ‘Environmental Justice Australia calls on EPA to act on serious air pollution at Vales Point’, Coast Community News (online), 28 February 2017 <http://coastcommunitynews.com.au/2017/02/environmental-justice-australia-calls-on-epa-to-act-on-serious-air-pollution-at-vales-point/>
98. ‘Delta Electricity strongly rejects any pollution claims’, Community Coast News (online) 16 March 2017 <https://coastcommunitynews.com.au/2017/03/delta-electricity-strongly-rejects-any-pollution-claims/>.
99. Engie Hazelwood Mine Rehabilitation and Power Station Decommissioning Community Consultation Session, Morwell, 14 June 2017.
100. Engie Hazelwood Mine Rehabilitation and Power Station Decommissioning Community Consultation Session, Morwell, 14 June 2017.
101. Pers comm, Hazelwood rehabilitation manager, 14 June 2017.
102. Hazelwood Information Meeting (14 June 2017) ENGIE <http://www.gdfsuezau.com/media/UploadedDocuments/Hazelwood%20Closure/Community%20Consultation%20June%202017/Community%20Information%20Presentation%20June%202017.pdf>.
103. For Mount Piper see EnergyAustralia addressing findings of EPA ash dam audit (11 October 2016) Energy Australia <https://www.energyaustralia.com.au/about-us/media/news/energyaustralia-addressing-findings-epa-ash-dam-audit>.
79
Environmental Justice Australia

104. EnergyAustralia responds to waste discharge incident (29 July 2015) EnergyAustralia <https://www.energyaustralia.com.au/about-us/media/news/energyaustralia-responds-waste-discharge-incident>.
105. Golder Associates, ‘Yallourn Landfills, 53V Audit, Yallourn Ash Landfill, Hard Waste Landfill and Asbestos Landfill’ (Audit Report No 117616111-015-R-Rev3, Golder Associates, 17 September 2015) pinpoint <http://apps.epa.vic.gov.au/EnvAuditFiles/53V/71329-2/71329-2_c.pdf>.
106. Golder Associates, ‘Yallourn Landfills, 53V Audit, Yallourn Ash Landfill, Hard Waste Landfill and Asbestos Landfill’ (Audit Report No 117616111-015-R-Rev3, Golder Associates, 17 September 2015) pinpoint <http://apps.epa.vic.gov.au/EnvAuditFiles/53V/71329-2/71329-2_c.pdf>.
107. Priority Sites Register (31 May 2017) Environmental Protection Authority Victoria <http://www.epa.vic.gov.au/your-environment/land-and-groundwater/priority-sites-register>.
108. Pers comm EPA Victoria representative, email 7 July 2017.
109. ‘Port Augusta’s coal-fired power station closes in South Australia’, ABC News (online), 10 May 2016 <http://www.abc.net.au/news/2016-05-09/port-augustas-coal-fired-power-station-closes/7394854>.
110. Port Augusta Power Stations Site (Flinders Power) Environmental Protection Authority South Australia <http://www.epa.sa.gov.au/business_and_industry/industry-updates/flinders-power-port-augusta>.
111. ‘Ash plume from Port Augusta’s former power station a cause for concern, EPA warns’, ABC News (online), 3 January 2017 <http://www.abc.net.au/news/2017-01-03/port-augusta-residents-hit-by-ash-should-be-worried-epa-warns/8158380 >.
112. Port Augusta Power Stations Site (Flinders Power) Environmental Protection Authority South Australia <http://www.epa.sa.gov.au/business_and_industry/industry-updates/flinders-power-port-augusta>.
113. See eg, the Mineral Resources (Sustainable Development) Act 1990 (Vic) s 80.
114. Pers comms, EPA Victoria to EJA, 1 June 2017.
115. Nicole Asher, ‘Hazelwood rehabilitation estimated to cost $743 million but may rise, Engie says’, ABC News (online), 20 January 2017 <http://www.abc.net.au/news/2017-01-20/hazelwood-rehabilitation-to-cost-743-million-engie-says/8197784>.
116. Statement of Reasons to require further rehabilitation bonds from the Latrobe Valley coal mines (2017) Earth Resources <http://earthresources.vic.gov.au/earth-resources-regulation/information-for-community-and-landholders/mining-and-extractives/latrobe-valley-coal-mines/latrobe-valley-coal-mines-bonds/second-statement-of-reasons >.
117. Victorian Government, Department of Economic Development, Jobs, Transport and Resources website <http://earthresources.vic.gov.au/earth-resources/hazelwood/hazelwood-mine-fire-inquiry-implementation-plan>
118. Environmental Protection Act 1970 (Vic) ss 67C(1), 61(1).
119. Environmental Protection Act 1970 (Vic) ss 67c(1), 62B(2).
120. In agreement with Loy Yang A power station, Loy Yang B discharges its wastewater to the Loy Yang A settling bond and ashing wastes to the Loy Yang Ash Pond. Thus Loy Yang A attracts the financial assurance on its licence whereas the Loy Yang B does not. Hazelwood and Anglesea power stations are now closed.
121. See Environment Protection Act 1970 (Vic) s 67B; Environment Protection (Scheduled premises and Exemptions) Regulations 2007 (Vic) sch 1 – Scheduled Premises Table A05 (Landfills).
122. Environment Protection Authority Victoria, ‘Calculation of financial assurance for landfills, Prescribed Industrial Waste management (PIW) and container washing’ (Guideline Publication No 1596, Environmental Protection Authority Victoria, April 2016) <http://www.epa.vic.gov.au/~/media/Publications/1596.pdf>.
123. Pers comm EPA Victoria representative, 24 May 2017.
124. Environmental Protection Act 1994 (QLD) s 292(1).
125. Environmental Protection Act 1994 (QLD) s 292(2).
126. Environmental Protection Act 1994 (QLD) s 262(1)(d).
127. See Gladstone Power Station Agreement Act 1993 (QLD) sch 2, pt E - Ash Disposal. EJA requested a copy of the Gladstone Ash Management Agreement from the power station but did not receive a response.
128. Per comms, Department of Environment and Heritage Protection to EJA, 15 June 2017.
129. Protection of the Environment Operations Act 1997 (NSW) s 296(1).
130. Protection of the Environment Operations Act 1997 (NSW) s 72.
131. Census 2016 (11 July 2017) Australian Bureau of Statistics <http://www.abs.gov.au/websitedbs/D3310114.nsf/Home/Census?opendocument&navpos=200>.
132. Census 2016 (11 July 2017) Australian Bureau of Statistics <http://www.abs.gov.au/websitedbs/D3310114.nsf/Home/Census?opendocument&navpos=200>.
133. Vales Point (3 September 2013) Delta Electricity <http://www.de.com.au/About-Us/Power-Stations/Vales-Point/default.aspx>.
134. Licence Summary, Summary Licence No: 761, Environmental Protection Authority NSW <http://www.epa.nsw.gov.au/prpoeoapp/Detail.aspx?instid=761&id=761&option=licence&search range=licence&range=POEO%20licence&prp=no&status=Issued>.
135. Ben Potter, ‘NSW government sells Vales Point power station for $1m’, Australian Financial Review (online), 19 November 2015 <http://www.afr.com/business/mining/coal/nsw-govt-sells-vales-point-power-station-for-1m-20151119-gl2uxn#ixzz4YBOk0H2X>.
136. Vales Point Power Station Monitoring Data (24 August 2016) Delta Electricity <http://www.de.com.au/Environment/Environmental-Licences---Monitoring/Vales-Point-Power-Station-Monitoring-Data/default.aspx>.
137. 2015/2016 report for DELTA ELECTRICITY, Vales Point Power Station – Mannering Park NSW (31 March 2017) National Pollutant Inventory <http://www.npi.gov.au/npidata/action/load/individual-facility-detail/criteria/year/2016/browse-type/Company/reg-business-name/DELTA%2BELECTRICITY/jurisdiction-facility/106>.
138. Georgia Osland, ‘Chain Valley, Mannering Valley collieries’ mining limits increased’, Lakes Mail (online), 15 January 2016 <http://www.lakesmail.com.au/story/3666206/mining-boom-for-lake/>.
139. Census 2016 (11 July 2017) Australian Bureau of Statistics <http://www.abs.gov.au/websitedbs/D3310114.nsf/Home/Census?opendocument&navpos=200>.
140. Census 2016 (11 July 2017) Australian Bureau of Statistics <http://www.abs.gov.au/websitedbs/D3310114.nsf/Home/Census?opendocument&navpos=200>.
141. Generation (2017) Origin Energy <https://www.originenergy.com.au/about/who-we-are/what-we-do/generation.html>.
142. Mark Ludlow, ‘Origin Energy to shut Eraring, ditch coal assets’, Newcastle Herald (online), 21 October 2015 <http://www.theherald.com.au/story/3436819/origin-energy-to-shut-eraring-ditch-coal-assets/>.
143. Licence Summary, Summary Licence No: 1429 (2017) Environment Protection Authority NSW <http://www.epa.nsw.gov.au/prpoeoapp/Detail.aspx?instid=1429&id=1429&option= licence&searchrange=licence&range=POEO%20licence&prp=no&status=Issued>.
144. Sean Nicholls, ‘Taxpayers out of pocket as state-owned power station sold for $50m’, Sydney Morning Herald (online), 1 July 2013 <http://www.smh.com.au/nsw/taxpayers-out-of-pocket-as-stateowned-power-station-sold-for-50m-20130701-2p6hu.html>.
145. 2015 Report for ORIGIN ENERGY ERARING PTY LIMITED, Eraring Power Staton –Eraring, NSW (31 March 2017) National Pollutant Inventory <http://www.npi.gov.au/npidata/action/load/individual-facility-detail/criteria/year/2016/browse-type/Company/reg-business-name/ORIGIN%2BENERGY%2BERARING% 2BPTY%2BLIMITED/jurisdiction-facility/226>.
146. ‘Lake MP calls for air quality monitors’, ABC News (online), 27 February 2013 <http://www.abc.net.au/news/2013-02-27/lake-mp-calls-for-air-quality-monitors/4543442>.
147. David Stewart, ‘Scientis calls for Eraring power station to be shut down ahead of schedule over black particle emission concerns’, Lakes Mail (online), 21 October 2016 <http://www.lakesmail.com.au/story/4242686/scientist-calls-for-eraring-power-station-to-be-shut-down-ahead-of-schedule/>.
148. Scott Bevan, ‘Lake power station dust fine slammed as not enough’, Newcastle Herald (online), 7 February 2017 <http://www.theherald.com.au/story/4452383/dust-fine-for-eraring-criticised/>.
80
Environmental Justice Australia

149. Census 2016 (11 July 2017) Australian Bureau of Statistics <http://www.abs.gov.au/websitedbs/D3310114.nsf/Home/Census?opendocument&navpos=200>.
150. Census 2016 (11 July 2017) Australian Bureau of Statistics <http://www.abs.gov.au/websitedbs/D3310114.nsf/Home/Census?opendocument&navpos=200>.
151. AGL Macquarie, AGL <https://www.agl.com.au/about-agl/how-we-source-energy/thermal-energy/agl-macquarie>.
152. AGL Greenhouse Gas Policy (17 April 2015) AGL <https://cdn.fairfaxregional.com.au/lounews/www.agl.com.au_-_media_AGL_About%20AGL_Documents_Media%20Center_Corporate%20Governance%20Policies%20Charter_1704015_GHG_Policy_Final.pdf>.
153. Licence Summary: Summary Licence No: 779, Environmental Protection Authority NSW <http://www.epa.nsw.gov.au/prpoeoapp/Detail.aspx?instid=779&id=779&option= licence&searchrange=licence&range=POEO%20licence&prp=no&status=Issued>.
154. Doctors for the Environment Australia, ‘Doctors Call for Stricter pollution licence fee system to protect health’ (Press release, 15 May 2017) <http://reneweconomy.com.au/doctors-call-stricter-pollution-license-fee-system-protect-health-93840/>.
155. Pers comm NSW EPA representative, email dated 4 May 2017.
156. 2015/2016 report for AGL MACQUARIE PTY LIMITED, Bayswater Power Station –Muswellbrook, NSW (31 March 2017) National Pollutant Inventory <http://www.npi.gov.au/npidata/action/load/individual-facility-detail/criteria/year/2016/browse-type/Company/reg-business-name/AGL%2BMACQUARIE%2BPTY%2BLIMITED/jurisdiction-facility/37>.
157. Environmental Protection Authority NSW, ‘AGL Macquarie Pty Ltd fined $15,000 by the NSW EPA’ (Media release, 18 August 2015) <http://www.epa.nsw.gov.au/epamedia/EPAMedia18081501.htm>.
158. Environmental Protection Authority NSW, ‘EPA fines Macquarie AGL for water pollution’ (Media release, 8 January 2016) <http://www.epa.nsw.gov.au/epamedia/EPAMedia16010801.htm>; ‘AGL Macquarie fined over pollution incident’, ABC News (online), 9 January 2016 <http://www.abc.net.au/news/2016-01-09/agl-macquarie-fined-over-pollution-incident/7077864>.
159. Environmental Protection Authority NSW, ‘EPA fines AGL Macquarie $15,000 for fly ash spill’ (Media release, 31 March 2016) <http://www.epa.nsw.gov.au/epamedia/EPAMedia16033101.htm>.
160. Behind the Greenwash, Dirty AGL <http://dirtyagl.com/behind-the-greenwash/>.
161. Peter Hannam, ‘Bayswater power station’s pollution masking lasted decades, documents show’, Sydney Morning Herald (online), 14 May 2017 <http://www.smh.com.au/environment/bayswater-power-stations-pollution-masking-lasted-decades-documents-show-20170514-gw4k0o.html> and Peter Hannam, ‘’Mindblowing’: NSW EPA probes over pollution claims’, Sydney Morning Herald (online), 14 May 2017 <http://www.smh.com.au/environment/mindblowing-nsw-epa-probes-coalfired-power-plants-over-pollution-claims-20170510-gw26lb.html>.
162. Census 2016 (11 July 2017) Australian Bureau of Statistics <http://www.abs.gov.au/websitedbs/D3310114.nsf/Home/Census?opendocument&navpos=200>.
163. Census 2016 (11 July 2017) Australian Bureau of Statistics <http://www.abs.gov.au/websitedbs/D3310114.nsf/Home/Census?opendocument&navpos=200>.
164. AGL Macquarie, AGL <https://www.agl.com.au/about-agl/how-we-source-energy/thermal-energy/agl-macquarie>.
165. AGL Greenhouse Gas Policy (17 April 2015) AGL <https://cdn.fairfaxregional.com.au/lounews/www.agl.com.au_-_media_AGL_About%20AGL_Documents_Media%20Center_Corporate%20Governance%20Policies%20Charter_1704015_GHG_Policy_Final.pdf>.
166. Giles Parkinson, AGL shuts down Liddell coal-fired power station units for repairs (21 March 2016) RenewEconomy <http://reneweconomy.com.au/agl-shuts-down-liddell-coal-fired-power-station-units-for-repairs-12915/>.
167. Licence Summary, Summary Licence No: 2122, Environmental Protection Authority NSW <http://www.epa.nsw.gov.au/prpoeoapp/Detail.aspx?instid=2122&id=2122& option=licence&searchrange=licence&range=POEO%20
licence&prp=no&status=Issued >.
168. Giles Parkinson, The 2,000MW coal generator the NSW government sold for $0 (20 August 2014) RenewEconomy <http://reneweconomy.com.au/the-2000mw-coal-generator-the-nsw-government-sold-for-0-59474/>.
169. 2015/2016 report for AGL MACQUARIE PTY LIMITED, Liddell Power Station –Muswellbrook, NSW (31 March 2017) National Pollutant Inventory < http://www.npi.gov.au/npidata/action/load/individual-facility-detail/criteria/year/2016/browse-type/Company/reg-business-name/AGL%2BMACQUARIE%2BPTY%2BLIMITED/jurisdiction-facility/151 >.
170. AGL, ‘ASX Release AGL Annual Report 2015’ (Report, AGL, 26 August 2015) <https://www.agl.com.au/-/media/AGL/About-AGL/Documents/Investor-Centre/150826_AnnualReport_1466512.pdf?la=en>; NSW EPA POEO public register for licence 2122 annual returns non-compliance list.
171. AGL, ‘ASX Release AGL Annual Report 2015’ (Report, AGL, 26 August 2015) <https://www.agl.com.au/-/media/AGL/About-AGL/Documents/Investor-Centre/150826_AnnualReport_1466512.pdf?la=en>; NSW EPA POEO public register for licence 2122 annual returns non-compliance list.
172. AGL, ‘ASX Release AGL Annual Report 2015’ (Report, AGL, 26 August 2015) pinpoint <https://www.agl.com.au/-/media/AGL/About-AGL/Documents/Investor-Centre/150826_AnnualReport_1466512.pdf?la=en>; EPA NSW POEO public register for licence 2122 annual returns non-compliance list; AGL Macquarie, AGL <https://www.agl.com.au/about-agl/how-we-source-energy/thermal-energy/agl-macquarie>.
173. ‘Controversy over Lake Liddell closure near Muswellbrook’, Muswellbrook Chronicle (online), 13 August 2016 <http://www.muswellbrookchronicle.com.au/story/4093815/action-group-calls-on-agl-to-close-liddell-power-station-after-poisoned-lake-debacle/>; Rod Thompson, ‘Brain-Eating virus forces lake closure’, Newcastle Herald (online), 12 August 2016 <http://www.theherald.com.au/story/4093667/brain-eating-virus-forces-lake-closure/>.
174. Joanne McCarthy, ‘Liddell and Bayswater power station sales have left hidden legacies’, Newcastle Herald (online), 12 July 2017 < http://www.theherald.com.au/story/4482305/liddell-and-the-legacy/>.
175. Census 2016 (11 July 2017) Australian Bureau of Statistics <http://www.abs.gov.au/websitedbs/D3310114.nsf/Home/Census?opendocument&navpos=200>.
176. Census 2016 (11 July 2017) Australian Bureau of Statistics <http://www.abs.gov.au/websitedbs/D3310114.nsf/Home/Census?opendocument&navpos=200>.
177. Mt Piper Power Station, Energy Australia <https://www.energyaustralia.com.au/about-us/energy-generation/mt-piper-power-station>.
178. Gay Alcorn and Kate Stanton, ‘What will fill the hole left by coal?’, The Guardian (online) 29 June 2016 <https://www.theguardian.com/australia-news/2016/jun/29/what-will-fill-the-hole-left-by-coal>.
179. Gavin Coote, ‘Future of coal-fired power generation in Lithgow goes under the spotlight at Senate inquiry’, ABC News (online), 23 February 2017 <http://www.abc.net.au/news/2017-02-23/future-of-coal-fired-power-generation-in-lithgow-under-spotlight/8296162>.
180. Sean Nicholls, ‘Power stations sold off in $160m deal’, Sydney Mornign Herald (online), 25 July 2013 <http://www.smh.com.au/nsw/power-stations-sold-off-in-160m-deal-20130725-2qngo.html>.
181. 2015/2016 report for ENERGYAUSTRALIA NSW PTY LT, Mount Piper Power Station –Portland, NSW (31 March 2017) National Pollutant Inventory <http://www.npi.gov.au/npidata/action/load/individual-facility-detail/criteria/state/NSW/year/2016/jurisdiction-facility/104>.
182. Gavin Coote, ‘Future of coal-fired power generation in Lithgow goes under the spotlight at Senate inquiry’, ABC News (online), 23 February 2017 <http://www.abc.net.au/news/2017-02-23/future-of-coal-fired-power-generation-in-lithgow-under-spotlight/8296162>.
183. Alison Branley, ‘Court Decision allowing Springvale mine to release wastewater into Sydney’s catchment appealed’, ABC News (online), 2 November 2016 <http://www.abc.net.au/news/2016-11-02/ruling-to-allow-mine-wastewater-into-nsw-catchment-appealed/7990574>.
184. Current Cases, Environmental Defender’s Office NSW <http://www.edonsw.org.au/current_cases>.
81
Environmental Justice Australia

185. Census 2016 (11 July 2017) Australian Bureau of Statistics <http://www.abs.gov.au/websitedbs/D3310114.nsf/Home/Census?opendocument&navpos=200>.
186. NRG Gladstone Power Station, NRG Gladstone Power Station <http://www.nrggos.com.au/>.
187. 2015/2016 report for NRG GLADSTONE OPERATING SERVICES PTY LTD, Gladstone Power Station – Gladstone, QLD (31 March 2017) National Pollutant Inventory <http://www.npi.gov.au/npidata/action/load/individual-facility-detail/criteria/year/2016/browse-type/Company/reg-business-name/NRG%2BGLADSTONE%2BOPERATING%2BSERVICES% 2BPTY%2BLTD/jurisdiction-facility/Q019NRG001>
188. Hourly Air Quality data (13 July 2017) Department of Environment and Heritage Protection, Queensland Government <https://www.ehp.qld.gov.au/air/data/search.php>.
189. Chris Lees, ‘Who cares about the southern ‘latte sippers,’ bring a coal-fired power station here’, CQ News (online), 3 May 2017 <https://www.cqnews.com.au/news/who-cares-about-the-southern-latte-sippers-bring-a/3173260/>.
190. 2016 Census Quickstats: Rockhampton (12 January 2017) Australian Bureau of Statistics <http://www.censusdata.abs.gov.au/census_services/getproduct/census/2016/quickstat/Local Government Area36370?opendocument>.
191. Coal (2017) Stanwell <http://www.stanwell.com/energy-assets/our-power-stations/coal/>.
192. Sharyn O’Neill, ‘$53m power station overhaul a major injection to CQ economy’, The Morning Bulletin (online), 24 June 2017 https://www.themorningbulletin.com.au/news/53m-power-station-overhaul-a-major-injection-to-cq/3193264/.
193. Stanwell Power Station (August 2016) Stanwell <http://www.stanwell.com/wp-content/uploads/FactSheet-Stanwell-AUGUST-2016.pdf>.
194. 2015/2016 report for STANWELL CORPORATION LIMITED, Stanwell Power Station – Gracemere, QLD (31 March 2017) National Pollutant Inventory <http://www.npi.gov.au/npidata/action/load/individual-facility-detail/criteria/year/2016/browse-type/Company/reg-business-name/STANWELL%2BCORPORATION%2BLIMITED/jurisdiction-facility/Q019SCL001>.
195. Sharyn O’Neill, ‘$53m power station overhaul a major injection to CQ economy’, The Morning Bulletin (online), 24 June 2017 <https://www.themorningbulletin.com.au/news/53m-power-station-overhaul-a-major-injection-to-cq/3193264/>.
196. ZeroGen Fact Sheet: Carbon Dioxide Storage Project (30 September 2016) MIT <https://sequestration.mit.edu/tools/projects/zerogen.html>.
197. ZeroGen Fact Sheet: Carbon Dioxide Storage Project (30 September 2016) MIT <https://sequestration.mit.edu/tools/projects/zerogen.html>.
198. Census 2016 (11 July 2017) Australian Bureau of Statistics <http://www.abs.gov.au/websitedbs/D3310114.nsf/Home/Census?opendocument&navpos=200>.
199. Census 2016 (11 July 2017) Australian Bureau of Statistics <http://www.abs.gov.au/websitedbs/D3310114.nsf/Home/Census?opendocument&navpos=200>.
200. AGL Macquarie, AGL <https://www.agl.com.au/about-agl/how-we-source-energy/thermal-energy/agl-macquarie>.
201. ABC Radio National, ‘After Hazelwood, what next for the Latrobe Valley?’, Breakfast, 23 March 2017 (Fran Kelly) <http://www.abc.net.au/radionational/programs/ breakfast/after-hazelwood,-what-next-for-the-latrobe-valley/8378896>.
202. AGL Greenhouse Gas Policy (17 April 2015) AGL <https://cdn.fairfaxregional.com.au/lounews/www.agl.com.au_-_media_AGL_About%20AGL_Documents_Media%20Center_Corporate%20Governance%20Policies%20Charter_1704015_GHG_Policy_Final.pdf>.
203. There are some discrepancies in the reported capacity for Loy Yang A. We took this figure from the operators website - https://www.agl.com.au/ about-agl/how-we-source-energy/thermal-energy/agl-loy-yang
204. Licence: AGL Loy Yang Pty Ltd (13 April 2017) Environment Protection Authority Victoria <https://crm.epa.vic.gov.au/contentserver/contentserver.dll?get&pVersion=0046&contRep=CRMORDER&docId= 005056A072D01EE788826B3E532C312F&compId=Licence %2011149_STATUTORY.PDF&accessMode=r&authId=CN% 3DECP&expiration=99991231235959&secKey=MIH3Bgkqhki G9w0BBwKggekwgeYCAQExCzAJBgUrDgMCGgUAMAs GCSqGSIb3DQEHATGBxjCBwwIBATAZMA4xDDAKBgNV BAMTA0VDUAIHIBIEMAAWVDAJBgUrDgMCGgUAoF0w GAYJKoZIhvcNAQkDMQsGCSqGSIb3DQEHATAcBgkqhki G9w0BCQUxDxcNMTcwNDEzMDYzNTQ2WjAjBgkqhkiG9 w0BCQQxFgQU%2BN%2B%2FPMZVA4iL9Fsp7AXZu2WSIi8 wCQYHKoZIzjgEAwQuMCwCFGyoIMMGbg2C0diZkcmMq CyotCC7AhQ6O3o7cn3Mv960c5DYEZ6LU7p29g%3D%3D >
205. 2015/2016 report for AGL LOY YANG PTY LTD, AGL loy Yand – Traralgon, VIC (31 March 2017) National Pollutant Inventory <http://www.npi.gov.au/npidata/action/load/individual-facility-detail/criteria/year/2016/browse-type/Company/reg-business-name/AGL%2BLOY%2BYANG%2BPTY%2BLTD/jurisdiction-facility/00004339 >.
206. Census 2016 (11 July 2017) Australian Bureau of Statistics <http://www.abs.gov.au/websitedbs/D3310114.nsf/Home/Census?opendocument&navpos=200>.
207. Yallourn Power Station (2017) Energy Australia https://www.energyaustralia.com.au/about-us/energy-generation/yallourn-power-station
208. Mark Ludlow, ‘Social Responsibility to keep coal plant open’, Financial Review (online), 17 November 2016 <http://www.afr.com/news/politics/social-responsibility-to-keep-coal-plant-open-energy-australia-20161116-gsr8cd>.
209. Licence: Energy Australia Yallourn Pty Ltd (19 May 2017) Environment Protection Authority Victoria <https://crm.epa.vic.gov.au/contentserver/contentserver.dll?get&pVersion=0046&contRep= CRMORDER&docId=005056A072D11EE78F8B14BB59BEDAD 1&compId=Licence%2010961_STATUTORY.PDF&accessMode= r&authId=CN%3DECP&expiration=99991231235959&se cKey=MIH4BgkqhkiG9w0BBwKggeowgecCAQExCzAJBgUr DgMCGgUAMAsGCSqGSIb3DQEHATGBxzCBxAIBATAZMA4x DDAKBgNVBAMTA0VDUAIHIBIEMAAWVDAJBgUrDgMC GgUAoF0wGAYJKoZIhvcNAQkDMQsGCSqGSIb3DQEHATAcBg kqhkiG9w0BCQUxDxcNMTcwNTE5MDYwMjE4WjAjBgkqhki G9w0BCQQxFgQU7LXKsVbZk7wcMbV%2FCnaTrEivM6ow CQYHKoZIzjgEAwQvMC0CFEN2tApLfpRYXZIhaosdUYq RBlVUAhUAjWTg1IRya1iE4a3doKjtF%2F5d%2BAk%3D>.
210. EPA Victoria, Pollution Abatement Notice ID: 90007403 dated 24 January 2017.
211. 2015/2016 report for ENERGYAUSTRALIA YALLOURN PTY LTD, EnergyAustralia Yallourn – Yallourn North, VIC (31 March 2017) National Pollutant Inventory <http://www.npi.gov.au/npidata/action/load/individual-facility-detail/criteria/year/2016/browse-type/Company/reg-business-name/ENERGYAUSTRALIA%2BYALLOURN%2BPTY%2BLTD/jurisdiction-facility/00004321>.
212. Golder Associates, ‘Yallourn Landfills, 53V Audit, Yallourn Ash Landfill, Hard Waste Landfill and Asbestos Landfill’ (Audit Report No 117616111-015-R-Rev3, Golder Associates, 17 September 2015) pinpoint < http://apps.epa.vic.gov.au/EnvAuditFiles/53V/71329-2/71329-2_c.pdf>.
213. EPA Victoria, Pollution Abatement Notice ID: 90007405 dated 24 January 2017
214. Melissa Fyfe, ‘Experts missed obvious signs before mine collapse’, Sydney Morning Herald (online), 4 January 2009 <http://www.smh.com.au/national/experts-missed-obvious-signs-before-mine-collapse-20090103-79he.html>.
215. Adam Morton, ‘Yallourn coal mine flood worsens’, The Age (online), 16 July 2012 <http://www.theage.com.au/victoria/yallourn-coal-mine-flood-worsens-20120715-224ef.html>.
216. EnergyAustralia responds to waste discharge incident (29 July 2015) EnergyAustralia <https://www.energyaustralia.com.au/about-us/media/news/energyaustralia-responds-waste-discharge-incident>.
82
Environmental Justice Australia

217. Census 2016 (11 July 2017) Australian Bureau of Statistics <http://www.abs.gov.au/websitedbs/D3310114.nsf/Home/Census?opendocument&navpos=200>.
218. Census 2016 (11 July 2017) Australian Bureau of Statistics <http://www.abs.gov.au/websitedbs/D3310114.nsf/Home/Census?opendocument&navpos=200>.
219. Loy Yang B Power Station, ENGIE <http://www.gdfsuezau.com/about-us/asset/Loy-Yang-B-Power-Station>.
220. Sophie Vorrath, Hazelwood owner to to shut Italian coal plant blamed for deaths (12 March 2014) RenewEconomy < http://reneweconomy.com.au/hazelwood-owner-told-to-shut-italian-coal-plant-blamed-for-deaths-18375/>.
221. Darren Gray, ‘Hazelwood’s French operator to stand trial over fire in open cut coalmine’, The Age (online), 29 June 2017 http://www.theage.com.au/business/mining-and-resources/hazelwood-owner-to-stand-trial-over-2014-fire-20170629-gx0wej.html; ‘Hazelwood fire: EPA charges four companies over 2014 coal mine blaze’, ABC News (online), 15 March 2016 <http://www.abc.net.au/news/2016-03-15/epa-to-charge-hazelwood-owner-over-coal-mine-fire/7246706 >.
222. Sonali Paul and Sharon Klyne, ‘Alinta, Delta vie for Engie’s Australian coal-fired plant’, Reuters, 23 June 2017 <https://www.reuters.com/article/us-australia-engie-idUSKBN19E0YN>.
223. There are some discrepancies in the reported capacity for Loy Yang B. We took this figure from the operator’s website - http://www.gdfsuezau.com/about-us/asset/Loy-Yang-B-Power-Station
224. Licence currently not available on the EPA Victoria website
225. Bridget Carter, ‘Buyers line up for coal-fired power station Loy Yang B’, The Australian (online), 19 May 2017 <http://www.theaustralian.com.au/business/dataroom/buyers-line-up-for-coalfired-power-station-loy-yang-b/news-story/39c144652fcf2980493b594a3870fd3d>.
226. Loy Yang B Power Station, ENGIE <http://www.gdfsuezau.com/about-us/asset/Loy-Yang-B-Power-Station>.
227. See for example Tom Arup ‘Hazelwood owners GDF Suez refusing to pay $18 million mine fire bill’, The Age (online),6 July 2015 <http://www.theage.com.au/victoria/hazelwood-owners-gdf-suez-refusing-to-pay-18-million-mine-fire-bill-20150706-gi6e6y.html >; Nicole Asher, ‘Hazelwood mine operator pleads not guilty, committed to stand trial over 2014 mine fire’, ABC News (online), 29 June 2017 <http://www.abc.net.au/news/2017-06-29/ihazelwood-mine-pleads-not-guilty-committed-to-trial/8662398>; ‘Mine operator GDF Suez responsible for Morwell main drain not council Supreme Court Rules’, ABC News (online), 20 November 2015 <http://www.abc.net.au/news/2015-11-20/court-rules-mine-operator-gdf-suez-responsible-for-morwell-drain/6957230>; Darren Gray, ‘Hazelwood’s French operator to dtand trial over fire in open cut coalmine’, The Age (online), 29 June 2017 <http://www.theage.com.au/business/mining-and-resources/hazelwood-owner-to-stand-trial-over-2014-fire-20170629-gx0wej.html>.
228. Fuel and Technology Cost Review – Data (ACIL Allen, 2014), available at: NTNDP Database, Australian Energy Market Operator <https://www.aemo.com.au/Electricity/National-Electricity-Market-NEM/Planning-and-forecasting/National-Transmission-Network-Development-Plan/NTNDP-database>.
229. EnergyAustralia Yallourn Social and Environmental Performance Summary 2014, available at: EnergyAustralia, Submission to Hazelwood Mine Fire Inquiry Board of Inquiry, Hazelwood Mine Fire Inquiry, 24 August 2015 <http://hazelwoodinquiry.vic.gov.au/wp-content/uploads/2015/08/EnergyAustralia-Submission.pdf >.
230. US Code of Federal Regulations 2013; 40 CFR Appendix F to Part 75 - Conversion Procedures, U.S. Government Publishing Office 446 <https://www.gpo.gov/fdsys/search/pagedetails.action?collectionCode=CFR&searchPath=Title+40%2FChapter+I%2FSubchapter+C%2FPart+75&granuleId=CFR-2013-title40-vol17-part75-appF&packageId=CFR-2013-title40-vol17&oldPath=Title+40%2FChapter+I%2FSubchapter+C&fromPageDetails=true&collapse=true&ycord=2095>.
231. US Code of Federal Regulations 2013; 40 CFR Appendix F to Part 75 - Conversion Procedures, U.S. Government Publishing Office 446 <https://www.gpo.gov/fdsys/search/pagedetails.action?collectionCode=CFR&searchPath=Title+40%2FChapter+I%2FSubchapter+C%2FPart+75&granuleId=CFR-2013-title40-vol17-part75-appF&packageId=CFR-2013-title40-vol17&oldPath=Title+40%2FChapter+I%2FSubchapter+C&fromPageDetails=true&collapse=true&ycord=2095>
232. www.chinafaqs.org/files/chinainfo/China FAQs Emission Standards v1.4_0.pdf
233. www.International Energy Agency-coal.org.uk/documents/82539/9516/China.
83
Environmental Justice Australia

Photo by Anna Carlile


Environmental Justice AustraliaTelephone: 03 8341 3100 / 1300 336 842Facsimile: 03 8341 3111Email: [email protected]: www.envirojustice.org.auPost: PO Box 12123, A’Beckett Street VIC 8006Address: Level 3, the 60L Green Building, 60 Leicester Street, Carlton
This publication uses 100% post-consumer waste recycled fibre.