toxicology and carcinogenesis studies of iodinated glycerol
TRANSCRIPT

NATIONAL TOXICOLOGY PROGRAMTechnical Report SeriesNo. 340
TOXICOLOGY AND CARCINOGENESIS
STUDIES OF
IODINATED GLYCEROL
(ORGANIDIN®)
(CAS NO. 5634-39-9)
IN F344/N RATS AND B6C3Fi MICE
(GAVAGE STUDIES)
U.S. DEPARTMENT OF HEALTH AND HUMAN SERVICESPublic Health Service
National Institutes of Health


NTP TECHNICAL REPORT
ON THE
TOXICOLOGY AND CARCINOGENESIS
STUDIES OF IODINATED GLYCEROL
(ORGANIDIN*)
(CAS NO. 5634-39-9)
IN F344/N RATS AND B6C3F1 MICE
(GAVAGE STUDIES)
John Edgar French, Ph.D., Study Scientist
NATIONAL TOXICOLOGY PROGRAM P.O. Box 12233
Research Triangle Park, NC 27709
March 1990
NTP TR 340
NIH Publication No. 90-2596
U.S. DEPARTMENT OF HEALTH AND HUMAN SERVICES Public Health Service
National Institutes of Health

CONTENTS PAGE
ABSTRACT ................................................................ 3
EXPLANATION OF LEVELS OF EVIDENCE OF CARCINOGENIC ACTIVITY .................. 7
CONTRIBUTORS ............................................................ 8
PEERREVIEWPANEL ........................................................ 10
SUMMARY OF PEER REVIEW COMMENTS ......................................... 11
I. INTRODUCTION ........................................................ 13
II. MATERIALS AND METHODS .............................................. 17
III. RESULTS ............................................................. 37
RATS ............................................................. 38
MICE ............................................................. 47
GENETICTOXICOLOGY ............................................... 56
IV. DISCUSSION AND CONCLUSIONS ........................................... 63
V. REFERENCES ......................................................... 69
APPENDIXES
APPENDIX A SUMMARY O F LESIONS IN MALE RATS IN THE TWO-YEAR GAVAGE STUDY OF IODINATED GLYCEROL ........................................ 73
APPENDIX B SUMMARY O F LESIONS I N FEMALE RATS I N THE TWO-YEAR GAVAGE STUDY O F IODINATED GLYCEROL ................................... 95
APPENDIX C SUMMARY O F LESIONS IN MALE MICE IN THE TWO-YEAR GAVAGE STUDY OF IODINATED GLYCEROL ........................................ 115
APPENDIX D SUMMARY OF LESIONS IN FEMALE MICE I N THE TWO-YEAR GAVAGE STUDY OF IODINATED GLYCEROL ................................... 135
APPENDIX E SENTINEL ANIMAL PROGRAM ...................................... 159
APPENDIX F INGREDIENTS. NUTRIENT COMPOSITION. AND CONTAMINANT LEVELS I N NIH 07 RAT AND MOUSE RATION ................................... 163
APPENDIXG AUDITSUMMARY ............................................... 169
Iodinated Glycerol. NTP TR 340 2

CH2 -CH --H21
I I OH OH
IODINATED GLYCEROL
3-Iodo-l,2-propanediol (major component a s determined by the NTP, not the compounds indicated in the patent)
CAS NO. 5634-39-9
C3H702I Molecular weight 202.0
Synonyms or Trade Names: Organidin@; iodopropylidene glycerol
ABSTRACT
Toxicology and carcinogenesis studies of iodinated glycerol (Organidin@, a complex mixture prepared by the reaction of iodine with glycerol and found to contain 33% 3-iodo-1,2-propanediolas the major component) were conducted because of human exposure to iodinated glycerol as an expectorant and its possible relationship to the formation of alkyl iodides, e.g., methyl iodide, a suspected animal car- cinogen. These studies were conducted by giving iodinated glycerol in water by gavage (5 days per week) to groups of F344/N rats and B6C3F1 mice for 16 days, 13 weeks, or 2 years. Genetic toxicology studies were conducted with iodinated glycerol in Salmonella typhimurium, mouse L5178Y lympho- ma cells, Chinese hamster ovary (CHO) cells, and B6C3F1 mice (in vivo bone marrow micronucleus test). Also, S-iodo-l,2-propanediol was tested in S. typhimurium and B6C3F1 mice (in vivo micro- nucleus assay).
Sixteen-Day and Thirteen- Week Studies: Sixteen-day studies were conducted by giving iodinated glycerol a t doses up to 1,000 mg/kg to rats and up to 500 mg/kg to mice. All female rats and 415 male rats in the highest dose group died before the end of the studies; there were no dose-related effects on body weights of male or female rats or male mice a t the end of the studies. The forestomach of 2/5 female mice that received 500 mg/kg was thickened and granular.
Thirteen-week studies were conducted by administering iodinated glycerol a t doses up to 500 mg/kg to rats and mice. During these studies, 3/10 female rats and 1/10 female mice that received 500 mg/kg died. Final mean body weights of rats and mice that received 500 mg/kgwere 4% lower than those of vehicle controls for males and 6%-7% lower for females.
Kidney tubular cell lesions, including cortical necrosis, regeneration, and calcification, were observed a t increased incidences in the highest dose group of female rats. Lymphoid hyperplasia of the stom- ach was observed in dosed male and female rats. Kidney tubular cell regeneration was also observed in dosed female mice. Inflammation or abscesses of mild-to-moderate severity and hyperplasia, acan- thosis, and/or hyperkeratosis of mild-to-moderate severity were observed in the forestomach of the highest dosed group of female mice.
Body Weight and Survival in the Two-year Studies: Two-year studies were conducted by adminis- tering 0, 125, or 250 mg/kg iodinated glycerol in deionized water by gavage, 5 days per week for 103 weeks, to groups of 50 male F344/N rats and 50 male B6C3F1 mice. Groups of 50 female F344/N rats and 50 female B6C3F1 mice were administered iodinated glycerol on the same schedule a t lower doses of 0,62,or 125 mg/kg because of the increased severity of kidney and stomach lesions in the 13-week studies. Mean body weights of high dose male rats were 5%-10% lower than those of vehicle controls
3 Iodinated Glycerol, NTP TR 340

from week 43 to week 68 and 10%-13% lower from week 72 to the end of the studies. Mean body weights of low dose male rats and high dose female rats were 4%-9% lower than those of vehicle con- trols from week 88 to the end of the studies. The survival of the high dose group of male rats was con- siderably lower than that of the vehicle controls after week 86. No other significant differences in survival were observed between any groups of rats of either sex (male: vehicle control, 28/50; low dose, 20150; high dose, 2/50; female: 31/50; 30150; 27/50). Mean body weights of dosed and vehicle con- trol male mice were similar. Mean body weights of high dose female mice were 6%-8% lower than those of vehicle controls from week 40 to week 64 and were 9%-13% lower thereafter. No significant differences in survival were observed between any groups of mice of either sex (male: 36/50; 40/50; 32/50; female: 40150; 33/50; 38/50).
Nonneoplastic and Neoplastic Effects in the Two-year Studies: The incidences of mononuclear cell leukemia were increased in dosed male rats (vehicle control, 14/50; low dose, 29/50; high dose, 24/50).
Follicular cell carcinomas of the thyroid gland in male rats occurred a t an increased incidence in low dose male rats (0149; 5/49; 1/49). Reduced survival of high dose male rats may have been responsible for the decreased tumor incidence in this group relative to that in the low dose group. Follicular cell carcinomas were observed in one low dose and one high dose female rat. Follicular cell carcinomas of the thyroid gland have been observed in 31293 water gavage vehicle control male F344/N rats and in 1011,904 untreated control male F344/N rats.
Adenomas of the nasal cavity were observed in two high dose male rats. Adenomas of the nasal cavity have not been observed in 300 water gavage vehicle control male F344/N rats or in 1,936 untreated control male F344/N rats.
Squamous metaplasia and focal atrophy of the salivary glands were observed at increased incidences in dosed rats (squamous metaplasia--male: 0148; 47/50; 48/49; female: 1/49; 48/50; 49/50; focal atrophy--male: 1/48; 10150; 30149; female: 0149; 4/50; 11/50).
In dosed female mice, adenomas of the anterior pituitary gland were increased (10147; 15/45; 24/46). The incidences of adenomas of the harderian gland in dosed female mice were increased (6150; 8/40; 13/50). A carcinoma of the harderian gland was observed in another high dose female mouse.
Dilatation of the thyroid gland follicle and follicular cell hyperplasia were observed a t increased inci- dences in dosed mice (dilatation--male: 0148; 28/50; 32/50; female: 4/48; 11/48; 10148; hyperplasia-- male: 3/48; 46/50; 34/50; female: 2/48; 25/48; 35/48). The incidences of follicular cell adenomas were 3/48,6/50, and 0150 for males and 2148,3148, and 4/48 for females.
Hyperkeratosis and acanthosis of the forestomach were observed a t increased incidences in high dose male mice (hyperkeratosis: 0149; 0/49; 5/50; acanthosis: 0149; 1/49; 5/50). Squamous cell papillomas were observed in female mice (1149; 2/50; 5/49). The historical incidence of forestomach squamous cell neoplasms is 41339 (1.2%) in water gavage vehicle control female B6C3F1 mice and is 1811,994 (0.9%) in untreated control female B6C3F1 mice. Squamous cell neoplasms were not observed in male mice.
Genetic Toxicology: Treatment of the base-substitution mutant S. typhimurium strains TAlOO and TA1535 with iodinated glycerol in a preincubation protocol with and without S9 resulted in a dose-related increase in the number of revertant colonies; no increase in revertants was observed with the frame-shift mutant strains TA98 or TA1537. 3-Iodo-l,2-propanediol was also mutagenic in TAlOO with or without S9; it was not mutagenic in TA98. Iodinated glycerol increased the number of trifluorothymidine-resistant cells in the mouse lymphoma L5178YITK”- assay in the absence of exogenous metabolic activation; it was not tested with activation. Iodinated glycerol induced sister chromatid exchanges (SCEs) and chromosomal aberrations in CHO cells without S9; with S9, the
Iodinated Glycerol, NTP TR 340 4

frequency of SCEs was increased more than without S9 but no chromosomal aberrations were induced. No increase in micronucleated polychromatic erythrocytes was observed in the bone marrow of B6C3F1 mice after injection with either iodinated glycerol or 3-iodo-l,2-propanediol.
Conclusions: Under the conditions of these 2-year gavage studies, there was some evidence of carcino-genic activity* for male F344/N rats administered iodinated glycerol, as indicated by increased inci- dences of mononuclear cell leukemia and follicular cell carcinomas of the thyroid gland. Adenomas of the nasal cavity in two high dose male rats may have been related to the administration of iodinated glycerol. There was no evidence of carcinogenic activity for female F344/N rats administered 62 or 125 mg/kg iodinated glycerol by gavage for 103 weeks. There was no evidence of carcinogenic activity for male B6C3F1 mice administered 125 or 250 mg/kg iodinated glycerol by gavage for 103 weeks. There was some evidence of carcinogenic activity for female B6C3F1 mice administered iodinated glycerol, as indicated by increased incidences of adenomas of the anterior pituitary gland and neoplasms of the harderian gland. Squamous cell papillomas of the forestomach may have been related to the adminis- tration of iodinated glycerol.
Significant nonneoplastic lesions considered related to exposure of iodinated glycerol were squamous metaplasia and focal atrophy of the salivary gland in male and female rats. Dilatation of the thyroid gland follicle and follicular cell hyperplasia were observed in male and female mice.
*Explanation of Levels of Evidence of Carcinogenic Activity is on page 7. A summary ofthe Peer Review comments and the public discussion on this Technical Report appears on pages 11-12.
5 Iodinated Glycerol, NTP TR 340

SUMMARY OF THE TWO-YEAR GAVAGE AND GENETIC TOXICOLOGY STUDIES OF IODINATED GLYCEROL
Male F344/N Rats Female F344/N Rats
Doses 0,125, or 250 mgkgiodinated 0,62, or 125 mgkg iodinated glycerol in water, 5 d/wk glycerol in water, 5 d/wk
Body weights in the 2-year study Dosed lower than vehicle High dose lower than vehicle controls controls
Survival rates in the 2-year study 28/50; 20150; 2/50 31/50; 30150; 27/50
Nonneoplastic lesions Squamous metaplasia and focal Squamous metaplasia an atrophy of the salivary glands focal atrophy of the salivary
glands
NeoplasmsMononuclear cell leukemia None (14150; 29/50; 24/50); follicular cell carcinomas of the thyroid gland (0149; 5/49; 1/49)
Adenomas of the nasal cavity (0148;0147; 2/49)
Level of evidence of carcinogenic activity Some evidence No evidence
Genetic toxicology
Salmonella Mouse L5178Y/TK Gene Mutation Tft Resistance
Positive with and Positive without S9; without S9 no test with S9
Male B6C3F1 Mice Female B6C3F1 Mice
0,125, or 250 mgkg iodinated 0,62, or 125 mgkg iodinat- glycerol in water, 5 d/wk ed glycerol in water, 5 d/wk
Dosed and vehicle controls High dose lower than similar vehicle controls
36/50; 40150; 32/50 40150; 33/50; 38/50
Hyperkeratosis anL xanthosis Dilatation of the thyroid of the forestomach; dilatation gland follicle and follicular of the thyroid gland follicle and cell hyperplasia follicular cell hyperplasia
None Adenomas of the anterior pituitary gland (10147; 15/45; 24/46); adenomas or carcinomas (combined) of the harderian gland (6150; 8/40; 14/50)
Squamous cell papillomas of the forestomach (1149; 2/50; 5/49)
No evidence Some evidence
CHO Cells in Vitro SCE Aberration
Positivewith and Positive without without S9 S9; negative with S9
Iodinated Glycerol, NTP TR 340 6

EXPLANATION OF LEVELS OF EVIDENCE OF CARCINOGENIC ACTIVITY
The National Toxicology Program describes the results of individual experiments on a a,emical agent and notes the strength of the evidence for conclusions regarding each study. Negative results, in which the study animals do not have a greater incidence of neoplasia than control animals, do not necessarily mean that a chemical is not a carcinogen, inasmuch asthe experiments are conducted under a limited set of conditions. Positive results demonstrate that a chemical is carcinogenic for laboratory animals under the conditions of the study and indicate that exposure to the chemical has the potential for hazard to humans. Other organizations, such as the International Agency for Research on Cancer, assign a strength of evidence for conclusions based on an examination of all available evidence including: animal studies such as those conducted by the NTP, epidemiologic studies, and estimates of exposure. Thus, the actual determination of risk to humans from chemicals found to be carcinogenic in labora- tory animals requires a wider analysis that extends beyond the purview ofthese studies.
Five categories of evidence of carcinogenic activity are used in the Technical Report series to summarize the strength ofthe evi- dence observed in each experiment: two categories for positive results ("Clear Evidence" and "Some Evidence"); one category for uncertain findings ("Equivocal Evidence"); one category for no observable effects ("No Evidence"); and one category for ex- periments that because of major flaws cannot be evaluated ("Inadequate Study"). These categories of interpretative conclusions were first adopted in June 1983 and then revised in March 1986 for use in the Technical Reports series to incorporate more specifically the concept of actual weight of evidence of carcinogenic activity. For each separate experiment (male rats, female rats, male mice, female mice), one of the following quintet is selected to describe the findings. These categories refer to the strength of the experimental evidence and not to either potency or mechanism.
Clear Evidence of Carcinogenic Activity is demonstrated by studies that are interpreted as showing a dose-related (i) increase of malignant neoplasms, (ii) increase of a combination of malignant and benign neoplasms, or (iii) marked increase ofbenign neoplasms if there is an indication from this or other studies of the ability of such tumors to progress to malignancy.
Some Evidence of Carcinogenic Activity is demonstrated by studies that are interpreted as showing a chemically related increased incidence of neoplasms (malignant, benign, or combined) in which the strength of the response is less than that required for clear evidence.
Equivocal Evidence of Carcinogenic Activity is demonstrated by studies that are interpreted as showing a mar-ginal increase of neoplasms that may be chemically related.
No Evidence of Carcinogenic Activity is demonstrated by studies that are interpreted as showing no chemically re- lated increases in malignant or benign neoplasms.
Inadequate Study of Carcinogenic Activity is demonstrated by studies that because of major qualitative or quanti- tative limitations cannot be interpreted as valid for showing either the presence or absence of carcinogenic activity.
When a conclusion statement for a particular experiment is selected, consideration must be given to key factors that wauld ex- tend the actual boundary of an individual category of evidence. This should allow for incorporation of scientific experience and current understanding of long-term carcinogenesis studies in laboratory animals, especially for those evaluations that may be on the borderline between two adjacent levels. These considerations should include:
The adequacy of the experimental design and conduct; Occurrence of common versus uncommon neoplasia;
0 Progression (or lack thereof) from benign to malignant neoplasia as well as from preneoplastic to neoplastic lesions; 0 Some benign neoplasms have the capacity to regress but others (of the same morphologic type) progress. At present, it
is impossible t o identify the difference. Therefore, where progression is known to be a possibility, the most prudent course is to assume that benign neoplasms of those types have the potential to become malignant;
0 Combining benign and malignant tumor incidences known or thought to represent stages of progression in the same or- gan or tissue; Latency in tumor induction;
0 Multiplicity in site-specific neoplasia; Metastases;Supporting information from proliferative lesions (hyperplasia) in the same site 6fneoplasia or in other experiments (same lesion in another sex or species); The presence or absence ofdose relationships; The statistical significance of the observed tumor increase;
0 The concurrent control tumor incidence as well as the historical control rate and variability for a specific neoplasm; Survival-adjustedanalyses and false positive or false negative concerns; Structure-activity correlations; and In some cases, genetic toxicology.
7 Iodinated Glycerol,NTP TR 340
CONTRIBUTORS
The NTP Technical Report on the Toxicology and Carcinogenesis Studies of Iodinated Glycerol is based on the 13-week studies that began in April 1980and ended in July 1980and on the 2-year stud- ies that began in April 1981 and ended in May 1983 at EG&G Mason Research Institute (Worcester, Massachusetts).
National Toxicology Program (Evaluated Experiment, Interpreted Results, and Reported Findings)
John Edgar French, Ph.D., Study Scientist
John Bucher, Ph.D. Joseph K. Haseman, Ph.D. Scot L. Eustis, D.V.M., Ph.D. James Huff, Ph.D.
(Discipline Leaders and Principal Contributors)
Jack Bishop, Ph.D. E.E. McConnell, D.V.M. Douglas W. Bristol, Ph.D. G.N. Rao,D.V.M.,Ph.D. R. Chhabra, Ph.D. B.A. Schwetz,D.V.M.,Ph.D. R. Griesemer, D.V.M., Ph.D. Douglas Walters, Ph.D. C.W.Jameson, Ph.D.
NTP Pathology Working Group (Evaluated Slides and Prepared Pathology Report for Rats on 10/28/86)
Steven Stefanski, D.V.M. (Chair) (NTP) Micheal Jokinen, D.V.M. (Experimental J.C. Bhandari, D.V.M., Ph.D. (Dynamac Corp.) Pathology Laboratories, Inc.) Michael Elwell, D.V.M., Ph.D. (NTP) Nabeel Mehdi, Ph.D. (Toxicity Research Scot L. Eustis, D.V.M., Ph.D. (NTP) Laboratories)
Linda Uraih, D.V.M. (NTP)
(Evaluated Slides and Prepared Pathology Report for Rats on 5/5/88)
Micheal Jokinen, D.V.M. (Chair) (NTP) Jerry Hardisty, D.V.M. (Experimental William Butler, M.B.B.S. (British Industrial Pathology Laboratories, Inc.)
Biological Research AssociatiodCarter Wallace) Robert Squire, D.V.M., Ph.D. (Johns Hopkins Michael Elwell, D.V.M., Ph.D. (NTP) University Hospital) Scot L. Eustis, D.V.M., Ph.D. (NTP) Jerry Ward, D.V.M., Ph.D. (National Cancer
Institute)
(Evaluated Slides and Prepared Pathology Report for Mice on 9/30/86)
Frank Voelker, D.V.M. (Chair) (Pathology Michael Elwell, D.V.M., Ph.D. (NTP) Associates, Inc.) Jerry Hardisty, D.V.M. (Experimental
Roger Alison, M.R.C.V.S. (NTP) Pathology Laboratories, Inc.) Gary Boorman, D.V.M., Ph.D. (NTP) Agnes Russfield, M.D. (EG&G Mason Charles Capen, D.V.M., Ph.D. (Ohio State Research Institute)
University)
(Evaluated Slides and Prepared Pathology Report for Mice on 7/12/88) Micheal Jokinen, D.V.M. (Chair) (NTP) Scot L. Eustis, D.V.M., Ph.D. (NTP) William Butler, M.B.B.S. (British Industrial Robert Garman, D.V.M. (Carnegie-Mellon
Biological Research AssociatiodCarter Wallace) Institute of Research) William Carlton, D.V.M., Ph.D. (Purdue Jerry Hardisty, D.V.M. (Experimental
University) Pathology Laboratories, Inc.) Michael Elwell, D.V.M., Ph.D. (NTP)
Iodinated Glycerol, NTP TR 340 8

CONTRIBUTORS (Continued)
Principal Contributors at EG&G Mason Research Institute (Conducted Studies and Evaluated Tissues)
H. Lilja, Ph.D. M. Hagopian, Ph.D. S. Wyand, D.V.M. A. Russfield, M.D.
Principal Contributors at Experimental Pathology Laboratories, Inc. (Provided Pathology Quality Assurance)
J. Gauchat J.Hardisty, D.V.M.
Principal Contributors at Carltech Associates, Inc. (Contractor for Technical Report Preparation)
William D. Theriault, Ph.D. John Warner, M.S. Abigail C. Jacobs, Ph.D. Naomi Levy, B.A.
9 Iodinated Glycerol, NTP TR 340

PEER REVIEW PANEL
The members of the Peer Review Panel who evaluated the draft Technical Report on iodinated glycer- ol on October 3,1988, are listed below. Panel members serve as independent scientists, not as repre- sentatives of any institution, company, or governmental agency. In this capacity, Panel members have five major responsibilities: (a)to ascertain that all relevant literature data have been adequate- ly cited and interpreted, (b) to determine if the design and conditions of the NTP studies were appro- priate, (c) to ensure that the Technical Report presents the experimental results and conclusions fully and clearly, (d) to judge the significance of the experimental results by scientific criteria, and (e) to as- sess the evaluation of the evidence of carcinogenicity and other observed toxic responses.
National Toxicology Program Board of Scientific Counselors Technical Reports Review Subcommittee
Robert A. Scala, Ph.D.* (Chair) Senior Scientific Advisor, Medicine and Environmental Health Department
Research and Environmental Health Division, Exxon Corporation East Millstone, New Jersey
Michael A. Gallo, Ph.D. (Principal Reviewer) Frederica Perera, Dr. P.H. Associate Professor, Director of Toxicology Division of Environmental Sciences Department of Environmental and Community School of Public Health
Medicine, UMDNJ - Rutgers Medical School Columbia University Piscataway, New Jersey New York, New York
Ad Hoc Subcommittee Panel of Experts John Ashby, Ph.D. Barbara McKnight, Ph.D.
Imperial Chemical Industries, PLC Assistant Professor, Department of Central Toxicology Laboratory Biostatistics, University of Washington Alderley Park, England Seattle, Washington
Robert H. Garman, D.V.M. (Principal Reviewer) Franklin E. Mirer, Ph.D. Carnegie-Mellon Institute of Research Director, Health and Safety Department Bushy Run Laboratories International Union, United Auto Export, Pennsylvania Workers, Detroit, Michigan
Lois Swirsky Gold, Ph.D. (Principal Reviewer) Paul M. Newberne, D.V.M., Ph.D. University of Ca1ifor:nia Professor, Mallory Institute of Pathology Lawrence Berkeley Llaboratory Boston, Massachusetts Berkeley, California
James A. Popp, D.V.M., Ph.D. Curtis D. Klaassen, Ph.D. Head, Department of Experimental
Professor, Department of Pharmacology and Pathology and Toxicology Toxicology, University of Kansas Medical Chemical Industry Institute of Toxicology Center, Kansas City, Kansas Research Triangle Park, North Carolina
William Lijinsky, Ph.D.* Director, Chemical Carcinogenesis Frederick Cancer Research Facility Frederick, Maryland
"Unableto attend
Iodinated Glycerol, NTP TR 340 10

SUMMARY OF PEER REVIEW COMMENTS ON THE TOXICOLOGY AND CARCINOGENESIS STUDIES OF
IODINATED GLYCEROL
On October 3, 1988, the draft Technical Report on the toxicology and carcinogenesis studies of iodi- nated glycerol received public review by the National Toxicology Program Board of Scientific Coun- selors’ Technical Reports Review Subcommittee and associated Panel of Experts. The review meeting was held a t the National Institute of Environmental Health Sciences, Research Triangle Park, North Carolina.
Dr. J.E. French, NIEHS, began the discussion by reviewing the experimental design, results, and pro- posed conclusions (some evidence of carcinogenic activity for male rats; no evidence of carcinogenic activity for female rats; no evidence of carcinogenic activity for male mice; some evidence of carcino- genic activity for female mice). Significant nonneoplastic lesions considered related to exposure to iodinated glycerol were squamous metaplasia and focal atrophy of the salivary glands in male and fe- male rats. Dilatation of the thyroid gland follicle and follicular cell hyperplasia were observed in male and female mice.
Dr. Gallo, a principal reviewer, agreed with the conclusions for female rats and male mice. He thought that the conclusion for male rats should be reduced to equivocal evidence of carcinogenic ac- tivity because the occurrence of mononuclear cell leukemia is variable and may have been affected by faulty environmental controls at the laboratory. For the thyroid gland, he stated that without knowl- edge of the functional status of the thyroid gland, association of follicular cell tumors with chemical exposure cannot be fully assessed. Dr. French responded that, because of the variability, the con- current controls were more appropriate for comparison of the leukemia incidences. With regard to the thyroid gland, all of the tumors were carcinomas, an uncommon event. Dr. Gallo said that the conclusion for female mice should be reduced to equivocal evidence of carcinogenic activity because association of pituitary gland tumors with chemical exposure cannot be assessed due to lack of knowledge of the thyroid gland’s functional status. Dr. Gallo said that the discussion should include more description of the role of free iodide on thyroid gland function and on how it may affect the thy- roid gland in these studies. He suggested that short-term studies might be appropriate to evaluate the effect of iodinated glycerol on thyroid gland function. Dr. French said that additional 13-week studies were already in progress, including thyroid gland function tests.
Dr. Gold, the second principal reviewer, agreed with the conclusions. She noted that the target sites in female mice, the pituitary and harderian glands, have only infrequently been considered as target sites in NTP studies. She commented that it might be desirable to state the category of evidence sep- arately for each target site instead of the current practice of adding a sentence without the evaluative category (in this case, adenomas of the nasal cavity in male rats).
Dr. Garman, the third principal reviewer, agreed with the conclusions. He agreed with Dr. Gallo’s concern about the need for more information on the level of thyroid gland activity and for a more de- tailed description of thyroid gland morphology, including representative photomicrographs of thyroid glands from vehicle control and high dose animals. Dr. S. Eustis, NIEHS, commented that the lesions in the thyroid gland were not typical of a goitrogenic effect. He said that a more detailed description would be provided (pages 44 and 66).
Dr. J. Haseman, NIEHS, observed that the low dose group should be the focus for evaluation in male rats because of the high mortality occurring late in the study in the high dose animals. Dr. Perera cautioned that judgments concerning the levels of evidence should be based on actual results and not
11 Iodinated Glycerol, NTP TR 340

SUMMARY OF PEER REVIEW COMMENTS (Continued)
on proposed mechanisms. Dr. Gallo agreed but said that consideration of mechanism was important to an understanding of how a chemical alters tissue physiology.
Dr. William H. Butler, British Industrial Biological Research Association, representing Carter- Wallace, Inc., discussed certain aspects of the pathologic evaluation, noting that he had reviewed the microslides at the NTP Archives and had participated in two NTP Pathology Working Groups. He be- gan by describing what he considered to be deficiencies in the conduct of the studies. He noted that the incidences of leukemia in male rats were within the historical vehicle control range with no shortening of latency, whereas incidences of thyroid gland tumors were increased only in the low dose group and there was no evidence of goitrogenic effects; thus, the conclusion should be no evidence of carcinogenic activity. In female mice, pituitary gland tumors are common and highly variable and there was no decrease in latency, whereas the increase in harderian gland tumors was marginal; thus, the conclusion should be, a t best, equivocal evidence of carcinogenic activity.
Dr. Gallo moved that the conclusion for male rats be accepted as written, some evidence of carcino- genic activity. Dr. Garman seconded the motion. Dr. Gallo noted that he based his motion primarily on the follicular cell carcinomas in the thyroid gland. The motion was approved by six affirmative votes to one negative vote (Dr. Gold). Dr. Gallo moved that the conclusions for female rats and male mice be accepted as written, no evidence of carcinogenic activity. Dr. Gold seconded the motion, which was approved unanimously. Dr. Gallo moved that the conclusion for female mice be accepted as written, some evidence of carcinogenic activity, but with squamous cell papillomas of the forestom- ach considered to be related rather than “may have been related.” Thus, the tumors supporting the level of evidence would be in order of importance: adenomas of the anterior pituitary gland, neoplasms of the harderian gland, and papillomas of the forestomach. Dr. Mirer seconded the motion. In discussion, Dr. Gold disagreed and thought that each organ should be evaluated separately and noted that the increased incidences of squamous cell papillomas of the forestomach were not sta-tistically significant, so the evaluation should not change. The motion received six negative votes and one affirmative vote (Dr. Gallo) and was not accepted. Dr. Gallo then moved to accept the con- clusion as written, some evidence of carcinogenic activity. Dr. Garman seconded the motion, which was approved unanimously.
Iodinated Glycerol, NTP TR 340 12
I. INTRODUCTION
Use, Production, and Exposure Absorption, Metabolism, and Excretion Reproductive and Developmental Toxicity Toxicity and Carcinogenicity Genetic Toxicology Study Rationale
13 Iodinated Glycero1;NTP TR 340

I. INTRODUCTION
CH2 -CH -CH21
I I OH OH
IODINATED GLYCEROL
3-1odo-l,2-propanediol (major component as determined by the NTP, not the compounds indicated in the patent)
CAS NO.5634-39-9
C3H7021 Molecular weight 202.0
Synonyms or Trade Names: Organidin@; iodopropylidene glycerol
H2C-0 -CHz-CHzl I ‘CH-CHI -CH3
HC-0 HC-0’I I CHzOH CHIOH
Structure A Structure B
STRUCTURES FOR IODINATED GLYCEROL AS GIVEN IN THE PATENT LITERATURE (PATENT NO. 2,872,378) (Merck, 1976). Isomeric mixture of
2-(l-iodoethyl)-l,3-dioxolane-4-methanol(67%-75%)and 2-(2-iodoethyl)-l,3-dioxolane-4-methanol (33%-25%)
Use, Production, and Exposure
Iodinated glycerol is a pale yellow liquid with a pungent, bitter aftertaste (Merck, 1983). Iodi- nated glycerol (Organidins) is used in humans as a mucolytic expectorant to clear bronchiolar secretions (Seltzer, 1961). This compound is manufactured by reacting iodine and glycerol and is reported in the patent literature (Man- chey et al., Denver Chem. Manuf., U.S.Patent No. 2,872,378, 1959) to be an isomeric mixture of the iodinated 1,3-dioxolane derivatives shown in the figure above.
Production of iodinated glycerol is probably greater than 1,000 lb (SRI, 1978). Exposure oc-curs through its use as a mucolytic expectorant in respiratory tract therapy in humans. A maxi-mum exposure of 2.4mg/kg per day is expected for individuals given the recommended dose (two
30-mg tablets each containing 15 mg of iodinat- ed glycerol, administered four times per day for a total of 120 mg) (Seltzer, 1961; AMA, 1977). No information was available on exposure of the general population to iodinated glycerol.
Absorption, Metabolism, and Excretion
Hoffnagle and Os01 (1958) administered iodinat- ed glycerol (containing 100 pCi of 1311, 2 mg io- dinated glycerol per animal) orally or intra- venously to male Wistar rats (250-300 g). With- in 2 hours, 77% of the radiolabel was absorbed intact, with little or no decomposition of iodinat- ed glycerol in the gastrointestinal tract. Within 24 hours after oral administration, approximate- ly 30%-60% of the 1311 was found in the thyroid gland (approximately 3%-6% in the form of thy-roxin); the remainder was excreted in the urine and feces. The blood, small intestine, liver,
Iodinated Glycerol, NTP TR 340 14

I. INTRODUCTION
kidney, and stomach were the principal com- partments of distribution within 30 minutes of intravenous administration.
Barrigon et al. (1986) administered [125I]iodi- nated glycerol (284 mg) orally to volunteers (age, sex, and weight unknown) who exhibited mean plasma concentration curves compatible with a two-compartment open model. Iodinated glycerol was excreted primarily in urine (94.8% in 48 hours) and followed a biphasic elimination curve. Initially, 41% of the dose was rapidly ex- creted (t+=0.72 hours); the remaining portion was eliminated at a slower rate (t+=4.85 hours).
3-Iodo-l,2-propanediol, a principal component of iodinated glycerol, was metabolized after intra- peritoneal administration of 100 mg/kg to male Wistar rats (250-300 g) or 200 mg/kg to male IC1 Swiss mice (30-50 g); two metabolites were found in the urine: S-(2,3-dihydroxypropyl)cysteine and N-acetyl-S-(2,3-dihydroxypropyl)cysteine (Jones, 1975). Metabolism of 3-iodo-1,2-pro- panediol, according to Jones (1975), is proposed to occur through the release of iodide and the formation of the epoxide intermediate, glycidol (2,3-epoxypropanol), and conjugation with gluta- thione. Release of radiolabeled carbon dioxide (approximately 22% in rats and 15% in mice) through glycerol formation, presumably from formation of glycidol, and subsequent metabo- lism support this hypothesis.
Reproductive and Developmental Toxicity
Iodide readily crosses the placenta and may cause fetal goiter (McLaren and Alexander, 1979). Holbreich (1982) indicated that adminis- tration of iodinated glycerol to pregnant women carries a high risk for induction of fetal goiter.
Toxicity and Carcinogenicity
No information was found in the scientific litera- ture on the acute, cellular, subcellular, or sys- temic toxicity of 3-iodo-l,2-propanediol or iodi- nated glycerol, nor was information found on the long-term toxicity and carcinogenicity or on
epidemiologic studies of 3-iodo-l,2-propanediol or iodinated glycerol.
Genetic Toxicology
In NTP Salmonella studies, treatment of the base-substitution mutant strains TA100 and TA1535 with iodinated glycerol in a preincuba- tion protocol with and without Aroclor 1254- induced male Sprague Dawley r a t or Syrian hamster liver $9 resulted in a s t rong dose- related increase in the number of revertant colo- nies recovered; no increase in revertants was ob- served in the frame-shift mutant strains TA98 and TA1537, with doses up to 10 mg/plate (Zeiger et al., 1987; see Table 23). There is no additional information in the literature on io- dinated glycerol, but there a r e da t a from a dominant lethal study conducted with 3-iodo- 1,2-propanedioI, the major component of iodinat-ed glycerol. Epstein et al. (1972) reported that 3-iodo-1,2-propanediol, injected intraperitoneally into 10 male mice a t 80 mg/kg (inferred from the authors' discussion to be an LD25 dose), did not induce dominant lethal mutations, as measured by early fetal deaths and preimplantation losses in females mated to these dosed males.
3-Iodo-l,2-propanediol is proposed to react in vivo through the epoxide intermediate, glycidol (Jones, 1975). Mutagenicity studies conducted by the NTP on glycidol show it to be positive for induction of gene mutations in Salmonella (Can- ter et al., 1986), positive for induction of trifluo- rothymidine resistance in mouse L5178Y/TK cells (NTP, 1990), and positive for induction of sister chromatid exchanges and chromosomal aberrations in cultured Chinese hamster ovary cells (NTP, 1990). In addition, both sex-linked recessive lethal mutations and reciprocal trans- locations were induced in the germ cells of male Drosophila melanogaster flies fed a water solu- tion containing 1,230 ppm glycidol. Results from an in vivo bone marrow micronucleus test with glycidol were weakly positive; dose-related increases in micronuclei were observed a t the two highest dose levels (75 and 150 mg/kg) (NTP, 1990).
15 Iodinated Glycerol, NTP TR 340

I. INTRODUCTION
Study Rationale
Iodinated glycerol was nominated and selected for study because of human exposure to iodinat- ed glycerol as an expectorant and because of the compound's structural relationship to methyl
iodide, a suspected animal carcinogen (IARC, 1986). Administration of iodinated glycerol by gavage was chosen to obtain oral exposure with a bolus dose regimen, which is the primary route for administration of the drug in humans.
Iodinated Glycerol, NTP TR 340 16

II. MATERIALS AND METHODS
PROCUREMENT AND CHARACTERIZATION OF IODINATED GLYCEROL
PREPARATION AND CHARACTERIZATION OF
DOSE MIXTURES
FIRST SIXTEEN-DAY STUDIES
SECOND SIXTEEN-DAY STUDIES
THIRTEEN-WEEK STUDIES
TWO-YEAR STUDIES Study Design Source and Specifications of Animals Animal Maintenance Clinical Examinations and Pathology Statistical Methods
GENETIC TOXICOLOGY
17 Iodinated Glycerol, NTP TR 340

II. MATERIALS AND METHODS
PROCUREMENT AND CHARACTERIZATION OF IODINATED GLYCEROL
Iodinated glycerol (Azeo 35%) was obtained in one lot (lot no. 276-YY-30) from Wallace Labora- tories (Cranbury, New Jersey) and was used for all studies. Purity and identity determinations were conducted a t Midwest Research Institute (MRI) (Kansas City, Missouri). MRI reports on analyses performed in support of the iodinated glycerol studies are on file a t the National Insti- tute of Environmental Health Sciences.
Elemental analysis values for carbon and hydro- gen were high, whereas that for oxygen agreed with theoretical values. The value for iodine was low when compared with values for struc- tures in the patent literature. The iodine con- tent was found to be 46.1% (w/w), which included 0.4% ionic iodine and 35.3% organically bound iodine, as defined by the manufacturer. The in- frared (Figure l),ultraviolet/visible, and nu- clear magnetic resonance (Figures 2 to 4) spectra were not consistent with those expected for ei- ther of the structures given in the patent litera- ture (Merck, 1976) for iodinated glycerol (Fig- ure 5). The structure of the major component as determined by the NTP is given in Figure 6. The infrared spectrum differed only slightly from that of glycerol. The ultraviolet spectrum showed a single peak (A,,,, 254 nm; E, 319.1 f 15.61, which was consistent with the spectrum of alkyl iodides. The nuclear magnetic resonance spec- tra, taken in both methanol-d4 and acetone-dg, did not have peaks attributable to the methine proton on the carbon in the 2 position or signifi-cant peaks for the methyl group in structure B orfor the methylene group in the 2 position of structure A.
A fluffy orange precipitate was formed when 2,4- dinitrophenylhydrazine in acidified ethanol was added to iodinated glycerol that had been re- fluxed for 1hour with 2% hydrochloric acid, sug- gesting the presence of a ketone or aldehyde in the hydrolyzed mixture. The results of this test and the lack of a methine absorbance in the nu- clear magnetic resonance spectrum do not sup- port the proposed structure reported in the pat- ent literature. The study material contained a relatively large amount of material (estimated
a t 10%-20%) tentatively identified a s glycerol (determined by thin-layer chromatography with 0.25 mm silica gel 60, F-254 plates and a n n-butano1:acetone:water [1:8:1] solvent system).
A second lot of iodinated glycerol was obtained from the supplier to confirm that the lot used in the studies was representative of the commer- cially available material. Lot no. 34220, re- ceived on 8/27/79, was analyzed by nuclear mag- netic resonance spectroscopy and found to be nearly identical to lot no. 276-YY-30 (received by MRI on 4/17/79). .
Water content a s determined by Karl Fischer analysis was 1%. A minor component, four trace components, and one slight trace impurity were detected by thin-layer chromatography on sili- ca gel plates with an ethyl acetate:methanol(9:1) solvent system. Six impurities with areas equal to 0.23%, 0.67%, 2.36%) 1.58%, 2.87%, and 1.99% tha t of the major peak were detected on a high-performance liquid chromatograph equipped with a fixed wavelength detector (254 nm) and a pPorasil column with a chloroform: tetrahydrofuran (60:40) solvent system. Be-cause of the uncertainty of the mixture’s compo- sition, a purity estimate cannot be assigned.
Because of the inconsistencies observed in the analyses of the original study material, a third sample of iodinated glycerol (lot no. WM1454) was obtained from Carter-Wallace, Inc., for com- parison analysis. Lot nos. 276-YY-30 and WM1454 were analyzed by carbon-13 nuclear magnetic resonance spectroscopy (carbon- 13 NMR), gas chromatography/mass spectrometry (GUMS) with electron impact (70 eV) ionization, gas chromatography/flame ionization detection (GC/FID), and high-performance liquid chrom- atography (HPLC). The carbon-13 NMR analy- sis was performed on acetone-dg solutions of the study material with a Varian VXR-300 Fourier transform spectrometer a t ambient tempera- ture. The chemical shifts were referenced to the 29.2-ppm acetone heptet. The GUMS analysis was conducted with a 60-m DB-5 capillary col-umn. The linear centroid data were handled by an Incos 2400 data system. The scan range was 35-450 amu. GC/FID quantitation of several components in the study material was performed with a 30-mm DB-5megabore capillary column.
Iodinated Glycerol, NTP TR 340 18

0
z
t r
NO
lSSlWSN
tMl lN
33H3d 19
IodinatedG
lycerol, NT
P TR 340

mP
z us+
p:cW 4
u
3
z ei
Iodinated Glycerol, N
TP TR 340 20

U313W
OU
133dSUW
N ZHW 09
OSE-YU3
21 Iodinated G
lycerol, NTP TR 340

e N
+
Iodinated Glycerol, N
TP TR 340
22
0
z E0
d L7 0er:W u
5;c5 nW
2 z ij0
W
cu 0
W
u z c z5:W pr:
2
EW
z 02 p:cW
C
l u32

H2C-0 \CH-CHI -CH3
HC-0 /I I
CHzOH C H ~ O H
Structure A Structure B
FIGURE 5. STRUCTURES FOR IODINATED GLYCEROL AS GIVEN IN THE PATENT LITERATURE (PATENT NO. 2,872,378)
(Merck, 1976)
CH2 -CH --H21
I I OH OH
FIGURE 6. STRUCTURE OF THE MAJOR COMPONENT OF IODINATED GLYCEROL AS DETERMINED BY THE NTP
Quantitation of glycerol was performed by re- four impurities was estimated a t approximately verse-phase HPLC with a 5-p Beckman Ultra- 10% in lot no. 276-YY-30 and 6% in lot no. sphere ODS Cl8 column. The mobile phase was WM1454 from results of the GC/FID impurity 5% acetonitrile in water, and detection was by profile. refractive index with a Shodex R1 SE-51 detector.
The analytical data on the remaining compo- The major component of both lots was identified nents indicated that they were polymers of glyc- as 3-iodo-l,2-propanediol (IPD). The identifica- erol- and iodine-containing analogs. Specifically, tion was based on results from GC/MS and car- isomers of diglyceryl ether, glyceryl iodoglyceryl bon-13 NMR with concurrent analyses of an IPD ether, and trioxobicyclononane were identified standard. The concentration was determined to from the GUMS data. These components were be approximately 33% in lot no. 276-YY-30 and estimated to account for approximately 40% of 34% in lot no. WM1454. Glycerol w a s also iden- lot no. 276-YY-30. tified as a component in each lot based on results from GUMS and carbon-13 NMR (Figure 7). The results from comparative analyses of lot nos. The concentration of glycerol in lot no. 276-YY- 276-YY-30 and WM1454 indicated that no sig- 30 was determined to be 17% by HPLC. Glycerol nificant differences existed in the composition of was not quantitated in lot no. WM1454; how- the two samples (Table 1). ever, based on the results from GC/FID impurity analysis, the concentration was comparable with Based on these results, it is concluded that the that of lot no. 276-YY-30. principal components of the iodinated glycerol
study material and an iodinated glycerol ref- Numerous impur i t i e s were ev ident in the erence material are IPD (-33%) and glycerol GC/FID, HPLC, and GUMS profiles as well as in (-17%). The two iodopropylideneglycerol iso- the carbon-13 NMR spectrum. Although four of mers described in the patent literature were not these components had a molecular weight of 258 detected in these samples. g/mol, consistent with that described in the pat- ent, it was concluded that these were isomers of The iodinated glycerol study material was (hydroxymethy1)-( iodomet hy1)-p-dioxane instead shown to be stable on storage for 2 weeks a t 25" of the iodopropylideneglycerol structures pur- C. However, some deterioration was observed ported by the patent. The concentration of these when samples were stored for 2 weeks at 60" C.
23 Iodinated Glycerol, NTP TR 340

h
- cCP-0WI Y
IodinatedG
lycerol, NT
P TR 340
24

TABLE 1. LOT COMPARISON RESULTS (a)
ComponentlAnalysis Lot NO. 278-YY-30 Lot No. WM1454
IPD(GC/FID) Glycerol (HPLC) HMIMD (GCIFID)Water (Karl Fischer)
33% 17% 10% 1%
34% (b)- 17%
6% 2.4%
(a)IPD = 3-iodo-1,2-propanediol; GC/FID = gas chromatography/flame ionization detection; HPLC = high-performanceliquid Chromatography; HMIMD = (hydroxymethy1)-(iodomethy1)-p-dioxane(b)Not quantitated by HPLC; amount estimated based on GC/FID impurity analysis.
The study material was stored a t 0" C. Periodic characterization of the study material by high- performance liquid chromatography indicated no deterioration of major components over the course of the studies.
PREPARATION AND CHARACTERIZATION OF DOSE MIXTURES
Dose mixtures were prepared by adding iodi- nated glycerol to deionized water (Table 2). Iodi-nated glycerol in water a t a concentration of 5%was shown to be stable for 7 days at room
temperature. Dose mixtures were stored for no longer than 7 days.
Periodic analysis for iodinated glycerol in dose mixtures was performed to confirm that correct concentrations were administered to the ani- mals. Results of the laboratory's periodic analy- ses indicated that samples were within 10% of the target concentration 98% (44145)of the time (Table 3). Referee analysis was performed peri- odically by the analytical chemistry laboratory during the 2-year studies. Good agreement was found between the laboratories (Table 4).
25 Iodinated Glycerol, NTP TR 340

TABLE 2. PREPARATION AND STORAGE OF DOSE MIXTURES IN THE GAVAGE STUDIES OF IODINATED GLYCEROL
First Sixteen- Day Studies
Second Sixteen- Day Studies
Thirteen-Week Studies
Two-yearStudies
PreparationFormulations of iodinated Same a s first 16-dstudies Same as first 16-dstudies Same as first 16-dstudies glycerol and water prepared by hand shaking in a ground glass-stoppered graduated cylinder and then sealed in serum vials
except solution stirred for 5 min after hand shaking
for administration
Maximum Storage Time 1wk 1wk 2 wk 1wk
Storage Conditions 1" _+ 4" C in the dark 0" * 5°C 0" k 5' C in the dark Same as 13-wkstudies
TABLE 3. RESULTS OF ANALYSIS OF DOSE MIXTURES IN THE TWO-YEAR GAVAGE STUDIES OF IODINATED GLYCEROL
Concentration of Iodinated Glycerol in Water for Target Concentration (mg/ml) (a)
Date Mixed 12.4 25 50
0412 118 1 12.9 24.8 50.0 05/12/81 (b) 16.7 25.4 50.5 05/14/81 (c) 12.9 _ _ _ _ 06/23/81 13.0 26.1 49.9 0910 118 1 12.7 25.7 51.0 10/13/81 13.1 25.7 50.6 12/15/81 11.4 24.6 49.6 02/02/82 12.2 24.8 49.9 03/23/82 12.6 24.8 50.0 06/22/82 12.5 25.5 50.6 07/13/82 13.1 25.4 49.5 09/21/82 12.9 24.5 49.8 11/09/82 12.3 25.2 50.2 0112 5/83 12.5 24.2 46.5 04/12/83 13.0 24.7 49.3 04/26/83 12.6 24.4 49.2
Mean (mg/ml) 12.9 25.0 49.8 Standard deviation 1.14 0.54 1.04 Coefficient of variation (percent) 8.8 2.2 2.09 Range (mg/ml) 11-4-16.7 24.2-26.1 46.5-51.O Number of samples 15 15 15
(a)Results of duplicate analysis (b)Out of specifications; not used in the studies. (c)Remix; not included in the mean.
Iodinated Glycerol, NTP TR 340 26

TABLE 4. RESULTS OF REFEREE ANALYSIS OF DOSE MIXTURES IN THE TWO-YEAR GAVAGE STUDIES OF IODINATED GLYCEROL
Target Concentration Date Mixed (mg/ml)
~~~
04/21/81 10/13/8106/22/8211/09/82 04/12/83
12.4 50.0 25.0 12.4 25.0
(a)Results of duplicate analysis (b)Results of triplicate analysis
FIRST SIXTEEN-DAY STUDIES
Male and female F344/N rats and B6C3F1 mice were obtained from Charles River Breeding Lab- oratories and held for approximately 4 weeks be- fore the studies began. Animals were 8 weeks old when placed on study. Groups of five rats of each sex were administered 0, 62,125, 250, 500, or 1,000 mg/kg iodinated glycerol in deionized water by gavage, 5 days per week (12 doses over 16 days). Groups of five mice of each sex were administered 0,31,62,125,250, or 500 mg/kg on the same schedule. Rats and mice were observed twice per day and were weighed once per week. A necropsy was performed on all animals. De-tails of animal maintenance are presented in Table 5.
SECOND SIXTEEN-DAY STUDIES
Because of dehydration in all groups of mice, the 16-day studies in mice were repeated. Male and female B6C3F1 mice were obtained from Charles River Breeding Laboratories and held for 19 days before the studies began. Animals were 6-8 weeks old when placed on study. Groups of five mice of each sex were administered 0, 31, 62, 125, 250, or 500 mg/kg iodinated glycerol in deionized water by gavage, 5 days per week (12 doses over 16 days). Mice were observed twice per day and were weighed once per week. A
Determined Concentration (mg/ml) Study Referee
Laboratory (a) Laboratory (b)
12.9 12.5 50.6 52.9 25.5 24.4 12.3 12.3 24.7 24.7
necropsy was performed on all animals. Details of animal maintenance are presented in Table 5.
THIRTEEN-WEEK STUDIES
Thirteen-week studies were conducted to evalu- ate the cumulative toxic effects of repeated ad- ministration of iodinated glycerol and to deter- mine the doses to be used in the 2-year studies.
Three- to five-week-old male and female F344/N ra t s and 4- to 5-week-old male and female B6C3F1 mice were obtained from Charles River Breeding Laboratories, observed for 15 days, and assigned to cages such tha t average cage weights were approximately equal. Groups of 10 rats and 10 mice of each sex were administered 0, 31, 62, 125, 250, or 500 mg/kg iodinated glyc- erol in deionized water by gavage, 5 days per week for 13 weeks.
Animals were housed five per cage. Feed and water were available ad libitum. Further exper- imental details are summarized in Table 5. Ani- mals were checked two times per day; moribund animals were killed. Individual animal weights were recorded once per week. At the end of the 13-week studies, survivors were killed. A necrop-sy was performed on all animals except those ex- cessively autolyzed or cannibalized. Tissues and groups examined are listed in Table 5.
27 Iodinated Glycerol, NTP TR 340

TABLE 5. EXPERIMENTAL DESIGN AND MATERIALS AND METHODS IN THE GAVAGE STUDIES OF IODINATED GLYCEROL
First Sixteen- Day Studies
EXPERIMENTAL DE SIGN
Size of Study Groups 5 males and 5 females of each species
Doses Rats--0,62,125,250,500, or 1,000 mg/kg iodinated glyc- erol in deionized water by gavage; mice--0,31,62,125, 250, or 500 mg/kg; dose VOL- 5 mllkg
Date of First Dose 10/29/79
Date of Last Dose 11/13/79
Duration of Dosing5 d/wk 112 doses over 16 d)
Second Sixteen- Day Studies
5 male and 5 female mice
0,31,62,125,250, or 500 mg/kg iodinated glycerol in deionized water by gavage; dose vol--5 mllkg
2/4/80
2/19/80
5 d/wk (12 doses over 16 d)
Type and Frequency of Observation Observed 2 X d; weighed Observed 2 X d; weighed ini- initially and 1 X wk tially and 1 X wk thereafter thereafter
Necropsy and Histologic Examinations Necropsy performed on all Same as first 16-d studies animals; histologic exams not performed
Thirteen-Week Studies
10 males and 10 females of each species
0,31,62,125,250,or 500 mg/kg iodinated glycerol in deionized water by gavage; dose vol--5 mllkg
4/25/80
7/24/80
5 d/wk for 13 wk
Observed 2 X d; weighed ini- tially and 1 X wk thereafter
Necropsy performed on all animals; the following tis-sues examined histologically for vehicle control and high dose groups: adrenal glands, brain, colon, esophagus, eyes (if grossly abnormal), gall- bladder (mice), gross lesions, heart, kidneys, liver, lungs and bronchi, mammary gland, mandibular lymph nodes, pancreas, parathy- roids, pituitary gland, pros- tatekestes or ovaries/uterus,regional lymph nodes, sali- vary glands, skin, small in- testine, spinal cord (if neu- rologic signs present), spleen, sternebrae, stomach, thymus, thyroid gland, tissue masses, trachea, and urinary bladder; additional tissues examined for all rats and mice in the 62,125, and 250 mg/kg groups: kidneys and stomach
Two-yearStudies
50 males and 50 females of each species
Male--O,l25, or 250 mg/kg iodi- nated glycerol in deionized water by gavage; female--O,62, or 125 mg/kg; dose vol--5 mllkg
Rats--511818 1;mice--4/24/81
Rats--5/6/83; mice--4/15/83
5 d/wk for 103 wk
Observed 2 X d; weighed ini- tially, 1 X wk for 12 wk, and then 1 X mo
Necropsy performed on all ani- mals; histologic exams performed on the following tissues from vehi- cle control and high dose animals and from low dose male rats: ad- renal glands, bone marrow, brain, colon, costochondral junction, du- odenum, esophagus, gallbladder (mice), heart, ileum, jejunum, kid- neys, larynx, liver, lungs and bronchi, mammary gland, man- dibular and mesenteric lymph nodes, nasal cavity, pancreas, par- athyroids, pituitary gland, pros- tate/testes/seminal vesicles or ovaries/uterus, regional lymph nodes (if abnormal), salivary glands, skin, spleen, stomach, thymus, thyroid gland, tissue masses, trachea, and urinary bladder; in addition, gross lesions and the following tissues from the low dose groups examined: fe- male rats-adrenal glands, heart, liver, pituitary gland, salivary glands; mice--esophagus, fore- stomach (female), harderian gland, heart (female), liver (fe- male), lung (female), pituitary gland, stomach, thyroid gland, and trachea
Iodinated Glycerol, NTP TR 340 28

TABLE 5. EXPERIMENTAL DESIGN AND MATERIALS AND METHODS IN THE GAVAGE STUDIES OF IODINATED GLYCEROL (Continued)
First Sixteen- Day Studies
ANIMALS AND ANIMAL
Strain and SpeciesF344/N rats, B6C3F1 mice
Animal Source Charles River Breeding Laboratories (Portage, MI)
Study Laboratory EG&G Mason Research Institute
Second Sixteen- Day Studies
MAINTENANCE
B6C3F1 mice
Charles River Breeding Laboratories (Portage, MI)
EG&G Mason Research Institute
Method of Animal Identification Ear punch Ear punch
Time Held Before Study 26 d 19 d
Age When Placed on Study 8 wk 6-8 wk
Age When Killed 11wk 8-10 wk
Necropsy Dates 11114/79-11115/79 2/20/00-212 1/80
Method of Animal Distribution Animals assigned to groups such that for each sex and species, all cage weights approximately equal
Feed Wayne Lab Blox" pellets (Allied Mills, Chicago, IL); available ad libitum
BeddingAspen Bed (American Excelsior, Baltimore, MD)
Water Automatic watering system (Edstrom Industries, Water- ford, WI); available ad libitum ~
CagesPolycarbonate (Lab Prod- ucts, Inc., Rochelle Park, NJ)
Same as first 16-d studies
Same as first 16-d studies
Same as first 16-d studies
Same as first 16-d studies
Same as first 16-d studies
Thirteen-Week Studies
F344/N rats; B6C3F1 mice
Rats-Charles River Breed- ing Laboratories (Kingston, NY); mice--Charles River Breeding Laboratories (Portage, MI)
EG&G Mason Research Institute
Ear punch
15 d
Rats--5-7 wk; mice-6-7 wk
18-20 wk
712 8/00 -011/80
Same as first 16-d studies
NIH 07 Rat and Mouse Ra- tion (Zeigler Bros., Gardners, PA); available ad libitum
Same as first 16-d studies; Beta Chips (Agway, Inc., Syracuse,NY) used when Aspen Bed was unavailable
Same as first 16-d studies
Same as first 16-d studies
Two-yearStudies
F344/N rats; B6C3F1 mice
Charles River Breeding Laboratories (Kingston, NY)
EG&G Mason Research Institute
Ear punch
Rats-19 d; mice--16 d
Rats-7 wk; mice--8 wk
Rats- 11 1 - 112 wk; mice--ll2-114wk
Rats--5/16/83-5/24/83; mice--4/25/83-5/3/83
According to a table of random numbers
Same as 13-wk studies
Same as first 16-d studies
Same as first 16-d studies
Same as first 16-d studies
29 Iodinated Glycerol, NTP TR 340

TABLE 5. EXPERIMENTAL DESIGN AND MATERIALS AND METHODS IN THE GAVAGE STUDIES OF IODINATED GLYCEROL (Continued)
First Sixteen- Second Sixteen- Day Studies Day Studies
~~ ~~
ANIMALS AND ANIMAL MAINTENANCE (Continued)
Thirteen-Week Studies
Two-yearStudies
Cage Filters See Thru II (LabProducts, Same as first 16-d studies Inc., Rochelle Park, NJ)
Animals per Cage 5 5
Other Chemicals on Study in the Same Room None None
Animal Room Environment Temp--20"-27' C; Temp--14"-28'C; h ~ - - 2 9 % - 7 0 % ; hum--35%-50%; fluorescent light 12 h/d; fluorescent light 12 h/d; 10-12room air changes/h 10-12room air changes/h
TWO-YEAR STUDIES
Study Design
Groups of 50 male rats and 50 male mice were administered 0, 125, or 250 mg/kg iodinated glycerol in deionized water by gavage, 5 days per week for 103 weeks. Groups of 50 female rats and 50 female mice were administered 0, 62, or 125 mg/kg on the same schedule.
Source and Specifications of Animals
The male and female F344/N rats and B6C3F1 (C57BW6N, female X C3H/HeN MTV-, male) mice used in these studies were produced under strict barrier conditions at Charles River Breed- ing Laboratories. Breeding stock for the founda- tion colonies at the production facility originated at the National Institutes of Health Repository. Animals shipped for study were progeny of de- fined microflora-associated parents that were transferred from isolators to barrier-maintained rooms. Rats were shipped to the study labora- tory a t 4 weeks of age and mice, a t 6 weeks. The rats were quarantined a t the study laboratory for 19 days and the mice, for 16 days. There-after, a complete necropsy was performed on five
Reemay spun-bonded polyes- Same as 13-wk studies ter filters (Snow Filtration, Cincinnati, OH)
5 5
None None
Temp--17"-29' C; Temp-22.8' C (mean); range- hum--43%-78%; 18.3"-27.2"C;hum--50.3% fluorescent light 12 h/d; (mean); fluorescent light 12 h/d; 12 room air changes/h 15room air changes/h
animals of each sex and species to assess their health status. The rats were 52 days old when placed on study and the mice, 56 days old. The health of the animals was monitored during the course of the studies according to the protocols of the NTP Sentinel Animal Program (Appen- dix E).
A quality control skin grafting program has been in effect since early 1978 to monitor the genetic integrity of the inbred mice used to pro- duce the hybrid B6C3F1 study animal. In mid- 1981, data were obtained that showed incompat- ibility between the NIH C3H reference colony and the C3H colony from a Program supplier. In August 1981, inbred parental lines of mice were further tested for genetic integrity via isozyme and protein electrophoresis profiles that demon- strate phenotype expressions of known genetic loci.
The C57BW6N mice were homogeneous a t all loci tested. Eighty-five percent of the C3H mice monitored were variant a t one to three loci, indi- cating some heterogeneity in the C3H line from this supplier. Nevertheless, the genome of this line is more homogeneous than that of randomly bred stocks.
Iodinated Glycerol, NTP TR 340 30

II. MATERIALS AND METHODS
Male mice from the C3H colony and female mice from the C57BIJ6N colony were used as parents for the hybrid B6C3F1 mice used in these stud- ies. The influence of the potential genetic non- uniformity in the hybrid mice on these results is not known, but results of the studies are not af- fected because concurrent controls were included in each study.
Animal Maintenance
Animals were housed five per cage. Feed and water were available ad libitum. Further de- tails of animal maintenance are given in Table 5. Cages were not rotated during the studies.
Clinical Examinations and Pathology
All animals were observed two times per day, and clinical signs were recorded a t least once per month. Body weights by cage were recorded once per week for the first 12 weeks of the study and once per month thereafter. Mean body weights were calculated for each group. Ani-mals found moribund and those surviving to the end of the studies were humanely killed. A nec- ropsy was performed on all animals including those found dead, except for tissues that were ex- cessively autolyzed or missing. Thus, the num- ber of animals from which particular organs or tissues were examined microscopically varies and is not necessarily equal to the number of animals that were placed on study.
During necropsy, all organs and tissues were ex- amined for grossly visible lesions. Tissues were preserved in 10% neutral buffered formalin, em- bedded in paraffin, sectioned, and stained with hematoxylin and eosin. Histopathologic exami- nation of tissues was performed according to an ‘‘inverse pyramid” design (McConnell, 1983a,b). That is, complete histopathologic examinations (Table 5) were performed on all high dose and vehicle control animals and on low dose animals dying before the end of the study. In addition, histopathologic examinations were performed on all grossly visible lesions in all dose groups. Po- tential target organs for chemically related neo- plastic and nonneoplastic effects were identified from the short-term studies or the literature and were determined by examination of the patholo- gy data; these target organs/tissues in the lower dose group were examined histopathologically.
If mortality in the highest dose group exceeded that in the vehicle control group by 15%, com- plete histopathologic examinations were per-formed on all animals in the second highest dose group in addition to those in the high dose group.
When the pathology evaluation was completed, the slides, paraffin blocks, and residual wet tis- sues were sent to the NTP Archives for inven- tory, slide/block match, and wet tissue audit. The slides, individual animal data records, and pathology tables were sent to an independent quality assessment laboratory. The individual animal records and tables were compared for ac- curacy, slides and tissue counts were verified, and histotechnique was evaluated. All tumor di- agnoses, all target tissues, and all tissues from a randomly selected 10% of the animals were eval- uated by a quality assessment pathologist. The quality assessment report and slides were sub- mitted to the Pathology Working Group (PWG) Chairperson, who reviewed all target tissues and those about which there was a disagreement between the laboratory and quality assessment pathologists.
Representative slides selected by the Chairper- son were reviewed by the PWG without knowl- edge of previously rendered diagnoses. When the consensus diagnosis of the PWG differed from that of the laboratory pathologist, the lab- oratory pathologist was asked to reconsider the original diagnosis. This procedure has been described, in part, by Maronpot and Boorman (1982) and Boorman et al. (1985). The final di- agnoses represent a consensus of contractor pathologists and the NTP Pathology Working Group. Special PWG sessions were conducted on all vehicle control and dosed male rats and fe- male mice to further evaluate hematopoietic neoplasms and anterior pituitary neoplasms, re- spectively. The materials for these evaluations were coded, randomized, and evaluated in a blind fashion. For subsequent analysis of pa- thology data, the diagnosed lesions for each tis- sue type are combined according to the guide- lines of McConnell et al. (1986).
Slides/tissues are generally not evaluated in a blind fashion (i.e., without knowledge of dose group) unless lesions in question are subtle or unless there is an inconsistent diagnosis of
31 Iodinated Glycerol, NTP TR 340

II. MATERIALS AND METHODS
lesions by the laboratory pathologist. Nonneo-plastic lesions are not examined routinely by the quality assessment pathologist or PWG unless they are considered part of the toxic effect of the chemical.
Statistical Methods
Datu Recording: Data on this experiment were recorded in the Carcinogenesis Bioassay Data System (Linhart e t al., 1974). The data elements include descriptive information on the chemi- cals, animals, experimental design, survival, body weight, and individual pathology results, a s recommended by the International Union Against Cancer (Berenblum, 1969).
Survival Analyses: The probability of survival was estimated by the product-limit procedure of Kaplan and Meier (1958) and is presented in the form of graphs. Animals were censored from the survival analyses a t the time they were found to be missing or dead from other than na tura l causes; animals dying from natural causes were not censored. Statistical analyses for a possible dose-related effect on survival used the method of Cox (1972) for testing two groups for equality and Tarone’s (1975) life table test for a dose- related trend. When significant survival differ- ences were detected, additional analyses using these procedures were carried out to determine the time point a t which significant differences in the survival curves were first detected. All re- ported P values for the survival analysis are two-sided.
Calculation of Incidence: The incidence of neo-plastic or nonneoplastic lesions is given as the ratio of the number of animals bearing such le- sions a t a specific anatomic site to the number of animals in which that site was examined. In most instances, the denominators include only those animals for which the site was examined histologically. However, when macroscopic ex- amination was required to detect lesions (e.g., skin or mammary tumors) prior to histologic sampling, or when lesions could have appeared a t multiple sites (e.g., lymphomas), the denomi- nators consist of the number of animals on which a necropsy was performed.
Analysis of Tumor Incidence: Three statistical methods are used to analyze tumor incidence data: life table tests, incidental tumor analysis, and Fisher exactEochran-Armitage trend analy- ses. Tests of significance include pairwise com-parisons of each dosed group with vehicle con- trols and tests for overall dose-response trends. For studies in which administration of the study compound has little effect on survival, the re- sults of the three alternative analyses will gen- erally be similar. When differing results a re obtained by the three methods, the final inter- pretation of the data will depend on the extent to which the tumor under consideration is regarded as being the cause of death. Continuity-cor-rected tests are used in the analysis of tumor in- cidence, and reported P values are one-sided. The procedures described below also were used to evaluate selected nonneoplastic lesions.
Life Table Analyses--The first method of analy- sis assumed that all tumors of a given type ob- served in animals dying before the end of the study were “fatal”; i.e., they either directly or in- directly caused the death of the animal. Ac-cording to this approach, the proportions of tu- mor-bearing animals in the dosed and vehicle control groups were compared at each point in time a t which an animal died with a tumor of in- terest. The denominators of these proportions were the total number of animals at risk in each group. These results, including the data from animals killed a t the end of the study, were then combined by the Mantel-Haenszel method (1959) to obtain an overall P value. This method of adjusting for intercurrent mortality is the life table method of Cox (1972) and of Tarone (1975). The underlying variable considered by this anal- ysis is time to death due to tumor. If the tumor is rapidly lethal, then time to death due to tumor closely approximates time to tumor onset. In this case, the life table test also provides a com-parison of the time-specific tumor incidences.
Incidental Tumor Analyses--The second method of analysis assumed that all tumors of a given type observed in animals that died before the end of the study were “incidental”; i.e., they were merely observed a t necropsy in animals dying of an unrelated cause. According to this
Iodinated Glycerol, NTP TR 340 32

II. MATERIALS AND METHODS
approach, the proportions of tumor-bearing animals in dosed and vehicle control groups were compared in each of five time intervals: weeks 0-52, weeks 53-78, weeks 79-92, week 93 to the week before the terminal-kill period, and the terminal-kill period. The denominators of these proportions were the number of animals actually examined for tumors during the time interval. The individual time interval compari- sons were then combined by the previously de- scribed method to obtain a single overall result. (See Haseman, 1984, for the computational de- tails of both methods.)
Fisher ExacWCochran-Armitage Trend Analy- ses--In addition to survival-adjusted methods, the results of the Fisher exact test for pairwise comparisons and the Cochran-Armitage linear trend test (Armitage, 1971; Gart et al., 1979) are given in the appendixes containing the analyses of tumor incidence. These two tests are based on the overall proportion of tumor-bearing animals and do not adjust for survival differences.
Historical Control Data: Although the concur- rent control group is always the first and most appropriate control group used for evaluation, there are certain instances in which historical control data can be helpful in the overall assess- ment of tumor incidence. Consequently, control tumor incidences from the NTP historical con- trol data base (Haseman et al., 1984, 1985) are included for those tumors appearing to show compound-related effects.
GENETIC TOXICOLOGY
Salmonella Protocol: Testing was performed as reported by Ames e t al. (1975) with modifi- cations listed below and described in greater detail by Zeiger et al. (1987). Chemicals were sent to the laboratories as coded aliquots from Radian Corporation (Austin, Texas). The study chemical was incubated with the Salmonella t yph imur ium tes ter s t ra ins (TA98, TA100, TA1535, and TA1537) either in buffer or S9 mix (metabolic activation enzymes and cofactors from Aroclor 1254-induced male Sprague Daw- ley rat or Syrian hamster liver) for 20 minutes a t 37" C before the addition of soft agar supple- mented with L-histidine and D-biotin and subse- quent plating on minimal glucose agar plates.
Incubation was continued for an additional 48 hours.
Iodinated glycerol was tested in all four strains; based on these test results, 3-iodo-1,2-propane- diol was tested only in strains TA98 and TA100. All trials were repeated.
Each test consisted of triplicate plates of concur- rent positive and negative controls and of at least five doses of the study chemical. The high dose was limited by toxicity or solubility but did not exceed 10 mg/plate. All negative assays were repeated, and all positive assays were re- peated under the conditions that elicited the pos-itive response.
A positive response was defined as a reproduci- ble, dose-related increase in histidine-indepen- dent (revertant) colonies in any one straidacti- vation combination. An equivocal response was defined as an increase in revertants which was not dose related, not reproducible, or of insuffi- cient magnitude to support a determination of mutagenicity. A response was considered nega- tive when no increase in revertant colonies was observed after chemical treatment.
Mouse Lymphoma Protocol: The experimental protocol is presented in detail by Myhr e t al. (1985) and follows the basic format of Clive et al. (1979). All study chemicals were supplied a s coded aliquots from Radian Corporation (Austin, Texas). The highest dose of the study compound was determined by solubility or toxicity and did not exceed 5 mg/ml. Mouse lymphoma L5178Y cells were maintained a t 37" C as suspension cul- tures in Fischer's medium supplemented with 2 mM L-glutamine, 110 pg/ml sodium pyruvate, 0.05% pluronic F68, antibiotics, and heat-inacti- vated horse serum; normal cycling time was about 10 hours. To reduce the number of sponta- neously occurring trifluorothymidine (Tftl-resis- tant cells, subcultures were exposed once to me- dium containing thymidine, hypoxanthine, methotrexate, and glycine for 1 day, to thymi- dine, hypoxanthine, and glycine for 1day, and to normal medium for 3-5 days. For cloning, horse serum content was increased and Noble agar was added. Freshly prepared S9 metabolic acti- vation factors were obtained from the liver of either Aroclor 1254-induced or noninduced male F344 rats.
33 Iodinated Glycerol, NTP TR 340

II. MATERIALS AND METHODS
All doses within an experiment, including con- current positive and solvent controls, were rep- licated. Treated cultures contained 6 X l o6cells in 10 ml of medium. This volume included the S9 fraction in those experiments performed with metabolic activation. Incubation with the study chemical continued for 4 hours, after which time the medidm plus chemical was removed and the cells were resuspended in 20 ml of fresh medium and incubated for a n additional 2 days to express the mutant phenotype. Cell density was moni- tored so that log phase growth was maintained. After the 48-hour expression period, 3 X lo6 cells were plated in medium and soft agar sup- plemented with Tft for selection of Tft-resistant cells (TK+’+), and 600 cells were plated in nonselective medium and soft agar to determine cloning efficiency. Plates were incubated at 37°C under 5% carbon dioxide for 10-12 days. All data were evaluated statistically for both trend and peak response. Both responses had to be significant (P<0.05)for a chemical to be con- sidered capable of inducing Tft resistance; a sin- gle significant response led to a n “equivocal” conclusion, and the absence of both a trend and a peak response resulted in a “negative” call.
Minimum criteria for accepting a n experiment as valid and a detailed description of the statisti- cal analysis and data evaluation are presented in Myhr et al. (1985). This assay was initially performed without S9; if a clearly positive re-sponse was not obtained, the experiment was re- peated with induced S9.
Chinese Hamster Ovary Cytogenetics Assays: Testing was performed as reported by Galloway et al. (1985, 1987) and is described briefly below. Chemicals were sent to the laboratories as coded aliquots from Radian Corporation (Austin, Tex- as). Chemicals were tested in cultured Chinese hamster ovary (CIIO) cells for induction of sister chromatid exchanges (SCEs) and chromosomal aberrations both in the presence and absence of Aroclor 1254-induced male Sprague Dawley rat liver S9 and cofactor mix. Cultures were han- dled under gold lights to prevent photolysis of bromodeoxyuridine (BrdU)-substituted DNA.
Each test consisted of concurrent solvent and positive controls and of at least three doses of the study chemical; the high dose was limited by toxicity or solubility but did not exceed 5 mg/ml.
In the SCE test without S9, CHO cells were incu- bated for 26 hours with the study chemical in McCoy’s 5A medium supplemented with 10% fe-tal bovine serum, L-glutamine (2 mM), and anti- biotics. BrdU was added 2 hours after culture initiation. After 26 hours, the medium contain- ing the study chemical was removed and re- placed with fresh medium plus BrdU and colce- mid, and incubation was continued for 2 more hours. Cells were then harvested by mitotic shake-off, fixed, and stained with Hoechst 33258 and Giemsa. In the SCE test with S9, cells were incubated with the chemical, serum-free medi- um, and S9 for 2 hours. The medium was then removed and replaced with medium containing BrdU and no study chemical; incubation pro- ceeded for an additional 26 hours, with colcemid present for the final 2 hours. Harvesting and staining were the same as for cells treated with- out s9.
In the chromosomal aberration test without S9, cells were incubated in McCoy’s 5A medium with the study chemical for 8 hours; colcemid was added, and incubation was continued for 2 hours. The cells were then harvested by mitotic shake-off, fixed, and stained with Giemsa. For the chromosomal aberration test with S9, cells were treated with the study chemical and S9 for 2 hours, after which the treatment medium was removed and the cells were incubated for 10 hours in fresh medium, with colcemid present for the final 2 hours. Cells were harvested in the same manner as for the treatment without S9.
For the SCE test, if significant chemical-induced cell cycle delay was seen, incubation time was lengthened to ensure a sufficient number of scor- able cells. The harvest time for the chromosom- al aberration test was based on the cell cycle in- formation obtained in the SCE test; if cell cycle delay was anticipated, the incubation period was extended approximately 5 hours.
Iodinated Glycerol, NTP TR 340 34

II. MATERIALS AND METHODS
Cells were selected for scoring on the basis of good morphology and completeness of karyotype (21 k 2 chromosomes). All slides were scored blind, and those from a single test were read by the same person. For the SCE test, 50 second-division metaphase cells were usually scored for frequency of SCEs per cell from each dose; 100 or 200 first-division metaphase cells were scored at each dose for the chromosomal aberration test. Classes of aberrations included simple (breaks and terminal deletions), complex (rearrange- ments and translocations), and other (pulverized cells, despiralized chromosomes, and cells con- taining 10or more aberrations).
Statistical analyses were conducted on both the slopes of the dose-response curves and the indiv- idual dose points. An SCE frequency 20% above the concurrent solvent control value was chosen a s a statistically conservative positive response. The probability of this level of difference oc- curring by chance a t one dose point is less than 0.01; the probability for such a chance occur- rence at two dose points is less than 0,001.Chro-mosomal aberration data are presented as per- centage of cells with aberrations. As with SCEs, both the dose-response curve and individual dose points were statistically analyzed. A statistical-
ly significant (P<0.003)effect on the slope of the curve or on a dose point (P<0.05) was sufficient for a conclusion of positive for a test.
Preliminary range-finding studies were per-formed to determine appropriate doses for the in vivo micronucleus test. Factors affecting dose selection included solubility of the chemical and animal lethality and/or cell cycle delay induced by chemical exposure. Male mice were injected intraperitoneally twice, a t 24-hour intervals, with the study chemical dissolved in phosphate- buffered saline; the total dosing volume was 0.4 ml. Solvent control animals were injected with 0.4 ml phosphate-buffered saline only. The positive control mice received injections of mito- mycin C. Twenty-four hours after the second in- jection, the mice were killed by cervical disloca- tion, and smears were prepared of the bone marrow cells obtained from the femurs. Air-dried smears were fixed and stained; 2,000 polychromatic erythrocytes were scored for fre- quency of micronucleated cells in each of five animals per dose group. The results were tabu- lated as the mean of the pooled results from all animals within a n exposure group, plus or minus the standard error of the mean.
35 Iodinated Glycerol, NTP TR 340

Iodinated Glycerol, NTP TR 340 36

III. RESULTS
RATS
SIXTEEN-DAY STUDIES
THIRTEEN-WEEK STUDIES
TWO-YEAR STUDIES Body Weights and Clinical Signs Survival Pathology and Statistical Analyses of Results
MICE
FIRST SIXTEEN-DAY STUDIES
SECOND SIXTEEN-DAY STUDIES
THIRTEEN-WEEK STUDIES
TWO-YEAR STUDIES Body Weights and Clinical Signs Survival Pathology and Statistical Analyses of Results
GENETIC TOXICOLOGY
37 IodinatedGlycerol, NTP TR 340

III. RESULTS: RATS
SIXTEEN-DAY STUDIES
Nine of 10 ra t s t ha t received 1,000 mg/kg iodinated glycerol and 1/5 females that received 500 mg/kg died before the end of the studies (Ta- ble 6). Mean body weights of surviving rats did not appear to be related to chemical administra- tion. No clinical signs or gross lesions observed a t necropsy could be clearly related to the chemical.
THIRTEEN-WEEK STUDIES
Three of 10 female rats that received 500 mg/kg and 1/10 females that received 62 mg/kg died before the end of the studies (Table 7). Final mean body weights of ra ts that received 500 mg/kg were 4% lower than that of vehicle con- trols for males and 7%lower for females. Kidney tubular cell regeneration was observed in both
vehicle control and dosed male rats (Table 8). The degree of severity of the lesion was greater in the 500 mgkg group than in the vehicle con- trol group. Kidney tubular cell regeneration and calcification were observed a t increased in- cidences in the survivors of the highest dose group of female rats. The average severity in- creased from minimal to mild to moderate as the dose increased. Severe renal cortical necrosis was observed in three high dose females that died early. Lymphoid hyperplasia of the stom- ach was observed in dosed male and female rats.
Dose Selection Rationale: Because of the inci- dence of deaths and the incidence and severity of kidney tubular cell regeneration and calcifica- tion,in rats receiving 500 mg/kg, doses selected for rats for the 2-year studies of iodinated glyc- erol were 125 and 250 mg/kg for males and 62 and 125 mg/kg for females, administered in wa- ter by gavage 5 days per week.
TABLE 6 . SURVIVAL AND MEAN BODY WEIGHTS OF RATS IN THE SIXTEEN-DAY GAVAGE STUDIES OF IODINATED GLYCEROL
Mean Body Weights (grams) Final Weight Relative Dose Survival (a) Initial (b) Final Change (a) to Vehicle Controls
(mg&!) (percent)
MALE
0 515 181 f 4 231 k 6 +50 f 3 62 515 181 f 4 220 f 9 +39 k 8 95
125 515 179 f 3 227 f 4 +48 f 2 98 250 515 180 f 4 232 f 7 +52 f 4 100 500 515 179 f 4 226 f 5 +47 k 4 98
1,000 (d) 115 180 k 3 224 +46 97
FEMALE
0 515 137 f 2 151 f 3 +14 f 3 62 515 137 f 3 151 f 3 + 1 4 f 1 100
125 515 137 f 2 156 f 4 +19 f 2 103 250 515 137 f 2 154 f 4 + 1 7 f 2 102 500 (e) 415 137 f 2 152 f 3 +14 f 2 101
1,000 (D015 137 k 2 (g) (g) (g)
(a)Number surviving/number initially in the group (b)Initial mean group body weight f standard error of the mean. Subsequent calculations are based on animals surviving to the end of the study. (c)Mean body weight change of the survivors f standard error ofthe mean (d)Day of death: all 9 (e)Day of death: 5 (D Day of death: 2,2,3,3,4 (g)No data are reported due to the 100% mortality in this group.
Iodinated Glycerol, NTP TR 340 38

TABLE 7. SURVIVAL AND MEAN BODY WEIGHTS OF RATS IN THE THIRTEEN-WEEK GAVAGE STUDIES OF IODINATED GLYCEROL
Mean Body Weights (prams) Final Weight Relative Dose Survival (a) Initial (b) Final (c) Change (d) to Vehicle Controls
MALE
0 loll0 121 f 3 330 f 8 +209 f 7 31 loll0 123 f 3 321 & 9 +198 f 8 97 62 loll0 121 f 3 320 f 9 +199 f 10 97 125 10110 122f 3 331 f 13 +209 f 11 100 250 10/10 122 f 3 328 f 9 +206 f 8 99 500 10/10 122f 3 318 f 7 +196 f 6 96
FEMALE
0 10/10 104f 2 200 f 3 +96f 2 31 10/10 104f 2 204f 4 +loof 3 102 62 (e)9/10 104f 2 205 f 3 +loof 2 103 125 10/10 104k 2 207 f 2 +lo3 f 2 104 250 10/10 104f 2 202 f 4 +98f 3 101 500 (07/10 103 f 2 186 f 3 +82f 4 93
(a)Number surviving/number initially in the group (b)Initial mean group body weight f standard error of the mean. Subsequent calculations are based on animals surviving to the end of the study. (c)Final body weights were taken after 12weeks on study. (d)Mean body weight change of the survivors f standard error of the mean (e)Week of death: 12 Cf, Week ofdeath: 11,12,13;(the rat dying during week 13 is included in the final mean body weight and weight change calculations).
TABLE 8. NUMBERS OF RATS WITH RENAL LESIONS IN THE THIRTEEN-WEEK GAVAGE STUDIES OF IODINATED GLYCEROL (a,b)
Male Female Lesion Vehicle Control 500 mg/kg Vehicle Control 250 mg/kg 500 m a g
Tubular cell regeneration 7 10 0 0 8 Calcification 0 0 2 2 7
(a)Ten animals examined in each group (b)Results of quality assurance pathology review
TWO-YEAR STUDIES thereafter (Table 9 and Figure 8). Mean body weights of low dose male rats and high dose fe- Body Weights and Clinical Signs male rats were 4%-9% lower than those of vehi-
Mean body weights of high dose male rats were cle controls from week 88 to the end of the stud- 5%-10% lower than those of vehicle controls ies, Sneezing in male and female high dose rats from week 43 to week 68 and 10%-13%lower may have been compound related.
39 Iodinated Glycerol, NTP TR 340

TABLE 9. MEAN BODY WEIGHTS AND SURVIVAL OF RATS IN THE TWO-YEAR GAVAGE STYDIES OF IODINATED GLYCEROL
Weeks on
Study
Vehicle Control Av. Wt. No. of (grams) Survivors
Av. Wt. (grams)
Low Dose Wt. (percent of veh. controls)
No. of Survivors
Av. Wt. (grams)
High Dose Wt. (percent of veh. controls)
NO.of Survivors
MALE 125 mg/kg 250 mgkg
0 112 50 102 91 50 109 97 50 1 157 50 149 95 50 155 99 50 2 191 50 182 95 50 182 95 50 3 214 50 210 98 50 215 100 50 4 239 50 236 99 50 240 100 50 5 253 50 250 99 50 254 100 50 6 262 50 262 100 50 268 102 50 8 287 50 289 101 50 293 102 50 9 296 50 298 101 50 300 101 50 11 310 50 311 100 50 311 100 50 12 310 50 319 103 50 314 101 50 16 342 50 339 99 50 340 99 49 20 365 50 359 98 50 356 98 49 24 379 50 379 100 50 374 99 49 27 390 50 389 100 50 373 96 49 31 409 50 405 99 50 397 97 49 36 423 50 421 100 50 411 97 49 40 438 50 434 99 50 424 97 49 43 443 50 428 97 50 420 95 49 48 452 50 442 98 49 424 94 49 52 451 50 444 98 48 424 94 49 56 454 50 444 98 47 419 92 49 60 457 50 448 98 47 422 92 49 63 467 49 452 97 47 426 91 49 68 464 49 449 97 47 418 90 48 72 461 48 436 95 47 411 89 47 76 466 47 446 96 46 416 89 45 80 455 46 436 96 45 411 90 44 83 458 44 443 97 42 398 87 40 88 450 42 429 95 40 396 88 30 92 444 39 417 94 38 393 89 27 96 445 37 409 92 32 385 87 21 100 437 35 404 92 24 385 88 9 104 432 28 408 94 20 376 87 4
FEMALE 62 m*s 125 mg/kg
0 93 50 92 99 50 90 97 50 1 121 50 120 99 50 117 97 50 2 136 50 137 101 50 132 97 50 3 146 50 145 99 50 142 97 50 4 160 50 161 101 50 152 95 50 5 169 50 168 99 50 164 97 50 6 164 50 165 101 50 168 102 50 8 199 50 184 92 50 179 90 50 9 191 50 189 99 50 187 98 50 11 209 50 195 93 50 193 92 50 12 199 50 197 99 50 203 102 50 16 206 50 207 100 50 204 99 50 20 212 50 213 100 50 205 97 50 24 221 50 219 99 50 219 99 50 27 219 50 223 102 50 223 102 50 31 235 50 246 105 50 233 99 50 36 240 50 238 99 50 238 99 50 40 248 50 246 99 50 245 99 50 43 256 50 252 98 49 252 98 50 48 52
264 266
50 50
260 264
98 99
49 49
258 262
98 98
50 50
56 274 50 275 100 49 268 98 50 60 286 50 283 99 49 280 98 50 63 300 49 296 99 49 294 98 50 68 315 49 311 99 48 298 95 50 72 321 47 313 98 48 300 93 49 76 331 45 322 97 48 312 94 49 80 327 44 314 96 46 311 95 48 83 335 43 326 97 44 312 93 47 88 343 41 333 97 41 321 94 45 92 340 40 328 96 41 317 93 39 96 342 36 331 97 36 328 96 37 100 347 32 330 95 33 315 91 33 104 345 31 334 97 30 320 93 27
Iodinated Glycerol, NTP TR 340 40

5 0 0 . 0 5 0 0 . 0
450.0 450.0
400.0 400 .0
350.0 350.0
3 0 0 . 0 3 0 0 . 0
250.0 250.0
200.0 200.0
150.0 150.0
100.0 100.0
50.0. 5 0 . 0 15 30 45 60 75 90 1
WEEKS ON STUDY
5 0 0 . 0 500 .0
450.0 450.0
400.0 400.0
350 .0 3 5 0 . 0
5 0 0 . 0 3 0 0 . 0
. . .. . , , .... , , ,,....., ,.250.0 250.0
2 0 0 . 0 200.0
150.0 150.0
100.0 100.0
s o . 0 . I ! I 1 1 1 1 1
1 1 5 0 . 0
0 15 3 0 4 5 6 0 7 5 9 0 105 WEEKS ON STUDY
FIGURE 8. GROWTH CURVES FOR RATS ADMINISTERED IODINATED GLYCEROL IN WATEH BY GAVAGE FOR TWO YEARS
41 Iodinated Glycerol, NTP TR 340
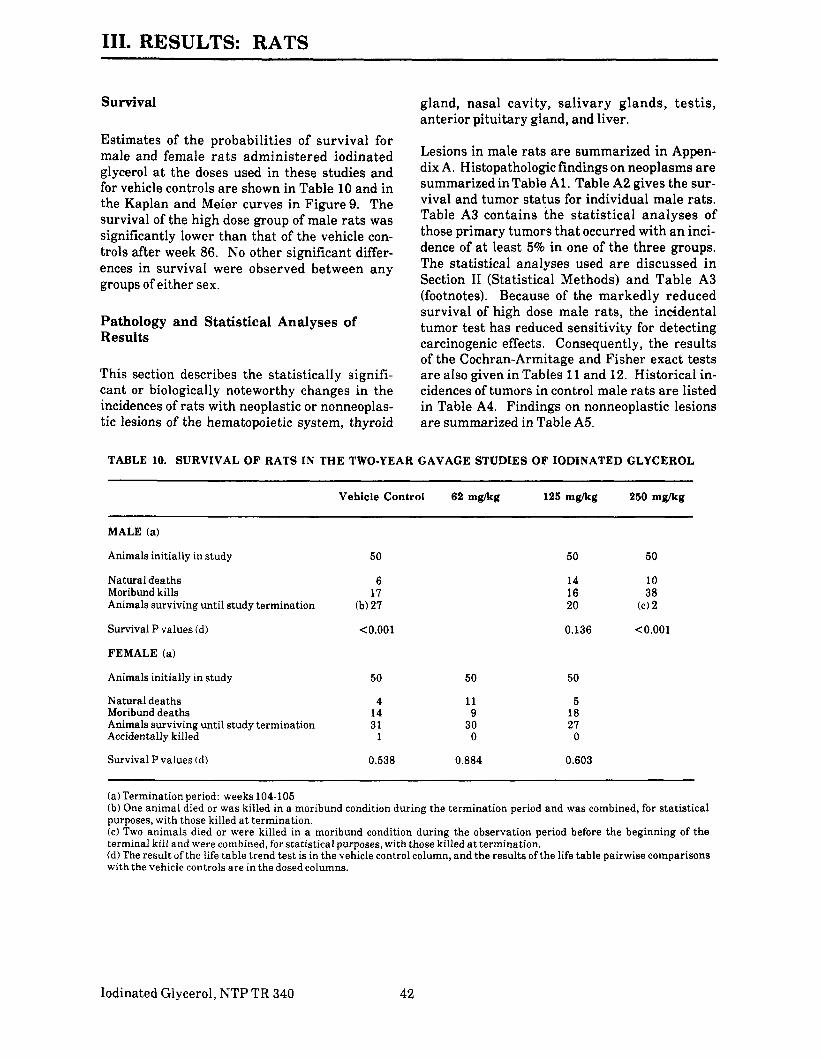
III. RESULTS: RATS
Survival gland, nasal cavity, salivary glands, testis , anterior pituitary gland, and liver.
Estimates of the probabilities of survival for male and female ra t s administered iodinated glycerol a t the doses used in these studies and for vehicle controls are shown in Table 10 and in the Kaplan and Meier curves in Figure9. The survival of the high dose group of male rats was significantly lower than that of the vehicle con- trols after week 86. No other significant differ- ences in survival were observed between any groups of either sex.
Pathology and Statistical Analyses of Results
This section describes the statistically signifi- cant or biologically noteworthy changes in the incidences of rats with neoplastic or nonneoplas- tic lesions of the hematopoietic system, thyroid
Lesions in male rats are summarized in Appen- dix A. Histopathologic findings on neoplasms are summarized inTable Al . Table A2 gives the sur- vival and tumor status for individual male rats. Table A3 contains the statistical analyses of those primary tumors that occurred with an inci- dence of a t least 5% in one of the three groups. The statistical analyses used a re discussed in Section II (Statistical Methods) and Table A3 (footnotes). Because of the markedly reduced survival of high dose male rats, the incidental tumor test has reduced sensitivity for detecting carcinogenic effects. Consequently, the results of the Cochran-Armitage and Fisher exact tests are also given in Tables 11and 12. Historical in- cidences of tumors in control male rats are listed in Table A4. Findings on nonneoplastic lesions are summarized in Table A5.
TABLE 10. SURVIVAL OF RATS IN THE TWO-YEAR GAVAGE STUDIES OF IODINATED GLYCEROL
Vehicle Control 62 mg/kg 125 mg/kg 250 mg/kg
MALE (a)
Animals initially in study
Natural deaths Moribund kills Animals surviving until study termination
Survival P values (d)
FEMALE (a)
Animals initially in study
Natural deaths Moribund deaths Animals surviving until study termination Accidentally killed
Survival P values (d)
(a)Termination period: weeks 104-105
50 50 50
6 14 10 17 16 38
(b)21 20 (c)2
<0.001 0.136 <0.001
50 50 50
4 11 5 14 9 18 31 30 21 1 0 0
0.538 0.884 0.603
(b)One animal died or was killed in a moribund condition during the termination period and was combined, for statistical purposes, with those killed a t termination. ( c ) Two animals died or were killed in a moribund condition during the observation period before the beginning of the terminal kill and were combined, for statistical purposes, with those killed at termination. (d)The result of the life table trend test is in the vehicle control column, and the results of the life table pairwise comparisons with the vehicle controls are in the dosed columns.
Iodinated Glycerol, NTP TR 340 42

1.0
0.9
0 . 8
0.7
0 . 6
0 . 5
0 . 4
0 . 3
0 . 2
0.1
0 . 0
FIGURE 9. KAPLAN-MEIER SURVIVAL CURVES FOR RATS ADMINISTERED IODINATED GLYCEROL IN WATER BY GAVAGE FOR TWO YEARS
43 Iodinated Glycerol,, NTP TR 340

III. RESULTS: RATS
Lesions in female rats are summarized in Ap- pendix B. Histopathologic findings on neo-plasms are summarized in Table B1. Table B2 gives the survival and tumor status for individ- ual female rats. Table B3 contains the statisti- cal analyses of those primary tumors that oc-curred with an incidence of a t least 5% in one of the three groups. The statistical analyses used are discussed in Section II (Statistical Methods) and Table B3 (footnotes). Historical incidences of tumors in control female rats are listed in Table B4. Findings on nonneoplastic lesions are summarized in Table B5.
Hematopoietic System: Mononuclear cell leuke- mia in male rats occurred with a positive trend; the incidences in the dosed groups were greater than that in the vehicle controls (Table 11).
Thyroid Gland: Follicular cell carcinomas oc-curred with a significantly greater incidence in low dose male rats than in vehicle controls (Ta- ble 12). Follicular cell carcinomas were ob- served in one low dose and one high dose female rat. Follicular cell adenomas were not observed in male or female rats. The follicular cell car- cinomas were circumscribed, expansile masses that compressed the adjacent thyroid parenchy- ma. The masses consisted of disorganized
follicular epithelium arranged in irregular folli- cle-like structures and solid clusters. Variable cellular pleomorphism and atypia and a scir- rhous reaction, characterized by the prolifera- tion of immature collagenous connective tissue, were sometimes present. Foci of cystic hyper- plasia consisted of dilated follicles with short papillary projections of follicular epithelium ex- tending into the lumen. The affected follicles were usually filled with colloid. Lesions classi- fied as follicular cell hyperplasia were small foci of irregular follicles with complex in-folding of the follicular epithelium. There were no other chemical-related nonneoplastic lesions of the thyroid gland in male or female rats. The size of the follicles, height of the follicular epithelium, and staining qualities of the colloid in rats given iodinated glycerol were not different from those in vehicle controls. Thus, the spectrum of le- sions characteristic of a “goitrogenic” effect were not present in the thyroid of exposed rats.
Nasal Cavity: Adenomas were observed in 2/49 high dose male rats. Adenomas were not diag- nosed in 1,936 untreated historical control male F344/N rats. A squamous cell papilloma and a squamous cell carcinoma have been observed in 1,936 untreated historical control male F344/N rats.
TABLE 11. MONONUCLEAR CELL LEUKEMIA IN MALE RATS IN THE TWO-YEAR GAVAGE STUDY OF IODINATED GLYCEROL (a,b)
Overall Rates Adjusted Rates Terminal Rates Week of First Observation Life Table Tests Incidental Tumor Tests Cochran-Armitage Trend Test Fisher Exact Test
Vehicle Control
14/50(28%)35.9% 6/28 (21%) 62 P<O.OOl P=0.174 P=0.028
125 mg/kg 250 mg/kg
29/50(58%) 24/50 (48%) 69.5% 65.2% 9/20 (45%) 014(0%)55 64 P=O.OOl P< 0.001 P=0.003 P=0.226
P=0.002 P=0.032
(a)The statistical analyses used are discussed in Section II (Statistical Methods) and Table A3 (footnotes).(b) Historical incidence of leukemia in water gavage vehicle controls (mean k SD): 118/300 (39% f 16%); historical incidence in untreated controls: 636/1,936 (33% f 15%
Iodinated Glycerol, NTP TR 340 44
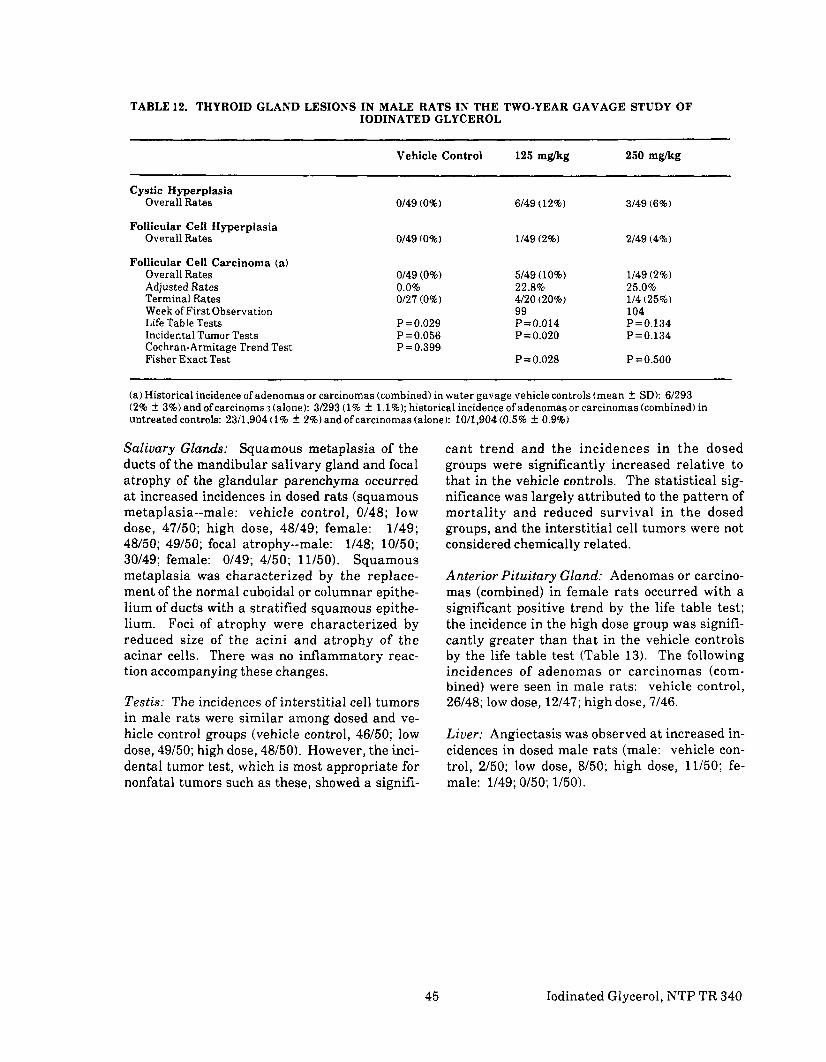
TABLE 12. THYROID GLAND LESIONS IN MALE RATS IN THE TWO-YEAR GAVAGE STUDY OF IODINATED GLYCEROL
Vehicle Control 125 mg/kg 250 mg/kg
Cystic Hyperplasia Overall Rates 0149 (0%) 6/49(12%) 3/49 (6%)
Follicular Cell Hyperplasia Overall Rates 0149 (0%) 1/49(2%) 2149 (4%)
Follicular Cell Carcinoma (a) Overall Rates 0149(0%) 5/49 (10%) 1/49(2%) Adjusted Rates 0.0% 22.8% 25.0% Terminal Rates 0127(0%) 4/20(20%) 114(25%) Week ofFirst Observation 99 104 Life Table Tests P=0.029 P=0.014 P = 0.134 Incidental Tumor Tests P =0.056 P=0.020 P=0.134 Cochran-Armitage Trend Test P=0.399 Fisher Exact Test P=0.028 P =0.500
(a)Historical incidence of adenomas or carcinomas (combined) in water gavage vehicle controls (mean f SD): 61293 (2% t 3%) and ofcarcinoma; (alone): 3/293(1% k 1.1%);historical incidence ofadenomas or carcinomas (combined) in untreated controls: 23/1,904(1% k 2%) and ofcarcinomas (alone): 10/1,904(0.5% k 0.9%)
Salivary Glands: Squamous metaplasia of the cant trend and the incidences in the dosed ducts of the mandibular salivary gland and focal groups were significantly increased relative to atrophy of the glandular parenchyma occurred that in the vehicle controls. The statistical sig- at increased incidences in dosed rats (squamous nificance was largely attributed to the pattern of metaplasia--male: vehicle control, 0148; low mortality and reduced survival in the dosed dose, 47/50; high dose, 48/49; female: 1/49; groups, and the interstitial cell tumors were not 48/50; 49/50; focal atrophy--male: 1/48; 10150; considered chemically related. 30149; female: 0149; 4/50; 11/50). Squamous metaplasia was characterized by the replace- Anterior Pituitary Gland: Adenomas or carcino-ment of the normal cuboidal or columnar epithe- mas (combined) in female rats occurred with a lium of ducts with a stratified squamous epithe- significant positive trend by the life table test; lium. Foci of atrophy were characterized by the incidence in the high dose group was signifi- reduced size of the acini and atrophy of the cantly greater than that in the vehicle controls acinar cells. There was no inflammatory reac- by the life table test (Table 13). The following tion accompanying these changes. incidences of adenomas or carcinomas (com-
bined) were seen in male rats: vehicle control, Testis: The incidences of interstitial cell tumors 26/48; low dose, 12/47; high dose, 7/46. in male rats were similar among dosed and ve- hicle control groups (vehicle control, 46/50; low Liver: Angiectasis was observed a t increased in- dose, 49/50; high dose, 48/50). However, the inci- cidences in dosed male rats (male: vehicle con- dental tumor test, which is most appropriate for trol, 2/50; low dose, 8/50; high dose, 11/50; fe-nonfatal tumors such as these, showed a signifi- male: 1/49; 0150;1/50).
45 Iodinated Glycerol, NTP TR 340

TABLE 13. ANTERIOR PITUITARY GLAND LESIONS IN FEMALE RATS IN THE TWO-YEAR GAVAGE STUDY OF IODINATED GLYCEROL
Vehicle Control 62 mg/kg 125 mg/kg
Focal Hyperplasia Overall Rates 2/48 (4%) 1/50 (2%) 1/50 (2%)
Adenoma Overall Rates 26/48 (54%) 24/50 (48%) 33/50 (66%) Adjusted Rates 70.0% 58.5% 81.9% Terminal Rates 20/31(65%) 14/30 (47%) 20127 (74%) Week of First Observation 83 42 87 Life Table Tests P=0.064 P =0.466N P =0.064 Incidental Tumor Tests P=0.158 P =0.266N P=0.141
Carcinoma Overall Rates 0/48 (0%) 3/50 (6%) 1/50 (2%) Adjusted Rates 0.0% 9.7% 3.7% Terminal Rates 0131 (0%) 2/30 (7%) 1/27 (4%) Week of First Observation 103 104 Life Table Tests P=0.342 P=O.119 P =0.472 Incidental Tumor Tests P =0.372 P=0.130 P =0.472
Adenoma or Carcinoma (a) Overall Rates 26/48 (54%) 27/50 (54%) 34/50 (68%) Adjusted Rates 70.0% 64.9% 84.5% Terminal Rates 20/31(65%) 16/30 (53%) 21/27 (78%) Week of First Observation 83 42 87 Life Table Tests P=0.043 P=0.461 P =0.042 Incidental Tumor Tests P = 0.108 P=0.495N P =0.092
(a)Historical incidence in water gavage vehicle controls (mean k SD): 140/290 (48% 5 6%);historical incidence in untreated controls: 93911,922 (49% f 11%)
Iodinated Glycerol, NTP TR 340 46

FIRST SIXTEEN-DAY STUDIES
Deaths occurred in vehicle control mice and in the dosed groups because of dehydration due to a malfunction in the automatic watering system. These studies were repeated.
SECOND SIXTEEN-DAY STUDIES
One female mouse that received 500 mg/kg and one female vehicle control died before the end of the studies (Table 14). The forestomach of 215 females that received 500 mg/kg was thickened and granular.
THIRTEEN-WEEK STUDIES
One of 10 female mice that received 500 mg/kg
III. RESULTS: MICE
died before the end of the studies and had severe necrosis of the kidney (Table 15). Compound- related effects in female mice included kidney tubular cell regeneration randomly scattered throughout the renal cortex and inflammation or abscess of the forestomach (Table 16). The in- flammation and abscesses were characterized microscopically by focal aggregates of polymor-phonuclear leukocytes within the s t ra t i f ied squamous epithelium of the forestomach.
Dose Selection Rationale: Iodinated glycerol doses selected for mice for the 2-year studies were 125 and 250 mg/kg for males (based on mild gastric lesions) and 62 and 125 mg/kg for females (based on kidney and stomach lesions) administered in water by gavage 5 days per week.
TABLE 14. SURVIVAL AND MEAN BODY WEIGHTS OF MICE IN THE SECOND SIXTEEN-DAY GAVAGE STUDIES OF IODINATED GLYCEROL
Mean Body Weights (grams) Final Weight Relative Dose Survival (a) Initial (b) Final Change (c) to Vehicle Controls
(mg/kg) (percent)
MALE
0 515 28.3 f 1.0 30.6 k 1.0 +2.3 f 0.3 31 515 28.0 f 1.1 29.9 f 1.0 +1.9 f 0.6 97.7 62 515 28.3 f 1.4 29.6 f 1.4 +1.3 f 0.4 96.7
125 515 28.4 f 1.7 30.4 f 1.6 +2.0 f 0.5 99.3 250 515 28.1 ? 1.7 29.2 f 1.5 +1.1 f 1.1 95.4 500 515 28.3 f 0.9 29.4 f 0.7 +1.1 f 0.5 96.1
FEMALE
0 (d)415 22.3 f 1.2 23.8 f 1.4 +0.9 f 0.4 31 515 22.5 f 0.7 23.3 f 0.5 +0.8 f 0.4 97.9 62 5/5 22.2 k 0.7 22.9 f 0.8 +0.7 k 0.4 96.2
125 515 21.5 f 0.6 22.2 f 0.5 +0.7 k 0.4 93.3 250 515 22.2 f 0.5 22.8 f 0.4 +0.6 f 0.5 95.8 500 (e)415 21.8 f 0.5 22.3 f 0.5 +0.5 f 0.4 93.7
(a)Number surviving/number initially in grouptb) Initial mean group body weight f standard error of the mean. Subsequent calculations are based on animals surviving to the end of the study. (e)Mean body weight change of the survivors f standard error of the mean (d)Death occurred on the day of necropsy.(e)Day of death: 2
47 Iodinated Glycerol, NTP TR 340

TABLE 15. SURVIVAL AND MEAN BODY WEIGHTS OF MICE IN THE THIRTEEN-WEEK GAVAGE STUDIES OF IODINATED GLYCEROL
Mean Body Weights (mams) Final Weight Relative Dose Survival (a) Initial (b) Final Change (c) to Vehicle Controls
(mg/kg) (percent)
MALE
0 1011 0 25.5f0.5 34.5k 1.3 +9.0 f0.9 31 10110 25.8f 0.5 36.4f0.9 + 10.6f0.5 105.5 62 loll0 25.6k 0.5 36.7f 1.1 +11.1f 0.8 106.4 125 10/10 25.4f0.5 34.0k 0.6 +8.6f 0.3 98.6 250 loll0 25.9f0.5 35.1f0.4 +9.2f0.4 101.7 500 10/10 25.4k 0.5 34.5f0.9 +9.1k 0.5 100.0
FEMALE
0 10/10 19.6k 0.3 27.4f0.7 +7.8f0.5 31 10/10 20.0f 0.3 28.7f 0.6 +8.7f0.4 104.7 62 10/10 19.4f0.3 27.1 f0.5 +7.7 f 0.5 98.9 125 10/10 19.8k 0.3 27.0k 0.5 4-7.2f0.3 98.5 250 10/10 19.6f0.2 27.4k 0.3 +7.8 f0.3 100.0 500 (d)9/10 19.6k 0.3 27.7f0.4 +8.2f0.5 101.1
(a)Number surviving/number initially in group (b)Initial mean group body weight f standard error ofthe mean. Subsequent calculations are based on animals surviving to the end of the study. (c )Mean body weight change of the survivors k standard error of the mean (d)Week of death: 1
TABLE 16. NUMBERS OF FEMALE MICE WITH SELECTED LESIONS IN THE THIRTEEN-WEEK GAVAGE STUDY OF IODINATED GLYCEROL (a)
Sitenesion Vehicle Control 125 mg/kg 250 mg/kg 500 mg/kg
KidneyTubular cell regeneration 0 0 2 5
Forestomach Inflammation or abscess 0 (b) 0 5 Hyperplasia, acanthosis,
and/or hyperkeratosis 0 (b) 0 7
(a)Ten animals were examined in each group. (b)Not examined
TWO-YEAR STUDIES Mean body weights of high dose female mice were 6%-8% lower than those of vehicle controls Body Weights and Clinical Signs from week 40 to week 64 and were 9%-13%lower
Mean body weights of dosed and vehicle control thereafter. No compound-related clinical signs male mice were similar (Table 17 and Figure 10). were observed.
Iodinated Glycerol, NTP TR 340 48

TABLE 17. MEAN BODY WEIGHTS AND SURVIVAL OF MICE IN THE TWO-YEAR GAVAGE STUDIES OF IODINATED GLYCEROL
Weeks on
Study
MALE
0 1 2 3 4 5 6 7 8 9
10 11 12 16 20 24 28 32 36 40 44 48 52 56 60 64 68 72 76 80 84 88 92 96
100 104
FEMALE
0 1 2 3 4 5 6 7 8 9
10 11 12 16 20 24 28 32 36 40 44 48 52 56 60 64 68 72 76 80 84 88 92 96
100 104
Vehicle Control Av. Wt. No. of (grams) Survivors
Av. Wt. (grams)
Low Dose Wt. (percent of veh. controls)
No. of Survivors
Av. Wt. (grams)
High Dose Wt. (percent of veh. controls)
No. of Survivors
125 mg/kg 250 mg/kg
23.7 50 23.3 98 50 23.0 97 50 25.2 50 25.2 100 50 25.2 100 50 26.1 50 26.8 103 50 27.5 105 49 27.0 50 26.8 99 50 27.0 100 49 28.0 50 27.0 96 50 27.3 98 49 28.5 50 28.6 100 50 29.3 103 49 30.0 50 29.6 99 50 28.9 96 49 29.9 50 30.7 103 50 30.4 102 49 30.0 50 31.1 104 50 30.4 101 49 32.1 50 31.4 98 50 31.6 98 49 32.5 50 31.8 98 50 30.9 95 49 32.0 50 32.6 102 50 31.8 99 49 33.4 50 32.6 98 50 32.7 98 49 34.1 50 34.0 100 50 33.9 99 47 34.9 50 34.9 100 50 34.9 100 47 36.0 50 35.8 99 50 35.8 99 47 36.0 50 36.0 100 50 36.4 101 47 35.6 50 34.6 97 50 34.4 97 47 36.1 50 37.2 103 50 36.5 101 47 37.3 50 37.2 100 50 37.2 100 45 37.7 50 38.3 102 50 38.0 101 45 39.8 49 39.5 99 50 39.0 98 45 37.3 48 37.8 101 50 38.0 102 44 38.8 48 38.0 98 50 38.5 99 44 38.0 48 38.3 101 50 38.2 101 44 39.1 48 38.6 99 50 39.3 101 44 39.1 48 38.2 98 50 38.8 99 43 39.5 48 38.7 98 50 38.6 98 43 39.8 47 38.7 97 50 38.8 97 42 39.3 47 39.4 100 50 39.0 99 41 39.3 46 38.8 99 50 38.6 98 41 39.8 46 38.4 96 48 38.9 98 39 39.5 44 38.8 98 46 38.9 98 37 39.3 41 38.9 99 45 40.3 103 35 38.9 38 38.4 99 42 37.7 97 35 39.4 36 38.5 98 40 38.2 97 32
62 m&g 125 mg/kg
18.8 50 18.9 101 50 18.4 98 50 19.5 50 19.7 101 49 19.8 102 50 20.0 50 20.5 103 49 20.7 104 50 20.6 50 20.9 101 49 21.4 104 50 21.7 50 21.1 97 49 21.6 100 50 22.8 50 23.1 101 49 23.0 101 50 24.5 50 23.1 94 49 23.1 94 50 23.8 50 23.7 100 49 23.8 100 50 24.9 50 24.5 98 49 24.5 98 50 25.5 so 25.1 98 49 24.1 95 50 25.1 50 '25.0 100 49 24.4 97 50 25.0 so 24.6 98 49 24. L 96 50 26.0 50 26.2 101 49 25.2 97 50 27.7 50 27.0 97 49 26.0 94 50 29.0 50 28.1 97 49 28.1 97 50 30.3 50 29.9 99 49 29.0 96 50 31.2 50 30.7 98 49 29.5 95 50 31.1 50 30.4 98 49 29.6 95 50 32.3 50 31.7 98 49 30.9 96 50 33.5 50 32.8 98 48 31.3 93 50 35.3 50 34.6 98 48 32.9 93 50 36.8 50 35.4 96 47 34.2 93 50 37.0 50 36.1 98 47 34.9 94 50 38.7 50 37 4 97 46 35.5 92 49 39.3 50 38.7 98 46 36.2 92 49 40.3 50 39.1 97 46 36.9 92 49 41.7 50 39.5 95 46 36.1 87 49 41.8 50 40.1 96 46 36.7 88 48 41.6 50 40.4 97 45 36.5 88 48 44.1 50 42.5 96 44 39.0 88 48 43.2 50 42.8 99 43 38.1 88 48 43.4 48 43.9 101 42 39.6 9 1 47 45.0 47 45.4 101 39 40.1 89 47 45.4 46 46.3 102 37 41.2 9 1 46 45.3 44 47.3 104 35 402 90 43 44.7 42 45.5 102 34 40.9 9 1 38
49 Iodinated Glycerol, NTP TR 340

v)IU K c3 3 I-I 2 W 3* a 0 m Z 4 WI
v)IU a 0
z, I-S 2 W 5
P 0 m zU WI
50.0 - 50.0
............................45.0 - 45.0
40 .0 ........................... - 40.0
...........................35.0 - 35.0
30 .0 - 3 0 . 0
25.0 ......................... - 25.0
20.0 - 20.0
15.0 - 15.0 5
WEEKS ON STUDY
5 0 . 0
.... 45.0
B
2...................... ....................... 40.0dA A
1 ............................ .............................. - 35.0
............................ .............................. - 50.0
........................... ............................. c - 25.0
FEMALE e IVEHIt 0 = 6 2 M[ ................. 2 0 . 0A=125 M
15.0 D 105
FIGURE 10. GROWTH CURVES FOR MICE ADMINISTERED IODINATED GLYCEROL IN WATER BY GAVAGE FOR TWO YEARS
Iodinated Glycerol, NTP TR 340 50

Survival
Estimates of the probabilities of survival for male and female mice administered iodinated glycerol a t the doses used in these studies and for vehicle controls are shown in Table 18and in the Kaplan and Meier curves in Figure 11. No significant differences in survival were observed between any groups of either sex.
Pathology and Statistical Analyses of Results
This section describes the statistically signifi- cant or biologically noteworthy changes in the incidences of mice with neoplastic or nonneo- plastic lesions of the anterior pituitary gland, harderian gland, l iver, thyroid gland, and forestomach.
Lesions in male mice are summarized in Appen- dix C. Histopathologic findings on neoplasms are summarized in Table C 1. Table C2 gives the
III. RESULTS: MICE
survival and tumor status for individual male mice. Table C3 contains the statistical analyses of those primary tumors that occurred with a n incidence of a t least 5% in one of the three groups. The statistical analyses used are dis- cussed in Section II (Statistical Methods) and Table C3 (footnotes). Findings on nonneoplastic lesions are summarized in Table C4.
Lesions in female mice are summarized in Ap- pendix D. Histopathologic findings on neo- plasms are summarized in Table D1. Table D2 gives the survival and tumor status for individ- ual female mice. Table D3 contains the statisti- cal analyses of those primary tumors that oc-curred with an incidence of a t least 5% in one of the three groups. The statistical analyses used are discussed in Section II (Statistical Methods) and Table D3 (footnotes). Historical incidences of tumors in control female mice are listed in Ta- ble D4. Findings on nonneoplastic lesions a re summarized in Table D5.
TABLE IS. SURVIVAL OF MICE IN THE TWO-YEAR GAVAGE STUDIES OF IODINATED GLYCEROL
Vehicle Control 62 mg/kg 125 mg/kg 250 mg/kg
MALE (a)
Animals initially in study 50 50 50
Natural deaths 7 5 9 Moribund kills I 5 10 Animals surviving until study termination 36 40 (b)31
Survival P values (c) 0.320 0.431 0.388
FEMALE (a)
Animals initially in study 50 50 50
Natural deaths 6 9 4 Moribund kills 6 8 8 Animals surviving until study termination (d)38 33 38
Survival P values (c) 0.724 0.111 0.768
(a)Termination period: male--weeks 104-106;female--weeks105-106 (b)One animal died or was killed in a moribund condition during the termination period and was combined, for statistical purposes, with those killed at termination. (c) The result of the life table trend test is in the vehicle control column, and the results of the life table pairwise comparisons with the vehicle controls are in the dosed columns. (d)Two animals died or were killed in a moribund condition during the termination period and were combined, for statistical purposes, with those killed at termination.
51 Iodinated Glycerol, NTP TR 340

1.0
0.9
0 . 8
0.7
0 . 6 7'5 9'0 10s 1 I
STUDY
IWEEKS ON STUDY
FIGURE 11 . KAPLAN-MEIER SURVIVAL C U R V E S FOR MICE ADMINISTERED IODINATED GLYCEROL IN WATER BY GAVAGE FOR TWO YEARS
Iodinated Glycerol, NTP TR 340 52

III. RESULTS: MICE
Anterior Pituitary Gland: Adenomas in females dose, 5/45;focal hyperplasia: 0144; 1/42; 5/45). occurred with a significant positive trend; the in- Anterior pituitary gland neoplasms were seen in cidence in the high dose group was significantly 0144vehicle control, 1/42low dose, and 1/45high greater than that in the vehicle controls (Table dose male mice. 19). No carcinomas were observed. Hyperplasia of the anterior pituitary gland was not increased Harderian Gland: Adenomas in female mice oc-in dosed female mice in relation to the vehicle curred with a significant positive trend, and the controls. Cysts and hyperplasia were observed incidence of adenomas or carcinomas (combined) a t increased incidences in high dose male mice in high dose female mice was significantly great- (cysts: vehicle control, 1/44;low dose, 2/42;high er than that in vehicle controls (Table 20).
TABLE 19. ANTERIOR PITUITARY GLAND LESIONS IN FEMALE MICE IN THE TWO-YEAR GAVAGE STUDY OF IODINATED GLYCEROL (a)
Vehicle Control 62 mg/kg 125 mg/kg
Hyperplasia Overall Rates 21/47 (45%) 18/45 (40%) 19/46 (41%)
Adenoma (b) Overall Rates 10147 (21%) 15/45 (33%) 24/46 (52%) Adjusted Rates 25.0% 44.4% 58.0% Terminal Rates 8/37 (22%) 11/29 (38%) 18/35 (51%) Week of First Observation 87 89 93 Life Table Tests P=0.002 P=0.059 P=0.003 Incidental Tumor Tests P=O.OOl P =0.068 P=0.002
(a)The statistical analyses used are discussed in Section II (Statistical Methods) and Table D3 (footnotes). (b)Historical incidence of adenomas or carcinomas (combined) in water gavage vehicle controls (mean k SD): 481322 (15% f 6%);historical incidence in untreated controls: 244/1,782 (14% k 11%)
TABLE 20. HARDERIAN GLAND LESIONS IN FEMALE MICE IN THE TWO-YEAR GAVAGE STUDY OF IODINATED GLYCEROL
Vehicle Control 62 mg/kg 125 mg/kg
Hyperplasia Overall Rates 1/50 (2%) 1/40 (3%) 1/50 (2%)
Adenoma Overall Rates 6/50 (12%) 8/40 (20%) 13/50 (26%) Adjusted Rates 14.6% 22.4% 32.3% Terminal Rates 5/40 (13%) 6/33 (18%) 11/38 (29%) Week of First Observation 104 92 97 Life Table Tests P=0.041 P =0.251 P=0.052 Incidental Tumor Tests P=0.041 P=0.201 P =0.062
Carcinoma Overall Rates 0/50 (0%) 0/40 (0%) 1/50(2%)
Adenoma or Carcinoma (a) Overall Rates 6/50 (12%) 8/40 (20%) 14/50 (28%) Adjusted Rates 14.6% 22.4% 34.8% Terminal Rates 5/40 (13%) 6/33 (18%) 12/38 (32%) Week of First Observation 104 92 97 Life Table Tests P =0.025 P=0.251 P =0.032 Incidental Tumor Tests P =0.024 P=0.201 P=0.039
(a)Historical incidence in water gavage vehicle controls (mean 2 SD): 12/350 (3% k 4%); historical incidence in untreated controls: 48/2,040 (2% k 2%)
53 Iodinated Glycerol, NTP TR 340

III. RESULTS: MICE
Liver: The incidences of hepatocellular adeno- female: 4/48; 11/48; 10148; hyperplasia--male: mas and hepatocellular adenomas or carcinomas 3/48; 46/50; 34/50; female: 2/48; 25/48; 35/48). (combined) in low dose female mice were signifi- The abnormally dilated follicles were often lo- cantly greater than those in the vehicle controls cated in the periphery of the glands; usually only (Table 21). Because the incidence of hepatocel- one or several were affected. Follicular cell hy- lular neoplasms observed in dosed female mice perplasia was focal or multifocal in distribution falls within the historical control range and the and characterized by variation in the size and incidence observed in the concurrent control shape of affected follicles, papillary infoldings group was unusually low, the observation of hep- into the lumens, and hypertrophy of the follicu- atocellular neoplasms in female mice is not be- lar epithelium. The colloid in the affected folli- lieved to be related to chemical administration. cles was often more basophilic than that in the
surrounding parenchyma. In areas unaffected Thyroid Gland: Dilated follicles and follicular by the follicular dilatation or hyperplasia, the cell hyperplasia were observed a t increased inci- follicles and colloid were normal for aging male dences in dosed mice (dilatation--male: vehicle and female mice. control, 0148; low dose, 28/50; high dose, 32/50;
TABLE 21. HEPATOCELLULAR TUMORS IN FEMALE MICE IN THE TWO-YEAR GAVAGE STUDY OF IODINATED GLYCEROL
Vehicle Control 62 mg/kg 125 mg/kg
Adenoma Overall Rates 0/50(0%) 4/50(8%) 3/50 (6%) Adjusted Rates 0.0% 12.1% 7.3% Terminal Rates 0140(0%) 4/33 (12%) 2/38(5%)Week of First Observation 105 93 Life Table Tests P=0.117 P=0.041 P=0.117 Incidental Tumor Tests P=0.127 P=0.041 P=0.131
Carcinoma Overall Rates 0/50 (0%) 1/50(2%) 1/50(2%)
Adenoma or Carcinoma (a) Overall Rates 0/50 (0%) 5/50 (10%) 4/50(8%) Adjusted Rates 0.0% 14.0% 9.9% Terminal Rates 0140 (0%) 4/33 (12%) 3/38(8%) Week of First Observation 53 93 Life Table Tests P=0.071 P=0.022 P=0.060 Incidental Tumor Tests P=0.103 P=0.041 P=0.068
(a)Historical incidence in water gavage vehicle controls (mean k SD): 29/348(8% k 5%); historical incidence in untreated controls: 184/2,032 (9% k 5%)
Iodinated Glycerol, NTP TR 340 54

III. RESULTS: MICE
Forestomach: Hyperkeratosis and acanthosis dosed female mice were not significantly differ- were observed a t increased incidences in high ent from that in the vehicle controls (Table 22) dose male mice (hyperkeratosis--male: vehicle but exceeded the greatest incidence observed in control, 0149; low dose, 0149; high dose, 5/50; fe- a n untreated historical control group (4150). male: 6/49; 2/50; 3/49; acanthosis--male: 0149; Squamous cell neoplasms were not diagnosed in 1/49; 5/50; female: 5/49; 4/50; 2/49). The inci- any of the male mice. dences of squamous cell papillomas found in
TABLE 22. FORESTOMACH SQUAMOUS CELL PAPILLOMAS IN FEMALE MICE IN THE TWO-YEAR GAVAGE STUDY OF IODINATED GLYCEROL (a)
Vehicle Control 62 mg/kg 125 mg/kg
Overall Rates 1/49 (2%) 2/50 (4%) 5/49(10%)Adjusted Rates 2.5% 6.1% 12.4% Terminal Rates 1/40(3%) 2/33(6%) 3/38(8%)Week of First Observation 105 105 103 Life Table Tests P=0.060 P=0.433 P=0.097 Incidental Tumor Tests P=0.077 P=0.433 P=0.127
(a)Historical incidence of stomach papillomas in water gavage vehicle controls (mean): 4/339(1%); historical incidence of stomach neoplasms in untreated controls: 18/1,994 (0.9%)
55 Iodinated Glycerol, NTP TR 340
III. RESULTS: GENETIC TOXICOLOGY
GENETIC TOXICOLOGY
In NTP Salmonella studies, treatment of the base-substitu tion mutant strains TA 100 and TA1535 with iodinated glycerol in a preincuba-tion protocol with and without Aroclor 1254- induced male Sprague Dawley r a t or Syrian hamster liver S9 resulted in a strong dose- related increase in the number of revertant colo- nies recovered; no increase in revertants was ob- served in the frame-shift mutant strains TA98 and TA1537, with doses up to 10 mg/plate (Ta- ble 23). 3-Iodo-l,2-propanediol was also muta- genic in the Salmonella test (Table 24). A strong dose-related increase in revertant colonies was observed in strain TA100 with and without S9; no increase was observed in strain TA98. The magnitude of the response was greater with 3-iodo-1,2-propanediol than with iodinated glyc- erol at identical doses. Iodinated glycerol in- duced trifluorothymidine resistance in mouse
lymphoma L5178Y/TK cells in the absence of S9 within a dose range of 0.25-3.0 pl/ml (Table 25); it was not tested with S9. When tested for cyto- genetic effects in cultured Chinese hamster ova- ry (CHO) cells, iodinated glycerol induced both sister chromatid exchanges (SCEs) and chro- mosomal aberrations in trials conducted without S9; in the presence of Aroclor 1254-induced male Sprague Dawley rat liver S9, iodinated glycerol significantly increased the frequency of SCEs (Table 261, but no chromosomal aberrat ions were induced (Table 27). Iodinated glycerol did not induce cell cycle delay in treated CHO cells. Results from the in vivo bone marrow micro- nucleus tests with iodinated glycerol (Table 28) and with 3-iodo-l,2-propanediol (Table 29) were negative; intraperitoneal doses up to 500 mg/kg iodinated glycerol or intraperitoneal doses up to 250 mg/kg 3-iodo-l,2-propanediol (two times in a 24-hour interval) did not cause an increase in micronucleated polychromatic erythrocytes.
Iodinated Glycerol, NTP TR 340 56

TABLE 23. MUTAGENICITY OF IODINATED GLYCEROL IN SALMONELLA TYPHlMURlUM (a)
Revertantshlate (b)Strain Dose -s9 t S9 (hamster) tS9 (rat)
(pdplate) Trial 1 Trial 2 Trial 1 Trial 2 Trial 1 Trial 2
TA100 0 100 333
1,000 3,333 6,666
10,000
138 f 7.4
185 f 5.0 288 f 13.0 546 f 16.5 708 f 27.5 833 f 40.3
_ _ 97 f 3.2 117 f 3.8 150 f 8.3 220 f 20.7 394 f 20.7
678 f 52.8 _ _
134 f 4.3
178 f 9.7 254 f 5.8 455 f 11.5 631 f 17.1 695 f 15.4
_ _ 112 f 2.3 127 f 13.1 178 f 19.0 282 f 11.5 484 k 22.9
823 f 32.5 _ _
160 f 3.8
187 f 7.7 320 f 8.4 5 6 5 f 11.1 771 f 12.8 893 f 54.7
_ _ 92 f 6.6 141 f 0.3 169 f 16.2 239 f 16.5 466 f 42.2
858 f 48.0 _ _
Trial summary Positive control (c)
Positive
348 f 9.5
Positive
408 f 10.8
Positive
1,422 f 62.9
Positive
1,203 f 145.6
Positive
943 f 29.1
Positive
654 f 48.4
TA1535 0 10 33
100 333
1,000 3,333 6,666
10.000
19 f 2.4 _-_ _ _ _
99 f 3.9 230 f 11.8 601 f 0.9 789 f 9.6 908 f 22.2
22 k 3.1 29 f 5.8 36 f 2.3 35 f 2.8 52 f 5.2
135 f 8.3 _ _ _-_ _
8 f 2.2 _ _
69 f 5.7 176 f 18.4 450 f 23.6 607 f 27.8 711 f 12.0
6 f 0.6 9 k 3.2
10 k 2.2 27 f 1.9 65 f 11.2
183 f 15.3 _ -_ _ _ _
7 f 0.9 _ _ _ _
96 f 5.8 254 f 20.0 585 f 17.8 809 f 18.0 902 f 21.2
5 f 0.3 7 f 0.7
14 f 0.9 21 f 4.9 57 f 4.0
155 f 17.9 _ _ _ _ _ _
Trial summary Positive control (c )
Positive
407 f 5.8
Positive
440 f 14.2
Positive
443 f 9.5
Positive
513 f 19.6
Positive
156 f 15.8
Positive
218 f 6.2
TA1537 0 4 f 0.0 _ _ 8 f 3.2 _ _ 8 k 3.4 _ _ 333 5 f 2.0 _- 6 f 0.6 _ _ 5 f 0.6 _ _
1,000 3,333 6,666
10.000
4 f 0.6 8 f 2.1 5 f 1.5 6 f 0.3
_ _ _ _ -_ --
6 f 2.1 7 f 1.0 5 f 1.2 5 f 0.6
_ _ _ _ _ _ _ _
4 f 0.6 6 f 1.2 4 f 0.9 4 f 0.6
_ _ _ -_ _ _ _
Trial summary Positive
Negative _ _ Negative _- Negative _ _ control (c ) 174 f 16.3 -_ 399 f 21.3 _ _ 203 k 10.0 _ _
TA98 0 333
1,000 3,333 6,666
10,000
14 f 0.3 16 f 3.7 16 f 3.8 15 f 2.2 18 f 1.5 16 f 1.7
--_ _ _ _ _ _ -_ _-
29 f 1.7 25 f 0.7 23 f 3.4 18 f 3.5 21 f 3.1 23 f 1.7
_ _ _ _ _ _ _-_ _
20 f 0.6 21 f 2.9 26 f 1.3 17 k 1.2 17 f 2.1 16 f 2.6
_ _ _ _ _ _ ._ -_ _ _
Trial summary Positive control (c )
Negative
948 f 37.5
_ _ _ _
Negative
1,266 k 27.6
-_
_ _ Negative
797 f 67.0
_ _ _ _
(a)Study performed a t SRI International. Data are presented in Zeiger et al. (1987). Cells and study compound or solvent (dis- tilled water) were incubated in the absence of exogenous metabolic activation ( -S9)or with Aroclor 1254-induced S9 from male Syrian hamster liver or male Sprague Dawley rat liver. High dose was limited by toxicity or solubility but did not exceed 10 mg/plate;O pg/plate dose is the solvent control. (b)Revertants are presented as mean f standard error from three plates. (c)Positive control; 2-aminoanthracene was used on all strains in the presence of S9. In the absence of metabolic activation, 4-nitro-o-phenylenediamine was used with TA98, sodium azide was used with TA100 and TA1535, and 9-aminoacridine was used with TA1537.
57 Iodinated Glycerol, NTP TR 340

TABLE 24. MUTAGENICITY OF 3-IODO-1,2-PROPANEDIOL IN SALMONELLA TYPHlMURlUM (a)
Strain Dose
(pg/plate) -s9 Revertants/plate (b)
tS9 (hamster) tS9 (rat)
TA98 0 19 f 1.9 30 f 1.8 14 k 0.9 100 19 f 1.0 30 f 2.7 11 f 2.7 333 22 f 3.3 33 f 4.1 16 f 0.6
1,000 3,333
10,000
18 f 2.0 19 f 2.8 17 f 1.7
32 f 5.9 34 f 3.4 23 f 1.5
17 f 0.6 15 f 0.9 15 f 2.6
Trial summary Positive
Negative Negative Negative
control (c) 575 f 13.0 543 f 17.1 186 f 14.0
Strain Dose -s9 (pg/plate) Trial 1 Trial 2 Trial 1
+S9 (hamster) Trial 2 Trial 3 Trial 1
+S9 (rat) Trial 2 Trial 3
TA100 0 142 ? 9.5 157 k 9.3 174 f 3.4 117 f 18.7 178 f 5.8 165 k 0.3 154 f 4.8 173 f 13.2 10 33
_ _ _ _ 187 f 8.2 129 f 4.1 200 f 7.2 151 k 4.2 148 f 6.7 195 f 7.4 152 k 4.9 207 f 3.7
173 f 10.7 133 k 6.5 196 5~ 3.5 203 k 15.7 200 f 19.5 179 f 9.5
100 182 f 3.5 179 f 7.4 222 f 6.7 189 f 2.0 209 f 4.6 230 k 33.8 205 f 2.4 214 5Z 15.2 333 236 f 4.9 229 f 3.5 379 f 21.7 227 f 4.6 289 f 10.9 376 f 18.0 242 f 4.6 239 f 3.7
1,000 3,333
450 5 33.2 362 f 11.7 728 f 34.9 310 ? 9.5 456 f 3.6 1,251 f 192.8 673 f 4.9
760 k 20.0 372 f 44.3 379 f 2 6
Trial summary Positive Positive Positive Positive Positive Positive Positive Positive Positive control(c) 1,010 k 21.7 454 f 66.6 868 f 26.4 665 f 27.9 1,146 f 19.9 489 f 13.1 544 f 19.5 699 f 5.5
(a)Study performed a t SRI International. Data are presented in Zeiger et al. (1987). Cells and study compound or solvent (dis- tilled water) were incubated in the absence of exogenous metabolic activation (-S9)or with 30% Aroclor 1254-induced S9from male Syrian hamster liver or male Sprague Dawley rat liver. High dose was limited by toxicity or solubility but did not exceed 10mg/plate; 0 pg/plate dose is the solvent control. (b)Revertants are presented as mean It standard error from three plates. (c)Positive control; 2-aminoanthracene was used on all strains in the presence of S9. In the absence of metabolic activation, 4-nitro-o-phenylenediamine was used with TA98 and sodium azide was used with TA100.
Iodinated Glycerol, NTP TR 340 58

TABLE 25. INDUCTION OF TRIFLUOROTHYMIDINE RESISTANCE BY IODINATED GLYCEROL IN MOUSE L5178Y LYMPHOMA CELLS (a,b)
Cloning Relative Tft-Resistant Mutant Compound Concentration Efficiency Total Growth Cells Fraction
(pYml) (percent) (percent) (C)
Trial 1
Distilled water td) 89.0 f 5.3 99.8 f 12.8 130.0 f 6.9 49.0 f 1.9
Iodinated glycerol 0.125 84.0 f 9.7 84.3 f 10.2 133.7 f 8.1 54.3 f 7.1 0.25 55.0 f 11.7 61.7 f 13.1 128.0 f 6.4 (e)82.7f 13.3 0.375 77.3 f 0.9 71.7 f 5.3 197.7 f 7.5 (e)85.0f 3.8 0.5 83.7 f 4.4 64.0 f 4.0 269.7 f 13.5 (e) 109.0 f 10.8 0.75 59.7 f 4.3 55.0 f 3.5 367.0 f 27.2 (e)210.3f 30.9 1 71.7 f 3.5 49.7 f 1.9 542.7 f 34.0 (e)252.3f 15.6
Methyl methanesulfonate 5 pg/ml 66.0 f 4.9 47.3 f 1.5 680.0 f 32.9 (ej349.0 f 41.1
Trial 2
Distilled water (0 103.5 f 0.5 100.0 f 7.0 92.0 f 5.0 29.5 f 1.5
Iodinated glycerol 0.5 79.7 f 3.8 72.0 f 3.2 148.7 f 8.8 (e)62.3 f 0.9 0.75 88.0 f 5.9 64.0 f 0.6 244.3 f 25.2 (e192.3 f 3.5 1 78.7 f 1.2 53.3 f 2.9 313.3 f 29.0 (e) 134.0 f 13.3 1.5 74.7 f 6.2 44.7 f 2.0 519.7 f 46.8 (e)232.3 f 9.8 2 90.0 f 4.0 38.0 f 1.7 732.3 f 34.5 (e)272.0 f 17.4 3 78.7 f 8.1 15.7 f 1.9 789.0 f 4.5 (ej343.7 f 39.2
Methyl methanesulfonate 5 pg/ml 71.3 f 3.3 50.0 f 4.6 610.0 f 32.1 (e)284.7 f 2.4
(a)Study performed a t Litton Bionetics, Inc. The experimental protocol is presented in detail by Myhr et al. (1985) and follows the basic format of Clive et al. (1979). The highest dose of study compound is determined by solubility or toxicity and may not exceed 5 mg/ml. All doses are tested in triplicate unless otherwise indicated; the average for the three tests is presented in the table. Cells (6 X lO5/ml) were treated for 4 hours a t 37” C in medium, washed, resuspended in medium, and incubated for 48 hours a t 37” C. After expression, 3 X 10⁶cells were plated in medium and soft agar supplemented with trifluorothymidine (Tft) for selection of Tft-resistant cells, and 600 cells were plated in nonselective medium and soft agar to determine the cloning efficiency. (b)Mean f standard error of replicate trials for approximately 3 X 10⁶ cells each. All data are evaluated statistically for both trend and peak response (P<0.05 for a t least one of the three highest dose sets). Both responses must be significantly (P<0.05) positive for a chemical to be considered capable of inducing Tft resistance. Ifonly one ofthese responses is significant, the call is “equivocal”; the absence of both trend and peak response results in a “negative”cal1. (c)Mutant fraction (frequency) is a ratio of the Tft-resistant cells to the cloning efficiency, divided by 3 (to arrive at MF per 1 X 10⁶cells treated); MF = mutant fraction. (d)Data presented are the results offour tests. (e)Significant positive response; occurs when the relative mutant fraction (average MF of treated culture/average MF of sol- vent control) is greater than or equal to 1.6. (DData presented are the results of two tests.
59 Iodinated Glycerol, NTP TR 340
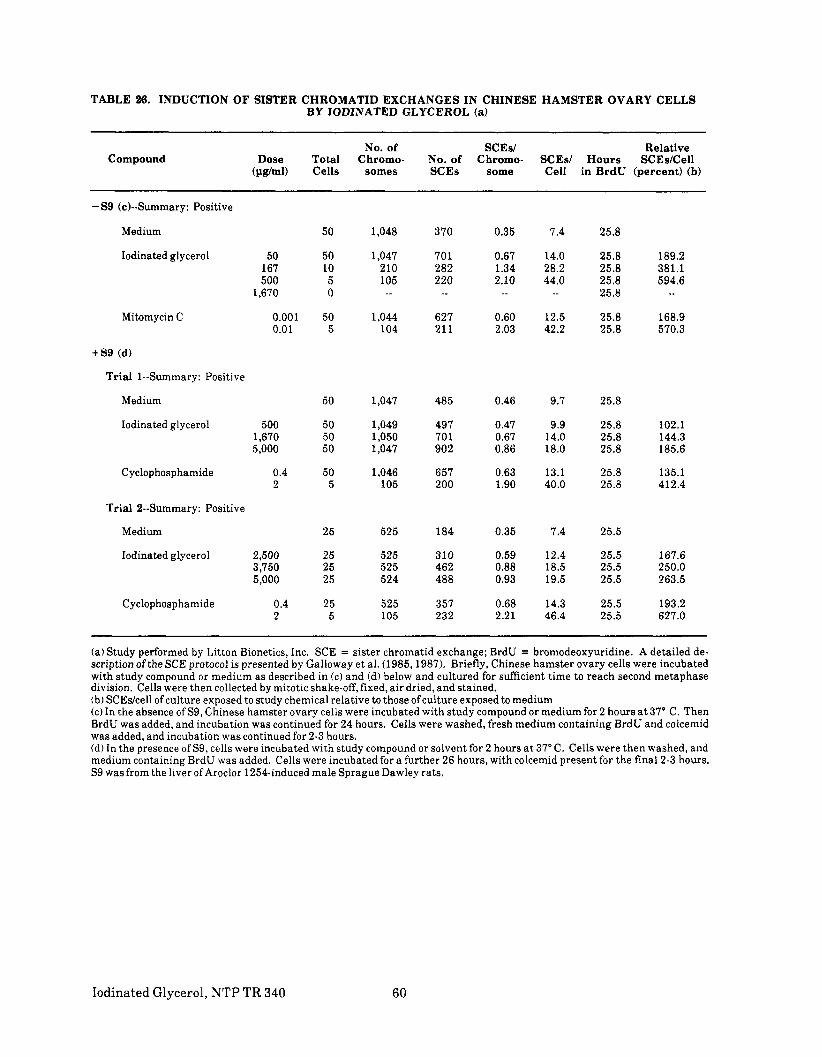
TABLE 26. INDUCTION OF SISTER CHROMATID EXCHANGES IN CHINESE HAMSTER OVARY CELLS BY IODINATED GLYCEROL (a)
No. of SCEs/ Relative Compound Dose Total Chromo- No. of Chromo- SCEs/ Hours SCEs/Cell
(&ml) Cells somes SCEs some Cell in BrdU (percent) (b)
-S9 (e)--Summary: Positive
Medium 50 1,048 370 0.35 7.4 25.8
Iodinated glycerol 50 167
50 10
1,047 210
701 282
0.67 1.34
14.0 28.2
25.8 25.8
189.2 381.1
500 5 105 220 2.10 44.0 25.8 594.6 1,670 0 _ _ _- 25.8
Mitomycin C 0.001 50 1,044 627 0.60 12.5 25.8 168.9 0.01 5 104 211 2.03 42.2 25.8 570.3
+S9 (d)
Trial 1-Summary: Positive
Medium 50 1.047 485 0.46 9.7 25.8
Iodinated glycerol 500 1,670
50 50
1,049 1,050
497 701
0.47 0.67
9.9 14.0
25.8 25.8
102.1 144.3
5,000 50 1,047 902 0.86 18.0 25.8 185.6
Cyclophosphamide 0.4 2
50 5
1,046 105
657 200
0.63 1.90
13.1 40.0
25.8 25.8
135.1 412.4
Trial 2-Summary: Positive
Medium 25 525 184 0.35 7.4 25.5
Iodinated glycerol 2,500 3,750
25 25
525 525
310 462
0.59 0.88
12.4 18.5
25.5 25.5
167.6 250.0
5,000 25 524 488 0.93 19.5 25.5 263.5
Cyclophosphamide 0.4 2
25 5
525 105
357 232
0.68 2.21
14.3 46.4
25.5 25.5
193.2 627.0
(a)Study performed by Litton Bionetics, Inc. SCE = sister chromatid exchange; BrdU = bromodeoxyuridine. A detailed de- scription of the SCE protocol is presented by Galloway et al. (1985,1987). Briefly, Chinese hamster ovary cells were incubated with study compound or medium as described in (c) and (d) below and cultured for sufficient time to reach second metaphase division. Cells were then collected by mitotic shake-off, fixed, air dried, and stained. (b)SCEs/cell of culture exposed to study chemical relative to those ofculture exposed to medium (c)In the absence of S9, Chinese hamster ovary cells were incubated with study compound or medium for 2 hours a t 37" C. Then BrdU was added, and incubation was continued for 24 hours. Cells were washed, fresh medium containing BrdU and colcemid was added, and incubation was continued for 2-3 hours. (d)In the presence of S9, cells were incubated with study compound or solvent for 2 hours at 37OC. Cells were then washed, and medium containing BrdU was added. Cells were incubated for a further 26 hours, with colcemid present for the final 2-3 hours. S9 was from the liver ofAroclor 1254-induced male Sprague Dawley rats.
Iodinated Glycerol, NTP TR 340 60

TABLE 27. INDUCTION OF CHROMOSOMAL ABERRATIONS IN CHINESE HAMSTER OVARY CELLS BY IODINATED GLYCEROL (a)
Trial 1 Trial 2
(pg/ml) Dose
Cells Total
Abs No. of
Cell Abs/
Cells Percent
with Abs (pg/ml) Dose
Cells Total
Abs No. of
Cell Abs/
Cells Percent
with Abs
-S9 (b)--Harvest time: 10hours -S9 (b)--Harvest time: 10.3 hours
Medium 200 5 0.03 2.0
Medium 100 3 0.03 3.0
Iodinated glycerol 1,250 1,875 2,500
200 46
200
14 0 1
0.07 0.00 0.01
7.0 0.0 0.5
Iodinated glycerol 1,250 1,875 2,500
100 100 100
5 12 24
0.05 0.12 0.24
5.0 9.0
19.0
Summary: Equivocal Summary: Weakly positive
Mitomycin C 0.25 0.75
200 25
29 17
0.15 0.68
11.5 44.0
Mitomycin C 0.25 0.75
50 25
20 15
0.40 0.60
32.0 32.0
tSQ (c)--Harvest time: 11.8 hours
Medium 200 1 0.01 0.5
Iodinated glycerol 2,500 2,750 5,000
200 200 200
0 0 2
0.00 0.00 0.01
0.0 0.0 1.o
Summary: Negative
Cyclophosphamide 7.5 200
37.5 25 27 17
0.14 0.68
10.5 48.0
(a) Study performed a t Litton Bionetics, Inc.; Abs = aberrations, A detailed presentation of the technique for detecting chromosomal aberrations is found in Galloway et al. (1985, 1987). Briefly, Chinese hamster ovary cells were incubated with study compound or medium as indicated in (b) and (c). Cells were arrested in first metaphase by addition of colcemid and harvested by mitotic shake-off, fixed, and stained in 6%Giemsa. (b)In the absence ofS9,cells were incubated with study compound or medium for 8-10 hours a t 37" C. Cells were then washed, and fresh medium containing colcemid was added for an additional 2-3 hoursfallowed by harvest. (c) In the presence of S9,cells were incubated with study compound or medium for 2 hours a t 37"C. Cells were then washed, medium was added, and incubation was continued for 8-10 hours. Colcemid was added for the last 2-3 hours of incubation before harvest. S9 was from the liver of Aroclor 1254-induced male Sprague Dawley rats.
61 Iodinated Glycerol, NTP TR 340

TABLE 28. FREQUENCY OF MICRONUCLEI IN BONE MARROW POLYCHROMATIC ERYTHROCYTES IN MICE TREATED WITH IODINATED GLYCEROL (a)
Treatment Micronucleated Cells/1,000 Cells (b) Number of Mice (mgflrg)
Control (c) 0 1.5 f 0.4 5
Iodinated glycerol 125 0.3 f 0.2 5 250 1.1 f 0.4 5 500 0.6 f 0.3 5
Mitomycin C (d) 1.o 37.7 f 4.6 5
(a)Study performed a t Environmental Health Research and Testing, Inc. Male mice were injected intraperitoneally twice, a t 24-hour intervals, with iodinated glycerol dissolved in phosphate-buffered saline (PBS); bone marrow smears were prepared 24 hours after the second injection. In each of five animals per dose group, 2,000 polychromatic erythrocytes were scored for fre- quency of micronuclei. (b)Values are mean k standard error ofthe mean. (c)Control animals received 0.4 ml PBS per injection. (d)Positive control
TABLE 29. FREQUENCY OF MICRONUCLEI IN BONE MARROW POLYCHROMATIC ERYTHROCYTES IN MICE TREATED WITH 3-IODO-1,2-PROPANEDIOL (a)
Treatment Micronucleated Cells/1,000 Cells (b) Number of Mice (mg/kg)
Control (c) 0 0.6 f 0.2 5
3-Iodo-1,2-propanediol62.5 0.4 k 0.2 5
125 0.8 f 0.5 5 250 0.8 f 0.6 5
Mitomycin C (d) 1.o 30.2 f 2.7 5
(a)Study performed a t Environmental Health Research and Testing, Inc. Male mice were injected intraperitoneally twice, at 24-hour intervals, with 3-iodo-1,2-propanediol dissolved in phosphate-buffered saline (PBS);bone marrow smears were prepared 24 hours after the second injection. In each of five animals per dose group, 2,000 polychromatic erythrocytes were scored for frequency of micronuclei. (b)Values are mean k standard error ofthe mean. (c)Control animals received 0.4 ml PBS per injection. (d)Positive control
Iodinated Glycerol, NTP TR 340 62

IV. DISCUSSION AND CONCLUSIONS
63 Iodinated Glycerol, NTP TR 340

IV. DISCUSSION AND CONCLUSIONS
These studies were conducted because of human exposure,to iodinated glycerol as a mucolytic ex- pectorant in respiratory therapy and because of the compound's possible relationship to other alkyl iodides (e.g., methyl iodide, an alkylating agent).
As indicated in the chemistry section of this Re- port, the iodopropylideneglycerol isomers de- scribed in the patent for iodinated glycerol were not observed when the study material used in these studies was analyzed. Analysis of the iodi- nated glycerol study material indicated that the principal components are 3-iodo-l,2-propanediol (33%) and glycerol (17%). Numerous other com- ponents were present in the study material. Four of these components were tentatively iden- tified as isomeric (hydroxymethy1)-(iodomethy1)-p-dioxane species and were cumulatively esti-mated to be present at a concentration of approx- imately 10%. The balance of the study material (-40%) is thought to contain polymers of glycerol and iodoglycerol.
3-Iodo-l,2-propanediol, the major component of iodinated glycerol, is presumed to be the most active component and may contribute to its mu- tagenicity. Glycidol was proposed as the reac- tive intermediate of S-iodo-l,2-propanediol in vivo (Jones, 1975). In vitro studies with rat liver supernatants indicate that 3-iodo- 1,2-propane- diol is conjugated with glutathione via an epox- ide intermediate, proposed to be glycidol, to form the primary metabolite, S-(2,3-dihydroxypro- py1)glutathione. The similarity of the results ob- tained in NTP-sponsored in vitro genotoxicity studies with iodinated glycerol and separately with glycidol is consistent and suggests that 3-iodo-1,2-propanediol, possibly through a glycidol intermediate, is a genetically active component of iodinated glycerol; 3-iodo- 1,2-propanediol was mutagenic in Salmonella strain TA100..
This compound was completely metabolized (no parent compound was found) and excreted in the urine after intraperitoneal administration of 100 mg/kg to male Wistar rats (250-300 g) or male IC1 Swiss mice (30-50 g) (Jones, 1975). The hydrolysis of 3-iodo-l,2-propanediol and other iodo-containing compounds would result in the release of iodide.
In the 16-day and 13-week studies, deaths of rats and mice were observed at doses of 500 mg/kg. The principal findings from the 13-week gavage studies (doses up to 500 mg/kg) included: tubu- lar cell regeneration and calcification of the kid-ney in dosed female rats; lymphoid hyperplasia in the stomach of dosed male and female rats; and kidney tubular cell regeneration, inflamma- tion, or abscesses of the forestomach and hyper- plasia, acanthosis, and/or hyperkeratosis of the forestomach in dosed female mice. Doses for the 2-year studies were based on the incidences of deaths and toxicity to the kidney in rats and in- cidences of deaths and toxicity to the kidney and forestomach in mice in the 13-week studies.
In the 2-year study, survival of high dose male rats was reduced. The cause of death of high dose male rats dying late in the study was not clear; i.e., there was no apparent dose-related in- crease in kidney toxicity or lethal malignancies observed in animals dying between weeks 89 and 103 of exposure. This decrease in survival may be related to the cumulative toxicity of iodinated glycerol and/or its metabolites, includ- ing iodide.
The incidences of mononuclear cell leukemia were increased in dosed male rats (see Table 11). There was a significant positive trend by both life table and Cochran-Armitage trend tests, and the incidences in both dosed groups were signifi- cantly greater than that in the vehicle controls by the life table test and Fisher exact test. Analy- sis of the incidence of leukemia at selected inter- vals during the 2-year studies (Table 30) in-dicates t ha t leukemia was dose related and occurred a t a greater incidence in the high dose group of male rats before week 89 of exposure. After week 89, fewer animals were diagnosed with leukemia in the high dose group than in the low dose group. The cause for this decreased in- cidence of leukemia in the high dose group after week 89 of exposure is not apparent but may be related to cumulative toxicity and the increased number of deaths due to iodinated glycerol expo- sure, as suggested above.
Davey and Moloney (1970) determined that ap- proximately 80% of all deaths due to mono- nuclear cell leukemia in untreated F344 rats
Iodinated Glycerol, NTP TR 340 64

TABLE 30. INCIDENCES OF MALE F344/N RATS WITH MONONUCLEAR CELL LEUKEMIA AT SELECTED INTERVALS IN THE TWO-YEAR GAVAGE STUDIES OF
IODINATED GLYCEROL (a)
Week Dose (mg/kg) 0-85 85-88 89-96 97-103 0-103 0-104
0 217 213 1I3 319 8/22 14/50 125 519 111 719 7111 20/30 29/50250 7111 7111 519 5115 24/46 24/50
(a)No. of animals with leukemialtotal no. dying during indicated interval
involved extensive bronchopulmonary infections and severe hemolytic anemia. The age a t death due to spontaneous occurrence of leukemia in untreated animals varied from 14 to 30 months, with a mean age of 24.5 months. In the current studies, secondary infection was not a cause of death, probably because of the use of barrier- bred and barrier-maintained animals. Severe hemolytic anemia and immunosuppression a re characteristic features of this disease (Strom- berg et al., 1983,1988).
In NTP untreated controls, the mean historical incidence of mononuclear cell leukemia in 25- to 26-month-old male F344/N rats (Table A4a) is approximately 33%. The term mononuclear cell leukemia a s used in this report refers to a neoplastic disease of F344 rats which is char- acterized by infiltration of pleomorphic blastlike mononuclear cells in various organs, especially in the spleen, liver, and bone marrow. The leu- kemia appears to originate in the spleen, and this organ is often markedly enlarged; bone mar- row infiltration occurs later and usually in- volves less than one-half the animals at risk (Stromberg and Vogtsberger, 1983). This dis- ease has also been described as large granular lymphocyte leukemia (Losco and Ward, 1984; Stromberg, 1985).
Neoplasms of the anterior pituitary gland were increased in dosed female mice (see Table 19) and occurred a t a marginally increased inci- dence in high dose female rats (see Table 13). In female mice, there was a significant positive trend, and the incidence in high dose female mice was significantly greater than that in vehi- cle controls. The incidence of adenomas of the anterior pituitary gland in vehicle control
female mice was similar to the incidences in his- torical control female mice. There was no indi- cation of compound-related hyperplasia of the pituitary gland in female rats or female mice. Conversely, the incidences of anterior pituitary gland neoplasms were decreased in dosed male rats (Table A3) and not notably changed in dosed male mice (Table Cl). Hyperplasia of the pitui- tary gland was not compound related in male rats; however, the incidence of hyperplasia in the pituitary gland of high dose male mice was increased (vehicle control, 0144; low dose, 1/42; high dose, 5/45).
According to Furth et al. (19761, pituitary gland tumors in rats can be induced by hormonal im- balance, ionizing radiation, or chemical carcino- gens but are most effectively induced by a com-bination of hormonal imbalance and physical or chemical carcinogens. Liebelt (1979) indicated that pituitary gland tumors in mice may be induced by any exposure that produces thyroid deficiency because reduced circulating levels of triiodothyronine (T3)and thyroxin (T4)stimu-late thyroid-stimulating hormone secreting cells, which may result in pituitary gland tissue be- coming hyperplastic and ultimately neoplastic.
In the current studies, sections from the pitui- tary gland from three or four vehicle control and high dose female mice that exhibited either no remarkable lesions or hyperplasia or adenomas were selectively stained for thyroid-stimulating hormone (TSH) by an immunohistochemical pro- cedure. The normal background of TSH-positive cells was seen in the normal tissue, but the foci of hyperplasia and the adenomas in general did not contain TSH-positive cells. Despite the absence of staining for TSH, it is unknown if the
65 Iodinated Glycerol, NTP TR 340

IV. DISCUSSION AND CONCLUSIONS
pituitary cells in the foci of hyperplasia or ade- noma were secreting TSH. Cells rapidly synthe- sizing and secreting the hormone may not store sufficient amounts to detect with the methods used. Also, in the absence of data on serum TSH levels, it is unknown if there was excessive se- cretion of TSH by the pituitary glands as a whole in dosed animals. Baker and Yu (1971) dosed fe- male Sprague Dawley rats with propylthiouracil or exposed them to iodine-131 irradiation after thyroidectomy and observed an increase in pro- liferative lesions of the pituitary gland and an increase in TSH-positive thyrotropes in animals in a thyroid-deficient state.
In the current 2-year studies, follicular cell car- cinomas of the thyroid gland occurred a t a signif-icantly increased incidence in low dose male rats by the incidental tumor test (see Table 12). The follicular cell carcinomas were late-appearing neoplasms; one was present in a low dose male dying at week 99, the others were present in ani- mals killed a t the end of the study. Thus, the re- duced survival of high dose male rats may have been responsible for the lower incidence in this group relative to that in the low dose group. There was no evidence of a chemically related ef- fect in the thyroid gland of female rats. Follicu- lar cell carcinomas were observed in one low dose and one high dose female rat, well within the range of untreated historical controls. In mice, follicular cell hyperplasia of the thyroid gland was considerably increased (Tables C4 and D5) and occurred in 52%-92% of dosed ani- mals. Follicular cell adenomas were observed in a few vehicle control and dosed mice (Tables C l and Dl).
There is abundant information associating the development of thyroid follicular cell neoplasms in experimental animals with perturbation of thyroid-pituitary homeostasis (Napalkov, 1976; Biancifiori, 1979; Hill et al., 1989). Chemicals that interfere with the synthesis of the thyroid hormones, T4 or T3, or increase the rate of their catabolism and removal from the circulation cause increases in the synthesis and secretion of TSH from the pituitary gland. In addition, ex- cessive dietary iodide may result in proliferative lesions in the thyroid gland by inhibiting the proportional uptake of iodide by the follicular cells, thereby blocking iodide peroxidation to
iodine and interfering with the release of T4 and T3 from the follicular cells (Nagataki, 1974; Cap- en, 1983; Stevens, 1985). A small group of thy- roid carcinogens seem to produce their effect without altering the function of the pituitary gland and may be inducing follicular cell neo- plasms through a genotoxic mechanism.
Whether any of these possible mechanisms were involved in the development of the thyroid neo- plasms in male rats in the 2-year study of iodi- nated glycerol is unknown. Since S-iodo-l,2-pro- panediol, the principal component of iodinated glycerol (33%), may undergo hydrolysis with the release of iodide, a role for iodide in the develop- ment of the thyroid lesions is possible. Measure- ments of circulating levels of T3, T4, or TSH were not performed. However, chemicals (goitrogens) which alter the circulating levels of these hor- mones typically cause diffuse follicular cell hy- perplasia, which precedes the development of adenoma and carcinoma. The lack of follicular cell hyperplasia and adenoma in male rats does not support a role for TSH in the development of the follicular tell carcinomas. Further, the focal nature of the hyperplastic lesions in the thyroid gland of mice is not typical of the goitrogenic compounds. The limited data on the genetic tox- icity of iodinated glycerol indicate that it is mu-tagenic in two strains of Salmonella and clasto- genic in Chinese hamster ovary cells. Thus, a role for genotoxicity in the development of folli- cular cell carcinomas in male rats is possible.
The incidence of adenomas of the harderian gland was increased in high dose female mice. A carcinoma of the harderian gland was observed in one high dose female mouse. Harderian gland neoplasms may also be influenced by hormonal disturbances (Weisburger et al., 1984).
Several other lesions and clinical observations were seen in these 2-year studies. Squamous metaplasia and focal atrophy of the salivary glands were observed at increased incidences in dosed male and female rats. Similar lesions may be observed in rats with sialodacryoadenitis vi- rus infections; however, serologic tests for this virus were negative in these studies. These le- sions are probably due to iodide accumulation in the salivary gland, a site of increased concentra- tion and excretion of iodide. Similarly, uncom- mon adenomas of the nasal cavity observed in
Iodinated Glycerol, NTP TR 340 66

IV. DISCUSSION AND CONCLUSIONS
two high dose male rats may be due to a systemic effect. The sneezing or coughing observed in high dose male and female rats may have been due to a pharmacologic response or increased na- sal secretions due to the excretion of metabolized iodide.
In the forestomach, hyperkeratosis and acantho- sis were observed a t an increased incidence in high dose male mice. No forestomach neoplasms were observed in male mice in the 2-year stud- ies. Squamous cell papillomas were increased in female mice in a dose-related manner, whereas the nonneoplastic lesions, acanthosis and hyper- keratosis, were observed a t incidences that de- creased with dose. The marginal increase in these forestomach neoplasms may have resulted from long-term exposure to iodinated glycerol and/or its metabolites, including iodide. The spectrum of forestomach lesions observed in dosed male and female mice in 16-day, 13-week, and 2-year studies indicates that iodinated glyc- erol is cytotoxic and that there may be a differ- ence between sexes in sensitivity to exposure. The biology of the forestomach neoplasms ob- served in female mice in this study is unknown.
In summary, other than mononuclear cell leuke- mia, the principal lesions in these 2-year studies of iodinated glycerol occurred in the pituitary gland, the thyroid gland, and possible sites of ab- sorption, metabolism, and excretion of iodinated
glycerol and/or its metabolites, including iodide. The homeostatic interrelationship between the hypothalamus (thyrotropic releasing factor) and the thyroid gland and associated regulatory con- trol mechanisms for thyroid hormones, T4 and T3, the major regulators of metabolism, growth, and development, and homeostatic mechanisms, is complex. An insult to any part of this axis can result in a myriad of physiologic changes that may influence hyperplastic and neoplastic re- sponse. Comparison of hyperplastic and neo- plastic responses of the pituitary and thyroid glands by organ site, species, and sex suggests a possible goitrogenic-like response in male and female mice after exposure to iodinated glycerol (Table 31). However, occurrence of carcinomas of the follicular cells of the thyroid gland in male rats in the absence of follicular cell hyperplasia suggests that this lesion is dis t inct from a proliferative response due to hormonal imbal- ance. The absence in both rats and mice of kid-ney lesions that were observed at the high doses in the 13-week studies suggests that the doses used in the 2-year studies were within the thresh- old for complete metabolism of active compo- nents, a s suggested by the studies of Jones (1975),and below that causing nephrotoxicity. Nonneoplastic responses in iodide-accumulating and iodide-secreting tissues suggest that iodide toxicity may have occurred over the course of the studies.
TABLE 31. SUMMARY OF THE NUMBER OF F344/N RATS AND B6C3F1 MICE WITH PITUITARY AND THYROID GLAND LESIONS IN THE TWO-YEAR GAVAGE STUDIES OF IODINATED
GLYCEROL (a)
Pituitary Gland Hyperplasia Neoplasms
Thyroid Gland Follicular Cell Follicular Cell
Hyperplasia Neoplasms
Male rats (b) 6; 6; 5 26; 12; 7 (Ador Ca) 0; 1;2 0; 5; 1 (Ca)
Female rats (c) 2; 1; 1 26; 27; 34 (Ador Ca) 0; 1; 1 0; 1; 1 (Ca)
Male mice tb) 0; 1;5 0; 1; 1 (Ad) 3; 46; 34 3; 6; 0 (Ad)
Female mice (c) 21; 18; 19 10; 15; 24 (Ad) 2; 25; 35 2; 3; 4 (Ad)
(a)Ad = adenomas; Ca = carcinomas (b)Doses: 0; 125 mg/kg; 250 mgkg (c) Doses: 0;62 mg/kg; 125 mg/kg
67 Iodinated Glycerol, NTP TR 340
IV. DISCUSSION AND CONCLUSIONS
The experimental and tabulated data for the NTP Technical Report on iodinated glycerol were examined for accuracy, consistency, com- pleteness, and compliance with Good Laboratory Practice regulations. As summarized in Appen- dix G, the audit revealed no major problems with the conduct of the studies or with collection and documentation of the experimental data. No dis-crepancies were found that influenced the final interpretation of the results of these studies.
Under the conditions of these 2-year gavage stud- ies, there was some evidence of carcinogenic activ- ity* for male F344/N rats administered iodinated glycerol, as indicated by increased incidences of mononuclear cell leukemia and follicular cell carcinomas of the thyroid gland. Adenomas of the nasal cavity in two high dose male rats may have been related to the administration of iodi- nated glycerol. There was no evidence of car-cinogenic ac t iv i ty for female F344/N r a t s
administered 62 or 125 mg/kg iodinated glycerol by gavage for 103 weeks. There was no evidence of carcinogenic activity for male B6C3F1 mice ad- ministered 125 or 250 mg/kg iodinated glycerol by gavage for 103 weeks. There was some evi- dence o f carcinogenic activity for female B6C3F1 mice administered iodinated glycerol, as indicat- ed by increased incidences of adenomas of the anterior pituitary gland and neoplasms of the harderian gland. Squamous cell papillomas of the forestomach may have been related to the administration of iodinated glycerol.
Significant nonneoplastic lesions considered re- lated to exposure of iodinated glycerol were squamous metaplasia and focal atrophy of the salivary gland in male and female rats. Dilata-tion of the thyroid gland follicle and follicular cell hyperplasia were observed in male and fe- male mice.
*Explanation of Levels of Evidence of Carcinogenic Activity is on page 7. A summary of the Peer Review comments and the public discussion on this Technical Report appears on pages 11-12.
Iodinated Glycerol, NTP TR 340 68

V. REFERENCES
69 Iodinated Glycerol, NTP TR 340

V. REFERENCES
1. American Medical Association (AMA) (1977) AMA Department of Drugs, AMA Drug Evalua- tions, 3rd ed. Littleton, MA: PSG Publishing Co., p. 658.
2. Ames, B.N.;McCann, J.; Yamasaki, E. (1975) Methods for detecting carcin'ogens and mu- tagens with the Salmonella/mammalian-micro- some mutagenicity test. Mutat. Res. 31:347-364.
3. Armitage, P. (1971) Statistical Methods in Medical Research. New York: John Wiley & Sons, Inc., pp. 362-365.
4. Baker, B.L.; Yu, Y.-Y. (1971) Hypophyseal changes induced by thyroid deficiency and thy- roxine administration as revealed by immuno- chemical staining. Endocrinology 89:996-1004.
5. Barrigon, S.;Moreno, A,; Rebollo, D.; Garcia de Jalon, P.D. (1986) Parametros farmacocineti- cos del 1251-yodopropilidenglicerol(IPG), en vol- untarios sanos. Rev. Farmacol. Clin. Exp. 3:73-79.
6. Berenblum, I., Ed. (1969) Carcinogenicity Testing: A Report of the Panel on Carcinogenic- ity of the Cancer Research Commission of UICC , Vol. 2. Geneva: International Union Against Cancer.
7. Biancifiori, C. (1979) Tumours of the thyroid gland. Turosov, V.S., Ed.: Pathology of Tu- mours in Laboratory Animals. Vol. II. Tumours of the Mouse. IARC Scientific Publications No. 23, pp. 451-473.
8. Boorman, G.A.; Montgomery, C.A., Jr.; Eus- tis, S.L.; Wolfe, M.J.; McConnell, E.E.; Hardisty, J.F. (1985) Quality assurance in pathology for rodent carcinogenicity studies. Milman, H.; Weisburger, E. ,Eds.: Handbook of Carcinogen Testing. Park Ridge, NJ: Noyes Publications, pp. 345-357.
9. Canter, D.A.; Zeiger, E.; Haworth, S.;Lawlor, T.; Mortelmans, K.; Speck, W. (1986) Compara-tive mutagenicity of aliphatic epoxides in Sal- monella. Mutat. Res. 172:105-138.
10. Capen, C.C. (1983) Chemical injury of thy- roid: Pathologic and mechanistic considera- tions. Toxicology Forum: 1983 Annual Winter Meeting. Washington, DC: Bowers Reporting CO.,pp. 260-273.
11. Clive, D.; Johnson, K.O.; Spector, J.F.S.; Bat- son, A.G.; Brown, M.M.M. (1979) Validation and characterization of the L5178Y/TK +'-mouse lymphoma mutagen assay system. Mutat. Res. 59~61-108.
12. Cox, D.R. (1972) Regression models and life tables. J.R. Stat. SOC.B34:187-220.
13. Davey, F.R.; Moloney, W.C. (1970) Postmor-tem observations on Fischer rats with leukemia and other disorders. Lab. Invest. 23:327-334.
14. Epstein, S.S.;Arnold, E.; Andrea, J.; Bass, W.; Bishop, Y. (1972) Detection of chemical mu- tagens by the dominant lethal assay in the mouse. Toxicol. Appl. Pharmacol. 23:288-325.
15. Furth, J . ; Nakane, P.; Pasteels, J.L. (1976) Tumours of the pituitary gland. Turosov, V.S., Ed.: Pathology of Tumours in Laboratory Ani- mals. Vol. I. Tumours of the Rat. IARC Scien- tific Publications No. 6, pp. 201-227.
16. Galloway, S.M.; Bloom, A.D.; Resnick, M.; Margolin, B.H.; Nakamura , F.; Archer, P.; Zeiger, E. (1985) Development of a standard pro- tocol for in vitro cytogenetic testing with Chi- nese hamster ovary cells: Comparison of results for 22 compounds in two laboratories. Environ. Mutagen. 7:l-51.
17. Galloway, S.M.; Armstrong, M.J.; Reuben, C.; Colman, S.; Brown, B.; Cannon, C.; Bloom, A.D.; Nakamura, F.; Ahmed, M.; Duk, S.;Rim-PO, J.;Margolin, B.H.; Resnick, M.A.; Anderson, B.; Zeiger, E. (1987) Chromosome aberrations and sister chromatid exchanges in Chinese ham- ster ovary cells: Evaluations of 108 chemicals. Environ. Molec. Mutagen. lO(Supp1. 1O):l-175.
18. Gart, J .J . ; Chu, K.C.; Tarone, R.E. (1979) Statistical issues in interpretation of chronic bioassay tests for carcinogenicity. J . Natl. Can- cer Inst. 62:957-974.
Iodinated Glycerol, NTP TR 340 70

V. REFERENCES
19. Haseman, J.K. (1984) Statistical issues in the design, analysis and interpretation of ani- mal carcinogenicity studies. Environ. Health Perspect. 58:385-392.
20. Haseman, J.K.; Huff, J . ; Boorman, G.A. (1984) Use of historical control data in carcino- genicity studies in rodents. Toxicol. Pathol. 12: 126-135.
21. Haseman, J.K.; Huff, J.;Rao, G.N.; Arnold, J.; Boorman, G.A.; McConnell, E.E. (1985) Neo- plasms observed in untreated and corn oil ga- vage control groups of F344/N r a t s a n d (C57BL/6N X C3H/HeN)F1 (B6C3F1) mice. J . Natl. Cancer Inst. 75:975-984.
22. Hill, R.N.; Erdreich, L.S.; Paynter, O.E.; Roberts, P.A.; Rosenthal, S.L. ; W il kinson, C .F. (1989) Thyroid follicular cell carcinogenesis. Fundam. Appl. Toxicol. 12:629-697.
23. Hoffnagle, G.P.; Osol, A. (1958) The distribu- tion and fate of iodine in iodopropylidene-glycer- 01 in the rat. J.Am. Pharm. Assoc. 47:149-153.
24. Holbreich, M. (1982) Asthma and other aller- gic disorders in pregnancy. Am. Fam. Physician 25:187-192.
25. International Agency for Research on Cancer (IARC) (1986) Methyl iodide. IARC Monographs on Evalution of the Carcinogenic Risk of Chemi- cals to Man: Some Halogenated Hydrocarbons and Pesticide Exposures, Vol. 41. Lyon: IARC, pp. 213-227.
26. Jones, A.R. (1975) The metabolism of 3-chloro-, 3-bromo- and 3-iodopropan-l,2-diol in rats and mice. Xenobiotica 5:155-165.
27. Kaplan, E.L.; Meier, P. (1958) Nonpara- metric estimation from incomplete observations. J.Am. Stat. Assoc. 53:457-481.
28. Liebelt, A.G. (1979) Tumours of the pituitary gland. Turosov, V.S., Ed.: Pathology of Tu-mours in Laboratory Animals. Vol. II. Tumours of the Mouse. IARC Scientific Publications No. 23, pp. 411-449.
29. Linhart, M.S.; Cooper, J.;Martin, R.L.; Page, N.; Peters, J . (1974) Carcinogenesis Bioassay Data System. Comput. Biomed. Res. 7:230-248.
30. Losco, P.E.; Ward, J.M. (1984) The early stages of large granular lymphocyte leukemia in the F344 rat. Vet. Pathol. 21:286-291.
31. Mantel, N.; Haenszel, W. (1959) Statistical aspects of the analysis of data from retrospective studies of disease. J. Natl. Cancer Inst. 22:719- 748.
32. Maronpot, R.R.; Boorman, G.A. (1982) Inter- pretation of rodent hepatocellular proliferative alterations and hepatocellular tumors in chemi- cal safety assessment. Toxicol. Pathol. 10:71-80.
33. McConnell, E.E. (1983a) Pathology require- ments for rodent two-year studies. I. A review of current procedures. Toxicol. Pathol. 11:60-64.
34. McConnell, E.E. (1983b) Pathology require- ments for rodent two-year studies. II. Alterna- tive approaches. Toxicol. Pathol. 11:65-76.
35. McConnell, E.E.; Solleveld, H.A.; Swenberg, J.A.; Boorman, G.A. (1986) Guidelines for com- bining neoplasms for evaluation of rodent carci- nogenesis studies. J . Natl. Cancer Inst. 76:283- 289.
36. McLaren, E.H.; Alexander, W.D. (1979) Goi- trogens. Clin. Endocrinol. Metab. 8:129-144.
37. The Merck Index (1976) 9th ed. Rahway, NJ: Merck & Co., Inc.,p. 661.
38. The Merck Index (1983) 10th ed. Rahway, NJ: Merck & Co., Inc., p. 726.
39. Myhr, B.; Bowers, L.; Caspary, W.J. (1985) Assays for the induction of gene mutations a t the thymidine kinase locus in L5178Y mouse lymphoma cells in culture. Prog. Mutat. Res. 5: 555-568.
40. Nagataki, S. (1974) Effects of excess quanti- ties of iodide. Greep, R.O.; Astwood, E.B.; Greer, M.A.; Solomon, D.H.; Geiger, S.R., Eds.: Hand- book of Physiology, Vol. 3. Washington, DC: American Physiological Society, pp. 329-344.
71 Iodinated Glycerol, NTP TR 340

V. REFERENCES
41. Napalkov, N.P. (1976) Tumours of the thy- roid gland. Turosov, VS., Ed.: Pathology of Tu- mours in Laboratory Animals. Vol. I. Tumours of the Rat. IARC Scientific Publications No. 6, pp. 239-261.
42. National Cancer Inst i tute (NCI) (1976) Guidelines for Carcinogen Bioassay in Small Rodents. NC1 Technical Report No. 1. U.S.De-partment of Health, Education, and Welfare, Public Health Service, National Institutes of Health, Bethesda, MD. 65 p.
43. National Institutes of Health (NIH) (1978) Open Formula Rat and Mouse Ration (NIH-07). Specification NIH-11-1335. U.S.Department of Health, Education, and Welfare, Public Health Service, National Institutes of Health, Bethesda, MD.
44. National Toxicology Program (NTP) (1990) Toxicology and Carcinogenesis Studies of Glyci- dol in F344/N Rats and B6C3F1 Mice. NTP Technical Report No. 374. U.S.Department of Health and Human Services, Public Heal th Service, National Institutes of Health, Bethesda, Md. 229p.
45. Seltzer, A. (1961) Mucolytic expectorant therapy with an iodinated “glyceril” ether. Ann. Allergy 19:381-385.
46. Stanford Research Institute (SRI) (1978) Data Base on Category E Drug Exposure. NC1 Contract No. N01-CP-33285. Menlo Park, CA.
47. Stevens, J.T. (1985) Effect of chemicals on the thyroid gland. Thomas, J.A.; Korach, K.S.; McLachlan, J.A., Eds.: Endocrine Toxicology. New York: Raven Press, pp. 135-147.
48. Stromberg, P.C. (1985) Large granular lymphocyte leukemia in F344 rats: Model for human Tg lymphoma, malignant histiocytosis, and T-cell chronic lymphocytic leukemia. Am. J. Pathol. 119:517-519.
49. Stromberg, P.C.; Vogtsberger, L.M. (1983) Pathology of the mononuclear cell leukemia of Fischer rats. I. Morphologic studies. Vet. Pa-thol. 20:698-708.
50. Stromberg, P.C.; Vogtsberger, L.M.; Marsh, L.R.; Wilson, F.D. (1983) Pathology of the mono- nuclear cell leukemia of Fischer rats. II. Hema- tology. Vet. Pathol. 20:709-717.
51. Stromberg, P.C.; McMurray, D.N.; Brown, C.A. (1988) Inhibition of in vitro mitogen in- duced lymphoproliferative responses by sera from F344 rats with large granular lymphocyte leukemia. J. Clin. Lab. Immunol. 25:89-95.
52. Tarone, R.E. (1975) Tests for trend in life table analysis. Biometrika 62:679-682.
53. Weisburger, E.K.; Murthy, A.S.K.; Lilja, H.S.; Lamb, J.C., IV (1984) Neoplastic response of F344 rats and B6C3F1 mice to the polymer and dyestuff intermediates 4,4’-methylenebis (N,N-dimethyl)benzenamine,4,4’-oxydianiline, and 4,4’-methylenedianiline. J. Natl. Cancer Inst. 72:1457-1463.
54. Zeiger, E . ; Anderson, B.; Haworth, S.; Lawlor, T.; Mortelmans, K.; Speck, W. (1987) Salmonella mutagenicity tests: III. Results from the testing of 255 chemicals. Environ. Mu- tagen. 9(Suppl.9):1-110.
Iodinated Glycerol, NTP TR 340 72

APPENDIX A
SUMMARY OF LESIONS IN MALE RATS IN
THE TWO-YEAR GAVAGE STUDY OF
IODINATED GLYCEROL
TABLE A l
TABLE A2
TABLE A3
TABLE A4a
TABLE A4b
TABLE A4c
TABLE A4d
TABLE A5
SUMMARY OF THE INCIDENCE OF NEOPLASMS IN MALE RATS IN THE TWO-YEAR GAVAGE STUDY OF IODINATED GLYCEROL
INDIVIDUAL ANIMAL TUMOR PATHOLOGY OF MALE RATS IN THE TWO-YEAR GAVAGE STUDY OF IODINATED GLYCEROL
ANALYSIS OF PRIMARY TUMORS IN MALE RATS IN THE TWO-YEAR GAVAGE STUDY OF IODINATED GLYCEROL
HISTORICAL INCIDENCE OF LEUKEMIA IN CONTROL MALE F344/N RATS
HISTORICAL INCIDENCE OF THYROID GLAND FOLLICULAR CELL TUMORS IN CONTROL MALE F344/N RATS
HISTORICAL INCIDENCE OF NASAL CAVITY TUMORS IN CONTROL MALE F344/N RATS
HISTORICAL INCIDENCE OF TESTICULAR INTERSTITIAL CELL TUMORS IN CONTROL MALE F344/N RATS
SUMMARY OF THE INCIDENCE OF NONNEOPLASTIC LESIONS IN MALE RATS IN THE TWO-YEAR GAVAGE STUDY OF IODINATED GLYCEROL
PAGE
75
78
84
88
89
89
90
91
73 Iodinated Glycerol; NTP TR 340

Iodinated Glycerol, NTP TR 340 74

TABLE Al. SUMMARY OF THE INCIDENCE OF NEOPLASMS IN MALE RATS IN THE TWO-YEAR GAVAGE STUDY OF IODINATED GLYCEROL
Vehicle Control Low Dose High Dose
Animals initially in study Animals necropsied Animals examined histopathologically
50 50 50
50 50 50
50 50 50
INTEGUMENTARY SYSTEM *Skin
Squamous cell papilloma Squamous cell carcinoma Basal cell tumor Basal cell carcinoma Trichoepithelioma Keratoacanthoma
Fibroma Fibrosarcoma Neurofibrosarcoma
*Subcutaneous tissue
(50) 2 (4%)
1 (2%)
3 (6%)
1 (2%)
1 (2%)
(50)
(50)
1 (2%) 1 (2%) 1 (2%)2 (4%)
2 (4%) 1 (2%)
(50)
(50)
1 (2%)
2 (4%)
1 (2%) (50)
RESPIRATORY SYSTEM #Nasal cavity
Adenoma, NOS
Alveolar/bronchiolar adenoma Alveolar/bronchiolar carcinoma Pheochromocytoma, metastatic Chordoma, metastatic
#Lung
(48)
1 (2%)
1 (2%) 1 (2%)
(50)
(47)
2 (4%) (50)
(49) 2 (4%)
1 (2%)
(50)
HEMATOPOIETIC SYSTEM *Multiple organs
Leukemia, mononuclear cell (50)
14 (28%) (50)
29 (58%) (50)
24 (48%)
CIRCULATORY SYSTEM #Spleen
Hemangiosarcoma (50) (50)
2 (4%) (50)
DIGESTIVE SYSTEM #Liver
#PancreasNeoplastic nodule
Acinar cell adenoma Acinar cell carcinoma
(50)
(49)
(50)
(49) 2 (4%)
1 (2%)
(50)
(49) 2 (4%)
1 (2%)
URINARY SYSTEM #Kidney
Tubular cell adenoma Lipoma
Mesothelioma, invasive #Urinary bladder
(50)
1 (2%)(49)
(50)
(49)
(50) 1 (2%)
1 (2%) (48)
75 Iodinated Glycerol, NTP TR 340

TABLE Al. SUMMARY OF THE INCIDENCE OF NEOPLASMS IN MALE RATS IN THE TWO-YEAR GAVAGE STUDY OF IODINATED GLYCEROL (Continued)
Vehicle Control Low Dose
~~
High Dose
ENDOCRINE SYSTEM #Anterior pituitary
Carcinoma, NOS Adenoma, NOS
#Adrenal cortex Adenoma, NOS
#Adrenal medulla PheochromocytomaPheochromocytoma, malignant
Follicular cell carcinoma C-cell adenoma C-cell carcinoma
#Pancreatic islets Islet cell adenoma Islet cell carcinoma
#Thyroid
(48)1 (2%)
25 (52%) (50)
(50) 23 (46%) 5 (10%)
(49)
3 (6%) 4 (8%)
3 (6%) 2 (4%)
(49)
(47)
(50)
(50)
(49)
2 (4%)10 (21%)
19 (38%) 1 (2%)
5 (10%) 2 (4%) 1 (2%)
(49)
1 (2%)
(46)
(49)
(49)
(49)
7 (15%)
1 (2%)
10 (20%)
1 (2%) 2 (4%)
(49)
REPRODUCTIVE SYSTEM *Mammary gland
Fibroadenoma *Preputial gland
Carcinoma, NOS Adenoma, NOS
#Testis Interstitial cell tumor
*Scrotum Sarcoma, NOS
(50)
(50) 3 (6%)
3 (6%) 1 (2%)
46 (92%) (50)
(50)
(50)
(50) 2 (4%)
1 (2%) 1 (2%)
(50)
(50) 49 (98%)
1 (2%)
(50)
(50) 3 (6%)
3 (6%)
(50)
(50) 48 (96%)
NERVOUS SYSTEM #Cerebrum
#BrainOligodendroglioma
Glioma, NOS
SPECIAL SENSE ORGANS *External ear
Squamous cell papilloma Fibroma
*Zymbal gland Carcinoma, NOS
(50)
1 (2%) (50)
(50)1 (2%) 1 (2%)
(50)
(50)
2 (4%)(50)
MUSCULOSKELETAL SYSTEM *Vertebral column
Chordoma (50)
BODY CAVITIES None
ALL OTHER SYSTEMS *Multiple organs
C-cell carcinoma, metastatic Histiocytic sarcoma Mesothelioma, NOS Mesothelioma, malignant
(50)
1 (2%) 1 (2%)
(50)1 (2%)
1 (2%) 1 (2%)
(50)
1 (2%) 1 (2%)
Iodinated Glycerol, NTP TR 340 76

TABLE Al. SUMMARY OF THE INCIDENCE OF NEOPLASMS IN MALE RATS IN THE TWO-YEAR GAVAGE STUDY OF IODINATED GLYCEROL (Continued)
Vehicle Control Low Dose High Dose.
ANIMAL DISPOSITION SUMMARY Animals initially in study 50 50 50
Natural death 6 14 10 Moribund sacrifice 17 16 38 Terminal sacrMce 27 20 2
TUMOR SUMMARY Total animals with primary tumors** 50 49 49
Total primary tumors 148 143 115 Total animals with benign tumors 50 49 48
Total benign tumors 113 93 78 Total animals with malignant tumors 29 37 29
Total malignant tumors 34 47 34 Total animals with secondary tumors## 2 1 1
Total secondary tumors 2 1 1 Total animals with tumors-
uncertain benign or malignant 1 3 3 Total uncertain tumors 1 3 3
* Number of animals receiving complete necropsy examinations; all gross lesions including masses examined microscopically. ** Primary tumors: all tumors except secondary tumors # Number of animals examined microscopically a t this site ## Secondary tumors: metastatic tumors or tumors invasive into an adjacent organ
77 Iodinated Glycerol, NTP TR 340
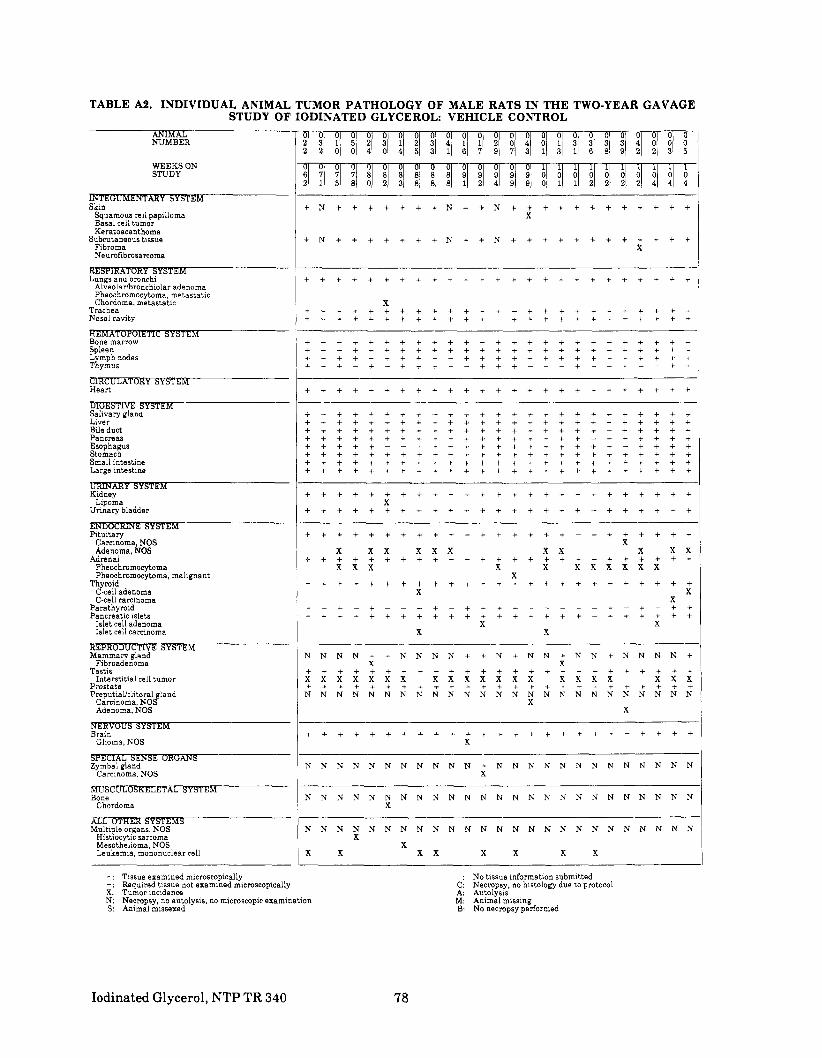
TABLE A2. INDIVIDUAL ANIMAL TUMOR PATHOLOGY OF MALE RATS IN THE TWO-YEAR GAVAGE STUDY OF IODINATED GLYCEROL: VEHICLE CONTROL
NUMBER 2 3 1 5 2 3 1 2 3 4 1 1 2 0 4 0 1 3 3 3 3 4 0 0 0 2 2 0 0 4 0 4 5 3 1 6 7 9 7 3 1 3 1 6 8 9 2 2 3 5
WEEKS ON 0 u 0 0 0 0 0 0 0 0 0 0 0 0 0 1 1 1 1 1 1 1 1 1 1 STUDY 6 7 7 7 8 8 8 8 8 8 9 9 9 9 9 0 0 0 0 0 0 0 0 0 0
2 1 5 8 0 2 3 8 8 8 1 2 4 9 9 0 1 1 2 2 2 2 4 4 4
Skin + N + + + + + + + N + + N + + + + + + + + + + + + Squamous cell papilloma X Basal cell tumor
+ N + + + + + + + N + + N + + + + + + + + + + + + X
Lungs and bronchi . . . . . . . . . . . . . . . . . . . . . . . . . Alveolar/bronchiolar adenoma Pheochromocytoma, metastatic Chordoma, metastatic X
Trachea . . . . . . . . . . . . . . . . . . . . . . . . . Nasal cavity . . . . . . . . . . . . . . . . . . . . . . . . .
Bone marrow . . . . . . . . . . . . . . . . . . . . . . . . . Spleen . . . . . . . . . . . . . . . . . . . . . . . . . Lymph nodes . . . . . . . . . . . . . . . . . . . . . . . . . Thymus + + + - + - + + + - - + + + - - - + - + + - - + +
Heart + + + t + + + + + + f t + + + + + + + + + + t + +
Salivary gland . . . . . . . . . . . . . . . . . . . . . . . . . Liver . . . . . . . . . . . . . . . . . . . . . . . . . Bile duct . . . . . . . . . . . . . . . . . . . . . . . . . Pancreas . . . . . . . . . . . . . . . . . . . . . . . . . Esophagus . . . . . . . . . . . . . . . . . . . . . . . . . Stomach . . . . . . . . . . . . . . . . . . . . . . . . . Small intestine . . . . . . . . . . . . . . . . . . . . . . . . . Large intestine . . . . . . . . . . . . . . . . . . . . . . . . .
Kidney . . . . . . . . . . . . . . . . . . . . . . . . . Lipoma X
Urinary bladder . . . . . . . . . . . . . . . . . . . . . . . . .
Pituitary . . . . . . . . . . . . . . . . . . . . . . . . . Carnnoma, NOS X Adenoma, NOS x x x x x x x x x x x
Adrenal . . . . . . . . . . . . . . . . . . . . . . . . . Pheochromocytoma x x x X x x x x x x x Pheochromocytoma, malignant X
Thyroid . . . . . . . . . . . . . . . . . . . . . . . . . C-cell adenoma X X C-cell camnoma X
Parathyroid - - + - + - - - + - + + + + - - - - - + - + - + + Pancreatic islets . . . . . . . . . . . . . . . . . . . . . . . . .
Islet cell adenoma X X Islet cell carcinoma X X
M Mammary gland N N N N + + N N N N + + N + N N + N N + N N N N +
Fibroadenoma X X Testis . . . . . . . . . . . . . . . . . . . . . . . . .
Interstitial cell tumor x x x x x x x x x x x x x x x x x x x x x Prostate . . . . . . . . . . . . . . . . . . . . . . . . . PreputiaUclitoral gland N N N N N N N N N N N N N N N N N N N N N N N N N
Carcinoma,NOS X Adenoma, NOS X
Brain + + + + + + + + + + + + + + + + + + + + + + + + + Glioma. NOS x
SPECIAL-GANS Zymbal gland N N N N N N N N N N N + N N N N N N N N N N N N N
Carcinoma. NOS X -
Bone N N N N N N N N N N N N N N N N N N N N N N N N N Chordoma X
S Multiple organs, NOS N N N N N N N N N N N N N N N N N N N N N N N N N
Histiocytic sarcoma X Mesothelioma, NOS X Leukemia. mononuclear cell x x x x x x x x
+: Tissue examined microscopically ' No tissue information submitted -: Required tissue not examined microscopically Ci Necropsy, no histology due to protocolX: Tumor incidence A AutolysisN: Necropsy, no autolysis, no microscopic examination M: Animal missing S : Animal missexed B: No necropsy performed
Iodinated Glycerol, NTP TR 340 78

l ~
TABLE A2. INDIVIDUAL ANIMAL TUMOR PATHOLOGY OF MALE RATS VEHICLE CONTROL (Continued)
NUMBER
WEEKS ON STUDY
0 0 0 0 0 0 0 0 0 0 0 0 0 0 0 0 0 0 0 0 0 0 0 0 0 0 1 1 1 2 2 2 2 2 3 3 3 4 4 4 4 4 4 0 1 1 2 4 6 8 9 2 5 8 0 3 6 7 8 4 5 7 4 5 6 7 8 9 4 1 9 1 0
0 0
r ~ l l l ~ ~ ~ l ~ ~ l l l l ~ l 0 0 0 0 0 0 0 0 0 0 0 0 0 0 0 0 0 0 0 0 0 0 0 0 0 4 4 4 4 4 4 4 4 4 4 4 4 4 4 4 4 4 4 4 4 5 5 5 5 5
l l 'OTAL:ISSUES UMORS
l l l l
Skin___Squamous cell papilloma Basal cell tumor Keratoacanthoma
Subcutaneous tissue Fibroma Neurofibrosarcoma
+ + + + + + + + N + + N + + + + + + + + N + + + +
X X + + + + + + + + N + + N + + + + + + + + N + + + +
X X
X
X
'50 2 1 3
*50 1 1
Lungs and bronchi Alveolarhmnchiolar adenoma Pheochromocytoma metastatic Chordoma, metastalk
Trachea Nasal cavity
.
.
.
.
.
.
.
.
.
.
.
.
.
.
.
.
.
.
.
.
.
.
.
.
.
.
.
.
.
.
.
.
.
.
.
.
.
.
.
.
.
.
.
.
.
.
.
.
.
.
.
.
.
.
.
.
.
.
X
.
.
.
.
.
.
.
.
.
.
.
. X
.
.
.
.
.
50 1 1 1
49 48
Bone marrow SpleenL mphnodes Tgymus
. . . . . . . . . . . . . . . . . . . . . . . . . . . . . . . . . . . . . . . . . . . . . . . . . .
. . . . . . . . . . . . . . . . . . . . . . . . .+ - - + + + + + + + + + + - - + - + + - + + - + +
50 50 49 33
Heart . . . . . . . . . . . . . . . . . . . . . . . . . 50
Salivary gland Liver Bile duct Pancreas Esopha s Stomae% Small intestine Large intestine
++++
. . . . . . . . . . . . . . . . . . . . . . . . + + + + + + + t + + + + + + + t + + + t + + + + . . . . . . . . . . . . . . . . . . . . . . . . . . . . . . . . . . . . . . . . . . . . . . . . . . . . . . . . . . . . . . . . . . . . . . . . .
. . . . . . . . . . . . . . . . . . . . . . . . .
. . . . . . . . . . . . . . . . . . . . . . . . .
. . . . . . . . . . . . . . . . . . . . . . . . .
48 50 50 49 44 49 50 49
Kidney
Urinary bladder Lipoma
. . . . . . . . . . . . . . . . . . . . . . . . .
. . . . . . . . . . . . . . . . . . . . . . . . . 50 1
49
C-cell adenoma Gcell carcinoma
ParathyroidPancreatic islets
Islet cell adenoma Islet cell carcinoma
. . . . . . . . . . . . . . . . . . . . . . . . .
X x x x x x x x x x x x x x . . . . . . . . . . . . . . . . . . . . . . . . . x x x x x x x X X x x X
. . . . . . . . . . . . . . . . . . . . . . . . . x x X X X
+ - - - + + - - + - - - - - - + - - - + - - t - + . . . . . . . . . . . . . . . . . . . . . . . . . X
X X X
48 1
25 50 23
5 49
3 4
19 49
3 2
+ + N + + + N + N N N + + N N + N N N N N N N + N Y
. . . . . . . . . . . . . . . . . . . . . . . . . x x x x x x x x x x x x x x x x x x x x x x x x x . . . . . . . . . . . . . . . . . . . . . . . . . N N N N N N N N N N N N N N N N N N N N N N N N N x x
*50 3
50 46 50
'50 3 1
Brain Glioma. NOS
. . . . . . . . . . . . . . . . . . . . . . . . . 50 1
-AL S E m ORGANS Zymbal gland
Carcinoma. NOS
~ ~~ ~
N N N N N + N N N N N N N N N N N N N N N N N N N *50 1
Bone Chordoma
ETAL N N N N N N N N N N N N N N N N N N N N N N N N N ' 5 0
1
S Multiple organs, NOS
Histiocytic sarcoma Mesothelioma. NOS Leukemia, mononuclear cell
N N N N N N N N N N N N N N N N N N N N N N N N N
x x x x x X
'50 1 1
14
'Animals necropsied
79 Iodinated Glycerol, NTP TR 340

TABLE A% INDIVIDUAL ANIMAL TUMOR PATHOLOGY OF MALE RATS IN THE TWO-YEAR GAVAGE STUDY OF IODINATED GLYCEROL: LOW DOSE
0 0 0 0 0 0 0 0 0 0 0 0 0 0 0 0 0 0 0 0 0 0 0 0 0 NUMBER 1 3 3 0 3 2 3 0 1 3 0 1 0 1 4 3 4 5 3 0 0 2 2 2 2
5 7 9 6 4 0 2 3 7 0 5 3 2 9 8 8 0 0 6 8 9 1 2 5 6
Skin . . . . . . . . . . . . . . . . . . . . . . . . .
Subcutaneous tissue + + + + + + + + + + + + + N + + + + + + + + + + + Fibroma X Fibrosarcoma X
~ ~ ~ ~
Lungs and bronchi . . . . . . . . . . . . . . . . . . . . . . . . . Alveolar/bronchiolar adenoma X
Trachea . . . . . . . . . . . . . . . . . . . . . . . . . Nasal cavity - - - . . . . . . . . . . . . . . . . . . . . . .
Bone marrow . . . . . . . . . . . . . . . . . . . . . . . . . Spleen . . . . . . . . . . . . . . . . . . . . . . . . .
Hemansosarcoma X L m p h n d e s . . . . . . . . . . . . . . . . . . . . . . . . . Tgymus - - + - + - + + + + + + + + + - - + - -
Heart . . . . . . . . . . . . . . . . . . . . . . . . .
Salivary gland . . . . . . . . . . . . . . . . . . . . . . . . . Liver . . . . . . . . . . . . . . . . . . . . . . . . .
Neoplastic nodule Bile duct + t + + + + + + t + + + + t + + + + + + + + + + + Pancnas . . . . . . . . . . . . . . . . . . . . . . . . .
Acinar cell cartinoma + + + + + - + t t - - + + + t + + + + - + + + + + :2kr . . . . . . . . . . . . . . . . . . . . . . . . .
Small intestine . . . . . . . . . . . . . . . . . . . . . . . . . Large intestine . . . . . . . . . . . . . . . . . . . . . . . . .
Kidney . . . . . . . . . . . . . . . . . . . . . . . . . Urinary bladder . . . . . . . . . . . . . . . . . . . . . . . . .
Pituitary . . . . . . . . . . . . . . . . . . . . . . . . . Carnnoma NOS AAdenoma, kOS X X X
Adrenal . . . . . . . . . . . . . . . . . . . . . . . . . Pheochromocytoma x x x x x x x xPheochromocytoma, malignant
Thyroid . . . . . . . . . . . . . . . . . . . . . . . . . Follicular cell carcinoma C-cell adenoma X C-cell carcinoma
Parathyroid - - + - - - + - + + + - + - - + - - - + + + - - -Pancreatic islets . . . . . . . . . . . . . . . . . . . . . . . . .
Islet cell carcinoma
TEM Mammary gland N + + N N N + N + N + N + N N + + + + N + + + + +
Fibroadenoma Y Testis . . . . . . . . . . . . . . . . . . . . . . . . .
Interstitial cell tumor x x x x x x x x x x x x x x x x x x x x x x x xProstate . . . . . . . . . . . . . . . . . . . . . . . . .
N N N N N N N N N N N N N N N N N N N N N N N N N
Brain . . . . . . . . . . . . . . . . . . . . . . . . .
Ear N N N N N N + N N N N N N N N N N N N N N N N N N S uamous cell papilloma Fcbroma X
~S Multi le organs. NOS N N N N N N N N N N N N N N N N N N N N N N N N N
C-ce'i carcinoma, metastatic Mesothelioma NOS X Mesothelioma: mah nant Leukemia, mononuc%ar cell x x x x x x x x x x x x x x x x x x
Scrotum,NOS Sarcoma, NOS X
Iodinated Glycerol, NTP TR 340 ao

TABLE A2. INDIVIDUAL
ANIMAL NUMBER
WEEKS ON STUDY
Slun Basal cell tumor Basal cell caranoma TnchoepithehomaKeratoacanthoma
Subcutaneous tissue Fibroma Fibrosarcoma
Lungs and bronchi Alveolar/bronchiolar adenoma
Trachea Nasal can ty
Bone marrow Spleen
HemanPosarcoma L mphnodesd y m u s
Heart
Salivary gland Liver
Neoplastic nodule Bile duct Pancreas
Acinar cell carcinoma
::::iT Small intestine Large intestine
KidneyUnnary bladder
Rtui tary Carcinoma, NOS Adenoma, NOS
Adrenal PheochromocytomaPheochromocytoma. malignant
ThyroidFollicular cell carcinoma C cell adenoma C-cell carcinoma
ParathyroidPancreatic islets
Islet cell carcinoma
Mammary gland Fibroadenoma
Testis Interstitial cell tumor
Prostate Preputiaiiclitoral gland
Carcinoma, NOS Adenoma, NOS
Brain
uamous cell papilloma a r o m a
S Multi le organs NOS
c-ceP1 carcinoAa. metastatic Mesothelioma, NOS Mesothelioma, mali nant Leukemia, mononucyear cell
Scrotum, NOS Sarcoma, NOS
*Animals necropsied
ANIMAL TUMOR PATHOLOGY OF MALE RATS LOW DOSE (Continued)
0 0 0 0 0 0 0 0 0 0 0 0 0 0 0 0 0 0 0 0 0 0 0 0 3 3 4 1 4 0 0 0 1 1 1 1 1 2 2 2 2 2 3 4 4 4 4 4 4 1 5 1 8 6 1 4 7 0 1 2 4 8 3 4 7 8 9 3 2 3 4 5 7 9
D l l l l l l l l l l l l l l l l l l l l l l l l 9 0 0 0 0 0 0 0 0 0 0 0 0 0 0 0 0 0 0 0 0 0 0 0 0 9 1 1 3 3 4 4 4 4 4 4 4 4 4 4 4 4 4 4 4 4 4 4 4 4
+ + + t t + + + + + + + + t + + + + t + C N f + +*50 X 1
X 1 X 1
X X 2+ + + + + + + + + + + + + + + + + + + N + + + *50 X 2
1
. . . . . . . . . . . . . . . . . . . . . . . . . 50 X 2
+ + + + + + + + * + * + + + + * + + + t + + + + +50+ + + + + * + + + * + * + + * + + + + + + + * + + 47
+ * + + + + * * + * + + + + * * * + + + * + t + +50 . . . . . . . . . . . . . . . . . . . . . . . . . 50
X 2 * + + + + + + * + + * * + + * + + + t + + + + * +49
34+ + * - + + + t - + - + t t + t t + t t + * - * +
+ + + + + + + + * + * * + + + + + * + + * + + + + 50
. . . . . . . . . . . . . . . . . . . . . . . . . 50* + + * + + + + + + + + + + * + + * + + + + + + + 50
X X 2 50+ + + + + + + + + + + + + + + + + * + t + * + * * . . . . . . . . . . . . . . . . . . . . . . . . . 49
X 1 + + + t - + + + - + + * + + + * t + + + * + t + + 44* + * - + + + + * * + + + + + + + + + + + + * + + 49 . . . . . . . . . . . . . . . . . . . . . . . . . 49 + + + + + + + + + * + * + - t + + + * + + * + + *47
50+ * + + + + + + + + + + + + + + + + t + + + + + ++ + + + + + * + + + + + + + + + + * * + + * + + + 49
. . . . . . . . . . . . . . . . . . . . . . . . . 47 X 2
X x x x x X X 10 50+ + + + + + + t + + + + + + + + + + + t t * t + +
X X x x x x x X x x X 19 X 1
49 X X x x X 5 + + + * + + + + + t + * t + + + t + + t + t + + +
X 2 X 1+ + + + + + + + + + * - - - + - - - - + + + + + - 27
49+ + + + + + + + + * * + + + + + t * + + + + + + + X 1
+ N N + + N + + + N N N N + + + N + N N + N * + N *50 X 2* + + + + + + + + * + + + + * + + + * + + + + + + 50
x x X x x x x x x x x x x x x x x x x x x x x x x 49+ + + + + + + + + + + * * + + + + + + + + * * + + 49 N N N N N N N N N N N N N N N N N N N N N N N N N $50
X 1 X 1
. . . . . . . . . . . . . . . . . . . . . . . . . 50
N N N N N N N N N N N N N N N N N N N N + N N N N '50 X 1
1
N N N N N N N N N N N N N N N N N N N N N N N N N '50 X 1
1 X 1 x x x x x x x x x x x 29
1
81 Iodinated Glycerol, NTP TR 340

TABLE A2. INDIVIDUAL ANIMAL TUMOR PATHOLOGY OF MALE RATS IN THE TWO-YEAR GAVAGE STUDY OF IODINATED GLYCEROL: HIGH DOSE
~ A L 0 0 0 0 0 0 0 0 0 0 0 0 0 0 0 0 0 0 0 0 0 0 0 0 0NUMBER 0 1 4 1 2 1 2 2 1 1 5 0 4 4 2 3 4 4 3 4 1 3 2 0 2
6 4 1 7 2 6 4 8 8 0 0 7 4 6 6 6 5 9 4 3 1 9 7 4 5
WEEKSON D 0 0 0 0 0 0 0 0 0 0 0 0 0 0 0 0 0 0 0 0 0 0 0 0 STUDY 1 8 1 7 7 7 a a a a a a a a a 8 a a a a a a a g g
1 4 1 5 5 8 1 1 2 3 4 5 5 5 6 6 6 6 7 7 8 8 9 4 4
Skin . . . . . . . . . . . . . . . . . . . . . . . . . Squamous cell carcinoma X Keratoacanthoma X X
Subcutaneous tissue . . . . . . . . . . . . . . . . . . . . . . . . .Fibroma
Lungs and bronchi . . . . . . . . . . . . . . . . . . . . . . . . . Nveolar/bmnchiolar carcinoma
Trachea . . . . . . . . . . . . . . . . . . . . . . . . . Nasal cavity . . . . . . . . . . . . . . . . . . . . . . . . .
Adenoma, NOS M
Bone marrow . . . . . . . . . . . . . . . . . . . . . . . . .Spleen . . . . . . . . . . . . . . . . . . . . . . . . . L mphnodes + + t + t + t + + + + + + + + + + + + + + + + + + Txymus + - + + - - + + - + + + + + + + + + + + - + - - +
Heart . . . . . . . . . . . . . . . . . . . . . . . . .
Salivary gland . . . . . . . . . . . . . . . . . . . . . . . . . Liver . . . . . . . . . . . . . . . . . . . . . . . . .
Neoplastic nodule Bile duct + + + + + t + + + + + + + + t + + + t + + + + + + Pancreas . . . . . . . . . . . . . . . . . . . . . . . . .
Acinar cell adenoma
!::2,,Small intestine Large intestine
Kidnev
M Pituitary
Adenoma, NOS Adrenal
Adenoma NOS Pheochromocytoma
ThyroidFollicular cell carcinoma C-cell adenoma
Parathyroid
Mammary gland Fibroadenoma
Testis Interstitial cell tumor
Brain Oligodendmglioma
Zymbal gland Carcinoma, NOS
s Multiple organs NOS
Mesothelioma: NOS Mesothelioma mali nant Leukemia, m<nonucYear cell
. . . . . . . . . . . . . . . . . . . . . . . . . . . . . . . . . . . . . . . . . . . . . . . . . . . . . . . . . . . . . . . . . . . . . . . . . . .
. . . . . . . . . . . . . . . . . . . . . . . . .
. . . . . . . . . . . . . . . . . . . . . . . . .
. . . . . . . . . . . . . . . . . . . . . . . . . X
. . . . . . . . . . . . . . . . . . . . . . . . . X X . . . . . . . . . . . . . . . . . . . . . . . . .
x x X X . . . . . . . . . . . . . . . . . . . . . . . . .
N + N + N N N N N N + + + + N N N N + + N + + + N X . . . . . . . . . . . . . . . . . . . . . . . . . x x x x x x x x x x x x x x x x x x x x x x x . . . . . . . . . . . . . . . . . . . . . . . . .
N N N N N N N N N N N N N N N N N N N N N N N N N
. . . . . . . . . . . . . . . . . . . . . . . . .
N N N N N N N N N N N N N N N N N N N + N N N N N X
N N N N N N N N N N N N N N N N N N N N N N N N N X
X x x x x x x x x x x x x x x x x x
Iodinated Glycerol, NTP TR 340 a2

TABLE A2. INDIVIDUAL ANIMAL TUMOR PATHOLOGY OF MALE RATS HIGH DOSE (Continued)
ANIMAL 1 0 0 0 0 0 0 0 0 0 0 0 0 0 0 0 0 0 0 0 0 0 0 0 0 NUMBER 1 3 1 2 2 4 0 0 0 0 0 1 2 3 3 3 3 4 4 0 3 1 1 3 4
3 7 2 3 1 2 9 1 2 3 5 5 0 1 2 5 3 0 8 8 8 3 9 0 7 'OTAL:
WEEKS ON ) 0 0 0 0 0 0 0 0 0 0 0 0 0 0 0 1 1 1 1 1 1 1 1 1 [SSUESSTUDY 3 9 9 9 9 9 9 9 9 9 9 9 9 9 9 9 0 0 0 0 0 0 0 0 0 UMORS
1 4 5 5 6 6 8 9 9 9 9 9 9 9 9 9 0 0 1 ' 2 2 4 4 5 5 -S h n + + + + + N + + + + + + + + + + + + + N + + + + + '50
Squamous cell carnnoma 1 Keratoacanthoma 2
Subcutaneous tissue + + + + + N + + + + + + + + + + + + + N + + + + + '50 Fibroma X 1
Lungsand bronchi . . . . . . . . . . . . . . . . . . . . . . . . . 50 Alveolarhronchiolar camnoma X 1
Trachea + + + + + + + + + + + + + + + + + + t t + + + t + 50 Nasal canty . . . . . . . . . . . . . . . . . . . . . . . . . 49
Adenoma, NOS X X 2
Bone marrow . . . . . . . . . . . . . . . . . . . . . . . . . 50 Spleen 50. . . . . . . . . . . . . . . . . . . . . . . . .L mphnodes . . . . . . . . . . . . . . . . . . . . . . . . . 50 Tgymus - - + + - + - + + + + + - + + - + + - + + + + + + 36
Heart . . . . . . . . . . . . . . . . . . . . . . . . . 50
Salivary gland . . . . . . . . . . . . . . . . . . . . . . . . . 49 Liver . . . . . . . . . . . . . . . . . . . . . . . . . 50
Neoplastic nodule x x 2 Bile duct . . . . . . . . . . . . . . . . . . . . . . . . . 50 Pancreas . . . . . . . . . . . . . . . . . . . . . . . . . 49
Amarce l l adenoma X 1+ + + - + + + + + + + + + - - - - + + - + - - - + 36:i?::X= + + t + + + + + + + + + + + + + i t + + + t + + +50 Small intestine . . . . . . . . . . . . . . . . . . . . . . . . . 50 Large intestine . . . . . . . . . . . . . . . . . . . . . . . . . 50
Kidney . . . . . . . . . . . . . . . . . . . . . . . . . 50 Tubular cell adenoma X 1
Unnary bladder . . . . . . . . . . . . . . . . . . . . . . . . . 48 Mesothelioma. invasive 1
Rtuitary . . . . . . . . . . . . . . . . . . . . . . . . . 46 Adenoma, NOS x x X x x 7
Adrenal . . . . . . . . . . . . . . . . . . . . . . . . . 49 Adenoma, NOS X 1 Pheochromocytoma x x X x x X 10
Thyroid . . . . . . . . . . . . . . . . . . . . . . . . . 49 Follicular cell carcinoma X 1 C-cell adenoma X X 2
Parathyroid - + - t - + + + + - - - + + + - - - - - + + - + + 25
Mammary gland N N + N + N N + N N N + + N N N N + N N + N N N + *50 Fibroadenoma X X 3
Testis . . . . . . . . . . . . . . . . . . . . . . . . . 50 Interstitial cell tumor x x x x x x x x x x x x x x x x x x x x x x x x x 48
Prostate . . . . . . . . . . . . . . . . . . . . . . . . . 47 PreputiaYclitoral gland N N N N N N N N N N N N N N N N N N N N N N N N N '50
Carcinoma, NOS x x X 3
Brain . . . . . . . . . . . . . . . . . . . . . . . . . 50 Oligodendroglioma X 1
Zymbal gland N N N N N N N + N N N N N N N N N N N N N N N N N '50 Carcinoma, NOS X 2
S Multiple organs NOS N N N N N N N N N N N N N N N N N N N N N N N N N '50
Mesothelioma' NOS 1 Mesothelioma: mali an t 1 Leukemia. mononucrar cell x x X X x x X 24
* Animals necropsied
83 Iodinated Glycerol, NTP TR 340

TABLE A3. ANALYSIS OF PRIMARY TUMORS IN MALE RATS I N THE TWO-YEAR GAVAGE STUDY OF IODINATED GLYCEROL
Vehicle Control 125 mg/kg
Skin: Keratoacanthoma Overall Rates (a) 3/50 (6%) 2/50 (4%)Adjusted Rates (b) 10.7% 10.0% Terminal Rates(c) 3/28(11%) 2/20 (10%)Week of First Observation 104 104 Life Table Tests (d) P=0.3 14 P =0.654N Incidental Tumor Tests (d) P=0.434 P=0.654N Cochran-Armitage Trend Test (d) P=0.406N Fisher Exact Test (d) P=0.500N
Skin: Trichoepithelioma, Basal Cell Tumor, or Basal Cell Carcinoma Overall Rates (a) 1/50(2%) 3/50 (6%) Adjusted Rates (b) 3.6% 12.4% Terminal Rates (c) 1/28 (4%) 1/20 (5%) Week of First Observation 104 99 Life Table Tests (d) P =0.472 P=0.212 Incidental Tumor Tests (d) P =0.467N P =0.315 Cochran-Armitage Trend Test (d) P=0.378N Fisher Exact Test (d) P=0.309
Subcutaneous Tissue: Fibroma o r Fibrosarcoma Overall Rates (a) 1/50 (2%) 3/50 (6%) Adjusted Rates (b) 3.1% 9.6% Terminal Rates (c) 0/28 (0%) 1/20(5%)Week of First Observation 102 49 Life Table Tests (d) P =0.328 P=0.240 Incidental Tumor Testa (d) Pt0.453N P=0.555 Cochran-Armitage Trend Test (d) P=0.610 Fisher Exact Test (d) P=0.309
Subcutaneous Tissue: Fibroma, Fibrosarcoma, or Neurofibrosarcoma Overall Rates (a) 2/50 (4%) 3/50 (6%) Adjusted Rates (b) 6.6% 9.6% Terminal Rates (c) 1/28 (4%) 1/20 (5%)Week of First Observation 102 49 Life Table Tests (d) P=0.455 P =0.398 Incidental Tumor Tests (d) P =0.332N P=0.685N Cochran-Armitage Trend Test (d) P=0.399N Fisher Exact Test (d) P =0.500
Hematopoietic System: Mononuclear Cell Leukemia Overall Rates (a) 14/50 (28%) 29150 (58%) Adjusted Rates (b) 35.9% 69.5% Terminal Rates (c) 6/28 (21%) 9/20 (45%) Week of First Observation 62 55 Life Table Tests (d) P <0.001 P = 0.001 Incidental Tumor Tests (d) P-0.174 P=0.003 Cochran-Armitage Trend Test (d) P=0.028 Fisher Exact Test (d) P=0.002
Anterior Pituitary Gland: Adenoma Overall Rates (a) 25/48 (52%) 10147 (21%) Adjusted Rates tb) 67.6% 40.3% Terminal Rates (c) 16/27 (59%) 7/20 (35%) Week of First Observation 75 81 Life Table Tests (d) P=0.178N P=0.022N Incidental Tumor Tests (d) P=0.002N P =0.004N Cochran-Armitage Trend Test (d) P<0.001N Fisher Exact Test (d) P=0.002N
250 mg/kg
2/50 (4%) 4.9% 014 (0%)82 P=0.426 P=0.609
P=0.500N
0/50 (0%)0.0% 014 (0%)
P =0.872N P =0.872N
P =0.500N
1150 (2%) 5.6% 014 (0%) 99 P =0.490 P =0.566N
P =0.753
1/50 (2%) 5.6% 014 (0%) 99 P=0.564 P =0.490N
P=0.500N
24/50 (48%) 65.2% 014 (0%)64 P <0.001 P=0.226
P=0.032
7/46 (15%)48.4% 114 (25%) 82 P=0.471N P=0.006N
P <0.001N
Iodinated Glycerol, NTP TR 340 84

TABLE A3. ANALYSIS OF PRIMARY TUMORS IN MALE RATS IN THE TWO-YEAR GAVAGE STUDY OF IODINATED GLYCEROL (Continued)
Vehicle Control 125 mg/kg 250 mg/kg
Anterior Pituitary Gland: Adenoma o r Carcinoma Overall Rates(a) Adjusted Rates (b) Terminal Rates (c)Week of First Observation
26/48 (54%) 68.7% 16/27 (59%) 75
12/47 (26%) 46.8% 8/20 (40%)81
7/46 (15%) 48.4% 114 (25%)82
Life Table Tests (d) Incidental Tumor Tests (d) Cochran-Armitage Trend Test (d) Fisher Exact Test (d)
P=0.193N P =0.001N P <0.001 N
P=0.050N P =O.OO8N
P =0.004N
P=0.441N P=O.O02N
P <0.001 N
Adrenal G land Pheochromocytoma Overall Rates (a)Adjusted Rates (b) Terminal Rates (c) Week of First Observation
23/50 (46%) 59.7% 13/28 (46%) 75
19/50 (38%) 59.8% 9/20 (45%) 78
10149 (20%) 52.0% 114 (25%) 75
Life Table Tests (d) Incidental Tumor Tests (d) Cochran-Armitage Trend Test (d) Fisher Exact Test (d)
P = 0.277 P =0.023N P = 0.005N
P =0.468 P=0.343N
P =0.272N
P =0.257 P =0.026N
P =0.006N
Adrenal Gland: Malignant Pheochromocytoma Overall Rates (a)Adjusted Rates (b) Terminal Rates(c)Week of First Observation
5/50 (10%) 16.6% 4/28 (14%) 99
1/50 (2%) 4.2% on0 (0%)101
0149 (0%)0.0% 014 (0%)
Life Table Tests (d) Incidental Tumor Tests (d) Cochran-Armitage Trend Test (d) Fisher Exact Test (d)
P=0.105N P=0.026N P=O.OllN
P =0.194N P=0.121N
P=0.103N
P =0.338N P=0.185N
P=0.030N
Adrenal G land Pheochromocytoma o r Malignant Pheochromocytoma Overall Rates (a) Adjusted Rates (b) Terminal Rates (c) Week of First Observation
28/50 (56%) 71.2% 17/28 (61%) 75
20150 (40%) 61.5% 9/20 (45%) 78
10149 (20%) 52.0% 114 (25%) 75
Life Table Tests (d) Incidental Tumor Tests (d) Cochran-Armitage Trend Test (d) Fisher Exact Test (d)
P =0.479 P=0.002N P<O.OOlN
P=0.459N P=0.118N
P = 0.081N
P=0.396 P =0.005N
P< 0.001N
Thyroid Gland: Follicular Cell Carcinoma Overall Rates (a)Adjusted Rates (b) Terminal Rates (c) Week of First Observation
0149 (0%)0.0% 0127 (0%)
5/49 (10%) 22.8% 4/20 (20%) 99
1/49 (2% 1 25.0% 114 (25%) 104
Life Table Tests (d) Incidental Tumor Tests (d) Cochran-Armitage Trend Test (d) Fisher Exact Test (d)
P =0.029 P =0.056 P=0.399
P=0.014 P =0.020
P=0.028
P =0.134 P=0.134
P=0.500
Thyroid Gland: C-cell Adenoma Overall Rates (a) Adjusted Rates (b)Terminal Rates (c) Week of First Observation
3/49 (6%)9.6% 2/27 (7%) 88
2/49 (4%) 7.4% 1/20 (5%) 90
2/49 (4% ) 50.0% 214 (50%) 104
Life Table Tests (d) Incidental Tumor Tests td) Cochran-Armitage Trend Test (d) Fisher Exact Test (d)
P=0.287 P =0.446 P=0.406N
P=0.587N P=0.541N
P =0.500N
P =0.238 P=0.350
P =0.500N
85 Iodinated Glycerol,NTP TR 340
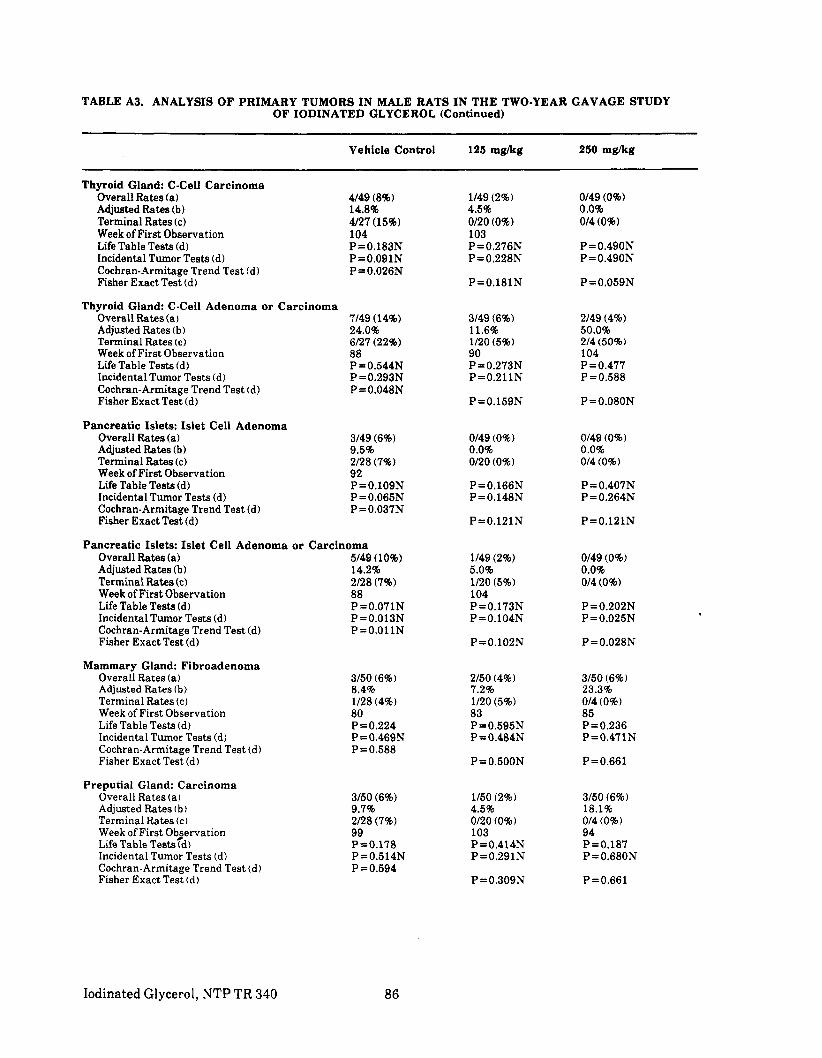
TABLE A3. ANALYSIS OF PRIMARY TUMORS IN MALE RATS IN THE TWO-YEAR GAVAGE STUDY OF IODINATED GLYCEROL (Continued)
Thyroid Gland: C-cell Carcinoma Overall Rates (a) Adjusted Rates (b) Terminal Rates (c) Week of First Observation Life Table Tests (d) Incidental Tumor Tests (d) Cochran-Armitage Trend Test (d) Fisher Exact Test (d)
Thyroid Gland: C-cell Adenoma or Carcinoma Overall Rates (a)Adjusted Rates (b)Terminal Rates (c)Week of First Observation Life Table Tests (d) Incidental Tumor Tests (d) Cochran-Armitage Trend Test (d) Fisher Exact Test (d)
Pancreatic Islets: Islet Cell Adenoma Overall Rates (a) Adjusted Rates (b) Terminal Rates(c)Week of First Observation Life Table Testa (d) Incidental Tumor Tests (d) Cochran-Armitage Trend Test (d) Fisher Exact Test (d)
Vehicle Control
4/49 (8%)14.8% 4/27 (15%) 104 P=0.183N P =0.091N P =0.026N
7/49 (14%) 24.0% 6127 (22%) 88 P =0.544N P =0.293N P=0.048N
3/49 (6%) 9.5% 2/28 (7%) 92 P=0.109N P =0.065N P =0.037N
Pancreatic Islets: Islet Cell Adenoma or Carcinoma Overall Rates (a) Adjusted Rates (b) Terminal Rates(c) Week of First Observation Life Table Tests (d) Incidental Tumor Tests (d) Cochran-Armitage Trend Test (d) Fisher Exact Test (d)
Mammary Gland: Fibroadenoma Overall Rates (a) Adjusted Rates (b) Terminal Rates (c) Week of First Observation Life Table Tests (d) Incidental Tumor Tests (d) Cochran-Armitage Trend Test (d) Fisher Exact Test (d)
Preputial Gland: Carcinoma Overall Rates (a) Adjusted Rates(b1 Terminal Rates (c) Week of First Objervation Life Table Tests (d) Incidental Tumor Tests (d) Cochran-Armitage Trend Test (d) Fisher Exact Test (d)
5/49 (10%) 14.2% 2/28 (7%) 88 P=0.071N P =0.013N P =0.01 LN
3/50 (6%) 8.4% 1/28 (4%) 80 P =0.224 P =0.469N P=0.588
3/50 (6%) 9.7% 2128 (7%) 99 P=0.178 P =0.514N P =0.594
125 mg/kg
1/49 (2%) 4.5% 0/20 (0%) 103 P =0.276N P =0.228N
P=0.18lN
3/49 (6%) 11.6% 1/20 (5%) 90 P=0.273N P=0.211N
P =0.159N
0149 (0%)0.0% 0120 (0%)
P=0.166N P=0.148N
P=0.121N
1/49 (2%) 5.0% 1/20 (5%)104 P=0.173N P =0.104N
P=0.102N
2/50 (4%) 7.2% 1/20 (5%) 83 P =0.595N P=0.484N
P=0.500N
1/50 (2%) 4.5% 0120 (0%) 103 P=0.41 4N P=0.291N
P=0.309N
250 mg/kg
0149 (0%)0 .O% 014 (0%)
P =0.490N P=0.490N
P =0.059N
2/49 (4%) 50.0% 214 (50%) 104 P =0.477 P=0.588
P=0.080N
0149 (0%)0.0% 014 (0%)
P = 0.407N P=0.264N
P=0.121N
0149 (0%)0.0% 014 (0%)
P =0.202N P =0.025N
P =0.028N
3/50 (6%) 23.3% 014 (0%)85 P =0.236 P=0.471N
P =0.661
3/50 (6%) 18.1% 014 (0%)94 P=0.1 87 P=0.680N
P=0.661
Iodinated Glycerol, NTP TR 340 86

TABLE A3. ANALYSIS OF PRIMARY TUMORS IN MALE RATS IN THE TWO-YEAR GAVAGE STUDY OF IODINATED GLYCEROL (Continued)
Vehicle Control 125 mg/kg 250 mgkg
Preputial Gland: Adenoma or Carc Overall Rates(a)Adjusted Rates (b)Terminal Rates (c) Week of First Observation
iinoma 4/50(8%)12.5% 2/28 (7%) 99
2/50(4%)9.3% 1/20(5%)103
3/50 (6%) 18.1% Of4(0%)94
Life Table Tests (d) Incidental Tumor Tests (d) Cochran-Armitage Trend Test (d) Fisher Exact Test (d)
P=0.217 P= 0.363N P=0.417N
P=0.488N P= 0.318N
P=0.339N
P=0.244 P=0.413N
P=0.500N
Testis: Interstitial Cell Tumor Overall Rates (a) Adjusted Rates (b) Terminal Rates (c) Week of First Observation
46/50 (92%) 100.0% 28/28 (100%) 62
49/50 (98%) 100.0% 20120 (100%) 49
48/50 (96%) 100.0% 4/4 (100%) 64
Life Table Tests (d) Incidental Tumor Testa (d) Cochran-Armitage Trend Test (d) Fisher Exact Test (d)
P<O.OOl P=0.026 P=0.238
P=0.027 P=0.026
P=0.181
P<O.OOl P=0.026
P=0.339
All Sites:Benign Tumors Overall Rates (a) Adjusted Rates (b) Terminal Rates (c) Week of First Observation
50/50 (100%) 100.0% 28/28 (100%) 62
49/50 (98%) 100.0% 20120 (100%) 49
48/50 (96%) 100.0% 4/4 (100%) 64
Life Table Tests (d) Incidental Tumor Tests (d) Cochran-Armitage Trend Test (d) Fisher Exact Test (d)
P<0.001 P=0.268N P=0.142N
P=0.086 (e)
P=0.500N
P<0.001 P=0.650N
P=0.248N
All Sites: Malignant Tumors Overall Rates (a) Adjusted Rates (b) Terminal Rates (c) Week of First Observation
29/50 (58%) 67.7% 15/28 (54%) 62
37/50 (74%) 83.0% 13/20 (65%) 49
29/50 (58%) 79.9% 114 (25%) 64
Life Table Tests (d) Incidental Tumor Tests (d) Cochran-Armitage Trend Test (d) Fisher Exact Test (d)
P<0.001 P=0.336N P=0.541
P= 0.021 P=0.081
P=0.069
P<0.001 P=0.409N
P=0.580
All Sites: All Tumors Overall Rates (a) Adjusted Rates (b) Terminal Rates (c) Week of First Observation
50150 (100%) 100.0% 28/28 (100%) 62
49/50 (98%) 100.0% 20120 (100%) 49
49/50 (98%) 100.0% 4/4 (100%) 64
Life Table Tests (d) Incidental Tumor Tests (d) Cochran-Armitage Trend Test (d) Fisher Exact Test (d)
P<0.001 P=0.638N P=0.331N
P=0.086 (e)
P=0.500N
P<O.OOl (e)
P=0.500N
(a)Number oftumor-bearing animals/number of animals examined a t the site (b)Kaplan-Meier estimated tumor incidences at the end of the study after adjusting for intercurrent mortality (c)Observed tumor incidence a t terminal kill (d)Beneath the vehicle control incidence are the P values associated with the trend test. Beneath the dosed group incidence are the P values corresponding to pairwise comparisons between that dosed group and the vehicle controls. The life table analysis regards tumors in animals dying prior t o terminal kill as being (directly or indirectly) the cause of death. The incidental tumor test regards these lesions as nonfatal. The Cochran-Armitage and Fisher exact tests compare directly the overall incidence rates. A negative trend or lower incidence in a dosed group is indicated by (N).(e)No Pvalue is reported because the tumor incidences in vehicle control and dosed groups were 100%in each of the four time intervals duringwhich tumors were observed.
87 Iodinated Glycerol, NTP TR 340
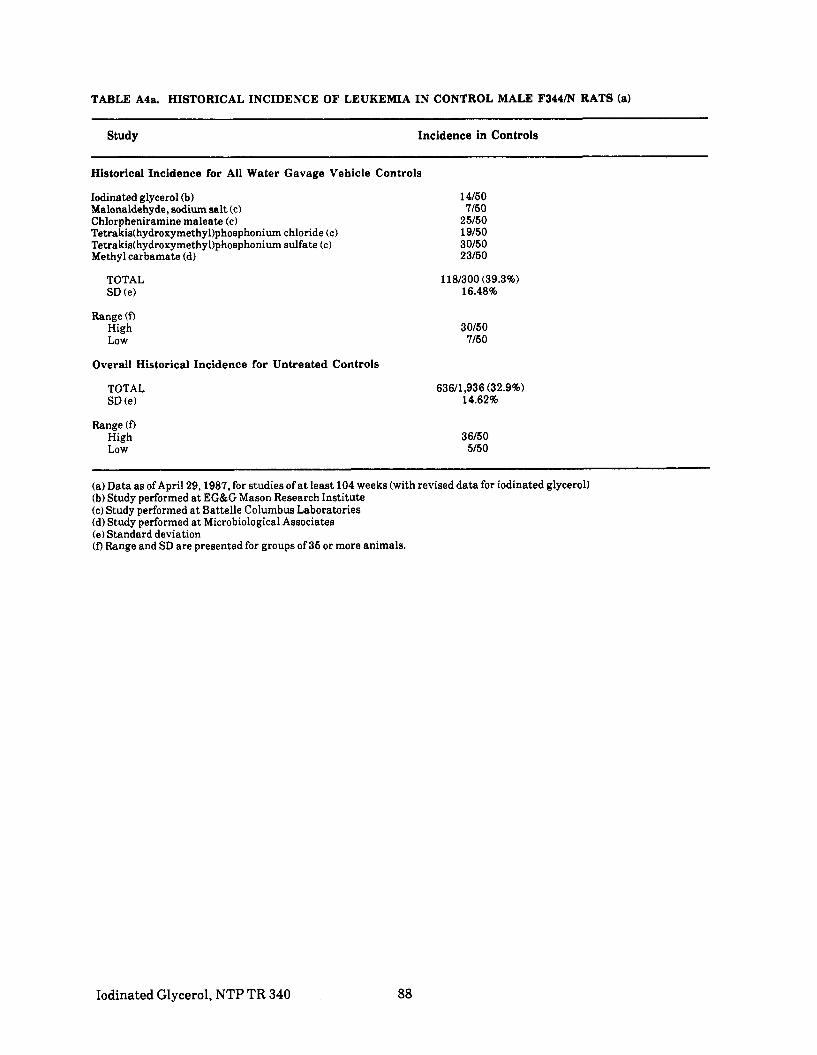
TABLE A4a HISTORICAL INCIDENCE OF LEUKEMIA IN CONTROL MALE F344/N RATS (a)
Study Incidence in Controls
Historical Incidence for All Water Gavage Vehicle Controls
Iodinated glycerol (b) Malonaldehyde, sodium salt (c)Chlorpheniramine maleate (c) Tetrakis(hydroxymethy1)phosphonium chloride (c) Tetrakis(hydroxymethy1)phosphonium sulfate (c) Methyl carbamate (d)
TOTAL SD (e)
Range (0High Low
Overall Historical Incidence for Untreated Controls
TOTAL SD (e)
Range (nHigh Low
14/50 7/50
25/50 19/50 30150 23/50
118/300 (39.3%) 16.48%
30150 7/50
63611,936 (32.9%) 14.62%
36/50 5/50
(a)Data asof April 29,1987, for studies of a t least 104 weeks (with revised data for iodinated glycerol) (b)Study performed a t EG&G Mason Research Institute (c)Study performed a t Battelle Columbus Laboratories (d)Study performed a t Microbiological Associates (e)Standard deviation (0Range and SD are presented for groups of 35 or more animals.
Iodinated Glycerol, NTP TR 340 88
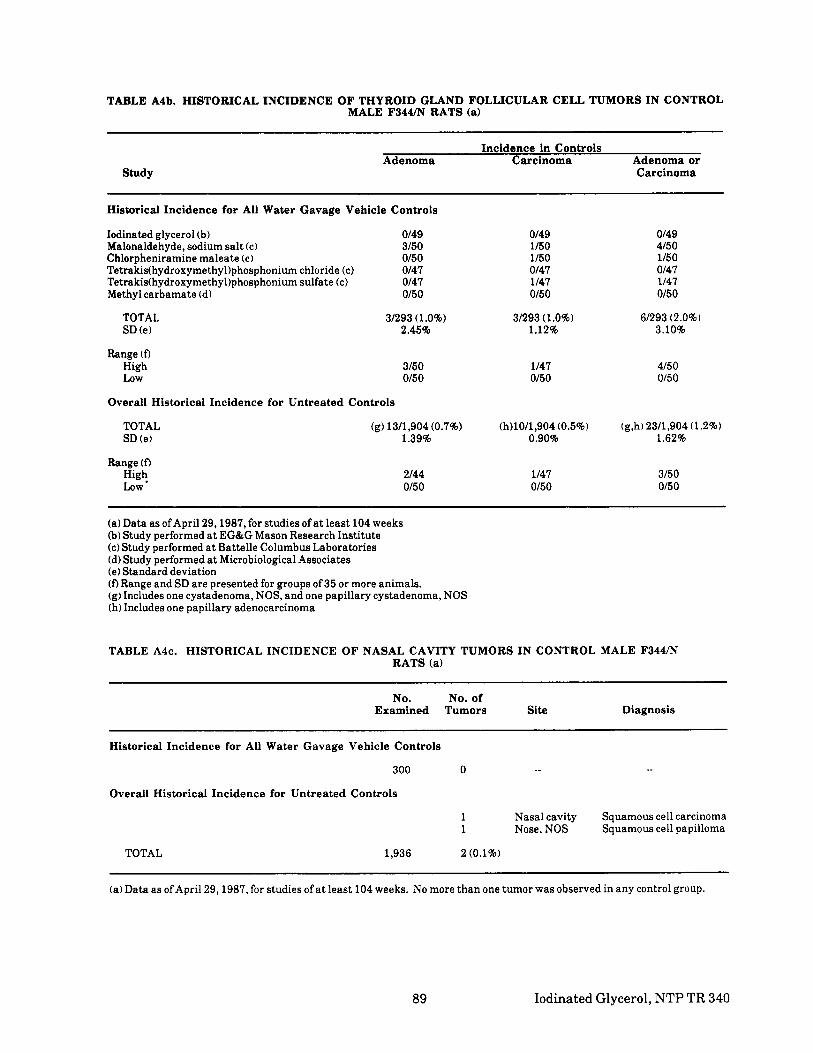
TABLE A4b. HISTORICAL INCIDENCE O F THYROID GLAND FOLLICULAR CELL TUMORS IN CONTROL MALE F344/N RATS (a)
Incidence in Controls Adenoma Carcinoma Adenoma or
Study Carcinoma
Historical Incidence for All Water Gavage Vehicle Controls
Iodinated glycerol (b) 0149 0149 0149 Malonaldehyde, sodium salt (c) 3/50 1150 4/50 Chlorpheniramine maleate (c) 0150 1/50 1150 Tetrakis(hydroxymethy1)phosphoniumchloride (c) 0147 0147 0147 Tetrakis(hydroxymethy1)phosphoniumsulfate (c) 0147 1/47 1/47 Methyl carbamate (d) 0150 0150 0150
TOTAL 31293 (1.0%) 31293 (1.0%) 61293 (2.0%) SD (e) 2.45% 1.12% 3.10%
Range (DHigh 3150 1147 4/50 LOW 0150 0150 0150
Overall Historical Incidence for Untreated Controls
TOTAL (g)1311,904 (0.7%) (h)1011,904 (0.5%) (g,h)2311,904 (1.2%) SD (e) 1.39% 0.90% 1.62%
Range (DHigh 2144 1/47 3150 LOW' 0150 0150 0150
(a)Data as of April 29,1987, for studies of at least 104 weeks (b)Study performed at EG&G Mason Research Institute ( c )Study performed a t Battelle Columbus Laboratories (d)Study performed a t Microbiological Associates (e)Standard deviation (D Range and SD are presented for groups of 35 or more animals. (g) Includes one cystadenoma, NOS, and one papillary cystadenoma, NOS (h)Includes one papillary adenocarcinoma
TABLE A4c. HISTORICAL INCIDENCE OF NASAL CAVITY TUMORS IN CONTROL MALE F344/N RATS (a)
No. No. of Examined Tumors Site Diagnosis
Historical Incidence for All Water Gavage Vehicle Controls
300 0 _ _ Overall Historical Incidence for Untreated Controls
1 1
Nasal cavity Nose, NOS
Squamous cell carcinoma Squamous cell papilloma
TOTAL 1,936 2 (0.1%)
(a)Data as ofApril 29,1987, for studies of a t least 104weeks. No more than one tumor was observed in any control group.
89 Iodinated Glycerol, NTP TR 340

TABLE A4d. HISTORICAL INCIDENCE OF TESTICULAR INTERSTITIAL CELL TUMORS IN CONTROL MALE F344/N RATS (a)
Study Incidence in Controls ~
Historical Incidence for All Water Gavage Vehicle Controls
Iodinated glycerol (b) Malonaldehyde, sodium salt (c) Chlorpheniramine maleate (c) Tetrakis(hydroxymethy1)phosphoniumchloride (c) Tetrakis(hydroxymethy1)phosphonium sulfate (c) Methyl carbamate (d)
46/50 40150 44/4944/5040150 43150
TOTAL SD (e)
2571299 (86.0%) 5.03%
Range (0HighLOW
46/5040150
Overall Historical --icidence -Jr Untreatei Contrc~-
TOTAL SD (e)
1,67711,910 (87.8%) 7.70%
Range (0High LOW
49/5032/50
(a)Data as ofApril 29,1987,for studies of a t least 104weeks (b)Study performed at EG&G Mason Research Institute (c)Study performed at Battelle Columbus Laboratories (d)Study performed a t Microbiological Associates (e)Standard deviation (f) Range and SD are presented for groups of 35or more animals.
Iodinated Glycerol, NTP TR 340 90

TABLE A5. SUMMARY OF THE INCIDENCE OF NONNEOPLASTIC LESIONS IN MALE RATS IN THE TWO-YEAR GAVAGE STUDY OF IODINATED GLYCEROL
Vehicle Control Low Dose High Dose
Animals initially in study Animals necropsied Animals examined histopathologically
50 50 50
50 50 50
50 50 50
INTEGUMENTARY SYSTEM *Skin (50) (50) (50)
Inflammation, chronic 1 (2%)Necrosis, NOS 1 (2%)Acanthosis 1 (2%)
*Subcutaneous tissue (50) (50) (50)Abscess, NOS 1 (2%)
RESPIRATORY SYSTEM #Nasal cavity (48) (47) (49)
Hamartoma 1 (2%)Foreign body, NOS 1 (2%)Inflammation, suppurative 3 (6%) 12 (26%) 12 (24%)Inflammation, chronic 6 (13%) 8 (17%) 2 (4%)Hyperplasia, epithelial 5 (11%) 1 (2%)Metaplasia, squamous 2 (4%) 2 (4%)
#Trachea (49) (50) (50)Inflammation, suppurative 1 (2%)Inflammation, chronic 1 (2%)
#Lung/bronchiole (50) (50) (50)Hyperplasia, focal 1 (2%)
# L u g (50) (50) (50)Cyst, NOS 1 (2%)Congestion, NOS 2 (4%) 1 (2%)Inflammation, interstitial 1 (2%) 2 (4%)Bronchopneumonia, acute 1 (2%)Inflammation, acute (2%) 2 (4%)Inflammation, chronic 1 (2%)Pneumonia, interstitial chronic (2%)Hyperplasia, adenomatous 1 (2%)Hyperplasia, alveolar epithelium 2 (4%) 1 (2%)
HEMATOPOIETIC SYSTEM *Multiple organs (50) (50) (50)
Leukocytosis, NOS 1 (2%)#Spleen (50) (50) (50)
Congestion,NOS 1 (2%)Fibrosis, focal 3 (6%) Hyperplasia, stromal 1 (2%)Hematopoiesis 1 (2%)
#Lymph node (49) (49) (50) Cyst, NOS 1 (2%)
#Mandibular lymph node (49) (49) (50)Cyst, NOS 1 (2%) Hyperplasia, NOS 1 (2%)
#Mediastinal lymph node (49) (49)Plasmacytosis 1 (2%)
#Pancreatic lymph node (49) (49)Hyperplasia, plasma cell 1 (2%)
#Mesenteric lymph node (49) (49)Cyst, NOS 1 (2%)Congestion,NOS 1 (2%) 1 (2%) Hemorrhage 1 (2%)Histiocytosis 1 (2%)
91 Iodinated Glycerol, NTP TR 340

TABLE AS. SUMMARY OF THE INCIDENCE OF NONNEOPLASTIC LESIONS IN MALE RATS IN THE TWO-YEAR GAVAGE STUDY OF IODINATED GLYCEROL (Continued)
Vehicle Control Low Dose High Dose
CIRCULATORY SYSTEM #Mesenteric lymph node
Lymphangiectasis #Heart
Calcification, focal #Headatrium
Thrombosis, NOS #Myocardium
Degeneration, NOS #Endocardium
Inflammation, chronic focal *Aorta
Inflammation, chronic focal Medial calcification
*Pulmonary vein Embolus, fat
#Pancreas Periarteritis
DIGESTIVE SYSTEM #Salivary gland
Hemorrhagic cyst Inflammation, suppurative Inflammation, chronic focal Atrophy, focal Metaplasia, squamous
#Liver Hernia, NOS Congestion, NOS Inflammation, acute focal Inflammation, chronic focal Degeneration, cystic Necrosis, NOS Metamorphosis, fatty Basophilic cyto change Focal cellular change Eosinophilic cyto change Clear cell change Angiectasis
#Liver/periportalCalcification, NOS
#LiverlKupffer cell Hyperplasia, NOS
#Bile duct Hyperplasia, NOS
#Pancreas Inflammation, chronic Hyperplasia, focal
#Pancreatic acinus Atrophy, NOS Hyperplasia, NOS
#Glandular stomach Cyst, NOS Calcification, NOS
#Forestomach Ulcer, NOS Inflammation, acute Calcification, NOS Acanthosis
(48) 1 (2%)
1 (2%)
(50)
4 (8%)9 (18%) 1 (2%)
14 (28%)13 (26%) 1 (2%)
13 (26%) 2 (4%)
(50) 1 (2%)
(50)
(50) 47 (94%)
(49) 7 (14%) 1 (2%)
(49)9 (18%) 1 (2%)
(49)
(49)
(50)
2 (4%) 2 (4%)
10 (20%) 47 (94%)
(50)1 (2%) 1 (2%)
8 (16%) 2 (4%)8 (16%) 6 (1240)
1 (2%) 8 (16%) 8 (16%)
(50)
(50)
(50) 42 (84%)
(49) 1 (2%)
(49)7 (14%) 1 (2%)
(49)
1 (2%) (49)
1 (2%)1 (2%)
(50) 1 (2%)
(49)2 (4%)
(49)
7 (14%) 4 (8%)
30 (61%) 48 (98%)
(50)
1 (2%)
11 (22%)
6 (12%) 9 (18%) 2 (4%) 1 (2%)5 (10%)
11 (22%)(50)
(50) 1 (2%)
(50) 37 (74%)
(49)5 (10%)
(49) 3 (6%)
(50) 1 (281 1 (2%)
(50)2 (4%)
1 (2%)
Iodinated Glycerol, NTP TR 340 92

TABLE A5. SUMMARY OF THE INCIDENCE OF NONNEOPLASTIC LESIONS IN MALE RATS IN THE TWO-YEAR GAVAGE STUDY OF IODINATED GLYCEROL (Continued)
Vehicle Control Low Dose High Dose
DIGESTIVE SYSTEM (Continued) #Ileum
#Colon
#Cecum
Parasitism
Parasitism
Inflammation, chronic Parasitism Necrosis, NOS
(50)
(49)
(49) 12 (24%)
1 (2%)
(49)
(47)
(47)
1 (2%)
10 (21%)
1 (2%)
(50)
(50)
(50) 7 (14%)
1 (2%)
URINARY SYSTEM #Kidney
Cyst, NOS Nephrosis, NOS Calcification, NOS
#Kidney/cortex Cyst, NOS Necrosis, focal
#Kidney/tubule Pigmentation, NOS
#Urinary bladder Inflammation, chronic focal
(50)
(49) 1 (2%)
1 (2%)
(50)
48 (96%) 1 (2%)
1 (2%) 1 (2%)
(50)
(50)
(49)
(50)
49 (98%)
(50)
(50)
(48)
ENDOCRINE SYSTEM #Pituitary
Necrosis, NOS #Anterior pituitary
Cyst, NOS Hypertrophy, focal Hyperplasia, focal Angiectasis
#Adrenal cortex Degeneration, NOS Metamorphosis, fatty Hypertrophy, focal Hyperplasia, focal
Degeneration, NOS Hyperplasia, focal
Inflammation, chronic focal Hyperplasia, cystic Hyperplasia, C-cell Hyperplasia, follicular cell
Hyperplasia, NOS
Hyperplasia, NOS
#Adrenal medulla
#Thyroid
#Parathyroid
#Pancreatic islets
(48)1
(48) (2%)
1 6 1
(50)3
(2%) (13%) (2%)
(6%)
6 (50)
9 (49)
(12%)
(18%)
(8%)4
(19)4
(49) (21%)
(47)
(47)
6 (13%)
(50) 2 1
(4% ) (2%)
(6%)
(2%) (6%)
3 (50)
1 3
(49)
6 8 1
(27) 1
(49) 1
(12%) (16%) (2%)
(4%)
(2%)
(46)
(46) 1 (2%)
5 (11%)
(49) 7 (14%) 3 (6%)1 (2%) 2 (4%)
(49)
8 (16%)
1 (2%) 3 (6%) 9 (18%) 2 (4%)
4 (16%)
1 (2%)
(49)
(25)
(49)
REPRODUCTIVE SYSTEM *Mammary gland
*Prepuce Hyperplasia, NOS
Hyperkeratosis Acanthosis
*Preputial gland Inflammation, suppurative Inflammation, acutekhronic Inflammation, chronic Hyperplasia, NOS
(50)
(50) 4 (8%)
1 (2%)
22 (44%)
(50)
(50)
(50) 7 (14%)
1 (2%) 1 (2%)
6 (12%) 3 (6%)
19 (38%) 2 (4%)
(50)
(50)
(50) 1 (2%)
7 (14%)
16 (32%)
(50)
93 Iodinated Glycerol, NTP TR 340

TABLE AS. SUMMARY OF THE INCIDENCE OF NONNEOPLASTIC LESIONS IN MALE RATS IN THE TWO-YEAR GAVAGE STUDY OF IODINATED GLYCEROL (Continued)
~~
Vehicle Control Low Dose High Dose ~ ~ ~~
REPRODUCTIVE SYSTEM (Continued) #Prostate
Retention of content Inflammation, suppurative Inflammation, chronic Cytoplasmic vacuolization Metaplasia, squamous
Retention of content *Seminal vesicle
(50)1
17 1
(50) 1
(2%) (34%)(2%)
(49)
13 (27%) 4 (8%)
(50)
(47)
12 (26%)
1 (2%)2 (4%)
(50)
Inflammation, chronic 1
Atrophy, NOS Hyperplasia, interstitial cell
Degeneration, NOS Calcification, NOS
Hyperplasia, NOS
Calcification, NOS
#Testis
#Testidtubule
#Rete testis
*Epididymis
(50) 1 7
(50) 4
(50) 1
(50)
(50)
(50)1 (2%) 1 (2%)
(50)
(50)
(50)
(50)
(50)
(50) 1 (2%)
NERVOUS SYSTEM #Lateral ventricle
Hydrocephalus, NOS #Cerebrum
Calcification, focal #Brain
Hemorrhage
SPECIAL SENSE ORGANS *Nasolacrimal duct (50) (50) (50)
Inflammation, suppurative 1 (2%) 3 (6%) Inflammation, chronic 2 (4%) 2 (4%) 1 (2%)
MUSCULOSKELETAL SYSTEM None
BODY CAVITIES *Mesentery (50)
Inflammation, chronic 1 (2%) Necrosis, fat
ALL OTHER SYSTEMS None
SPECIAL MORPHOLOGY SUMMARY None
* Number of animals receiving complete necropsy examination; al1 gross lesions including masses examined microscopically. # Number of animals examined microscopically at this site
Iodinated Glycerol, NTP TR 340 94

APPENDIX B
SUMMARY OF LESIONS IN FEMALE RATS IN
THE TWO-YEAR GAVAGE STUDY OF
IODINATED GLYCEROL
PAGE
TABLE B1 SUMMARY OF THE INCIDENCE OF NEOPLASMS IN FEMALE RATS IN THE TWO-YEAR GAVAGE STUDY OF IODINATED GLYCEROL 97
TABLE B2 INDIVIDUAL ANIMAL TUMOR PATHOLOGY OF FEMALE RATS IN THE TWO-YEAR GAVAGE STUDY OF IODINATED GLYCEROL 100
TABLE B3 ANALYSIS OF PRIMARY TUMORS IN FEMALE RATS IN THE TWO-YEAR GAVAGE STUDY OF IODINATED GLYCEROL 106
TABLE B4 HISTORICAL INCIDENCE OF ANTERIOR PITUITARY GLAND TUMORS IN CONTROL FEMALE F344/N RATS 109
TABLE B5 SUMMARY OF THE INCIDENCE OF NONNEOPLASTIC LESIONS IN FEMALE RATS IN THE TWO-YEAR GAVAGE STUDY OF IODINATED GLYCEROL 110
95 Iodinated Glycerol, NTP TR 340

Iodinated Glycerol, NTP TR 340 96

TABLE B1. SUMMARY OF THE INCIDENCE OF NEOPLASMS IN FEMALE RATS IN THE TWO-YEAR GAVAGE STUDY OF IODINATED GLYCEROL
Animals initially in study Animals necropsied Animals examined histopathologically
INTEGUMENTARY SYSTEM *Skin
Basal cell tumor Keratoacanthoma Fibroma Neurofibrosarcoma
*Subcutaneous tissue Fibroma Neurilemoma, malignant
RESPIRATORY SYSTEM #Lung
Alveolar/bronchiolar adenoma Alveolar/bronchiolar carcinoma C-cell carcinoma, metastatic Pheochromocytoma, metastatic Choriocarcinoma, metastatic
HEMATOPOIETIC SYSTEM *Multiple organs
Leukemia, mononuclear cell #Liver
Leukemia, mononuclear cell
CIRCULATORY SYSTEM #Spleen
Hemangiosarcoma *Mesentery
Hemangiosarcoma, metastatic
DIGESTIVE SYSTEM #Liver
Neoplastic nodule #Esophagus
Squamous cell carcinoma
URINARY SYSTEM None
ENDOCRINE SYSTEM #Anterior pituitary
Carcinoma, NOS Adenoma, NOS
#Adrenal Cortical adenoma
#Adrenal medulla Pheochromocytoma Pheochromocytoma, malignant Ganglioneuroma
Vehicle Control
50 50 49.
(49) 1 (2%)1 (2%) 1 (2%)
(50)15 (30%)
(49)
(49)
(34)
(48)
26 (54%) (49)
(49)1 (2%) 1 (2%)
Low Dose
50 50 50
(33) 1 (3%)
(50)14 (28%)
(50) 4 (8%)
(50)
(11)
(50)3 (6%)
24 (48%) (50)
2 (4%) (50)
6 (12%)
~~ ~
High Dose
50 50 50
(50) 2 (4%)
1 (2%) 1 (2%)
(50)14 (28%)
(50)
(50)1 (2%)
33 (66%)(50)
(50) 4 (8%)1 (2%) 1 (2%)
97 Iodinated Glycerol, NTP TR 340
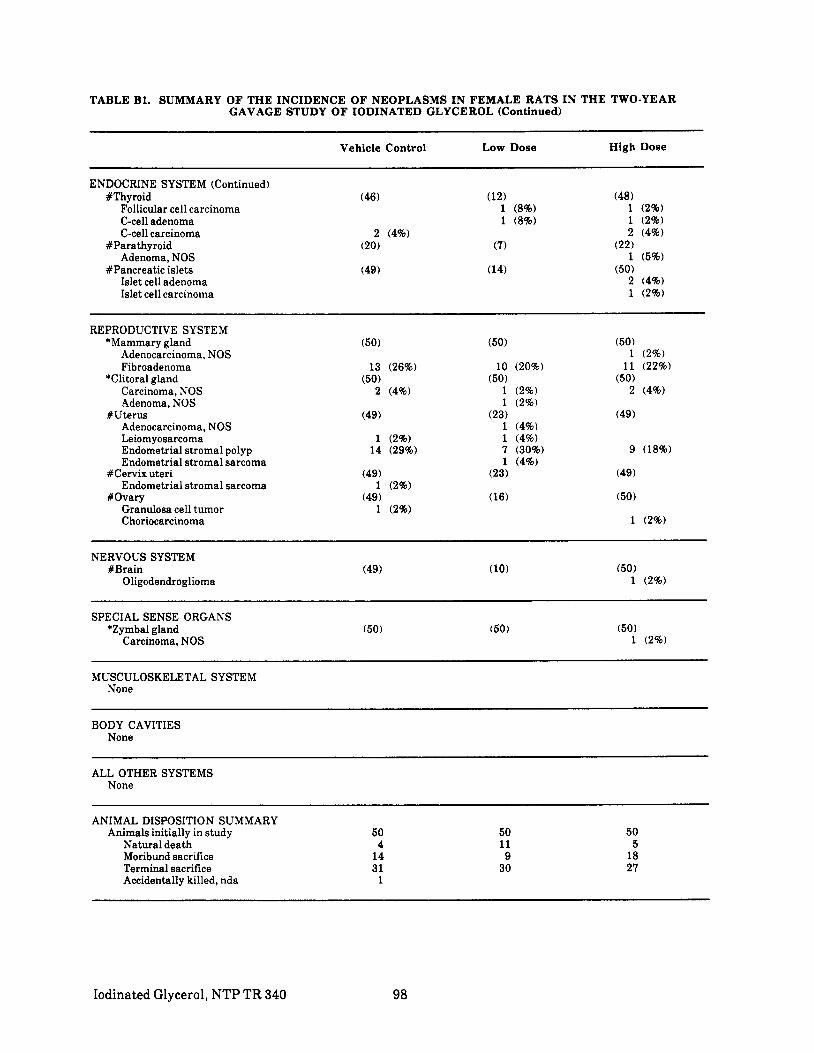
TABLE B l . SUMMARY OF THE INCIDENCE OF NEOPLASMS IN FEMALE RATS IN THE TWO-YEAR GAVAGE STUDY OF IODINATED GLYCEROL (Continued)
ENDOCRINE SYSTEM (Continued) #Thyroid
Follicular cell carcinoma C-cell adenoma C-cell carcinoma
#Parathyroid Adenoma, NOS
#Pancreatic islets Islet cell adenoma Islet cell carcinoma
REPRODUCTIVE SYSTEM *Mammary gland
Adenocarcinoma, NOS Fibroadenoma
*Clitoral gland Carcinoma, NOS Adenoma, NOS
#Uterus Adenocarcinoma, NOS LeiomyosarcomaEndometrial stromal polyp Endometrial stromal sarcoma
#Cervix uteri Endometrial stromal sarcoma
#OvaryGranulosa cell tumor Choriocarcinoma
NERVOUS SYSTEM #Brain
Oligodendroglioma
SPECIAL SENSE ORGANS *Zymbal gland
Carcinoma, NOS
MUSCULOSKELETAL SYSTEM None
BODY CAVITIES None
ALL OTHER SYSTEMS None
ANIMAL DISPOSITION SUMMARY Animals initially in study
Natural death Moribund sacrifice Terminal sacrifice Accidentally killed, nda
Vehicle Control Low Dose High Dose
(46) (12) (48) 1 (8%) 1 (2%) 1 (8%) 1 (2%)
2 (4%) 2 (4%) (20) (7) (22)
1 (5%) (49) (14) (50)
2 (4%)1 (2%)
(50) (50) (50)1 (2%)
13 (26%) 10 (20%) 11 (22%) (50) (50) (50)
2 (4%) 1 (2%) 2 (4%) 1 (2%)
(23) (49)1 (4%) 1 (4%)7 (30%) 9 (18%) 1 (4%)
(23) (49)
(16) (50)
1 (2%)
(49) (10) (50) 1 (2%)
(50) (50) (50)1 (2%)
50 50 50 4 11 5
14 9 18 31 30 27
1
Iodinated Glycerol, NTP TR 340 98

TABLE B1. SUMMARY OF THE INCIDENCE OF NEOPLASMS IN FEMALE RATS IN THE TWO-YEAR GAVAGE STUDY OF IODINATED GLYCEROL (Continued)
Vehicle Control
TUMOR SUMMARY Total animals with primary tumors** 44
Total primary tumors 82 Total animals with benign tumors 36
Total benign tumors 57 Total animals with malignant tumors 23
Total malignant tumors 24 Total animals with secondary tumors## 2
Total secondary tumors 2 Total animals with tumors-
uncertain benign or malignant 1 Total uncertain tumors 1
Low Dose High Dose
46 47 81 95 40 40 54 65 21 26 27 29
2 2
1 1
* Number of animals receiving complete necropsy examination; all gross lesions including masses examined microscopically. ** Primary tumors: all tumors except secondary tumors # Number of animals examined microscopically a t this site # # Secondary tumors: metastatic tumors or tumors invasive into an adjacent organ
99 Iodinated Glycerol, NTP TR 340

TABLE B2. INDIVIDUAL ANIMAL TUMOR PATHOLOGY OF FEMALE RATS IN THE TWO-YEAR GAVAGE STUDY OF IODINATED GLYCEROL: VEHICLE CONTROL
ANIMAL 0 0 0 0 0 0 0 0 0 0 0 0 0 0 0 0 0 0 0 0 0 0 0 0 0 NUMBER 0 1 2 2 3 2 4 2 0 0 1 3 4 2 3 1 1 3 2 0 0 0 0 0 0
7 8 0 6 7 4 9 8 2 1 1 9 8 7 2 2 5 0 5 3 4 5 6 8 9
b 0 0 0 0 0 0 0 0 0 0 0 0 0 0 0 0 0 1 1 l l l l l 6 7 7 7 7 7 8 8 8 8 9 9 9 9 9 9 9 9 0 0 0 0 0 0 0 2 1 2 3 5 8 3 8 7 8 4 5 5 6 6 9 9 9 0 4 4 4 4 4 4
Skin N + + + + + + + + + N + N + + + + + + + + + + + + Karatoacanthoma
Subcutaneous tissue N + + + + + + + + + N + N t + + + + + t + + + + + Fibroma X
Lungs and bronchi . . . . . . . . . . . . . . . . . . . . . . . . . Alveokrhronchio~aradenoma Alveolarhronchiolar carcinoma C-cell carcinoma, metastatic
Trachea . . . . . . . . . . . . . . . . . . . . . . . . . Nasal cavity A + + + + + + + + + + + - + + + + + - + + + t + -
Bone m a m w A + + + + + + + + + + + + + + + + + + + t + t + + Spleen A + + + + + + + + + + + - + + + + + + + + + + + +
Hemangiosarcoma X L mphnodes A + + + + + + + + + + + + + + + + + + + + + + + + Tgymus A + + + - + + + + + - - - + + + + + + + + + + - +
Heart A + + + + + + + + + + + + + + + + + + + + + + + +
Salivary gland A + + + + + + + + + + + + + + + + + + + r C + + + Liver A t + + + + + + + + + + t + + + + + + + + + + + + Bile duct . . . . . . . . . . . . . . . . . . . . . . . . . Pancreas A + + + + + + + + + + + + + + + + + + + + + + + +
A + + - + + + - + + + - + - + - + t i + + + - - + :t%:r A + + + + + + + + + + t + + + + t + + + + + + + + Small intestine A + + + + + + + + + + + t + + + + + + + + + + + t Large intestine . . . . . . . . . . . . . . . . . . . . . . . . .
Kidney . . . . . . . . . . . . . . . . . . . . . . . . . Urinary bladder A + + + + + + + + + + - t - + + + + + + + + t t +
Pituitary . . . . . . . . . . . . . . . . . . . . . . . . . Adenoma. NOS X x x x x x x x X
Adrenal . . . . . . . . . . . . . . . . . . . . . . . . . PheochromocytomaPheochromocytoma, malignant YA
Thyroid . . . . . . . . . . . . . . . . . . . . . . . . . C-cell carcinoma X
Parathyroid A + - - + + + + + - - - + + - - - + + - - + - + + ~
Mammary gland N + N N N + + N + + N + + + t + + + + + + + N + N Fibroadenoma x x x x x x
PreputiaYclitoral gland N N N N N N N N N N N N N N N N N N N N N N N N N Camnoma, NOS
Ilterua-... _. A + + + + + + + + + + + + + + + + + + + + + + + + LeiomyosarcomaEndometrial stromal polyp X x x x x x x x Endometrial stromal sarcoma X
. . . . . . . . . . . . . . . . . . . . . . . . . X
Brain . . . . . . . . . . . . . . . . . . . . . . . . .
ES Mesentery N N N N N N N N N N N N N N N N N N N N N N N N N
Hemangiosarcoma, metastatic X
Multi leorgans NOS N N N N N N N N N N N N N N N N N N N N N N N N N Leutlemia. mohonuclear cell x x X X X x x x x
+: Tissue examined microscopically ' No tissue information submitted -: Reauired tissue not examined microscooicallv Ci Necropsy, no histology due to protocol - . X: Tumor inndence A: Autolvsis N Necropsy no autolysis, no microscopic examination M Animal missing S: Animal missexed B No necropsy performed
.-
Iodinated Glycerol, NTP TR 340 100

TABLE B2. INDIVIDUAL ANIMAL TUMOR PATHOLOGY OF FEMALE RATS VEHICLE CONTROL
ANIMAL NUMBER
WEEKS ONSTUDY
Skill Keratoacanthoma
SUbCUhllEOUS t1SSUE Fibroma
Lungs and bronchi Alveolarlbronchiolar adenoma Alveolarlbronchiolar carcinoma C-cell carcinoma, metastatic
Trachea Nasal cavlty
Bone marrow Spleen
HemanposarcomaL mphnodes Tgymus
Heart
Salivary gland Liver Bile duct Pancreas
E%:,,Small intestine Large intestine
KidneyUrinary bladder
PituitaryAdenoma. NOS
Adrenal PheochromocytomaPheochromocytoma, malignant
Th roid K e l l carcinoma
Parathyroid
EM Mammarv d a n d
U t e m LeiomyosarcomaEndometnal stromal polyp Endometnal stromal sarcoma
?Zulonulope cell tumor
M Brain
S Mesentery
Hemangiosarcoma. metastatic
Multi le organs NOS Ledemia . mohonuclear cell
* Animals necropsied
(Continued) 3 0 0 0 0 0 0 0 0 0 0 0 0 0 0 0 0 0 0 0 0 0 0 0 0 1 1 1 1 1 2 2 2 2 3 3 3 3 4 4 . 4 4 4 4 4 1 3 3 4 5 3 3 4 7 9 1 2 3 9 1 3 4 5 0 1 2 3 4 5 7 6 6 8 6 0
fOTAL: 1 1 1 1 1 1 1 1 1 1 1 1 1 1 1 1 1 1 1 1 l l l l l ISSUES 0 0 0 0 0 0 0 0 0 0 0 0 0 0 0 0 0 0 0 0 0 0 0 0 0 'UMORS 4 4 4 4 4 4 4 4 4 4 4 4 4 4 4 4 4 4 4 4 5 5 5 5 5
'50 1
*50 1
-. . . . . . . . . . . . . . . . . . . . . . . . . 49
X 1 X 1
X 1 . . . . . . . . . . . . . . . . . . . . . . . . . 48 . . . . . . . . . . . . . . . . . . . . . . . . . 46
. . . . . . . . . . . . . . . . . . . . . . . . . 49
. . . . . . . . . . . . . . . . . . . . . . . . . 48 1
. . . . . . . . . . . . . . . . . . . . . . . . . 49- + + - - + + + + - + + + - + + - + + + - + - + + 36 -
. . . . . . . . . . . . . . . . . . . . . . . . . 49
. . . . . . . . . . . . . . . . . . . . . . . . . 49 . . . . . . . . . . . . . . . . . . . . . . . . . 49 . . . . . . . . . . . . . . . . . . . . . . . . . 49 . . . . . . . . . . . . . . . . . . . . . . . . . 49+ + + + + - + + + + - + - - - - - + + + + + - + + 34
. . . . . . . . . . . . . . . . . . . . . . . . . 49 . . . . . . . . . . . . . . . . . . . . . . . . . 49 . . . . . . . . . . . . . . . . . . . . . . . . . 47
. . . . . . . . . . . . . . . . . . . . . . . . . 49 . . . . . . . . . . . . . . . . . . . . . . . . . 46
. . . . . . . . . . . . . . . . . . . . . . . . . 48 x x x x x x x x x x x x x x x x x 26 . . . . . . . . . . . . . . . . . . . . . . . . . 49 X 1
1 . . . . . . . . . . . . . . . . . . . . . . . . . 46 x 2
20
N N + + + + + + + + + + + N + + N N N + N + + + Nx *50x x x x x X 13
N N N N N N N N N N N N N N N N N N N N N N N N N $50 Y X 2
. . . . . . . . . . . . . . . . . . . . . . . . . 49 X 1
x x X X x x 14 1
. . . . . . . . . . . . . . . . . . . . . . . . . 49 1
-. . . . . . . . . . . . . . . . . . . . . . . . .
-49
N N N N N N N N N N N N N N N N N N N N N N N N N '50 1
N N N N N N N N N N N N N N N N N N N N N N ~ N N *50 x x X x x x 15
101 Iodinated Glycerol, NTP TR 340
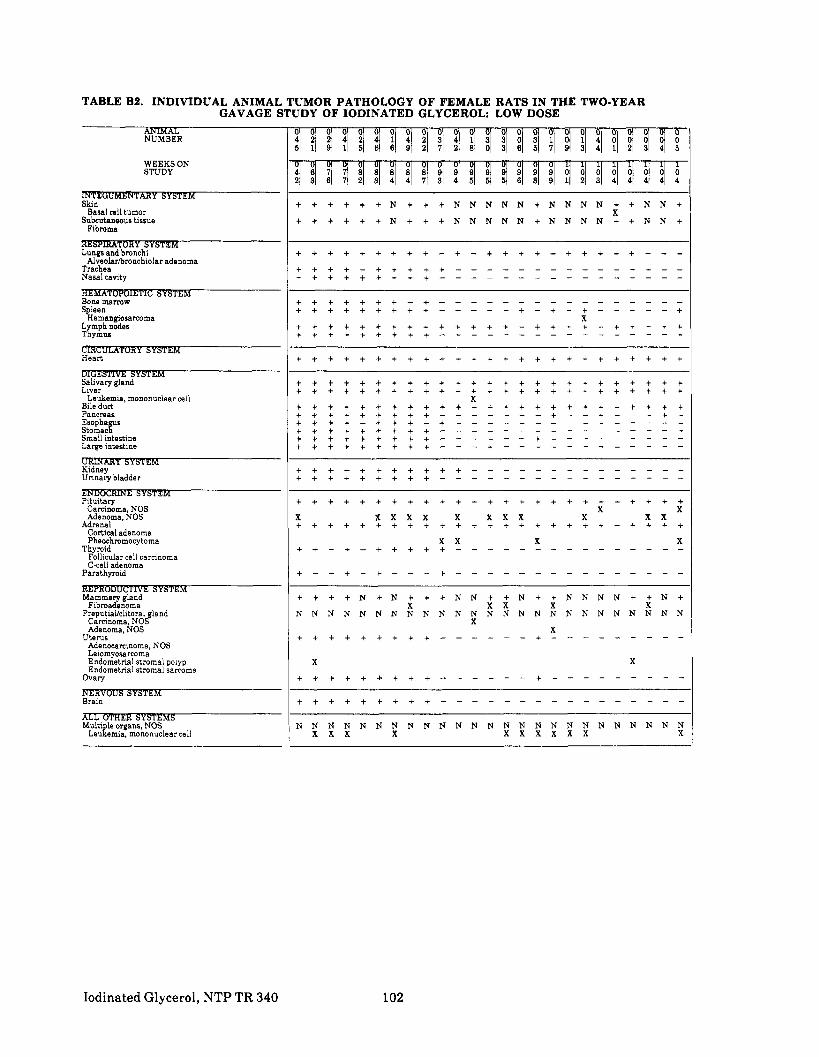
TABLE B2. INDIVIDUAL ANIMAL TUMOR PATHOLOGY OF FEMALE RATS IN THE TWO-YEAR
ANIMAL NUMBER
S h n Basal cell tumor
Subcutaneoustissue Fibroma
Lungs and bronchi Alveolar/bronchiolar adenoma
Trachea Nasal canty
Bone marrow Spleen
Hemang~osamomaL mphnodes Ttymus
Heart
Salivary gland Liver
Leukemia, mononuclear cell Bile duct Pancreas
E;::%Small intestine Large intestine
KidneyUnnary bladder
Adrenal '
Cortical adenoma Pheochromocytoma
ThyroidFollicular cell carclnoma C-cell adenoma
Parathyroid
Mammary gland Fibroadenoma
PreputlaVclitoral gland Carcinoma, NOS Adenoma, NOS
Uterus Adenocarnnoma, NOS LeiomyosarcomaEndornetnal stromal polyp Endometnal stromal sarcoma
b a r l
Brain
Multi le organs, NOS Leugemla, mononuclear cell
GAVAGE STUDY OF IODINATED GLYCEROL: LOW DOSE 0 0 0 0 0 0 0 0 0 0 0 0 0 0 0 0 0 0 0 0 0 0 0 0 0 4 2 2 4 2 4 1 4 2 3 4 1 3 3 0 3 1 0 1 4 0 0 0 0 0 5 1 9 1 5 6 6 9 2 7 2 8 0 3 6 5 7 9 3 4 1 2 3 4 5
D O o O o O o O o O o o O o O o O l l l l l l l l 4 6 7 7 8 8 8 8 8 9 9 9 9 9 9 9 9 0 0 0 0 0 0 0 0 2 3 6 7 2 3 4 4 7 3 4 5 5 5 6 8 9 1 2 3 4 4 4 4 4
+ + + + + + N + + + N N N N N + N N N N + + N N + X
+ + + + + + N + + + N N N N N + N N N N + + N N +
+ + + + + + + + + - + - + + + + - + + + + + - - -+ + + + - + + + + + - - - - - - - - - - - - - - -- + + + + + + + + - - - - - - - - - - - - - - - -
+ + + + + + + - + - - - - - - - - - - - - - - - -+ + + + + + + + + - - - - - + - + + + - - - - - +
X . . . . . . . . . . . . . . . . . . . . . . . . . + * + + + + + + + - - - - - - - - - - - - - - - -
. . . . . . . . . . . . . . . . . . . . . . . . .
. . . . . . . . . . . . . . . . . . . . . . . . . X X
X x x x x x x x x X x x . . . . . . . . . . . . . . . . . . . . . . . . . x x X X
+ + + + - + + + + + - - - - - - - - - - - - - - -
+ - - + - + - - - + - - - - - - - - - - - - - - -
+ + + + N + N + + + N N + + N + + N N N N + + N + X x x X X
N N N N N N N N N N N N N N N N N N N N N N N N N X
X + + + + + + + + + - - - - - - + - - - - - + - - -
X X
+ + + + + + + + + - - - - - - - - - - - - - - - -
N N N N N N N N N N N N N N N N N N N N N N N N N x x x X x x x x x x X
Iodinated Glycerol, NTP TR 340 102

TABLE 82. INDIVIDUAL ANIMAL TUMOR PATHOLOGY OF FEMALE RATS LOW DOSE
ANIMAL NUMBER
WEEKS ON STUDY
skin Basal cell tumor
Subcutaneous tissue Fibroma
Lungs and bmnchi Alveolar/bronchiolar adenoma
Trachea Nasal cavity
Bone marrow Spleen
HemangiosarcomaL mphnodesTgymus
Heart
Salivary gland Liver
Leukemia. mononuclear cell Bile duct
KidneyUrinary bladder
Rtui taryCamnoma, NOS Adenoma, NOS
Adrenal Cortical adenoma Pheochmmocytoma
ThyroidFollicular call carcinoma C-cell adenoma
Parathyroid
Mammary gland Fibroadenoma
PreputiaUclitoral gland Carcinoma, NOS Adenoma, NOS
UteNS Adenocarnnoma, NOS LeiomyosarcomaEndornetnal stromal polyp Endometnal stromal sarcoma
Ovary
Brain
S Multi leorgans NOS
LeuRemia, mohonuc~ear cell
* Animals necropsied
(Continued) 1 0 0 0 0 0 0 0 0 0 0 0 0 0 0 0 0 0 0 0 0 0 0 0 0
1 1 1 1 1 1 2 2 2 2 2 2 3 3 3 3 3 3 4 4 4 4 5 ' : d l 2 4 5 9 0 3 4 6 7 8 1 2 4 B I 8 1 4 0 / 3 I 7 ! 8 1 0
1 1 1 1 1 1 1 1 1 1 1 1 1 1 1 1 1 1 1 1 1 1 1 1 1 0 0 0 0 0 0 0 0 0 0 0 0 0 0 0 0 0 0 0 0 0 0 0 0 L 4 4 4 4 4 4 4 4 4 4 4 4 4 4 4 4 4 4 4 4 4 4 4 4
V N + N N N N N N N N N N N N N t + + N N N N N N *50 1
V N + N N N N N N N N N N N N N + + + N N N N N N *50 X 1
33 1
11 9
9 21 1
46 10
50
50 50
4 50 14 11 10 13 12
19 10
. . . . . . . . . . . . . . . . . . . . . . . . . 50 X 3 x x x x x x x x x x x x 24 . . . . . . . . . . . . . . . . . . . . . . . . . 50
X X 2 X X 6- - - - - - - - - - - - - - - - + - - + - - - + - 12
X 1 X 1
- - - - - - - - - - - - - - - - + - - + - - - + - I
Y + + N N + + N N + N + N N N + + N + N N N N N N *50 x x x x X 10 V N N N N N N N N N N N N N N N N N N N N N N N N '50
1 1
+ - - - + + - - - + + + - + - - + - + - + - + + - 23 Y 1
1 7 1
16
10
N N N N N N N N N N N N N N N N N N N N N N N N N '50 x x X 14
103 Iodinated Glycerol, NTP TR 340

TABLE B2. INDIVIDUAL ANIMAL TUMOR PATHOLOGY OF FEMALE RATS IN THE TWO-YEAR
NUMBER
WEEKS ON STUDY
S h n Fibroma Neurofibmsarcoma
Subcutaneous tissue Neunlemoma. malignant
Lungs and bronchi Alveolarbronchiolar adenoma Pheochromocytoma metastatic Chonocarnnoma. &astatic
Trachea Nasal can ty
Bone marrow SpleenL mphnodesTKymus
EM Heart
Salivary glandLiver
Neoplastic nodule Bile duct Pancreas Esophagus
Squamous cell camnoma Stomach Small intestine Large intestine
KidneyUnnary bladder
PituitaryCarcinoma, NOS Adenoma, NOS
Adrenal PheochromocytomaPheochromocytoma, malignantGanglioneuroma
ThyroidFollicular cell carmnoma C-cell adenoma C cell carcinoma
ParathyroidAdenoma, NOS
Pancreatic islets Islet cell adenoma Islet cell carcinoma
Mammary glandAdenocarcinoma NOS..._.._.........-.-..............-,...-,.. ----FibroadenomaFibroadenoma
PreputiaUcIitoralPreputiaUcIitoral glandglandCarcinoma.Carcinoma. NOSNOS
UterusUterus EndometrialEndometrial stromalstromal polyppolyp
OvaryOvaryChoriocarcinomaChoriocarcinoma
Brain Oligodendroglioma
ORGANS Zymbal gland
Carcinoma, NOS
ALL OT-Multi leorgans NOS
LeuEemia, mohonuciear cell
GAVAGE STUDY OF IODINATED GLYCEROL HIGH DOSE 0 0 0 0 0 0 0 0 0 0 0 0 0 0 0 0 0 0 0 0 0 0 0 0 0 3 5 4 2 0 2 0 0 1 2 3 1 3 4 2 2 4 0 1 2 3 4 1 0 0 1 0 0 5 2 0 4 3 9 7 6 4 7 1 6 3 9 6 2 9 3 8 1 1 5
0 0 0 0 0 0 0 0 0 0 0 0 0 0 0 0 0 1 1 1 1 1 1 1 1 7 7 8 8 8 8 9 9 9 9 9 9 9 9 9 9 9 0 0 0 0 0 0 0 0 1 7 1 7 6 8 0 1 1 1 1 4 4 6 7 9 9 0 2 2 2 2 3 ~ 5
N + + + + t + + + + + + + + + + + + + + + + + t tX
X N + + t t + + + + + + + t + + + + + t t + + + t t
X ~
+ + + + + + + + t + + + + + + + + + + + t t + + +
X X . . . . . . . . . . . . . . . . . . . . . . . . . . . . . . . . . . . . . . . . . . . . . . . . . .
. . . . . . . . . . . . . . . . . . . . . . . . .
. . . . . . . . . . . . . . . . . . . . . . . . .
. . . . . . . . . . . . . . . . . . . . . . . . . . . . . . . . . . . . . . . . . . . . . . . . . .
/ + t + + + + + + + + + + + + + + + + + + + t t + + l
. . . . . . . . . . . . . . . . . . . . . . . . . + + + + t + + + + + + + + + + + + + + + + t + + t
. . . . . . . . . . . . . . . . . . . . . . . . .
. . . . . . . . . . . . . . . . . . . . . . . . . + + + + + + + + + - + + + + + t + - - + + t + + +
X . . . . . . . . . . . . . . . . . . . . . . . . . . . . . . . . . . . . . . . . . . . . . . . . . . . . . . . . . . . . . . . . . . . . . . . . . . .
. . . . . . . . . . . . . . . . . . . . . . . . . . . . . . . . . . . . . . . . . . . . . . . . . .
h x x x X x x x x x x x x x x . . . . . . . . . . . . . . . . . . . . . . . . .
X X X
Y
. . . . . . . . . . . . . . . . . . . . . . . . .
X X
- + - - + + - - - - - + t i - + + - - - - - + + +
+ + + + + + + + + + + + + + + + + + + + + t + t tX
N N + + + + N N t N + + + + + + N N N + N t t N +
X x x x N N N N N ~ U N N N N N N
Y + + + + + + + + + + + + + +
X X X . .
X . . . . . . . . . . . .
. . . . . . . . . . . . . .
X N N N N N N N N N N N N
x - + + + + + + t + + +
X X . . . . . . . . . . .
. . . . . . . . . . .
N N N N N N N N N N N N N N N N N N N t N N N N N
N N N N N N N N N N N N N N N N N N N N N N N N N x x x x x x x
Iodinated Glycerol, NTP TR 340 104

TABLE B2. INDIVIDUAL ANIMAL TUMOR PATHOLOGY OF FEMALE RATS: HIGH DOSE
NUMBER
WEEKS ON STUDY
Skin Fibroma Neurofibrosarcoma
Subcutaneous tissue Neurilemoma. malignant
Lungs and bronchi Alveolarfbronchiolar adenoma Pheochromocytoma, metastatic Choriocarcinoma, metastatic
Trachea Nasal cavlty
Bone rnarmw SpleenL mphnodesTKymus
Heart
Salivary gland Liver
Neoplastic nodule Bile duct Pancreas Esophagus
Squamous cell carcinoma Stomach Small intastine Large intestine
KidneyUrinary bladder
PituitaryCarcinoma NOS Adenoma, NOS
Adrenal PheochromocytomaPheochromocytoma, malignant Ganglioneuroma
ThyroidFollicular cell carcinoma C-cell adenoma C-cell carcinoma
Parathy mid Adenoma. NOS
Pancreatic islets Islet cell adenoma Islet cell carcinoma
M Mammary gland
Adenocarcinoma, NOS Fibroadenoma
PreputiaUclitoral gland Carcinoma, NOS
Uterus Endometrial stromal polyp
%Yriocarcinoma
Brain Oligodendroglioma
A N S Zymbal gland
Carcinoma, NOS
Multi leorgans NOS ~ e u l e m i a ,mohonuclear cell
*Animals necropsied
(Continued) 0 0 0 0 0 0 0 0 0 0 0 0 0 0 0 0 0 0 0 0 0 0 0 0 0 0 0 0 1 1 1 1 1 1 2 2 2 2 3 3 3 3 3 3 4 4 4 4 4 4 I 8 9 0 3 5 6 7 8 1 2 4 8 0 2 4 5 8 9 2 3 4 5 6 1
TOTAL: 1 1 1 1 1 1 1 1 1 1 1 1 1 1 1 1 1 1 1 1 1 1 1 1 1 TISSUES 0 0 0 0 0 0 0 0 0 0 0 0 0 0 0 0 0 0 0 0 0 0 0 0 0 TUMORS 5 5 5 5 5 5 5 5 5 5 5 5 5 5 5 5 5 5 5 5 5 5 5 5 5
+ + + + + + + + + + + + + + N + + + + + + + + + + '50 1 1
. . . . . . . . . . . . . . . . . . . . . . . . . '50 1
. . . . . . . . . . . . . . . . . . . . . . . . . 50X X 2
1 1
. . . . . . . . . . . . . . . . . . . . . . . . . 50 - + t t + + + + + + + + + + + + + + + + + + + + + 47
. . . . . . . . . . . . . . . . . . . . . . . . . 50
. . . . . . . . . . . . . . . . . . . . . . . . . + + + + + + + + + + + + + + + + + + + + + + + ++ + + + - + + + - + + + - - + + + + + - + - + - E: i 37 I
. . . . . . . . . . . . . . . . . . . . . . . . . 50 ! + + + + + + + + + + + + + + + + + + + + + t + t + M j
. . . . . . . . . . . . . . . . . . . . . . . . . 50 X 1
+ + + + + + + + ' + + + + + + + + + + + + + + + + + 50 . . . . . . . . . . . . . . . . . . . . . . . . . 50 . . . . . . . . . . . . . . . . . . . . . . . . . 44
. . . . . . . . . . . . . . . . . . . . . . . . . 49
. . . . . . . . . . . . . . . . . . . . . . . . . 50
. . . . . . . . . . . . . . . . . . . . . . . . . 50 '
. . . . . . . . . . . . . . . . . . . . . . . . . 50
. . . . . . . . . . . . . . . . . . . . . . . . . 49
. . . . . . . . . . . . . . . . . . . . . . . . . 50 1 x x x x x x x x x x x x x x x x x x x 33 . . . . . . . . . . . . . . . . . . . . . . . . . 50
X X 4 1
. . . . . . . . . .
X
. . . . . . .X . . . . . . . .
1 48 1 1 2 22- - + + - - - + + + + + + - - - + - - + + - - - -
X 1 + + + + + t + + + + + + + + + + + t + + + t + + + 50
2 X 1
N N + + N + + + + + N N + N + + + + N + + + N + + '50 X 1
X X X X x x I1 N N N N N N N N N N N N N N N N N N N N N N N N N '50
2 + + + + + + + + + + + + + + + + t t + + + + + + + 49 x x x x 9 . . . . . . . . . . . . . . . . . . . . . . . + + 50
1
. . . . . . . . . . . . . . . . . . . . . . . . . 50 X 1
N N + N N N N N N N N N N N N N N N N N N N N N N '50 X
N N N N N N N N N N N N N N N N N N N N N N N N N '50 x x x X x x
105 Iodinated Glycerol, NTP TR 340

TABLE B3. ANALYSIS O F PRIMARY TUMORS IN FEMALE RATS IN THE TWO-YEAR GAVAGE STUDY O F IODINATED GLYCEROL
Vehicle Control 62 mg/kg 125 mg/kg
Hematopoietic System: Mononuclear Cell Leukemia Overall Rates (a)Adjusted Rates (d) Terminal Rates (e) Week of First Observation Life Table Test (DIncidental Tumor Test (0 Fisher Exact Test (0
Anterior Pituitary Gland: Adenoma Overall Rates (a) Adjusted Rates (d) Terminal Rates (e) Week of First Observation Life Table Tests (f) Incidental Tumor Tests (DCochran-Armitage Trend Test (f) Fisher Exact Test (0
Anterior Pituitary Gland: Carcinoma Overall Rates (a) Adjusted Rates (d) Terminal Rates (e) Week of First Observation Life Table Tests (D Incidental Tumor Tests (DCochran-Armitage Trend Test (0Fisher Exact Test (0
15/50 (30%) (b,c) 18/50 (36%) 14/50 (28%) 38.0% 36.5% 8/31 (26%) 6/27 (22%) 71 71
P=0.560N P=0.481N P=0.500N
26/48 (54%) 24/50 (48%) 33/50 (66%) 70.0% 58.5% 81.9% 20131 (65%) 14/30 (47%) 20127 (74%) 83 42 87 P =0.064 P =0.466N P =0.064 P =0.158 P=0.266N P =0.141 P=0.136
P=0.342N P=0.161
0148 (0%) 3/50 (6%) 1/50 (2%) 0.0% 9.7% 3.7% 0131 (0%) 2/30 (7%) 1/27 (4%)
103 104 P =0.342 P=O.119 P =0.472 P=0.372 P=0.130 P =0.472 P=0.395
P =0.129 P=0.510
Anterior Pituitary Gland: Adenoma or Carcinoma Overall Rates (a) Adjusted Rates (d) Terminal Rates (e) Week of First Observation Life Table Tests (DIncidental Tumor Tests (DCochran-Armitage Trend Test (f) Fisher Exact Test (0
Adrenal Gland: Pheochromocytoma Overall Rates (a) Adjusted Rates (d) Terminal Rates (e) Week of First Observation Life Table Tests (0 Incidental Tumor Tests (0Cochran-Armitage Trend Test (0 Fisher Exact Test (0
Adrenal Gland: Pheochromocytoma or Malignant Pheochromocytoma Overall Rates (a) Adjusted Rates (d) Terminal Rates (e) Week of First Observation Life Table Tests (0Incidental Tumor Tests (DCochran-Armitage Trend Test (0Fisher Exact Test (0
26/48 (54%) 27/50 (54%) 34/50 (68%) 70.0% 64.9% 84.5% 20131 (65%) 16/30 (53%) 21/27 (78%) 83 42 87 P =0.043 P =0.461 P =0.042 P=O.108 P =0.495N P =0.092 P =0.097
P =0.574N P=0.115
1/49 (2%) 6/50 (12%) 4/50 (8%) 3.2% 16.8% 12.1% 1/31 (3%) 3/30 (10%) 2/27 (7%) 104 93 91 P=0.151 P =0.060 P =0.163 P =0.209 P=0.069 P =0.220 P =0.178
P =0.059 P =0.187
2/49 (4%) 6/50 (12%) 5/50 (10%) 5.8% 16.8% 14.2% 1/31 (3%) 3/30 (10%) 2/27 (7%) 96 93 91 P =0.173 P=0.136 P=0.207 P=0.267 P=0.159 P =0.323 P =0.197
P=0.141 P =0.226
Iodinated Glycerol, NTP TR 340 106

TABLE B3. ANALYSIS OF PRIMARY TUMORS IN FEMALE RATS IN THE TWO-YEAR GAVAGE STUDY OF IODINATED GLYCEROL (Continued)
~~ ~ ~~
Vehicle Control 62 mg/kg 125 mg/kg ~~~ ~
Thyroid Gland: C-cell Adenoma or Carcinoma Overall Rates (a) 2/46 (4%) (c)1/12(8%) 3/48(6%)Adjusted Rates (d) 6.7% 9.8% Terminal Rates (e) 2/30 (7%) 2/27 (7%)Week of First Observation 104 94 Life Table Test (D P=0.459 Incidental Tumor Test (D P=0.490 Fisher Exact Test (D P=0.520
Pancreatic Islets: Islet Cell Adenoma o r Carcinoma Overall Rates (a) 0149(0%) (c)0114(0%) 3/50 (6%) Adjusted Rates (d) 0.0% 9.9% Terminal Rates (e) 0/31(0%) 2/27(7%)Week of First Observation 96 Life Table Test (D P=0.107 Incidental Tumor Test (D P=O.122 Fisher Exact Test (0 P=0.125
Mammary Gland: Fibroadenoma Overall Rates (a) 13/50 (26%) 10/50(20%) 11/50(22%)Adjusted Rates (d) 36.5% 28.0% 31.5% Terminal Rates (e) 9/31 (29%) 6/30(20%) 6/27 (22%) Week of First Observation 95 84 88 Life Table Tests (0 P=0.447N P=0.347N P=0.496N Incidental Tumor Tests (D P=0.274N P=0.268N P=0.320N Cochran-Armitage Trend Test (D P=0.361N Fisher Exact Test (0 P=0.318N P=0.408N
Uterus: Endometrial Stromal Polyp Overall Rates (a) 14/49 (29%) (c)7/23 (30%) 9/49 (18%) Adjusted Rates (d) 35.9% 26.3% Terminal Rates (e) 8/31 (26%) 5/27 (19%) Week of First Observation 71 88 Life Table Test (f) P= 0.229N Incidental Tumor Test (0 P=0.1 14N Fisher Exact Test (n P=0.170N
All Sites: Benign Tumors Overall Rates (a) 36/50(72%) 40/50(80%) 40/50(80%) Adjusted Rates (d) 81.6% 90.7% 88.6% Terminal Rates (e) 23/31(74%) 26/30 (87%) 22/27 (81%) Week of First Observation 71 42 81 Life Table Tests (0 P=0.158 P=0.264 P=0.194 Incidental Tumor Tests (0 P=0.398 P=0.365 P=0.494 Cochran-Armitage Trend Test (0 P=0.203 Fisher Exact Test (0 P=0.241 P=0.241
All Sites: Malignant Tumors Overall Rates (a) 23/50 (46%) 21/50 (42%) 26/50(52%) Adjusted Rates (d) 55.0% 49.2% 60.9% Terminal Rates (e) 13/31(42%) 9/30 (30%) 12/27 (44%) Week of First Observation 71 63 71 Life Table Tests (0 P=0.274 P=0.453N P=0.300 Incidental Tumor Tests (0 P=0.290 P=0.477N P=0.374 Cochran-Armitage Trend Test (D P=0.307 Fisher Exact Test (0 P=0.421N P=0.345
107 Iodinated Glycerol, NTP TR 340

TABLE B3. ANALYSIS OF PRIMARY TUMORS IN FEMALE RATS IN THE TWO-YEAR GAVAGE STUDY OF IODINATED GLYCEROL (Continued)
Vehicle Control 62 mg/kg 125 mg/kg
All Sites: All Tumors Overall Rates (a) 44/50 (88%) 46/50 (92%) 47/50 (94%) Adjusted Rates (d) 9 1.7% 93.9% 95.9% Terminal Rates (e) 27/31 (87%) 27/30 (90%) 25/27 (93%) Week of First Observation 71 42 71 Life Table Testa (0 P=0.203 P=0.391 P=0.232 Incidental Tumor Tests (0 P=0.267 P=0.456 P=0.396 Cochran-Armitage Trend Test (D P =0.188 Fisher Exact Test (0 P=0.370 P =0.243
(a)Number oftumor-bearing animals/number of animals examined a t the site (b)Twenty-one spleens examined microscopically (c)Incomplete sampling of tissues (d)Kaplan-Meier estimated tumor incidences a t the end ofthe study after adjusting for intercurrent mortality (e)Observed tumor incidence a t terminal kill (0Beneath the vehicle control incidence are the P values associated with the trend test. Beneath the dosed group incidence are the Pvalues corresponding to pairwise comparisons between that dosed group and the vehicle controls. The life table analysis regards tumors in animals dying prior to terminal kill as being (directly or indirectly) the cause of death. The incidental tumor test regards these lesions as nonfatal. The Cochran-Armitage and Fisher exact testa compare directly the overall incidence rates. A negative trend or lower incidence in a dosed group is indicated by (N).
Iodinated Glycerol, NTP TR 340 108

TABLE B4. HISTORICAL INCIDENCE OF ANTERIOR PITUITARY GLAND TUMORS IN CONTROL FEMALE F344/N RATS (a)
Incidence in Controls Adenoma Carcinoma Adenoma o r
Study Carcinoma
Historical Incidence for All Water Gavage Vehicle Controls
Iodinated glycerol (b) 26/48 0148 26/48Malonaldehyde, sodium salt (c) 16/49 2/49 18/49Chlorpheniramine maleate (c) 24/48 1/48 25/48Tetrakis(hydroxymethy1)phosphoniumchloride (c) 24/49 0149 24/49Tetrakis(hydroxymethy1)phosphonium sulfate (c) 23/46 0146 23/46 Methyl carbamate (d) 21/50 3/50 24/50
TOTAL 1341290 (46.2%) 6/290(2.1%) 1401290 (48.3%) SD (e) 7.76% 2.54% 6.10%
Range (0High 26/48 3/50 26/48LOW 16/49 0149 18/49
Overall Historical Incidence for Untreated Controls
TOTAL (g)86911,922 (45.2%) (h)7211,922 (3.7%) (g,h)93911,922 (48.9%) SD (e) 11.77% 4.05% 11.34%
Range (0High 33/47 8/49 33/47 LOW 7/39 0150 913 9
(a)Data as ofApril 29,1987,for studies ofa t least 104weeks (b)Study performed at EG&G Mason Research Institute (c)Study performed a t Battelle Columbus Laboratories (d)Study performed a t Microbiological Associates (e)Standard deviation ( f ) Range and SD are presented for groups of 35or more animals. (g)Includes 102chromophobe adenomas (h)Includes three adenocarcinomas, NOS, and six chromophobe carcinomas
109 Iodinated Glycerol, NTP TR 340

TABLE B6. SUMMARY OF THE INCIDENCE OF NONNEOPLASTIC LESIONS IN FEMALE RATS IN THE TWO-YEAR GAVAGE STUDY OF IODINATED GLYCEROL
Animals initially in study Animals necropsied Animals examined histopathologically
INTEGUMENTARY SYSTEM +Skin
Hyperplasia, basal cell Acanthosis
RESPIRATORY SYSTEM #Nasal cavity
Inflammation, suppurative Inflammation, chronic
#Trachea Inflammation, acutekhronic Inflammation, chronic
#LungCongestion, NOS Inflammation, interstitial Bronchopneumonia, acute Inflammation, chronic Pneumonia, interstitial chronic Hyperplasia, alveolar epithelium
#Lung/alveoli H em orrhage Necrosis, NOS
HE MATOPOI ETIC SYSTEM #Spleen
Inflammation, granulomatous Granuloma, NOS Fibrosis, focal Hemosiderosis Hyperplasia, lymphoid Hematopoiesis
#Lymph node Cyst, NOS
#Mandibular lymph node Hyperplasia, plasma cell
#Mediastinal lymph node Congestion, NOS Pigmentation, NOS
#Mesenteric lymph node Congestion, NOS HemorrhageInflammation, granulomatous
CIRCULATORY SYSTEM #Heart
Inflammation, chronic focal Periarteritis
#MyocardiumDegeneration, NOS
*Coronary artery Inflammation, chronic Inflammation, chronic focal
Vehicle Control
50 50 49
(50) 1 (2%) 1 (2%)
(48)
1 (2%)
2 (4%) (49)
(49)
(49)
1 (2%) (49)
1 (2%)
1 (2%)
(49)
(49)26 (53%)
(50) 1 (2%)
Low Dose
50 50 50
(50)
(9) 1 (11%)3 (33%)
(11)
(33)12 (36%)
1 (3%)
(21) 1 (5%)
(46)1 (2%)
(46) 1 (2%)
(46)2 (4%) 1 (2%)
(46) 2 (4%)
(50) 1 (2%) 1 (2%)
(50)12 (24%)
(50)
High Dose
50 50 50
(50)
(47) 3 (6%)2 (4%)
(50) 1 (2%)
(50)
1 (2%)
1 (2%)
(50)
(50) 1 (2%) 1 (2%) 1 (2%)
1 (2%)
(50)
(50)
(50)
(50)
1 (2%) 1 (2%)
(50) 1 (2%)
(50)17 (34%)
(50)
1 (2%)
Iodinated Glycerol, NTP TR 340 110

TABLE B5. SUMMARY OF THE INCIDENCE OF NONNEOPLASTIC LESIONS IN FEMALE RATS IN THE TWO-YEAR GAVAGE STUDY OF IODINATED GLYCEROL (Continued)
Vehicle Control Low Dose High Dose
CIRCULATORY SYSTEM (Continued) #Pancreas
"Mesentery Periarteritis
Periarteritis
(49)
(50) 1 (2%)
(14)
(50) 1 (7%)
1 (2%)
(50)
(50)
DIGESTIVE SYSTEM #Salivary gland
Cyst, NOS Inflammation, suppurative Inflammation, acute Inflammation, chronic Atrophy, focal Metaplasia, squamous
Atrophy, focal
Hemorrhage Inflammation, chronic focal Sclerosis Peliosis hepatis Necrosis, NOS Necrosis, focal Metamorphosis, fatty Basophilic cyto change Ground glass cyto change Focal cellular change Eosinophilic cyto change Clear cell change Angiectasis
Fibrosis, focal
Congestion, NOS
#Parotid gland
#Liver
#Hepatic capsule
#Liver/centrilobular
#Bile duct Hyperplasia, NOS
(49)
1 (2%)
1 (2%)
22 (45%) 1 (2%)
1 (2%)
19 (39%) 35 (71%)
1 (2%)
2 (4%) 1 (2%)
1 (2%)
(49)
(49)
(49)
(49)
(49)24 (49%)
(50)
2 (4%) 4 (8%)
48 (96%)
2 (4%)
1 (2%)20 (40%)
1 (2%)
2 (4%) 13 (26%) 33 (66%)
1 (2%)
1 (2%)
(50)
(50)
(50)
(50)
(50)26 (52%)
(50) 1 (2%) 2 (4%) 1 (2%) 3 (6%)
11 (22%) 49 (98%)
20 (40%)
1 (2%) 1 (2%)
22 (44%) 33 (66%) 1 (2%) 2 (4%)
2 (4%)1 (2%)
(50)
(50)
(50)
(50)
(50)26 (52%)
#Pancreas Inflammation, chronic
(49)6 (12%)
(14)2 (14%)
(50)5 (10%)
#Pancreatic acinus
#Glandular stomach Atrophy, NOS
Necrosis, focal
(49)
(49) 6 (12%)
(14)
(10) 1 (7%)
(50)
(49) 7 (14%)
1 (2%) #Forestomach
Ulcer, NOS (49)
1 (2%) (10) (49)
2 (4%) Inflammation, acute Inflammation, chronic Hyperplasia, basal cell Hyperkeratosis Acanthosis
#Colon
2 (4%)
1 (2%) 2 (4%)
(47)
1 (10%)
(12)
1 (2%)
1 (2%) 1 (2%)
(50) Parasitism
Dilatation, NOS Parasitism
#Cecum 11 (23%)
(47) 1 (8%)
(12) 5 (10%)
2 (4%)
(50)
URINARY SYSTEM #Kidney
Nephrosis, NOS Necrosis, cortical
Calcification, NOS # Kidneyhubule
(49) 43 (88%) 1 (2%)
(49)
(19) 15 (79%)
1 (5%) (19)
(50) 45 (90%)
(50)
111 Iodinated Glycerol, NTP TR 340

TABLE B5. SUMMARY OF THE INCIDENCE OF NONNEOPLASTIC LESIONS IN FEMALE RATS IN THE TWO-YEAR GAVAGE STUDY OF IODINATED GLYCEROL (Continued)
Vehicle Control Low Dose High Dose
URINARY SYSTEM (Continued)
Inflammation, chronic Hyperplasia, epithelial
Hyperplasia, epithelial
#Kidneylpelvis
#Urinary bladder
(49)
(46)
(19)
(10)
ENDOCRINE SYSTEM #Anterior pituitary
Cyst, NOS Multiple cysts CytomegalyHyperplasia, focal Angiectasis
Hyperplasia, focal
Accessory structure Necrosis, focal Metamorphosis, fatty Hypertrophy, focal Hyperplasia, focal Angiectasis
#Adrenal medulla Cyst, NOS Hyperplasia, focal
Cystic follicles Hyperplasia, C-cell Hyperplasia, follicular cell
Hyperplasia, NOS
#Adrenal
#Adrenal cortex
#Thyroid
#Parathyroid
(48) 3 (6%) 5 (10%) 1 (2%) 2 (4%) 3 (6%)
1 (2%) (49)
(49)
2 (4%) 1 (2%)
11 (22%) 22 (45%) 1 (2%)
1 (2%) 4 (8%)
4 (9%)
(49)
(46)
(20)
(50)
6 (12%)
1 (2%) 1 (2%)
(50)
(50)
2 (4%) 1 (2%)9 (18%)
19 (38%) 2 (4%)
2 (4%)
(50)
(12)
1 (8%) (7)
(50) 2 (4%) 3 (6%)
16 (32%) 18 (36%)
(50)
5 (10%)
1 (2%) 5 (10%) 1 (2%)
2 (9%)
(48)
(22)
REPRODUCTIVE SYSTEM "Mammary gland
Inflammation, suppurative Hyperplasia, NOS
Inflammation, suppurative Inflammation, chronic Hyperplasia, NOS Hyperplasia, focal
Inflammation, suppurative
HydrometraHemorrhage Inflammation, suppurative Inflammation, acute
#Uterus/endometriumHyperplasia, cystic
#OvaryCyst, NOS Inflammation, suppurative Inflammation, chronic Hyperplasia, focal
"Clitoral gland
"Vagina
#Uterus
1 (2%) 1 (2%)
7 (14%)
7 (14%) 1 (2%) 1 (2%) 1 (2%)
(49)
(49)
(50)
10 (20%)
2 (4%)
2 (4%)
(50)
(50)
(23) 2 (4%)
1 (4%) 1 (4%)
(23)
(16) 1 (4%)
1 (6%)
(50)
11 (22%)
6 (12%) 6 (12%) 1 (2%)
(50)
(50)
(49) 1 (2%) 1 (2%)
(49)
(50) 2 (4%)
10 (20%)
Iodinated Glycerol, NTP TR 340 112

TABLE B5. SUMMARY OF THE INCIDENCE OF NONNEOPLASTIC LESIONS IN FEMALE RATS IN THE TWO-YEAR GAVAGE STUDY OF IODINATED GLYCEROL (Continued)
Vehicle Control Low Dose High Dose
NERVOUS SYSTEM #Brain
Hydrocephalus, NOS (50)
SPECIAL SENSE ORGANS None
MUSCULOSKELETAL SYSTEM *Muscle of thorax (50) (50) (50)
Cyst, NOS 1 (2%)
BODY CAVITIES *Abdominal cavity (50) (50) (50)
Hematoma, NOS 1 (2%) *Mesentery (50) (50) (50)
Inflammation, chronic focal 1 (2%) Necrosis, fat 3 (6%) 3 (6%)
ALL OTHER SYSTEMS Site unknown
Necrosis, NOS 1 Adipose tissue
Hemorrhage 1 Necrosis, NOS 2 1
SPECIAL MORPHOLOGY SUMMARY Autolysidnecropsyho histology 1
* Number of animals receiving complete necropsy examination; all gross lesions including masses examined microscopically. # Number of animals examined microscopically at this site
113 Iodinated Glycerol, NTP TR 340

Iodinated Glycerol, NTP TR 340 114

APPENDIX C
SUMMARY OF LESIONS IN MALE MICE IN THE
TWO-YEAR GAVAGE STUDY OF
IODINATED GLYCEROL
PAGE
TABLE C l SUMMARY OF THE INCIDENCE OF NEOPLASMS IN MALE MICE IN THE TWO-YEAR GAVAGE STUDY OF IODINATED GLYCEROL 117
TABLE C2 INDIVIDUAL ANIMAL TUMOR PATHOLOGY OF MALE MICE IN THE TWO-YEAR GAVAGE STUDY OF IODINATED GLYCEROL 120
TABLE C3 ANALYSIS OF PRIMARY TUMORS IN MALE MICE IN THE TWO-YEAR GAVAGE STUDY OF IODINATED GLYCEROL 126
TABLE C4 SUMMARY OF THE INCIDENCE OF NONNEOPLASTIC LESIONS IN MALE MICE IN THE TWO-YEAR GAVAGE STUDY OF IODINATED GLYCEROL 130
115 Iodinated Glycerol, NTP TR 340

Iodinated Glycerol, NTP TR 340 116

TABLE C l . SUMMARY OF THE INCIDENCE OF NEOPLASMS IN MALE MICE IN THE TWO-YEAR GAVAGE STUDY OF IODINATED GLYCEROL
Vehicle Control Low Dose High Dose
Animals initially in study Animals necropsied Animals examined histopathologically
50 50 50
50 50 50
50 50 50
INTEGUMENTARY SYSTEM *Subcutaneous tissue
Fibroma Fibrosarcoma Liposarcoma
Fibrous histiocytoma #Nasopharynx
(50)3 (6%) 8 (16%) 1 (2%)
1 (2%) (45)
(50)4 (8%)
12 (24%)
(3)
(50)
4 (8%)
(38)
RESPIRATORY SYSTEM #Lung
Hepatocellular carcinoma, metastatic Alveolar/bronchiolar adenoma Alveolar/bronchiolar carcinoma
(50)
8 (16%) 1 (2%)
(19)
6 (32%)
(50)1 (2%)
10 (20%)
HEMATOPOIETIC SYSTEM *Multiple organs
Malignant lymphoma, lymphocytic type Malignant lymphoma, histiocytic type Malignant lymphoma, mixed type
Malignant lymphoma, mixed type
Malignant lymphoma, lymphocytic type
Mast cell tumor
#Spleen
#Mesenteric lymph node
*Periodontal tissues
(50) 2 (4%) 1 (2%) 6 (12%)
(50)
(48)
(50) 1 (2%)
1 (2%)
CIRCULATORY SYSTEM #Liver
Hemangiosarcoma (50) (19)
1 (5%) (50)
1 (2%)
DIGESTIVE SYSTEM #Liver
Hepatocellular adenoma Hepatocellular carcinoma Mixed hepatokholangio carcinoma
Bile duct carcinoma
Adenocarcinoma, NOS
#Bile duct
#Jejunum
(50) 8 (16%)2 (4%) 2 (4%)
1 (2%) (50)
(50)
(19) 8 (42%)1 15%)
(50)7 (14%) 6 (12%)
(50)
(49)
URINARY SYSTEM #Kidney
Tubular cell adenoma (50)
117 IodinatedGlycerol, NTP TR 340

TABLE Cl. SUMMARY OF THE INCIDENCE OF NEOPLASMS IN MALE MICE IN THE TWO-YEAR GAVAGE STUDY OF IODINATED GLYCEROL (Continued)
Vehicle Control Low Dose High Dose
ENDOCRINE SYSTEM #Anterior pituitary
#AdrenaUcapsule
#Adrenal medulla
Adenoma, NOS
Adenoma, NOS
Phew hromocytoma Pheochromocytoma, malignant
#Thyroid
#Pancreatic islets Follicular cell adenoma
Islet cell adenoma
(44)
(50)
(50) 1 (2%)
1 (2%) (48)
(50) 3 (6%)
(42)
(4)
(4)
1 (2%)
(50)
( 6 ) 6 (12%)
(45)
(50)
(50)
1 (2%)
1 (2%)
3 (6%)
(50)
(50)1 (2%)
REPRODUCTIVE SYSTEM
Interstitial cell tumor #Testis (50)
1 (2%) (50)
1 (2%)
NERVOUS SYSTEM None
SPECIAL SENSE ORGANS #Harderian gland
Carcinoma, NOS Adenoma, NOS
(50)
4 (8%)
(44) 2 (5%) 4 (9%)
(50)
4 (8%)
MUSCULOSKELETAL SYSTEM None
BODY CAVITIES None
ALL OTHER SYSTEMS *Multiple organs
Bile duct carcinoma, metastatic Hepatocellular carcinoma, metastatic Mixed hepato/cholangio carcinoma, metastatic
(50) 1 (2%) 1 (2%)1 (2%)
(50) (50)
ANIMAL DISPOSITION SUMMARY Animals initially in study
Natural death Moribund sacrifice Terminal sacrifice
50 7 7
36
50 5 5 40
50 9
10 31
Iodinated Glycerol, NTP TR 340 118

TABLE Cl. SUMMARY OF THE INCIDENCE OF NEOPLASMS IN MALE MICE IN THE TWO-YEAR GAVAGE STUDY OF IODINATED GLYCEROL (Continued)
Vehicle Control Low Dose High Dose
TUMOR SUMMARY Total animals with primary tumors++ 33 29 29
Total primary tumors 57 50 42 Total animals with benign tumors 23 16 22
Total benign tumors 30 29 28 Total animals with malignant tumors 22 19 14
Total malignant tumors 26 21 14 Total animals with secondary tumors## 2 1
Total secondary tumors 3 1 Total animals with tumors-
uncertain benign or malignant 1 Total uncertain tumors 1
* Number of animals receiving complete necropsy examinations; all gross lesions including masses examined microscopically. IC+ Primary tumors: all tumors except secondary tumors # Number of animals examined microscopically at this site # # Secondary tumors: metastatic tumors or tumors invasive into an adjacent organ
119 Iodinated Glycerol, NTP TR 340

TABLE C2. INDIVIDUAL ANIMAL TUMOR PATHOLOGY OF MALE MICE IN THE TWO-YEAR GAVAGESTUDY OF IODINATED GLYCEROL: VEHICLE CONTROL
ANIMALNUMBER
WEEKS ONSTUDY
INTEGUMENTARY SYSTEMSubcutaneous tissue
FibromaFibrosarcomaLiposarcoma
RESPIRATORY SYSTEMLungs and bronchi
Alveolar/bronchiolar adenomaAlveolar/bronchiolar carcinoma
TracheaNasal cavity
Fibrous histiocytoma
HEMATOPOIETIC SYSTEMBone marrowSpleenLymph nodes
Malignant lymphoma, lymphocytic typeThymus
CIRCULATORY SYSTEMHeart
DIGESJnv"j^ SYSTEMOral cavity
Mast cell tumorSalivary glandLiver
Hepatocellular adenomaHepatocellular carcinomaMixed hepato/cholangio carcinoma
Bile ductBile duct carcinoma
Gallbladder & common bile ductPancreasEsophagusStomachSmall intestineLarge intestine
URINARY SYSTEMKidney
Tubular cell adenomaUrinary bladder
ENDOCRINE SYSTEMPituitaryAdrenal
Adenoma, NOSPheochromocytoma, malignant
ThyroidFolhcular cell adenoma
Parathyroid
REPRODUCT1VK SVsTEMMammary glandTestis
Interstitial cell tumorProstate
NERVOUS SYSTEMBrain
SPECIAL SENSE ORGANSHardenan gland
Adenoma, NOS
ALL OTHER SYSTEMSMultiple organs, NOS
Bile duct carcinoma, metastaticHepatocellular carcinoma, metastaticMixed hepato/cholangio carcinoma, metastaticMalignant lymphoma, lymphocytic typeMalignant lymphoma, histiocytic typeMalignant lymphoma, mixed type
0 01 01 01 0 0 01 01 01 0 0 0 0 01 0 0 0 0 01 0 0 0 0 03 5 2 1 0 3 0 2 1 0 1 2 3 4 0 0 0 0 1 1 1 1 1 11 0| 0| 7| 8 7 6| 3\ 0| 2 4 2 5 8| 1 3 4 9 l| 2 3 5 6 8
01 01 01 01 0 0 01 01 01 01 01 0 1 11 1 11 1 11 11 1 1 1 1 14 5 7 8 9 9 9 9 9 9 9 9 0 0 0 0 0 0 0 0 0 0 0 05| 0| 5| 2| 1 2 3| 3| 4| 8\ 8\ 9 2 2| 5 5| 5 5| 5| 5 5 5 5 5
019
105
X X X J
X X
+ + + + + + + + + ^ + + + + + + + + + + + + + +
+
++
+
X
N N N N N N N N N N N N N N N N N N N N N N N N N
+ + + + + + + + + + + + + + + + + + + + + + + -* ++
X X X XX X
X X
X
+ + + + + + + + + + + + + + + + + + + + + + -*
+ + + + + + + + + -t- + + + + + + + + + -t- + + + HX
XX
X+ - + - + - + - + + + + - + - + + + + - + + + -
+
+ + +
4
. +
1 +
+
N N N N N N N N N N N N N N N N N N N N N N N N N
X4. + + + H- + + + + + + + - + + + + + + + + + + -h +
+ + + + + + + + + + H- + + + + H- H- + + + + + + + +
X
N N N N N N N N N N N N N N N N N N N N N N N N NXX
X
X X
+ Tissue examined microscopically Required tissue not examined microscopically
X Tumor incidenceN Necropsy, no autolysis, no microscopic examinationS Animal missexed
No tissue information submittedC Necropsy, no histology due to protocolA. AutolysisM Animal missingB No necropsy performed
lodinated Glycerol, NTP TR 340 120
-
--
-
— —
-
_
"
—

TABLE C2. INDIVIDUAL ANIMAL TUMOR PATHOLOGY OF MALE MICE: VEHICLE CONTROL(Continued)
ANIMALNUMBER
WEEKS ONSTUDY
INTEGUMENTARY SYSTEMSubcutaneous tissue
FibromaFibrosarcomaLiposarcoma
RESPIRATORY SYSTEMLungs and bronchi
Alveolar/bronchiolar adenomaAlveolar/bronchiolar carcinoma
TracheaNasal cavity
Fibrous histiocytoma
HEMATOPOIETIC SYSTEMBone marrowSpleenLymph nodes
Malignant lymphoma, lymphocytic typeThymus
CIRCULATORY SYSTEMHeart
DIGESTIVfc SYSTEMOral cavity
Mast cell tumorSalivary glandLiver
Hepatocellular adenomaHepatocellular carcinomaMixed hepato/cholangio carcinoma
Bile ductBile duct carcinoma
Gallbladder & common bile ductPancreasEsophagusStomachSmall intestineLarge intestine
URINARY SYSTEMKidney
Tubular cell adenomaUrinary bladder
ENDOCRINE SYSTEMPituitaryAdrenal
Adenoma, NOSPheochromocytoma, malignant
ThyroidFolhcular cell adenoma
Parathyroid
REPRODUCTIVE SYSTEMMammary glandTestis
Interstitial cell tumorProstate
NERVOUS SYSTEMBrain
SPECIAL SENSE ORGANSHardenan gland
Adenoma, NOS
ALL OTHER SYSTEMSMultiple organs, NOS
Bile duct carcinoma, metastaticHepatocellular carcinoma, metastaticMixed hepato/cholangio carcinoma, metaMalignant lymphoma, lymphocytic typeMalignant lymphoma, histiocytic typeMalignant lymphoma, mixed type
0 0 01 01 01 01 01 01 0 0 01 0 01 0 01 0 0! 0 0 01 0 0! 01 01 02 2 2 2 2 2 2 3 3 3 3 3 4 4 4 4 4 4 4 4 0 0 3 3 41 4 5| 6| Y] 8| 9| 0| 3 4 6| 8 0| 1 2| 3 4| 5 6 9| 5 7| 2\ 9| 7
11 11 11 11 1 11 1 1 1 1 1 1 1 1 11 1 1 1 1 1 1 1 1 1 10 0 0 0 0 0 0 0 0 0 0 0 0 0 0 0 0 0 0 0 0 0 0 0 05 J 5 | 5 | 5 | 5 5 | 5 5 5 5 5 5 5 5 5 ) 5 5 5 5 5 6 6 6 6 6
+ + + + + f + + + + + + + + + +N + + -i + + + + +X X X
X X X XX
+ + + + + + + + + + + + + + + + + + + + + + + + +X X X X X X
X
+ + + + + + + + + + + + + -4 + + -I + + + + +X
+ + + + + + + + + + + + + + + + + + + + + + + + +
N N N N N N N N N N N N N N N N N N N N N N N N NX
X X X X
+ + - ( - . f + + + l ^ + -l- + + .f + -f + + + . J - . l . + + + . { - + .
+ + + + + + + +• + + + + + + + 4 + + + + + + + +
+ + + + + + + + + + -4- + + -»- + + + + + -J- + + + + -t-
+ + + + + + + + + + + + + + + + + + + + + + + + +
+ + + + + + + + + + + + + + + + + + + -I +
+ + 4. + + + + + + + 4. + + + + + + + + + + + + +
X X_ - - + - _ + + + _ _ + _ - - + + _ + + + + - + +
N N N N N N N N N N N N N N N N N N N N N N N N N+ + + + + + + 4- + + + + + + + + + + -t- + + + + + +
+ + + + + + + + + + + + + + + + + + + + + +
+ + + + + + + + + + + + + + + + + + + + + + + + +
X X X
N N N N N N N N N N N N N N N N N N N N N N N N N
X XX
x x x x
TOTAL.TISSUESTUMORS
»50381
5081
50451
5050481
31
50
•501
5050822
501
«505048495047
501
50
445011
483
30
*50501
46
50
504
»50111216
* Animals necropsied
121 lodinated Glycerol, NTP TR 340
-
— — - - —
—
- - - -
_
- -

TABLE C2. INDIVIDUAL ANIMAL TUMOR PATHOLOGY OF MALE MICE IN THE TWO-YEAR GAVAGESTUDY OF IODINATED GLYCEROL: LOW DOSE
ANIMALNUMBER
WEEKS ONSTUDY
o\ o i o | o o | o | o | o | o i o i o n o 0 1 o n o r <M or oi 01 o 01 or o1 2 1 4 1 4 4 2 2 0 0 0 0 0 0 0 0 0 1 1 1 1 13| 7| 2| 7 5| 2| 4| 0| 8| l| 2| 3\ 4| 5| 6| 7| 8| 9| o| l| 4| 6| 9\
01 1 1
9
0 OI 0 ] 0 1 0 1 0 \ W 0 I 11 I 1^ I i\ U V I I IT II II 11 I] 18 8 8 9 9 9 9 9 0 0 0 0 0 0 0 0 0 0 0 0 0 0 0 0 06 7| 8| l| 5| 7| g| 9 3 s| 5 5 5| 5 5| 5| 5| 5 5 5| 5| i\ 5| 5| 5
+ N + + N N N N N N N N + N N N N N N N + N N N NX X
X X X X X X X X X X X
X X X X+ + + + + + + + + + + + + + + + + + + + + + + + +
X XX
X
+ + + + + N N N N N N N N N N N N N N N N N N N N
+ + + + + + + + + + + + + + + + + +• + + + + + ++ + + + + + + + + + + + + + + + - t - - t - - t + -t + + +
+ + + + + - + + + _ _ - - _ - _ , - - - . - - -
+ + + + + + + + + + + + + + + + + + + + + * + +X
+ + + + + + + + -l- + + + + 4- + + + + + -t- + + -f + +X X X
N N N N N N N N N N N N N N N N N N N N N N N N N
XX X
INTEGUMENTARY SYSTEMSubcutaneous tissue
FibromaFibrosarcoma
RESPIRATORY SYSTEMLungs and bronchi
Alveolar/bronchiolar adenomaTracheaNasal cavity
HEMATOPOIETIC SYSTEMBone marrowSpleenLymph nodesThymus
CIRCULATORY SYSTEMHeart
DIGESTIVE SYSTEMSalivary glandLiver
Hepatocellular adenomaHepatocellular carcinomaHemangiosarcoma
Bile ductGallbladder & common bile ductPancreasEsophagusStomachSmall intestine
Adenocarcinoma, NOSLarge intestine
URINARY SYSTEMKidneyUrinary bladder
ENDOCRINE SYSTEMPituitary
Adenoma, NOSAdrenalThyroid
Follicular cell adenomaParathyroid
REPRODUCTIVE SYSTEMMammary glandTestisProstate
NERVOUS SYSTEMBrain
SPECIAL SENSE ORGANSHarderian gland
Carcinoma, NOSAdenoma, NOS
ALL OTHER SYSTEMSMultiple organs, NOS
Malignant lymphoma, lymphocytic typeMalignant lymphoma, histiocytic typeMalignant lymphoma, mixed type
N N N N N N N N N N N N N N N N N
X
N N N N N N N NX
lodinated Glycerol, NTP TR 340 122
— - -
_ _ —

TABLE C2. INDIVIDUAL ANIMAL TUMOR PATHOLOGY OF MALE MICE: LOW DOSE(Continued)
ANIMALNUMBER
WEEKS ONSTUDY
INTEGUMENTARY SYSTEMSubcutaneous tissue
FibromaFibrosarcoma
KESPIRATOKY SYSTEMLungs and bronchi
Alveolar/bronchiolar adenomaTracheaNasal cavity
rfEMATOPOIETIC SYSTEMBone marrowSpleenLymph nodesThymus
CIRCULATORY SYSTEMHeart
DIGESTIVE SYSTEMSalivary glandLiver
Hepatocellular adenomaHepatocellular carcinomaHemangiosarcoma
Bile ductGallbladder & common bile ductPancreasEsophagusStomachSmall intestine
Adenocarcinoma, NOSLarge intestine
URINARY SYSTEMKidneyUrinary bladder
ENDOCRINE SYSTEMPituitary
Adenoma, NOSAdrenalThyroid
Folhcular cell adenomaParathyroid
REPRODUCTIVE SYSTEMMammary glandTestisProstate
NERVOUS SYSTEMBrain
SPECIAL SENSE ORGANSHardenan gland
Carcinoma, NOSAdenoma, NOS
ALL OTHER SYSTEMSMultiple organs, NOS
Malignant lymphoma, lymphocytic typeMalignant lymphoma, histiocytic typeMalignant lymphoma, mixed type
0 0 0 0 01 0 0 01 0 0 0 0 0 01 0 0 01 01 0 01 01 01 0 0 0
1 2 3 4 5| 6 9 0| 1 2 3 4 5 6| 7 8 9| 0| 1 3| 5| 6| 8 9 0
1 11 ll 11 11 1 1 11 1| 11 11 11 11 11 1 1 11 11 11 11 11 11 1 1 10 0 0 0 0 0 0 0 0 0 0 0 0 0 0 0 0 0 0 0 0 0 0 0 05 5| 5| 5| 5| 5 5 5| 5| s| 5| 5| 5| 5| 5 5 5| 5] 5| 5| 5| 5| 5 5 5
N N N + N N N N N N N N N N N N N N N N + N N N NX X
X
_ + _ _ _ + _ _ _ _ _ _ _ _ _ _ _ _ _ + _ + _ _ _ X X
+ + +_ _ - _ _ _ _ _ _ _ _ _ + _ + _ _ _ _ _ 4 - _ _ + +
- _ _ _ _ _ _ _ _ _ _ _ _ _ _ _ _ _ _ _ - _ _ _ ^
+ + + + + + + - _ iX X X X X X
+ + + + + + + _ - , -N N N N N N N N N N N N N + N N N N N N N N N + N_ _ _ _ „ _ _ _ _ _ _ _ _ _ _ _ _ _ _ _ . ( - _
+ + + + + + + + + + + + + + + + + + + + + + + + -T +
X
+
+ + + + + + + + + + + + + + + + + +
X X X+ + + + + + + •* + + + +
N N N N N N N N N N N N N N N N N N N N N N N N N
XX X
N N N N N N N N N N N N N N N N N N N N N N N N N
X
TOTALTISSUESTUMORS
'504
12
196
503
41622
2
5
419811
19*50
64449614
87
4214
506
25
*5043
4
4424
*50112
* Animals necropsied
123 lodinated Glycerol, NTP TR 340
i
_ _ _ — _ _ _ _ _ _ _ _ _ _ _ _ _ _ _ _ _ _
_ _ _ _ _ _ _ _ _ _ _ _ _ _ _
_ _ _ _ _ _ _ _ _ _ _ _ _ _
_ — _
_ _ _ _ _ _ _ _ _ _ _ _ _ _ _ _ _ — _ _ — _ — —
-- -- - -
— — — — — — — - — — - — - —

TABLE C2. INDIVIDUAL ANIMAL TUMOR PATHOLOGY OF MALE MICE IN THE TWO-YEAR GAVAGESTUDY OF IODINATED GLYCEROL: HIGH DOSE
ANIMALNUMBER
WEEKS ONSTUDY
INTEGUMENTARY SYSTEMSubcutaneous tissue
Fibrosarcoma
RfiSPlftAf ORY SYSTEMLungs and bronchi
Hepatocellular carcinoma, metastaticAlveolar/bronchiolar adenoma
TracheaNasal cavity
HEMATOP01ETIC SYSTEMBone marrowSpleen
Malignant lymphoma, mixed typeLymph nodesThymus
CIRCULATORY SYSTEMHeart
DIGESTIVE SYSTEMSalivary glandLiver
Hepatoceihilar adenomaHepatocellular carcinomaHemangiosarcoma
Bile ductGallbladder & common bile ductPancreasEsophagusStomachSmall intestineLarge intestine
URINARY SYSTEMKidneyUnnary bladder
ENDOCRINE SYSTEMPituitary
Adenoma, NOSAdrenal
Adenoma, NOSPheochromocytoma
ThyroidParathyroidPancreatic islets
Islet cell adenoma
REPRODUCTIVE SYSTEMMammary glandTestis
Interstitial cell tumorProstate
NERVOUS SYSTEMBrain
SPECIAL SENSE ORGANSHardenan gland
Adenoma, NOS
ALL OTHER SYSTEMSMultiple organs, NOS
Malignant lymphoma, lymphocytic typeMalignant lymphoma, mixed type
01 0 0| 0| 0| 0| 0| 0 0 0 0 01 01 01 01 01 01 01 0 01 01 0 0 0 01 3 3 3 4 0 2 1 0 4 4 0 2 0 3 1 2 4 0 0 0 0 0 1 19 1 5| 9| l| l| 5] 8 9 2 7 4| 2| g| 8| 4| 6| OJ 2 3| 5| 6 7 0 1
•or o or o 01 01 o oi o o 01 a o opn ITT rrr i 11 i| i| i0 1 1 3 3 5 6 7 7 8 8 8 8 9 9 0 0 0 0 0 0 0 0 0 02| 3 3| 7 7| l| 7 4| 9 5 5| 9 9 2| 4 0 3 3 4| 4 4 4| 4| 4| 4
X X X X
Xx x
+ + + + + + + + + + + + + + + + +
X+ + + + + + + + -!- + + - + + + + + + + + + + + + ++ + + + + + + + + + + + +
+ + + + + + + + + + + + + + + + + + + + + + + + +
X X X XX X X X X
+ + + + + + -l + 4 + + + H + + + + + + + + + + ++ + + + + + + + + + + + + + + + + + + + + + + +
+ + + + + + + + + + + + + + + + + + + + + + + + +
+ 4. + + + + + + + + + + + + + + + + + + + + +X
X X X
+ + > + + + - - * +X
N N N N N N N N N N N N N N N N N N + N N N N N N
X+ + + + + + + + + + + + + + + + + + + + 4 + + + +
+ + + + + + + + + + + + + + + + + + + + + + + + +
X X
N N N N N N N N N N N N N N N N N N N N N N N N NX
lodinated Glycerol, NTP TR 340 124
- —
- -- - -
— - - - '
— — — — — — — — — - — — - — — —
-

TABLE C2. INDIVIDUAL ANIMAL TUMOR PATHOLOGY OF MALE MICE: HIGH DOSE(Continued)
ANIMALNUMBER
WEEKS ONSTUDY
INTEGUMENTARY SYSTEMSubcutaneous tissue
Fibrosarcoma
RESPIRATORY SYSTEMLungs and bronchi
Hepatocellular carcinoma, metastaticAlveolar/bronchiolar adenoma
TracheaNasal cavity
HEMATOPOIETIC SYSTEMBone marrowSpleen
Malignant lymphoma, mixed typeLymph nodesTnymus
CIRCULATORY SYSTEMHeart
DIGESTIVE SYSTEMSalivary glandLiver
Hepatocellular adenomaHepatocellular carcinomaHemangiosarcoma
Bile ductGallbladder & common bile ductPancreasEsophagusStomachSmall intestineLarge intestine
URINARY SYSTEMKidneyUnnary bladder
ENDOCRINE SYSTEMPituitary
Adenoma, NOSAdrenal
Adenoma, NOSPheochromocytoma
ThyroidParathyroidPancreatic islets
Islet cell adenoma
REPRODUCTIVE SYSTEMMammary glandTestis
Interstitial cell tumorProstate
NERVOUS SYSTEMBrain
SPECIAL SENSE ORGANSHardenan gland
Adenoma, NOS
ALL OTHER SYSTEMSMultiple organs, NOS
Malignant lymphoma, lymphocytic typeMalignant lymphoma, mixed type
01 01 01 01 0 01 0 01 01 0 01 01 0 0 01 01 01 0 01 01 01 01 01 01 01 1 1 1 1 2 2 2 2 2 2 2 3 3 3 3 3 3 4 4 4 4 4 4 52| 3| 5| 6| 7 0| 1 3| 4| 7 9| 8| 0 2 3| 4J 6| 7 3| 4| 5\ 6| 8J 9| 0
0 0 0 0 0 0 0 0 0 0 0 0 0 0 0 0 0 0 0 0 0 0 0 0 04| 4| 4| 4| 4 4 4| 4 4 4\ 4\ 5 s| 5| 5| 5| 5 5 5 s| s| 5| 5 5 5
X X X X X X X X
+ + + + + + + + + + + + + + + + + + + + + + + + +
+ + + + + + + + + + + + + + + + + + + + + +
+ + + + + + + + + + + + + + + + + + + + + + + + +X X X
XX
+ + + + + + + + + + + + + + + + + + + + + + + + +
X
+ + + + + + + + + + +
N N N N N N N N N N N N N N N N N N N N N N N N N
+ + + + + + + + + + + + + + + + + + + + + + + + +
+ + + + + + + + + + + + + + + + + + + + + + + + +X X
N N N N N N N N N N N N N N N N N N N N N N N N N
*
TOTAL.TISSUESTUMORS
•504
501
105038
50501
4936
50
4950761
50*505049504948
5049
451
5013
5019501
'50501
50
49
504
«5011
* Animals necropsied
125 lodinated Glycerol, NTP TR 340
--
— — — — — — — — — — — — — —

TABLE C3. ANALYSIS OF PRIMARY TUMORS IN MALE MICE IN THE TWO-YEAR GAVAGE STUDY OF IODINATED GLYCEROL
Subcutaneous Tissue: Fibroma Overall Rates (a) Adjusted Rates (b) Terminal Rates (c) Week of First Observation Life Table Tests (d) Incidental Tumor Tests (d) Cochran-Armitage Trend Test (d) Fisher Exact Test (d)
Subcutaneous Tissue: Fibrosarcoma Overall Rates (a) Adjusted Rates (b) Terminal Rates (c) Week of First Observation Life Table Tests (d) Incidental Tumor Tests (d) Cochran-Armitage Trend Test (d) Fisher Exact Test (d)
Subcutaneous Tissue: Fibroma or Fibrosarcoma Overall Rates (a) Adjusted Rates (b) Terminal Rates (c) Week of First Observation Life Table Tests (d)Incidental Tumor Tests (d) Cochran-Armitage Trend Test (d) Fisher Exact Test (d)
Lung: AlveolarIBronc hiolar Adenoma Overall Rates (a) Adjusted Rates (b) Terminal Rates(c)Week of First Observation Life Table Test (d) Incidental Tumor Test (d) Fisher Exact Test (d)
Vehicle Control
3/50 (6%) 8.3% 3/36(8%)104 P=0.138N P=0.158N P=0.118N
8/50 (16%) 20.1% 5/36(14%)92 P =0.253N P=0.204N P= 0.170N
11/50(22%)27.9% 8/36(22%)92 P=0.102N P=0.069N P=0.052N
8/50 (16%) 20.7% 6/36 (17%) 92
Lung: AlveolarlBronchiolar Adenoma or Carcinoma Overall Rates (a) 9/50(18%) Adjusted Rates (b) 23.3% Terminal Rates (c) 7/36 (19%) Week of First Observation 92 Life Table Test (d) Incidental Tumor Test (d) Fisher Exact Test (d)
Hematopoietic System: Malignant Lymphoma, Lymphocytic Type Overall Rates (a) 3/50 (6%) Adjusted Rates (b) 8.0% Terminal Rates (c) 2/36 (6%) Weekof First Observation 102 Life Table Test (d) Incidental Tumor Test (d) Fisher Exact Test (d)
125 mg/kg
4/50(8%)9.7% 3/40 (7%) 99 P=0.556 P=0.527
P=0.500
12/50 (24%) 24.6% 4/40(10%)86 P=0.315 P=0.232
P=0.227
15/50 (30%) 30.8% 7/40(18%)86 P=0.355 P=0.286
P=0.247
(e)6/19(32%)
(e)6/19(32%)
(e,f)1/50(2%)
250 mg/kg
0/50(0%)0.0% 0/32(0%)
P = 0.142N P=0.142N
P=0.121N
4/50(8%)10.8% 1/32(3%)79 P=0.248N P=0.262N
P=0.178N
4/50(8%)10.8% 1/32(3%)79 P =0.084N P=0.083N
P=0.045N
10/50(20%)28.5% 8/32(25%)13 P=0.296 P=0.397 P=0.397
10/50(20%)28.5% 8/32 (25%) 13 P=0.387 P=0.495 P=0.500
1/50(2%)2.6% 0/32(0%) 89 P=0.354N P=0.324N P=0.309N
Iodinated Glycerol, NTP TR 340 126

TABLE C3. ANALYSIS OF PRIMARY TUMORS IN MALE MICE IN THE TWO-YEAR GAVAGE STUDY OF IODINATED GLYCEROL (Continued)
Vehicle Control
Hematopoietic System: Malignant Lymphoma, Mixed Type Overall Rates (a) 6/50 (12%) Adjusted Rates (b) 16.0% Terminal Rates (c) 5/36 (14%) Week of First Observation 98 Life Table Test (d) Incidental Tumor Test (d) Fisher Exact Test (d)
Hematopoietic System: Lymphoma, All Malignant Overall Rates (a) Adjusted Rates (b) Terminal Rates (c) Week of First Observation Life Table Test (d) Incidental Tumor Test (d) Fisher Exact Test (d)
Liver: Hepatocellular Adenoma Overall Rates (a) Adjusted Rates (b) Terminal Rates (c) Week of First Observation Life Table Test (d) Incidental Tumor Test (d) Fisher Exact Test (d)
Liver: Hepatocellular Carcinoma Overall Rates (a) Adjusted Rates (b) Terminal Rates (c) Week of First Observation Life Table Test (d) Incidental Tumor Test (d) Fisher Exact Test (d)
Liver: Hepatocellular Adenoma or Carcinoma Overall Rates (a)Adjusted Rates (b) Terminal Rates (c) Week of First Observation Life Table Test (d) Incidental Tumor Test (d) Fisher Exact Test (d)
Adrenal Gland: Pheochromocytoma Overall Rates (a) Adjusted Rates (b)Terminal Rates (c) Week of First Observation Life Table Test (d) Incidental Tumor Test (d) Fisher Exact Test (d)
Adrenal Gland: Pheochromocytoma or Malignant Pheochromocytoma Overall Rates (a) Adjusted Rates (b) Terminal Rates (c) Week of First Observation Life Table Test (d)Incidental Tumor Test (d) Fisher Exact Test (d)
10/50(20%) 26.1% 8/36 (22%) 98
8/50 (16%) 20.8% 6/36 (17%) 98
2/50 (4%) 4.7% 0136 (0%) 93
10150 (20%) 24.6% 6/36 (17%) 93
0/50 (0%) 0.0% 0/36 (0%)
125 mg/kg 250 mg/kg
( e a 2/50 (4%) 2/50 (4%) 6.2% 2/32 (6%) 104 P=0.177N P =0.201N P=0.135N
(ef)4/50 (8%) 3/50 (6%) 8.7% 2/32 (6%) 89 P=0.064N P=0.064N P=0.036N
(e)8/19 (42%) 7/50 (14%) 19.9% 5/32 (16%) 74 P =0.599N P=0.577 P=O.SOON
(e) 1/19 (5%) 6/50 (12%) 15.0% 1/32 (3%) 67 P=0.106 P=0.134 P=0.134
(e)9/19 (47%) 13/50 (26%) 32.3% 6/32 (19%) 67 P =0.226 P=0.222 P=0.317
(e)014 (0%) 3/50 (6%) 8.3% 1/32 (3%) 85 P =0.108 P=0.108 P=O.121
1/50 (2%) (e) 0/4 (0%) 3/50 (6%) 2.4% 8.3% 0/36 (0%) 1/32 (3%) 98 85
P =0.270 P=0.228 P=0.309
127 IodinatedGlycerol, NTP TR 340

TABLE C3. ANALYSIS O F PRIMARY TUMORS IN MALE MICE IN THE TWO-YEAR GAVAGE STUDY O F IODINATED GLYCEROL (Continued)
Thyroid Gland: Follicular Cell Adenoma Overall Rates (a) Adjusted Rates (b)Terminal Rates (c) Week of First Observation Life Table Tests (d) Incidental Tumor Tests (d) Cochran-Armitage Trend Test (d) Fisher Exact Test (d)
Harderian Gland: Adenoma Overall Rates (a) Adjusted Rates (b) Terminal Rates (c) Week of First Observation Life Table Tests (d) Incidental Tumor Tests (d) Cochran-Armitage Trend Test (d) Fisher Exact Test (d)
Harderian Gland: Adenoma o r Carcinoma Overall Rates (a) Adjusted Rates (b)Terminal Rates (c) Week of First Observation Life Table Tests (d) Incidental Tumor Tests (d) Cochran-Armitage Trend Test (d) Fisher Exact Test (d)
All Sites: Benign Tumors Overall Rates (a) Adjusted Rates (b) Terminal Rates(c) Week of First Observation Life Table Tests (d) Incidental TumorTests (d) Cochran-Armitage Trend Test (d) Fisher Exact Test (d)
All Sites: Malignant Tumors Overall Rates (a) Adjusted Rates (b) Terminal Rates (c) Week of First Observation Life Table Tests (d) Incidental Tumor Tests (d) Cochran-Armitage Trend Test (d) Fisher Exact Test (d)
All Sites: All Tumors Overall Rates (a) Adjusted Rates (b) Terminal Rates (c)Week of First Observation Life Table Tests (d) Incidental Tumor Tests (d) Cochran-Armitage Trend Test (d) Fisher Exact Test (d)
Vehicle Control
3/48 (6%) 8.0% 2/35 (6%) 98 P=0.171N P=0.155N P=0.134N
4/50(8%)10.7% 3/36 (8%) 102 P=0.508 P=0.479 P=0.572
4/50(8%)10.7% 3/36(8%)102 P=0.495 P=0.444 P=0.567
23/50 (46%) 54.5% 17/36 (47%) 91 P=0.435 P=0.523N P= 0.459N
22/50(44%)49.5% 14/36(49%)75 P=0.166N P=0.057N P=0.060N
33/50 (66%) 7 1.6% 23/36 (64%) 75 P=0.501N P=0.323N P=0.237N
125 mg/kg
6/50 (12%) 14.2% 5/40(13%)86 P=0.308 P=0.306
P=0.264
4/44 (9%) 10.5% 4/38(11%)104 P= 0.610N P=0.637N
P=0.569
6/44 (14%) 15.0% 5/38(13%)95 P=0.412 P=0.361
P= 0.291
16/50 (32%) 36.7% 13/40 (33%) 86 P=0.066N P=0.063N
P=0.109N
19/50 (38%) 38.0% 9/40 (23%) 86 P=0.251N P=0.368N
P=0.343N
29/50 (58%) 58.0% 19/40 (48%) 86 P=0.169N P=0.222N
P=0.269N
250 mg/kg
0150(0%)0.0% 0132(0%)
P= 0.144N P= 0.168N
P=0.1 14N
4/50(8%)12.5% 4/32(13%)104 P=0.578 P=0.538
P=0.643
4/50 (8%) 12.5% 4/32 (13%) 104 P=0.578 P=0.538
P=0.643
22/50 (44%) 55.6% 15/32 (47%) 13 P=0.446 P=0.550
P=0.500N
14/50 (28%) 33.6% 5/32 (16%) 67 P=0.194N P=0.076N
P=0.072N
29/50 (58%) 65.7% 17/32 (53%) 13 P=0.548N P=0.370N
P=0.269N
Iodinated Glycerol, NTP TR 340 128

TABLE C3. ANALYSIS OF PRIMARY TUMORS IN MALE MICE IN THE TWO-YEAR GAVAGE STUDY OF IODINATED GLYCEROL (Continued)
(a)Number of tumor-bearing animals/number of animals examined a t the site (b)Kaplan-Meier estimated tumor incidences a t the end of the study after adjusting for intercurrent mortality (c)Observed tumor incidence at terminal kill (d)Beneath the vehicle control incidence are the P values associated with the trend test. Beneath the dosed group incidence are the P values corresponding to pairwise comparisons between that dosed group and the vehicle controls. The life table analysis regards tumors in animals dying prior to terminal kill as being (directly or indirectly) the cause of death. The incidental tumor test regards these lesions as nonfatal. The Cochran-Armitage and Fisher exact tests compare directly the overall incidence rates. A negative trend or lower incidence in a dosed group is indicated by (N). (e)Incomplete sampling of tissues (0Sixteen spleens and 19 livers were examined microscopically.
129 Iodinated Glycerol, NTP TR 340
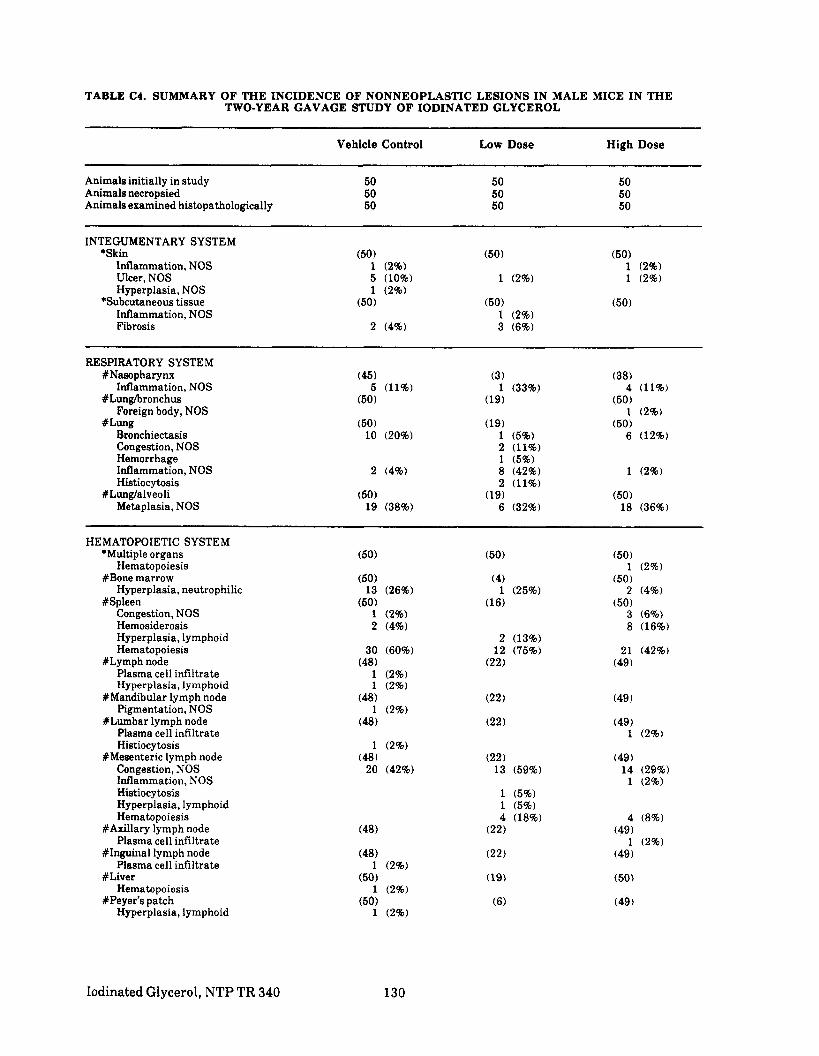
TABLE C4. SUMMARY OF THE INCIDENCE OF NONNEOPLASTIC LESIONS IN MALE MICE IN THE TWO-YEAR GAVAGE STUDY OF IODINATED GLYCEROL
Animals initially in study Animals necropsied Animals examined histopathologically
INTEGUMENTARY SYSTEM *Skin
Inflammation, NOS Ulcer, NOS Hyperplasia, NOS
*Subcutaneous tissue Inflammation, NOS Fibrosis
RESPIRATORY SYSTEM #Nasopharynx
Inflammation, NOS XLunghronchus
Foreign body, NOS #Lung
Bronchiectasis Congestion, NOS HemorrhageInflammation, NOS Histiocytosis
#Lung/alveoli Metaplasia, NOS
HEMATOPOIETIC SYSTEM *Multiple organs
Hematopoiesis #Bone marrow
Hyperplasia, neutrophilic #Spleen
Congestion, NOS Hemosiderosis Hyperplasia, lymphoid Hematopoiesis
#Lymph node Plasma cell infiltrate Hyperplasia, lymphoid
#Mandibular lymph node Pigmentation, NOS
#Lumbar lymph node Plasma cell infiltrate Histiocytosis
#Mesenteric lymph node Congestion, NOS Inflammation, NOS HistiocytosisHyperplasia, lymphoid Hematopoiesis
#Axillary lymph node Plasma cell infiltrate
#Inguinal lymph node Plasma cell infiltrate
#Liver Hematopoiesis
XPeyer’s patch Hyperplasia, lymphoid
Vehicle Control Low Dose High Dose
50 50 50 50 50 50 50 50 50
(50)1 (2%) 5 (10%) 1 (2%)
(50)
1 (2%)
(50)1 (2%) 1 (2%)
2 (4%)
(50) 1 (2%) 3 (6%)
(50) (50)
(45)
(50)
(50)
5 (11%)
10 (20%)
2 (4%)
(50)19 (38%)
(3)
(19)
(19)
1 (33%)
1 (5%)2 (11%) 1 (5%)8 (42%) 2 (11%)
6 (32%) (19)
(38)
(50)
(50)
4 (11%)
1 (2%)
6 (12%)
1 (2%)
(50)18 (36%)
(50)1 (2%)
(50)
(50) 2 (4%)
3 (6%)
2 (13%) 12 (75%)
(22)
8 (16%)
21 (42%) (49)
(22) (49 )
(22) (49) 1 (2%)
(22) 13 (59%)
1 (5%) 1 (5%) 4 (18%)
(49) 14 (29%) 1 (2%)
4 (8%) (22)
1 (2%) (49)
(22) (49)
(19) (50)
(6) (49)
IodinatedGlycerol, NTP TR 340 130

TABLE C4. SUMMARY OF THE INCIDENCE OF NONNEOPLASTIC LESIONS IN MALE MICE IN THE TWO-YEAR GAVAGE STUDY OF EODINATED GLYCEROL (Continued)
HEMATOPOIETIC SYSTEM (Continued) #Thymus
Cyst, NOS Hyperplasia, lymphoid
CIRCULATORY SYSTEM #Lung
Perivasculitis #Heart
Inflammation, acute focal Periarteritis
#Myocardium Degeneration, NOS
#Endocardium Fibrosis
'Aorta Thrombosis, NOS
DIGESTIVE SYSTEM *Tooth
Inflammation, acute Abscess,NOS
#Salivary gland Dilatatiodducts Inflammation, NOS Hypertrophy, NOS
#Liver Hernia, NOS Congestion, NOS Hemorrhage Inflammation, chronic focal Necrosis, focal Metamorphosis, fatty Cytoplasmic change, NOS
*Gallbladder Dilatation, NOS
#Pancreatic acinus Cytoplasmic vacuolization Hyperplasia, focal
#Periesophageal tissue Inflammation, chronic
#Glandular stomach Ulcer, NOS Metaplasia, squamous
#Forestomach Inflammation, NOS Ulcer, NOS HyperkeratosisAcanthosis
#JejunumInflammation, NOS Ulcer, NOS Abscess, NOS
Vehicle Control
(31)
(50) 1 (2%)
(50) 2 (4%) 1 (2%)
(50) 48 (96%)
(50)
(50) 1 (2%)
(50) 6 (12%) 4 (8%)
(50)
2 (4%)
(50)
4 (8%) 3 (6%) 3 (6%)
(50)
(50) 1 (2%)2 (4%)
(48)
(49)
1 (2%) (49)
(50)
1 (2%)
Low Dose
(19)
(5)
(5) 3 (60%)
(5)
(50)
(50)
(4)
(19) 1 (5%)
1 (5%)
2 (11%)
1 (5%) (50)
(6)
(44)
(49)
(49)
1 (2%) (6)
1 (17%)
High Dose
(50)
(50)
2 (4%) (50)
35 (70%) (50)
1 (2%) (50)
(50) 1 (2%) 1 (2%)
(49) 1 (2%) 3 (6%) 1 (2%)
(50)
4 (8%)
1 (2%) 6 (12%) 1 (2%) 4 (8%)
(50) 1 (2%)
(50)
(50) 1 (2%) 2 (4%) 5 (10%) 5 (10%)
(49)1 (2%) 1 (2%)
131 Iodinated Glycerol, NTP TR 340

TABLE C4. SUMMARY OF THE INCIDENCE OF NONNEOPLASTIC LESIONS IN MALE MICE IN THE TWO-YEAR GAVAGE STUDY OF IODINATED GLYCEROL (Continued)
URINARY SYSTEM #Kidney
Mineralization Glomerulonephritis, NOS Inflammation, acute focal Abscess, NOS Inflammation, chronic focal Scar Nephrosis, NOS Necrosis, focal Cytomegaly
#Kidney/tubule Cast, NOS Pigmentation, NOS Regeneration,NOS
#Urinary bladder Calculus, unknown gross or microscopic Calculus, gross observation only Calculus, microscopic examination HemorrhageInflammation, acutelchronic
ENDOCRINE SYSTEM #Anterior pituitary
Cyst, NOS Hyperplasia, focal
#Pituitary/basophil cell Cytoplasmic vacuolization
#Adrenal cortex Focal cellular change Hyperplasia, focal
#Adrenal medulla Hyperplasia, focal
#Thyroid Mineralization Inflammation, NOS Hyperplasia, follicular cell
#Thyroid follicle Dilatation, NOS
#ParathyroidCyst, NOS
#Pancreatic islets Hyperplasia, NOS
REPRODUCTIVE SYSTEM *Penis
Abscess, NOS Inflammation, active chronic
*Preputial gland Mineralization Dilatation, NOS Inflammation, NOS Abscess, NOS
#Prostate Inflammation, NOS Abscess, NOS Atrophy, NOS
*Seminal vesicle Dilatation, NOS Atrophy, NOS
Vehicle Control
(50)1 (2%)
44 (88%) 2 (4%)
3 (6%) 3 (6%) 2 (4%) 1 (2%)
(50)
1 (2%) 10 (20%)
(50)
1 (2%)
(50)
2 (4%) (50)
1 (2%)13 (26%) 8 (16%)
(46)2 (4%)
(50) 1 (2%) 1 (2%)
Low Dose
(8)
8 (100%)
1 (13%)
(7)1 (14%) 2 (29%)
(50)1 (2%)
(50) 1 (2%) 2 (4%)
15 (30%) 6 (12%)
(3)
High Dose
(50)2 (4%)
34 (68%)
3 (6%) 6 (12%)
16 (32%) (49)
1 (2%) 2 (4%) 1 (2%)
(45) 5 (11%) 5 (11%)
(45) 1 (2%)
(50) 5 (10%) 2 (4%)
(50) 1 (2%)
(50)
1 (2%) 34 (68%)
(50)32 (64%)
(19)
(50) 1 (2%)
(50)
(50)
2 (4%) 16 (32%) 4 (8%)
(50) 1 (2%) 1 (2%) 1 (2%)
(50) 1 (2%) 1 (2%)
Iodinated Glycerol, NTP TR 340 132

TABLE C4. SUMMARY OF THE INCIDENCE OF NONNEOPLASTIC LESIONS IN MALE MICE IN THE TWO-YEAR GAVAGE STUDY OF IODINATED GLYCEROL (Continued)
REPRODUCTIVE SYSTEM (Continued) *Coagulating gland
Dilatation, NOS #Testis
Mineralization Hypospermatogenesis Hyperplasia, interstitial cell
#Testidtubule Atrophy, focal
*Epididymis Inflammation, NOS Granuloma, foreign body Aspermatogenesis
*Scrotum Abscess, NOS
NERVOUS SYSTEM #Brain
Mineralization *Spinal cord
Degeneration, NOS
SPECIAL SENSE ORGANS #Harderian gland
Inflammation, NOS Hyperplasia, NOS Hyperplasia, focal
MUSCULOSKELETAL SYSTEM *Tarsal joint
AnkylosisHemorrhage Inflammation, chronic
*Muscle of leg Degeneration, NOS
BODY CAVITIES *Abdominal cavity
Cyst, NOS *Pelvis
Abscess, NOS *Pleura
Inflammation, acute *Pericardium
Inflammation, acute
ALL OTHER SYSTEMS *Multiple organs
Congestion, NOS Inflammation, chronic focal
Perineum Steatitis
Omentum Necrosis, fat
Vehicle Control
(50)
(50)5 (10%) 1 (2%)
(50)5 (10%)
(50)
1 (2%) 2 (4%)
(50)
(50)26 (52%)
(50)
(50) 1 (2%) 1 (2%)
(50)41 (82%)
(50)
(50)
40 (80%)
1
Low Dose
(50)1 (2%)
(4)
(4)
(50)
(50)
(4)3 (75%)
(50)
(44) 1 (2%)
1 (2%)
(50)33 (66%) 2 (4%) 2 (4%)
(50)
~
(50)
4 (8%)
. 4
High Dose
(50)
(50)2 (4%) 2 (4%) 2 (4%)
(50)4 (8%)
(50) 1 (2%).
1 (2%)(50)
1 (2%)
(49)18 (37%)
(50)1 (2%)
(50)
3 (6%)
(50) 29 (58%)
(50) 1 (2%)
(50) 1 (2%)
(50) 1 (2%)
(50)1 (2%)
(50) 1 (2%)
41 (82%)
2
133 Iodinated Glycerol, NTP TR 340

TABLE C4. SUMMARY OF THE INCIDENCE OF NONNEOPLASTIC LESIONS IN MALE MICE IN THE TWO-YEAR GAVAGE STUDY OF IODINATED GLYCEROL (Continued)
Vehicle Control Low Dose High Dose
SPECIAL MORPHOLOGY SUMMARY None
Number of animals receiving complete necropsy examination; all gross lesions including masses examined microscopically. K Number of animals examined microscopically at this site
IodinatedGlycerol, NTP TR 340 134

APPENDIX D
SUMMARY OF LESIONS IN FEMALE MICE IN
THE TWO-YEAR GAVAGE STUDY OF
IODINATED GLYCEROL
TABLE D1 SUMMARY OF THE INCIDENCE OF NEOPLASMS IN FEMALE MICE IN THE TWO-YEAR GAVAGE STUDY OF IODINATED GLYCEROL
TABLE D2 INDIVIDUAL ANIMAL TUMOR PATHOLOGY OF FEMALE MICE IN THE TWO-YEAR GAVAGE STUDY OF IODINATED GLYCEROL
TABLE D3 ANALYSIS OF PRIMARY TUMORS IN FEMALE MICE IN THE TWO-YEAR GAVAGE STUDY OF IODINATED GLYCEROL
TABLE D4a HISTORICAL INCIDENCE OF ANTERIOR PITUITARY GLAND TUMORS IN CONTROL FEMALE B6C3F1 MICE
TABLE D4b HISTORICAL INCIDENCE OF HARDERIAN GLAND TUMORS IN CONTROL FEMALE B6C3F1 MICE
TABLE D4c HISTORICAL INCIDENCE OF HEPATOCELLULAR TUMORS IN CONTROL FEMALE B6C3F1 MICE
TABLE D4d HISTORICAL MICE
INCIDENCE OF STOMACH TUMORS IN CONTROL FEMALE B6C3F1
TABLE D5 SUMMARY OF THE INCIDENCE OF NONNEOPLASTIC LESIONS IN FEMALE MICE IN THE TWO-YEAR GAVAGE STUDY OF IODINATED GLYCEROL
PAGE
137
140
146
149
150
151
152
153
135 Iodinated Glycerol, NTP TR 340

Iodinated Glycerol, NTP TR 340 136

TABLE D1. SUMMARY OF THE INCIDENCE OF NEOPLASMS IN FEMALE MICE IN THE TWO-YEAR GAVAGE STUDY OF IODINATED GLYCEROL
Vehicle Control Low Dose High Dose
Animals initially in study Animals necropsied Animals examined histopathologically
50 50 50
50 50 50
50 50 50
INTEGUMENTARY SYSTEM *Subcutaneous tissue
Fibrosarcoma
RESPIRATORY SYSTEM #Lung
Hepatocellular carcinoma, metastatic Alveolar/bronchiolar adenoma Alveolar/bronchiolar carcinoma Pheochromocytoma, metastatic
(50)
3 (6%) 1 (2%) 1 (2%)
(15) 1 (7%)
(50)1 (2%) 4 (8%) 2 (4%)
HEMATOPOIETIC SYSTEM *Multiple organs
Malignant lymphoma, undifferentiated type Malignant lymphoma, lymphocytic type Malignant lymphoma, histiocytic type Malignant lymphoma, mixed type
Malignant lymphoma, lymphocytic type Malignant lymphoma, mixed type
Malignant lymphoma, lymphocytic type
#Spleen
#Thymus
(50) 1 (2%)5 (10%) 1 (2%) 4 (8%)
(31)
(7)
(50) 1 (2%)
14 (28%) 1 (2%) 8 (16%)
4 (8%)3 (6%)
1 (3%)
(50)
(40)
CIRCULATORY SYSTEM #Mesenteric lymph node
Hemangiosarcoma#Uterus
Hemangiosarcoma #Uterusfendometrium
Hemangioma#Ovary
Hemangiosarcoma
DIGESTIVE SYSTEM #Liver
Hepatocellular adenoma Hepatocellular carcinoma
Squamous cell papilloma
Adenocarcinoma, NOS
#Forestomach
#Jejunum
URINARY SYSTEM None
ENDOCRINE SYSTEM #Pituitary intermedia
Adenoma, NOS #Anterior pituitary
Adenoma, NOS
(47)
(47) 1 (2%)
10 (21%)
(45)
(45)15 (33%)
(46)
(46)24 (52%)
137 Iodinated Glycerol, NTP TR 340

TABLE Dl. SUMMARY O F THE INCIDENCE OF NEOPLASMS IN FEMALE MICE IN THE TWO-YEAR GAVAGE STUDY OF IODINATED GLYCEROL (Continued)
~~ ______ ~ ~ _ _ _ _ _ _ ~~ ~~
Vehicle Control Low Dose High Dose
ENDOCRINE SYSTEM (Continued) #Adrenal medulla
#Thyroid
#Pancreatic islets
Pheochromocytoma Pheochromocytoma, malignant
Follicular cell adenoma C-cell adenoma
Islet cell adenoma
(49)
(48)
(50)
2 (4%) 1 (2%)
2 (4%) 1 (2%)
1 (2%)
(13)
(48)
(9)
3 (6%)
(50)
(48)
(49)
4 (8%)
1 (2%)
REPRODUCTIVE SYSTEM *Mammary gland
#Uterus Adenosquamous carcinoma
Leiomyosarcoma Endometrial stromal polyp
Adenocarcinoma, NOS
Adenocarcinoma, NOS
Cystadenoma, NOS Luteoma
#Cervix uteri
#Uterus/endometrium
#Ovary
(50)
(50)
1 (2%)
(50)
(50)
(48)
(50)
(27)
1 (4%)
1 (4%)
(27)
(27)
(29)
(50)
(50) 1 (2%)
1 (2%) 2 (4%)
1 (2%) 1 (2%)
(50)
(50)
(49)
NERVOUS SYSTEM None
SPECIAL SENSE ORGANS #Harderian gland
Carcinoma, NOS Adenoma, NOS
(50)
6 (12%)
(40)
8 (20%)
(50) 1 (2%)
13 (26%)
MUSCULOSKELETAL SYSTEM None
BODY CAVITIES None
ALL OTHER SYSTEMS *Multiple organs
Leiomyosarcoma, metastatic (50) (50) (50)
1 (2%)
ANIMAL DISPOSITION SUMMARY Animals initially in study
Natural death Moribund sacrifice Terminal sacrifice
50 6 6 38
50 9 8
33
50 4 8 38
Iodinated Glycerol, NTP TR 340 138

TABLE D1. SUMMARY OF THE INCIDENCE OF NEOPLASMS IN FEMALE MICE IN THE TWO-YEAR GAVAGE STUDY OF IODINATED GLYCEROL (Continued)
Vehicle Control Low Dose High Dose
TUMOR SUMMARY Total animals with primary tumors** 37 30 45
Total primary tumors 59 48 97 Total animals with benign tumors 23 23 37
Total benign tumors 29 32 58 Total animals with malignant tumors 30 15 34
Total malignant tumors 30 16 39 Total animals with secondary tumors## 1 1 2
Total secondary tumors 1 1 2
* Number of animals receiving complete necropsy examinations; all gross lesions including masses examined microscopically. ** Primary tumors: all tumors except secondary tumors # Number of animals examined microscopically at this site # # Secondary tumors: metastatic tumors or tumors invasive into an adjacent organ
139 Iodinated Glycerol, NTP TR 340

TABLE D2. INDIVIDUAL ANIMAL TUMOR PATHOLOGY OF FEMALE MICE IN THE TWO-YEAR GAVAGE STUDY OF IODINATED GLYCEROL: VEHICLE CONTROL
NUMBER
WEEKS ON STUDY
ITM-SWEM Lungs and bronchi
Alveolarhronchiolar adenoma Alveolar/bronchiolar carcinoma Pheochromocytoma. metastatic
Trachea Nasal cavity
Bone marrow Spleen
Malignant lymphoma, mixed type L mphnodesTiymus
Heart
Salivary gland Liver Bile duct Gallbladder & common bile duct Pancreas
$%R.'" Squamous cell papilloma
Small intestine Adenocarnnoma, NOS
Large intestine
KidneyUrinary bladder
PituitaryAdenoma. NOS
Adrenal PheochromocytomaPheochromocytoma, malignant
ThyroidFollicular cell adenoma C-eell adenoma
ParathyroidPancreatic islets
Islet cell adenoma
Mammary gland Ut0lUS
Hemannoma Ovary
Cystadenoma. NOS Hemaneosarcoma
Brain
CANS Hardenan gland
Adenoma. NOS
Multiple organs NOS Malignant lydphoma, undifferentiated type Malignant lymphoma lymphocytic type Malignant lymphoma: histiocytic type Malignant lymphoma, mixed type
+: Tissue examined microscopically -' Required tissue not examined microscopically XI Tumor incidence
0 0 0 0 0 0 0 0 0 0 0 0 0 0 0 0 0 0 0 0 0 0 0 0 0 3 2 0 3 4 4 2 4 3 4 0 0 0 0 0 0 1 3 4 0 0 1 1 1 1 5 1 7 1 8 5 0 2 0 6 1 2 3 4 5 9 0 6 1 6 8 1 2 3 4
0 0 0 0 1 1 1 1 1 1 1 1 1 1 1 1 1 1 1 1 1 1 1 1 8 8 9 9 9 0 0 0 0 0 0 0 0 0 0 0 0 0 0 0 0 0 0 0 0 6 7 0 3 8 0 1 1 4 4 5 5 5 5 5 5 5 5 5 6 6 6 6 6 6
+ + + + + + + + + + + + + + + + + + + t + t + + t X X
X . . . . . . . . . . . . . . . . . . . . . . . . . + + + + + + + + + + + - + + + + - t + + + t t + +
. . . . . . . . . . . . . . . . . . . . . . . . .
. . . . . . . . . . . . . . . . . . . . . . . . .
+ - + + + + + + + t t t + + + + + + + + + + + + + . . . . . . . . . . . . . . . . . . . . . . . . .
. . . . . . . . . . . . . . . . . . . . . . . . .
. . . . . . . . . . . . . . . . . . . . . . . . . + + + + + + + + + + + + + + + + t + + + + t + + t + + + t + t + + t t + + + + + + + + + + t + + + t + + + + + + + + + N + N N + N + + N + + + + + + + + + + + + t t + + t + + + + + + + + + + + + + + t . . . . . . . . . . . . . . . . . . . . . . . . . . . . . . . . . . . . . . . . . . . . . . . . . .
. . . . . . . . . . . . . . . . . . . . . . . . . X
. . . . . . . . . . . . . . . . . . . . . . . . . ~ ~~ ~~~_______
. . . . . . . . . . . . . . . . . . . . . . . . .
. . . . . . . . . . . . . . . . . . . . . . . . .
. . . . . . . . . . . . . . . . . . . . . . . . . X X X . . . . . . . . . . . . . . . . . . . . . . . . . X
X . . . . . . . . . . . . . . . . . . . . . . . . . " A
+ - + + - + - - + - + + t + + - + + + + + + t + + . . . . . . . . . . . . . . . . . . . . . . . . . X
N + N N N + N + N N N N N N N N N + N N + N t N + . . . . . . . . . . . . . . . . . . . . . . . . . . . . . . . . . . . . . . . . . . . . . . . . . .
X
. . . . . . . . . . . . . . . . . . . . . . . . .
. . . . . . . . . . . . . . . . . . . . . . . . . X X X
N N N N N N N N N N N N N N N N N N N N N N N N N
x x xX
X
' No tissue information submitted Ci Necropsy, no histology due to protocol A Autolysis
N: Necropsy. no autolysis, no microscopic examination M: Animal missing S: Animal missered B: No necropsy performed
Iodinated Glycerol, NTP TR 340 140

TABLE D2. INDIVIDUAL ANIMAL TUMOR PATHOLOGY OF FEMALE MICE: VEHICLE CONTROL
ANIMAL NUMBER
WEEKS ON STUDY
Lungs and bronchi Alveolarhmnchiolar adenoma Alveolar/bronchiolar carcinoma Pheochromocytoma. metastatic
Trachea Nasal cavity
Bone marrow Spleen
Malignant lymphoma, mixed type L mphnodesd y m u s
Heart
Salivary gland Liver Bile duct Gallbladder & common bile duct Pancreas
EEY Squamous cell papilloma
Small intestine Adenocarcinoma. NOS
Large intestine
KidneyUnnary bladder
PituitaryAdenoma, NOS
Adrenal PheochromoeytomaPheochromocytoma, malignant
ThyroidFollicular cell adenoma C-cell adenoma
Parathy mid Pancreatic islets
Islet cell adenoma
Mammary gland Uterus
Brain
H a d e n a n gland Adenoma. NOS
ALL -s Multiple organs NOS
Malignant lymphoma, undiffer type Malignant lymphoma lymphocytic type Malignant lymphoma' histiocytic type Malignant lymphoma: mixed type
* Animals necropsied
(Continued) B 0 0 0 0 0 0 0 0 0 0 0 0 0 0 0 0 0 0 0 0 0 0 0 0 1 1 1 1 1 2 2 2 2 2 2 2 2 3 3 3 3 3 3 4 4 4 4 4 5 5 6 1 8 9 2 3 4 5 6 1 8 9 2 3 4 7 8 9 0 3 4 1 9 0
1 1 1 1 1 1 1 1 1 1 1 1 1 1 1 1 1 1 1 1 1 1 1 1 1 0 0 0 0 0 0 0 0 0 0 0 0 0 0 0 0 0 0 0 0 0 0 0 0 0 6 6 6 6 6 6 6 6 6 6 6 6 6 6 6 6 6 6 6 6 6 6 6 6 6
. . . . . . . . . . . . . . . . . . . . . . . . . 50X 3
X 1 1 . . . . . . . . . . . . . . . . . . . . . . . . . 49 . . . . . . . . . . . . . . . . . . . . . . . . . 46
. . . . . . . . . . . . . . . . . . . . . . . . . 49+ + + + + + + + + + + + + + + + + + + + + + + + + 50 X 1 . . . . . . . . . . . . . . . . . . . . . . . . . 48 . . . . . . . . . . . . . . . . . . . . . . . . . 41
. . . . . . . . . . . . . . . . . . . . . . . . . 50
. . . . . . . . . . . . . . . . . . . . . . . . . 50 . . . . . . . . . . . . . . . . . . . . . . . . . 50 . . . . . . . . . . . . . . . . . . . . . . . . . 50
. . . . . . . . . . . . . . . . . . . . . . . . . '50 . . . . . . . . . . . . . . . . . . . . . . . . . 50 . . . . . . . . . . . . . . . . . . . . . . . . . 46 . . . . . . . . . . . . . . . . . . . . . . . . . 49X 1 . . . . . . . . . . . . . . . . . . . . . . . . . 50
1 . . . . . . . . . . . . . . . . . . . . . . . . . 49
. . . . . . . . . . . . . . . . . . . . . . . . . 50 . . . . . . . . . . . . . . . . . . . . . . . . . 41
+ + + + + + + + e + + + + + - + + - + + + + + + +47 X X x x x X x x 11 . . . . . . . . . . . . . . . . . . . . . . . . . 49
X 2 1 . . . . . . . . . . . . . . . . . . . . . . . . . 48
X X 2 1- + + - + + + - - + - + + + + + - - + - + + + - + 35 . . . . . . . . . . . . . . . . . . . . . . . . . 50 1
N N N N N N N N N N N N N N + N + + N N N N N N N $50 . . . . . . . . . . . . . . . . . . . . . . . . . 50X 1 . . . . . . . . . . . . . . . . . . . . . . . . . 48
X 1 1
. . . . . . . . . . . . . . . . . . . . . . . . . 50
. . . . . . . . . . . . . . . . . . . . . . . . . 50 X X X 6
~
N N N N N N N N N N N N N N N N N N N N N N N N N $50 X 1 x x x x x x x X 15
2 X X X 7
141 Iodinated Glycerol, NTP TR 340

TABLE D2. INDIVIDUAL ANIMAL TUMOR PATHOLOGY OF FEMALE MICE IN THE TWO-YEARGAVAGE STUDY OF IODINATED GLYCEROL: LOW DOSE
ANIMALNUMBER
WEEKS ONSTUDY
INTEGUMENTARY SYSTEMSubcutaneous tissue
Fibrosarcoma
01 01 0 01 0 0 012 4 4 1 0 2 05| l[ 5 0| 1 1 4|
01 0 01 01 01 01 01 01 01 01 01 1 4 4 1 0 0 0 0 0 18[ 6 OJ 4| 3| 3| 5| 6| 7J 9| 1
0l
1\ 4
o\ or 0 1 0 1 0 1 o o oi o or o o <j o o i i ir i i IT i i i0 3 4 5 7 7 8 8 8 9 9 9 9 9 9 0 0 0 0 0 0 0 0 0l| 9| 8| 3| 3| 9 1 6| 9 0| 2| 2 3 6| 6 0 4| S\ 5 5| s| 5| 5| S\ s
+ N N N N N N N N N + N N N N
RESPIRATORY SYSTEMLungs and bronchi
Hepatocellular carcinoma, metastaticTracheaNasal cavity
HEMATOPOIET1C SYSTEMBone marrowSpleenLymph nodesThymus
+ + + + + + + + + + + + + +X
_ _ _ _ + + + + + + + _ _ _ _ _ _ _ _ _ _ _ _ _ _
+ + + + + + + + + + + + + + +X X
X+ + + + + + + + + + + + + + + + + + + + +
+ + + + + + + + + + + + + + ++ + + + + + + + + + + + + + + + + + + + + + + + +
+ + + + + + + + + + + +
+ + + + + + + + + + + ++ + + + + + + + + + +
+ + + + + + + + + - + + + + + + + + + + + + - + +X X X X X X X
+ + + + + + + + + + +
X
N N N + N + + N + N + N N N N + N N N N N N N N N
X+ + + + + + + + + + + + + + + + + + + +
--- + - - - - - - - + + + + + + + + + + + + + +X X X
CIRCULATORY SYSTEMHeart
DIGESTIVE SYSTEMSalivary glandLiver
Hepatocellular adenomaHepatocellular carcinoma
Bile ductGallbladder & common bile ductPancreasEsophagusStomach
Squamous cell papillomaSmall intestineLarge intestine
URINARY SYSTEMKidneyUnnary bladder
ENDOCRINE SYSTEMPituitary
Adenoma, NOSAdrenalThyroid
Folhcular cell adenomaParathyroid
REPRODUCTIVE SYSTEMMammary glandUterus
Adenocarcinoma, NOSHemangiosarcoma
Ovary
NERVOUS SYSTEMBrain
SPECIAL SENSE ORGANSHardenan gland
Adenoma, NOS
ALL OTHER SYSTEMSMultiple organs, NOS
Malignant lymphoma, undifferentiated typeMalignant lymphoma, lymphocytic typeMalignant lymphoma, histiocytic typeMalignant lymphoma, mixed type
N N N N N N N N N N N N N N N N N NX
X
N N N N N N N
X X
lodinated Glycerol, NTP TR 340 142
-- - - - - - - - -
- - - - - - - - - - - - —
- - - - - - - - - - - - - - - - - - - - - - - - -
— — — — — — — — — - — — — —
--- -

TABLE D2. INDIVIDUAL ANIMAL TUMOR PATHOLOGY OF FEMALE MICE: LOW DOSE(Continued)
ANIMALNUMBER
WEEKS ONSTUDY
INTEGUMENTARY SYSTEMSubcutaneous tissue
Fibrosarcoma
RESPIRATORY SYSTEMLungs and bronchi
Hepatocellular carcinoma, metastaticTracheaNasal cavity
HEMATOPOIETIC SYSTEMBone marrowSpleenLymph nodesTnymus
CIRCULATORY SYSTEMHeart
DIGESTIVE SYSTEMSalivary glandLiver
Hepatocellular adenomaHepatocellular carcinoma
Bile ductGallbladder & common bile ductPancreasEsophagusStomach
Squamous cell papillomaSmall intestineLarge intestine
URINARY SYSTEMKidneyUrinary bladder
ENDOCRINE SYSTEMPituitary
Adenoma, NOSAdrenalThyroid
Folhcular cell adenomaParathyroid
REPRODUCTIVE SYSTEMMammary glandUterus
Adenocarcinoma, NOSHemangiosarcoma
Ovary
NERVOUS SYSTEMBrain
SPECIAL SENSE ORGANSHardenan gland
Adenoma, NOS
ALL OTHER SYSTEMSMultiple organs, NOS
Malignant lymphoma, undiffer typeMalignant lymphoma, lymphocytic typeMalignant lymphoma, histiocytic typeMalignant lymphoma, mixed type
0 0 01 0 0 0 0 0 0 01 01 01 0 0 01 01 0 01 01 0 0 0 0 0 0
5 7 9| 0 2 3 4 6 7 S\ S\ 0| 1 2 3\ B\ 7 8| 2| 3 6 7 8 9 0
0 0 0 0 0 0 0 0 0 0 0 0 0 0 0 0 0 0 0 0 0 0 0 0 05| 5| 5| 5 5| 5] 5| 5| 5| 5 5 5\ 5| 5| 5| 5| 5| 5 5| 5 5 5| 5| 5| 5
N N N N N N N N N N N N N N N N N N N N N N N N NX
+
+ + + + + + + + + + 4 + + + - - - . ) • - +
+
X X
x x
+
+ + + + + + + + + + + + + + + + + + + + + +X X X X X X X X+ +
X X
N N N N N N N N N N N N N N N N N N N N N N N N N
X X
+ + + + + + + + +
+ + + + + + + + + + + + + + + + + + + + + + + + +x x x x x
N N N N N N N N N N N N N N N N N N N N N N N N N
X X X XX
X
TOTAL:TISSUESTUMORS
*501
151
487
113119
11
115041
50*50
94750
21211
1311
451513483
29
«5027
21
29
13
408
•501514
* Animals necropsied
143 lodinated Glycerol, NTP TR 340
— — — — — — — — — — — — — _ - - - - - - - — -- — - — --
_ _ — _ _ — _ _ _ _ — _ _ _ _ _ _ _ _ _ _ _ _

TABLE D2. INDIVIDUAL ANIMAL TUMOR PATHOLOGY OF FEMALE MICE IN THEGAVAGE STUDY OF IODINATED GLYCEROL: HIGH DOSE
TWO-YEAR
ANIMALNUMBER
WEEKS ONSTUDY
KESi^litATORY SYSTEMLangs and bronchi
Hepatocellular carcinoma, metastaticAlveolar/bronchiolar adenomaAlveolar/bronchiolar carcinoma
TracheaNasal cavity
HEMATOFOIETIC SYSTEMBone marrowSpleen
Malignant lymphoma. lymphocytic typeMalignant lymphoma, mixed type
Lymph nodesHemangiosarcoma
ThymusMalignant lymphoma, lymphocytic type
CIRCULATORY SYSTEMHeart
DIGESTIVE SYSTEMSalivary glandLiver
Hepatocellular adenomaHepatocellular carcinoma
Bile ductGallbladder & common bile ductPancreasEsophagusStomach
Squamous cell papillomaSmall intestineLarge intestine
URINARY SYSTEMKidneyUnnary bladder
ENDOCRINE SYSTEMPituitary
Adenoma, NOSAdrenalThyroid
Folhcular cell adenomaParathyroidPancreatic islets
Islet cell adenoma
REPRODUCTIVE SYSTEMMammary gland
Adenosquamous carcinomaUterus
LeiomyosarcomaEndometnal stromal polyp
OvaryCystadenoma, NOSLuteoma
NERVOUS SYSTEMBrain
SPECIAL SENSE ORGANSHardenan gland
Carcinoma, NOSAdenoma, NOS
ALL OTHER SYSTEMSMultiple organs, NOS
Leiomyosarcoma, metastaticMalignant lymphoma, undifferentiated typeMalignant lymphoma, lymphocytic typeMalignant lymphoma, histiocytic typeMalignant lymphoma, mixed type
01 01 0! 0] 01 01 0 0 01 0 01 0 0 01 0 0 01 01 01 01 0 0 0 03 3 4 2 2 0 4 1 0 1 1 4 0 0 0 0 0 0 0 1 1 1 1 10| 4| 7| 4| 3| 6| 6 3 3| 0 6| 9 1 2\ 4 5 7\ B\ 9| l| 2 4 5 7
5 7 8 9 9 9 9 0 0 0 0 0 0 0 0 0 0 0 0 0 0 0 0 04 0| 5| 3\ 7\ 8| 9| 0 1 3 3| 4| 5 s| 5| 5| 5 5 5| 5 5| 5| 5| 5
018
r^ O
Ift
XX X
- + + + + + + + + + - + + + + + - - + + + - + 4
X+
+ +
XX
•h + + + + + + + + + + + + -* + HX
h +
+ + + + + + + + + + H- + H- + + H- + + + + + + + . .
+ + + + + + + + + + + + + + + + + + + + + + + ^
XX
X X
+ + + + + + + + -,. + + + + + + + + + + + +X X X X X X X X X
+ + -f + + + + + - f - i - - t - - * + + - * - - + + + + + - ( - - )
f +: x
++
X X X
N N N + N + N + N N + + + N N N + N + + N N N
X
X
f
f N
•f +
X-f +
+ + + + + + + + + + + + + + + + + + + + + + + + +
+ + + + + + + + + + + + + + + + + + + + + + + + +
X X X X X X X
N N N N N N N N N N N N N N N N N N N N N N N N NX
XX X X X X
XX X X X X
lodinated Glycerol, NTP TR 340 144
~
--
— — — — — — — - —
- - - —
-
-

TABLE D2. INDIVIDUAL ANIMAL TUMOR PATHOLOGY OF FEMALE MICE: HIGH DOSE(Continued)
ANIMALNUMBER
WEEKS ONSTUDY
RESPIRATORY SYSTEMLungs and bronchi
Hepatocellular carcinoma, metastaticAlveolaribronchiolar adenomaAlveolar/bronchiolar carcinoma
TracheaNasal cavity
HEMATOFOIETIC SYSTEMBone marrowSpleen
Malignant lymphoma, lymphocytic typeMalignant lymphoma, mixed type
Lymph nodesHemangiosarcoma
ThymusMalignant lymphoma, lymphocytic type
CIRCULATORY SYSTEMHeart
DIGESTIVE SYSTEMSalivary glandLiver
Hepatocellular adenomaHepatocellular carcinoma
Bile ductGallbladder & common bile ductPancreasEsophagusStomach
Squamous cell papillomaSmall intestineLarge intestine
URINARY SYSTEMKidneyUnnary bladder
ENDOCRINE SYSTEMPituitary
Adenoma, NOSAdrenalThyroid
Follicularcell adenomaParathyroidPancreatic islets
Islet cell adenoma
REPRODUCTIVE SYSTEMMammary gland
Adenosquamous carcinomaUterus
LeiomyosarcomaEndometnal stromal polyp
OvaryCystadenoma, NOSLuteoma
NERVOUS SYSTEMBrain
SPECIAL SENSE ORGANSHardenan gland
Carcinoma, NOSAdenoma, NOS
ALL OTHER SYSTEMSMultiple organs, NOS
Leiomyosarcoma, metastaticMalignant lymphoma, undiffer typeMalignant lymphoma, lymphocytic typeMalignant lymphoma, histiocytic typeMalignant lymphoma, mixed type
0 0 0 0 0 0 0 01 01 0 0 0 0 0 0 0 0 01 01 0 01 01 0 01 0
9 0 1 2 5 6 7 8 | 9| 1 2 3 5 6 7 8 9 0 | l | 2 3 | 4| 5 8 | 0
0 0 0 0 0 0 0 0 0 0 0 0 0 0 0 0 0 0 0 0 0 0 0 0 05 5 5 5 5 5 5 5| 5 | 5 5 5| 5 5 5 5 5 5 5 5| 5 5 5| 5 | 5
X XX
+ 4- + + - + + + + + + + + + + + + + + + + + + + +
+ + + + + + + + + + + + + + + + + + + + + + + + +X X X
X X+ + + + + + + + + + + + + + + + + + + + + + + +
+ + + + + + + + + + + + + + + + + + + + + + +X
+ + + + + + + + + + + + + + + + + + + + + + + + +X X
+ + + N + + + + + + + 4 - 4 + + 4 + + + + + + + + +
+ + + + + + + + + + + + + + + + + + + + + + ++ + + + + + + + + + + + + + + + + + + + + + + + +
X X X
X X X X X X X X X X X X X+ + + + + + + + + + + + + + + + + + + + + + + + ++ + + + + + + + + + + + + + + + + + + + + + + +
X + + + + + + + + + + + + +
+ + + + + + + + + + + + + + + + + + + + + + + + +X
N + N N N N N + N N N N + N + + N N + N N + N N +X
X
X
XX X X X X X
N N N N N N N N N N N N N N N N N N N N N N N N N
X X X X X X X X X
X X X
TOTALTISSUESTUMORS
50142
4940
505043
471
401
50
5050
31
50*504947495
5048
5050
46245048
424491
«501
5012
4911
50
501
13
•5011
1418
* Animals necropsied
145 lodinated Glycerol, NTP TR 340
-
-
— — — — — — — — — — — —

TABLE D3. ANALYSIS OF PRIMARY TUMORS IN FEMALE MICE IN THE TWO-YEAR GAVAGE STUDY OF IODINATED GLYCEROL
~ _ _ _
Vehicle Control 62 mg/kg 125 mg/kg
Lung: AlveolarlBronc hiolar Adenoma Overall Rates (a) 3/50 (6%) (b)0/15(0%)Adjusted Rates (c) 7.5% Terminal Rates (d) 3/40 (7%) Week ofFirst Observation 105 Life Table Test (e) Incidental Tumor Test (e) Fisher Exact Test (e)
Lung: AlveolarlBronchiolar Adenoma or Carcinoma Overall Rates (a ) 4/50(8%) (b)0115(0%) Adjusted Rates (c) 10.0% Terminal Rates (d) 4/40 (10%) Week of First Observation 105 Life Table Test (e) Incidental Tumor Test (e) Fisher Exact Test (e)
Hematopoietic System: Malignant Lymphoma, Lymphocytic Type Overall Rates (a) 15/50 (30%) (b,O5/50 (10%) Adjusted Rates (c) 36.5% Terminal Rates (d) 14/40 (35%) Week ofFirst Observation 104 Life Table Test (e) Incidental Tumor Test (e) Fisher Exact Test (e)
Hematopoietic System: Malignant Lymphoma, Mixed Type Overall Rates (a) 8/50 (16%) (b,O4/50 (8%) Adjusted Rates (c) 19.3% Terminal Rates (d) 7/40 (18%) Week ofFirst Observation 98 Life Table Test (e) Incidental Tumor Test (e) Fisher Exact Test (e )
Hematopoietic System: Lymphoma, All MalignantOverall Rates (a) 26/50 (52%) (bf) 11/50 (22%) Adjusted Rates (c) 58.8% Terminal Rates td) 22/40 (55%) Week ofFirst Observation 86 Life Table Test (e) Incidental Tumor Test (e) Fisher Exact Test (e)
Liver: Hepatocellular Adenoma Overall Rates (a) 0150(0%) 4/50 (8%) Adjusted Rates (c) 0.0% 12.1% Terminal Rates (d) 0140(0%) 4/33 (12%) Week of First Observation 105 Life Table Tests (e) P=0.117 P=0.041 Incidental Tumor Tests (e) P=0.127 P=0.041 Cochran-Armitage Trend Test (e) P=0.120 Fisher Exact Test ( e ) P=0.059
4/50(8%)10.5% 4/38 (11%) 105 P=0.472 P=0.472 P=0.500
5/50(10% 1 13.2% 5/38(13%)105 P=0.468 P=0.468 P=0.500
19/50 (38%) 48.7% 18/38 (47%) 104 P=0.198 P=0.218 P=0.263
11/50 (22%) 26.5% 8/38 (21%) 93 P=0.274 P=0.316 P=0.305
32/50 (64%) 72.5% 26/38 (68%) 70 P=0.115 P=0.136 P=0.155
3/50(6%)7.3% 2/38 (5%) 93 P=0.117 P=0.131
P=O.121
Iodinated Glycerol, NTP TR 340 146

TABLE D3. ANALYSIS O F PRIMARY TUMORS IN FEMALE MICE IN THE TWO-YEAR GAVAGE STUDY O F IODINATED GLYCEROL (Continued)
Vehicle Control 62 mg/kg
Liver: Hepatocellular Adenoma or Carcinoma Overall Rates (a) 0150(0%) 5/50 (10%) Adjusted Rates (c) 0.0% 14.0% Terminal Rates(d) 0140(0%) 4/33 (12%) Week of First Observation 53 Life Table Tests (e) P=0.071 P=0.022 Incidental Tumor Tests (e) P=0.103 P=0.041 Cochran-Armitage Trend Test (e) P=0.071 Fisher Exact Test (e) P=0.028
Forestomach: Squamous Cell Papilloma Overall Rates (a) 1/49(2%) 2/50 (4%) Adjusted Rates (c) 2.5% 6.1% Terminal Rates (d) 1/40 (3%) 2/33(6%)Week of First Observation 105 105 Life Table Tests (e) P=0.060 P=0.433 Incidental Tumor Tests (e) P=0.077 P=0.433 Cochran-Armitage Trend Test (e) P=0.059 Fisher Exact Test (e) P=0.508
Anterior Pituitary Gland: Adenoma Overall Rates (a) 10147(21%) 15/45 (33%) Adjusted Rates (c) 25.0% 44.4% Terminal Rates (d) 8/37 (22%) 11/29 (38%) Week of First Observation 87 89 Life Table Tests (e) P=0.002 P=0.059 Incidental Tumor Tests (e) P=0.001 P=0.068 Cochran-Armitage Trend Test (e) P=0.001 Fisher Exact Test (e) P=0.143
Adrenal Gland: Pheochromocytoma or Malignant Pheochromocytoma Overall Rates (a) 3149 (6%) (b)0113(0%)Adjusted Rates(c) 6.5% Terminal Rates (d) 1/39(3%)Week ofFirst Observation 87 Life Table Test (e) Incidental Tumor Test (e) Fisher Exact Test (e)
Thyroid Gland: Follicular Cell Adenoma Overall Rates (a) 2/48 (4%) 3/48 (6%) Adjusted Rates ( c ) 5.3% 9.1% Terminal Rates (d) 2/38 (5%) 3/33 (9%) Week of First Observation 105 105 Life Table Tests (e) P=0.245 P=0.435 Incidental Tumor Tests (e) P=0.264 P=0.435 Cochran-Armitage Trend Test (e) P=0.264 Fisher Exact Test (e) P=0.500
Harderian Gland: Adenoma Overall Rates (a) 6/50(12%) 8/40 (20%) Adjusted Rates (c) 14.6% 22.4% Terminal Rates (d) 5/40(13%) 6/33(18%)Week of First Observation 104 92 Life Table Tests (e) P=0.041 P=0.251 Incidental Tumor Tests (e) P=0.041 P=0.201 Cochran-Armitage Trend Test (e) P=0.050 Fisher Exact Test (e) P=0.227
~
125 mg/kg
4/50(8%)9.9% 3/38(8%)93 P=0.060 P=0.068
P=0.059
5/49(10%)12.4% 3/38(8%)103 P=0.097 P=0.1 27
P=0.102
24/46 (52%) 58.0% 18/35 (51%) 93 P=0.003 P=O.O02
P=O.O02
0150(0%)0.0% 0138(0%)
P=0.129N P=0.243N P=0.118N
4/48 (8%) 10.7% 3/36(8%)104 P=0.312 P=0.336
P=0.339
13/50 (26%) 32.3% 11/38(29%) 97 P=0.052 P=0.062
P=0.062
147 Iodinated Glycerol, NTP TR 340

TABLE D3. ANALYSIS OF PRIMARY TUMORS IN FEMALE MICE IN THE TWO-YEAR GAVAGE STUDY O F IODINATED GLYCEROL (Continued)
Vehicle Control 62 mgkg 125 mg/kg
Harderian Gland: Adenoma or Carcinoma Overall Rates (a) 6/50 (12%) 8/40 (20%) 14/50 (28%) Adjusted Rates (c) 14.6% 22.4% 34.8% Terminal Rates (d) 5/40 (13%) 6/33 (18%) 12/38~ 2 % )Week of First Observation 104 92 97 Life Table Tests (e) P=0.025 P=0.251 P=0.032 Incidental Tumor Tests (e) P=0.024 P=0.201 P =0.039 Cochran-Armitage Trend Test (e) P =0.030 Fisher Exact Test (e) P =0.227 P =0.039
All Sites: Benign Tumors Overall Rates (a) 23/50 (46%) 23/50 (46%) 37/50 (74%) Adjusted Rates (c) 54.6% 58.8% 82.2% Terminal Rates (d) 21/40 (53%) 17/33 (52%) 30138 (79%) Week of First Observation 87 89 93 Life Table Tests (e) P=0.003 P =0.252 P =0.003 Incidental Tumor Tests (e) P=O.O02 P=0.319 P =0.002 Cochran-Armitage Trend Test (e) P=0.003 Fisher Exact Test (e) P =0.579 P =0.004
All Sites: Malignant Tumors Overall Rates (a) 30150 (60%) 15/50 (30%) 34/50 (68%) Adjusted Rates (c) 66.4% 38.3% 75.3% Terminal Rates (d) 25/40 (63%) 10133 (30%) 27/38 (71%) Week of First Observation 86 48 54 Life Table Tests (e) P=0.192 P =0.032N P =0.202 Incidental Tumor Tests (e) P =0.250 P =0.002N P =0.266 Cochran-Armitage Trend Test (e) P=0.236 Fisher Exact Test (e) P=0.003N P =0.266
All Sites: All Tumors Overall Rates (a) 37/50 (74%) 30/50 (60%) 45/50 (90%) Adjusted Rates (c) 78.6% 71.1% 93.7% Terminal Rates (d) 30140 (75%) 21/33 (64%) 35/38 (92%) Week of First Observation 86 48 54 Life Table Tests (e) P =0.049 P = 0.522N P =0.044 Incidental Tumor Tests (e) P=0.041 P =0.178N P =0.028 Cochran-Armitage Trend Test (e) P =0.041 Fisher Exact Test (e) P =0.101N P =0.033
(a)Number oftumor-bearing animals/number of animals examined a t the site (b)Incomplete sampling oftissues (c)Kaplan-Meier estimated tumor incidences a t the end of the study after adjusting for intercurrent mortality (d)Observed tumor incidence a t terminal kill (e)Beneath the vehicle control incidence are the P values associated with the trend test. Beneath the dosed group incidence are the P values corresponding to pairwise comparisons between that dosed group and the vehicle controls. The life table analysis regards tumors in animals dying prior to terminal kill as being (directly or indirectly) the cause of death. The incidental tumor test regards these lesions as nonfatal. The Cochran-Armitage and Fisher exact tests compare directly the overall incidence rates. A negative trend or lower incidence in a dosed group is indicated by (N).(DThirty-one spleens were examined microscopically.
Iodinated Glycerol, NTP TR 340 148

TABLE D4a. HISTORICAL INCIDENCE OF ANTERIOR PITUITARY GLAND TUMORS IN CONTROL FEMALE B6C3F1 MICE (a)
~~
Study Adenoma
Incidence i n Controls Carcinoma Adenoma or
Carcinoma
Historical Incidence for All Water Gavage Vehicle Controls
Iodinated glycerol (b) Chlorpheniramine maleate (c) Tetrakis(hydroxymethy1)phosphoniumchloride (cl Malonaldehyde, sodium salt (c) Tetrakis(hydroxymethy1)phosphonium sulfate (c) Methyl carbamate (d) Chlorinated trisodium phosphate (bl
4/46 5/46
11/50 2/43 8/43 9/49 8/45
1/46 0146 0150 0143 0143 0149 0145
5/46 5146
11/50 2/43 8/43 9/49 8/45
TOTAL SD (e)
Range (DHigh Low
471322 (14.6%) 6.36%
11/50 2143
11322 (0.3%) 0.82%
1/46 0150
481322 (14.9%) 6.08%
11/50 2/43
Overall Historical Incidence for Untreated Controls
TOTAL SD (e)
Range (DHigh Low
(g)23111,782 (13.0%) 10.20%
18/49 0148
(h)1311,782 (0.7%) 1.34%
3/50 0149
(g,h)24411,782 (13.7%) 10.58%
19/49 0148
(a) Data as of April 29,1987, for studies of a t least 104weeks (b)Study performed a t EG&G Mason Research Institute (c) Study performed a t Battelle Columbus Laboratories (d)Study performed a t Microbiological Associates (e) Standard deviation (0Range and SD are presented for groups of 35 or more animals. (g)Includes eight chromophobe adenomas (h) Includes three adenocarcinomas, NOS, and one chromophobe carcinoma
149 Iodinated Glycerol, NTP TR 340

TABLE D4b. HISTORICAL INCIDENCE O F HARDERIAN GLAND TUMORS IN CONTROL FEMALE B6C3F1 MICE (a)
Adenoma Study
Historical Incidence for All Water Gavage Vehicle Controls
Iodinated glycerol (b) 6150 Chlorpheniramine maleate (c) 2150 Tetrakis(hydroxymethy1)phosphoniumchloride (c) 0150 Malonaldehyde, sodium salt (c) 0150 Tetrakis(hydroxymethy1)phosphonium sulfate (c) 0150 Methyl carbamate (e) Chlorinated trisodium phosphate (b)
TOTAL SD (0
Range (g) HighLow
1150 0150
91350 (2.6%) 4.43%
6150 0150
Overall Historical Incidence for Untreated Controls
TOTAL SD (0
Range (g) High LOW
(h)4112,040 (2.0%) 2.06%
4150 0150
Incidence in Controls Carcinoma
0150 0150 0150 0150
(d)2/50 0150 1/50
31350 (0.9%) 1.57%
2150 0150
(i)712,040 (0.3%) 0.88%
2/50 0150
Adenoma or Carcinoma
6/50 2/50 0150 0150
(d)2/50 1/50 1/50
121350 (3.4%) 4.12%
6/50 0150
(h,i)4812,040 (2.4%) 2.19%
4/50 0150
(a)Data as of April 29,1987, for studies of a t least 104weeks (b)Study performed a t EG&G Mason Research Institute (c)Study performed a t Battelle Columbus Laboratories (d)Papillary adenocarcinomas (e)Study performed a t Microbiological Associates (0Standard deviation (g)Range and SD are presented for groups of 35 or more animals. (h)Includes three papillary adenomas, one cystadenoma, NOS,and two papillary cystadenomas, NOS (i) Includes one adenocarcinoma, NOS, two papillary adenocarcinomas, and one papillary cystadenocarcinoma, NOS
Iodinated Glycerol, NTP TR 340 150
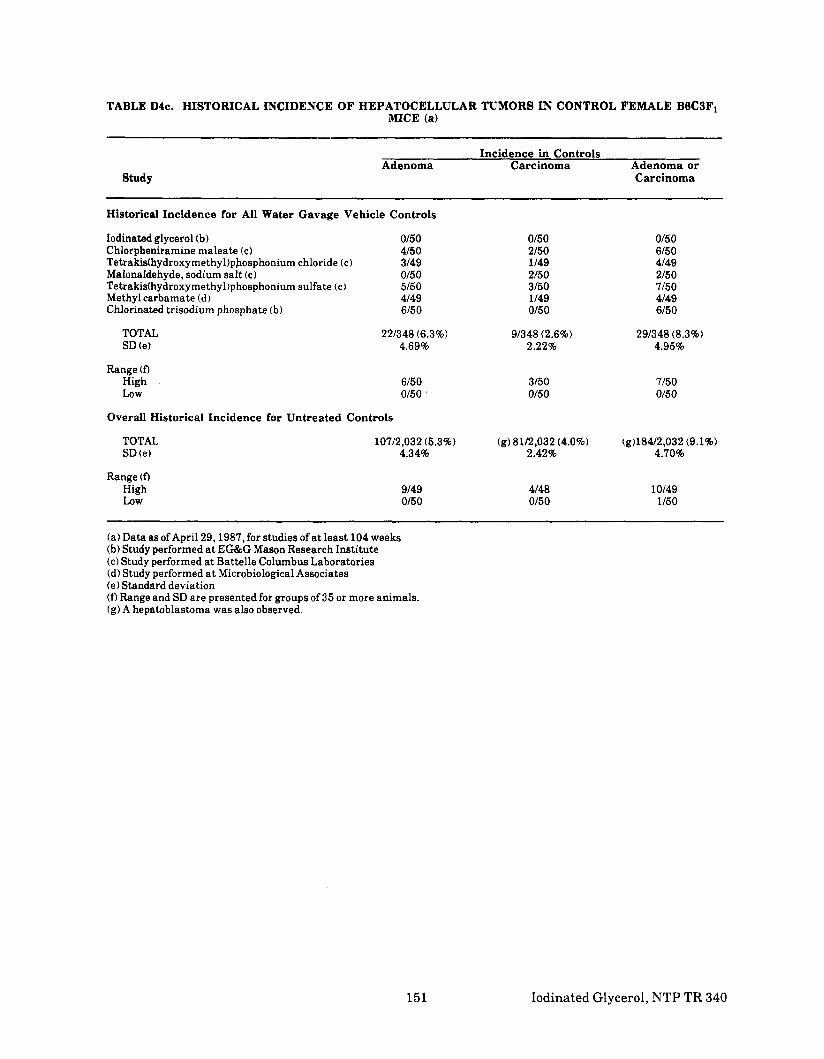
TABLE D ~ c . HISTORICAL INCIDENCE OF HEPATOCELLULAR TUMORS IN CONTROL FEMALE B6C3F1 MICE (a)
Study Adenoma
Incidence in Controls Carcinoma Adenoma or
Carcinoma
Historical Incidence for All Water Gavage Vehicle Controls
Iodinated glycerol (b) Chlorpheniramine maleate (c)
Malonaldehyde, sodium salt (c) Tetrakis(hydroxymethy1)phosphonium sulfate (c)
Chlorinated trisodium phosphate (b)
Tetrakis(hydroxymethy1)phosphoniumchloride (c)
Methyl carbamate (d)
0150 4/50
0150 5/50
6150
3/49
4/49
0150 2/50 1/49 2/50 3/50 1/49 0150
0150 6/50 4/49 2/50 7/50 4/49 6/50
TOTAL SD (et
221348 (6.3%) 4.69%
91348 (2.6%) 2.22%
291348 (8.3%) 4.95%
Range (0High LOW
6/50 0150
3150 0150
7/50 0150
Overall Historical Incidence for Untreated Controls
TOTAL SD (e)
10712,032 (5.3%) 4.34%
(g)8112,032 (4.0%) 2.42%
(g)184/2,032 (9.1%) 4.70%
Range (0High LOW
9/49 0150
4/48 0150
10149 1/50
(a) Data as of April 29.1987, for studies of a t least 104 weeks (b)Study performed at EG&G Mason Research Institute (c) Study performed a t Battelle Columbus Laboratories (d) Study performed a t Microbiological Associates (e) Standard deviation (0Range and SD are presented for groups of 35 or more animals. (g)A hepatoblastoma was also observed.
151 Iodinated Glycerol, NTP TR 340

TABLE D4d. HISTORICAL INCIDENCE OF STOMACH TUMORS IN CONTROL FEMALE B6C3F1 MICE (a)
No. No. of Study Examined Tumors Site Diagnosis
Historical Incidence for All Water Gavage Vehicle Controls
Iodinated glycerol (b) Tetrakis(hydroxymethy1)phosphonium chloride (c) Malonaldehyde, sodium salt (e) All others
49 49 46
195
1 2 1 0
Forestomach Forestomach Cardiac stomach _ _
Squamous cell papilloma Squamous cell papilloma Squamous cell papilloma _ _
TOTAL 339 4 (1.2%)
Overall Historical Incidence for Untreated Controls
1 3 3 9 1 1
Stomach, NOS Stomach, NOS Stomach, NOS Forestomach Cardiac stomach Stomach, NOS
Papilloma, NOS Papillomatoses Squamous cell papilloma Squamous cell papilloma Squamous cell papilloma Squamous cell carcinoma
TOTAL 1,994 18 (0.99)
(a)Data asof April 29,1987, for studies of at least 104 weeks; the greatest observed incidence in any control group is 4/50. (b)Study performed a t EG&G Mason Research Institute (c)Study performed a t Battelle Columbus Laboratories
Iodinated Glycerol, NTP TR 340 152

TABLE D5. SUMMARY OF THE INCIDENCE OF NONNEOPLASTIC LESIONS IN FEMALE MICE IN THE TWO-YEAR GAVAGE STUDY OF IODINATED GLYCEROL
Vehicle Control Low Dose High Dose
Animals initially in study Animals necropsied Animals examined histopathologically
50 50 50
50 50 50
50 50 50
INTEGUMENTARY SYSTEM *Skin
Ulcer, NOS Inflammation, chronic diffuse
(50) 1 (2%)
(50)
1 (2%)
(50)
RESPIRATORY SYSTEM
Inflammation, NOS
Inflammation, chronic
Congestion, NOS Hemorrhage Bronchopneumonia, NOS Inflammation, NOS
Metaplasia,NOS
#Nasopharynx
#Trachea
#Lung
#Lung/alveoli
(46)
(49)
(50)
5 (11%)
1 (2%)(50)
15 (30%)
(7)
(48)
(15)
1 (14%)
1 (2%)
1 (7%) 1 (7%) 1 (7%) 3 (20%)
(15)
(40)
(49)
(50)
4 (10%)
(50) 6 (12%)
HEMATOPOIETIC SYSTEM
Hyperplasia, lymphoid Hematopoiesis
#Bone marrow Fibrosis Hyperplasia, neutrophilic
Congestion, NOS Plasma cell infiltrate Infarct, focal Hemosiderosis Depletion, lymphoid Hyperplasia, lymphoid Hematopoiesis
Plasma cell infiltrate Histiocytosis
#Mediastinal lymph node Abscess, NOS Plasma cell infiltrate
#Lumbar lymph node Hyperplasia, NOS
#Mesenteric lymph node Congestion, NOS Inflammation, acute Plasma cell infiltrate Hyperplasia, NOS HistiocytosisHematopoiesis
#Renal lymph node Abscess, NOS Plasma cell infiltrate Hyperplasia, NOS
*Multiple organs
#Spleen
#Lymph node
(50)
5 (10%)
33 (67%) 4 (8%)
(49)
(50)
1 (2%)
2 (4%) 1 (3%) 3 (10%)
18 (58%)
4 (21%) (19)
(19)
(19)
1 (5%) 1 (5%)
(19) 1 (5%)
(50) 1 (2%) 7 (14%)
7 (64%)
(11)
(31)
1 (5%)
(19)
1 (5%)
(50)
2 (4%)
34 (68%) 5 (10%)
(50)
(50) 1 (2%)
2 (4%)
24 (48%) (47)
(47)
(47)
(47) 1 (2%) 1 (2%) 1 (2%)
(47)
153 Iodinated Glycerol, NTP TR 340

TABLE D5. SUMMARY O F THE INCIDENCE O F NONNEOPLASTIC LESIONS IN FEMALE MICE IN THE TWO-YEAR GAVAGE STUDY OF IODINATED GLYCEROL (Continued)
Vehicle Control Low Dose High Dose
HEMATOPOIETIC SYSTEM (Continued) #Inguinal lymph node
Inflammation, acute
Hematopoiesis
Hyperplasia, lymphoid
Hematopoiesis
Hyperplasia, lymphoid
#Liver
#Glandular stomach
#Adrenal
#Thymus
(48)
1 (2%)(50)
(49)
(49)
(41)
(19) 1 (5%)
1 (2%)
1 (2%)
1 (8%)
2 (29%)
(50)
(50)
(13)
(7)
(47)
(50)
(49)
(50)
(40)
CIRCULATORY SYSTEM #Inguinal lymph node
Lymphangiectasis #Lung
Perivasculitis #Heart
Mineralization Perivasculitis
Degeneration, NOS
Mineralization
Perivasculitis
Perivasculitis
#Myocardium
*Pulmonary artery
#Liver
#Urinary bladder
(19)
(15)
(11)
(11)
(50)
(50)
(11)
1 (5%)
1 (7%)
1 (9%)
6 (55%)
1 (2%)
2 (4%) (50)
1 (2%)
DIGESTIVE SYSTEM *Tooth
#Salivary gland
#Liver
Inflammation, acute
Inflammation, NOS
Inflammation, chronic Necrosis, focal Metamorphosis, fatty Cytoplasmic change, NOS Multinucleate giant cell
Inflammation, acute
Dilatation, NOS Inflammation, acute
Dilatatiodducts Inflammation, acute Fibrosis, focal Atrophy, NOS
#Stomach EctopiaUlcer, NOS
#Glandular stomach Mineralization Inflammation, NOS Ulcer, NOS
#Hepatic serosa
*Gallbladder
#Pancreas
3 (6%) 8 (16%)
(50)
(50)
(50)
1 (2%) 1 (2%)
1 (2%)
1 (2%)4 (8%) 1 (2%)
(49)
(49)
(50)
(11)
(50) 1 (9%)
9 (18%) 9 (18%)
15 (30%)
(50)
(50) 1 (2%)
2 (4%) 1 (2%)
(9)
1 (11%) 1 (11%)
(50) 1 (2%) 1 (2%)
(50)
5 (10%)
(50)
3 (6%) 13 (26%) 3 (6%) 1 (2%)
(50)
(50)
(49) 1 (2%)
(49)
1 (2%)
1 (2%) 2 (4%)
(49)
Iodinated Glycerol, NTP TR 340 154

TABLE DI. SUMMARY OF THE INCIDENCE OF NONNEOPLASTIC LESIONS IN FEMALE MICE IN THE TWO-YEAR GAVAGE STUDY OF IODINATED GLYCEROL (Continued)
Vehicle Control Low Dose High Dose
DIGESTIVE SYSTEM (Continued) #Forestomach
Inflammation, NOS Ulcer, NOS Abscess, NOS Hyperplasia, basal cell Hyperkeratosis Acanthosis
(49) 2 (4%)
1 (2%)
6 (12%) 5 (10%)
(50)
1 (2%)
1 (2%) 2 (4%) 4 (8%)
(49) 1 (2%)
3 (6%) 2 (4%)
URINARY SYSTEM
Mineralization Cast, NOS Glomerulonephritis, NOS Inflammation, NOS Scar NephropathyNecrosis, focal Metaplasia, osseous
Regeneration, NOS
Inflammation, chronic focal
#Kidney
XKidneyttubule
#Urinary bladder
(50)
47 (94%) 1 (2%) 1 (2%) 2 (4%)
(13)
9 (69%) 1 (8%)
1 (8%)
3 (27%)
(13)
(11)
(50) 5 (10%) 1 (2%)
48 (96%) 2 (4%)
1 (2%) 1 (2%) 1 (2%)
1 (2%)
3 (6%)
(50)
(50)
ENDOCRINE SYSTEM
Hyperplasia, focal
Cyst, NOS Hypertrophy, focal Hyperplasia, focal Hyperplasia, dif€use Angiectasis Vascularization
Inflammation, acute focal
Hyperplasia, NOS
Cytoplasmic vacuolization Focal cellular change
Hyperplasia, NOS
Inflammation, chronic focal Hyperplasia, C-cell Hyperplasia, follicular cell
#Thyroid follicle Dilatation, NOS
#ParathyroidEctopia
#Pituitary intermedia
#Anterior pituitary
#Adrenal
#Adrenal/capsule
#Adrenal cortex
#Adrenal medulla
#Thyroid
(47)
(47) 1 (2%)
1 (2%)
21 (45%)
2 (4%) 1 (2%)
1 (2%) (49)
(49)
(49)
(49)
(48)
2 (4%)
1 (2%)
2 (4%)
4 (8%)
1 (3%)
(48)
(35)
(13)
(48)
1 (2%)25 (52%)
11 (23%)(48)
(29)
(46)
(46) 2 (4%) 1 (2%)
18 (39%) 1 (2%) 1 (2%)
(50)
(50)
(50) 2 (4%)
(50)
(48) 1 (2%)
1 (2%)
35 (73%)
10 (21%)(48)
(24)
REPRODUCTIVE SYSTEM 'Mammary gland
Lactation *Clitoral gland
Dilatation, NOS Inflammation, NOS
Keratin pearl formation 'Vagina
155 Iodinated Glycerol, NTP TR 340

TABLE DS. SUMMARY OF THE INCIDENCE OF NONNEOPLASTIC LESIONS IN FEMALE MICE IN THE TWO-YEAR GAVAGE STUDY OF IODINATED GLYCEROL (Continued)
Vehicle Control Low Dose High Dose ~ ~~~
REPRODUCTIVE SYSTEM (Continued) #Uterus
Dilatation, NOS Pyometra Abscess, NOS Atrophy, NOS
#Uterus/endometrium Inflammation, acute Hyperplasia, cystic Metaplasia, squamous
#Tub0 ovarian site Abscess, NOS
#Ovary Cyst, NOS Congestion, NOS Inflammation, acute
(50)
1 3
(50)4
33
(50)5
(48)11
(2%) (6%)
(8%)(66%)
(10%)
(23%)
(27)1 3
(27)
19 2
(27)10
(29)14 1 1
(4%)(11%)
(70%) (7%)
(37%)
(48%)(3%) (3%)
(50) 1 (2%)
2 (4%)
1 (2%) 38 (76%)
2 (4%)
3 (6%)
17 (35%)
(50)
(50)
(49)
NERVOUS SYSTEM
Mineralization Deformity, NOS Hydrocephalus, NOS
Cytoplasmic vacuolization
#Brain
#Cerebellum
(50) 21 (42%)
2 (4%)(50)
(13)
1 (8%) 1 (8%)
(13)
(50)22 (44%)
(50)1 (2%)
SPECIAL SENSE ORGANS *Eye
#Harderian gland Synechia, anterior
Dilatation, NOS Inflammation, NOS Hyperplasia, NOS Hyperplasia, focal
(50)
(50)
36 (72%)
1 (2%)
(50)
(40) 1 (3%)
23 (58%) 1 (3%)
(50)
(50) 2 (4%)
30 (60%)
1 (2%)
MUSCULOSKELETAL SYSTEM None
BODY CAVITIES *Abdominal cavity
Inflammation, acute Abscess, NOS
Inflammation, acute Inflammation, acutekhronic
EmpyemaInflammation, acute
*Pericardium Inflammation, acute
*MesenteryInflammation, acutehhronic
*Peritoneum
*Pleura
(50 )
(50)1 (2%)
(50) 2 (4%)
(50)
(50) 2 (4%)
(50) 1 (2%)
(50) 2 (4%)
(50)
1 (2%)
1 (2%)
1 (2%)
(50)
(50)
(50 )
1 (2%) (50)
1 (2%) (50)
(50)
(50)
Iodinated Glycerol, NTP TR 340 156

TABLE D5. SUMMARY OF THE INCIDENCE OF NONNEOPLASTIC LESIONS IN FEMALE MICE IN THE TWO-YEAR GAVAGE STUDY OF IODINATED GLYCEROL (Continued)
Vehicle Control Low Dose High Dose
ALL OTHER SYSTEMS *Multiple organs
Omentum
Plasma cell infiltrate Inflammation, chronic focal
(50)
40 (80%)
(50) 1 (2%) 5 (10%)
(50)
40 (80%)
Necrosis, fat 2 2 1
SPECIAL MORPHOLOGY SUMMARY None
* Number of animals receiving complete necropsy examination; all gross lesions including masses examined microscopically. # Number of animals examined microscopically a t this site
157 Iodinated Glycerol, NTP TR 340

Iodinated Glycerol, NTP TR 340 158

APPENDIX E
SENTINEL ANIMAL PROGRAM
PAGE
TABLE E l MURINE ANTIBODY DETERMINATIONS FOR RATS AND MICE IN THE TWO-YEAR GAVAGE STUDIES OF IODINATED GLYCEROL 161
159 Iodinated Glycerol, NTP TR 340

APPENDIX E. SENTINEL ANIMAL PROGRAM
Methods
Rodents used in the Carcinogenesis Program of the National Toxicology Program are produced in op- timally clean facilities to eliminate potential pathogens that may affect study results. The Sentinel Animal Program ispart of the periodic monitoring of animal health that occurs during the toxicologic evaluation of chemical compounds. Under this program, the disease state of the rodents is monitored via serology on sera from extra (sentinel) animals in the study rooms. These animals are untreated, and these animals and the study animals are both subject to identical environmental conditions. The sentinel animals come from the same production source and weanling groups as the animals used for the studies of chemical compounds.
Fifteen B6C3F1 mice and 15 F344/N rats of each sex were selected a t the time of randomization and allocation of the animals to the various study groups. Five animals of each designated sentinel group were killed at 6,12, and 18months on study, Data from animals surviving 24 months were collected from 5/50 randomly selected control animals of each sex and species. The blood from each animal was collected and clotted, and the serum was separated. The serum was cooled on ice and shipped to Microbiological Associates’ Comprehensive Animal Diagnostic Service for determination of the anti- body titers. The following tests were performed:
Hemagglutination Inhibition
Complement Fixation ELISA
Mice PVM (pneumonia virus of mice) Reo 3 (reovirus type 3)
M. Ad, (mouse adenovirus) LCM (lymphocytic
MHV (mouse hepatitis virus)
GDVII (Theiler’s choriomeningitis virus) M . pul . (Mycoplasma encephalomyelitis virus) pulmonis)
Poly (polyoma virus) MVM (minute virus of mice) Ectro (infectious ectromelia) Sendai
Rats PVM RCV (rat coronavirus) M . pul . KRV (Kilham rat virus) H-1 (Toolan’s H-1 virus) Sendai
Results
Results are presented in Table E l .
Iodinated Glycerol, NTP TR 340 160

TABLE E l . MURINE ANTIBODY DETERMINATIONS FOR RATS AND MICE IN THE TWO-YEAR GAVAGE STUDIES OF IODINATED GLYCEROL (a)
Interval (months) No. of
Animals Positive Serologic
Reaction for
RATS
6 None positive
12 9/10 Sendai
18 9/10 Sendai
24 8/10 4/10
518
PVM Sendai M. pul.ib)
MICE
6 None positive
12 10/10 Sendai
18 515 Sendai 1I5 MHV
24 1I5 8110
M.pul.ib) Sendai
2/10 MHV
(a)Blood samples were taken from sentinel animals at 6,12, and 18 months after the start of dosing and from the vehicle control animals just before they were killed; samples were sent to Microbiological Associates (Bethesda, MD)for determination of antibody titers. (b)Further evaluation of this assay indicated that i t was not specific for M.pulmonis,and these results were considered to be false positive.
161 Iodinated Glycerol, NTP TR 340

162Iodinated Glycerol, NTP TR 340

APPENDIX F
INGREDIENTS, NUTRIENT COMPOSITION, AND
CONTAMINANT LEVELS IN
NIH 07 RAT AND MOUSE RATION
Meal Diet: April 1981 to April 1983 (Manufactured by Zeigler Bros., Inc., Gardners, PA)
PAGE
TABLE F1 INGREDIENTS OF NIH 07 RAT AND MOUSE RATION 164
TABLE F2 VITAMINS AND MINERALS IN NIH 07 RAT AND MOUSE RATION 164
TABLE F3 NUTRIENT COMPOSITION OF NIH 07 RAT AND MOUSE RATION 165
TABLE F4 CONTAMINANT LEVELS IN NIH 07 RAT AND MOUSE RATION 166
163 Iodinated Glycerol, NTP TR 340

TABLE F1. INGREDIENTS OF NIH
Ingredients (b)
Ground X2 yellow shelled corn Ground hard winter wheat Soybean meal (49% protein)Fishmeal (60% protein) Wheat middlings Dried skim milk Alfalfa meal (dehydrated, 17% protein)Corn gluten meal (60%protein)Soy oil Dried brewer’s yeast D 4 molasses Dicalcium phosphate Ground limestone Salt Premixes (vitamin and mineral)
(a)NCI, 1976; NIH, 1978 (b)Ingredients ground to pass through a U.S.Standard Screen No. 16before being mixed
TABLE F2. VITAMINS AND MINERALS IN NIH 07 RAT AND MOUSE RATION (a)
Vitamins
A D3 K3 d-a-Tocopheryl acetate Choline Folic acid Niacin d-Pantothenic acid Riboflavin Thiamine B12 PyridoxineBiotin
Minerals
Iron ManganeseZinc CopperIodine Cobalt
Amount
5,500,000 IU 4,600,000IU
2.8 g 20,000 IU
560.0 g 2.2 g30.0g 18.0 g3.4g
10.0 g 4,000 pg
1.7 g 140.0 mg
120.0 g 60.0 g 16.0 g 4.0 g 1.4 g 0.4 g
07 RAT AND MOUSE RATION (a)
Percent by Weight
24.50 23.00 12.00 10.00 10.00 5.00 4.00 3.00 2.50 2.00 1.50 1.25 0.50 0.50 0.25
(a)Per ton (2,000 lb) of finished product
Iodinated Glycerol, NTP TR 340 164
Source
Stabilized vitamin A palmitate or acetate D-activated animal sterol Menadione
Choline chloride
d-Calcium pantothenate
Thiamine mononitrate
Pyridoxine hydrochloride d-Biotin
Iron sulfate Manganous oxide Zinc oxide Copper sulfate Calcium iodate Cobalt carbonate

TABLE F3. NUTRIENT COMPOSITION OF NIH 07 RAT AND MOUSE RATION (a)
Mean f Standard Nutrients Deviation Range Number of Samples
~ ~ ~~
Crude protein (percent by weight) 24.19f 1.07 22.4-26.3 25 Crude fat (percent by weight) 5.02 f 0.47 4.2-6.0 25 Crude fiber (percent by weight) 3.37 f 0.37 2.4-4.2 25 Ash (percentby weight) 6.54f 0.26 5.97-7.03 25
Amino Acids (percent of total diet) (a)
Arginine 1.300 1.21 -1.38 3 Cystine 0.340 0.23-0.40 3 Glycine 1.137 1.06-1.20 3 Histidine 0.561 0.530-0.578 3 Isoleucine 0.899 0.881-0.934 3 Leucine 1.930 1.85-1.98 3 Lysine 1.243 1.20-1.30 3 Methionine 0.329 0.306-0.368 3 Phenylalanin 0.991 0.960-1.04 3 Threonine 0.851 0.827-0.886 3 Tryptophan 0.187 0,171-0.211 3 Tyrosine 0.647 0.566-0.769 3 Valine 1.090 1.05-1.12 3
Essential Fatty Acids (percent of total diet) (a)
Linoleic 2.40 2.37-2.44 2 Linolenic 0.284 0.259-0.308 2
Vitamins (a)
Vitamin A (IUkg) 11,936f 2,547 8,900-22,000 25 Vitamin D ( IUkg) 5,220 4,140-6,300 2 a-Tocopherol (ppm) 39.1 31.1-44.0 3 Thiamine (ppm) 18.7k 3.20 14.0-26.0 (b)24 Riboflavin (ppm) 7.3 6.1-8.1 3 Niacin (ppm) 82 65-97 3 Pantothenic acid (ppm) 30.2 23.0-30.5 3 Pyridoxine (ppm) 7.7 5.6-8.8 3 Folic acid (ppm) 2.5 1.8-3.4 3 Biotin (ppm) 0.27 0.21-0.32 3 Vitamin B,~(ppb) 21.2 10.6-38.0 3 Choline (ppm) 3,337 3,200-3,430 3
Minerals (a)
Calcium (percent) 1.22 k 0.10 1.10-1.45 25 Phosphorus (percent) 0.96 k 0.05 0.84-1.10 25 Potassium (percent) 0.809 0.772-0.846 2 Chloride (percent) 0.581 0.479-0.635 3 Sodium(percent) 0.307 0.258-0.349 3 Magnesium (percent) 0.165 0.151-0.177 3 Sulfur (percent) 0.292 0.270-0.290 3 lron (ppm) 420 409-431 3 Manganese (ppm) 87.7 81.7-95.5 3 Zinc (ppm) 52.1 46.1-56.0 3 Copper (ppm) 11.15 8.09-15.70 3 Iodine (ppm) 2.66 1.52-3.64 3 Chromium (ppm) 1.72 1.44-1.93 3 Cobalt (ppm) 0.64 0.49-0.78 3
(a) Two or three lots of feed analyzed for nutrients reported in this table were manufactured in 1983or 1984. (b) One lot (7/22/81)not analyzed for thiamine
165 Iodinated Glycerol, NTP TR 340
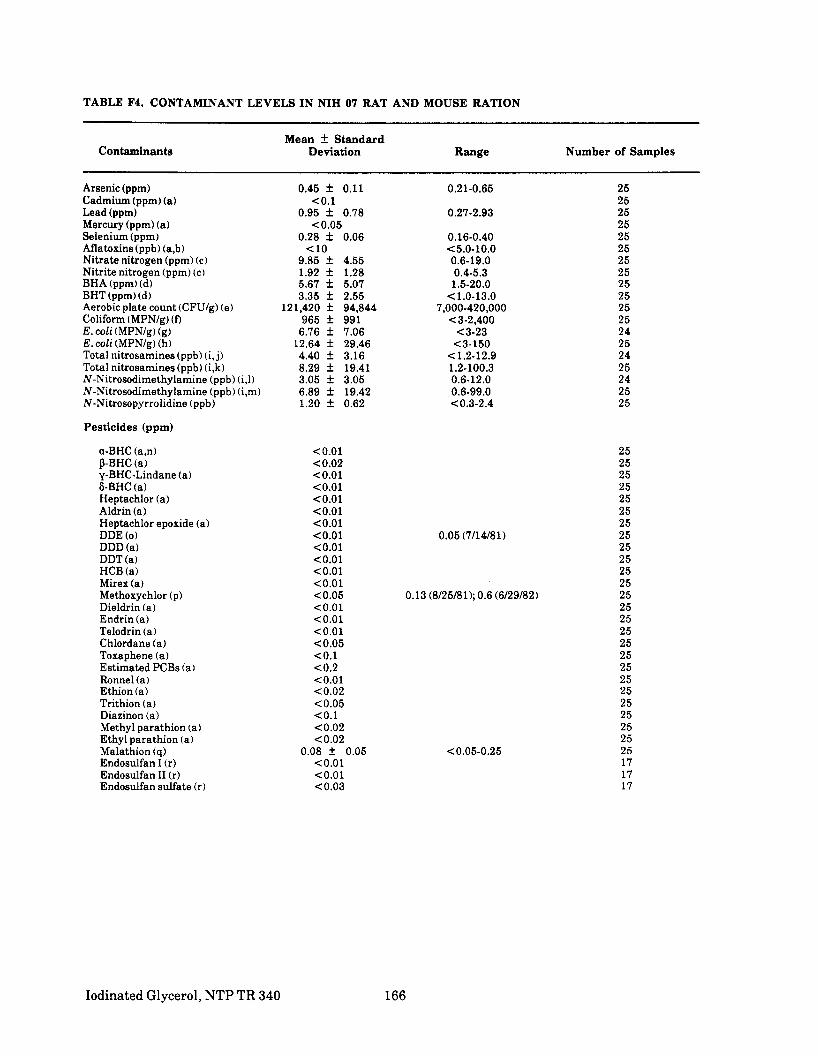
TABLE F4. CONTAMINANT LEVELS IN NIH 07 RAT AND MOUSE RATION
Mean f Standard Contaminants Deviation Range Number of Samples
Arsenic (ppm) Cadmium (ppm) (a) Lead (ppm) Mercury (ppm) (a)Selenium (ppm) Aflatoxins (ppb) (a,b) Nitrate nitrogen (ppm) (c) Nitrite nitrogen (ppm) (c) BHA (ppm) (d) BHT (ppm) (d)Aerobic plate count (CFUlg) (e) Coliform (MPN/g) (DE. coli (MPN/g) (g) E. coli (MPNlg) (h) Total nitrosamines (ppb) (i,j ) Total nitrosamines (ppb) (i,k) N-Nitrosodimethylamine (ppb) (i,l) N-Nitrosodimethylamine (ppb) (i,m) N-Nitrosopyrrolidine (ppb)
Pesticides (ppm)
a-BHC (a,n) D-BHC (a) y-BHC-Lindane (a) 8-BHC (a)Heptachlor (a) Aldrin (a) Heptachlor epoxide (a) DDE ( 0 )
DDD (a) DDT (a) HCB (a) Mirex (a) Methoxychlor (p) Dieldrin (a) Endrin (a) Telodrin (a) Chlordane (a) Toxaphene (a) Estimated PCBs (a ) Ronnel (a)Ethion (a) Trithion (a) Diazinon (a) Methyl parathion (a) Ethyl parathion (a) Malathion (q) Endosulfan I (r)Endosulfan II (r)Endosulfan sulfate (r)
0.45 f 0.11 <0.1
0.95 f 0.78 <0.05
0.28 f 0.06 <10
9.85 f 4.55 1.92 k 1.28 5.67 f 5.07 3.35 f 2.55
121,420 5 94,844 965 f 991
6.76 f 7.06 12.64 f 29.46 4.40 k 3.16 8.29 f 19.41 3.05 f 3.05 6.89 f 19.42 1.20 k 0.62
<0.01 <0.02 <0.01 <0.01 <0.01 co.01 <0.01 <0.01 <0.01 <0.01 <0.01 <0.01 <0.05 <0.01 <0.01 <0.01 <0.05 <0.1 <0.2 <0.01 (0.02 <0.05 <0.1 <0.02 <0.02
0.08 f 0.05 <0.01 <0.01 <0.03
0.21-0.65
0.27-2.93
0.16-0.40 <5.0- 10.0 0.6-19.0 0.4-5.3 1.5-20.0
<1.0-13.0 7,000-420,000 C3-2,400
<3-23 <3-150
<1.2-12.9 1.2-100.3 0.6-12.0 0.6-99.0 <0.3-2.4
0.05 (7/14/81)
0.13 (8125181); 0.6 (6129182)
<0.05-0.25
25 25 25 25 25 25 25 25 25 25 25 25 24 25 24 25 24 25 25
25 25 25 25 25 25 25 25 25 25 25 25 25 25 25 25 25 25 25 25 25 25 25 25 25 25 17 17 17
Iodinated Glycerol, NTP TR 340 166

TABLE F4. CONTAMINANT LEVELS IN NIH 07 RAT AND MOUSE RATION (Continued)
(a)All values were lees than the detection limit, given in the table as the mean. 6)The detection limit was reduced from 10 ppb to 5 ppb after 7/81. (c)Source of contamination: alfalfa, grains, and fish meal (d)Source of contamination: soy oil and fish meal (e)CFU = colony-forming unit (0MPN = most probable number (g)Mean, standard deviation, and range exclude one high value of 150obtained for the lot produced on 8/26/82. (h)Mean, standard deviation, and range include the high value given in footnote (g). (i)All values were corrected for percent recovery. c j ) Mean, standard deviation, and range exclude one value of 100.3 obtained for the lot produced on 4/27/81.(k)Mean, standard deviation, and range include the high value given in footnote Cj). (1) Mean, standard deviation, and range exclude one high value of 99.0obtained for the lot produced on 4/27/81.(m)Mean, standard deviation, and range include the high value given in footnote (1). (n)BHC = hexachlorocyclohexaneor benzene hexachloride (0 )One observation was above the detection limit. The value and the date it was obtained are listed under the range. (p)Two observations were above the detection limit. The values and the dates they were obtained are listed under the range. (q)Ten lots contained more than 0.05 ppm. (r) Analysis for endosulfan I, endosulfan II, and endosulfan sulfate was started on 12/23/81.
167 Iodinated Glycerol, NTP TR 340

Iodinated Glycerol, NTP TR 340 168

APPENDIX G
AUDIT SUMMARY
169 Iodinated Glycerol, NTP TR 340

APPENDIX G. AUDIT SUMMARY
The pathology specimens, experimental data, study documents, and draft NTP Technical Report No. 340 for the 2-year studies of iodinated glycerol in rats and mice were audited for the National Insti- tute of Environmental Health Sciences (NIEHS) a t the National Toxicology Program (NTP) Archives by Dynamac Corporation. The audits included review of
All records concerning animal receipt, quarantine, randomization, and disposition prior to study start.
All inlife records including protocol, correspondence, animal husbandry, environmental condi- tions, dosing, external masses, mortality, animal identification, and serology.
Body weight and clinical observation data; all data were scanned before individual data for a random 10%sample of animals in each study group were reviewed in detail.
All chemistry records.
All postmortem records for individual animals concerning date of death, disposition code, condi- tiun code, tissue accountability, correlation of masses or clinical signs recorded a t the last inlife observation with gross observations and microscopic diagnoses, and correlations between gross observations and microscopic diagnoses.
All wet tissue bags for inventory, and wet tissues from a random 20% sample of animals in each study group, plus other relevant cases, to evaluate the integrity of individual animal identity and to examine for untrimmed potential lesions.
Blocks and slides of tissues from a random 20% sample of animals from each study group, plus animals with less than complete or correct identification.
Necropsy record forms for data entry errors, and correlation between original, updated, and final microscopic diagnoses for a random 10% sample of animals to verify computer data entry of all diagnoses.
Correlation between the data, factual information, and procedures for the 2-year studies pre- sented in the draft Technical Report and the records available at the NTP Archives.
Procedures and events during the exposure phase of the studies were documented adequately by the archival records, with the exception of some or all of the records for observations during quarantine, disposition of surplus animals, balance calibration, cage and rack changes, relative humidity measurements for 52 days, room light cycle, and room air changes. Records documented that doses were prepared, stored, analyzed, and administered to animals properly. Recalculation of group mean body weights for 20% of the measurement dates plus 4 possible outlier values showed 4 errors of small magnitude (2.2% to 4.9%)out of 97 values checked. Observations of clinical signs and masses were made consistently. Of the masses noted in the inlife records, 63/70 in rats and 54/55 in mice cor- related with necropsy observations. Survival records for all unscheduled-death animals were re- viewed and found to be complete and accurate.
Individual animal identifiers (marked ears) were present and correct for 64/72 rats and 57/78 mice ex- amined. Review of data trails for animals with less than complete and correct wet tissue identifiers indicated that the integrity of individual identity had been preserved for all of the rats and for all but four mice. From comparison of the evidence of lesions and gender present in the residual tissues with written study records, it appeared that tissue bags for one pair of low dose male mice may have been cross-labeled and that a second pair of low dose male mice may have been exchanged a t the time of
Iodinated Glycerol, NTP TR 340 170

APPENDIX G. AUDIT SUMMARY
necropsy; there was no evidence to indicate that animals in the studies had been mixed up prior to necropsy or between study groups. Residual wet tissues contained 15 untrimmed potential lesions in 72 rats and 4 in 78 mice examined; the untrimmed potential lesions involved a variety of organs and were distributed across all study groups of rats and in high dose groups of mice. The comparison be-tween gross observations recorded at necropsy or trimming and microscopic diagnoses revealed 7 non-correlations in rats and 12 in mice, distributed across organs and study groups. Tissue blocks and slides were labeled correctly and corresponding sections matched.
Full details about these and other audit findings are presented in audit reports on file at the NIEHS. In conclusion, the data and factual information in the draft Technical Report are supported by the study records a t the NTP Archives.
171 Iodinated Glycerol, NTP TR 340
'U.S. a 3 V E R N M M PRIWl'ING OFFICE : 1990 0 - 265-776 : QL 3