toxicology and carcinogenesis studies of oxazepam · ntp technical report on the. toxicology and...
TRANSCRIPT
NTP TECHNICAL REPORT
ON THE
TOXICOLOGY AND CARCINOGENESIS
STUDIES OF OXAZEPAM
(CAS NO. 604-75-1)
IN F344/N RATS
(FEED STUDIES)
NATIONAL TOXICOLOGY PROGRAM P.O. Box 12233
Research Triangle Park, NC 27709
October 1998
NTP TR 468
NIH Publication No. 99-3958
U.S. DEPARTMENT OF HEALTH AND HUMAN SERVICES Public Health Service
National Institutes of Health
FOREWORD
The National Toxicology Program (NTP) is made up of four charter agencies of the U.S. Department of Health and Human Services (DHHS): the National Cancer Institute (NCI), National Institutes of Health; the National Institute of Environmental Health Sciences (NIEHS), National Institutes of Health; the National Center for Toxicological Research (NCTR), Food and Drug Administration; and the National Institute for Occupational Safety and Health (NIOSH), Centers for Disease Control. In July 1981, the Carcinogenesis Bioassay Testing Program, NCI, was transferred to the NIEHS. The NTP coordinates the relevant programs, staff, and resources from these Public Health Service agencies relating to basic and applied research and to biological assay development and validation.
The NTP develops, evaluates, and disseminates scientific information about potentially toxic and hazardous chemicals. This knowledge is used for protecting the health of the American people and for the primary prevention of disease.
The studies described in this Technical Report were performed under the direction of the NIEHS and were conducted in compliance with NTP laboratory health and safety requirements and must meet or exceed all applicable federal, state, and local health and safety regulations. Animal care and use were in accordance with the Public Health Service Policy on Humane Care and Use of Animals. The prechronic and chronic studies were conducted in compliance with Food and Drug Administration (FDA) Good Laboratory Practice Regulations, and all aspects of the chronic studies were subjected to retrospective quality assurance audits before being presented for public review.
These studies are designed and conducted to characterize and evaluate the toxicologic potential, including carcinogenic activity, of selected chemicals in laboratory animals (usually two species, rats and mice). Chemicals selected for NTP toxicology and carcinogenesis studies are chosen primarily on the bases of human exposure, level of production, and chemical structure. The interpretive conclusions presented in this Technical Report are based only on the results of these NTP studies. Extrapolation of these results to other species and quantitative risk analyses for humans require wider analyses beyond the purview of these studies. Selection per se is not an indicator of a chemical’s carcinogenic potential.
Listings of all published NTP reports and ongoing studies are available from NTP Central Data Management, NIEHS, P.O. Box 12233, MD E1-02, Research Triangle Park, NC 27709 (919-541-3419). The Abstracts and other study information for 2-year studies are also available at the NTP’s World Wide Web site: http://ntp-server.niehs.nih.gov.

NTP TECHNICAL REPORT
ON THE
TOXICOLOGY AND CARCINOGENESIS
STUDIES OF OXAZEPAM
(CAS NO. 604-75-1)
IN F344/N RATS
(FEED STUDIES)
NATIONAL TOXICOLOGY PROGRAM P.O. Box 12233
Research Triangle Park, NC 27709
October 1998
NTP TR 468
NIH Publication No. 99-3958
U.S. DEPARTMENT OF HEALTH AND HUMAN SERVICES Public Health Service
National Institutes of Health
2 Oxazepam, NTP TR 468
CONTRIBUTORS
National Toxicology Program Evaluated and interpreted results and reported findings
J.R. Bucher, Ph.D., Study Scientist D.A. Bridge, B.S. R.E. Chapin, Ph.D. J.R. Hailey, D.V.M. J.K. Haseman, Ph.D. R.A. Herbert, D.V.M., Ph.D. R.R. Maronpot, D.V.M. G.N. Rao, D.V.M., Ph.D. J.H. Roycroft, Ph.D. C.S. Smith, Ph.D. G.S. Travlos, D.V.M. D.B. Walters, Ph.D. K.L. Witt, M.S., Oak Ridge Associated Universities
Battelle Columbus Laboratories Conducted studies, evaluated pathology findings
P.J. Kurtz, Ph.D., Principal Investigator M. Hejtmancik, Ph.D. M.J. Ryan, D.V.M., Ph.D.
Experimental Pathology Laboratories, Inc. Provided pathology quality assurance
J.F. Hardisty, D.V.M., Principal Investigator C.C. Shackelford, D.V.M., M.S., Ph.D.
Dynamac Corporation Prepared quality assurance audits
S. Brecher, Ph.D., Principal Investigator
NTP Pathology Working Group Evaluated slides, prepared pathology report on rats (3 April 1996)
D.G. Goodman, V.M.D., Chairperson PATHCO, Inc.
R. Brown, D.V.M. Glaxo-Wellcome
J.R. Hailey, D.V.M. National Toxicology Program
R.A. Herbert, D.V.M., Ph.D. National Toxicology Program
A. Nyska, D.V.M. National Toxicology Program
A. Radovsky, D.V.M., Ph.D. National Toxicology Program
C.C. Shackelford, D.V.M., M.S., Ph.D. Experimental Pathology Laboratories, Inc.
Analytical Sciences, Inc. Provided statistical analyses
R.W. Morris, M.S., Principal Investigator S.R. Lloyd, M.S. N.G. Mintz, B.S.
Biotechnical Services, Inc. Prepared Technical Report
S.R. Gunnels, M.A., Principal Investigator J.M. Gregory, B.S. L.M. Harper, B.S. A.M. Macri-Hanson, M.A., M.F.A.
3
CONTENTS
ABSTRACT . . . . . . . . . . . . . . . . . . . . . . . . . . . . . . . . . . . . . . . . . . . . . . . . . . . . . . . . . . . . . 5
EXPLANATION OF LEVELS OF EVIDENCE OF CARCINOGENIC ACTIVITY . . . . . . . . . . . . . 9
TECHNICAL REPORTS REVIEW SUBCOMMITTEE . . . . . . . . . . . . . . . . . . . . . . . . . . . . . . . . 10
SUMMARY OF TECHNICAL REPORTS REVIEW SUBCOMMITTEE COMMENTS . . . . . . . . . . 11
INTRODUCTION . . . . . . . . . . . . . . . . . . . . . . . . . . . . . . . . . . . . . . . . . . . . . . . . . . . . . . . . . 13
MATERIALS AND METHODS . . . . . . . . . . . . . . . . . . . . . . . . . . . . . . . . . . . . . . . . . . . . . . . . 21
RESULTS . . . . . . . . . . . . . . . . . . . . . . . . . . . . . . . . . . . . . . . . . . . . . . . . . . . . . . . . . . . . . . . 29
DISCUSSION AND CONCLUSIONS . . . . . . . . . . . . . . . . . . . . . . . . . . . . . . . . . . . . . . . . . . . . 47
REFERENCES . . . . . . . . . . . . . . . . . . . . . . . . . . . . . . . . . . . . . . . . . . . . . . . . . . . . . . . . . . . 51
APPENDIX A Summary of Lesions in Male Rats in the 2-Year Feed Study of Oxazepam . . . . . . . . . . . . . . . . . . . . . . . . . . . . . . . . . . . . . . . . . . . . . . . . . 61
APPENDIX B Summary of Lesions in Female Rats in the 2-Year Feed Study of Oxazepam . . . . . . . . . . . . . . . . . . . . . . . . . . . . . . . . . . . . . . . . . . . . . . . . . 109
APPENDIX C Genetic Toxicology . . . . . . . . . . . . . . . . . . . . . . . . . . . . . . . . . . . . . . . . . . . . . 147
APPENDIX D Chemical Characterization and Dose Formulation Studies . . . . . . . . . . . . . . . . . . . 155
APPENDIX E Feed and Compound Consumption in the 2-Year Feed Studies of Oxazepam . . . . . . 163
APPENDIX F Ingredients, Nutrient Composition, and Contaminant Levels in NIH-07 Rat and Mouse Ration . . . . . . . . . . . . . . . . . . . . . . . . . . . . . . . . . . . . . . . . . . . . . . 169
APPENDIX G Sentinel Animal Program . . . . . . . . . . . . . . . . . . . . . . . . . . . . . . . . . . . . . . . . . 173
APPENDIX H Early Responses of F344/N Rats to Oxazepam . . . . . . . . . . . . . . . . . . . . . . . . . . . 175

4 Oxazepam, NTP TR 468
5
ABSTRACT
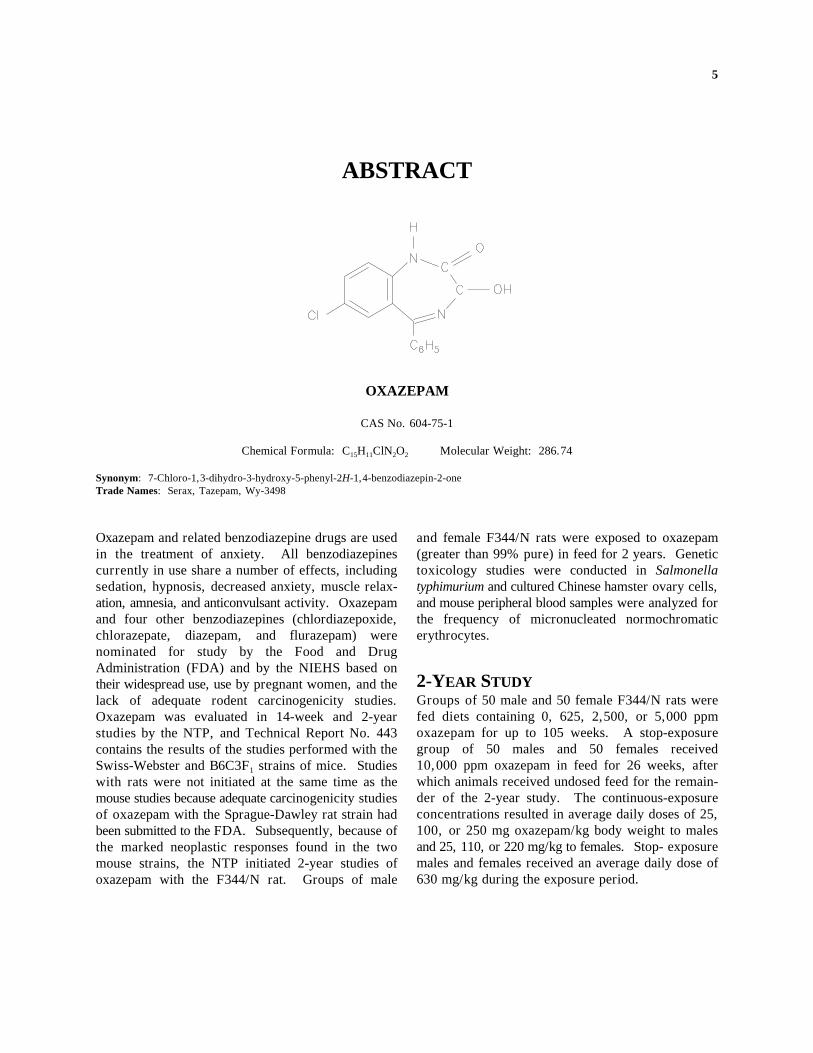
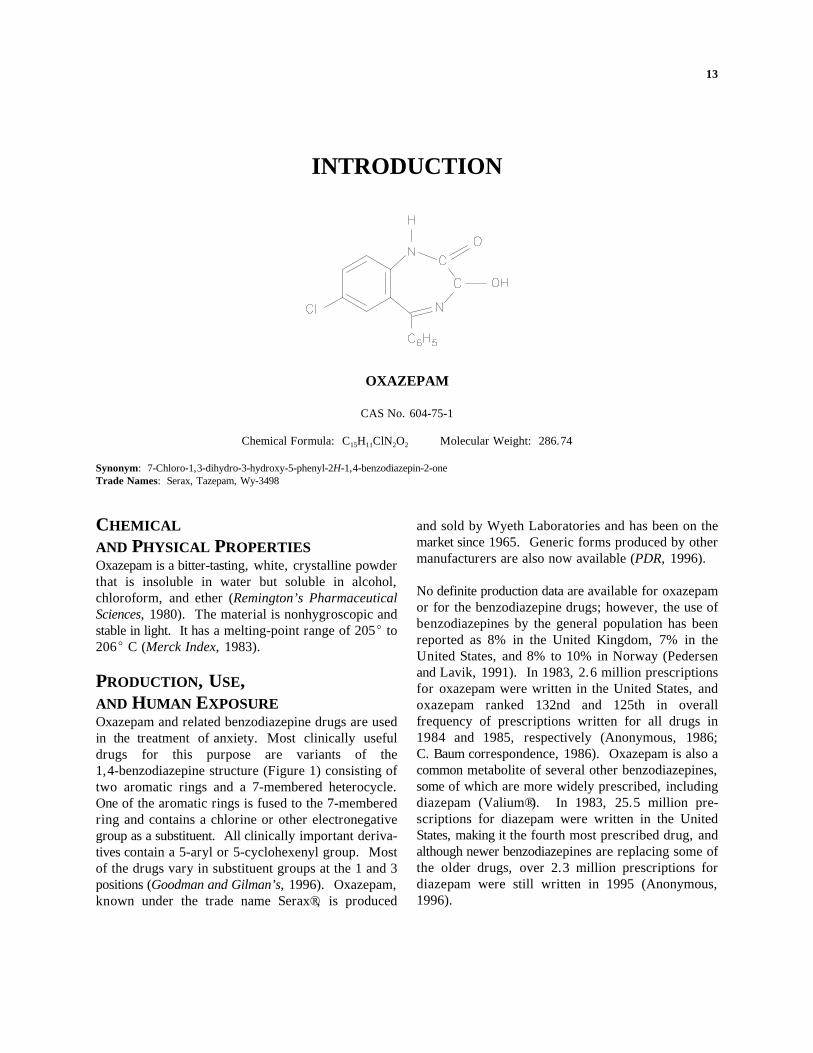
OXAZEPAM
CAS No. 604-75-1
Chemical Formula: C H ClN O Molecular Weight: 286.7415 11 2 2
Synonym: 7-Chloro-1,3-dihydro-3-hydroxy-5-phenyl-2H-1,4-benzodiazepin-2-one Trade Names: Serax, Tazepam, Wy-3498
Oxazepam and related benzodiazepine drugs are used in the treatment of anxiety. All benzodiazepines currently in use share a number of effects, including sedation, hypnosis, decreased anxiety, muscle relaxation, amnesia, and anticonvulsant activity. Oxazepam and four other benzodiazepines (chlordiazepoxide, chlorazepate, diazepam, and flurazepam) were nominated for study by the Food and Drug Administration (FDA) and by the NIEHS based on their widespread use, use by pregnant women, and the lack of adequate rodent carcinogenicity studies. Oxazepam was evaluated in 14-week and 2-year studies by the NTP, and Technical Report No. 443 contains the results of the studies performed with the Swiss-Webster and B6C3F strains of mice. Studies 1
with rats were not initiated at the same time as the mouse studies because adequate carcinogenicity studies of oxazepam with the Sprague-Dawley rat strain had been submitted to the FDA. Subsequently, because of the marked neoplastic responses found in the two mouse strains, the NTP initiated 2-year studies of oxazepam with the F344/N rat. Groups of male
and female F344/N rats were exposed to oxazepam (greater than 99% pure) in feed for 2 years. Genetic toxicology studies were conducted in Salmonella typhimurium and cultured Chinese hamster ovary cells, and mouse peripheral blood samples were analyzed for the frequency of micronucleated normochromatic erythrocytes.
2-YEAR STUDY Groups of 50 male and 50 female F344/N rats were fed diets containing 0, 625, 2,500, or 5,000 ppm oxazepam for up to 105 weeks. A stop-exposure group of 50 males and 50 females received 10,000 ppm oxazepam in feed for 26 weeks, after which animals received undosed feed for the remainder of the 2-year study. The continuous-exposure concentrations resulted in average daily doses of 25, 100, or 250 mg oxazepam/kg body weight to males and 25, 110, or 220 mg/kg to females. Stop- exposure males and females received an average daily dose of 630 mg/kg during the exposure period.
6 Oxazepam, NTP TR 468
Survival, Body Weights, and Clinical Findings All 5,000 ppm continuous-exposure and 10,000 ppm stop-exposure males died before the end of the study. Survival of 2,500 ppm continuous-exposure males and females was significantly less than that of the controls. The mean body weight gains of 2,500 and 5,000 ppm males and females were less than those of the controls throughout the study. The mean body weights of 10,000 ppm stop-exposure males were generally less than those of the controls throughout the study; those of 10,000 ppm stop-exposure females were less than those of the controls during the exposure portion of the study but increased steadily after the cessation of dosing at week 27. Feed consumption by exposed groups was similar to that by the controls after week 1 of the study. Treatment-related eye/nasal discharge, hyperactivity when handled, and/or ataxia were observed in exposed male and female rats on or about day 2 of exposure but were no longer apparent after day 7.
Plasma Oxazepam Determinations Plasma oxazepam concentrations were measured at the end of the study. The concentrations ranged from approximately 0.5 (625 ppm males) to 2.8 Fg/mL (5,000 ppm females).
Pathology Findings In the standard histopathologic evaluation, the incidence of renal tubule adenoma was slightly increased in male rats exposed to 2,500 ppm and was at the upper limit of the historical control range for this neoplasm in 2-year NTP feed studies. In an extended evaluation (step section) of the kidneys of male rats, the incidences of renal tubule adenoma occurred with a positive trend in exposed groups. In standard and step sections (combined), male rats exposed to 2,500
or 5,000 ppm showed a significant increase in the incidences of renal tubule adenoma and hyperplasia. In addition, the incidences of renal tubule adenoma and hyperplasia were significantly increased in the 10,000 ppm stop-exposure group. The incidences of nephropathy in continuously exposed female rats were significantly greater than in the controls, and the severity of nephropathy increased with increasing exposure concentration in males.
The incidences of epithelial hyperplasia and chronic inflammation of the forestomach in males exposed to 2,500 and 5,000 ppm and of ulcers in 2,500 ppm males were significantly greater than in the controls. Incidences of mineralization of the glandular stomach in 5,000 ppm and 10,000 ppm (stop-exposure) males and of erosion of the duodenum in 5,000 ppm males were significantly greater than in the controls. Female rats exposed to 2,500 ppm had greater incidences of epithelial hyperplasia, chronic inflammation, and ulcers of the forestomach and of erosion in the glandular stomach.
Centrilobular hepatocyte hypertrophy occurred more frequently in 2,500 and 5,000 ppm males and females than in the controls.
GENETIC TOXICOLOGY Oxazepam was not mutagenic in any of several strains of S. typhimurium, nor did it induce sister chromatid exchanges or chromosomal aberrations in cultured Chinese hamster ovary cells. These in vitro tests were performed with and without S9 metabolic activation. Results from an in vivo mouse peripheral blood micronucleus test performed on B6C3F mice used in1a 14-week study were also negative.
__________
7 Oxazepam, NTP TR 468
CONCLUSIONS In summary, under the conditions of these 2-year dosed-feed studies, there was equivocal evidence of carcinogenic activity* in male F344/N rats, based on small increases in the incidences of renal tubule adenomas in exposed groups also exhibiting significantly enhanced nephropathy. There was no evidence of carcinogenic activity of oxazepam in female F344/N rats exposed to feed containing 625, 2,500, or 5,000 ppm for 2 years or 10,000 ppm for 6 months.
Administration of oxazepam to rats resulted in nonneoplastic lesions in the forestomach, glandular stomach, and small intestine as well as centrilobular hypertrophy of hepatocytes in the liver. In addition, nephropathy was increased in incidence in female rats and was markedly increased in severity in male rats, resulting in early mortality at the higher exposure concentrations.
* Explanation of Levels of Evidence of Carcinogenic Activity is on page 9. A summary of the Technical Reports Review Subcommittee comments and the public discussion on this Technical Report appears on page 11.
8 Oxazepam, NTP TR 468
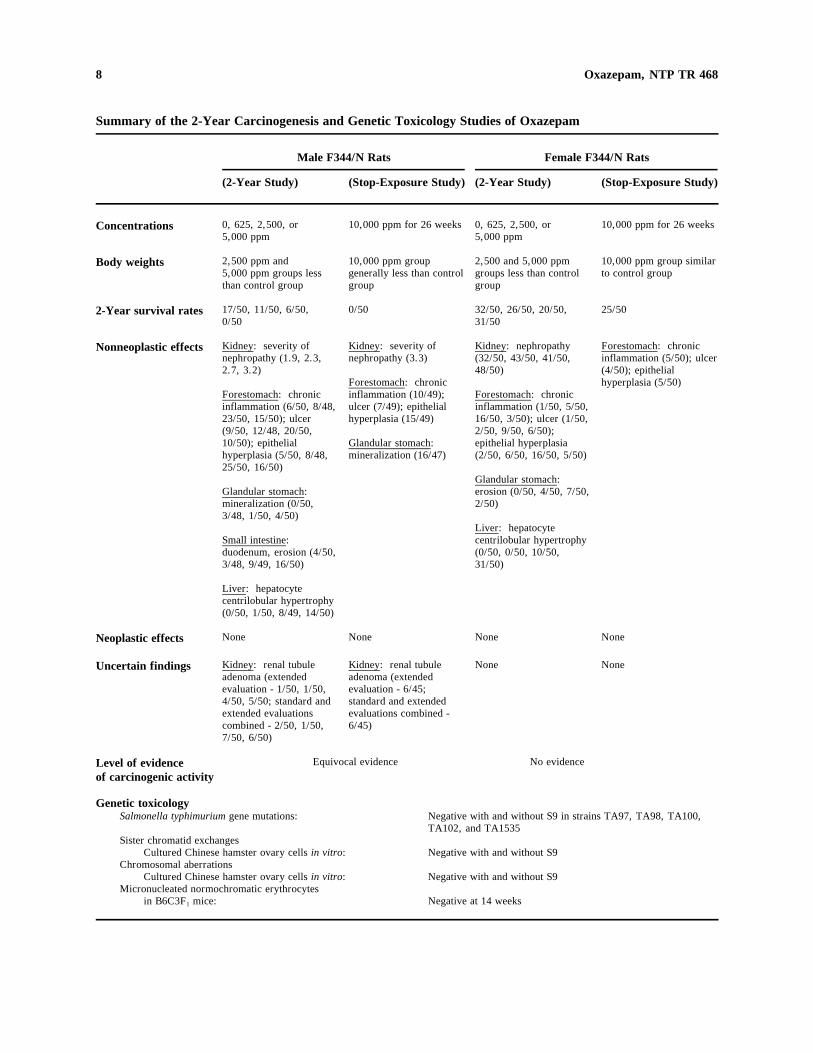
Summary of the 2-Year Carcinogenesis and Genetic Toxicology Studies of Oxazepam
Male F344/N Rats Female F344/N Rats
(2-Year Study) (Stop-Exposure Study) (2-Year Study) (Stop-Exposure Study)
Concentrations 0, 625, 2,500, or 10,000 ppm for 26 weeks 0, 625, 2,500, or 10,000 ppm for 26 weeks 5,000 ppm 5,000 ppm
Body weights 2,500 ppm and 10,000 ppm group 2,500 and 5,000 ppm 10,000 ppm group similar 5,000 ppm groups less generally less than control groups less than control to control group than control group group group
2-Year survival rates 17/50, 11/50, 6/50, 0/50 32/50, 26/50, 20/50, 25/50 0/50 31/50
Nonneoplastic effects Kidney: severity of Kidney: severity of Kidney: nephropathy Forestomach: chronic nephropathy (1.9, 2.3, nephropathy (3.3) (32/50, 43/50, 41/50, inflammation (5/50); ulcer 2.7, 3.2) 48/50) (4/50); epithelial
Forestomach: chronic hyperplasia (5/50) Forestomach: chronic inflammation (10/49); Forestomach: chronic inflammation (6/50, 8/48, ulcer (7/49); epithelial inflammation (1/50, 5/50, 23/50, 15/50); ulcer hyperplasia (15/49) 16/50, 3/50); ulcer (1/50, (9/50, 12/48, 20/50, 2/50, 9/50, 6/50); 10/50); epithelial Glandular stomach: epithelial hyperplasia hyperplasia (5/50, 8/48, mineralization (16/47) (2/50, 6/50, 16/50, 5/50) 25/50, 16/50)
Glandular stomach: Glandular stomach: erosion (0/50, 4/50, 7/50, mineralization (0/50, 2/50) 3/48, 1/50, 4/50)
Liver: hepatocyte Small intestine: centrilobular hypertrophy duodenum, erosion (4/50, (0/50, 0/50, 10/50, 3/48, 9/49, 16/50) 31/50)
Liver: hepatocyte centrilobular hypertrophy (0/50, 1/50, 8/49, 14/50)
Neoplastic effects None None None None
Uncertain findings Kidney: renal tubule Kidney: renal tubule None None adenoma (extended adenoma (extended evaluation - 1/50, 1/50, evaluation - 6/45; 4/50, 5/50; standard and standard and extended extended evaluations evaluations combined combined - 2/50, 1/50, 6/45) 7/50, 6/50)
Level of evidence Equivocal evidence No evidence
of carcinogenic activity
Genetic toxicology Salmonella typhimurium gene mutations: Negative with and without S9 in strains TA97, TA98, TA100,
TA102, and TA1535 Sister chromatid exchanges
Cultured Chinese hamster ovary cells in vitro: Negative with and without S9 Chromosomal aberrations
Cultured Chinese hamster ovary cells in vitro: Negative with and without S9 Micronucleated normochromatic erythrocytes
in B6C3F mice: Negative at 14 weeks1
9 Oxazepam, NTP TR 468
EXPLANATION OF LEVELS OF EVIDENCE OF CARCINOGENIC ACTIVITY
The National Toxicology Program describes the results of individual experiments on a chemical agent and notes the strength of the evidence for conclusions regarding each study. Negative results, in which the study animals do not have a greater incidence of neoplasia than control animals, do not necessarily mean that a chemical is not a carcinogen, inasmuch as the experiments are conducted under a limited set of conditions. Positive results demonstrate that a chemical is carcinogenic for laboratory animals under the conditions of the study and indicate that exposure to the chemical has the potential for hazard to humans. Other organizations, such as the International Agency for Research on Cancer, assign a strength of evidence for conclusions based on an examination of all available evidence, including animal studies such as those conducted by the NTP, epidemiologic studies, and estimates of exposure. Thus, the actual determination of risk to humans from chemicals found to be carcinogenic in laboratory animals requires a wider analysis that extends beyond the purview of these studies.
Five categories of evidence of carcinogenic activity are used in the Technical Report series to summarize the strength of the evidence observed in each experiment: two categories for positive results (clear evidence and some evidence); one category for uncertain findings (equivocal evidence); one category for no observable effects (no evidence); and one category for experiments that cannot be evaluated because of major flaws (inadequate study). These categories of interpretative conclusions were first adopted in June 1983 and then revised in March 1986 for use in the Technical Report series to incorporate more specifically the concept of actual weight of evidence of carcinogenic activity. For each separate experiment (male rats, female rats, male mice, female mice), one of the following five categories is selected to describe the findings. These categories refer to the strength of the experimental evidence and not to potency or mechanism.
• Clear evidence of carcinogenic activity is demonstrated by studies that are interpreted as showing a dose-related (i) increase of malignant neoplasms, (ii) increase of a combination of malignant and benign neoplasms, or (iii) marked increase of benign neoplasms if there is an indication from this or other studies of the ability of such tumors to progress to malignancy.
• Some evidence of carcinogenic activity is demonstrated by studies that are interpreted as showing a chemical-related increased incidence of neoplasms (malignant, benign, or combined) in which the strength of the response is less than that required for clear evidence.
• Equivocal evidence of carcinogenic activity is demonstrated by studies that are interpreted as showing a marginal increase of neoplasms that may be chemical related.
• No evidence of carcinogenic activity is demonstrated by studies that are interpreted as showing no chemical-related increases in malignant or benign neoplasms.
• Inadequate study of carcinogenic activity is demonstrated by studies that, because of major qualitative or quantitative limitations, cannot be interpreted as valid for showing either the presence or absence of carcinogenic activity.
When a conclusion statement for a particular experiment is selected, consideration must be given to key factors that would extend the actual boundary of an individual category of evidence. Such consideration should allow for incorporation of scientific experience and current understanding of long-term carcinogenesis studies in laboratory animals, especially for those evaluations that may be on the borderline between two adjacent levels. These considerations should include:
• adequacy of the experimental design and conduct; • occurrence of common versus uncommon neoplasia; • progression (or lack thereof) from benign to malignant neoplasia as well as from preneoplastic to neoplastic lesions; • some benign neoplasms have the capacity to regress but others (of the same morphologic type) progress. At present, it is
impossible to identify the difference. Therefore, where progression is known to be a possibility, the most prudent course is to assume that benign neoplasms of those types have the potential to become malignant;
• combining benign and malignant tumor incidence known or thought to represent stages of progression in the same organ or tissue;
• latency in tumor induction; • multiplicity in site-specific neoplasia; • metastases; • supporting information from proliferative lesions (hyperplasia) in the same site of neoplasia or in other experiments (same lesion
in another sex or species); • presence or absence of dose relationships; • statistical significance of the observed tumor increase; • concurrent control tumor incidence as well as the historical control rate and variability for a specific neoplasm; • survival-adjusted analyses and false positive or false negative concerns; • structure-activity correlations; and • in some cases, genetic toxicology.
________
10 Oxazepam, NTP TR 468
NATIONAL TOXICOLOGY PROGRAM BOARD OF SCIENTIFIC COUNSELORS TECHNICAL REPORTS REVIEW SUBCOMMITTEE
The members of the Technical Reports Review Subcommittee who evaluated the draft NTP Technical Report on oxazepam on 11 December 1996 are listed below. Subcommittee members serve as independent scientists, not as representatives of any institution, company, or governmental agency. In this capacity, subcommittee members have five major responsibilities in reviewing the NTP studies:
• to ascertain that all relevant literature data have been adequately cited and interpreted, • to determine if the design and conditions of the NTP studies were appropriate, • to ensure that the Technical Report presents the experimental results and conclusions fully and clearly, • to judge the significance of the experimental results by scientific criteria, and • to assess the evaluation of the evidence of carcinogenic activity and other observed toxic responses.
Gary P. Carlson, Ph.D., Chairperson Irma Russo, M.D. School of Health Sciences Fox Chase Cancer Center Purdue University Philadelphia, PA West Lafayette, IN
Arnold L. Brown, M.D., Principal Reviewer Louise Ryan, Ph.D.*
Division of Biostatistics University of Wisconsin Medical School Dana-Farber Cancer Institute Madison, WI Boston, MA
Thomas L. Goldsworthy, Ph.D. Robert E. Taylor, M.D., Ph.D., Principal Reviewer Department of Experimental Pathology and Toxicology Department of Pharmacology Chemical Industry Institute of Toxicology Howard University College of Medicine Research Triangle Park, NC Washington, DC
Robert LeBoeuf, Ph.D. Frederick L. Tyson Corporate Professional and Regulatory Services St. Mary’s Hospital and Medical Center Human Safety Department Cancer Research Institute The Procter & Gamble Company Grand Junction, CO Cincinnati, OH
Janardan K. Reddy, M.D. Jerrold M. Ward, D.V.M., Ph.D.
National Cancer Institute Department of Pathology Frederick, MD Northwestern University Medical School Chicago, IL
* Did not attend
11 Oxazepam, NTP TR 468
SUMMARY OF TECHNICAL REPORTS REVIEW SUBCOMMITTEE COMMENTS
On 11 December 1996, the draft Technical Report on the toxicology and carcinogenesis studies of oxazepam received public review by the National Toxicology Program’s Board of Scientific Counselors’ Technical Reports Review Subcommittee. The review meeting was held at the National Institute of Environmental Health Sciences, Research Triangle Park, NC.
Dr. J.R. Bucher, NIEHS, introduced the toxicology and carcinogenesis studies of oxazepam by discussing the uses of the chemical and the rationale for study, describing the experimental design, reporting on survival and body weight effects, and commenting on compound-related neoplastic and nonneoplastic lesions in rats. Dr. Bucher noted that the Subcommittee had reviewed a bioassay of oxazepam in Swiss-Webster and B6C3F mice in 1993. The proposed conclusions1
for the present study were some evidence of carcinogenic activity in male F344/N rats and no evidence of carcinogenic activity in female F344/N rats.
Dr. Taylor, a principal reviewer, agreed in principle with the proposed conclusions. He stated that because there was substantial reduction in body weight gain and survival in 2,500 and 5,000 ppm male rats along with a dose response that was not very dramatic, he would argue for changing the proposed conclusion in male rats to equivocal evidence of carcinogenic activity. Noting the figure illustrating the metabolism of oxazepam in F344 rats, Dr. Taylor stated that some discussion of metabolism in rats and mice would be useful as an aid in trying to explain the difference between the mouse and rat in sites of toxicity and neoplasia.
Dr. Brown, the second principal reviewer, agreed with the proposed conclusions. He said that it would be helpful if additional information could be provided in the Abstract regarding the background against which this bioassay was conducted, i.e., the unpublished study by industry in Sprague-Dawley rats. Dr. Bucher observed that the 1996 edition of the Physicians’ Desk Reference provides a description of the rat study performed by Wyeth Laboratories, although no doses are listed. The citation indicates that there were increased incidences of prostate adenoma, interstitial cell adenoma of the testes, and thyroid gland follicular cell adenoma, none of which were replicated in the
current study in F344/N rats. Dr. W.R. Allaben, NCTR/FDA, pointed out that the data are considered proprietary information and by law cannot be released publicly. Dr. Bucher mentioned that this was one of four benzodiazepines nominated and selected for study. Three were products of Hoffmann-LaRoche, which agreed to carry out the studies with the NTP’s assistance in the study design. The studies were completed, and data were submitted to the FDA.
There was a discussion about the appropriateness of step sectioning kidneys in male rats and about the exposure concentrations used in the study. Dr. Bucher said that in retrospect, the 1,250 ppm group, which was terminated after 26 weeks with the thought that it would be uninformative, would have been the best high exposure group. Dr. LeBoeuf argued that if the 5,000 ppm group were excluded from analysis because of very poor survival, and if the results for renal tubule adenomas in the 625 and 2,500 ppm groups were compared with those in the controls, then he would conclude that there was equivocal evidence of carcinogenic activity. Dr. J.K. Haseman, NIEHS, noted that the increased incidence of renal tubule adenoma in the 2,500 ppm group was significant at P=0.018. Dr. Goldsworthy asked under what circumstances the NTP would consider a study to be inadequate for evaluation. Dr. Bucher said that, generally, the NTP might consider a study to be inadequate if there is poor survival and if there is no neoplasm response, such that the ability of the study to detect a response may be compromised. Dr. Goldsworthy asked whether excluding a 13-week study would occur more often in future bioassays. Dr. G.A. Boorman, NIEHS, pointed out that in the case of oxazepam, a 26-week study did not predict very well; however, the decision of whether to employ a 13-week study would have to be determined on a case-by-case basis by drawing on other available toxicity information.
Dr. Taylor moved that the Technical Report on oxazepam be accepted with the revisions discussed and the conclusion as written for female rats, no evidence of carcinogenic activity, but changed for male rats, from some evidence of carcinogenic activity to equivocal evidence of carcinogenic activity.
12 Oxazepam, NTP TR 468
Dr. Brown seconded the motion. In discussion, chemically induced because the organ is a target site Dr. Ward stated that having toxicity in an organ such for the chemical. Dr. Taylor’s motion was accepted as the kidney, where there were also neoplasms, with five yes votes to three no votes (Goldsworthy, strengthened the evidence for the neoplasms being Reddy, and Ward).
13
INTRODUCTION
OXAZEPAM
CAS No. 604-75-1
Chemical Formula: C H ClN O Molecular Weight: 286.7415 11 2 2
Synonym: 7-Chloro-1,3-dihydro-3-hydroxy-5-phenyl-2H-1,4-benzodiazepin-2-one Trade Names: Serax, Tazepam, Wy-3498
CHEMICAL AND PHYSICAL PROPERTIES Oxazepam is a bitter-tasting, white, crystalline powder that is insoluble in water but soluble in alcohol, chloroform, and ether (Remington’s Pharmaceutical Sciences, 1980). The material is nonhygroscopic and stable in light. It has a melting-point range of 205E to 206E C (Merck Index, 1983).
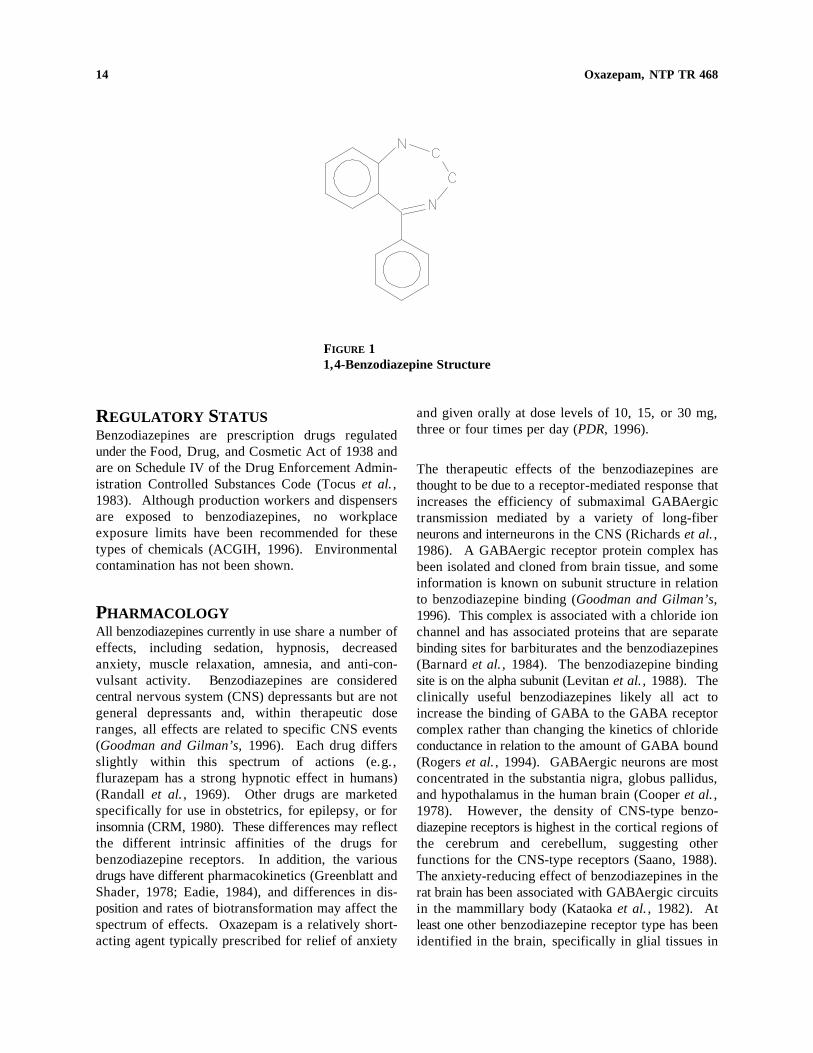
PRODUCTION, USE, AND HUMAN EXPOSURE Oxazepam and related benzodiazepine drugs are used in the treatment of anxiety. Most clinically useful drugs for this purpose are variants of the 1,4-benzodiazepine structure (Figure 1) consisting of two aromatic rings and a 7-membered heterocycle. One of the aromatic rings is fused to the 7-membered ring and contains a chlorine or other electronegative group as a substituent. All clinically important derivatives contain a 5-aryl or 5-cyclohexenyl group. Most of the drugs vary in substituent groups at the 1 and 3 positions (Goodman and Gilman’s, 1996). Oxazepam, known under the trade name Serax®, is produced
and sold by Wyeth Laboratories and has been on the market since 1965. Generic forms produced by other manufacturers are also now available (PDR, 1996).
No definite production data are available for oxazepam or for the benzodiazepine drugs; however, the use of benzodiazepines by the general population has been reported as 8% in the United Kingdom, 7% in the United States, and 8% to 10% in Norway (Pedersen and Lavik, 1991). In 1983, 2.6 million prescriptions for oxazepam were written in the United States, and oxazepam ranked 132nd and 125th in overall frequency of prescriptions written for all drugs in 1984 and 1985, respectively (Anonymous, 1986; C. Baum correspondence, 1986). Oxazepam is also a common metabolite of several other benzodiazepines, some of which are more widely prescribed, including diazepam (Valium®). In 1983, 25.5 million prescriptions for diazepam were written in the United States, making it the fourth most prescribed drug, and although newer benzodiazepines are replacing some of the older drugs, over 2.3 million prescriptions for diazepam were still written in 1995 (Anonymous, 1996).
14 Oxazepam, NTP TR 468
FIGURE 1 1,4-Benzodiazepine Structure
REGULATORY STATUS Benzodiazepines are prescription drugs regulated under the Food, Drug, and Cosmetic Act of 1938 and are on Schedule IV of the Drug Enforcement Administration Controlled Substances Code (Tocus et al., 1983). Although production workers and dispensers are exposed to benzodiazepines, no workplace exposure limits have been recommended for these types of chemicals (ACGIH, 1996). Environmental contamination has not been shown.
PHARMACOLOGY All benzodiazepines currently in use share a number of effects, including sedation, hypnosis, decreased anxiety, muscle relaxation, amnesia, and anti-convulsant activity. Benzodiazepines are considered central nervous system (CNS) depressants but are not general depressants and, within therapeutic dose ranges, all effects are related to specific CNS events (Goodman and Gilman’s, 1996). Each drug differs slightly within this spectrum of actions (e.g., flurazepam has a strong hypnotic effect in humans) (Randall et al., 1969). Other drugs are marketed specifically for use in obstetrics, for epilepsy, or for insomnia (CRM, 1980). These differences may reflect the different intrinsic affinities of the drugs for benzodiazepine receptors. In addition, the various drugs have different pharmacokinetics (Greenblatt and Shader, 1978; Eadie, 1984), and differences in disposition and rates of biotransformation may affect the spectrum of effects. Oxazepam is a relatively shortacting agent typically prescribed for relief of anxiety
and given orally at dose levels of 10, 15, or 30 mg, three or four times per day (PDR, 1996).
The therapeutic effects of the benzodiazepines are thought to be due to a receptor-mediated response that increases the efficiency of submaximal GABAergic transmission mediated by a variety of long-fiber neurons and interneurons in the CNS (Richards et al., 1986). A GABAergic receptor protein complex has been isolated and cloned from brain tissue, and some information is known on subunit structure in relation to benzodiazepine binding (Goodman and Gilman’s, 1996). This complex is associated with a chloride ion channel and has associated proteins that are separate binding sites for barbiturates and the benzodiazepines (Barnard et al., 1984). The benzodiazepine binding site is on the alpha subunit (Levitan et al., 1988). The clinically useful benzodiazepines likely all act to increase the binding of GABA to the GABA receptor complex rather than changing the kinetics of chloride conductance in relation to the amount of GABA bound (Rogers et al., 1994). GABAergic neurons are most concentrated in the substantia nigra, globus pallidus, and hypothalamus in the human brain (Cooper et al., 1978). However, the density of CNS-type benzodiazepine receptors is highest in the cortical regions of the cerebrum and cerebellum, suggesting other functions for the CNS-type receptors (Saano, 1988). The anxiety-reducing effect of benzodiazepines in the rat brain has been associated with GABAergic circuits in the mammillary body (Kataoka et al., 1982). At least one other benzodiazepine receptor type has been identified in the brain, specifically in glial tissues in
15 Oxazepam, NTP TR 468
the pineal gland and olfactory bulb, and is also found in heart, liver, lung, testis, and other tissues. The role of this receptor is not clear, but it appears to be a mitochondrial protein that may use porphyrins as endogenous ligands (Snyder et al., 1987; Verma and Snyder, 1989; Calvo et al., 1991) and may be involved in the regulation of steroid biosynthesis (Krueger and Papadopoulos, 1992), specifically in the transport of cholesterol to the inner mitochondrial membrane (Papadopoulos and Brown, 1995). Some structural requirements for binding to these receptors have been described (Campiani et al., 1996).
ABSORPTION, DISPOSITION, METABOLISM, AND EXCRETION Experimental Animals The toxicokinetics and metabolism of oxazepam in F344 rats and B6C3F1 and Swiss-Webster mice have been described in detail by Yuan et al. (1994) and Griffin and Burka (1993, 1995). Oxazepam was well absorbed after oral administration, with peak blood concentrations achieved within 2 to 3.5 hours, and with female rats and mice having higher blood concentrations than males. Elimination of oxazepam from plasma was first order and best described by a twocompartment model with terminal elimination halflives of 4 to 5 hours for rats and 5 to 7 hours for mice. The bioavailability of oxazepam from the diet was about 40% of that achieved following a gavage dose of oxazepam (50 mg/kg) in methyl cellulose vehicle, and apparently decreased with increasing oxazepam concentrations. Thus, steady-state blood concentrations, reached after about 4 days on dosed feed, were not proportional to dose (Yuan et al., 1994).
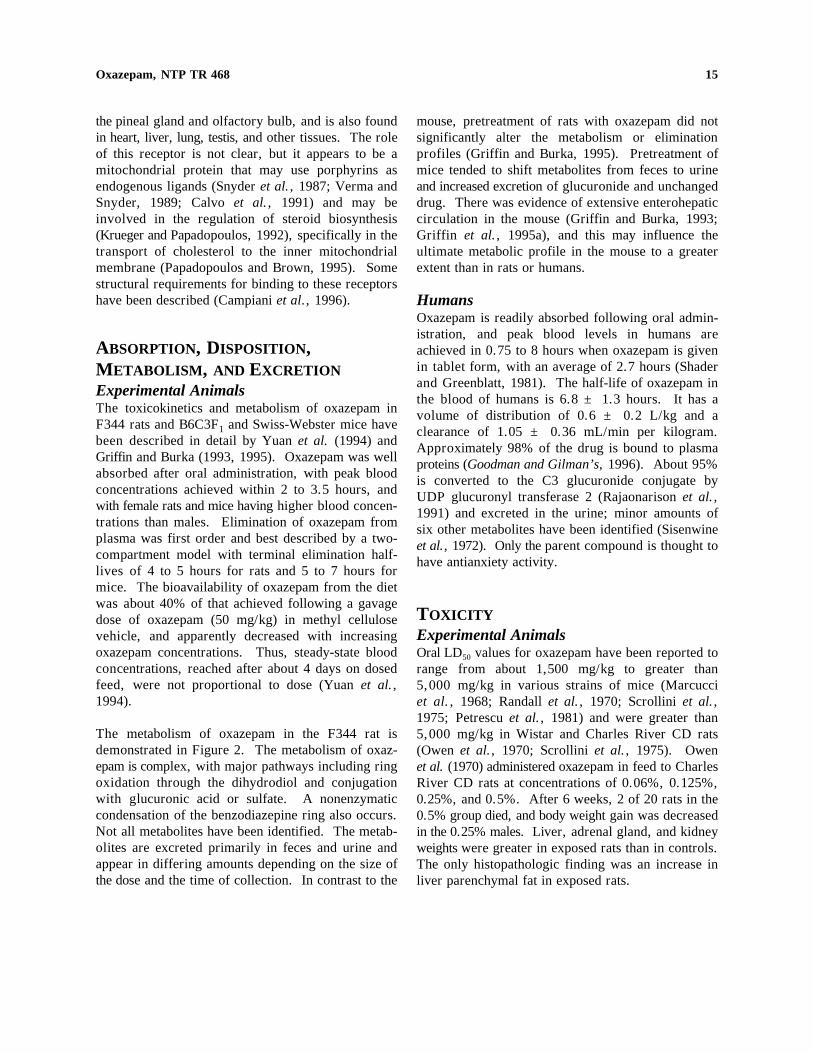
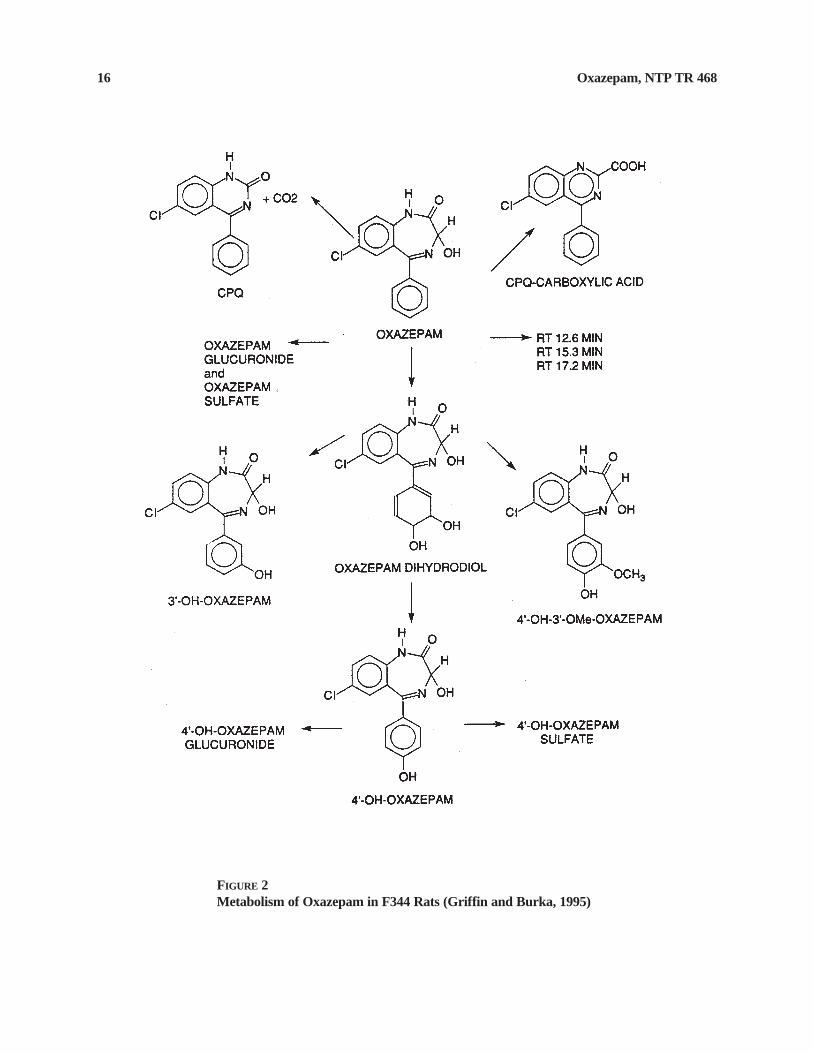
The metabolism of oxazepam in the F344 rat is demonstrated in Figure 2. The metabolism of oxazepam is complex, with major pathways including ring oxidation through the dihydrodiol and conjugation with glucuronic acid or sulfate. A nonenzymatic condensation of the benzodiazepine ring also occurs. Not all metabolites have been identified. The metabolites are excreted primarily in feces and urine and appear in differing amounts depending on the size of the dose and the time of collection. In contrast to the
mouse, pretreatment of rats with oxazepam did not significantly alter the metabolism or elimination profiles (Griffin and Burka, 1995). Pretreatment of mice tended to shift metabolites from feces to urine and increased excretion of glucuronide and unchanged drug. There was evidence of extensive enterohepatic circulation in the mouse (Griffin and Burka, 1993; Griffin et al., 1995a), and this may influence the ultimate metabolic profile in the mouse to a greater extent than in rats or humans.
Humans Oxazepam is readily absorbed following oral administration, and peak blood levels in humans are achieved in 0.75 to 8 hours when oxazepam is given in tablet form, with an average of 2.7 hours (Shader and Greenblatt, 1981). The half-life of oxazepam in the blood of humans is 6.8 ± 1.3 hours. It has a volume of distribution of 0.6 ± 0.2 L/kg and a clearance of 1.05 ± 0.36 mL/min per kilogram. Approximately 98% of the drug is bound to plasma proteins (Goodman and Gilman’s, 1996). About 95% is converted to the C3 glucuronide conjugate by UDP glucuronyl transferase 2 (Rajaonarison et al., 1991) and excreted in the urine; minor amounts of six other metabolites have been identified (Sisenwine et al., 1972). Only the parent compound is thought to have antianxiety activity.
TOXICITY Experimental Animals Oral LD50 values for oxazepam have been reported to range from about 1,500 mg/kg to greater than 5,000 mg/kg in various strains of mice (Marcucci et al., 1968; Randall et al., 1970; Scrollini et al., 1975; Petrescu et al., 1981) and were greater than 5,000 mg/kg in Wistar and Charles River CD rats (Owen et al., 1970; Scrollini et al., 1975). Owen et al. (1970) administered oxazepam in feed to Charles River CD rats at concentrations of 0.06%, 0.125%, 0.25%, and 0.5%. After 6 weeks, 2 of 20 rats in the 0.5% group died, and body weight gain was decreased in the 0.25% males. Liver, adrenal gland, and kidney weights were greater in exposed rats than in controls. The only histopathologic finding was an increase in liver parenchymal fat in exposed rats.
16 Oxazepam, NTP TR 468
FIGURE 2 Metabolism of Oxazepam in F344 Rats (Griffin and Burka, 1995)
17 Oxazepam, NTP TR 468
Groups of 30 male and 30 female rats were fed diets containing 0, 0.015%, 0.03%, 0.06%, or 0.12% oxazepam for 55 weeks. Deaths were not clearly chemical related, and other than increased liver weights, no effects on body weight gain, hematology parameters, or significant chemical-related gross or histopathologic lesions were observed (Owen et al., 1970).
The principal effects seen in Swiss-Webster and B6C3F mice in 13- or 14-week studies using dosed 1 feed at concentrations as high as 10,000 ppm were marked liver weight increases and increased incidences of centrilobular hypertrophy. These changes occurred at all doses including the lowest dose, 625 ppm (NTP, 1993).
The increased liver weights observed in these and other studies with benzodiazepines suggest stimulation of proliferation of smooth endoplasmic reticulum (Orlandi et al., 1975). However, the benzodiazepines do not appear to stimulate their own metabolism and have been found to inhibit metabolism of other drugs such as morphine or aminopyrine in Wistar rats (Vega et al., 1984) and to stimulate metabolism of certain chemicals (i.e., benzene and aniline) (Jab»o½ska et al., 1975). This coincides with the benzodiazepines’ reputation of not producing significant tolerance during long-term therapy (Goodman and Gilman’s, 1996). Physical dependence has been demonstrated in rats with several of the drugs, including diazepam (Martin et al., 1982).
Humans The benzodiazepines are a poor choice for suicide purposes and, despite many attempts, deaths by overdose are rare (Finkle et al., 1979; Buckley et al., 1995). Overdoses of oxazepam commonly result in drowsiness, blurred vision, and ataxia. As in rats, stimulation of proliferation of smooth endoplasmic reticulum has been shown in liver biopsies from humans taking diazepam (Orlandi et al., 1975). Physical dependence is produced in humans given benzodiazepines.
CARCINOGENICITY Experimental Animals Several long-term rodent studies have been performed with the benzodiazepines. Fox and Lahcen (1974) observed liver neoplasms in oxazepam-treated Swiss-Webster mice during the course of reproductive
toxicity studies. Mice were housed as breeding pairs from 3 to 12 months of age and were fed an oxazepam-supplemented diet at doses of 0.05% and 0.15%. They were killed at 14 months of age. The incidences of liver neoplasms increased in males (0/13, 3/12, 8/13) and females (0/10, 0/10, 5/8) with dose. The neoplasms were generally multiple and gave the livers a massively nodular appearance. Histopathologically, the neoplasms were diagnosed as hepatocellular adenomas, which showed peliosis and extramedullary hematopoiesis.
De la Iglesia et al. (1981) administered diazepam or prazepam in feed at concentrations sufficient to result in doses of up to 75 mg/kg body weight per day to male and female CF mice and Wistar rats for 80 and1
104 weeks, respectively. The incidences of malignant liver neoplasms were increased in male mice receiving diazepam. Temazepam, which is metabolized to oxazepam in the mouse, was administered in feed to Charles River CD rats for 2 years and to Charles River CD-1 mice for 18 months at doses of 10 to 160 mg/kg per day. Exposed female mice had slightly increased incidences of liver adenoma (Robinson et al., 1984).
As a follow-up to the Fox and Lachen (1974) observation, groups of 60 male and 60 female Swiss-Webster mice were exposed to feed containing 0, 2,500, or 5,000 ppm oxazepam for 57 weeks. The study was then terminated because of poor survival in the exposed groups. Mice receiving oxazepam were found to have very high rates of hepatocellular neoplasms (males, combined hepatocellular adenomas and carcinomas: control, 1/60; 2,500 ppm, 35/60; 5,000 ppm, 52/60; females: 1/60, 23/59, 47/59), as well as an exacerbated amyloidosis. Amyloidosis is commonly seen in this strain of mice, but the condition was severe, particularly in the heart, and likely contributed to the low survival. A similar study was carried out with the B6C3F mouse, with an additional1 dose group receiving oxazepam at 125 ppm. This lower exposure concentration was projected to give blood concentrations in the therapeutic range for humans. Again, mice receiving 2,500 or 5,000 ppm oxazepam suffered from reduced survival and high rates of hepatocellular neoplasms (males, combined hepatocellular adenomas, carcinomas, and hepatoblastomas: control, 23/49; 125 ppm, 19/50; 2,500 ppm, 50/50; 5,000 ppm, 50/50; females: 28/50, 36/50, 50/50, 47/50). The incidences of thyroid gland
18 Oxazepam, NTP TR 468
follicular cell adenoma were also increased in exposed females (0/50, 4/50, 5/50, 6/50) (NTP, 1993; Bucher et al., 1994).
Humans No studies on the carcinogenicity of oxazepam in humans were found in the literature.
PROMOTION STUDIES The benzodiazepines have been tested in various promotion assays because of reports, primarily from one laboratory, that diazepam treatment accelerated the growth of intrarenally implanted neoplasm cells (Walker 256) (Horrobin et al., 1979) and that it was positive in an in vitro metabolic cooperation assay for neoplasm promoters (Trosko and Horrobin, 1980). These reports appeared following publication of an epidemiological study that suggested an association between increased incidences of breast cancer and benzodiazepine use in women (Stoll, 1976). This association was later discounted (Kleinerman et al., 1984), but further animal experimentation has provided mixed results.
Remandet et al. (1984) fed F344/N rats 2-acetylaminofluorene for 8 weeks and followed this for 12 weeks with diets containing one of six benzodiazepines. They reported no increased incidences of liver neoplasms or enzyme-altered foci. Préat et al. (1987) reported positive promotional activity with oxazepam in Wistar rats in two different assays for hepatocarcinogenesis. In one, animals were initiated with diethylnitrosamine (DEN) and were treated with 2-acetylaminofluorene and carbon tetrachloride during the next 2 weeks; they then received oxazepam in feed for 30 weeks. In the other protocol, initiation with DEN was preceded by partial hepatectomy, and promotion was effected by dietary administration for 1 year. Diwan et al. (1986) found diazepam and oxazepam to be promoters of DEN-initiated liver neoplasms in mice. In this study, groups of B6C3F1
mice received injections of DEN at 5 weeks of age; at 7 weeks, they were fed diets containing diazepam or oxazepam at 0.05% or 0.15%, or were given phenobarbital in water at 500 ppm. Mice were killed periodically through 60 weeks of age. The incidences of neoplasms were increased in mice receiving diazepam and in those receiving 0.15% oxazepam. A few adenomas were also observed in uninitiated mice receiving 0.15% diazepam (3/15) or 0.05% oxazepam
(2/16), and none were observed in mice receiving only phenobarbital. Diazepam and oxazepam were also found to induce hepatic P450 content and to increase aminopyrine N-demethylase activity. Diwan et al. (1986) have proposed that promotion of hepatocellular carcinogenesis is associated with induction of N-demethylase activity and appears to be quite species and strain specific. Diazepam did not induce cytochrome P450 in the liver of Sprague-Dawley rats (Vorne and Idänpään-Heikkilä, 1975), and this was considered consistent with the negative promotional findings of Remandet et al. (1984) in their study with F344/N rats.
REPRODUCTIVE AND DEVELOPMENTAL TOXICITY Experimental Animals Although the benzodiazepines have been used in treating toxemia and preeclampsia as well as the psychiatric complications of pregnancy (Shannon et al., 1972; Kanto, 1982), there are many reports of fetotoxic and teratogenic effects of these and other minor tranquilizers when given to pregnant animals. Tucker (1985) provided a critical review of studies of developmental toxicity of benzodiazepines in the rat. Saito et al. (1984) found increases in fetal toxicity (resorptions, dead fetuses, and malformations) in pregnant rats given doses of diazepam or chlordiazepoxide of 100 mg/kg per os during gestational days 7 to 14. Miller and Becker (1975) first found diazepam produced cleft palate following oral administration of 87.5 or 125 mg/kg to Swiss-Webster mice on days 11 to 13. This has since received considerable study and is now attributed to potentiation of the GABAergic inhibition of the palate shelf reorientation (Wee and Zimmerman, 1983). In general, exposures to high doses in utero produce decreased litter sizes, decreased pup weights, and increased numbers of malformations. Exposures to lower doses (5 to 20 mg/kg per day) during critical periods (after gestational day 14 in rats) produce no immediately obvious effects at birth but result in various behavioral deficits during later life and a variety of poorly understood changes in the concentration of neurotransmitters in various brain areas (Livezey et al., 1986a; Ryan and Pappas, 1986; Shibuya et al., 1986). Central to these studies have been attempts to correlate changes in benzodiazepine receptor concentration with altered behavior. Livezey et al. (1986b) have argued that in utero exposure to benzodiazepines during the
19 Oxazepam, NTP TR 468
period of receptor development (after gestational day 14 in rats) results in a decreased benzodiazepine receptor concentration and results in rats that suffer chronic anxiety demonstrated by hyperarousal, inability of the animals to habituate to a novel environment, and a large reduction in the amount of deep slow-wave sleep. Changes in passive avoidance have also been reported in mice following in utero exposure to oxazepam (Ricceri et al., 1994).
Humans Exposure of the human fetus to diazepam results in a set of symptoms collectively known as the “floppy infant syndrome,” which includes hypothermia, hyperbilirubinemia, hypotonia, asphyxia, respiratory complications, and poor sucking response. This is likely due to the ready transfer of the drugs across the placenta. Pharmacologic effects are exaggerated in the unborn because higher levels accumulate due to the slower elimination from the fetus. There have been reports of increases in severe congenital anomalies in infants whose mothers took chlordiazepoxide and other benzodiazepines (including oxazepam) during pregnancy (Milkovich and van den Berg, 1974); there have also been reports claiming no link between benzodiazepine use and fetal abnormalities (Hartz et al., 1975).
GENETIC TOXICITY Oxazepam has not been tested extensively for mutagenicity, but the data reported for oxazepam and its structural analogues indicate that this class of chemicals is probably not genotoxic. There is one report of a positive response in a Salmonella gene mutation assay (Batzinger et al., 1978). The authors described an increase in revertants for strains TA98 and TA100 when exposure was carried out in the presence of rat liver S9 activation enzymes. The data reported were insufficient for a critical evaluation of the results. Other laboratories that have tested oxazepam for mutagenicity in Salmonella have reported negative results. Matula and Downie (1983), in a brief abstract which presented little experimental detail, reported negative results, with and without S9, in strains TA98 and TA100. Balbi et al. (1980) detected no mutagenic activity with oxazepam in four strains of Salmonella, with or without S9, but their report did not include complete data tables for those tests that gave negative results. NTP mutagenicity tests with five strains of
Salmonella yielded negative results, with and without S9 (Appendix C).
No evidence of chromosome nondisjunction was observed in Aspergillus nidulans treated with an unspecified concentration of oxazepam in the absence of S9 (Bignami et al., 1974). Unscheduled DNA synthesis was not detected in rat liver cells in vitro (Swierenga et al., 1983), and no induction of chromosomal aberrations was observed in bone marrow cells of mice administered 0.85 mg/kg oxazepam by intraperitoneal injection five times weekly for 8 weeks (Degraeve et al., 1985). In addition, results from NTP (1993) studies (Appendix C) showed no induction of sister chromatid exchanges or chromosomal aberrations in cultured Chinese hamster ovary cells treated with oxazepam, with or without rat liver S9, and no increase in micronucleus frequency was noted in peripheral blood erythrocytes of male and female mice treated with oxazepam for 90 days.
A variety of genotoxicity tests has been performed with two of the widely used structural analogues of oxazepam, diazepam, and chlordiazepoxide. Diazepam was nonmutagenic in Salmonella (Batzinger et al., 1978; Waskell, 1978; Preiss et al., 1982; Zeiger et al., 1992). There was no evidence of diazepam-induced chromosome loss or nondisjunction in yeast (Bignami et al., 1974; Matula and Downie, 1983; Crebelli et al., 1989, 1991; Parry et al., 1989; Whittaker et al., 1989). The effects reported for diazepam in cultured mammalian cells varied. No induction of chromosomal aberrations was noted in cultured Chinese hamster ovary cells treated with diazepam with or without S9 in two laboratories (Ishidate et al., 1978; Matsuoka et al., 1979), but positive results were reported in one study using cultured Chinese hamster ovary cells treated in the absence of S9 (Lafi and Parry, 1988). Disruption of mitosis with concomitant chromosome loss was observed in cultured Chinese hamster ovary cells after treatment with diazepam in the absence of S9 (Hsu et al., 1983; Parry et al., 1986; Lafi et al., 1987). Results of tests for induction of chromosomal aberrations and sister chromatid exchanges in human lymphocytes (Staiger, 1970; Zhurkov, 1975) or fibroblasts (Staiger, 1969; Kawachi et al., 1980; Sasaki et al., 1980) treated in vitro with diazepam were uniformly negative. Unscheduled DNA synthesis was not detected in rat liver cells treated in vitro
20 Oxazepam, NTP TR 468
with diazepam (Swierenga et al., 1983; Williams et al., 1989).
In vivo tests with diazepam showed little indication of genotoxic activity. No evidence of mitotic disruption or induction of chromosomal aberrations was observed in mouse bone marrow cells following administration of up to 100 or 150 mg/kg diazepam, respectively (Miller and Adler, 1989; Xu and Adler, 1990). Negative results were reported for diazepam in bone marrow chromosomal aberration assays in hamsters (Schmid and Staiger, 1969) and rats (Ishimura et al., 1975; Kawachi et al., 1980). In addition, no increases in chromosomal aberrations (Stenchever et al., 1970a; White et al., 1974) or sister chromatid exchanges (Torigoe, 1979; Husum et al., 1985) were observed in peripheral lymphocytes obtained from patients treated with diazepam either chronically, as a management for anxiety or muscle spasm, or acutely, as part of a surgical routine.
Fewer genotoxicity test results are available for chlordiazepoxide, but indications are that it, too, is not genetically active. Chlordiazepoxide did not induce nondisjunction in A. nidulans (Bignami et al., 1974) or chromosomal aberrations in cultured Chinese hamster cells (Sasaki et al., 1980), human fibroblasts (Staiger, 1969), or leucocytes (Bregman, 1970; Stenchever et al., 1970b). In vitro micronucleus tests with hamster and human cells were negative (Sasaki et al., 1980). Results of in vivo investigations indicate that chlordiazepoxide does not induce chromosomal aberrations in mouse (Petersen et al., 1978; Degraeve et al., 1985) or hamster (Schmid and Staiger, 1969) bone marrow cells. Finally, no induction of chromosomal aberrations was observed in lymphocytes obtained from patients administered chlordiazepoxide (up to 200 mg/day) (Stenchever et al., 1970b).
STUDY RATIONALE Oxazepam and four other benzodiazepines (chlordiazepoxide, chlorazepate, diazepam, and flurazepam) were nominated for study by the Food and Drug Administration (FDA) and by the NIEHS based on their widespread use, use by pregnant women, and the lack of adequate rodent carcinogenicity studies. An agreement was reached with Hoffmann-LaRoche, Inc., the manufacturer of chlordiazepoxide, diazepam, and flurazepam, for studies to be carried out on these drugs under its auspices in cooperation with the NTP. These studies are completed and results have been submitted to the FDA. No studies were performed on chlorazepate because of the very similar metabolite profile between this drug and diazepam. Oxazepam was evaluated in 14-week and 2-year studies by the NTP, and Technical Report No. 443 contains the results of studies performed with the Swiss-Webster and B6C3F1 strains of mice (NTP, 1993). Studies with rats were not initiated at the same time as the mouse studies because adequate carcinogenicity studies of oxazepam with the Sprague-Dawley rat strain had been submitted to the FDA by the manufacturer, Wyeth Laboratories. Subsequently, because of the marked neoplastic responses found in the two mouse strains, the NTP initiated further 2-year studies of oxazepam with the F344/N rat.
The current studies include measures of serum oxazepam concentrations and histopathologic evaluation of tissues from the 2-year animals. No 13-week studies were performed with oxazepam in rats because it was determined that the prior 13-week studies with mice gave very little information on which to base dose selection for the 2-year studies. For this reason, five exposure concentrations were chosen for the 2-year evaluation. After 26 weeks, one exposure group considered uninformative was terminated, and the highest exposure group was removed from dosed feed for the duration of the study. A separate set of studies evaluating a number of biochemical changes in the F344/N rat following short-term exposure to oxazepam is summarized in Appendix H.
21
MATERIALS AND METHODS
PROCUREMENT AND CHARACTERIZATION OF OXAZEPAM Oxazepam was obtained from Roussel Corporation (Englewood Cliffs, NJ) in one lot (86017.01). Identity, purity, and stability analyses were conducted by the analytical chemistry laboratory, Midwest Research Institute (Kansas City, MO) (Appendix D). Reports on analyses performed in support of the oxazepam studies are on file at the NIEHS.
The chemical, a white, powdered solid, was identified as oxazepam by infrared, ultraviolet/visible, and nuclear magnetic resonance spectroscopy. Purity of oxazepam was determined by elemental analyses, Karl Fischer water analysis, functional group titration, thinlayer chromatography (two systems), and highperformance liquid chromatography. Elemental analyses for carbon, hydrogen, nitrogen, and chlorine were in agreement with the theoretical values for oxazepam. Karl Fischer water analysis indicated 0.026% ± 0.001% water. Functional group titration indicated a purity of 101.4% ± 0.5%. Thin-layer chromatography indicated a major spot and one trace impurity in one system, and only a major spot in a second system. High-performance liquid chromatography revealed a major peak with no impurity peaks with areas greater than 0.1% of the major peak area. The overall purity was determined to be greater than 99%.
Stability studies of the bulk chemical were performed by the analytical chemistry laboratory using highperformance liquid chromatography. These studies indicated that oxazepam was stable as a bulk chemical for 2 weeks when stored protected from light at temperatures up to 60E C. To ensure stability, the bulk chemical was stored at room temperature, protected from light, in metal cans or amber glass bottles.
Stability was monitored during the 2-year study using high-performance liquid chromatography. No degradation of the bulk chemical was detected.
PREPARATION AND ANALYSIS OF DOSE FORMULATIONS The dose formulations were prepared every 2 weeks by mixing oxazepam with feed (Table D1). Homogeneity and stability studies of a 500 ppm dose formulation were performed by the analytical chemistry laboratory using high-performance liquid chromatography. Homogeneity was confirmed and the stability of the dose formulation was confirmed for at least 3 weeks at 5E C when stored protected from light.
Periodic analyses of the dose formulations of oxazepam were conducted at the study laboratory and analytical chemistry laboratory using highperformance liquid chromatography. During the 2-year study, dose formulations were analyzed every 8 weeks (Table D2). All 50 of the dose formulations analyzed were within 10% of the target concentrations; 89% (17/19) of the animal room samples analyzed were within 10% of the target concentrations with no value differing more than 12% from the target concentration.
2-YEAR STUDY Study Design Groups of 50 male and 50 female F344/N rats were fed diets containing 0, 625, 1,250, 2,500, 5,000, or 10,000 ppm oxazepam for up to 105 weeks. The exposure concentrations were selected to provide a wide exposure range. No 13-week rat studies were performed because the data from the 13-week mouse study did not provide useful information for the selection of exposure concentrations for the prior 2-year mouse studies (NTP, 1993), and it was not anticipated that useful information would be gained from a 13-week rat study. The 5,000 ppm exposure concentration was determined during the course of the study to be the maximum tolerated dose. Concentrations of 0, 625, 2,500, and 5,000 ppm were selected for the continuous-exposure study. After
22 Oxazepam, NTP TR 468
26 weeks of exposure, rats in the 1,250 ppm group were eliminated from the study because it was anticipated that this group would provide no useful information. Rats in the 625, 2,500, and 5,000 ppm groups received dosed feed throughout the 2-year study. Rats in the 10,000 ppm group stopped receiving oxazepam in feed at 26 weeks and remained on control feed until study termination.
Source and Specification of Animals Male and female F344/N rats were obtained from Taconic Farms (Germantown, NY) for use in the 2-year study. Rats were quarantined for 13 days (males) or 14 days (females) before the beginning of the studies and were approximately 6 weeks old at the beginning of the study. Five male and five female rats were randomly selected for parasite evaluation and gross observation of disease at the end of the quarantine period. The health of the animals was monitored during the study according to the protocols of the NTP Sentinel Animal Program (Appendix G).
Animal Maintenance Rats were housed five per cage. Feed and water were available ad libitum. Feed consumption was measured for a 7-day interval during weeks 1 and 4 and every 4 weeks thereafter by cage. Cages were changed twice per week, and racks were rotated every 2 weeks. Further details of animal maintenance are given in Table 1. Information on feed composition and contaminants is provided in Appendix F.
Clinical Examinations and Pathology All animals were observed twice daily. Clinical findings were recorded every 4 weeks and at study termination. Individual body weights were recorded weekly for 13 weeks, monthly thereafter, and at the end of the study.
During study weeks 105 (males) and 104 (females) (1 to 3 days prior to necropsy), blood samples were collected from the retroorbital sinus of up to six males and six females in the 625, 2,500, and 5,000 ppm groups either at 6:00 a.m. or 6:00 p.m. On the days of necropsy, blood samples were similarly collected from up to 17 randomly selected female rats that had not been bled earlier. Plasma oxazepam concentra
tions were measured in all samples by Midwest Research Institute.
A complete necropsy and microscopic examination were performed on all rats in the 0, 625, 2,500, and 5,000 ppm groups. Rats in the 1,250 ppm group were discarded without tissue collection at 26 weeks. Histopathologic evaluation of rats in the 10,000 ppm group was limited to gross lesions, stomach (forestomach and glandular), small intestine, kidney, thyroid gland, and the liver. At necropsy, all organs and tissues were examined for grossly visible lesions, and all major tissues were fixed and preserved in 10% neutral buffered formalin, processed and trimmed, embedded in paraffin, sectioned to a thickness of 5 to 6 µm, and stained with hematoxylin and eosin for microscopic examination. For extended evaluation of renal tubule proliferative lesions in male rats, kidneys were step-sectioned at 1-mm intervals to obtain a maximum of four additional sections per kidney. For all paired organs (i.e., adrenal gland, kidney, and ovary), samples from each organ were examined. Tissues examined microscopically are listed in Table 1.
Microscopic evaluations were completed by the study laboratory pathologist, and the pathology data were entered into the Toxicology Data Management System. The slides, paraffin blocks, and residual wet tissues were sent to the NTP Archives for inventory, slide/block match, and wet tissue audit. The slides, individual animal data records, and pathology tables were evaluated by an independent quality assessment laboratory. The individual animal records and tables were compared for accuracy, the slide and tissue counts were verified, and the histotechnique was evaluated. For the 2-year study, a quality assessment pathologist evaluated slides from all tumors and all potential target organs, which included the adrenal cortex, forestomach, glandular stomach, and liver of males and females; the adrenal medulla, duodenum, eye, kidney, pancreas, preputial gland, rectum, and skin of males; and the spleen and thyroid gland of females.
The quality assessment report and the reviewed slides were submitted to the NTP Pathology Working Group (PWG) chairperson, who reviewed the selected tissues and addressed any inconsistencies in the diagnoses made by the laboratory and quality assessment
23 Oxazepam, NTP TR 468
pathologists. Representative histopathology slides containing examples of lesions related to chemical administration, examples of disagreements in diagnoses between the laboratory and quality assessment pathologist, or lesions of general interest were presented by the chairperson to the PWG for review. The PWG consisted of the quality assessment pathologist and other pathologists experienced in rodent toxicologic pathology. This group examined the tissues without any knowledge of dose groups or previously rendered diagnoses. When the PWG consensus differed from the opinion of the laboratory pathologist, the diagnosis was changed. Final diagnoses for reviewed lesions represent a consensus between the laboratory pathologist, reviewing pathologist(s), and the PWG. Details of these review procedures have been described, in part, by Maronpot and Boorman (1982) and Boorman et al. (1985). For subsequent analyses of the pathology data, the decision of whether to evaluate the diagnosed lesions for each tissue type separately or combined was generally based on the guidelines of McConnell et al. (1986).
STATISTICAL METHODS Survival Analyses The probability of survival was estimated by the product-limit procedure of Kaplan and Meier (1958) and is presented in the form of graphs. Animals found dead of other than natural causes were censored from the survival analyses; animals dying from natural causes were not censored. Statistical analyses for possible dose-related effects on survival used Cox’s (1972) method for testing two groups for equality and Tarone’s (1975) life table test to identify dose-related trends. All reported P values for the survival analyses are two sided.
Calculation of Incidence The incidences of neoplasms or nonneoplastic lesions as presented in Tables A1, A5, B1, and B5 are given as the number of animals bearing such lesions at a specific anatomic site and the number of animals with that site examined microscopically. For calculation of statistical significance, the incidences of most neoplasms (Tables A3a, A3b, B3a, and B3b) and all nonneoplastic lesions are given as the numbers of animals affected at each site examined microscopically. However, when macroscopic examination was required to detect neoplasms in certain tissues (e.g.,
harderian gland, intestine, mammary gland, and skin) before microscopic evaluation, or when neoplasms had multiple potential sites of occurrence (e.g., leukemia or lymphoma), the denominators consist of the number of animals on which a necropsy was performed. Tables A3a, A3b, B3a, and B3b also give the survivaladjusted neoplasm rate for each group and each sitespecific neoplasm, i.e., the Kaplan-Meier estimate of the neoplasm incidence that would have been observed at the end of the study in the absence of mortality from all other competing risks (Kaplan and Meier, 1958).
Analysis of Neoplasm Incidences The majority of neoplasms in these studies were considered to be incidental to the cause of death or not rapidly lethal. Thus, the primary statistical method used was logistic regression analysis, which assumed that the diagnosed neoplasms were discovered as the result of death from an unrelated cause and thus did not affect the risk of death. In this approach, neoplasm prevalence was modeled as a logistic function of chemical exposure and time. Both linear and quadratic terms in time were incorporated initially, and the quadratic term was eliminated if the fit of the model was not significantly enhanced. The neoplasm incidences of exposed and control groups were compared on the basis of the likelihood score test for the regression coefficient of dose. This method of adjusting for intercurrent mortality is the prevalence analysis of Dinse and Lagakos (1983), further described and illustrated by Dinse and Haseman (1986). When neoplasms are incidental, this comparison of the time-specific neoplasm prevalences also provides a comparison of the time-specific neoplasm incidences (McKnight and Crowley, 1984).
In addition to logistic regression, other methods of statistical analysis were used, and the results of these tests are summarized in the appendixes. These methods include the life table test (Cox, 1972; Tarone, 1975), appropriate for rapidly lethal neoplasms, and the Fisher exact test and the Cochran-Armitage trend test (Armitage, 1971; Gart et al., 1979), procedures based on the overall proportion of neoplasm-bearing animals.
Tests of significance included pairwise comparisons of each exposed group with controls and a test for an overall dose-related trend. Continuity-corrected tests were used in the analysis of neoplasm incidence, and reported P values are one sided. The procedures
24 Oxazepam, NTP TR 468
described in the preceding paragraphs were also used to evaluate selected nonneoplastic lesions. For further discussion of these statistical methods, refer to Haseman (1984).
Analysis of Nonneoplastic Lesion Incidences Because all nonneoplastic lesions in this study were considered to be incidental to the cause of death or not rapidly lethal, the primary statistical analysis used was a logistic regression analysis in which nonneoplastic lesion prevalence was modeled as a logistic function of chemical exposure and time.
Analysis of Continuous Variables Prior to analysis, extreme values identified by the outlier test of Dixon and Massey (1951) were examined by NTP personnel, and implausible values were eliminated from the analysis. Average severity values were analyzed for significance using the Mann-Whitney U test (Hollander and Wolfe, 1973).
Historical Control Data Although the concurrent control group is always the first and most appropriate control group used for evaluation, historical control data can be helpful in the overall assessment of neoplasm incidence in certain instances. Consequently, neoplasm incidences from the NTP historical control database, which is updated yearly, are included in the NTP reports for neoplasms appearing to show compound-related effects.
QUALITY ASSURANCE METHODS The 2-year study was conducted in compliance with Food and Drug Administration Good Laboratory Practice Regulations (21 CFR, Part 58). In addition, as records from the 2-year study were submitted to the NTP Archives, this study was audited retrospectively by an independent quality assurance contractor. Separate audits covering completeness and accuracy of the pathology data, pathology specimens, final pathology tables, and a draft of this NTP Technical Report were conducted. Audit procedures and findings are presented in the reports and are on file at NIEHS. The audit findings were reviewed and assessed by NTP staff, so all comments had been resolved or were otherwise addressed during the preparation of this Technical Report.
GENETIC TOXICOLOGY The genetic toxicity of oxazepam was assessed by testing the ability of the chemical to induce mutations in various strains of Salmonella typhimurium, sister chromatid exchanges and chromosomal aberrations in cultured Chinese hamster ovary cells, and increases in the frequency of micronucleated erythrocytes in peripheral blood of mice. The protocols for these studies and the results are given in Appendix C.
The genetic toxicity studies of oxazepam are part of a larger effort by the NTP to develop a database that would permit the evaluation of carcinogenicity in experimental animals from the molecular structure and the effects of the chemical in short-term in vitro and in vivo genetic toxicity tests. These genetic toxicity tests were originally developed to study mechanisms of chemical-induced DNA damage and to predict carcinogenicity in animals, based on the electrophilicity theory of chemical mutagenesis and the somatic mutation theory of cancer (Miller and Miller, 1977; Straus, 1981; Crawford, 1985).
There is a strong correlation between a chemical’s potential electrophilicity (structural alert to DNA reactivity), mutagenicity in Salmonella, and carcinogenicity in rodents. The combination of electrophilicity and Salmonella mutagenicity is highly correlated with the induction of carcinogenicity in rats and mice and/or at multiple tissue sites (Ashby and Tennant, 1991). Other in vitro genetic toxicity tests correlate less well with rodent carcinogenicity (Tennant et al., 1987; Zeiger et al., 1990), although these other tests can provide information on the types of DNA and chromosome effects that can be induced by the chemical being investigated. Data from NTP studies show that a positive response in Salmonella is the most predictive in vitro test for rodent carcinogenicity (89% of the Salmonella mutagens are rodent carcinogens), and that there is no complementarity among the in vitro genetic toxicity tests. That is, no battery of tests that included the Salmonella test improved the predictivity of the Salmonella test alone.
The predictivity for carcinogenicity of a positive response in bone marrow chromosome aberration or micronucleus tests appears to be less than the Salmonella test (Shelby et al., 1993; Shelby and Witt,
25 Oxazepam, NTP TR 468
1995). Positive responses in long term peripheral adverse effects in somatic and germ cells, the blood micronucleus tests have not been formally eval- determination of in vivo genetic effects is important to uated for their predictivity for rodent carcinogenicity. the overall understanding of the risks associated with But because of the theoretical and observed exposure to a particular chemical. associations between induced genetic damage and
26 Oxazepam, NTP TR 468
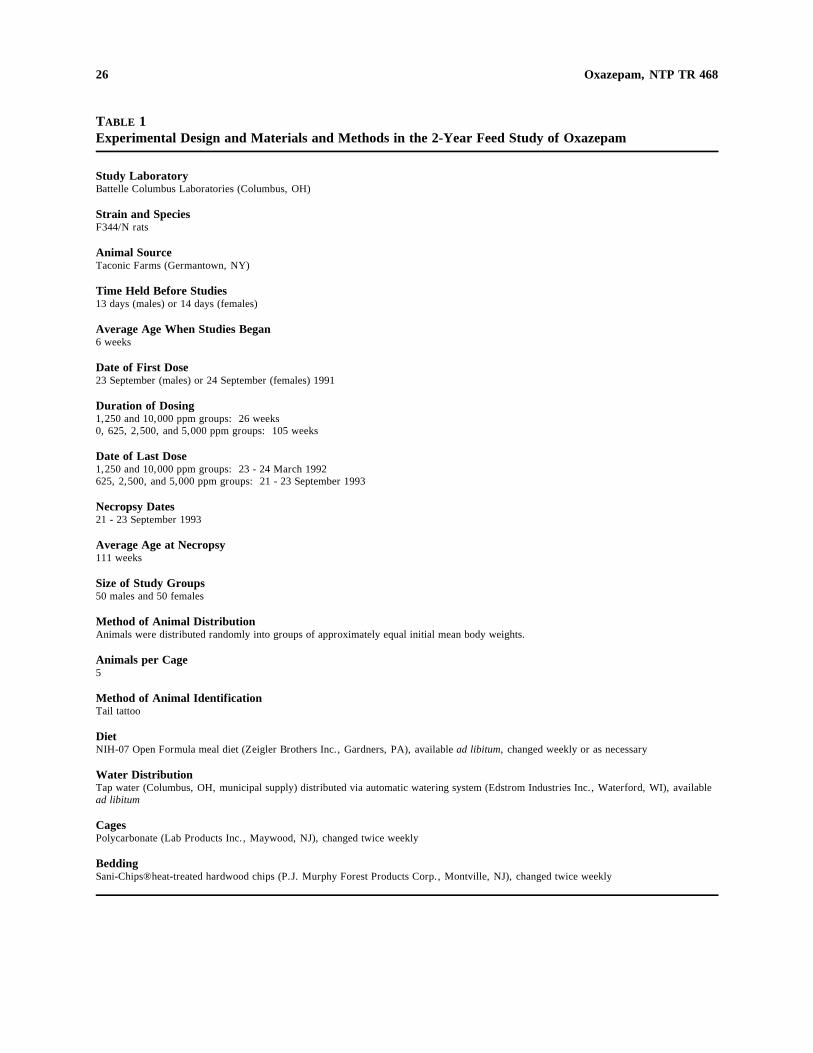
TABLE 1 Experimental Design and Materials and Methods in the 2-Year Feed Study of Oxazepam
Study Laboratory Battelle Columbus Laboratories (Columbus, OH)
Strain and Species F344/N rats
Animal Source Taconic Farms (Germantown, NY)
Time Held Before Studies 13 days (males) or 14 days (females)
Average Age When Studies Began 6 weeks
Date of First Dose 23 September (males) or 24 September (females) 1991
Duration of Dosing 1,250 and 10,000 ppm groups: 26 weeks 0, 625, 2,500, and 5,000 ppm groups: 105 weeks
Date of Last Dose 1,250 and 10,000 ppm groups: 23 - 24 March 1992 625, 2,500, and 5,000 ppm groups: 21 - 23 September 1993
Necropsy Dates 21 - 23 September 1993
Average Age at Necropsy 111 weeks
Size of Study Groups 50 males and 50 females
Method of Animal Distribution Animals were distributed randomly into groups of approximately equal initial mean body weights.
Animals per Cage 5
Method of Animal Identification Tail tattoo
Diet NIH-07 Open Formula meal diet (Zeigler Brothers Inc., Gardners, PA), available ad libitum, changed weekly or as necessary
Water Distribution Tap water (Columbus, OH, municipal supply) distributed via automatic watering system (Edstrom Industries Inc., Waterford, WI), available ad libitum
Cages Polycarbonate (Lab Products Inc., Maywood, NJ), changed twice weekly
Bedding Sani-Chips® heat-treated hardwood chips (P.J. Murphy Forest Products Corp., Montville, NJ), changed twice weekly

27 Oxazepam, NTP TR 468
TABLE 1 Experimental Design and Materials and Methods in the 2-Year Feed Study of Oxazepam (continued)
Cage Filters DuPont 2024 spun-bonded polyester filters (Snow Filtration Co., Cincinnati, OH), changed once every 2 weeks
Racks Stainless steel (Lab Products Inc., Maywood, NJ), rotated every 2 weeks
Animal Room Environment Temperature: 19.4E to 25.6E C Relative humidity: 36% to 66% Fluorescent light: 12 hours/day Room air: minimum of 10 changes/hour
Doses 0, 625, 1,250, 2,500, 5,000, or 10,000 ppm in feed
Type and Frequency of Observation Rats were observed twice daily; clinical findings were recorded every 4 weeks and at study termination; individual body weights were recorded weekly for 13 weeks, monthly thereafter, and at study termination. Feed consumption was recorded for a 7-day interval during study weeks 1 and 4, and every 4 weeks thereafter by cage.
Method of Sacrifice CO2 asphyxiation
Necropsy Necropsy performed on all rats except the 1,250 ppm group
Histopathology Complete histopathology was performed on all 0, 625, 2,500, and 5,000 ppm rats. In addition to gross lesions, tissue masses, and associated lymph nodes, the tissues examined included: adrenal gland, brain, clitoral gland, esophagus, eyes, heart, large intestine (cecum, colon, and rectum), small intestine (duodenum, jejunum, and ileum), kidney, liver, lung, lymph nodes (mandibular and mesenteric), mammary gland, nose, ovary, pancreas, parathyroid gland, pituitary gland, preputial gland, prostate gland, salivary gland, skin, spleen, stomach (forestomach and glandular stomach), testis, thymus, thyroid gland, trachea, urinary bladder, and uterus. Histopathologic evaluation was limited to gross lesions, stomach (forestomach and glandular), small intestine, kidney, thyroid gland, and liver for the 10,000 ppm group.
Plasma Oxazepam Determinations At weeks 27 (1,250 ppm group) and 105 (males) and 104 (females) (625, 2,500, and 5,000 ppm groups), blood was collected from the vena cava or retroorbital sinus for plasma oxazepam assays.

28 Oxazepam, NTP TR 468
29
RESULTS
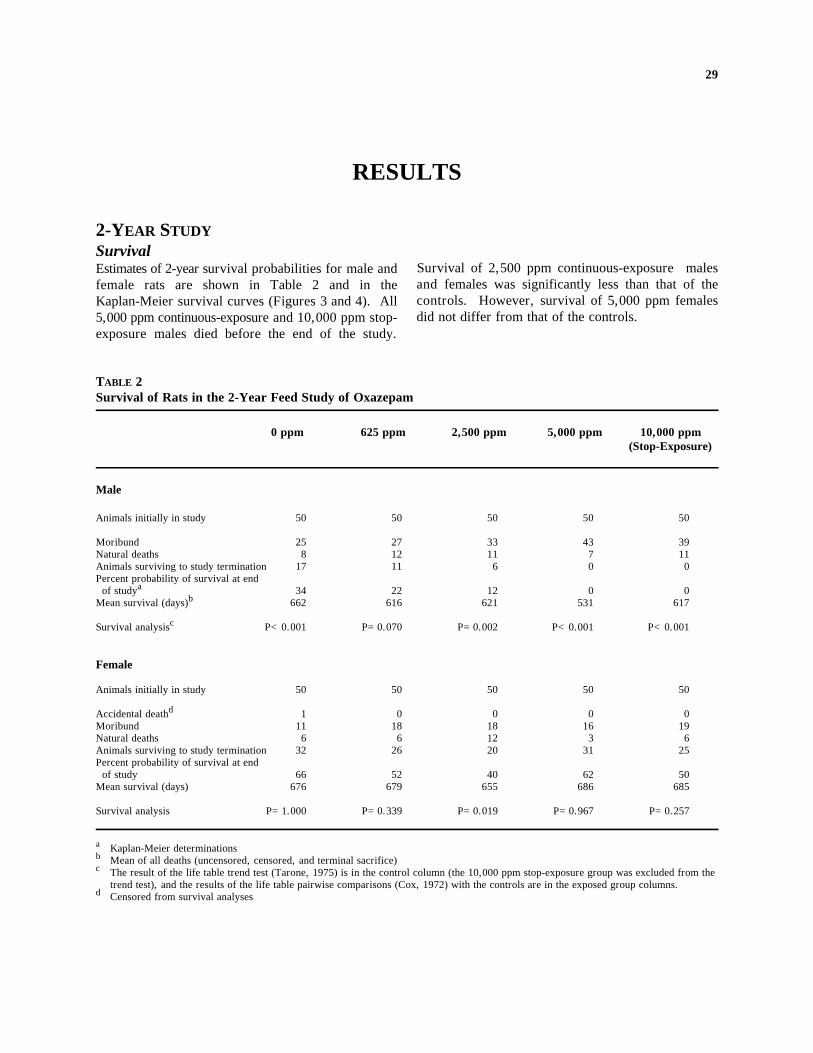
2-YEAR STUDY Survival Estimates of 2-year survival probabilities for male and Survival of 2,500 ppm continuous-exposure males female rats are shown in Table 2 and in the and females was significantly less than that of the Kaplan-Meier survival curves (Figures 3 and 4). All controls. However, survival of 5,000 ppm females 5,000 ppm continuous-exposure and 10,000 ppm stop- did not differ from that of the controls. exposure males died before the end of the study.
TABLE 2 Survival of Rats in the 2-Year Feed Study of Oxazepam
0 ppm 625 ppm 2,500 ppm 5,000 ppm 10,000 ppm (Stop-Exposure)
Male
Animals initially in study 50 50 50 50 50
Moribund 25 27 33 43 39 Natural deaths 8 12 11 7 11 Animals surviving to study termination 17 11 6 0 0 Percent probability of survival at end
aof study 34 22 12 0 0 Mean survival (days)b 662 616 621 531 617
cSurvival analysis P<0.001 P=0.070 P=0.002 P<0.001 P<0.001
Female
Animals initially in study 50 50 50 50 50
dAccidental death 1 0 0 0 0 Moribund 11 18 18 16 19 Natural deaths 6 6 12 3 6 Animals surviving to study termination 32 26 20 31 25 Percent probability of survival at end of study 66 52 40 62 50 Mean survival (days) 676 679 655 686 685
Survival analysis P=1.000 P=0.339 P=0.019 P=0.967 P=0.257
a Kaplan-Meier determinationsb Mean of all deaths (uncensored, censored, and terminal sacrifice)
The result of the life table trend test (Tarone, 1975) is in the control column (the 10,000 ppm stop-exposure group was excluded from the trend test), and the results of the life table pairwise comparisons (Cox, 1972) with the controls are in the exposed group columns.
d Censored from survival analyses
c
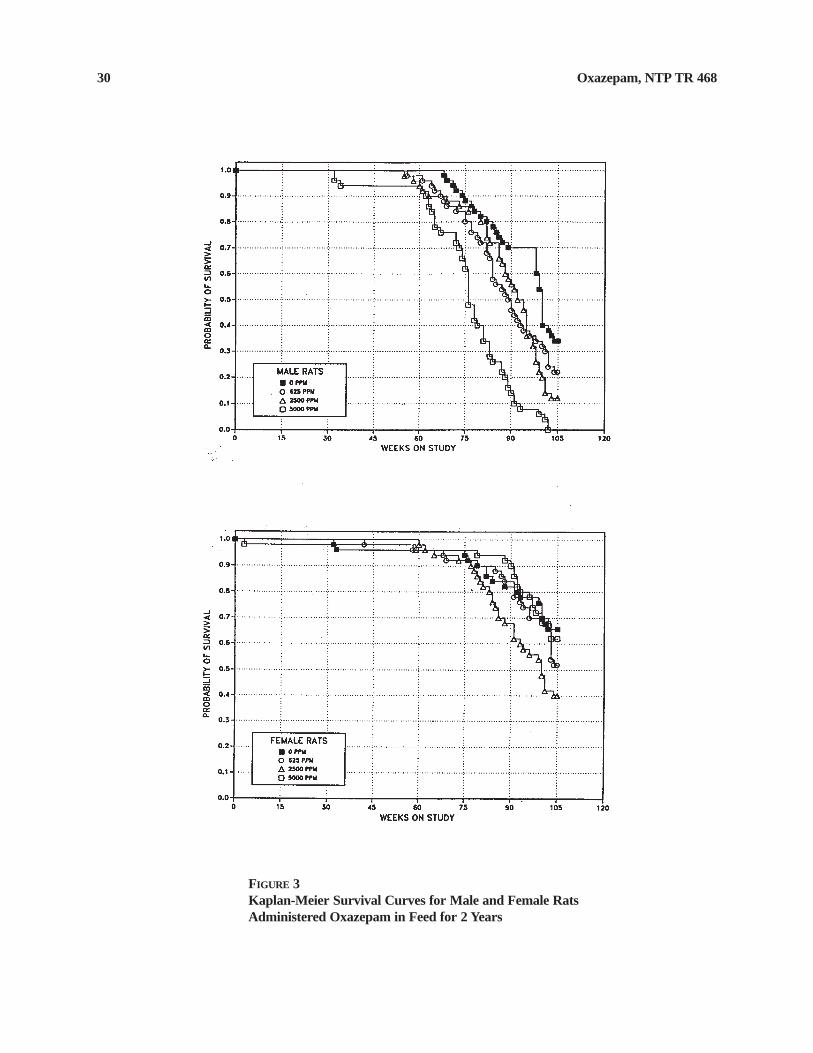
30 Oxazepam, NTP TR 468
FIGURE 3 Kaplan-Meier Survival Curves for Male and Female Rats Administered Oxazepam in Feed for 2 Years
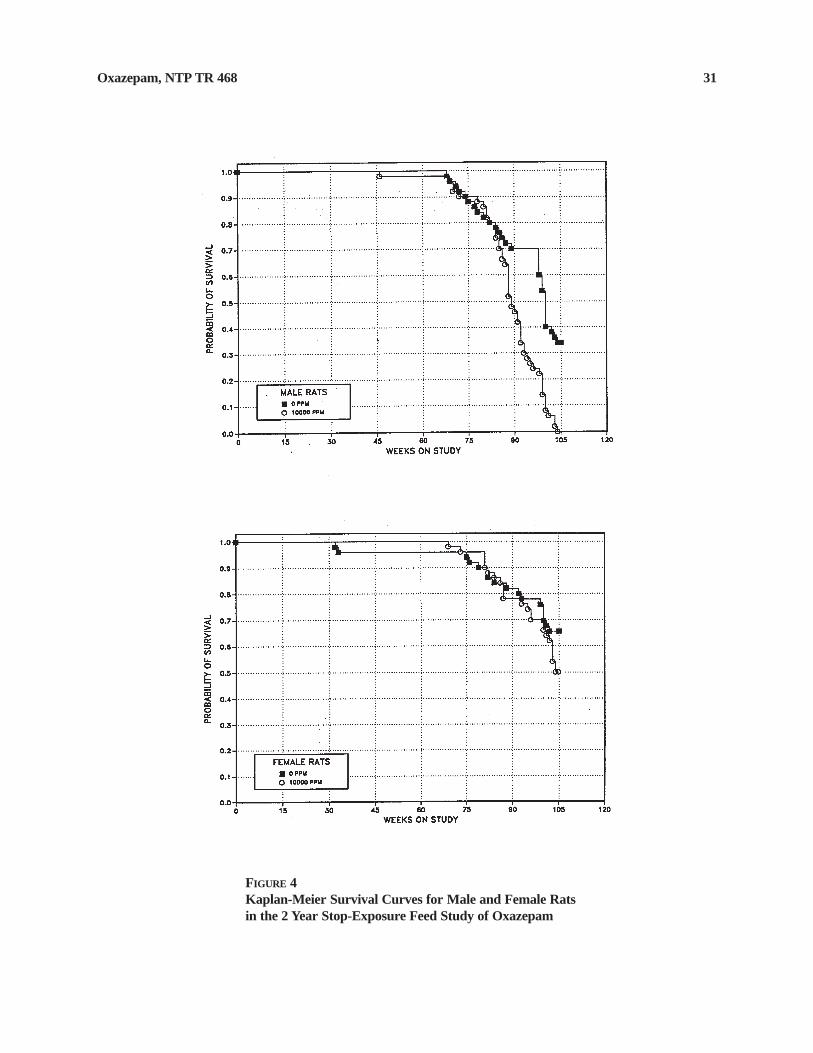
31 Oxazepam, NTP TR 468
FIGURE 4 Kaplan-Meier Survival Curves for Male and Female Rats in the 2 Year Stop-Exposure Feed Study of Oxazepam
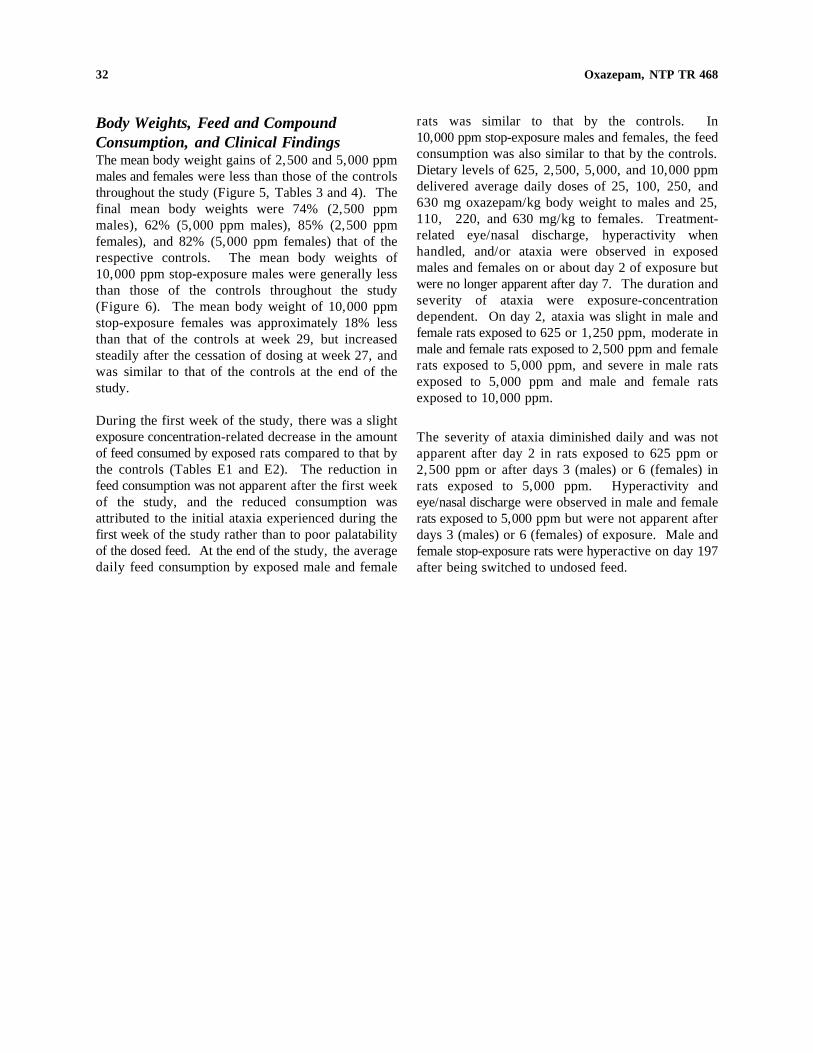
32 Oxazepam, NTP TR 468
Body Weights, Feed and Compound Consumption, and Clinical Findings The mean body weight gains of 2,500 and 5,000 ppm males and females were less than those of the controls throughout the study (Figure 5, Tables 3 and 4). The final mean body weights were 74% (2,500 ppm males), 62% (5,000 ppm males), 85% (2,500 ppm females), and 82% (5,000 ppm females) that of the respective controls. The mean body weights of 10,000 ppm stop-exposure males were generally less than those of the controls throughout the study (Figure 6). The mean body weight of 10,000 ppm stop-exposure females was approximately 18% less than that of the controls at week 29, but increased steadily after the cessation of dosing at week 27, and was similar to that of the controls at the end of the study.
During the first week of the study, there was a slight exposure concentration-related decrease in the amount of feed consumed by exposed rats compared to that by the controls (Tables E1 and E2). The reduction in feed consumption was not apparent after the first week of the study, and the reduced consumption was attributed to the initial ataxia experienced during the first week of the study rather than to poor palatability of the dosed feed. At the end of the study, the average daily feed consumption by exposed male and female
rats was similar to that by the controls. In 10,000 ppm stop-exposure males and females, the feed consumption was also similar to that by the controls. Dietary levels of 625, 2,500, 5,000, and 10,000 ppm delivered average daily doses of 25, 100, 250, and 630 mg oxazepam/kg body weight to males and 25, 110, 220, and 630 mg/kg to females. Treatmentrelated eye/nasal discharge, hyperactivity when handled, and/or ataxia were observed in exposed males and females on or about day 2 of exposure but were no longer apparent after day 7. The duration and severity of ataxia were exposure-concentration dependent. On day 2, ataxia was slight in male and female rats exposed to 625 or 1,250 ppm, moderate in male and female rats exposed to 2,500 ppm and female rats exposed to 5,000 ppm, and severe in male rats exposed to 5,000 ppm and male and female rats exposed to 10,000 ppm.
The severity of ataxia diminished daily and was not apparent after day 2 in rats exposed to 625 ppm or 2,500 ppm or after days 3 (males) or 6 (females) in rats exposed to 5,000 ppm. Hyperactivity and eye/nasal discharge were observed in male and female rats exposed to 5,000 ppm but were not apparent after days 3 (males) or 6 (females) of exposure. Male and female stop-exposure rats were hyperactive on day 197 after being switched to undosed feed.
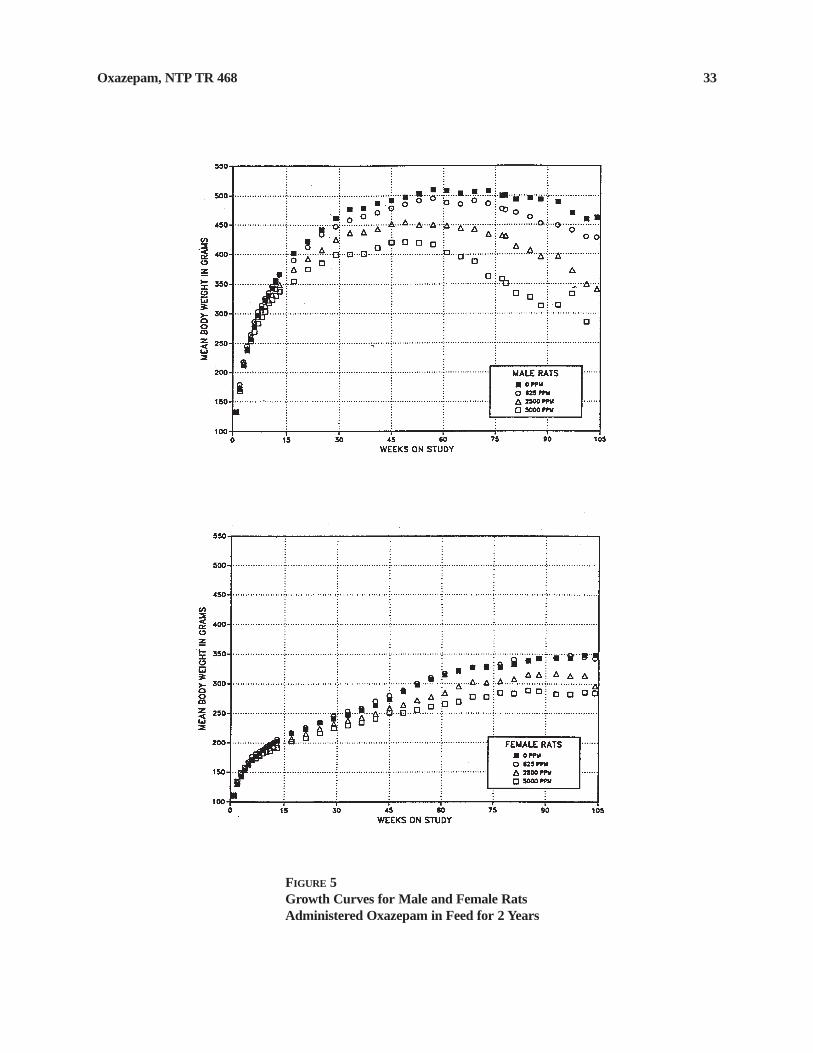
33 Oxazepam, NTP TR 468
FIGURE 5 Growth Curves for Male and Female Rats Administered Oxazepam in Feed for 2 Years
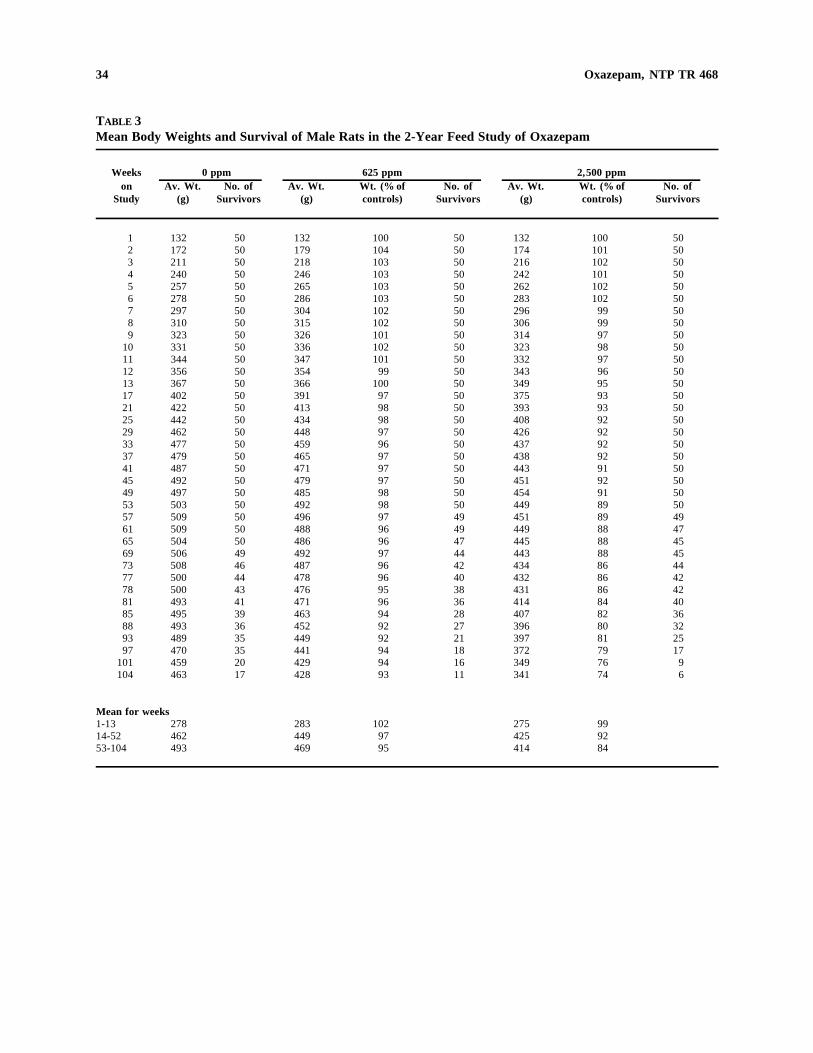
34 Oxazepam, NTP TR 468
TABLE 3 Mean Body Weights and Survival of Male Rats in the 2-Year Feed Study of Oxazepam
Weeks 0 ppm 625 ppm 2,500 ppm on Av. Wt. No. of Av. Wt. Wt. (% of No. of Av. Wt. Wt. (% of No. of
Study (g) Survivors (g) controls) Survivors (g) controls) Survivors
1 132 50 132 100 50 132 100 50 2 172 50 179 104 50 174 101 50 3 211 50 218 103 50 216 102 50 4 240 50 246 103 50 242 101 50 5 257 50 265 103 50 262 102 50 6 278 50 286 103 50 283 102 50 7 297 50 304 102 50 296 99 50 8 310 50 315 102 50 306 99 50 9 323 50 326 101 50 314 97 50
10 331 50 336 102 50 323 98 50 11 344 50 347 101 50 332 97 50 12 356 50 354 99 50 343 96 50 13 367 50 366 100 50 349 95 50 17 402 50 391 97 50 375 93 50 21 422 50 413 98 50 393 93 50 25 442 50 434 98 50 408 92 50 29 462 50 448 97 50 426 92 50 33 477 50 459 96 50 437 92 50 37 479 50 465 97 50 438 92 50 41 487 50 471 97 50 443 91 50 45 492 50 479 97 50 451 92 50 49 497 50 485 98 50 454 91 50 53 503 50 492 98 50 449 89 50 57 509 50 496 97 49 451 89 49 61 509 50 488 96 49 449 88 47 65 504 50 486 96 47 445 88 45 69 506 49 492 97 44 443 88 45 73 508 46 487 96 42 434 86 44 77 500 44 478 96 40 432 86 42 78 500 43 476 95 38 431 86 42 81 493 41 471 96 36 414 84 40 85 495 39 463 94 28 407 82 36 88 493 36 452 92 27 396 80 32 93 489 35 449 92 21 397 81 25 97 470 35 441 94 18 372 79 17
101 459 20 429 94 16 349 76 9 104 463 17 428 93 11 341 74 6
Mean for weeks 1-13 278 283 102 275 99 14-52 462 449 97 425 92 53-104 493 469 95 414 84
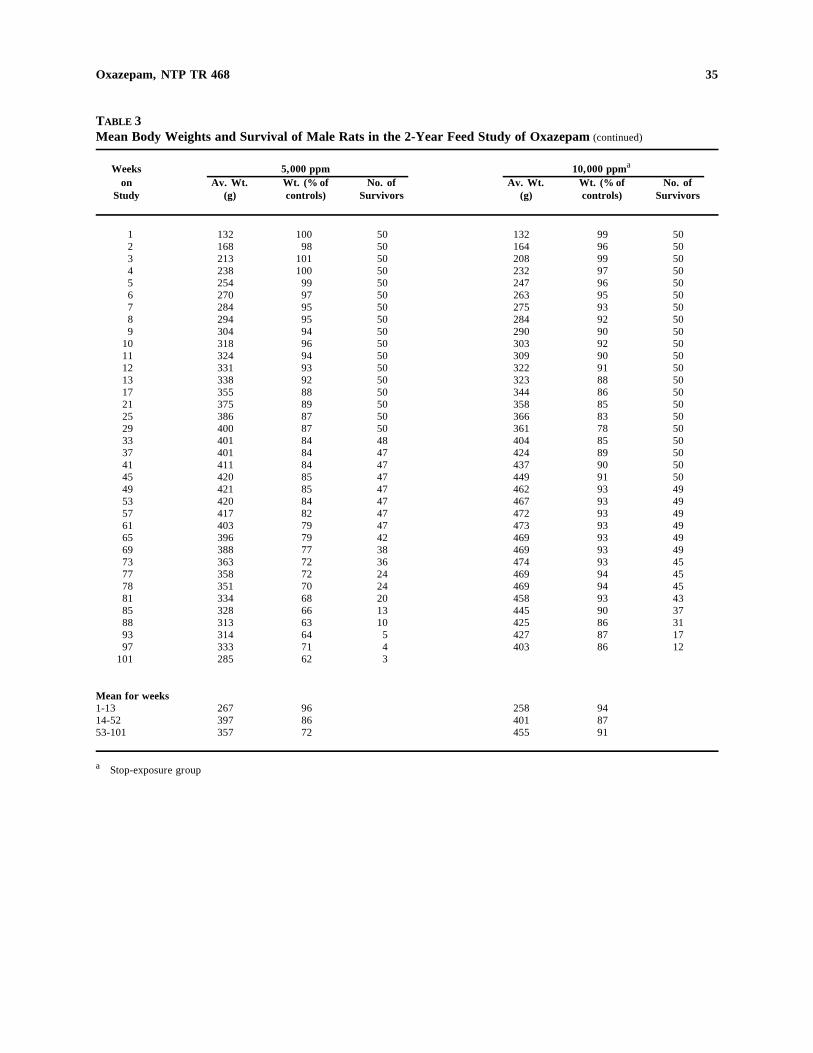
35 Oxazepam, NTP TR 468
TABLE 3 Mean Body Weights and Survival of Male Rats in the 2-Year Feed Study of Oxazepam (continued)
Weeks 5,000 ppm 10,000 ppma
on Av. Wt. Wt. (% of No. of Av. Wt. Wt. (% of No. of Study (g) controls) Survivors (g) controls) Survivors
1 132 100 50 132 99 50 2 168 98 50 164 96 50 3 213 101 50 208 99 50 4 238 100 50 232 97 50 5 254 99 50 247 96 50 6 270 97 50 263 95 50 7 284 95 50 275 93 50 8 294 95 50 284 92 50 9 304 94 50 290 90 50
10 318 96 50 303 92 50 11 324 94 50 309 90 50 12 331 93 50 322 91 50 13 338 92 50 323 88 50 17 355 88 50 344 86 50 21 375 89 50 358 85 50 25 386 87 50 366 83 50 29 400 87 50 361 78 50 33 401 84 48 404 85 50 37 401 84 47 424 89 50 41 411 84 47 437 90 50 45 420 85 47 449 91 50 49 421 85 47 462 93 49 53 420 84 47 467 93 49 57 417 82 47 472 93 49 61 403 79 47 473 93 49 65 396 79 42 469 93 49 69 388 77 38 469 93 49 73 363 72 36 474 93 45 77 358 72 24 469 94 45 78 351 70 24 469 94 45 81 334 68 20 458 93 43 85 328 66 13 445 90 37 88 313 63 10 425 86 31 93 314 64 5 427 87 17 97 333 71 4 403 86 12
101 285 62 3
Mean for weeks 1-13 267 96 258 94 14-52 397 86 401 87 53-101 357 72 455 91
a Stop-exposure group
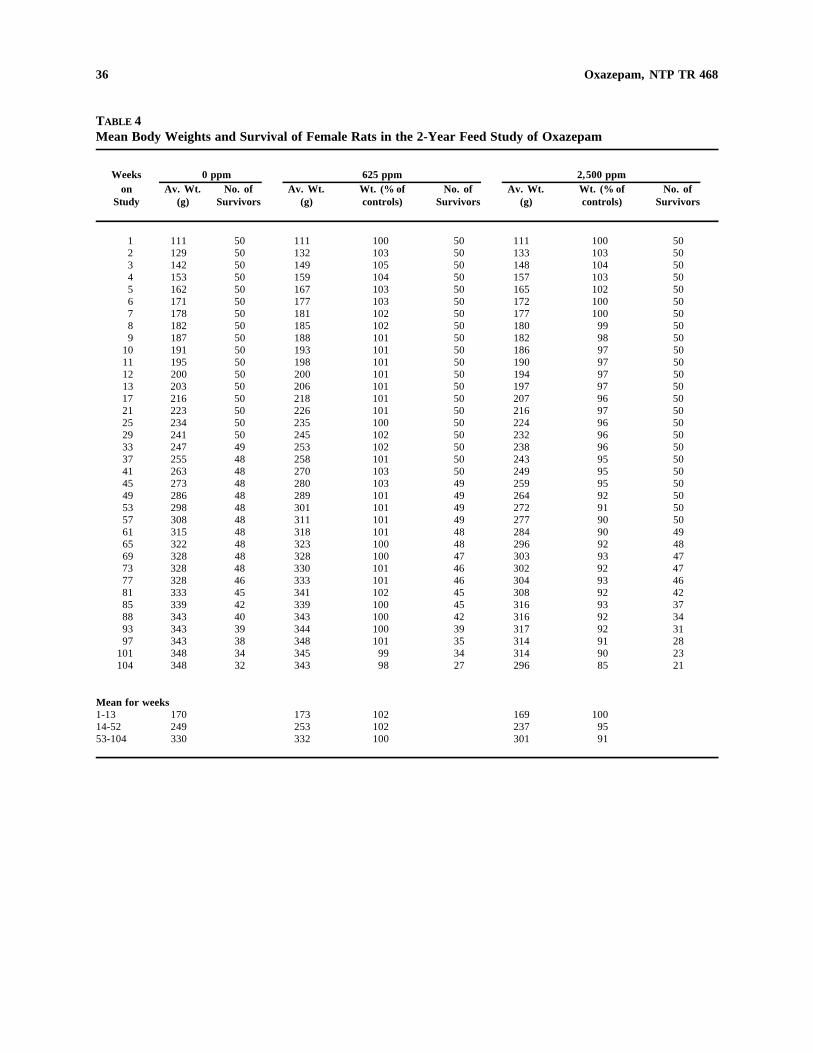
36 Oxazepam, NTP TR 468
TABLE 4 Mean Body Weights and Survival of Female Rats in the 2-Year Feed Study of Oxazepam
Weeks 0 ppm 625 ppm 2,500 ppm on Av. Wt. No. of Av. Wt. Wt. (% of No. of Av. Wt. Wt. (% of No. of
Study (g) Survivors (g) controls) Survivors (g) controls) Survivors
1 111 50 111 100 50 111 100 50 2 129 50 132 103 50 133 103 50 3 142 50 149 105 50 148 104 50 4 153 50 159 104 50 157 103 50 5 162 50 167 103 50 165 102 50 6 171 50 177 103 50 172 100 50 7 178 50 181 102 50 177 100 50 8 182 50 185 102 50 180 99 50 9 187 50 188 101 50 182 98 50
10 191 50 193 101 50 186 97 50 11 195 50 198 101 50 190 97 50 12 200 50 200 101 50 194 97 50 13 203 50 206 101 50 197 97 50 17 216 50 218 101 50 207 96 50 21 223 50 226 101 50 216 97 50 25 234 50 235 100 50 224 96 50 29 241 50 245 102 50 232 96 50 33 247 49 253 102 50 238 96 50 37 255 48 258 101 50 243 95 50 41 263 48 270 103 50 249 95 50 45 273 48 280 103 49 259 95 50 49 286 48 289 101 49 264 92 50 53 298 48 301 101 49 272 91 50 57 308 48 311 101 49 277 90 50 61 315 48 318 101 48 284 90 49 65 322 48 323 100 48 296 92 48 69 328 48 328 100 47 303 93 47 73 328 48 330 101 46 302 92 47 77 328 46 333 101 46 304 93 46 81 333 45 341 102 45 308 92 42 85 339 42 339 100 45 316 93 37 88 343 40 343 100 42 316 92 34 93 343 39 344 100 39 317 92 31 97 343 38 348 101 35 314 91 28
101 348 34 345 99 34 314 90 23 104 348 32 343 98 27 296 85 21
Mean for weeks 1-13 170 173 102 169 100 14-52 249 253 102 237 95 53-104 330 332 100 301 91
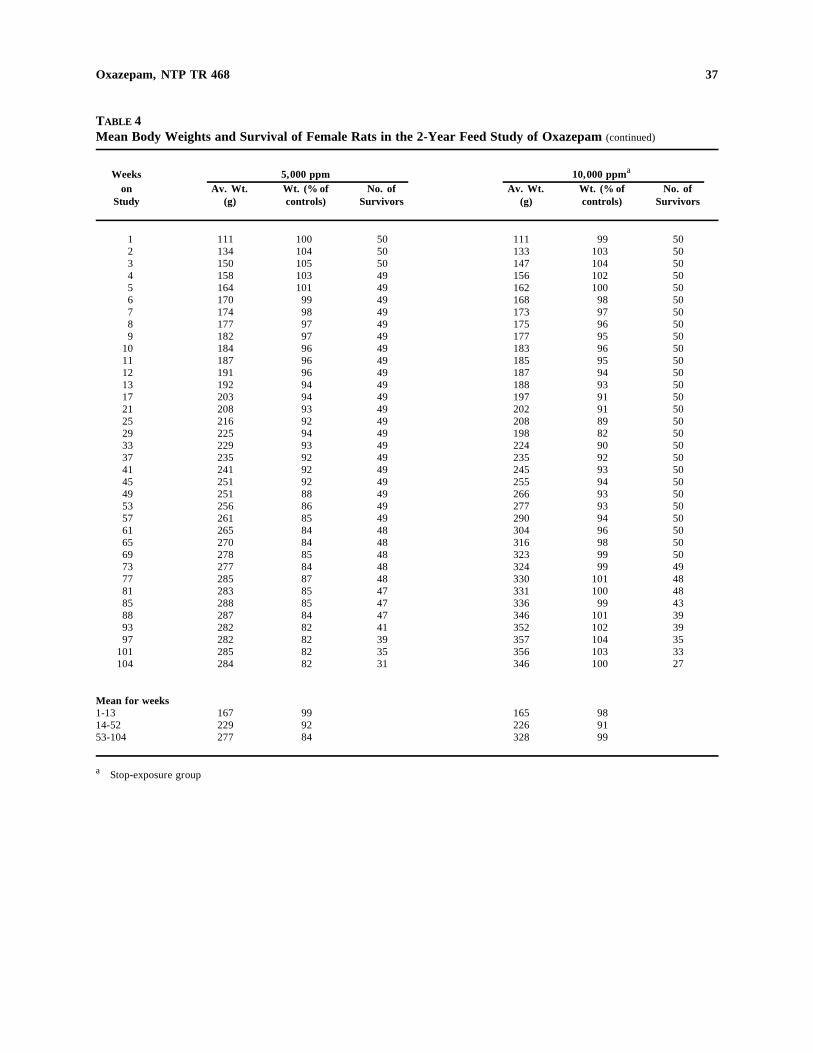
37 Oxazepam, NTP TR 468
TABLE 4 Mean Body Weights and Survival of Female Rats in the 2-Year Feed Study of Oxazepam (continued)
Weeks 5,000 ppm 10,000 ppma
on Av. Wt. Wt. (% of No. of Av. Wt. Wt. (% of No. of Study (g) controls) Survivors (g) controls) Survivors
1 111 100 50 111 99 50 2 134 104 50 133 103 50 3 150 105 50 147 104 50 4 158 103 49 156 102 50 5 164 101 49 162 100 50 6 170 99 49 168 98 50 7 174 98 49 173 97 50 8 177 97 49 175 96 50 9 182 97 49 177 95 50
10 184 96 49 183 96 50 11 187 96 49 185 95 50 12 191 96 49 187 94 50 13 192 94 49 188 93 50 17 203 94 49 197 91 50 21 208 93 49 202 91 50 25 216 92 49 208 89 50 29 225 94 49 198 82 50 33 229 93 49 224 90 50 37 235 92 49 235 92 50 41 241 92 49 245 93 50 45 251 92 49 255 94 50 49 251 88 49 266 93 50 53 256 86 49 277 93 50 57 261 85 49 290 94 50 61 265 84 48 304 96 50 65 270 84 48 316 98 50 69 278 85 48 323 99 50 73 277 84 48 324 99 49 77 285 87 48 330 101 48 81 283 85 47 331 100 48 85 288 85 47 336 99 43 88 287 84 47 346 101 39 93 282 82 41 352 102 39 97 282 82 39 357 104 35
101 285 82 35 356 103 33 104 284 82 31 346 100 27
Mean for weeks 1-13 167 99 165 98 14-52 229 92 226 91 53-104 277 84 328 99
a Stop-exposure group
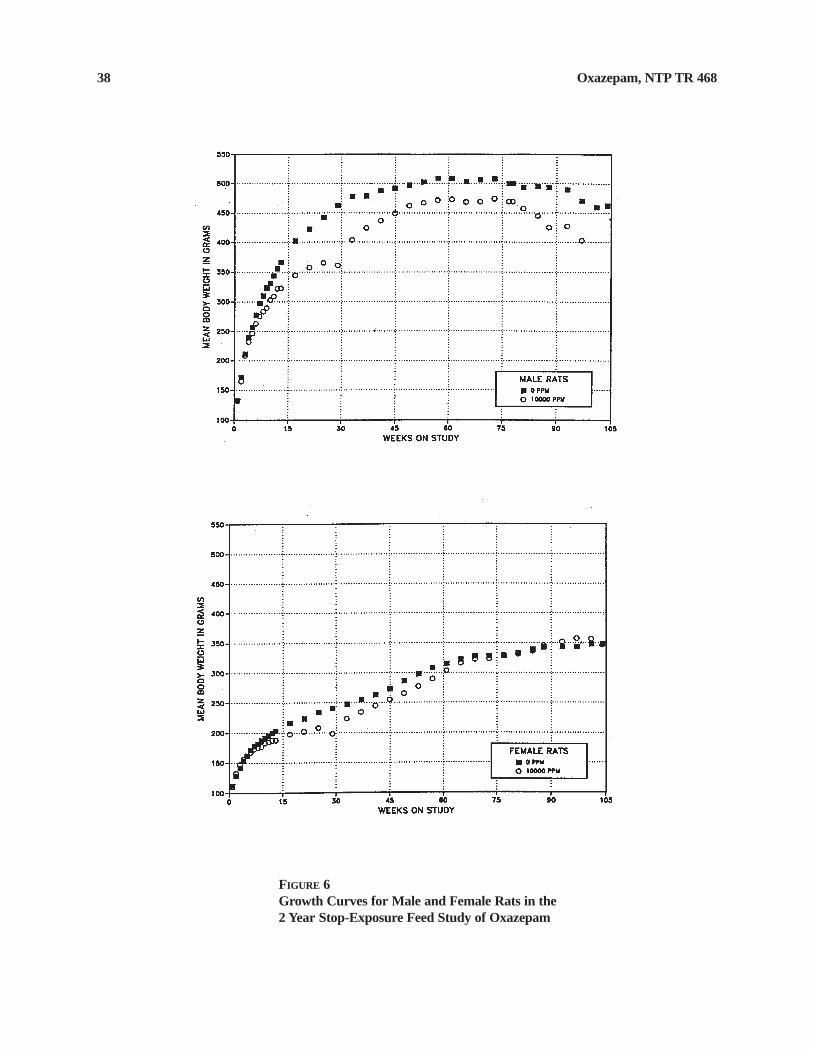
38 Oxazepam, NTP TR 468
FIGURE 6 Growth Curves for Male and Female Rats in the 2 Year Stop-Exposure Feed Study of Oxazepam
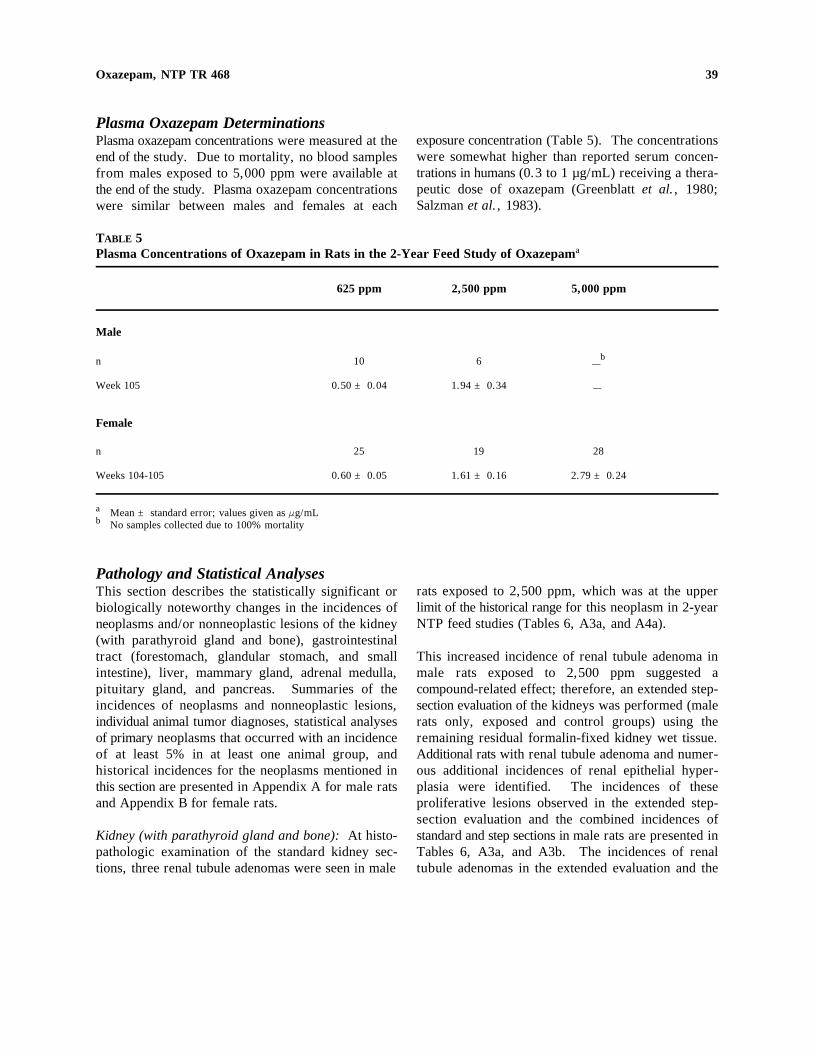
39 Oxazepam, NTP TR 468
Plasma Oxazepam Determinations Plasma oxazepam concentrations were measured at the exposure concentration (Table 5). The concentrations end of the study. Due to mortality, no blood samples were somewhat higher than reported serum concenfrom males exposed to 5,000 ppm were available at trations in humans (0.3 to 1 µg/mL) receiving a therathe end of the study. Plasma oxazepam concentrations peutic dose of oxazepam (Greenblatt et al., 1980; were similar between males and females at each Salzman et al., 1983).
TABLE 5 Plasma Concentrations of Oxazepam in Rats in the 2-Year Feed Study of Oxazepama
625 ppm 2,500 ppm 5,000 ppm
Male
n 10 6 Ób
Week 105 0.50 ± 0.04 1.94 ± 0.34 Ó
Female
n 25 19 28
Weeks 104-105 0.60 ± 0.05 1.61 ± 0.16 2.79 ± 0.24
a Mean ± standard error; values given as Fg/mLb No samples collected due to 100% mortality
Pathology and Statistical Analyses This section describes the statistically significant or biologically noteworthy changes in the incidences of neoplasms and/or nonneoplastic lesions of the kidney (with parathyroid gland and bone), gastrointestinal tract (forestomach, glandular stomach, and small intestine), liver, mammary gland, adrenal medulla, pituitary gland, and pancreas. Summaries of the incidences of neoplasms and nonneoplastic lesions, individual animal tumor diagnoses, statistical analyses of primary neoplasms that occurred with an incidence of at least 5% in at least one animal group, and historical incidences for the neoplasms mentioned in this section are presented in Appendix A for male rats and Appendix B for female rats.
Kidney (with parathyroid gland and bone): At histopathologic examination of the standard kidney sections, three renal tubule adenomas were seen in male
rats exposed to 2,500 ppm, which was at the upper limit of the historical range for this neoplasm in 2-year NTP feed studies (Tables 6, A3a, and A4a).
This increased incidence of renal tubule adenoma in male rats exposed to 2,500 ppm suggested a compound-related effect; therefore, an extended stepsection evaluation of the kidneys was performed (male rats only, exposed and control groups) using the remaining residual formalin-fixed kidney wet tissue. Additional rats with renal tubule adenoma and numerous additional incidences of renal epithelial hyperplasia were identified. The incidences of these proliferative lesions observed in the extended stepsection evaluation and the combined incidences of standard and step sections in male rats are presented in Tables 6, A3a, and A3b. The incidences of renal tubule adenomas in the extended evaluation and the
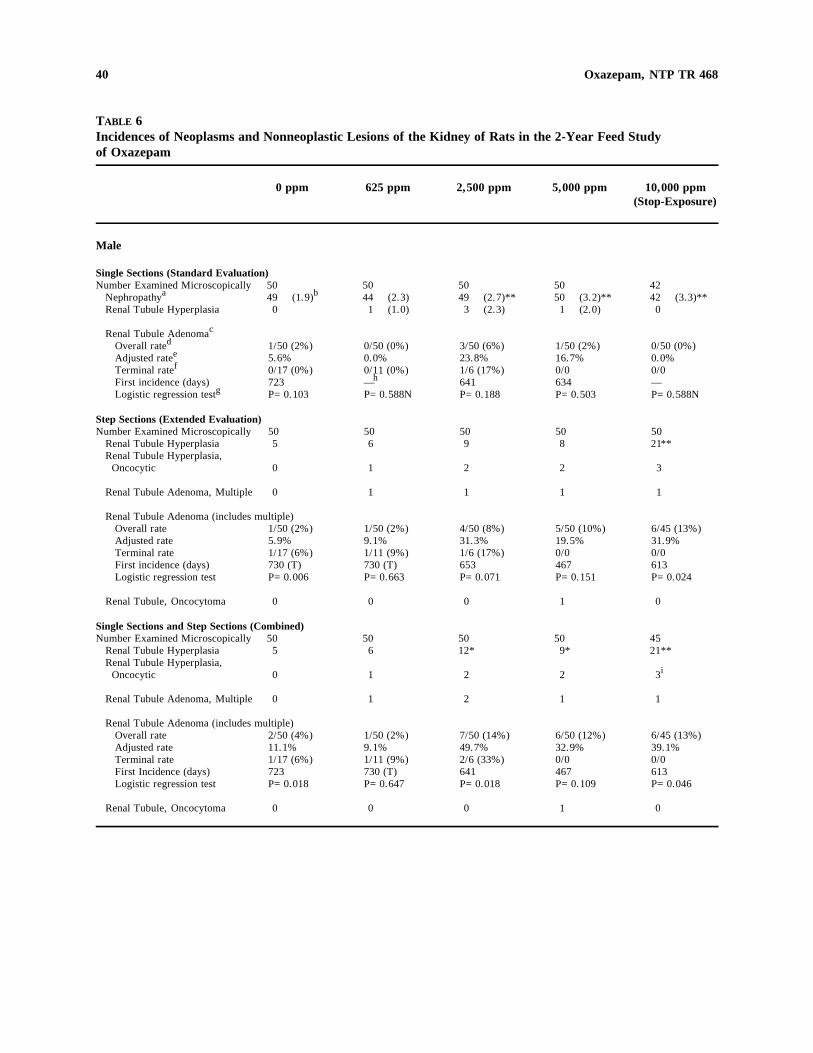
40 Oxazepam, NTP TR 468
TABLE 6 Incidences of Neoplasms and Nonneoplastic Lesions of the Kidney of Rats in the 2-Year Feed Study of Oxazepam
0 ppm 625 ppm 2,500 ppm 5,000 ppm 10,000 ppm (Stop-Exposure)
Male
Single Sections (Standard Evaluation) Number Examined Microscopically
Nephropathya 50 49 (1.9)b
50 44 (2.3)
50 49 (2.7)**
50 50 (3.2)**
42 42 (3.3)**
Renal Tubule Hyperplasia 0 1 (1.0) 3 (2.3) 1 (2.0) 0
Renal Tubule Adenomac
Overall rated
Adjusted ratee
Terminal ratef
First incidence (days) Logistic regression testg
1/50 (2%) 5.6% 0/17 (0%) 723 P=0.103
0/50 (0%) 0.0% 0/11 (0%) — h
P=0.588N
3/50 (6%) 23.8% 1/6 (17%) 641 P=0.188
1/50 (2%) 16.7% 0/0 634 P=0.503
0/50 (0%) 0.0% 0/0 — P=0.588N
Step Sections (Extended Evaluation) Number Examined Microscopically 50 50 50 50 50
Renal Tubule Hyperplasia 5 6 9 8 21** Renal Tubule Hyperplasia, Oncocytic 0 1 2 2 3
Renal Tubule Adenoma, Multiple 0 1 1 1 1
Renal Tubule Adenoma (includes multiple) Overall rate 1/50 (2%) 1/50 (2%) 4/50 (8%) 5/50 (10%) 6/45 (13%) Adjusted rate 5.9% 9.1% 31.3% 19.5% 31.9% Terminal rate 1/17 (6%) 1/11 (9%) 1/6 (17%) 0/0 0/0 First incidence (days) 730 (T) 730 (T) 653 467 613 Logistic regression test P=0.006 P=0.663 P=0.071 P=0.151 P=0.024
Renal Tubule, Oncocytoma 0 0 0 1 0
Single Sections and Step Sections (Combined) Number Examined Microscopically 50 50 50 50 45
Renal Tubule Hyperplasia 5 6 12* 9* 21** Renal Tubule Hyperplasia, Oncocytic 0 1 2 2 3i
Renal Tubule Adenoma, Multiple 0 1 2 1 1
Renal Tubule Adenoma (includes multiple) Overall rate 2/50 (4%) 1/50 (2%) 7/50 (14%) 6/50 (12%) 6/45 (13%) Adjusted rate 11.1% 9.1% 49.7% 32.9% 39.1% Terminal rate 1/17 (6%) 1/11 (9%) 2/6 (33%) 0/0 0/0 First Incidence (days) 723 730 (T) 641 467 613 Logistic regression test P=0.018 P=0.647 P=0.018 P=0.109 P=0.046
Renal Tubule, Oncocytoma 0 0 0 1 0
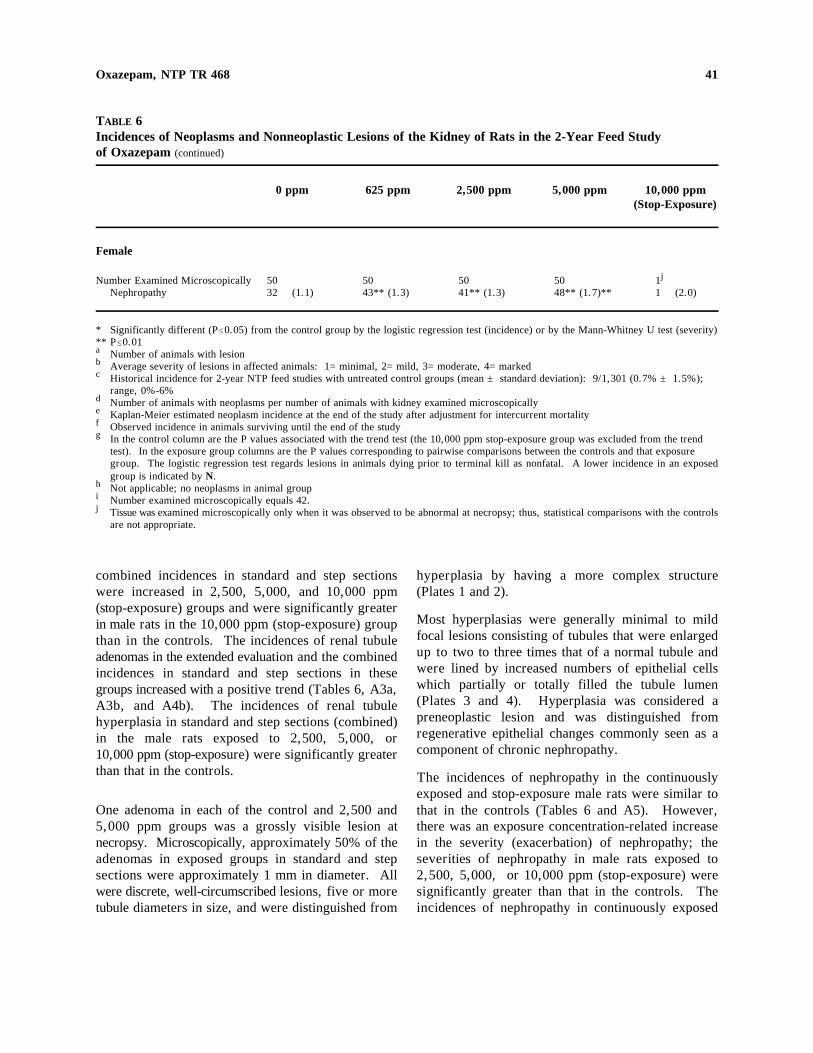
41 Oxazepam, NTP TR 468
TABLE 6 Incidences of Neoplasms and Nonneoplastic Lesions of the Kidney of Rats in the 2-Year Feed Study of Oxazepam (continued)
0 ppm 625 ppm 2,500 ppm 5,000 ppm 10,000 ppm (Stop-Exposure)
Female
Number Examined Microscopically 50 50 50 50 1j
Nephropathy 32 (1.1) 43** (1.3) 41** (1.3) 48** (1.7)** 1 (2.0)
* Significantly different (P#0.05) from the control group by the logistic regression test (incidence) or by the Mann-Whitney U test (severity) ** P#0.01 a Number of animals with lesion b Average severity of lesions in affected animals: 1=minimal, 2=mild, 3=moderate, 4=marked c Historical incidence for 2-year NTP feed studies with untreated control groups (mean ± standard deviation): 9/1,301 (0.7% ± 1.5%);
range, 0%-6%d Number of animals with neoplasms per number of animals with kidney examined microscopically e Kaplan-Meier estimated neoplasm incidence at the end of the study after adjustment for intercurrent mortalityf Observed incidence in animals surviving until the end of the study g In the control column are the P values associated with the trend test (the 10,000 ppm stop-exposure group was excluded from the trend
test). In the exposure group columns are the P values corresponding to pairwise comparisons between the controls and that exposure group. The logistic regression test regards lesions in animals dying prior to terminal kill as nonfatal. A lower incidence in an exposed group is indicated by N.
h Not applicable; no neoplasms in animal groupi Number examined microscopically equals 42.j Tissue was examined microscopically only when it was observed to be abnormal at necropsy; thus, statistical comparisons with the controls
are not appropriate.
combined incidences in standard and step sections were increased in 2,500, 5,000, and 10,000 ppm (stop-exposure) groups and were significantly greater in male rats in the 10,000 ppm (stop-exposure) group than in the controls. The incidences of renal tubule adenomas in the extended evaluation and the combined incidences in standard and step sections in these groups increased with a positive trend (Tables 6, A3a, A3b, and A4b). The incidences of renal tubule hyperplasia in standard and step sections (combined) in the male rats exposed to 2,500, 5,000, or 10,000 ppm (stop-exposure) were significantly greater than that in the controls.
One adenoma in each of the control and 2,500 and 5,000 ppm groups was a grossly visible lesion at necropsy. Microscopically, approximately 50% of the adenomas in exposed groups in standard and step sections were approximately 1 mm in diameter. All were discrete, well-circumscribed lesions, five or more tubule diameters in size, and were distinguished from
hyperplasia by having a more complex structure (Plates 1 and 2).
Most hyperplasias were generally minimal to mild focal lesions consisting of tubules that were enlarged up to two to three times that of a normal tubule and were lined by increased numbers of epithelial cells which partially or totally filled the tubule lumen (Plates 3 and 4). Hyperplasia was considered a preneoplastic lesion and was distinguished from regenerative epithelial changes commonly seen as a component of chronic nephropathy.
The incidences of nephropathy in the continuously exposed and stop-exposure male rats were similar to that in the controls (Tables 6 and A5). However, there was an exposure concentration-related increase in the severity (exacerbation) of nephropathy; the severities of nephropathy in male rats exposed to 2,500, 5,000, or 10,000 ppm (stop-exposure) were significantly greater than that in the controls. The incidences of nephropathy in continuously exposed
42 Oxazepam, NTP TR 468
female rats were significantly greater than that in the males were significantly greater than those in the controls; however, the severity was significantly controls (Tables 7 and A5). In male rats exposed to increased only in the 5,000 ppm group (Tables 6 5,000 ppm, the incidences of mineralization of the and B5). Nephropathy in male rats was generally mild glandular stomach and erosion of the duodenum were in the control and 625 ppm groups and moderate to significantly greater than those in the controls. In the marked in the 2,500, 5,000, and 10,000 ppm (stop- 10,000 ppm stop-exposure males, the incidence of exposure) groups. Mild nephropathy involved less mineralization of the glandular stomach was signifithan 50% of the kidney and was composed of multi- cantly greater than that in the controls. In female rats focal renal tubule regeneration, minimal to mild tubule exposed to 2,500 ppm, the incidences of epithelial dilatation, and interstitial fibrosis with mononuclear hyperplasia, chronic inflammation, and ulcers in the infiltrates (Plate 5). Moderate nephropathy involved forestomach and of erosion of the glandular stomach a greater proportion of the kidney and consisted of a were significantly greater than those in the controls spectrum of changes that included dilatation of renal (Tables 7 and B5). tubules with hyaline or cellular casts, increased interstitial fibrosis with mononuclear inflammatory cell Epithelial hyperplasia of the forestomach occurred as infiltrates, and multifocal tubule regeneration. Severe focal or multifocal lesions of varying severity. Most nephropathy involved most of the kidney and consisted lesions occurred as slightly to moderately raised of a similar spectrum of lesions of greater severity thickenings of the mucosa, due to an increase in the (Plate 6). In addition, there was marked thickening number of epithelial cells at all levels of the epithelium and mineralization of the basement membrane of (Plates 7 and 8). Others were focal broad-based tubules, blood vessels, and glomeruli; atrophy of the lesions in which the epithelium was markedly thickglomerular tuft; dilatation of the glomerular urinary ened and thrown into papillary folds (Plates 9 and 10). space; and transitional epithelial hyperplasia of the In some cases, focal nests or finger-like projections of renal papilla. proliferative basal epithelium extended into the
submucosa. Forestomach ulcers were also focal or Parathyroid gland hyperplasia and fibrous osteo- multifocal lesions characterized by loss of the mucosal dystrophy of the bone were considered secondary to squamous epithelium with necrosis and inflammation the exacerbated nephropathy that occurred in exposed of the adjacent muscularis mucosa and superficial male rats. In male rats, the incidences of parathyroid submucosa, with or without accompanying fibrosis gland hyperplasia (0 ppm, 3/39; 625 ppm, 6/41; (Plates 11 and 12). Variable thickening (hyperplasia) 2,500 ppm, 9/46; 5,000 ppm, 16/40) and fibrous of the epithelium and keratin layer (hyperkeratosis) at osteodystrophy of the bone (0/50, 1/50, 6/50, 8/50) the edges of ulcers were consistent and frequently occurred with positive trends (Table A5). The inci- striking components of ulcerative lesions. Ulcers dences of parathyroid gland hyperplasia in male rats were sometimes accompanied by focal erosion of the exposed to 5,000 ppm and fibrous osteodystrophy of mucosal epithelium. Chronic active inflammation of the bone in male rats exposed to 2,500 or 5,000 ppm varying severity almost invariably occurred in the were greater than those in the controls. submucosa beneath hyperplastic and ulcerative lesions
and consisted of a combination of edema and infiltrates Gastrointestinal Tract (forestomach, glandular stom- of neutrophils, macrophages, and lymphocytes with ach, and small intestine): In male rats, there were occasional focal hemorrhage (Plates 8, 10, and 12). In positive trends in the incidences of epithelial hyper- male rats, the incidence of mucosal erosions in the plasia and chronic inflammation of the forestomach. duodenum in the 5,000 ppm group was significantly The incidences of epithelial hyperplasia and chronic greater than in the controls. Erosions of the duodenum inflammation of the forestomach of males exposed to were characterized by focal loss and necrosis of the 2,500 or 5,000 ppm and of ulcers in 2,500 ppm superficial mucosal epithelium.
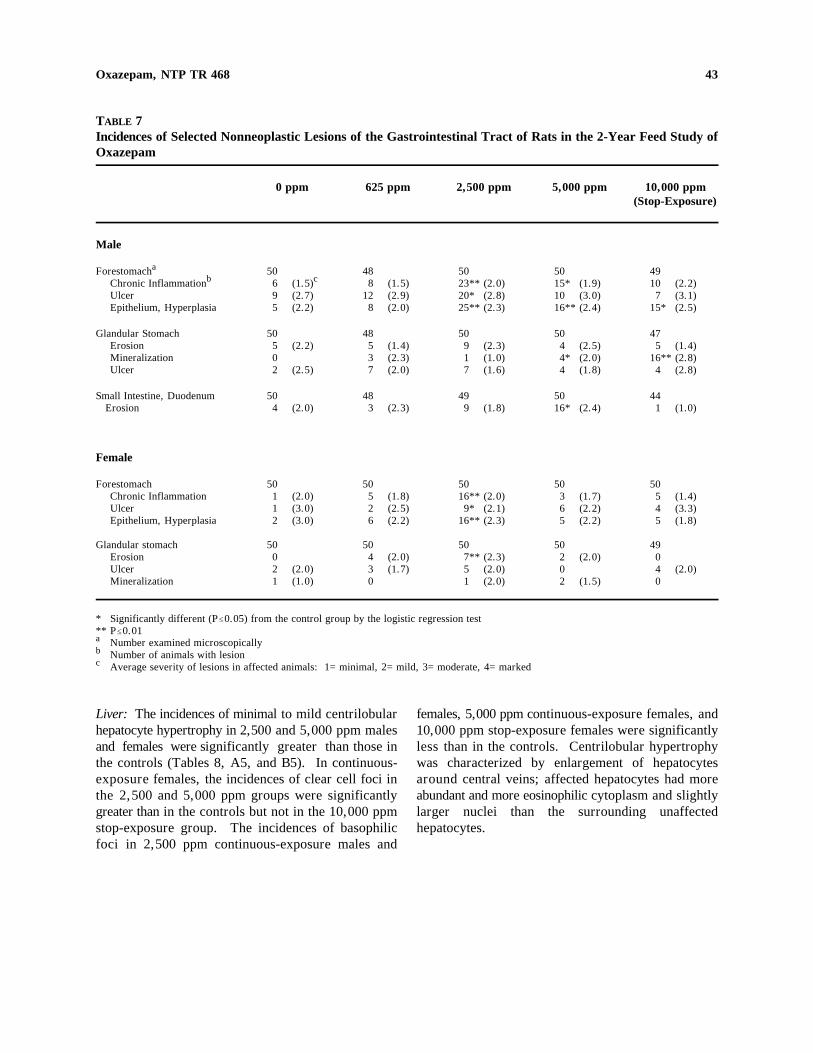
43
c
Oxazepam, NTP TR 468
TABLE 7 Incidences of Selected Nonneoplastic Lesions of the Gastrointestinal Tract of Rats in the 2-Year Feed Study of Oxazepam
0 ppm 625 ppm 2,500 ppm 5,000 ppm 10,000 ppm (Stop-Exposure)
Male
Forestomacha
Chronic Inflammationb
Ulcer Epithelium, Hyperplasia
50 6 9 5
(1.5)c
(2.7) (2.2)
48 8
12 8
(1.5) (2.9) (2.0)
50 23** (2.0) 20* (2.8) 25** (2.3)
50 15* (1.9) 10 (3.0) 16** (2.4)
49 10 (2.2) 7 (3.1)
15* (2.5)
Glandular Stomach Erosion Mineralization Ulcer
50 5 0 2
(2.2)
(2.5)
48 5 3 7
(1.4) (2.3) (2.0)
50 9 1 7
(2.3) (1.0) (1.6)
50 4 4* 4
(2.5) (2.0) (1.8)
47 5 (1.4)
16** (2.8) 4 (2.8)
Small Intestine, Duodenum Erosion
50 4 (2.0)
48 3 (2.3)
49 9 (1.8)
50 16* (2.4)
44 1 (1.0)
Female
Forestomach Chronic Inflammation Ulcer Epithelium, Hyperplasia
50 1 1 2
(2.0) (3.0) (3.0)
50 5 2 6
(1.8) (2.5) (2.2)
50 16** (2.0) 9* (2.1)
16** (2.3)
50 3 6 5
(1.7) (2.2) (2.2)
50 5 4 5
(1.4) (3.3) (1.8)
Glandular stomach Erosion Ulcer Mineralization
50 0 2 1
(2.0) (1.0)
50 4 3 0
(2.0) (1.7)
50 7** (2.3) 5 (2.0) 1 (2.0)
50 2 0 2
(2.0)
(1.5)
49 0 4 0
(2.0)
* Significantly different (P#0.05) from the control group by the logistic regression test ** P#0.01 a Number examined microscopicallyb Number of animals with lesion
Average severity of lesions in affected animals: 1=minimal, 2=mild, 3=moderate, 4=marked
Liver: The incidences of minimal to mild centrilobular females, 5,000 ppm continuous-exposure females, and hepatocyte hypertrophy in 2,500 and 5,000 ppm males 10,000 ppm stop-exposure females were significantly and females were significantly greater than those in less than in the controls. Centrilobular hypertrophy the controls (Tables 8, A5, and B5). In continuous- was characterized by enlargement of hepatocytes exposure females, the incidences of clear cell foci in around central veins; affected hepatocytes had more the 2,500 and 5,000 ppm groups were significantly abundant and more eosinophilic cytoplasm and slightly greater than in the controls but not in the 10,000 ppm larger nuclei than the surrounding unaffected stop-exposure group. The incidences of basophilic hepatocytes. foci in 2,500 ppm continuous-exposure males and
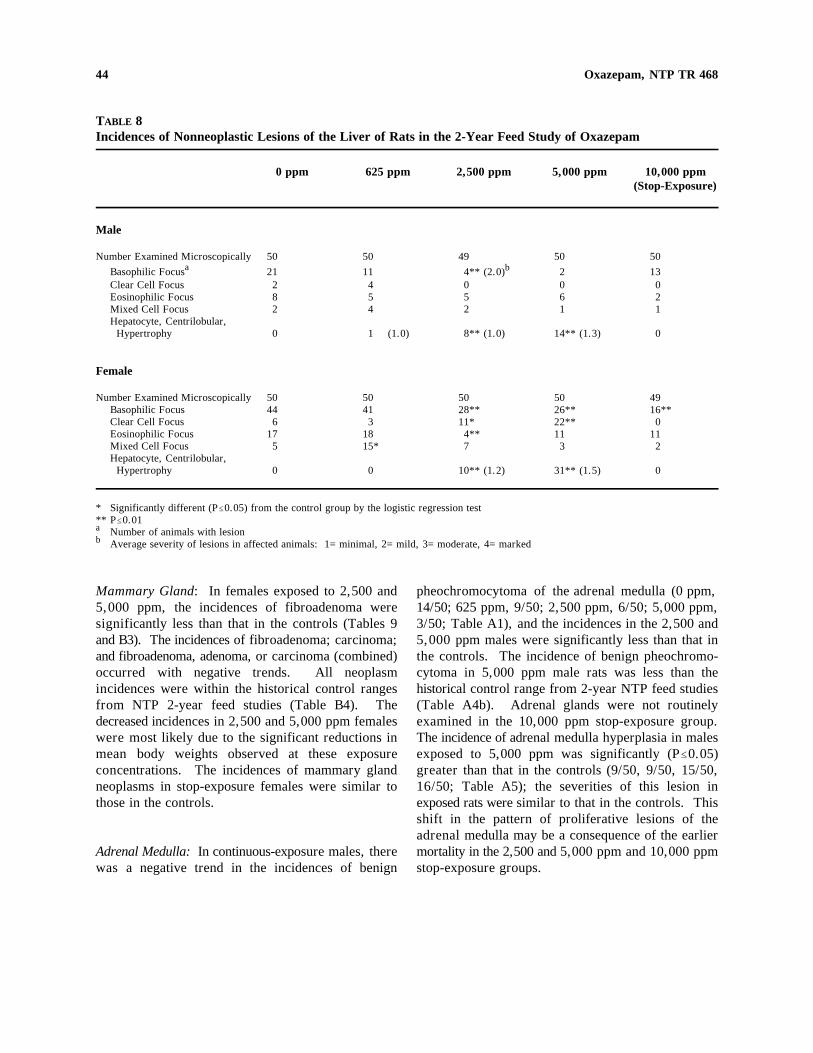
44 Oxazepam, NTP TR 468
TABLE 8 Incidences of Nonneoplastic Lesions of the Liver of Rats in the 2-Year Feed Study of Oxazepam
0 ppm 625 ppm 2,500 ppm 5,000 ppm 10,000 ppm (Stop-Exposure)
Male
Number Examined Microscopically Basophilic Focusa
Clear Cell Focus Eosinophilic Focus Mixed Cell Focus Hepatocyte, Centrilobular, Hypertrophy
50 21 2 8 2
0
50 11 4 5 4
1 (1.0)
49 4** (2.0) b
0 5 2
8** (1.0)
50 2 0 6 1
14** (1.3)
50 13 0 2 1
0
Female
Number Examined Microscopically Basophilic Focus Clear Cell Focus Eosinophilic Focus Mixed Cell Focus Hepatocyte, Centrilobular, Hypertrophy
50 44 6
17 5
0
50 41 3
18 15*
0
50 28** 11* 4** 7
10** (1.2)
50 26** 22** 11 3
31** (1.5)
49 16** 0
11 2
0
* Significantly different (P#0.05) from the control group by the logistic regression test ** P#0.01 a Number of animals with lesion b Average severity of lesions in affected animals: 1=minimal, 2=mild, 3=moderate, 4=marked
Mammary Gland: In females exposed to 2,500 and pheochromocytoma of the adrenal medulla (0 ppm, 5,000 ppm, the incidences of fibroadenoma were 14/50; 625 ppm, 9/50; 2,500 ppm, 6/50; 5,000 ppm, significantly less than that in the controls (Tables 9 3/50; Table A1), and the incidences in the 2,500 and and B3). The incidences of fibroadenoma; carcinoma; 5,000 ppm males were significantly less than that in and fibroadenoma, adenoma, or carcinoma (combined) the controls. The incidence of benign pheochromooccurred with negative trends. All neoplasm cytoma in 5,000 ppm male rats was less than the incidences were within the historical control ranges historical control range from 2-year NTP feed studies from NTP 2-year feed studies (Table B4). The (Table A4b). Adrenal glands were not routinely decreased incidences in 2,500 and 5,000 ppm females examined in the 10,000 ppm stop-exposure group. were most likely due to the significant reductions in The incidence of adrenal medulla hyperplasia in males mean body weights observed at these exposure exposed to 5,000 ppm was significantly (P#0.05) concentrations. The incidences of mammary gland greater than that in the controls (9/50, 9/50, 15/50, neoplasms in stop-exposure females were similar to 16/50; Table A5); the severities of this lesion in those in the controls. exposed rats were similar to that in the controls. This
shift in the pattern of proliferative lesions of the adrenal medulla may be a consequence of the earlier
Adrenal Medulla: In continuous-exposure males, there mortality in the 2,500 and 5,000 ppm and 10,000 ppm was a negative trend in the incidences of benign stop-exposure groups.
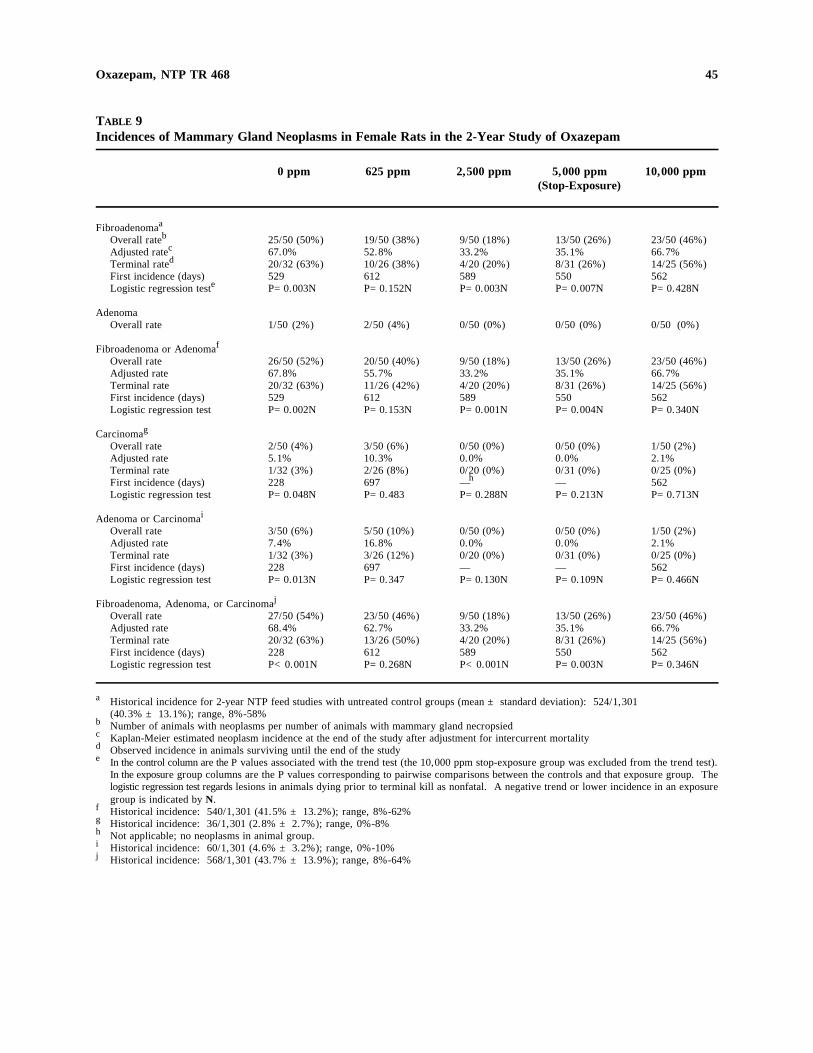
45 Oxazepam, NTP TR 468
TABLE 9 Incidences of Mammary Gland Neoplasms in Female Rats in the 2-Year Study of Oxazepam
0 ppm 625 ppm 2,500 ppm 5,000 ppm 10,000 ppm (Stop-Exposure)
Fibroadenomaa
Overall rateb 25/50 (50%) 19/50 (38%) 9/50 (18%) 13/50 (26%) 23/50 (46%) cAdjusted rate 67.0% 52.8% 33.2% 35.1% 66.7%
Terminal rated 20/32 (63%) 10/26 (38%) 4/20 (20%) 8/31 (26%) 14/25 (56%) First incidence (days) 529 612 589 550 562
eLogistic regression test P=0.003N P=0.152N P=0.003N P=0.007N P=0.428N
Adenoma Overall rate 1/50 (2%) 2/50 (4%) 0/50 (0%) 0/50 (0%) 0/50 (0%)
Fibroadenoma or Adenomaf
Overall rate 26/50 (52%) 20/50 (40%) 9/50 (18%) 13/50 (26%) 23/50 (46%) Adjusted rate 67.8% 55.7% 33.2% 35.1% 66.7% Terminal rate 20/32 (63%) 11/26 (42%) 4/20 (20%) 8/31 (26%) 14/25 (56%) First incidence (days) 529 612 589 550 562 Logistic regression test P=0.002N P=0.153N P=0.001N P=0.004N P=0.340N
Carcinomag
Overall rate 2/50 (4%) 3/50 (6%) 0/50 (0%) 0/50 (0%) 1/50 (2%) Adjusted rate 5.1% 10.3% 0.0% 0.0% 2.1% Terminal rate 1/32 (3%) 2/26 (8%) 0/20 (0%) 0/31 (0%) 0/25 (0%) First incidence (days) 228 697 —h — 562 Logistic regression test P=0.048N P=0.483 P=0.288N P=0.213N P=0.713N
Adenoma or Carcinomai
Overall rate 3/50 (6%) 5/50 (10%) 0/50 (0%) 0/50 (0%) 1/50 (2%) Adjusted rate 7.4% 16.8% 0.0% 0.0% 2.1% Terminal rate 1/32 (3%) 3/26 (12%) 0/20 (0%) 0/31 (0%) 0/25 (0%) First incidence (days) 228 697 — — 562 Logistic regression test P=0.013N P=0.347 P=0.130N P=0.109N P=0.466N
Fibroadenoma, Adenoma, or Carcinomaj
Overall rate 27/50 (54%) 23/50 (46%) 9/50 (18%) 13/50 (26%) 23/50 (46%) Adjusted rate 68.4% 62.7% 33.2% 35.1% 66.7% Terminal rate 20/32 (63%) 13/26 (50%) 4/20 (20%) 8/31 (26%) 14/25 (56%) First incidence (days) 228 612 589 550 562 Logistic regression test P<0.001N P=0.268N P<0.001N P=0.003N P=0.346N
a Historical incidence for 2-year NTP feed studies with untreated control groups (mean ± standard deviation): 524/1,301 (40.3% ± 13.1%); range, 8%-58%
b Number of animals with neoplasms per number of animals with mammary gland necropsied c Kaplan-Meier estimated neoplasm incidence at the end of the study after adjustment for intercurrent mortalityd Observed incidence in animals surviving until the end of the study e In the control column are the P values associated with the trend test (the 10,000 ppm stop-exposure group was excluded from the trend test).
In the exposure group columns are the P values corresponding to pairwise comparisons between the controls and that exposure group. The logistic regression test regards lesions in animals dying prior to terminal kill as nonfatal. A negative trend or lower incidence in an exposure group is indicated by N.
f Historical incidence: 540/1,301 (41.5% ± 13.2%); range, 8%-62% g Historical incidence: 36/1,301 (2.8% ± 2.7%); range, 0%-8%h Not applicable; no neoplasms in animal group.i Historical incidence: 60/1,301 (4.6% ± 3.2%); range, 0%-10%j Historical incidence: 568/1,301 (43.7% ± 13.9%); range, 8%-64%
46 Oxazepam, NTP TR 468
Pituitary Gland: There were negative trends in the incidences of pituitary gland (pars distalis) adenoma in males (17/49, 12/50, 10/50, 2/48) and females (31/50, 28/50, 21/50, 12/50) (Tables A3a and B3a). In males and females exposed to 5,000 ppm, incidences of adenoma were significantly less than those in the controls, and the incidences were below the historical ranges from 2-year NTP feed studies (Tables A4c and B4b). In females exposed to 5,000 ppm, the incidence of adenoma or carcinoma (combined) was also significantly less than that in the controls and was below the historical control range. There was a negative trend in the incidence of hyperplasia in male rats (9/49, 5/50, 3/50, 1/48; Table A5). In males exposed to 5,000 ppm, the incidence of hyperplasia was significantly less than that in the controls. The decreasing trends were most likely due at least in part to a combination of decreased body weights and survival in males and to decreased body weights in females, although it is unlikely that these reasons could fully account for the effects observed.
Pancreas: The incidence of atrophy of the pancreatic acinus in males in the 5,000 ppm group was significantly less than that in the controls (17/50, 10/48, 14/49, 1/50; Table A5), and the incidences of this
lesion occurred with a negative trend. The lower incidences of this lesion may have been related to reduced survival of exposed males.
GENETIC TOXICOLOGY Oxazepam (3 to 3,333 Fg/plate) did not induce mutations in Salmonella typhimurium strains TA97, TA98, TA100, TA102, or TA1535 when tested in a preincubation protocol with or without Aroclor 1254-induced male Sprague-Dawley rat or Syrian hamster liver S9 (Table C1). In cytogenetic tests with cultured Chinese hamster ovary cells, oxazepam did not induce sister chromatid exchanges (Table C2) or chromosomal aberrations (Table C3), with or without S9. Cell cycle delay was noted at the 50 Fg/mL dose in the sister chromatid exchange test without S9; harvest time was extended to allow accumulation of sufficient second-division metaphase cells for analysis. Peripheral blood samples obtained from B6C3F mice1
in a 14-week toxicity study were analyzed for frequency of micronucleated normochromatic erythrocytes; no increase in the frequency of micronucleated normochromatic erythrocytes was observed in any of the exposed groups (Table C4).

PLATE 1 Renal tubule adenoma in the kidney of a male F344/N rat administered 2,500 ppm oxazepam for 2 years. Mass is well circumscribed with cells arranged in variably sized packets, some of which have central areas of cellular degeneration and hemorrhage (arrows). H&E; 35 ×
PLATE 2 Higher magnification of Plate 1. Neoplastic cells resemble epithelial cells of normal adjacent tubules and form small packets separated by delicate fibrovascular septae. H&E; 175 ×
PLATE 3 Mild renal tubule hyperplasia (arrowheads) in the kidney of a male F344/N rat administered 2,500 ppm oxazepam for 2 years. Group of hyperplastic tubules are surrounded by relatively normal renal tubules. Glomerulus (arrow). H&E; 140 ×
PLATE 4 Higher magnification of Plate 3. Hyperplastic tubules are filled with cuboidal to polygonal tubular epithelial cells. Note mitotic figure (arrow). H&E; 230 ×
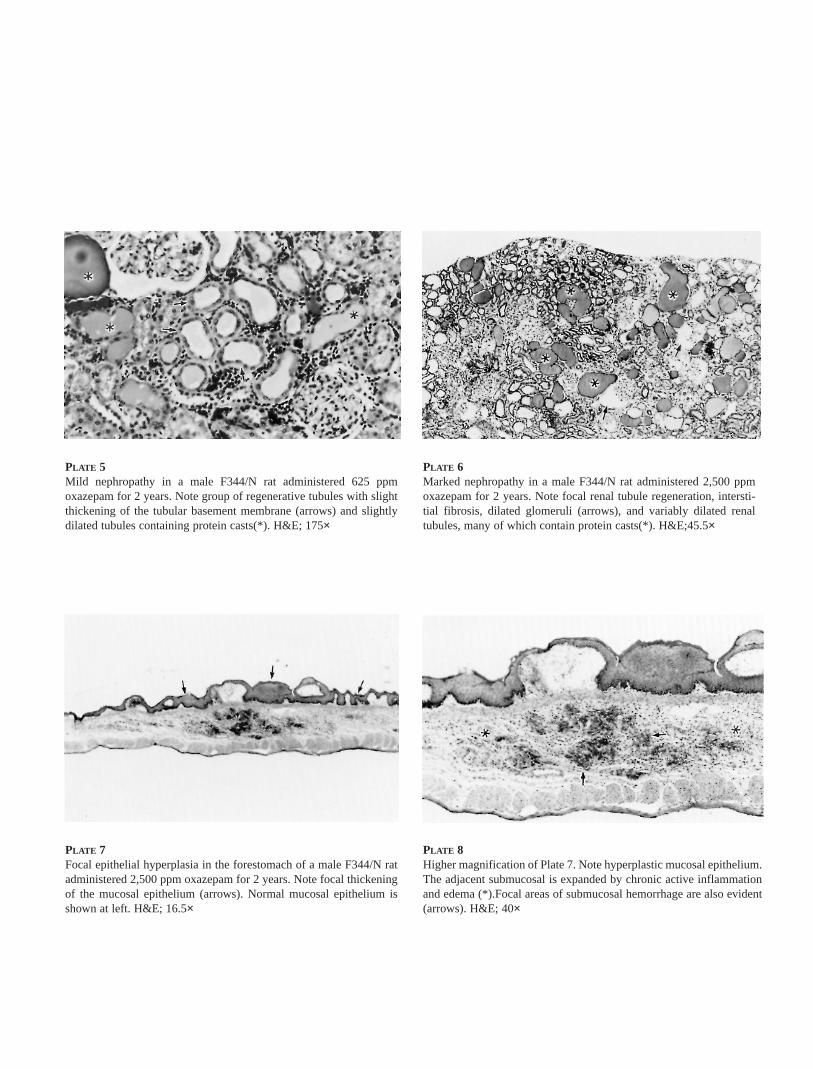
PLATE 5 Mild nephropathy in a male F344/N rat administered 625 ppm oxazepam for 2 years. Note group of regenerative tubules with slight thickening of the tubular basement membrane (arrows) and slightly dilated tubules containing protein casts(*). H&E; 175×
PLATE 6 Marked nephropathy in a male F344/N rat administered 2,500 ppm oxazepam for 2 years. Note focal renal tubule regeneration, interstitial fibrosis, dilated glomeruli (arrows), and variably dilated renal tubules, many of which contain protein casts(*). H&E;45.5×
PLATE 7 Focal epithelial hyperplasia in the forestomach of a male F344/N rat administered 2,500 ppm oxazepam for 2 years. Note focal thickening of the mucosal epithelium (arrows). Normal mucosal epithelium is shown at left. H&E; 16.5×
PLATE 8 Higher magnification of Plate 7. Note hyperplastic mucosal epithelium. The adjacent submucosal is expanded by chronic active inflammation and edema (*).Focal areas of submucosal hemorrhage are also evident (arrows). H&E; 40×
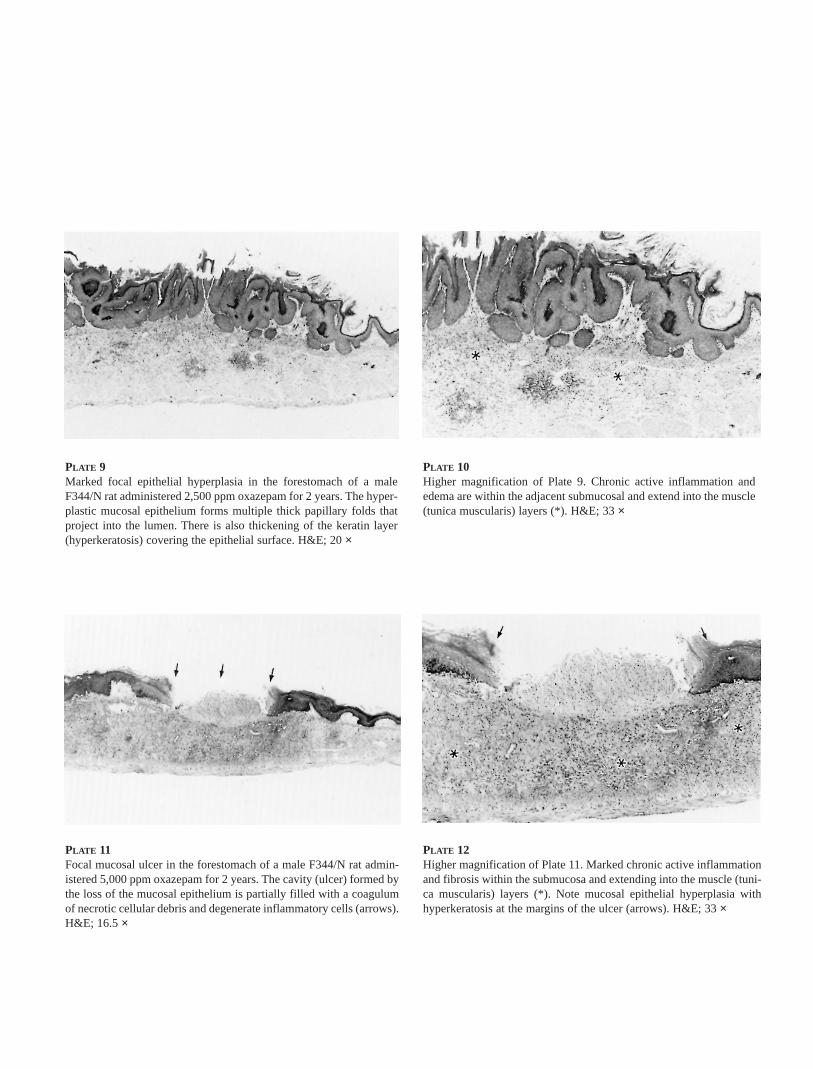
PLATE 9 Marked focal epithelial hyperplasia in the forestomach of a male F344/N rat administered 2,500 ppm oxazepam for 2 years. The hyperplastic mucosal epithelium forms multiple thick papillary folds that project into the lumen. There is also thickening of the keratin layer (hyperkeratosis) covering the epithelial surface. H&E; 20 ×
PLATE 11 Focal mucosal ulcer in the forestomach of a male F344/N rat administered 5,000 ppm oxazepam for 2 years. The cavity (ulcer) formed by the loss of the mucosal epithelium is partially filled with a coagulum of necrotic cellular debris and degenerate inflammatory cells (arrows). H&E; 16.5 ×
PLATE 10 Higher magnification of Plate 9. Chronic active inflammation and edema are within the adjacent submucosal and extend into the muscle (tunica muscularis) layers (*). H&E; 33 ×
PLATE 12 Higher magnification of Plate 11. Marked chronic active inflammation and fibrosis within the submucosa and extending into the muscle (tunica muscularis) layers (*). Note mucosal epithelial hyperplasia with hyperkeratosis at the margins of the ulcer (arrows). H&E; 33 ×
47
DISCUSSION AND CONCLUSIONS
Evaluation of the toxicity and carcinogenicity of In female rats, adverse effects on body weights and oxazepam in F344/N rats was prompted by the finding survival were not nearly as severe as in males, alof a marked hepatocellular neoplasm response in though both body weights and survival were reduced similar studies with Swiss-Webster and B6C3F mice 1 in an exposure-related fashion. The incidences of (NTP, 1993; Bucher et al., 1994). Studies of the nephropathy were increased in females, but the carcinogenicity of oxazepam in Sprague-Dawley rats severities were mild. The difference between the were performed previously and reported to the FDA. responses of males and females to oxazepam appeared However, given the widespread use of benzo- to be in the unexpected and marked enhancement of diazepines and the fact that oxazepam is a common the nephropathy commonly seen in control male metabolite of several of the more widely used variants F344/N rats. Varying degrees of nephropathy norof this drug class, cancer studies in a second strain of mally develop in the aging rat, and this condition is rat were deemed necessary to examine possible worsened when the animals are maintained on a differences in response. relatively high protein diet, such as the NIH-07 diet
used in these studies (Rao et al., 1993). Nephropathy No 13-week rat studies were performed prior to the is considered to be a major contributor to early 2-year studies summarized in this report because there mortality in rats and likely accounts for the pattern of was some sense of urgency to begin the rat studies and deaths observed in this study. It is possible that this because relatively little useful information was kidney lesion would have been seen in certain obtained from the 13-week studies conducted in exposure groups in 13-week studies because nephroppreparation for the 2-year mouse studies. Instead, athy was more severe in the 10,000 ppm stopbased on information from the literature, a five-dose exposure group of males, 18 months after exposure 2-year study was begun in anticipation that sufficient ceased. However, enhanced nephropathy was not seen information would be gained during the first 6 months in mice receiving oxazepam, nor was it reported in of the 2-year study to determine which exposure rats or mice in chronic studies with prazepam groups would be allowed to proceed to study termi- (de la Iglesia et al., 1981), temazepam (Robinson nation. Based on low body weight gains, groups of et al., 1984), or ripazepam (Fitzgerald et al., 1984), male and female rats exposed to 10,000 ppm were although some renal tubule dilatation in rats was removed from dosed feed and allowed to consume reported with the last compound. control diet until the end of the study. Groups consuming feed containing 1,250 ppm were terminated In the current study, the parathyroid gland hyperplasia because it was predicted that little additional informa- and fibrous osteodystrophy of bone that occurred in tion would be gained from these animals. the male rats are consistent sequelae to severe
nephropathy and secondary hyperparathyroidism of In retrospect, the decision to forego performance of chronic renal failure (Leininger and Riley, 1990; Seely 13-week studies was incorrect. The 2,500 and and Hildebrandt, 1990; Capen, 1994). Mineralization 5,000 ppm exposure concentrations selected for the of the glandular stomach is also a common continuous administration portion of the study were manifestation of severe nephropathy and is due to sufficiently high to result in substantial reductions in hypercalcemia induced by secondary renal both body weight gains and in survival of male rats. hyperparathyroidism. It has been shown experi-Survival was somewhat reduced in the 625 ppm male mentally that stress-related ulceration of the glandular group, and mean body weights were also slightly stomach can be enhanced by either acidotic or nonlower in this group during most of the study. From acidotic renal insufficiency (Fischer et al., 1974), and the standpoint of body weight and survival, 625 ppm mineralization of the glandular stomach and the was sufficient for an adequate chronic toxicity and forestomach can be sequelae to uremia (Brown and carcinogenicity study in male rats. Hardisty, 1990).
48 Oxazepam, NTP TR 468
Male rats exposed to 2,500 or 5,000 ppm and female rats exposed to 2,500 ppm had increased incidences of epithelial hyperplasia, ulceration, and inflammation of the forestomach. Degenerative and proliferative forestomach lesions are relatively common in studies in which chemicals are administered orally (Gonipath et al., 1987). The spectrum of degenerative lesions includes erosions, ulceration, and necrosis with associated inflammation of the submucosa, which may extend to the serosal surface. Proliferative lesions range from mild hyperplasia to marked papillomatous hyperplasia of the squamous epithelium of the forestomach, with or without the development of papillomas. Papillomas were not noted in this study; however, severe papillary hyperplasia was observed in some animals. The increased incidences of these lesions in the forestomach of continuously exposed animals suggest that the development of these lesions was probably a direct effect of chemical administration. In the stop-exposure study, the significantly increased incidences of nonneoplastic lesions in the forestomach indicate a failure of these lesions to resolve during the prolonged recovery period. This is rather unexpected. It suggests that these lesions may have been due in part to the abrupt removal of the drug from the diet, eliciting stress related to dependence, coupled with compromised renal function later in the study.
A few renal tubule adenomas were seen, principally in the 2,500 ppm group in the initial evaluation of kidneys of exposed male rats, although a dose response was not evident. Additional sections of the remaining embedded kidneys were taken and additional microscopic adenomas were observed. The NTP experience with multiple-step sectioning of kidneys has been reported by Eustis et al. (1994). In 13 prior studies, additional renal tubule neoplasms and oncocytomas were observed with step sectioning in both control and exposed groups. Although no additional neoplasms were found in the control rat kidneys for many of the studies, as many as six were found in one study. Even greater numbers of additional neoplasms were found in some exposure groups. Eustis et al. (1994) noted that the studies in which additional renal neoplasms were found were also those in which nephropathy was more severe than usual, or those in which the chemical enhanced the nephropathy. This was the case in the present study with oxazepam.
Although the renal tubule neoplasms occurred with a positive trend, this was considered an uncertain finding. The incidence of 14% in the 2,500 ppm group is similar to the upper range of neoplasms found in historical controls after step sectioning (Eustis et al., 1994). While it is unlikely that the 2,500, 5,000, and 10,000 ppm stop-exposure groups incidences would all fall close to the upper range of historical control incidences by chance alone, the severe nephropathy complicated interpretation of these findings. There was no increase in renal tubule neoplasms in the 625 ppm group. Whether these renal neoplasms represent an intrinsic carcinogenic effect of oxazepam or are secondary to the oxazepam-enhanced nephropathy cannot be determined from these studies. There is no convincing evidence to suggest that oxazepam is mutagenic or has the ability to induce chromosomal aberrations or other adverse genetic effects.
The effects of oxazepam on the liver of male and female rats were limited to centrilobular hepatocyte hypertrophy commonly seen with a wide variety of agents, including other benzodiazepines and barbiturates, and changes in the incidences of basophilic and clear cell foci. There was no evidence of an increase in hepatocellular neoplasms in male or female rats exposed to oxazepam. This is in sharp contrast to the increases in liver neoplasms reported with the two mouse strains studied earlier (NTP, 1993; Bucher et al., 1994).
The reasons for the species differences in liver neoplasm response are not known. The response of the mouse liver to oxazepam includes a transient induction of hepatocyte replication, which, coupled with hepatocyte hypertrophy, accounts for the increase in liver weight. Increases in cytochrome P450 and b5 content and glucuronyl transferase activity are seen; however, there is little evidence to suggest that oxidative stress or cytotoxicity is induced (Bucher et al., 1994; Cunningham et al., 1994; Griffin et al., 1996). In similar studies reported in Appendix H, hepatocyte proliferation in rats was also transient and hypertrophy was a persistent change. Again, oxazepam did not induce significant cytotoxicity. In in vitro incubations of oxazepam with microsomes from human, rat, and mouse liver, evidence of covalent protein binding was found in all three cases, but the magnitude was greatest in rats,
__________
49 Oxazepam, NTP TR 468
followed by mice, and then humans (Griffin et al., 1995a,b), suggesting that this activity is unrelated to the carcinogenic response.
One area in which there are clear differences between rats and mice is in comparative metabolism. The metabolism of oxazepam is complex and has been extensively documented in the F344/N rat and the B6C3F and Swiss-Webster mouse (Griffin and Burka, 1
1993, 1995). Oxidative metabolism (of the phenyl ring) occurs in both rats and mice (Griffin et al., 1995c) but is more pronounced in rats. There are also differences in the major conjugation reactions with glucuronic acid and sulfate, as well as differences in fecal and urinary excretion patterns. On repeated dosing, there is a shift in the metabolite pattern in mice, but not rats, suggesting an induction of enzymes which are involved in oxazepam metabolism. Serum concentrations of oxazepam were higher at comparable dosed feed concentrations in mice (NTP, 1993) than in rats in the current study, but the differences appeared due at least in part to the relatively greater consumption of dosed feed by mice than rats on a body weight basis. Mice also eliminated less oxazepam in the feces than did rats and had a slightly longer terminal elimination half-life from plasma, suggesting that enterohepatic circulation may be greater in mice (Yuan et al., 1994; Griffin and Burka, 1993, 1995). This may indicate a greater degree of exposure of the liver of mice to oxazepam and its metabolites when compared to rats. Nonetheless, as indicated earlier, despite considerable effort devoted to examining the basis for the differential carcinogenic response in rats and mice, no clear biochemical basis for this effect has been identified.
Two recent epidemiology studies have evaluated the association between human cancers and benzodiazepine use. Neither examined oxazepam specifically. Rosenberg et al. (1995) did not find an associ
ation between sustained benzodiazepine use (at least 4 days per week for at least 1 month, initiated at least 2 years prior to hospital admission) and any one of 11 cancers (breast, large bowel, malignant melanoma, lung, uterine endometrium, ovary, non-Hodgkin’s lymphoma, testis, Hodgkin’s disease, thyroid gland, and liver) in a large United States hospital-based surveillance study. Harlow and Cramer (1995) reported an association between prior use of benzodiazepines exceeding 1 to 6 months with subsequent development of ovarian cancer (adjusted odds ratio 1.8, 95% CI 1.0 -3.1). These authors proposed that the induction of hepatic microsomal enzymes by benzodiazepines might enhance the metabolism of estrogen, thus stimulating higher gonadotropin levels. Ovarian neoplasms were not increased in female rats in the present studies or in studies with mice reported earlier (NTP, 1993).
CONCLUSIONS In summary, under the conditions of these 2-year dosed-feed studies, there was equivocal evidence of carcinogenic activity* in male F344/N rats based on small increases in the incidences of renal tubule adenomas in exposed groups also exhibiting significantly enhanced nephropathy. There was no evidence of carcinogenic activity of oxazepam in female F344/N rats exposed to feed containing 625, 2,500, or 5,000 ppm for 2 years or 10,000 ppm for 6 months.
Administration of oxazepam to rats resulted in nonneoplastic lesions in the forestomach, glandular stomach, and small intestine as well as centrilobular hypertrophy of hepatocytes in the liver. In addition, nephropathy was increased in incidence in female rats and was markedly increased in severity in male rats, resulting in early mortality at the higher exposure concentrations.
* Explanation of Levels of Evidence of Carcinogenic Activity is on page 9. A summary of the Technical Reports Review Subcommittee comments and the public discussion on this Technical Report appears on page 11.

50 Oxazepam, NTP TR 468
51
REFERENCES
American Conference of Governmental Industrial Hygienists (ACGIH) (1996). 1996 Threshold Limit Values for Chemical Substances and Physical Agents and Biological Exposure Indices. Cincinnati, OH.
Anonymous (1986). Top 200 Drugs of 1985: A 1.4% increase in refills nudges 1985 rxs 1.1% ahead of 1984 volume. Pharm. Times 52, 25-33.
Anonymous (1996). The Top 200 Drugs. Am. Druggist Feb., 18-23.
Armitage, P. (1971). Statistical Methods in Medical Research, pp. 362-365. John Wiley and Sons, New York.
Ashby, J., and Tennant, R.W. (1991). Definitive relationships among chemical structure, carcinogenicity and mutagenicity for 301 chemicals tested by the U.S. NTP. Mutat. Res. 257, 229-306.
Balbi, A., Muscettola, G., Staiano, N., Martire, G., and De Lorenzo, F. (1980). Psychotropic drugs: Evaluation of mutagenic effect. Pharmacol. Res. Commun. 12, 423-431.
Barnard, E.A., Stephenson, F.A., Sigel, E., Mamalaki, C., Bilbe, G., Constanti, A., Smart, T.G., and Brown, D.A. (1984). Structure and properties of the brain GABA/benzodiazepine receptor complex. Adv. Exp. Med. Biol. 175, 235-254.
Batzinger, R.P., Ou, S.-Y.L., and Bueding, E. (1978). Antimutagenic effects of 2(3)-tert-butyl-4hydroxyanisole and of antimicrobial agents. Cancer Res. 38, 4478-4485.
Bignami, M., Morpurgo, G., Pagliani, R., Carere, A., Conti, G., and Di Giuseppe, G. (1974). Nondisjunction and crossing-over induced by pharmaceutical drugs in Aspergillus nidulans. Mutat. Res. 26, 159-170.
Boorman, G.A., Montgomery, C.A., Jr., Eustis, S.L., Wolfe, M.J., McConnell, E.E., and Hardisty, J.F. (1985). Quality assurance in pathology for rodent carcinogenicity studies. In Handbook of Carcinogen Testing (H.A. Milman and E.K. Weisburger, Eds.), pp. 345-357. Noyes Publications, Park Ridge, NJ.
Bregman, A.A. (1970). In vitro effects of tranquilizers on human chromosomes. EMS Newsl. 3, 41.
Brown, H. R., and Hardisty, J. F. (1990). Oral cavity, esophagus, and stomach. In Pathology of the Fischer Rat. (G.A. Boorman, S.L. Eustis, M.R. Elwell, C.A. Montgomery, Jr., and W.F. MacKenzie, Eds.), pp. 9-30. Academic Press, Inc., San Diego.
Bucher, J.R., Shackelford, C.C., Haseman, J.K., Johnson, J.D., Kurtz, P.J., and Persing, R.L. (1994). Carcinogenicity studies of oxazepam in mice. Fundam. Appl. Toxicol. 23, 280-297.
Buckley, N.A., Dawson, A.H., Whyte, I.M., and O’Connell, D.L. (1995). Relative toxicity of benzodiazepines in overdose. BMJ 310, 219-221.
Calvo, D.J., Campos, M.B., Calandra, R.S., Medina, J.H., and Ritta, M.N. (1991). Effect of long term diazepam administration on testicular benzodiazepine receptors and steroidogenesis. Life Sci. 49, 519-525.
Campiani, G., Nacci, V., Fiorini, I., De Filippis, M.P., Garofalo, A., Ciani, S.M., Greco, G., Novellino, E., Williams, D.C., Zisterer, D.M., Woods, M.J., Mihai, C., Manzoni, C., and Mennini, T. (1996). Synthesis, biological activity, and SARs of pyrrolobenzoxazepine derivatives, a new class of specific “peripheral-type” benzodiazepine receptor ligands. J. Med. Chem. 39, 3435-3450.
52 Oxazepam, NTP TR 468
Capen, C.C. (1994). Changes in structure and function of the parathyroid gland. In Pathobiology of the Aging Rat. (U. Mohr, D.L. Dungworth, and C.C. Capen, Eds.), pp. 199-226. ILSI Press, Washington, DC.
Code of Federal Regulations (CFR) 21, Part 58.
Committee on the Review of Medicines (CRM) (1980). Systematic review of the benzodiazepines. Guidelines for data sheets on diazepam, chlordiazepoxide, medazepam, clorazepate, lorazepam, oxazepam, temazepam, triazolam, nitrazepam, and flurazepam. Br. Med. J. 280, 910-912.
Cooper, J.R., Bloom, F.E., and Roth, R.H., Eds. (1978). The Biochemical Basis of Neuropharmacology, 3rd ed. Oxford University Press, New York.
Cox, D.R. (1972). Regression models and life-tables. J. R. Stat. Soc. B34, 187-220.
Crawford, B.D. (1985). Perspectives on the somatic mutation model of carcinogenesis. In Advances in Modern Environmental Toxicology. Mechanisms and Toxicity of Chemical Carcinogens and Mutagens (M.A. Mehlman, W.G. Flamm, and R.J. Lorentzen, Eds.), pp. 13-59. Princeton Scientific Publishing Co., Inc., Princeton, NJ.
Crebelli, R., Conti, G., Conti, L., and Carere, A. (1989). The E.E.C. genomic mutation program: Results with Aspergillus nidulans. Environ. Mol. Mutagen. 14 (Suppl. 15), 41-42 (Abstr.).
Crebelli, R., Conti, G., Conti, L., and Carere, A. (1991). In vitro studies with nine known or suspected spindle poisons: Results in tests for chromosome malsegregation in Aspergillus nidulans. Mutagenesis 6, 131-136.
Cunningham, M.L., Maronpot, R.R., Thompson, M., and Bucher, J.R. (1994). Early responses of the liver of B6C3F1 mice to the hepatocarcinogen oxazepam. Toxicol. Appl. Pharmacol. 124, 31-38.
Degraeve, N., Chollet, C., Moutschen, J., Moutschen-Dahmen, M., and Gilet-Delhalle, J. (1985). Investigation of the potential mutagenic activity of benzodiazepines in mice. Mutat. Res. 147, 290.
de la Iglesia, A., Barsoum, N., Gough, A., Mitchell, L., Martin, R.A., di Fonzo, C., and McGuire, E.J. (1981). Carcinogenesis bioassay of prazepam (Verstran) in rats and mice. Toxicol. Appl. Pharmacol. 57, 39-54.
Dinse, G.E., and Haseman, J.K. (1986). Logistic regression analysis of incidental-tumor data from animal carcinogenicity experiments. Fundam. Appl. Toxicol. 6, 44-52.
Dinse, G.E., and Lagakos, S.W. (1983). Regression analysis of tumour prevalence data. Appl. Statist. 32, 236-248.
Diwan, B.A., Rice, J.M., and Ward, J.M. (1986). Tumor-promoting activity of benzodiazepine tranquilizers, diazepam and oxazepam, in mouse liver. Carcinogenesis 7, 789-794.
Dixon, W.J., and Massey, F.J., Jr. (1951). Introduction to Statistical Analysis, 1st ed., pp. 145-147. McGraw-Hill Book Company, Inc., New York.
Eadie, M.J. (1984). Currently available benzodiazepines. Med. J. Aust. 8, 827-831.
Eustis, S.L., Hailey, J.R., Boorman, G.A., and Haseman, J.K. (1994). The utility of multiple-section sampling in the histopathological evaluation of the kidney for carcinogenicity studies. Toxicol. Pathol. 22, 457-472.
Finkle, B.S., McCloskey, K.L., and Goodman, L.S. (1979). Diazepam and drug-associated deaths. JAMA 242, 429-434.
Fischer, R.P., Peter, E.T., and Mullane, J.F. (1974). Experimental stress ulcers in acidotic and nonacidotic renal insufficiency. Arch. Surg. 109, 409-411.
53 Oxazepam, NTP TR 468
Fitzgerald, J.E., de la Iglesia, F.A., and McGuire, E.J. (1984). Carcinogenicity studies in rodents and ripazepam, a minor tranquilizing agent. Fundam. Appl. Toxicol. 4, 178-190.
Florey, K., Ed. (1974). Analytical Profiles of Drug Substances, Vol. 3, pp. 442-464. Academic Press, New York.
Fox, K.A., and Lahcen, R.B. (1974). Liver-cell adenomas and peliosis hepatis in mice associated with oxazepam. Res. Commun. Chem. Pathol. Pharmacol. 8, 481-488.
Galloway, S.M., Armstrong, M.J., Reuben, C., Colman, S., Brown, B., Cannon, C., Bloom, A.D., Nakamura, F., Ahmed, M., Duk, S., Rimpo, J., Margolin, B.H., Resnick, M.A., Anderson, B., and Zeiger, E. (1987). Chromosome aberrations and sister chromatid exchanges in Chinese hamster ovary cells: Evaluations of 108 chemicals. Environ. Mol. Mutagen. 10 (Suppl. 10), 1-175.
Gart, J.J., Chu, K.C., and Tarone, R.E. (1979). Statistical issues in interpretation of chronic bioassay tests for carcinogenicity. JNCI 62, 957-974.
Gonipath, C., Prentice, D.E., and Lewis, D.J. (1987). The alimentary system and pancreas. In Atlas of Experimental Toxicological Pathology, Vol. 13. (G.A. Gresham, Ed.), pp. 61-76. MTP Press Limited, Boston, MA.
Goodman and Gilman’s The Pharmacological Basis of Therapeutics (1996). 9th ed. (J.G. Hardman, L.E. Limbird, P.B. Molinoff, R.W. Ruddon, and A.G. Gilman, Eds.). McGraw-Hill, New York.
Greenblatt, D.J., and Shader, R.I. (1978). Pharmacokinetic understanding of antianxiety drug therapy. South. Med. J. 71, 2-9.
Greenblatt, D.J., Divoll, M., Harmatz, J.S., and Shader, R.I. (1980). Oxazepam kinetics, effects of age and sex. J. Pharmacol. Exp. Ther. 215, 86-91.
Griffin, R.J., and Burka, L.T. (1993). Metabolism and elimination of oxazepam in B6C3F1 and Swiss-Webster mice. Drug Metab. Dispos. 21, 918-926.
Griffin, R.J., and Burka, L.T. (1995). Metabolism and elimination of oxazepam in F344 rats. Drug Metab. Dispos. 23, 232-239.
Griffin, R.J., Burka, L.T., and Cunningham, M.L. (1995a). Activity of hepatic drug metabolizing enzymes following oxazepam-dosed feed treatment in B6C3F1 mice. Toxicol. Lett. 76, 251-256.
Griffin, R.J., Burka, L.T., and Cunningham, M.L. (1995b). Activity of hepatic drug metabolizing enzymes following oxazepam-dosed feed treatment in B6C3F mice. Toxicol. Lett. 76, 251-256.1
Griffin, R.J., Burka, L.T., and Demby, K.B. (1995c). Oxidative biotransformation of oxazepam to reactive and nonreactive products in rat, mouse and human microsomes. Hum. Exp. Toxicol. 14, 779-786.
Griffin, R.J., Dudley, C.N., and Cunningham, M.L. (1996). Biochemical effects of the mouse hepatocarcinogen oxazepam: Similarities to phenobarbital. Fundam. Appl. Toxicol. 29, 147-154.
Harlow, B.L., and Cramer, D.W. (1995). Self-reported use of antidepressants or benzodiazepine tranquilizers and risk of epithelial ovarian cancer: Evidence from two combined case-control studies (Massachusetts, United States). Cancer Causes Control 6, 130-134.
Hartz, S.C., Heinonen, O.P., Shapiro, S., Siskind, V., and Slone, D. (1975). Antenatal exposure to meprobamate and chlordiazepoxide in relation to malformations, mental development, and childhood mortality. N. Engl. J. Med. 292, 726-728.
Haseman, J.K. (1984). Statistical issues in the design, analysis and interpretation of animal carcinogenicity studies. Environ. Health Perspect. 58, 385-392.
Hollander, M., and Wolfe, D.A. (1973). Nonparametric Statistical Methods, pp. 120-123. John Wiley and Sons, New York.
Horrobin, D.F., Ghayur, T., and Karmali, R.A. (1979). Mind and cancer. Lancet 1, 978.
54 Oxazepam, NTP TR 468
Hsu, T.C., Liang, J.C., and Shirley, L.R. (1983). Aneuploidy induction by mitotic arrestants. Effects of diazepam on diploid Chinese hamster cells. Mutat. Res. 122, 201-209.
Husum, B., Wulf, H.C., Niebuhr, E., and Rasmussen, J.A. (1985). SCE in lymphocytes of patients treated with single, large doses of diazepam. Mutat. Res. 155, 71-73.
Ishidate, M., Jr., Hayashi, M., Sawada, M., Matsuoka, K., Yoshikawa, K., Ono, M., and Nakadate, M. (1978). Cytotoxicity test on medical drugs ) Chromosome aberration tests with Chinese hamster cells in vitro. Eisei Shikenjo Hokoku 96, 55-61.
Ishimura, K., Sawai, M., Yamamoto, K., Neda, K., and Sato, H. (1975). Studies on the chromosomes of rat bone marrow cells treated with benzodiazepine derivative in vivo. Teratology 12, 199.
Jab»o½ska, J.K., Knobloch, K., Majka, J., and WiÑniewska-Knypl, J.M. (1975). Stimulatory effects of chlordiazepoxide, diazepam and oxazepam on the drug-metabolizing enzymes in microsomes. Toxicology 5, 103-111.
Kanto, J.H. (1982). Use of benzodiazepines during pregnancy, labour and lactation, with particular reference to pharmacokinetic considerations. Drugs 23, 354-380.
Kaplan, E.L., and Meier, P. (1958). Nonparametric estimation from incomplete observations. J. Am. Stat. Assoc. 53, 457-481.
Kataoka, Y., Shibata, K., Gomita, Y., and Ueki, S. (1982). The mammillary body is a potential site of antianxiety action of benzodiazepines. Brain Res. 241, 374-377.
Kawachi, T., Yahagi, T., Kada, T., Tazima, Y., Ishidate, M., Sasaki, M., and Sugiyama, T. (1980). Cooperative programme on short-term assays for carcinogenicity in Japan. IARC Sci. Publ. 27, 323-330.
Kleinerman, R.A., Brinton, L.A., Hoover, R., and Fraumeni, J.F., Jr. (1984). Diazepam use and progression of breast cancer. Cancer Res. 44, 1223-1225.
Krueger, K.E., and Papadopoulos, V. (1992). Mitochondrial benzodiazepine receptors and the regulation of steroid biosynthesis. Annu. Rev. Pharmacol. Toxicol. 32, 211-237.
Lafi, A., and Parry, J.M. (1988). A study of the induction of aneuploidy and chromosome aberrations after diazepam, medazepam, midazolam and bromazepam treatment. Mutagenesis 1, 78.
Lafi, A., Parry, E.M., and Parry, J.M. (1987). The effects of benzodiazepines upon the fidelity of mitotic cell division in cultured Chinese hamster cells. Mutat. Res. 189, 319-332.
Leininger, J.R., and Riley, M.G.I. (1990). Bones, joints, and synovia. In Pathology of the Fischer Rat. Reference and Atlas. (G.A. Boorman, S.L. Eustis, M.R. Elwell, C.A. Montgomery, Jr., and W.F. MacKenzie, Eds.), pp. 209-226. Academic Press, Inc., San Diego.
Levitan, E.S., Schofield, P.R., Burt, D.R., Rhee, L.M., Wisden, W., Köhler, M., Fujita, N., Rodriguez, H.F., Stephenson, A., Darlison, M.G., Barnard, E.A., and Seeburg, P.H. (1988). Structural and functional basis for GABAA receptor heterogeneity. Nature 335, 76-79.
Livezey, G.T., Marczynski, T.J., McGrew, E.A., and Beluhan, F.Z. (1986a). Prenatal exposure to diazepam: Late postnatal teratogenic effect. Neurobehav. Toxicol. Teratol. 8, 433-440.
Livezey, G.T., Marczynski, T.J., and Isaac, L. (1986b). Prenatal diazepam: Chronic anxiety and deficits in brain receptors in mature rat progeny. Neurobehav. Toxicol. Teratol. 8, 425-432.
McConnell, E.E., Solleveld, H.A., Swenberg, J.A., and Boorman, G.A. (1986). Guidelines for combining neoplasms for evaluation of rodent carcinogenesis studies. JNCI 76, 283-289.
55 Oxazepam, NTP TR 468
MacGregor, J.T., Wehr, C.M., and Langlois, R.G. (1983). A simple fluorescent staining procedure for micronuclei and RNA in erythrocytes using Hoechst 33258 and pyronin Y. Mutat. Res. 120, 269-275.
MacGregor, J.T., Wehr, C.M., Henika, P.R., and Shelby, M.D. (1990). The in vivo erythrocyte micronucleus test: Measurement at steady state increases assay efficiency and permits integration with toxicity studies. Fundam. Appl. Toxicol. 14, 513-522.
McKnight, B., and Crowley, J. (1984). Tests for differences in tumor incidence based on animal carcinogenesis experiments. J. Am. Stat. Assoc. 79, 639-648.
Marcucci, F., Guaitani, A., Kvetina, J., Mussini, E., and Garattini, S. (1968). Species difference in diazepam metabolism and anticonvulsant effect. Eur. J. Pharmacol. 4, 467-470.
Margolin, B.H., Risko, K.J., Frome, E.L., and Tice, R.R. (1990). A general purpose statistical analysis program for micronucleus assay data. Appendix 2: Micronucleus data management and analysis version 1.4a. Integrated Laboratory Systems, Research Triangle Park, NC.
Maronpot, R.R., and Boorman, G.A. (1982). Interpretation of rodent hepatocellular proliferative alterations and hepatocellular tumors in chemical safety assessment. Toxicol. Pathol. 10, 71-80.
Martin, W.R., McNicholas, L.F., and Cherian, S. (1982). Diazepam and pentobarbital dependence in the rat. Life Sci. 31, 721-730.
Matsuoka, A., Hayashi, M., and Ishidate, M., Jr. (1979). Chromosomal aberration tests on 29 chemicals combined with S9 mix in vitro. Mutat. Res. 66, 277-290.
Matula, T.I., and Downie, R. (1983). Evaluation of diazepam and oxazepam in in vitro microbial mutagenicity tests and in an in vivo promoter assay. Environ. Mutagen. 5, 478.
The Merck Index (1983). 10th ed. (M. Windholz, Ed.), p. 994. Merck and Company, Inc., Rahway, NJ.
The Merck Index (1989). 11th ed. (S. Budavari, Ed.), p. 1096. Merck and Company, Inc., Rahway, NJ.
Milkovich, L., and van den Berg, B.J. (1974). Effects of prenatal meprobamate and chlordiazepoxide hydrochloride on human embryonic and fetal development. N. Engl. J. Med. 291, 1268-1271.
Miller, B.M., and Adler, I.-D. (1989). Suspect spindle poisons: Analysis of c-mitotic effects in mouse bone marrow cells. Mutagenesis 4, 208-215.
Miller, J.A., and Miller, E.C. (1977). Ultimate chemical carcinogens as reactive mutagenic electrophiles. In Origins of Human Cancer (H.H. Hiatt, J.D. Watson, and J.A. Winsten, Eds.), pp. 605-627. Cold Spring Harbor Laboratory, Cold Spring Harbor, NY.
Miller, R.P., and Becker, B.A. (1975). Teratogenicity of oral diazepam and diphenylhydantoin in mice. Toxicol. Appl. Pharmacol. 32, 53-61.
National Cancer Institute (NCI) (1976). Guidelines for Carcinogen Bioassay in Small Rodents. Technical Report Series No. 1. NIH Publication No. 76-801. U.S. Department of Health, Education, and Welfare, Public Health Service, National Institutes of Health, Bethesda, MD.
National Institutes of Health (NIH) (1978). Open Formula Rat and Mouse Ration (NIH-07). Specification NIH-11-1335. U.S. Department of Health, Education, and Welfare, Public Health Service, NIH, Bethesda, MD.
National Toxicology Program (NTP) (1993). Toxicology and Carcinogenesis Studies of Oxazepam (CAS No. 604-75-1) in Swiss-Webster and B6C3F1
Mice (Feed Studies). Technical Report Series No. 443. NIH Publication No. 93-3359. U.S. Department of Health and Human Services, Public Health Service, National Institutes of Health, Research Triangle Park, NC.

56 Oxazepam, NTP TR 468
Orlandi, F., Bamonti, F., Dini, M., Koch, M., and Jezequel, A.M. (1975). Hepatic cholesterol synthesis in man: Effect of diazepam and other drugs. Eur. J. Clin. Invest. 5, 139-146.
Owen, G., Smith, T.H.F., and Agersborg, H.P.K., Jr. (1970). Toxicity of some benzodiazepine compounds with CNS activity. Toxicol. Appl. Pharmacol. 16, 556-570.
Papadopoulos, V., and Brown, A.S. (1995). Role of the peripheral-type benzodiazepine receptor and the polypeptide diazepam binding inhibitor in steroidogenesis. J. Steroid Biochem. Mol. Biol. 53, 103-110.
Parry, J.M., Parry, E.M., Calvert, R., Lafi, A., and Somers, A. (1986). The mechanisms of induction of chromosome aneuploidy as revealed by the study of aberrations of mitotic cell division. Prog. Clin. Biol. Res. 209A, 325-332.
Parry, J.M., Parry, E.M., Warr, T., Lynch, A., and James, S. (1989). The detection of aneugens using yeasts and cultured mammalian cells. Environ. Mol. Mutagen. 14 (Suppl. 15), 151 (Abstr.).
Pedersen, W., and Lavik, N.J. (1991). Adolescents and benzodiazepines: Prescribed use, self-medication and intoxication. Acta Psychiatr. Scand. 84, 94-98.
Petersen, K.W., Sherwood, H.L., and Petersen, H.D. (1978). The cytogenetic effects of diazepam and chlordiazepoxide. Anat. Rec. 190, 620.
Petrescu, M., Cuparencu, B., Horak, J., Petrescu, L., Florescu, P., Kory, M., Tomus, C., and Rusu, V. (1981). Certain aspects of the toxicity of some benzodiazepines. Agressologie 22, 209-217.
Physicians’ Desk Reference (PDR) (1996). 50th ed., pp. 2810-2811. Medical Economics Company, Montvale, NJ.
Préat, V., de Gerlache, J., Lans, M., and Roberfroid, M. (1987). Promoting effect of oxazepam in rat hepatocarcinogenesis. Carcinogenesis 8, 97-100.
Preiss, A.M., Scheutwinkel-Reich, M., Fülle, I., Grohmann, H.G., and Stan, H.-J. (1982). Investigation, with the Salmonella/microsome test, of psychopharmaceuticals used in meat production. Mutat. Res. 104, 333-337.
Rajaonarison, J.F., Lacarelle, B., De Sousa, G., Catalin, J., and Rahmani, R. (1991). In vitro glucuronidation of 3N-azido-3N-deoxythymidine by human liver. Role of UDP-glucuronosyltransferase 2 form. Drug Metab. Dispos. 19, 809-815.
Randall, L.O., Schallek, W., Scheckel, C.L., Stefko, P.L., Banziger, R.F., Pool, W., and Moe, R.A. (1969). Pharmacological studies on
1flurazepam hydrochloride ( ) (RO 5-6901), a newpsychotropic agent of the benzodiazepine class. Arch. Int. Pharmacodyn. Ther. 178, 216-241.
Randall, L.O., Scheckel, C.L., and Pool, W. (1970). 1Pharmacology of medazepam ( ) and metabolites.
Arch. Int. Pharmacodyn. Ther. 185, 135-148.
Rao, G.N., Edmondson, J., and Elwell, M.R. (1993). Influence of dietary protein concentration on severity of nephropathy in Fischer-344 (F-344/N) rats. Toxicol. Pathol. 21, 353-361.
Remandet, B., Gouy, D., Berthe, J., Mazue, G., and Williams, G.M. (1984). Lack of initiating or promoting activity of six benzodiazepine tranquilizers in rat liver limited bioassays monitored by histopathology and assay of liver and plasma enzymes. Fundam. Appl. Toxicol. 4, 152-163.
Remington’s Pharmaceutical Sciences (1980). 16th ed. (A. Osol, Ed.). Mack Publishing Company, Easton, PA.
Ricceri, L., Calamandrei, G., and Alleva, E. (1994). Prenatal oxazepam affects passive avoidance performance of preweaning mice. Brain Res. Bull. 33, 267-271.
Richards, J.G., Schoch, P., Möhler, H., and Haefely, W. (1986). Benzodiazepine receptors resolved. Experientia 42, 121-126.
57 Oxazepam, NTP TR 468
Robinson, R.L., Van Ryzin, R.J., Stoll, R.E., Jensen, R.D., and Bagdon, R.E. (1984). Chronic toxicity/carcinogenesis study of temazepam in mice and rats. Fundam. Appl. Toxicol. 4, 394-405.
Rogers, C.J., Twyman, R.E., and MacDonald, R.L. (1994). Benzodiazepine and beta-carboline regulation of single GABAA receptor channels of mouse spinal neurones in culture. J. Physiol. (Lond.) 475, 69-82.
Rosenberg, L., Palmer, J.R., Zauber, A.G., Warshauer, M.E., Strom, B.L., Harlap, S. and Shapiro, S. (1995). Relation of benzodiazepine use to the risk of selected cancers: Breast, large bowel, malignant melanoma, lung, endometrium, ovary, non-Hodgkin’s lymphoma, testis, Hodgkin’s disease, thyroid and liver. Am. J. Epidemiol. 141, 1153-60.
Ryan, C.L., and Pappas, B.A. (1986). Intrauterine diazepam exposure: Effects on physical and neurobehavioral development in the rat. Neurobehav. Toxicol. Teratol. 8, 279-286.
Saano, V. (1988). Central-type and peripheral-type benzodiazepine receptors. Ann. Clin. Res. 20, 348-355.
Saito, H., Kobayashi, H., Takeno, S., and Sakai, T. (1984). Fetal toxicity of benzodiazepines in rats. Res. Commun. Chem. Pathol. Pharmacol. 46, 437 (Abstr.).
Salzman, C., Shader, R.I., Greenblatt, D.J., and Harmatz, J.S. (1983). Long vs. short half-life benzodiazepines in the elderly. Arch. Gen. Psychiatry 40, 293-297.
Sasaki, M., Sugimura, K., Yoshida, M.A., and Abe, S. (1980). Cytogenetic effects of 60 chemicals on cultured human and Chinese hamster cells. La Kromosomo 20, 574-584.
Schmid, W., and Staiger, G.R. (1969). Chromosome studies on bone marrow from Chinese hamsters treated with benzodiazepine tranquillizers and cyclophosphamide. Mutat. Res. 7, 99-108.
Scrollini, F., Caliari, S., Romano, A., and Torchio, P. (1975). Toxicological and pharmaco-logical investigations of pinazepam (7-chloro-1-propargyl5-phenyl-3H-1,4-benzodiazepin-2-one): A new psychotherapeutic agent. Arzneimittelforschung 25, 934-940.
Seely, J.C., and Hildebrandt, P.K. (1990). Parathyroid gland. In Pathology of the Fischer Rat. Reference and Atlas. (G.A. Boorman, S.L. Eustis, M.R. Elwell, C.A. Montgomery, Jr., and W.F. MacKenzie, Eds.), pp. 537-543. Academic Press, Inc., San Diego.
Shader, R.I., and Greenblatt, D.J. (1981). The use of benzodiazepines in clinical practice. Br. J. Clin. Pharmacol. 11, 5S-9S.
Shannon, R.W., Fraser, G.P., Aitken, R.G., and Harper, J.R. (1972). Diazepam in preeclamptic toxaemia with special reference to its effect on the newborn infant. Br. J. Clin. Pract. 26, 271-275.
Shelby, M.D., and Witt, K.L. (1995). Comparison of results from mouse bone marrow chromosome aberration and micronucleus tests. Environ. Mol. Mutagen. 25, 302-313.
Shelby, M.D., Erexson, G.L., Hook, G.J., and Tice, R.R. (1993). Evaluation of a three-exposure mouse bone marrow micronucleus protocol: Results with 49 chemicals. Environ. Mol. Mutagen. 21, 160-179.
Shibuya, T., Watanabe, Y., Hill, H.F., and Salafsky, B. (1986). Developmental alterations in maturing rats caused by chronic prenatal and postnatal diazepam treatments. Jpn. J. Pharmacol. 40, 21-29.
Sisenwine, S.F., Tio, C.O., Shrader, S.R., and Ruelius, H.W. (1972). The biotransformation of oxazepam (7-chloro-1,3-dihydro-3-hydroxy-5-phenyl2H-1,4-benzodiazepin-2-one) in man, miniature swine and rat. Arzneimittelforschung 22, 682-687.
58 Oxazepam, NTP TR 468
Snyder, S.H., Verma, A., and Trifiletti, R.R. (1987). The peripheral-type benzodiazepine receptor: A protein of mitochondrial outer membranes utilizing porphyrins as endogenous ligands. FASEB J. 1, 282-288.
Staiger, G.R. (1969). Chlordiazepoxide and diazepam: Absence of effects on the chromosomes of diploid human fibroblast cells. Mutat. Res. 7, 109-115.
Staiger, G.R. (1970). Studies on the chromosomes of human lymphocytes treated with diazepam in vitro. Mutat. Res. 10, 635-644.
Stenchever, M.A., Frankel, R.S., and Jarvis, J.A. (1970a). Effect of diazepam on chromosomes of human leukocytes in vivo. Am. J. Obstet. Gynecol. 107, 456-460.
Stenchever, M.A., Frankel, R.S., Jarvis, J.A., and Veress, K. (1970b). Effect of chlordiazepoxide hydrochloride on human chromosomes. Am. J. Obstet. Gynecol. 106, 920-923.
Stoll, B.A. (1976). Psychosomatic factors and tumour growth. In Risk Factors in Breast Cancer (B.A. Stoll, Ed.), pp. 193-203. William Heinemann Medical Books, London.
Straus, D.S. (1981). Somatic mutation, cellular differentiation, and cancer causation. JNCI 67, 233-241.
Swierenga, S.H.H., Butler, S.G., and Hasnain, S.H. (1983). Activity of diazepam and oxazepam in various mammalian cell in vitro toxicity tests. Environ. Mutagen. 5, 417.
Tarone, R.E. (1975). Tests for trend in life table analysis. Biometrika 62, 679-682.
Tennant, R.W., Margolin, B.H., Shelby, M.D., Zeiger, E., Haseman, J.K., Spalding, J., Caspary, W., Resnick, M., Stasiewicz, S., Anderson, B., and Minor, R. (1987). Prediction of chemical carcinogenicity in rodents from in vitro genetic toxicity assays. Science 236, 933-941.
Tocus, E.C., Nelson, R.C., and Vocci, F.J., Jr. (1983). Regulatory perspectives and the benzodiazepines. J. Psychoactive Drugs 15, 151-157.
Torigoe, K. (1979). Sister chromatid exchange in children treated with anticonvulsant drugs. Acta Med. Biol. 27, 65-72.
Trosko, J.E., and Horrobin, D.F. (1980). The activity of diazepam in a Chinese hamster V79 lung cell assay for tumour promoters. IRCS Med. Sci. 8, 887.
Tucker, J.C. (1985). Benzodiazepines and the developing rat: A critical review. Neurosci. Biobehav. Rev. 9, 101-111.
Vega, P., Carrasco, M., Sanchez, E., and del Villar, E. (1984). Structure-activity relationship in the effect of 1,4-benzodiazepines on morphine, aminopyrine and oestrone metabolism. Res. Commun. Chem. Pathol. Pharmacol. 44, 179-198.
Verma, A., and Snyder, S.H. (1989). Peripheral type benzodiazepine receptors. Annu. Rev. Pharmacol. Toxicol. 29, 307-322.
Vorne, M., and Idänpään-Heikkilä, J. (1975). Inhibition of drug metabolizing enzymes by diazepam in rat liver. Experientia 31, 962-963.
Waskell, L. (1978). A study of the mutagenicity of anesthetics and their metabolites. Mutat. Res. 57, 141-153.
Wee, E.L., and Zimmerman, E.F. (1983). Involvement of GABA in palate morphogenesis and its relation to diazepam teratogenesis in two mouse strains. Teratology 28, 15-22.
White, B.J., Driscoll, E.J., Tjio, J.-H., and Smilack, Z.H. (1974). Chromosomal aberration rates and intravenously given diazepam. JAMA 230, 414-417.
Whittaker, S.G., Zimmermann, F.K., Dicus, B., Piegorsch, W.W., Fogel, S., and Resnick, M.A. (1989). Detection of induced mitotic chromosome loss in Saccharomyces cerevisiae — an interlaboratory study. Mutat. Res. 224, 31-78.
59 Oxazepam, NTP TR 468
Williams, G.M., Mori, H., and McQueen, C.A. (1989). Structure-activity relationships in the rat hepatocyte DNA-repair test for 300 chemicals. Mutat. Res. 221, 263-286.
Xu, W., and Adler, I.-D. (1990). Clastogenic effects of known and suspect spindle poisons studied by chromosome analysis in mouse bone marrow cells. Mutagenesis 5, 371-374.
Yuan, J., Goehl, T.J., Hong, L., Clark, J., Murrill, E., and Moore, R. (1994). Toxicokinetics of oxazepam in rats and mice. J. Pharm. Sci. 83, 1373-1379.
Zeiger, E., Haseman, J.K., Shelby, M.D., Margolin, B.H., and Tennant, R.W. (1990). Evaluation of four in vitro genetic toxicity tests for predicting rodent carcinogenicity: Confirmation of earlier results with 41 additional chemicals. Environ. Mol. Mutagen. 16 (Suppl. 18), 1-14.
Zeiger, E., Anderson, B., Haworth, S., Lawlor, T., and Mortelmans, K. (1992). Salmonella mutagenicity tests: V. Results from the testing of 311 chemicals. Environ. Mol. Mutagen. 19 (Suppl. 21), 2-141.
Zhurkov, V.S. (1975). Investigation of the mutagenic activity of drug preparations and food additives in a culture of human lymphocytes. Sov. Genet. 11, 528-530.

60 Oxazepam, NTP TR 468
61
APPENDIX A SUMMARY OF LESIONS IN MALE RATS
IN THE 2-YEAR FEED STUDY OF OXAZEPAM
TABLE A1
TABLE A2
TABLE A3a
TABLE A3b
TABLE A4a
TABLE A4b
TABLE A4c
TABLE A5
Summary of the Incidence of Neoplasms in Male Rats in the 2-Year Feed Study of Oxazepam . . . . . . . . . . . . . . . . . . . . . . . . . . . . . . . . . . Individual Animal Tumor Pathology of Male Rats in the 2-Year Feed Study of Oxazepam . . . . . . . . . . . . . . . . . . . . . . . . . . . . . . . . . . Statistical Analysis of Primary Neoplasms in Male Rats in the 2-Year Feed Study of Oxazepam . . . . . . . . . . . . . . . . . . . . . . . . . . . . . . . . . . Statistical Analysis of Primary Neoplasms in Male Rats in the 2-Year Stop-Exposure Feed Study of Oxazepam . . . . . . . . . . . . . . . . . . . . . . . . Historical Incidence of Renal Tubule Adenoma in Untreated Male F344/N Rats . . . . . . . . . . . . . . . . . . . . . . . . . . . . . . . . . . . . . . . Historical Incidence of Benign Adrenal Medulla Pheochromocytoma in Untreated Male F344/N Rats . . . . . . . . . . . . . . . . . . . . . . . . . . . . . . . . . . . . . . . Historical Incidence of Pituitary Gland (Pars Distalis) Adenoma in Untreated Male F344/N Rats . . . . . . . . . . . . . . . . . . . . . . . . . . . . . . . . . . . . . . . Summary of the Incidence of Nonneoplastic Lesions in Male Rats in the 2-Year Feed Study of Oxazepam . . . . . . . . . . . . . . . . . . . . . . . . . . . . . . . . . .
62
66
90
96
101
101
102
103
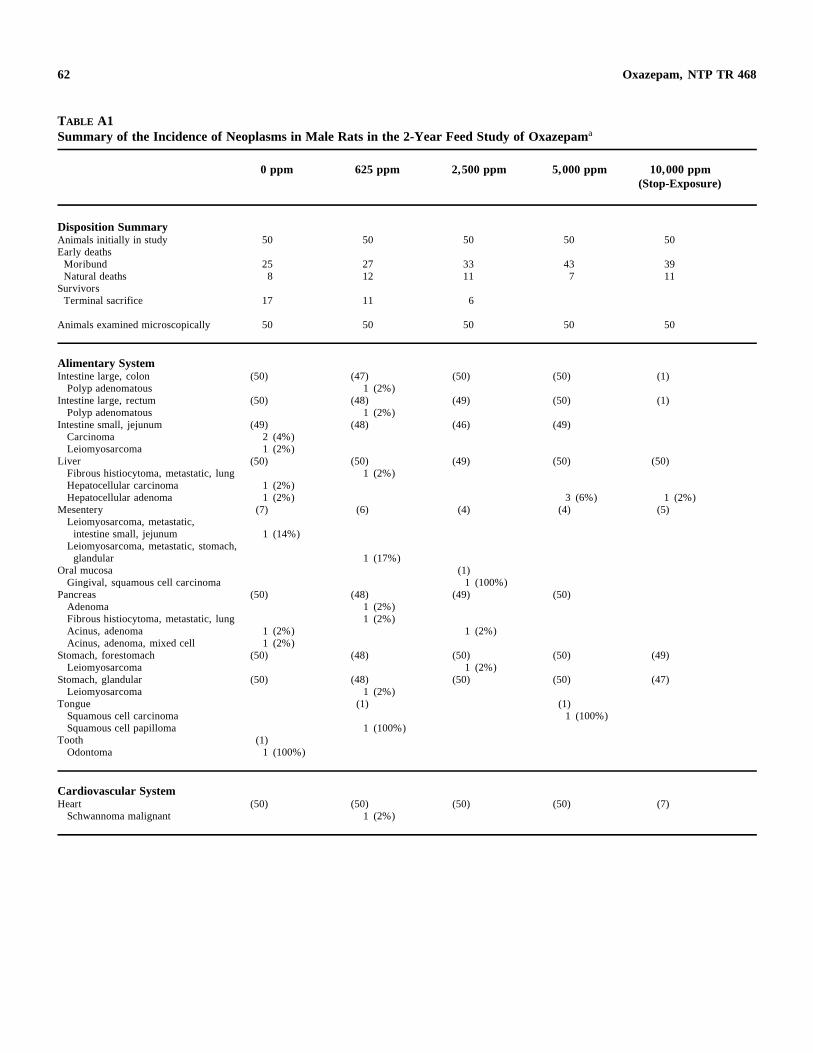
62 Oxazepam, NTP TR 468
TABLE A1 Summary of the Incidence of Neoplasms in Male Rats in the 2-Year Feed Study of Oxazepama
0 ppm 625 ppm 2,500 ppm 5,000 ppm 10,000 ppm (Stop-Exposure)
Disposition Summary Animals initially in study 50 50 50 50 50 Early deaths Moribund 25 27 33 43 39 Natural deaths 8 12 11 7 11
Survivors Terminal sacrifice 17 11 6
Animals examined microscopically 50 50 50 50 50
Alimentary System Intestine large, colon (50) (47) (50) (50) (1)
Polyp adenomatous 1 (2%) Intestine large, rectum (50) (48) (49) (50) (1)
Polyp adenomatous 1 (2%) Intestine small, jejunum (49) (48) (46) (49)
Carcinoma 2 (4%) Leiomyosarcoma 1 (2%)
Liver (50) (50) (49) (50) (50) Fibrous histiocytoma, metastatic, lung 1 (2%) Hepatocellular carcinoma 1 (2%) Hepatocellular adenoma 1 (2%) 3 (6%) 1 (2%)
Mesentery (7) (6) (4) (4) (5) Leiomyosarcoma, metastatic, intestine small, jejunum 1 (14%) Leiomyosarcoma, metastatic, stomach, glandular 1 (17%)
Oral mucosa (1) Gingival, squamous cell carcinoma 1 (100%)
Pancreas (50) (48) (49) (50) Adenoma 1 (2%) Fibrous histiocytoma, metastatic, lung 1 (2%) Acinus, adenoma 1 (2%) 1 (2%) Acinus, adenoma, mixed cell 1 (2%)
Stomach, forestomach (50) (48) (50) (50) (49) Leiomyosarcoma 1 (2%)
Stomach, glandular (50) (48) (50) (50) (47) Leiomyosarcoma 1 (2%)
Tongue (1) (1) Squamous cell carcinoma 1 (100%) Squamous cell papilloma 1 (100%)
Tooth (1) Odontoma 1 (100%)
Cardiovascular System Heart (50) (50) (50) (50) (7)
Schwannoma malignant 1 (2%)
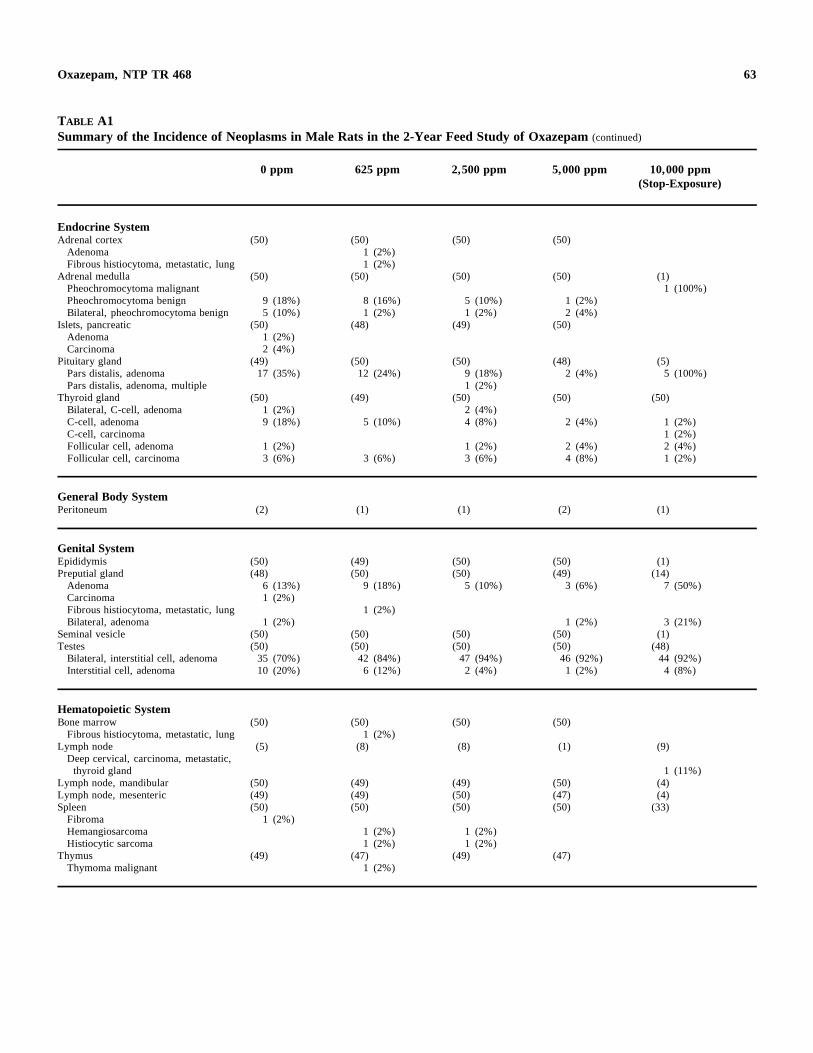
63 Oxazepam, NTP TR 468
TABLE A1 Summary of the Incidence of Neoplasms in Male Rats in the 2-Year Feed Study of Oxazepam (continued)
0 ppm 625 ppm 2,500 ppm 5,000 ppm 10,000 ppm (Stop-Exposure)
Endocrine System Adrenal cortex (50) (50) (50) (50)
Adenoma 1 (2%) Fibrous histiocytoma, metastatic, lung 1 (2%)
Adrenal medulla (50) (50) (50) (50) (1) Pheochromocytoma malignant 1 (100%) Pheochromocytoma benign 9 (18%) 8 (16%) 5 (10%) 1 (2%) Bilateral, pheochromocytoma benign 5 (10%) 1 (2%) 1 (2%) 2 (4%)
Islets, pancreatic (50) (48) (49) (50) Adenoma 1 (2%) Carcinoma 2 (4%)
Pituitary gland (49) (50) (50) (48) (5) Pars distalis, adenoma 17 (35%) 12 (24%) 9 (18%) 2 (4%) 5 (100%) Pars distalis, adenoma, multiple 1 (2%)
Thyroid gland (50) (49) (50) (50) (50) Bilateral, C-cell, adenoma 1 (2%) 2 (4%) C-cell, adenoma 9 (18%) 5 (10%) 4 (8%) 2 (4%) 1 (2%) C-cell, carcinoma 1 (2%) Follicular cell, adenoma 1 (2%) 1 (2%) 2 (4%) 2 (4%) Follicular cell, carcinoma 3 (6%) 3 (6%) 3 (6%) 4 (8%) 1 (2%)
General Body System Peritoneum (2) (1) (1) (2) (1)
Genital System Epididymis (50) (49) (50) (50) (1) Preputial gland (48) (50) (50) (49) (14)
Adenoma 6 (13%) 9 (18%) 5 (10%) 3 (6%) 7 (50%) Carcinoma 1 (2%) Fibrous histiocytoma, metastatic, lung 1 (2%) Bilateral, adenoma 1 (2%) 1 (2%) 3 (21%)
Seminal vesicle (50) (50) (50) (50) (1) Testes (50) (50) (50) (50) (48)
Bilateral, interstitial cell, adenoma 35 (70%) 42 (84%) 47 (94%) 46 (92%) 44 (92%) Interstitial cell, adenoma 10 (20%) 6 (12%) 2 (4%) 1 (2%) 4 (8%)
Hematopoietic System Bone marrow (50) (50) (50) (50)
Fibrous histiocytoma, metastatic, lung 1 (2%) Lymph node (5) (8) (8) (1) (9)
Deep cervical, carcinoma, metastatic, thyroid gland 1 (11%)
Lymph node, mandibular (50) (49) (49) (50) (4) Lymph node, mesenteric (49) (49) (50) (47) (4) Spleen (50) (50) (50) (50) (33)
Fibroma 1 (2%) Hemangiosarcoma 1 (2%) 1 (2%) Histiocytic sarcoma 1 (2%) 1 (2%)
Thymus (49) (47) (49) (47) Thymoma malignant 1 (2%)
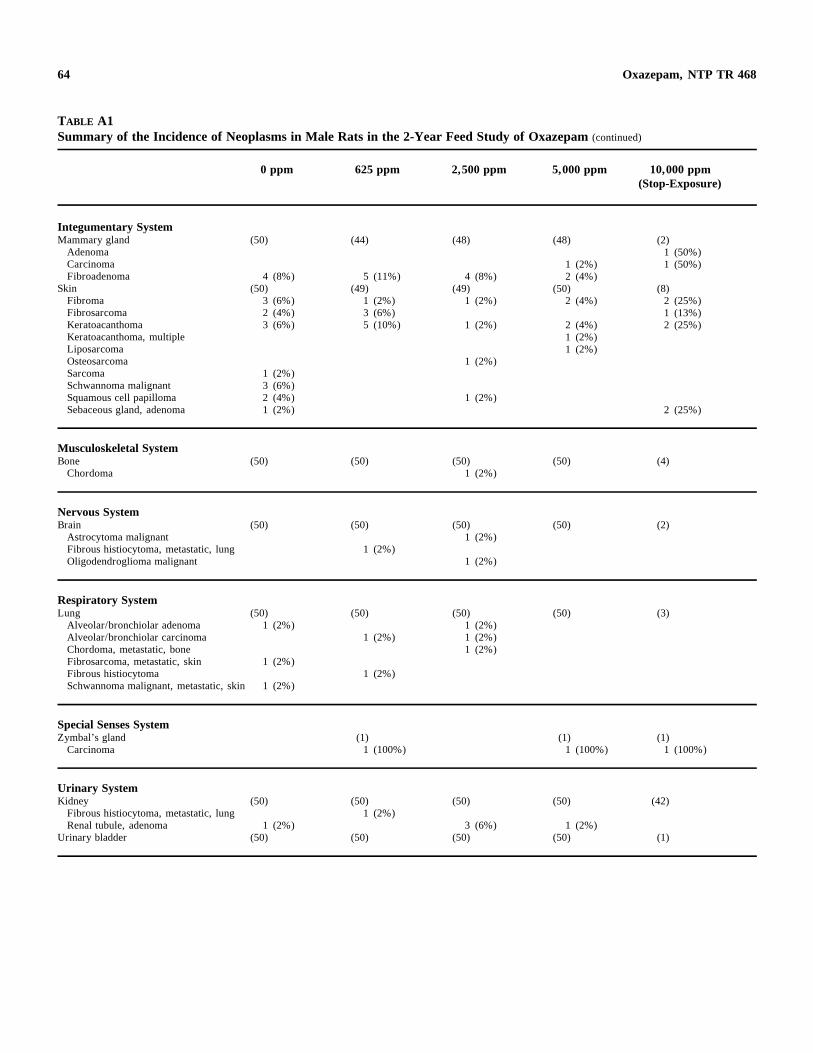
64 Oxazepam, NTP TR 468
TABLE A1 Summary of the Incidence of Neoplasms in Male Rats in the 2-Year Feed Study of Oxazepam (continued)
0 ppm 625 ppm 2,500 ppm 5,000 ppm 10,000 ppm (Stop-Exposure)
Integumentary System Mammary gland
Adenoma Carcinoma Fibroadenoma
Skin Fibroma Fibrosarcoma Keratoacanthoma Keratoacanthoma, multiple Liposarcoma Osteosarcoma Sarcoma Schwannoma malignant Squamous cell papilloma Sebaceous gland, adenoma
(50)
4 (8%) (50)
3 (6%) 2 (4%) 3 (6%)
1 (2%) 3 (6%) 2 (4%) 1 (2%)
(44)
5 (11%) (49)
1 (2%) 3 (6%) 5 (10%)
(48)
4 (8%) (49)
1 (2%)
1 (2%)
1 (2%)
1 (2%)
(48)
1 (2%) 2 (4%)
(50) 2 (4%)
2 (4%) 1 (2%) 1 (2%)
(2) 1 (50%) 1 (50%)
(8) 2 (25%) 1 (13%) 2 (25%)
2 (25%)
Musculoskeletal System Bone
Chordoma (50) (50) (50)
1 (2%) (50) (4)
Nervous System Brain
Astrocytoma malignant Fibrous histiocytoma, metastatic, lung Oligodendroglioma malignant
(50) (50)
1 (2%)
(50) 1 (2%)
1 (2%)
(50) (2)
Respiratory System Lung (50)
Alveolar/bronchiolar adenoma 1 (2%) Alveolar/bronchiolar carcinoma Chordoma, metastatic, bone Fibrosarcoma, metastatic, skin 1 (2%) Fibrous histiocytoma Schwannoma malignant, metastatic, skin 1 (2%)
(50)
1 (2%)
1 (2%)
(50) 1 (2%) 1 (2%) 1 (2%)
(50) (3)
Special Senses System Zymbal’s gland
Carcinoma (1)
1 (100%) (1)
1 (100%) (1)
1 (100%)
Urinary System Kidney
Fibrous histiocytoma, metastatic, lung Renal tubule, adenoma
Urinary bladder
(50)
1 (2%) (50)
(50) 1 (2%)
(50)
(50)
3 (6%) (50)
(50)
1 (2%) (50)
(42)
(1)
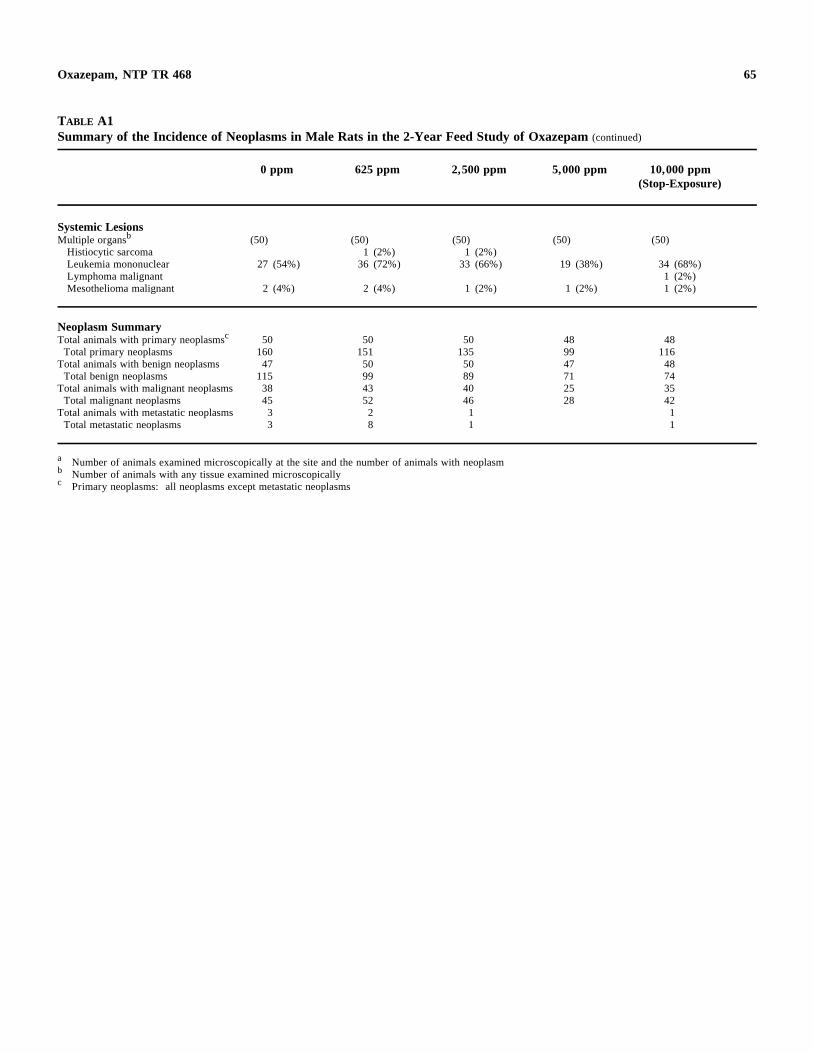
65
c
Oxazepam, NTP TR 468
TABLE A1 Summary of the Incidence of Neoplasms in Male Rats in the 2-Year Feed Study of Oxazepam (continued)
0 ppm 625 ppm 2,500 ppm 5,000 ppm 10,000 ppm (Stop-Exposure)
Systemic Lesions Multiple organsb (50) (50) (50) (50) (50)
Histiocytic sarcoma 1 (2%) 1 (2%) Leukemia mononuclear 27 (54%) 36 (72%) 33 (66%) 19 (38%) 34 (68%) Lymphoma malignant 1 (2%) Mesothelioma malignant 2 (4%) 2 (4%) 1 (2%) 1 (2%) 1 (2%)
Neoplasm Summary Total animals with primary neoplasmsc 50 50 50 48 48
Total primary neoplasms 160 151 135 99 116 Total animals with benign neoplasms 47 50 50 47 48 Total benign neoplasms 115 99 89 71 74
Total animals with malignant neoplasms 38 43 40 25 35 Total malignant neoplasms 45 52 46 28 42
Total animals with metastatic neoplasms 3 2 1 1 Total metastatic neoplasms 3 8 1 1
a Number of animals examined microscopically at the site and the number of animals with neoplasmb Number of animals with any tissue examined microscopically
Primary neoplasms: all neoplasms except metastatic neoplasms
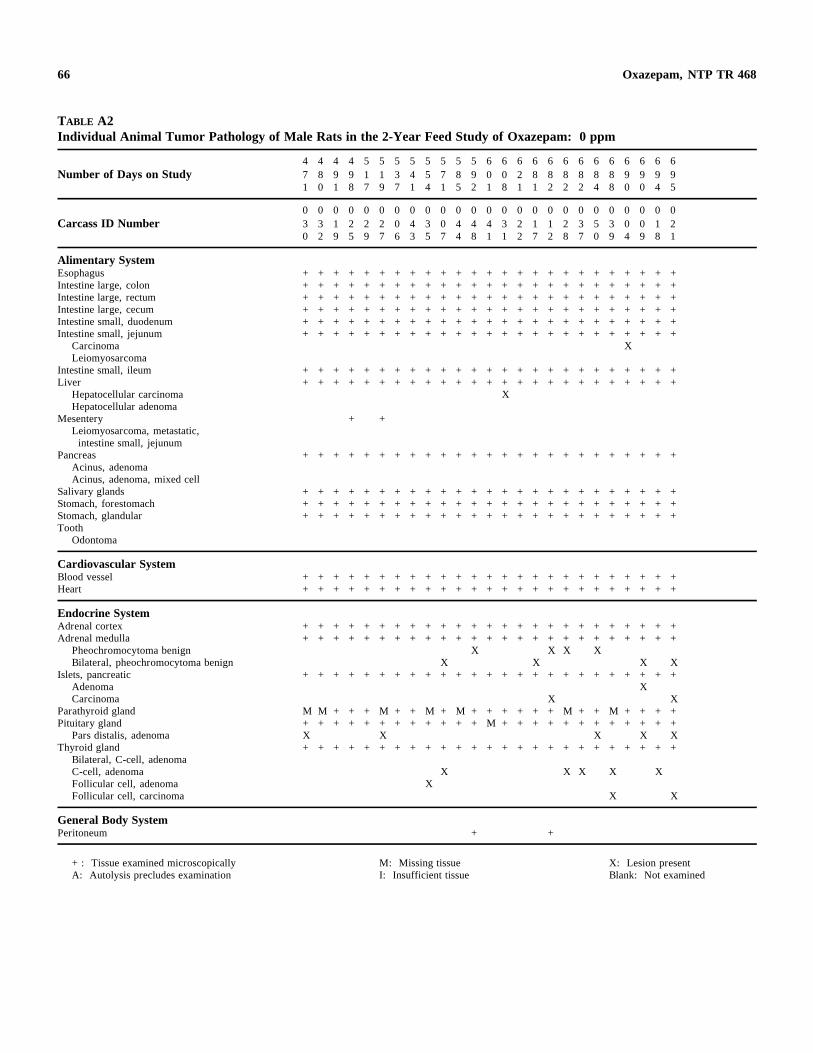
66 Oxazepam, NTP TR 468
TABLE A2 Individual Animal Tumor Pathology of Male Rats in the 2-Year Feed Study of Oxazepam: 0 ppm
4 4 4 4 5 5 5 5 5 5 5 5 6 6 6 6 6 6 6 6 6 6 6 6 6 Number of Days on Study 7 8 9 9 1 1 3 4 5 7 8 9 0 0 2 8 8 8 8 8 8 9 9 9 9
1 0 1 8 7 9 7 1 4 1 5 2 1 8 1 1 2 2 2 4 8 0 0 4 5
0 0 0 0 0 0 0 0 0 0 0 0 0 0 0 0 0 0 0 0 0 0 0 0 0 Carcass ID Number 3 3 1 2 2 2 0 4 3 0 4 4 4 3 2 1 1 2 3 5 3 0 0 1 2
0 2 9 5 9 7 6 3 5 7 4 8 1 1 2 7 2 8 7 0 9 4 9 8 1
Alimentary System Esophagus + + + + + + + + + + + + + + + + + + + + + + + + + Intestine large, colon + + + + + + + + + + + + + + + + + + + + + + + + + Intestine large, rectum + + + + + + + + + + + + + + + + + + + + + + + + + Intestine large, cecum + + + + + + + + + + + + + + + + + + + + + + + + + Intestine small, duodenum + + + + + + + + + + + + + + + + + + + + + + + + + Intestine small, jejunum + + + + + + + + + + + + + + + + + + + + + + + + +
Carcinoma X Leiomyosarcoma
Intestine small, ileum + + + + + + + + + + + + + + + + + + + + + + + + + Liver + + + + + + + + + + + + + + + + + + + + + + + + +
Hepatocellular carcinoma X Hepatocellular adenoma
Mesentery + + Leiomyosarcoma, metastatic, intestine small, jejunum
Pancreas + + + + + + + + + + + + + + + + + + + + + + + + + Acinus, adenoma Acinus, adenoma, mixed cell
Salivary glands + + + + + + + + + + + + + + + + + + + + + + + + + Stomach, forestomach + + + + + + + + + + + + + + + + + + + + + + + + + Stomach, glandular + + + + + + + + + + + + + + + + + + + + + + + + + Tooth
Odontoma
Cardiovascular System Blood vessel + + + + + + + + + + + + + + + + + + + + + + + + + Heart + + + + + + + + + + + + + + + + + + + + + + + + +
Endocrine System Adrenal cortex + + + + + + + + + + + + + + + + + + + + + + + + + Adrenal medulla + + + + + + + + + + + + + + + + + + + + + + + + +
Pheochromocytoma benign X X X X Bilateral, pheochromocytoma benign X X X X
Islets, pancreatic + + + + + + + + + + + + + + + + + + + + + + + + + Adenoma X Carcinoma X X
Parathyroid gland M M + + + M + + M + M + + + + + + M + + M + + + + Pituitary gland + + + + + + + + + + + + M + + + + + + + + + + + +
Pars distalis, adenoma X X X X X Thyroid gland + + + + + + + + + + + + + + + + + + + + + + + + +
Bilateral, C-cell, adenoma C-cell, adenoma X X X X X Follicular cell, adenoma X Follicular cell, carcinoma X X
General Body System Peritoneum + +
+: Tissue examined microscopically M: Missing tissue X: Lesion present A: Autolysis precludes examination I: Insufficient tissue Blank: Not examined
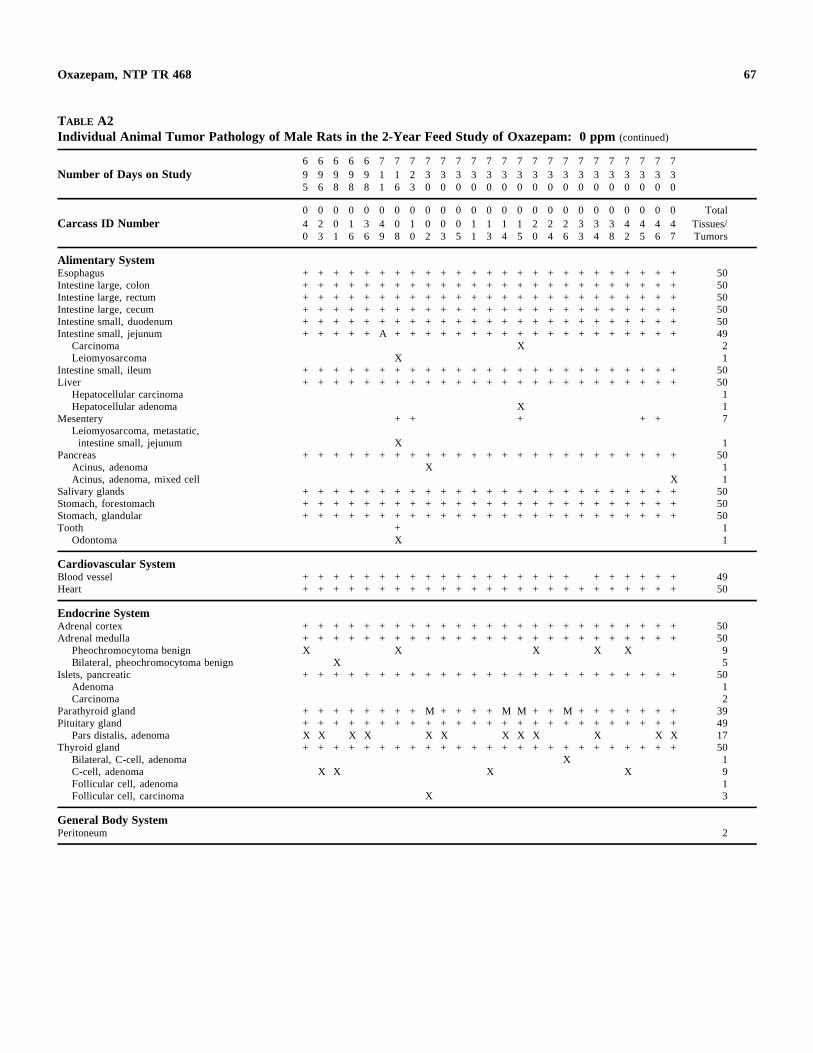
67 Oxazepam, NTP TR 468
TABLE A2 Individual Animal Tumor Pathology of Male Rats in the 2-Year Feed Study of Oxazepam: 0 ppm (continued)
6 6 6 6 6 7 7 7 7 7 7 7 7 7 7 7 7 7 7 7 7 7 7 7 7 Number of Days on Study 9 9 9 9 9 1 1 2 3 3 3 3 3 3 3 3 3 3 3 3 3 3 3 3 3
5 6 8 8 8 1 6 3 0 0 0 0 0 0 0 0 0 0 0 0 0 0 0 0 0
0 0 0 0 0 0 0 0 0 0 0 0 0 0 0 0 0 0 0 0 0 0 0 0 0 Total Carcass ID Number 4 2 0 1 3 4 0 1 0 0 0 1 1 1 1 2 2 2 3 3 3 4 4 4 4 Tissues/
0 3 1 6 6 9 8 0 2 3 5 1 3 4 5 0 4 6 3 4 8 2 5 6 7 Tumors
Alimentary System Esophagus + + + + + + + + + + + + + + + + + + + + + + + + + 50 Intestine large, colon + + + + + + + + + + + + + + + + + + + + + + + + + 50 Intestine large, rectum + + + + + + + + + + + + + + + + + + + + + + + + + 50 Intestine large, cecum + + + + + + + + + + + + + + + + + + + + + + + + + 50 Intestine small, duodenum + + + + + + + + + + + + + + + + + + + + + + + + + 50 Intestine small, jejunum + + + + + A + + + + + + + + + + + + + + + + + + + 49
Carcinoma X 2 Leiomyosarcoma X 1
Intestine small, ileum + + + + + + + + + + + + + + + + + + + + + + + + + 50 Liver + + + + + + + + + + + + + + + + + + + + + + + + + 50
Hepatocellular carcinoma 1 Hepatocellular adenoma X 1
Mesentery + + + + + 7 Leiomyosarcoma, metastatic, intestine small, jejunum X 1
Pancreas + + + + + + + + + + + + + + + + + + + + + + + + + 50 Acinus, adenoma X 1 Acinus, adenoma, mixed cell X 1
Salivary glands + + + + + + + + + + + + + + + + + + + + + + + + + 50 Stomach, forestomach + + + + + + + + + + + + + + + + + + + + + + + + + 50 Stomach, glandular + + + + + + + + + + + + + + + + + + + + + + + + + 50 Tooth + 1
Odontoma X 1
Cardiovascular System Blood vessel + + + + + + + + + + + + + + + + + + + + + + + + 49 Heart + + + + + + + + + + + + + + + + + + + + + + + + + 50
Endocrine System Adrenal cortex + + + + + + + + + + + + + + + + + + + + + + + + + 50 Adrenal medulla + + + + + + + + + + + + + + + + + + + + + + + + + 50
Pheochromocytoma benign X X X X X 9 Bilateral, pheochromocytoma benign X 5
Islets, pancreatic + + + + + + + + + + + + + + + + + + + + + + + + + 50 Adenoma 1 Carcinoma 2
Parathyroid gland + + + + + + + + M + + + + M M + + M + + + + + + + 39 Pituitary gland + + + + + + + + + + + + + + + + + + + + + + + + + 49
Pars distalis, adenoma X X X X X X X X X X X X 17 Thyroid gland + + + + + + + + + + + + + + + + + + + + + + + + + 50
Bilateral, C-cell, adenoma X 1 C-cell, adenoma X X X X 9 Follicular cell, adenoma 1 Follicular cell, carcinoma X 3
General Body System Peritoneum 2
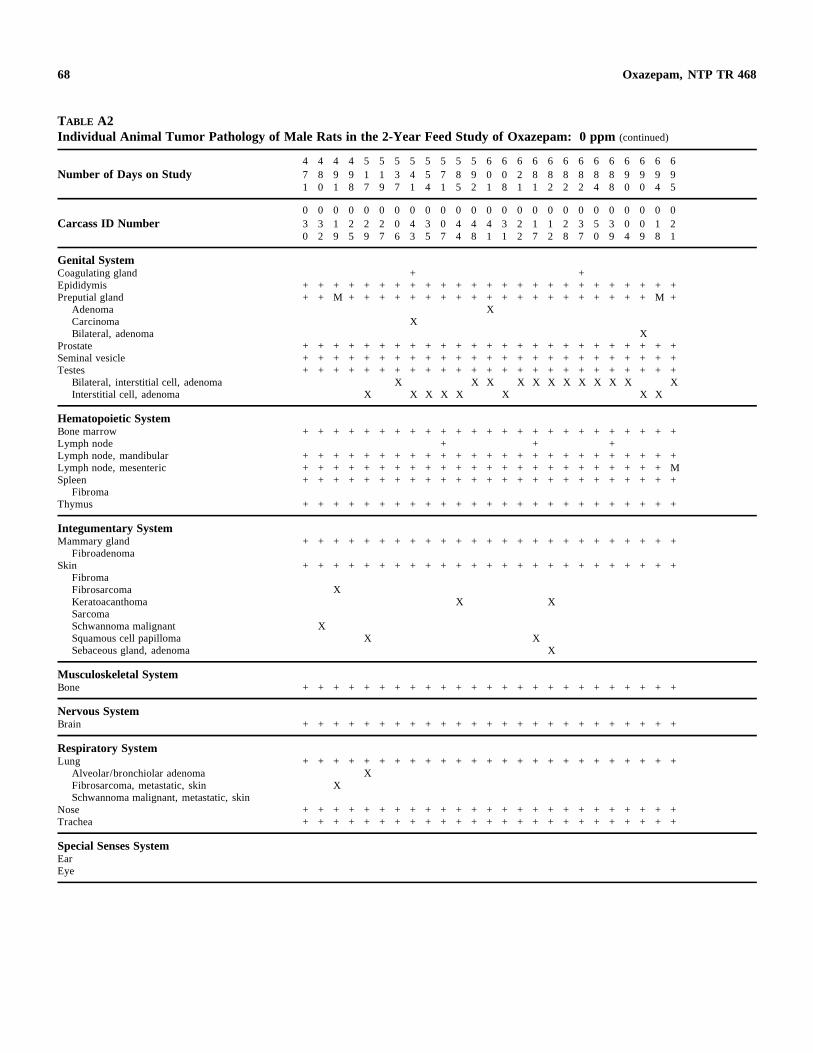
68 Oxazepam, NTP TR 468
TABLE A2 Individual Animal Tumor Pathology of Male Rats in the 2-Year Feed Study of Oxazepam: 0 ppm (continued)
4 4 4 4 5 5 5 5 5 5 5 5 6 6 6 6 6 6 6 6 6 6 6 6 6 Number of Days on Study 7 8 9 9 1 1 3 4 5 7 8 9 0 0 2 8 8 8 8 8 8 9 9 9 9
1 0 1 8 7 9 7 1 4 1 5 2 1 8 1 1 2 2 2 4 8 0 0 4 5
0 0 0 0 0 0 0 0 0 0 0 0 0 0 0 0 0 0 0 0 0 0 0 0 0 Carcass ID Number 3 3 1 2 2 2 0 4 3 0 4 4 4 3 2 1 1 2 3 5 3 0 0 1 2
0 2 9 5 9 7 6 3 5 7 4 8 1 1 2 7 2 8 7 0 9 4 9 8 1
Genital System Coagulating gland + + Epididymis + + + + + + + + + + + + + + + + + + + + + + + + + Preputial gland + + M + + + + + + + + + + + + + + + + + + + + M +
Adenoma X Carcinoma X Bilateral, adenoma X
Prostate + + + + + + + + + + + + + + + + + + + + + + + + + Seminal vesicle + + + + + + + + + + + + + + + + + + + + + + + + + Testes + + + + + + + + + + + + + + + + + + + + + + + + +
Bilateral, interstitial cell, adenoma X X X X X X X X X X X X Interstitial cell, adenoma X X X X X X X X
Hematopoietic System Bone marrow + + + + + + + + + + + + + + + + + + + + + + + + + Lymph node + + + Lymph node, mandibular + + + + + + + + + + + + + + + + + + + + + + + + + Lymph node, mesenteric + + + + + + + + + + + + + + + + + + + + + + + + M Spleen + + + + + + + + + + + + + + + + + + + + + + + + +
Fibroma Thymus + + + + + + + + + + + + + + + + + + + + + + + + +
Integumentary System Mammary gland + + + + + + + + + + + + + + + + + + + + + + + + +
Fibroadenoma Skin + + + + + + + + + + + + + + + + + + + + + + + + +
Fibroma Fibrosarcoma X Keratoacanthoma X X Sarcoma Schwannoma malignant X Squamous cell papilloma X X Sebaceous gland, adenoma X
Musculoskeletal System Bone + + + + + + + + + + + + + + + + + + + + + + + + +
Nervous System Brain + + + + + + + + + + + + + + + + + + + + + + + + +
Respiratory System Lung + + + + + + + + + + + + + + + + + + + + + + + + +
Alveolar/bronchiolar adenoma X Fibrosarcoma, metastatic, skin X Schwannoma malignant, metastatic, skin
Nose + + + + + + + + + + + + + + + + + + + + + + + + + Trachea + + + + + + + + + + + + + + + + + + + + + + + + +
Special Senses System Ear Eye
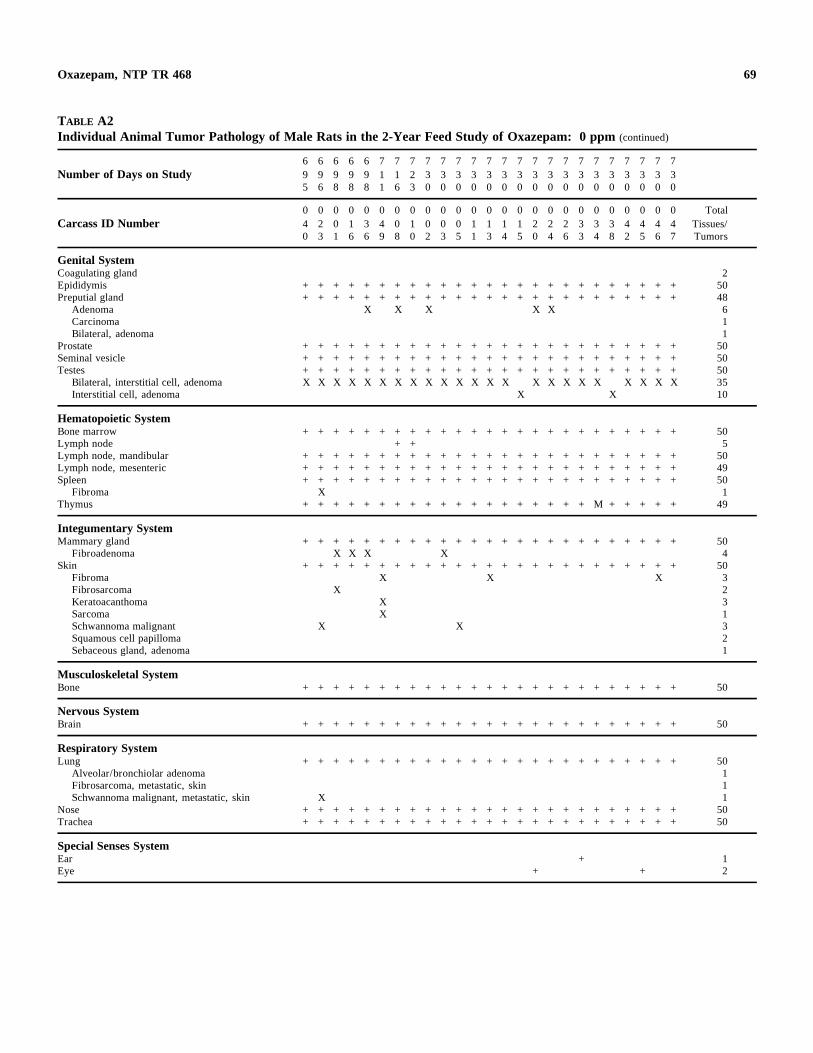
69 Oxazepam, NTP TR 468
TABLE A2 Individual Animal Tumor Pathology of Male Rats in the 2-Year Feed Study of Oxazepam: 0 ppm (continued)
6 6 6 6 6 7 7 7 7 7 7 7 7 7 7 7 7 7 7 7 7 7 7 7 7 Number of Days on Study 9
5 9 6
9 8
9 8
9 8
1 1
1 6
2 3
3 0
3 0
3 0
3 0
3 0
3 0
3 0
3 0
3 0
3 0
3 0
3 0
3 0
3 0
3 0
3 0
3 0
0 0 0 0 0 0 0 0 0 0 0 0 0 0 0 0 0 0 0 0 0 0 0 0 0 Total Carcass ID Number 4
0 2 3
0 1
1 6
3 6
4 9
0 8
1 0
0 2
0 3
0 5
1 1
1 3
1 4
1 5
2 0
2 4
2 6
3 3
3 4
3 8
4 2
4 5
4 6
4 7
Tissues/ Tumors
Genital System Coagulating glandEpididymis Preputial gland
Adenoma CarcinomaBilateral, adenoma
Prostate Seminal vesicle Testes
Bilateral, interstitial cell, adenoma Interstitial cell, adenoma
+ + + + + + + + + + + + + + + + + + + + + + + + + + + + + + + + + + + + + + + + + + + + + + + + + +
X X X X X
+ + + + + + + + + + + + + + + + + + + + + + + + + + + + + + + + + + + + + + + + + + + + + + + + + + + + + + + + + + + + + + + + + + + + + + + + + + + X X X X X X X X X X X X X X X X X X X X X X X
X X
2 50 48 6 1 1
50 50 50 35 10
Hematopoietic System Bone marrow Lymph node Lymph node, mandibular Lymph node, mesenteric Spleen
Fibroma Thymus
+ + + + + + + + + + + + + + + + + + + + + + + + + + +
+ + + + + + + + + + + + + + + + + + + + + + + + + + + + + + + + + + + + + + + + + + + + + + + + + + + + + + + + + + + + + + + + + + + + + + + + + + +
X+ + + + + + + + + + + + + + + + + + + M + + + + +
50 5
50 49 50 1
49
Integumentary System Mammary gland
Fibroadenoma Skin
Fibroma Fibrosarcoma Keratoacanthoma Sarcoma Schwannoma malignant Squamous cell papillomaSebaceous gland, adenoma
+ + + + + + + + + + + + + + + + + + + + + + + + + X X X X
+ + + + + + + + + + + + + + + + + + + + + + + + + X X X
XXX
X X
50 4
50 3 2 3 1 3 2 1
Musculoskeletal System Bone + + + + + + + + + + + + + + + + + + + + + + + + + 50
Nervous System Brain + + + + + + + + + + + + + + + + + + + + + + + + + 50
Respiratory System Lung
Alveolar/bronchiolar adenomaFibrosarcoma, metastatic, skinSchwannoma malignant, metastatic, skin
Nose Trachea
+ + + + + + + + + + + + + + + + + + + + + + + + +
X+ + + + + + + + + + + + + + + + + + + + + + + + + + + + + + + + + + + + + + + + + + + + + + + + + +
50 1 1 1
50 50
Special Senses System Ear Eye +
++
1 2
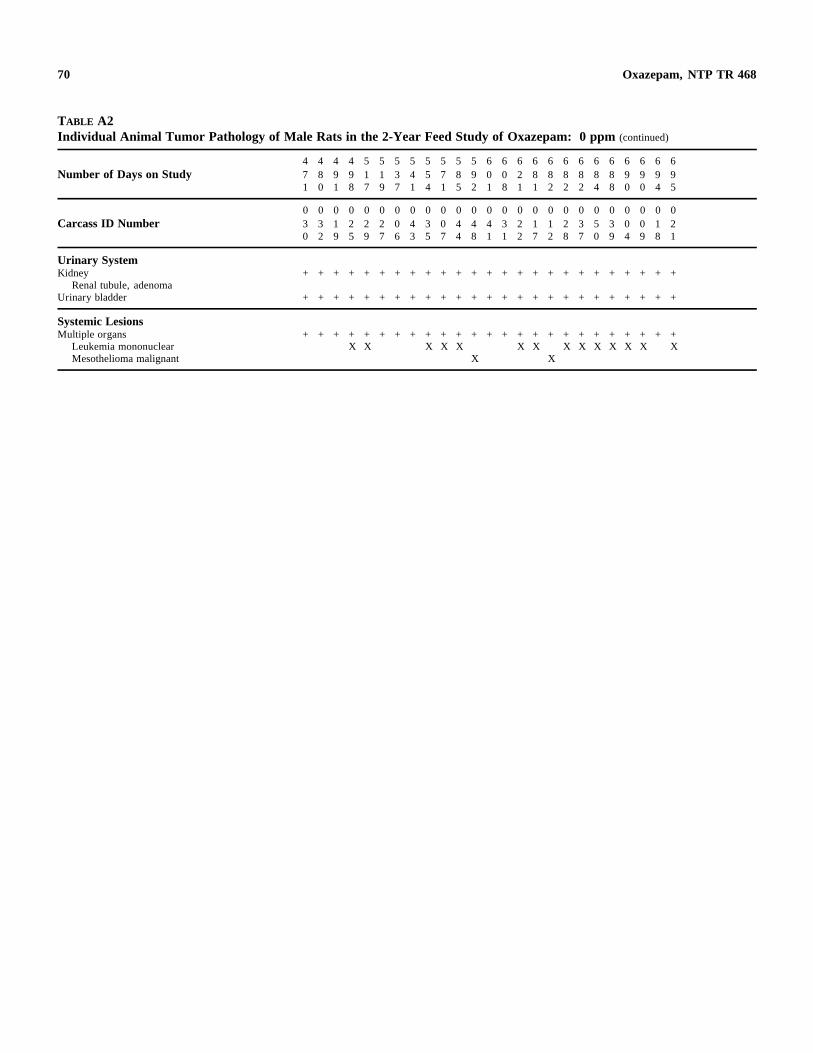
70 Oxazepam, NTP TR 468
TABLE A2 Individual Animal Tumor Pathology of Male Rats in the 2-Year Feed Study of Oxazepam: 0 ppm (continued)
4 4 4 4 5 5 5 5 5 5 5 5 6 6 6 6 6 6 6 6 6 6 6 6 6 Number of Days on Study 7 8 9 9 1 1 3 4 5 7 8 9 0 0 2 8 8 8 8 8 8 9 9 9 9
1 0 1 8 7 9 7 1 4 1 5 2 1 8 1 1 2 2 2 4 8 0 0 4 5
0 0 0 0 0 0 0 0 0 0 0 0 0 0 0 0 0 0 0 0 0 0 0 0 0 Carcass ID Number 3 3 1 2 2 2 0 4 3 0 4 4 4 3 2 1 1 2 3 5 3 0 0 1 2
0 2 9 5 9 7 6 3 5 7 4 8 1 1 2 7 2 8 7 0 9 4 9 8 1
Urinary System Kidney + + + + + + + + + + + + + + + + + + + + + + + + +
Renal tubule, adenoma Urinary bladder + + + + + + + + + + + + + + + + + + + + + + + + +
Systemic Lesions Multiple organs + + + + + + + + + + + + + + + + + + + + + + + + +
Leukemia mononuclear X X X X X X X X X X X X X X Mesothelioma malignant X X
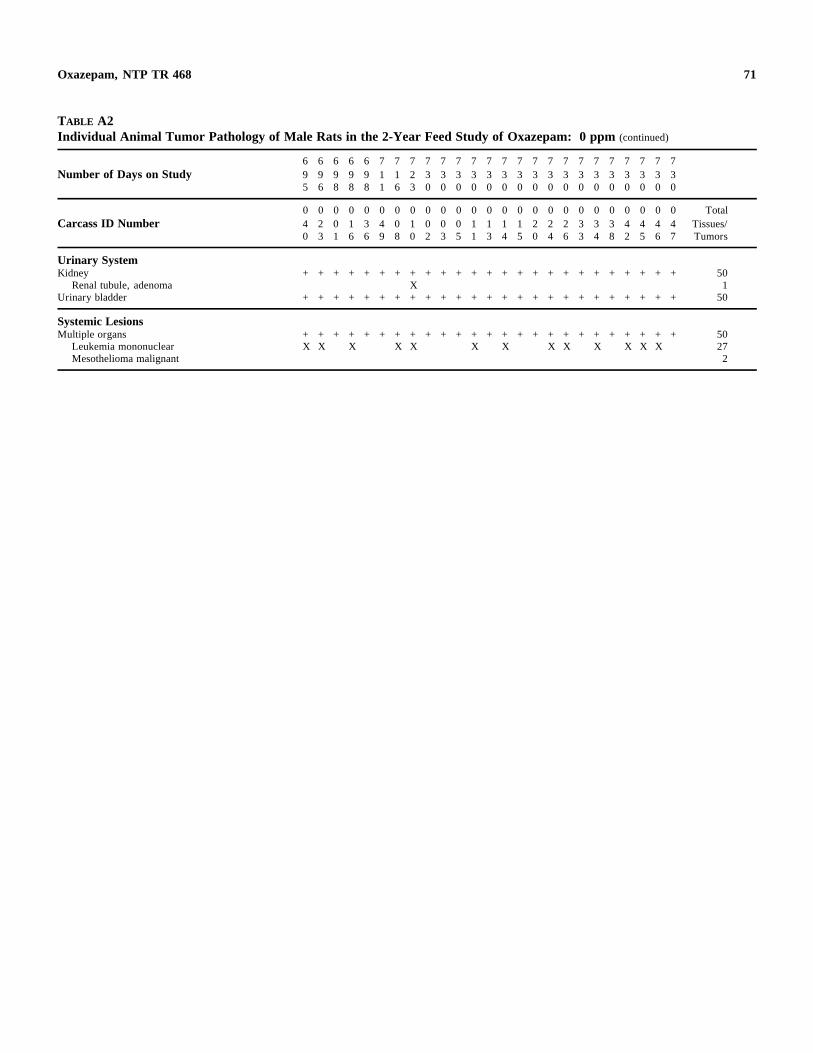
71 Oxazepam, NTP TR 468
TABLE A2 Individual Animal Tumor Pathology of Male Rats in the 2-Year Feed Study of Oxazepam: 0 ppm (continued)
6 6 6 6 6 7 7 7 7 7 7 7 7 7 7 7 7 7 7 7 7 7 7 7 7 Number of Days on Study 9 9 9 9 9 1 1 2 3 3 3 3 3 3 3 3 3 3 3 3 3 3 3 3 3
5 6 8 8 8 1 6 3 0 0 0 0 0 0 0 0 0 0 0 0 0 0 0 0 0
0 0 0 0 0 0 0 0 0 0 0 0 0 0 0 0 0 0 0 0 0 0 0 0 0 Total Carcass ID Number 4 2 0 1 3 4 0 1 0 0 0 1 1 1 1 2 2 2 3 3 3 4 4 4 4 Tissues/
0 3 1 6 6 9 8 0 2 3 5 1 3 4 5 0 4 6 3 4 8 2 5 6 7 Tumors
Urinary System Kidney + + + + + + + + + + + + + + + + + + + + + + + + + 50
Renal tubule, adenoma X 1 Urinary bladder + + + + + + + + + + + + + + + + + + + + + + + + + 50
Systemic Lesions Multiple organs + + + + + + + + + + + + + + + + + + + + + + + + + 50
Leukemia mononuclear X X X X X X X X X X X X X 27 Mesothelioma malignant 2
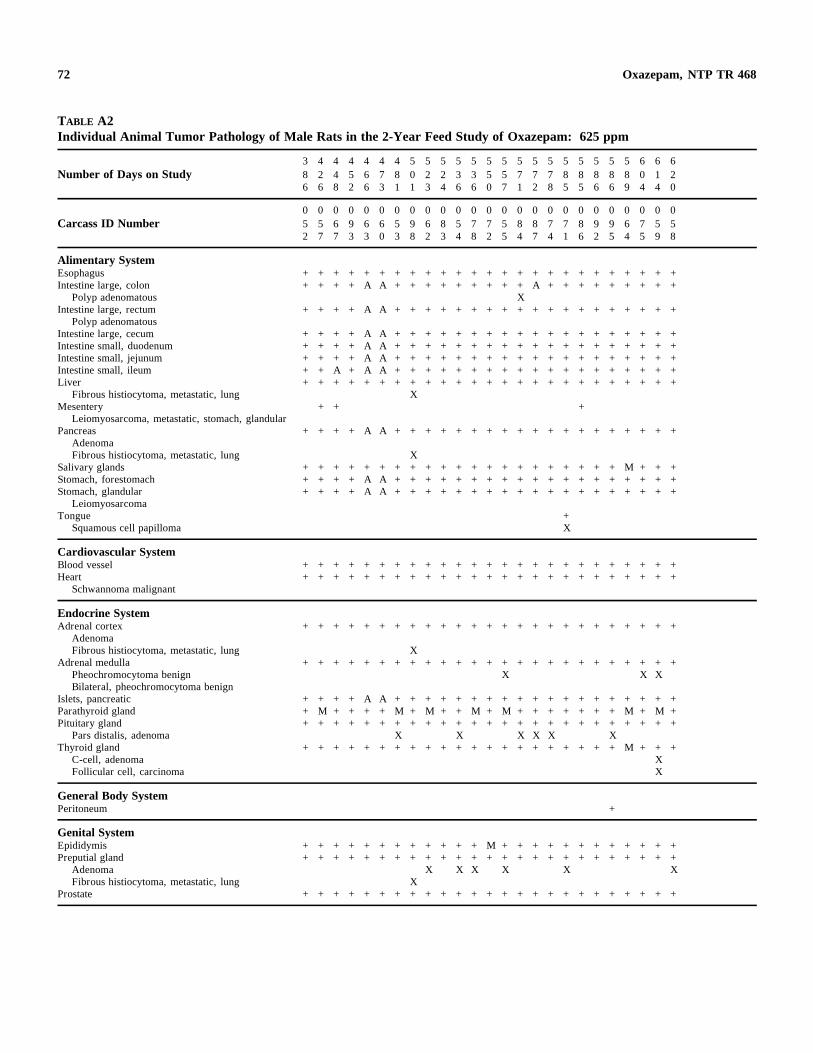
72 Oxazepam, NTP TR 468
TABLE A2 Individual Animal Tumor Pathology of Male Rats in the 2-Year Feed Study of Oxazepam: 625 ppm
3 4 4 4 4 4 4 5 5 5 5 5 5 5 5 5 5 5 5 5 5 5 6 6 6 Number of Days on Study 8 2 4 5 6 7 8 0 2 2 3 3 5 5 7 7 7 8 8 8 8 8 0 1 2
6 6 8 2 6 3 1 1 3 4 6 6 0 7 1 2 8 5 5 6 6 9 4 4 0
0 0 0 0 0 0 0 0 0 0 0 0 0 0 0 0 0 0 0 0 0 0 0 0 0 Carcass ID Number 5 5 6 9 6 6 5 9 6 8 5 7 7 5 8 8 7 7 8 9 9 6 7 5 5
2 7 7 3 3 0 3 8 2 3 4 8 2 5 4 7 4 1 6 2 5 4 5 9 8
Alimentary System Esophagus + + + + + + + + + + + + + + + + + + + + + + + + + Intestine large, colon + + + + A A + + + + + + + + + A + + + + + + + + +
Polyp adenomatous X Intestine large, rectum + + + + A A + + + + + + + + + + + + + + + + + + +
Polyp adenomatous Intestine large, cecum + + + + A A + + + + + + + + + + + + + + + + + + + Intestine small, duodenum + + + + A A + + + + + + + + + + + + + + + + + + + Intestine small, jejunum + + + + A A + + + + + + + + + + + + + + + + + + + Intestine small, ileum + + A + A A + + + + + + + + + + + + + + + + + + + Liver + + + + + + + + + + + + + + + + + + + + + + + + +
Fibrous histiocytoma, metastatic, lung X Mesentery + + +
Leiomyosarcoma, metastatic, stomach, glandular Pancreas + + + + A A + + + + + + + + + + + + + + + + + + +
Adenoma Fibrous histiocytoma, metastatic, lung X
Salivary glands + + + + + + + + + + + + + + + + + + + + + M + + + Stomach, forestomach + + + + A A + + + + + + + + + + + + + + + + + + + Stomach, glandular + + + + A A + + + + + + + + + + + + + + + + + + +
Leiomyosarcoma Tongue +
Squamous cell papilloma X
Cardiovascular System Blood vessel + + + + + + + + + + + + + + + + + + + + + + + + + Heart + + + + + + + + + + + + + + + + + + + + + + + + +
Schwannoma malignant
Endocrine System Adrenal cortex + + + + + + + + + + + + + + + + + + + + + + + + +
Adenoma Fibrous histiocytoma, metastatic, lung X
Adrenal medulla + + + + + + + + + + + + + + + + + + + + + + + + + Pheochromocytoma benign X X X Bilateral, pheochromocytoma benign
Islets, pancreatic + + + + A A + + + + + + + + + + + + + + + + + + + Parathyroid gland + M + + + + M + M + + M + M + + + + + + + M + M + Pituitary gland + + + + + + + + + + + + + + + + + + + + + + + + +
Pars distalis, adenoma X X X X X X Thyroid gland + + + + + + + + + + + + + + + + + + + + + M + + +
C-cell, adenoma X Follicular cell, carcinoma X
General Body System Peritoneum +
Genital System Epididymis + + + + + + + + + + + + M + + + + + + + + + + + + Preputial gland + + + + + + + + + + + + + + + + + + + + + + + + +
Adenoma X X X X X X Fibrous histiocytoma, metastatic, lung X
Prostate + + + + + + + + + + + + + + + + + + + + + + + + +
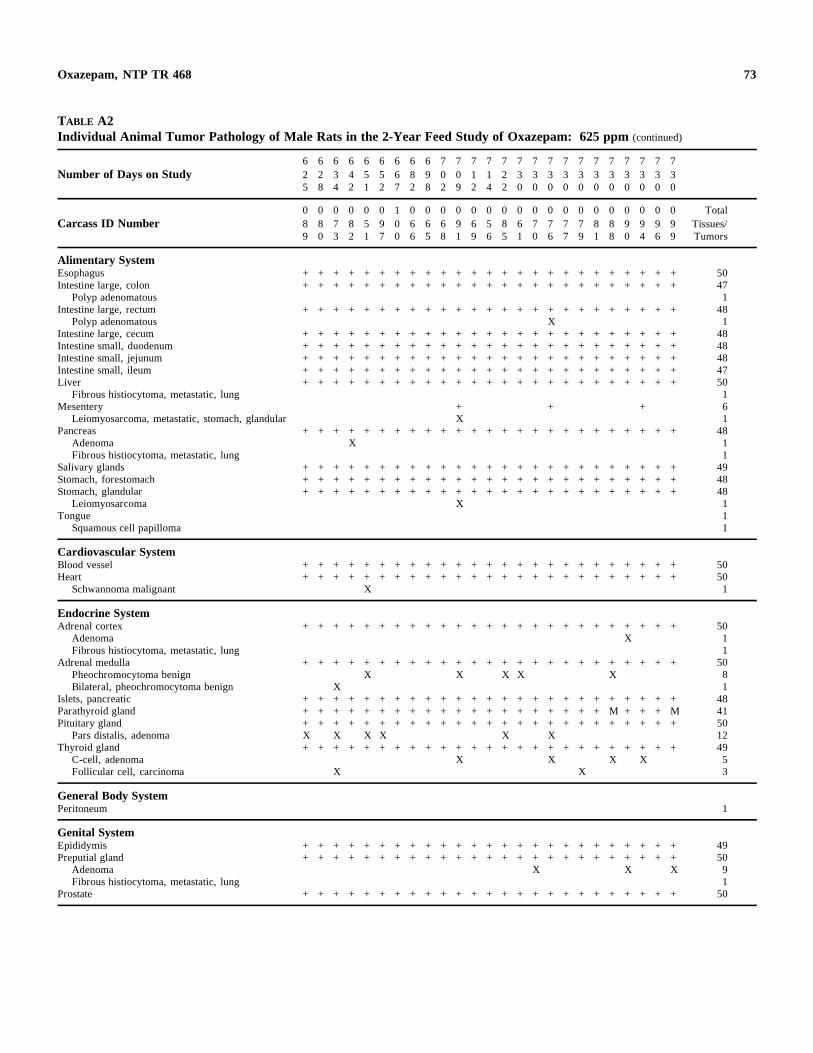
73 Oxazepam, NTP TR 468
TABLE A2 Individual Animal Tumor Pathology of Male Rats in the 2-Year Feed Study of Oxazepam: 625 ppm (continued)
6 6 6 6 6 6 6 6 6 7 7 7 7 7 7 7 7 7 7 7 7 7 7 7 7 Number of Days on Study 2 2 3 4 5 5 6 8 9 0 0 1 1 2 3 3 3 3 3 3 3 3 3 3 3
5 8 4 2 1 2 7 2 8 2 9 2 4 2 0 0 0 0 0 0 0 0 0 0 0
0 0 0 0 0 0 1 0 0 0 0 0 0 0 0 0 0 0 0 0 0 0 0 0 0 Total Carcass ID Number 8 8 7 8 5 9 0 6 6 6 9 6 5 8 6 7 7 7 7 8 8 9 9 9 9 Tissues/
9 0 3 2 1 7 0 6 5 8 1 9 6 5 1 0 6 7 9 1 8 0 4 6 9 Tumors
Alimentary System Esophagus + + + + + + + + + + + + + + + + + + + + + + + + + 50 Intestine large, colon + + + + + + + + + + + + + + + + + + + + + + + + + 47
Polyp adenomatous 1 Intestine large, rectum + + + + + + + + + + + + + + + + + + + + + + + + + 48
Polyp adenomatous X 1 Intestine large, cecum + + + + + + + + + + + + + + + + + + + + + + + + + 48 Intestine small, duodenum + + + + + + + + + + + + + + + + + + + + + + + + + 48 Intestine small, jejunum + + + + + + + + + + + + + + + + + + + + + + + + + 48 Intestine small, ileum + + + + + + + + + + + + + + + + + + + + + + + + + 47 Liver + + + + + + + + + + + + + + + + + + + + + + + + + 50
Fibrous histiocytoma, metastatic, lung 1 Mesentery + + + 6
Leiomyosarcoma, metastatic, stomach, glandular X 1 Pancreas + + + + + + + + + + + + + + + + + + + + + + + + + 48
Adenoma X 1 Fibrous histiocytoma, metastatic, lung 1
Salivary glands + + + + + + + + + + + + + + + + + + + + + + + + + 49 Stomach, forestomach + + + + + + + + + + + + + + + + + + + + + + + + + 48 Stomach, glandular + + + + + + + + + + + + + + + + + + + + + + + + + 48
Leiomyosarcoma X 1 Tongue 1
Squamous cell papilloma 1
Cardiovascular System Blood vessel + + + + + + + + + + + + + + + + + + + + + + + + + 50 Heart + + + + + + + + + + + + + + + + + + + + + + + + + 50
Schwannoma malignant X 1
Endocrine System Adrenal cortex + + + + + + + + + + + + + + + + + + + + + + + + + 50
Adenoma X 1 Fibrous histiocytoma, metastatic, lung 1
Adrenal medulla + + + + + + + + + + + + + + + + + + + + + + + + + 50 Pheochromocytoma benign X X X X X 8 Bilateral, pheochromocytoma benign X 1
Islets, pancreatic + + + + + + + + + + + + + + + + + + + + + + + + + 48 Parathyroid gland + + + + + + + + + + + + + + + + + + + + M + + + M 41 Pituitary gland + + + + + + + + + + + + + + + + + + + + + + + + + 50
Pars distalis, adenoma X X X X X X 12 Thyroid gland + + + + + + + + + + + + + + + + + + + + + + + + + 49
C-cell, adenoma X X X X 5 Follicular cell, carcinoma X X 3
General Body System Peritoneum 1
Genital System Epididymis + + + + + + + + + + + + + + + + + + + + + + + + + 49 Preputial gland + + + + + + + + + + + + + + + + + + + + + + + + + 50
Adenoma X X X 9 Fibrous histiocytoma, metastatic, lung 1
Prostate + + + + + + + + + + + + + + + + + + + + + + + + + 50
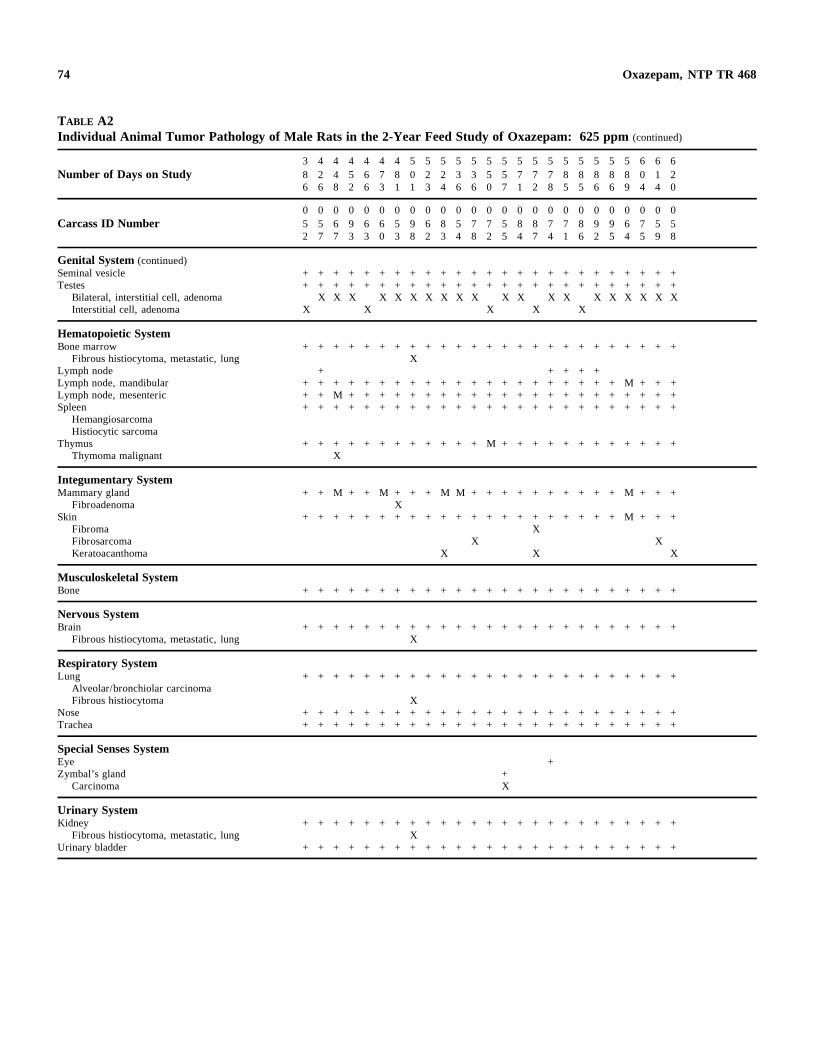
74 Oxazepam, NTP TR 468
TABLE A2 Individual Animal Tumor Pathology of Male Rats in the 2-Year Feed Study of Oxazepam: 625 ppm (continued)
3 4 4 4 4 4 4 5 5 5 5 5 5 5 5 5 5 5 5 5 5 5 6 6 6 Number of Days on Study 8
6 2 6
4 8
5 2
6 6
7 3
8 1
0 1
2 3
2 4
3 6
3 6
5 0
5 7
7 1
7 2
7 8
8 5
8 5
8 6
8 6
8 9
0 4
1 4
2 0
0 0 0 0 0 0 0 0 0 0 0 0 0 0 0 0 0 0 0 0 0 0 0 0 0 Carcass ID Number 5
2 5 7
6 7
9 3
6 3
6 0
5 3
9 8
6 2
8 3
5 4
7 8
7 2
5 5
8 4
8 7
7 4
7 1
8 6
9 2
9 5
6 4
7 5
5 9
5 8
Genital System (continued) Seminal vesicle Testes
Bilateral, interstitial cell, adenoma Interstitial cell, adenoma
+ + + + + + + + + + + + + + + + + + + + + + + + + + + + + + + + + + + + + + + + + + + + + + + + + +
X X X X X X X X X X X X X X X X X X X X X X X X X
Hematopoietic System Bone marrow
Fibrous histiocytoma, metastatic, lung Lymph node Lymph node, mandibular Lymph node, mesenteric Spleen
Hemangiosarcoma Histiocytic sarcoma
Thymus Thymoma malignant
+ + + + + + + + + + + + + + + + + + + + + + + + + X
+ + + + + + + + + + + + + + + + + + + + + + + + + + M + + + + + M + + + + + + + + + + + + + + + + + + + + + + + + + + + + + + + + + + + + + + + + + + + + + + +
+ + + + + + + + + + + + M + + + + + + + + + + + + X
Integumentary System Mammary gland
Fibroadenoma Skin
Fibroma Fibrosarcoma Keratoacanthoma
+ + M + + M + + + M M + + + + + + + + + + M + + + X
+ + + + + + + + + + + + + + + + + + + + + M + + + X
X X X X X
Musculoskeletal System Bone + + + + + + + + + + + + + + + + + + + + + + + + +
Nervous System Brain
Fibrous histiocytoma, metastatic, lung + + + + + + + + + + + + + + + + + + + + + + + + +
X
Respiratory System Lung
Alveolar/bronchiolar carcinoma Fibrous histiocytoma
Nose Trachea
+ + + + + + + + + + + + + + + + + + + + + + + + +
X + + + + + + + + + + + + + + + + + + + + + + + + + + + + + + + + + + + + + + + + + + + + + + + + + +
Special Senses System Eye Zymbal’s gland
Carcinoma + X
+
Urinary System Kidney
Fibrous histiocytoma, metastatic, lung Urinary bladder
+ + + + + + + + + + + + + + + + + + + + + + + + + X
+ + + + + + + + + + + + + + + + + + + + + + + + +

75 Oxazepam, NTP TR 468
TABLE A2 Individual Animal Tumor Pathology of Male Rats in the 2-Year Feed Study of Oxazepam: 625 ppm (continued)
6 6 6 6 6 6 6 6 6 7 7 7 7 7 7 7 7 7 7 7 7 7 7 7 7 Number of Days on Study 2 2 3 4 5 5 6 8 9 0 0 1 1 2 3 3 3 3 3 3 3 3 3 3 3
5 8 4 2 1 2 7 2 8 2 9 2 4 2 0 0 0 0 0 0 0 0 0 0 0
0 0 0 0 0 0 1 0 0 0 0 0 0 0 0 0 0 0 0 0 0 0 0 0 0 Total Carcass ID Number 8 8 7 8 5 9 0 6 6 6 9 6 5 8 6 7 7 7 7 8 8 9 9 9 9 Tissues/
9 0 3 2 1 7 0 6 5 8 1 9 6 5 1 0 6 7 9 1 8 0 4 6 9 Tumors
Genital System (continued) Seminal vesicle + + + + + + + + + + + + + + + + + + + + + + + + + 50 Testes + + + + + + + + + + + + + + + + + + + + + + + + + 50
Bilateral, interstitial cell, adenoma X X X X X X X X X X X X X X X X X X X X X X 42 Interstitial cell, adenoma X 6
Hematopoietic System Bone marrow + + + + + + + + + + + + + + + + + + + + + + + + + 50
Fibrous histiocytoma, metastatic, lung 1 Lymph node + + + 8 Lymph node, mandibular + + + + + + + + + + + + + + + + + + + + + + + + + 49 Lymph node, mesenteric + + + + + + + + + + + + + + + + + + + + + + + + + 49 Spleen + + + + + + + + + + + + + + + + + + + + + + + + + 50
Hemangiosarcoma X 1 Histiocytic sarcoma X 1
Thymus + + + + + + + + + + M + + + + + + + + + + + + M + 47 Thymoma malignant 1
Integumentary System Mammary gland + + + + + + + + + + + + + + + + + + M + + + + + + 44
Fibroadenoma X X X X 5 Skin + + + + + + + + + + + + + + + + + + + + + + + + + 49
Fibroma 1 Fibrosarcoma X 3 Keratoacanthoma X X 5
Musculoskeletal System Bone + + + + + + + + + + + + + + + + + + + + + + + + +
Nervous System Brain + + + + + + + + + + + + + + + + + + + + + + + + + 50
Fibrous histiocytoma, metastatic, lung 1
Respiratory System Lung + + + + + + + + + + + + + + + + + + + + + + + + + 50
Alveolar/bronchiolar carcinoma X 1 Fibrous histiocytoma 1
Nose + + + + + + + + + + + + + + + + + + + + + + + + + 50 Trachea + + + + + + + + + + + + + + + + + + + + + + + + + 50
Special Senses System Eye + + 3 Zymbal’s gland 1
Carcinoma 1
Urinary System Kidney + + + + + + + + + + + + + + + + + + + + + + + + + 50
Fibrous histiocytoma, metastatic, lung 1 Urinary bladder + + + + + + + + + + + + + + + + + + + + + + + + + 50
50
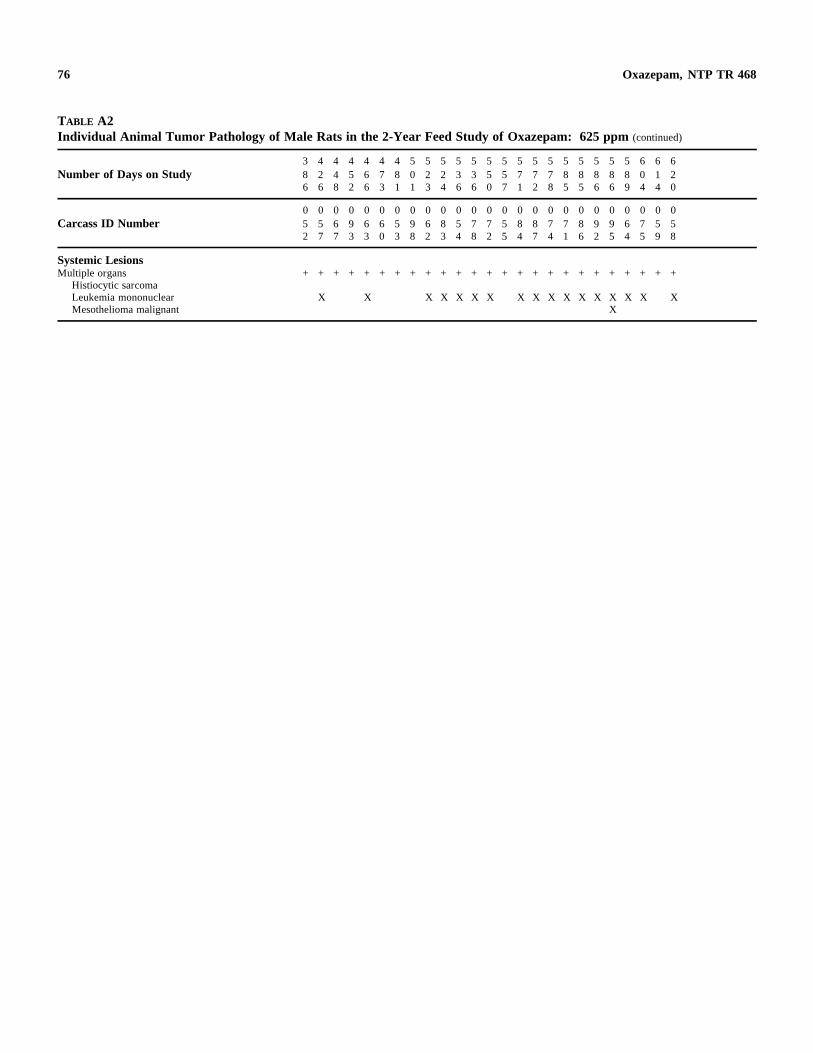
76 Oxazepam, NTP TR 468
TABLE A2 Individual Animal Tumor Pathology of Male Rats in the 2-Year Feed Study of Oxazepam: 625 ppm (continued)
3 4 4 4 4 4 4 5 5 5 5 5 5 5 5 5 5 5 5 5 5 5 6 6 6 Number of Days on Study 8 2 4 5 6 7 8 0 2 2 3 3 5 5 7 7 7 8 8 8 8 8 0 1 2
6 6 8 2 6 3 1 1 3 4 6 6 0 7 1 2 8 5 5 6 6 9 4 4 0
0 0 0 0 0 0 0 0 0 0 0 0 0 0 0 0 0 0 0 0 0 0 0 0 0 Carcass ID Number 5 5 6 9 6 6 5 9 6 8 5 7 7 5 8 8 7 7 8 9 9 6 7 5 5
2 7 7 3 3 0 3 8 2 3 4 8 2 5 4 7 4 1 6 2 5 4 5 9 8
Systemic Lesions Multiple organs + + + + + + + + + + + + + + + + + + + + + + + + +
Histiocytic sarcoma Leukemia mononuclear X X X X X X X X X X X X X X X X X Mesothelioma malignant X
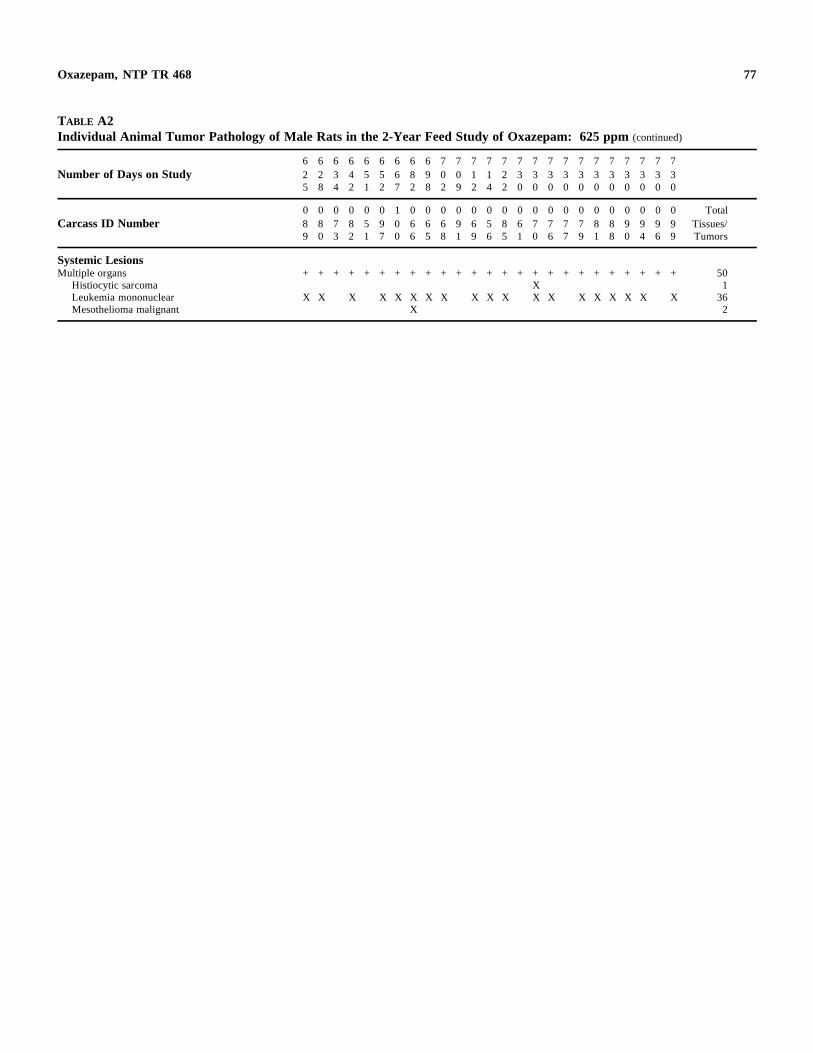
77 Oxazepam, NTP TR 468
TABLE A2 Individual Animal Tumor Pathology of Male Rats in the 2-Year Feed Study of Oxazepam: 625 ppm (continued)
6 6 6 6 6 6 6 6 6 7 7 7 7 7 7 7 7 7 7 7 7 7 7 7 7 Number of Days on Study 2 2 3 4 5 5 6 8 9 0 0 1 1 2 3 3 3 3 3 3 3 3 3 3 3
5 8 4 2 1 2 7 2 8 2 9 2 4 2 0 0 0 0 0 0 0 0 0 0 0
0 0 0 0 0 0 1 0 0 0 0 0 0 0 0 0 0 0 0 0 0 0 0 0 0 Total Carcass ID Number 8 8 7 8 5 9 0 6 6 6 9 6 5 8 6 7 7 7 7 8 8 9 9 9 9 Tissues/
9 0 3 2 1 7 0 6 5 8 1 9 6 5 1 0 6 7 9 1 8 0 4 6 9 Tumors
Systemic Lesions Multiple organs + + + + + + + + + + + + + + + + + + + + + + + + + 50
Histiocytic sarcoma X 1 Leukemia mononuclear X X X X X X X X X X X X X X X X X X X 36 Mesothelioma malignant X 2
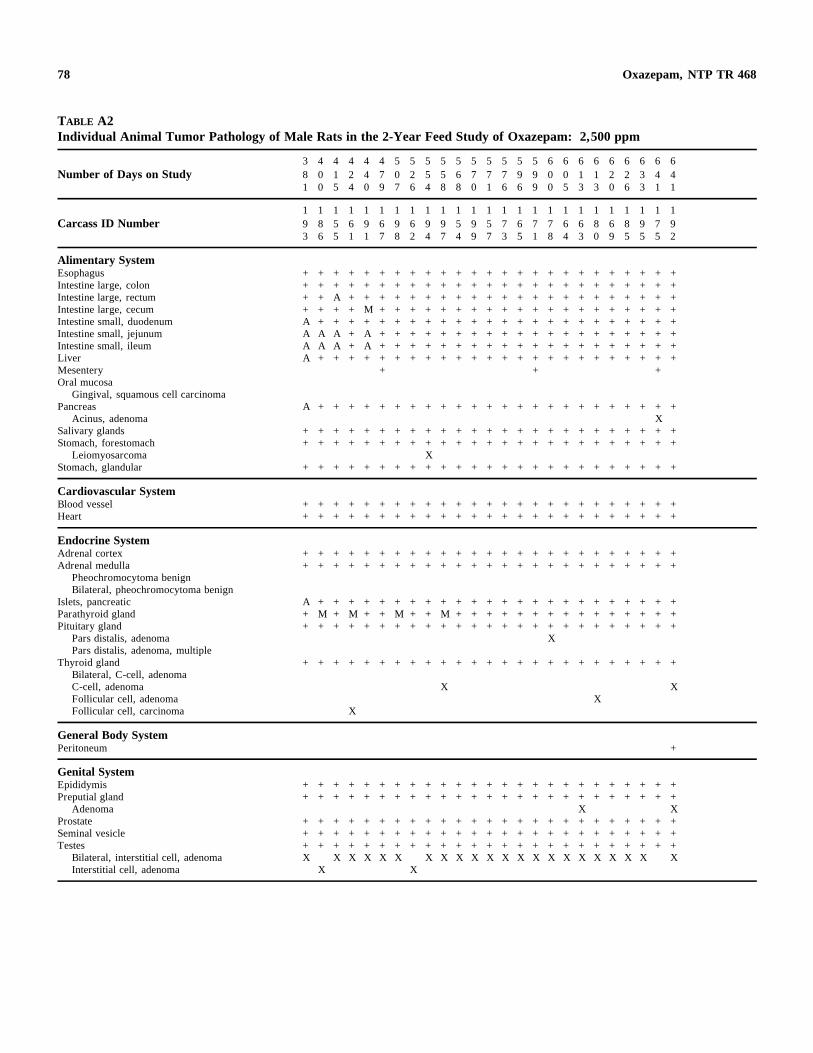
78 Oxazepam, NTP TR 468
TABLE A2 Individual Animal Tumor Pathology of Male Rats in the 2-Year Feed Study of Oxazepam: 2,500 ppm
3 4 4 4 4 4 5 5 5 5 5 5 5 5 5 5 6 6 6 6 6 6 6 6 6 Number of Days on Study 8 0 1 2 4 7 0 2 5 5 6 7 7 7 9 9 0 0 1 1 2 2 3 4 4
1 0 5 4 0 9 7 6 4 8 8 0 1 6 6 9 0 5 3 3 0 6 3 1 1
1 1 1 1 1 1 1 1 1 1 1 1 1 1 1 1 1 1 1 1 1 1 1 1 1 Carcass ID Number 9 8 5 6 9 6 9 6 9 9 5 9 5 7 6 7 7 6 6 8 6 8 9 7 9
3 6 5 1 1 7 8 2 4 7 4 9 7 3 5 1 8 4 3 0 9 5 5 5 2
Alimentary System Esophagus + + + + + + + + + + + + + + + + + + + + + + + + + Intestine large, colon + + + + + + + + + + + + + + + + + + + + + + + + + Intestine large, rectum + + A + + + + + + + + + + + + + + + + + + + + + + Intestine large, cecum + + + + M + + + + + + + + + + + + + + + + + + + + Intestine small, duodenum A + + + + + + + + + + + + + + + + + + + + + + + + Intestine small, jejunum A A A + A + + + + + + + + + + + + + + + + + + + + Intestine small, ileum A A A + A + + + + + + + + + + + + + + + + + + + + Liver A + + + + + + + + + + + + + + + + + + + + + + + + Mesentery + + + Oral mucosa
Gingival, squamous cell carcinoma Pancreas A + + + + + + + + + + + + + + + + + + + + + + + +
Acinus, adenoma X Salivary glands + + + + + + + + + + + + + + + + + + + + + + + + + Stomach, forestomach + + + + + + + + + + + + + + + + + + + + + + + + +
Leiomyosarcoma X Stomach, glandular + + + + + + + + + + + + + + + + + + + + + + + + +
Cardiovascular System Blood vessel + + + + + + + + + + + + + + + + + + + + + + + + + Heart + + + + + + + + + + + + + + + + + + + + + + + + +
Endocrine System Adrenal cortex + + + + + + + + + + + + + + + + + + + + + + + + + Adrenal medulla + + + + + + + + + + + + + + + + + + + + + + + + +
Pheochromocytoma benign Bilateral, pheochromocytoma benign
Islets, pancreatic A + + + + + + + + + + + + + + + + + + + + + + + + Parathyroid gland + M + M + + M + + M + + + + + + + + + + + + + + + Pituitary gland + + + + + + + + + + + + + + + + + + + + + + + + +
Pars distalis, adenoma X Pars distalis, adenoma, multiple
Thyroid gland + + + + + + + + + + + + + + + + + + + + + + + + + Bilateral, C-cell, adenoma C-cell, adenoma X X Follicular cell, adenoma X Follicular cell, carcinoma X
General Body System Peritoneum +
Genital System Epididymis + + + + + + + + + + + + + + + + + + + + + + + + + Preputial gland + + + + + + + + + + + + + + + + + + + + + + + + +
Adenoma X X Prostate + + + + + + + + + + + + + + + + + + + + + + + + + Seminal vesicle + + + + + + + + + + + + + + + + + + + + + + + + + Testes + + + + + + + + + + + + + + + + + + + + + + + + +
Bilateral, interstitial cell, adenoma X X X X X X X X X X X X X X X X X X X X X X Interstitial cell, adenoma X X
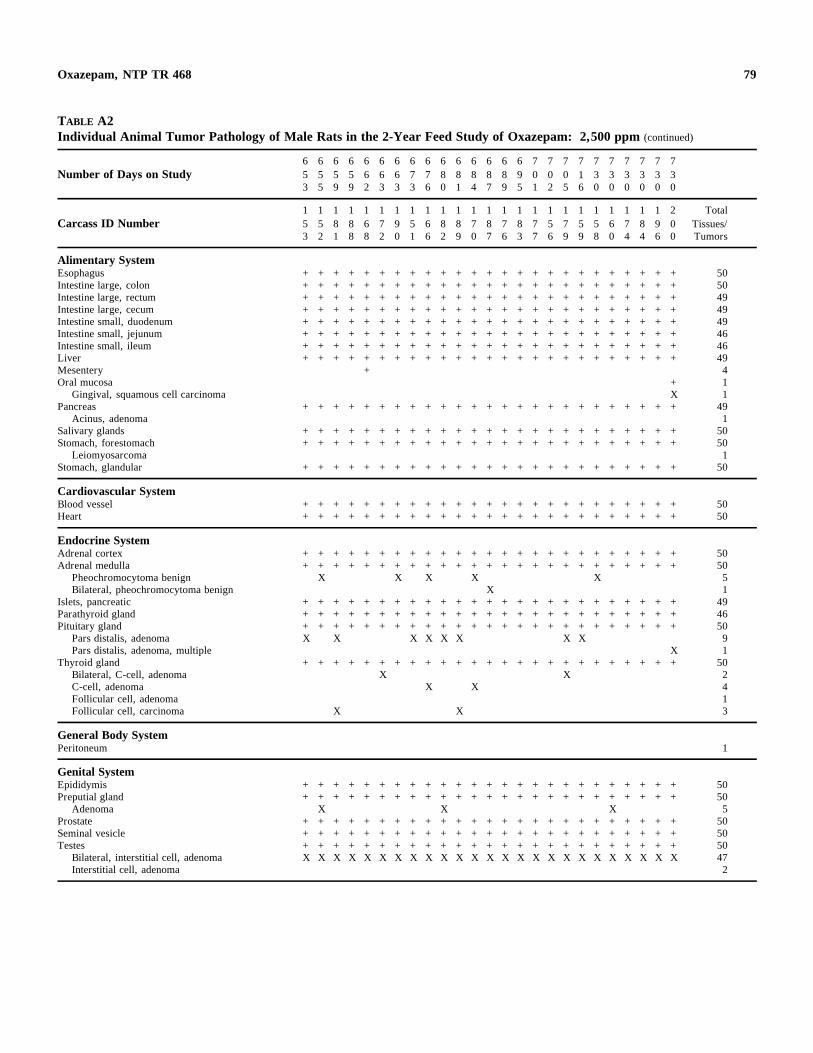
79 Oxazepam, NTP TR 468
TABLE A2 Individual Animal Tumor Pathology of Male Rats in the 2-Year Feed Study of Oxazepam: 2,500 ppm (continued)
6 6 6 6 6 6 6 6 6 6 6 6 6 6 6 7 7 7 7 7 7 7 7 7 7 Number of Days on Study 5 5 5 5 6 6 6 7 7 8 8 8 8 8 9 0 0 0 1 3 3 3 3 3 3
3 5 9 9 2 3 3 3 6 0 1 4 7 9 5 1 2 5 6 0 0 0 0 0 0
1 1 1 1 1 1 1 1 1 1 1 1 1 1 1 1 1 1 1 1 1 1 1 1 2 Total Carcass ID Number 5 5 8 8 6 7 9 5 6 8 8 7 8 7 8 7 5 7 5 5 6 7 8 9 0 Tissues/
3 2 1 8 8 2 0 1 6 2 9 0 7 6 3 7 6 9 9 8 0 4 4 6 0 Tumors
Alimentary System Esophagus + + + + + + + + + + + + + + + + + + + + + + + + + 50 Intestine large, colon + + + + + + + + + + + + + + + + + + + + + + + + + 50 Intestine large, rectum + + + + + + + + + + + + + + + + + + + + + + + + + 49 Intestine large, cecum + + + + + + + + + + + + + + + + + + + + + + + + + 49 Intestine small, duodenum + + + + + + + + + + + + + + + + + + + + + + + + + 49 Intestine small, jejunum + + + + + + + + + + + + + + + + + + + + + + + + + 46 Intestine small, ileum + + + + + + + + + + + + + + + + + + + + + + + + + 46 Liver + + + + + + + + + + + + + + + + + + + + + + + + + 49 Mesentery + 4 Oral mucosa + 1
Gingival, squamous cell carcinoma X 1 Pancreas + + + + + + + + + + + + + + + + + + + + + + + + + 49
Acinus, adenoma 1 Salivary glands + + + + + + + + + + + + + + + + + + + + + + + + + 50 Stomach, forestomach + + + + + + + + + + + + + + + + + + + + + + + + + 50
Leiomyosarcoma 1 Stomach, glandular + + + + + + + + + + + + + + + + + + + + + + + + + 50
Cardiovascular System Blood vessel + + + + + + + + + + + + + + + + + + + + + + + + + 50 Heart + + + + + + + + + + + + + + + + + + + + + + + + + 50
Endocrine System Adrenal cortex + + + + + + + + + + + + + + + + + + + + + + + + + 50 Adrenal medulla + + + + + + + + + + + + + + + + + + + + + + + + + 50
Pheochromocytoma benign X X X X X 5 Bilateral, pheochromocytoma benign X 1
Islets, pancreatic + + + + + + + + + + + + + + + + + + + + + + + + + 49 Parathyroid gland + + + + + + + + + + + + + + + + + + + + + + + + + 46 Pituitary gland + + + + + + + + + + + + + + + + + + + + + + + + + 50
Pars distalis, adenoma X X X X X X X X 9 Pars distalis, adenoma, multiple X 1
Thyroid gland + + + + + + + + + + + + + + + + + + + + + + + + + 50 Bilateral, C-cell, adenoma X X 2 C-cell, adenoma X X 4 Follicular cell, adenoma 1 Follicular cell, carcinoma X X 3
General Body System Peritoneum 1
Genital System Epididymis + + + + + + + + + + + + + + + + + + + + + + + + + 50 Preputial gland + + + + + + + + + + + + + + + + + + + + + + + + + 50
Adenoma X X X 5 Prostate + + + + + + + + + + + + + + + + + + + + + + + + + 50 Seminal vesicle + + + + + + + + + + + + + + + + + + + + + + + + + 50 Testes + + + + + + + + + + + + + + + + + + + + + + + + + 50
Bilateral, interstitial cell, adenoma X X X X X X X X X X X X X X X X X X X X X X X X X 47 Interstitial cell, adenoma 2
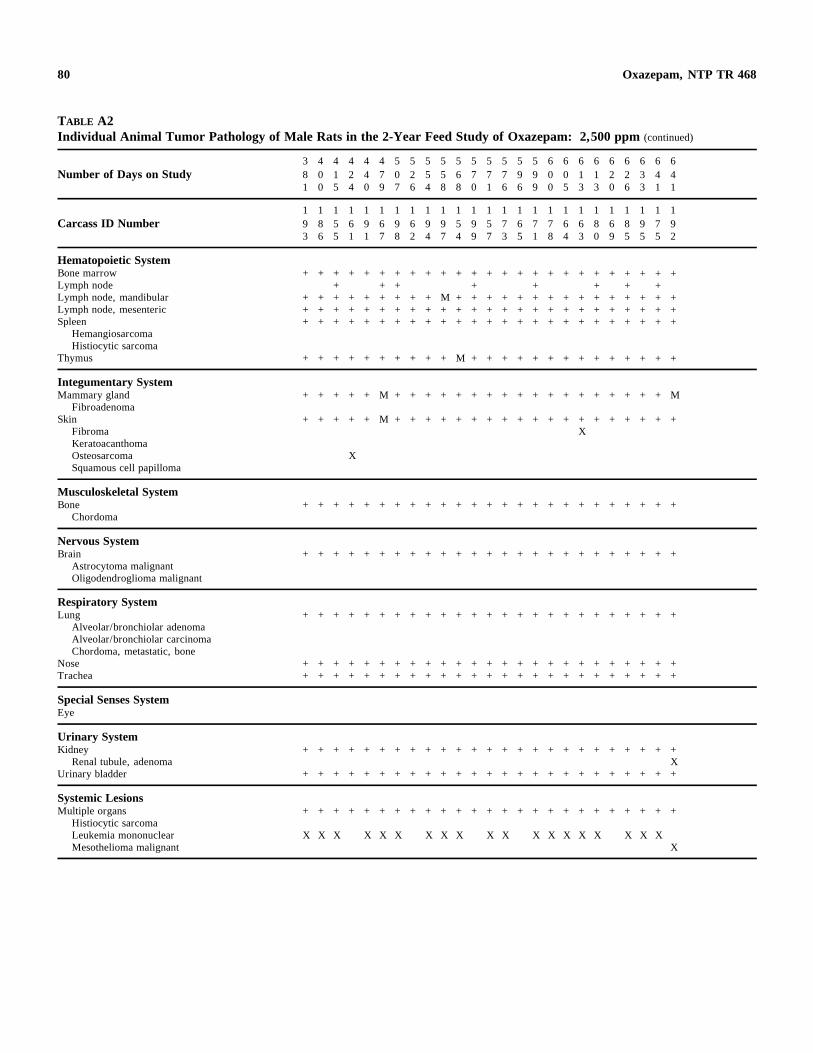
80 Oxazepam, NTP TR 468
TABLE A2 Individual Animal Tumor Pathology of Male Rats in the 2-Year Feed Study of Oxazepam: 2,500 ppm (continued)
Number of Days on Study 3 8 1
4 0 0
4 1 5
4 2 4
4 4 0
4 7 9
5 0 7
5 2 6
5 5 4
5 5 8
5 6 8
5 7 0
5 7 1
5 7 6
5 9 6
5 9 9
6 0 0
6 0 5
6 1 3
6 1 3
6 2 0
6 2 6
6 3 3
6 4 1
6 4 1
Carcass ID Number 1 9 3
1 8 6
1 5 5
1 6 1
1 9 1
1 6 7
1 9 8
1 6 2
1 9 4
1 9 7
1 5 4
1 9 9
1 5 7
1 7 3
1 6 5
1 7 1
1 7 8
1 6 4
1 6 3
1 8 0
1 6 9
1 8 5
1 9 5
1 7 5
1 9 2
Hematopoietic System Bone marrow Lymph node Lymph node, mandibular Lymph node, mesenteric Spleen
Hemangiosarcoma Histiocytic sarcoma
Thymus
+
+ + +
+
+
+ + +
+
+ + + + +
+
+
+ + +
+
+
+ + +
+
+ + + + +
+
+ + + + +
+
+
+ + +
+
+
+ + +
+
+
M + +
+
+
+ + +
M
+ + + + +
+
+
+ + +
+
+
+ + +
+
+
+ + +
+
+ + + + +
+
+
+ + +
+
+
+ + +
+
+
+ + +
+
+ + + + +
+
+
+ + +
+
+ + + + +
+
+
+ + +
+
+ + + + +
+
+
+ + +
+
Integumentary System Mammary gland
Fibroadenoma Skin
Fibroma Keratoacanthoma Osteosarcoma Squamous cell papilloma
+
+
+
+
+
+
+
+
X
+
+
M
M
+
+
+
+
+
+
+
+
+
+
+
+
+
+
+
+
+
+
+
+
+
+
+
+
+
+ X
+
+
+
+
+
+
+
+
+
+
M
+
Musculoskeletal System Bone
Chordoma + + + + + + + + + + + + + + + + + + + + + + + + +
Nervous System Brain
Astrocytoma malignant Oligodendroglioma malignant
+ + + + + + + + + + + + + + + + + + + + + + + + +
Respiratory System Lung
Alveolar/bronchiolar adenoma Alveolar/bronchiolar carcinoma Chordoma, metastatic, bone
Nose Trachea
Special Senses System Eye
+
+ +
+
+ +
+
+ +
+
+ +
+
+ +
+
+ +
+
+ +
+
+ +
+
+ +
+
+ +
+
+ +
+
+ +
+
+ +
+
+ +
+
+ +
+
+ +
+
+ +
+
+ +
+
+ +
+
+ +
+
+ +
+
+ +
+
+ +
+
+ +
+
+ +
Urinary System Kidney
Renal tubule, adenoma Urinary bladder
+
+
+
+
+
+
+
+
+
+
+
+
+
+
+
+
+
+
+
+
+
+
+
+
+
+
+
+
+
+
+
+
+
+
+
+
+
+
+
+
+
+
+
+
+
+
+
+
+ X +
Systemic Lesions Multiple organs
Histiocytic sarcoma Leukemia mononuclear Mesothelioma malignant
+
X
+
X
+
X
+ +
X
+
X
+
X
+ +
X
+
X
+
X
+ +
X
+
X
+ +
X
+
X
+
X
+
X
+
X
+ +
X
+
X
+
X
+
X
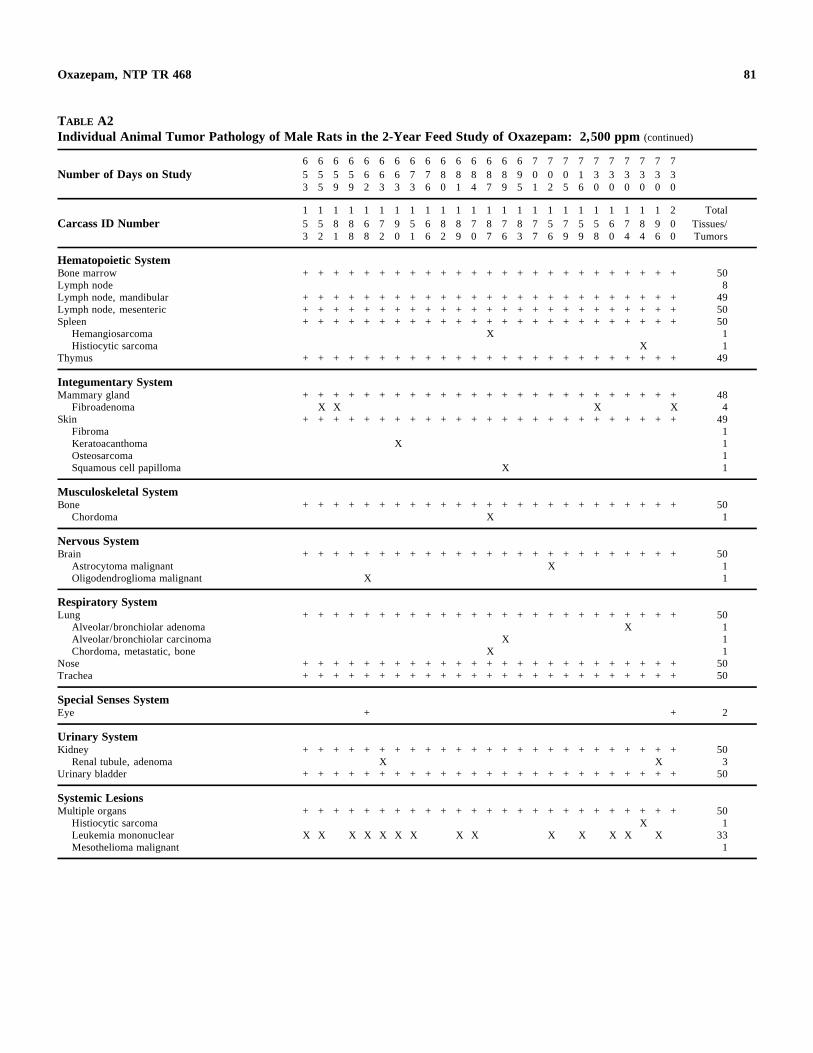
81 Oxazepam, NTP TR 468
TABLE A2 Individual Animal Tumor Pathology of Male Rats in the 2-Year Feed Study of Oxazepam: 2,500 ppm (continued)
6 6 6 6 6 6 6 6 6 6 6 6 6 6 6 7 7 7 7 7 7 7 7 7 7 Number of Days on Study 5 5 5 5 6 6 6 7 7 8 8 8 8 8 9 0 0 0 1 3 3 3 3 3 3
3 5 9 9 2 3 3 3 6 0 1 4 7 9 5 1 2 5 6 0 0 0 0 0 0
1 1 1 1 1 1 1 1 1 1 1 1 1 1 1 1 1 1 1 1 1 1 1 1 2 Total Carcass ID Number 5 5 8 8 6 7 9 5 6 8 8 7 8 7 8 7 5 7 5 5 6 7 8 9 0 Tissues/
3 2 1 8 8 2 0 1 6 2 9 0 7 6 3 7 6 9 9 8 0 4 4 6 0 Tumors
Hematopoietic System Bone marrow + + + + + + + + + + + + + + + + + + + + + + + + + 50 Lymph node 8 Lymph node, mandibular + + + + + + + + + + + + + + + + + + + + + + + + + 49 Lymph node, mesenteric + + + + + + + + + + + + + + + + + + + + + + + + + 50 Spleen + + + + + + + + + + + + + + + + + + + + + + + + + 50
Hemangiosarcoma X 1 Histiocytic sarcoma X 1
Thymus + + + + + + + + + + + + + + + + + + + + + + + + + 49
Integumentary System Mammary gland + + + + + + + + + + + + + + + + + + + + + + + + + 48
Fibroadenoma X X X X 4 Skin + + + + + + + + + + + + + + + + + + + + + + + + + 49
Fibroma 1 Keratoacanthoma X 1 Osteosarcoma 1 Squamous cell papilloma X 1
Musculoskeletal System Bone + + + + + + + + + + + + + + + + + + + + + + + + + 50
Chordoma X 1
Nervous System Brain + + + + + + + + + + + + + + + + + + + + + + + + + 50
Astrocytoma malignant X 1 Oligodendroglioma malignant X 1
Respiratory System Lung + + + + + + + + + + + + + + + + + + + + + + + + + 50
Alveolar/bronchiolar adenoma X 1 Alveolar/bronchiolar carcinoma X 1 Chordoma, metastatic, bone X 1
Nose + + + + + + + + + + + + + + + + + + + + + + + + + 50 Trachea + + + + + + + + + + + + + + + + + + + + + + + + + 50
Special Senses System Eye + + 2
Urinary System Kidney + + + + + + + + + + + + + + + + + + + + + + + + + 50
Renal tubule, adenoma X X 3 Urinary bladder + + + + + + + + + + + + + + + + + + + + + + + + + 50
Systemic Lesions Multiple organs + + + + + + + + + + + + + + + + + + + + + + + + + 50
Histiocytic sarcoma X 1 Leukemia mononuclear X X X X X X X X X X X X X X 33 Mesothelioma malignant 1
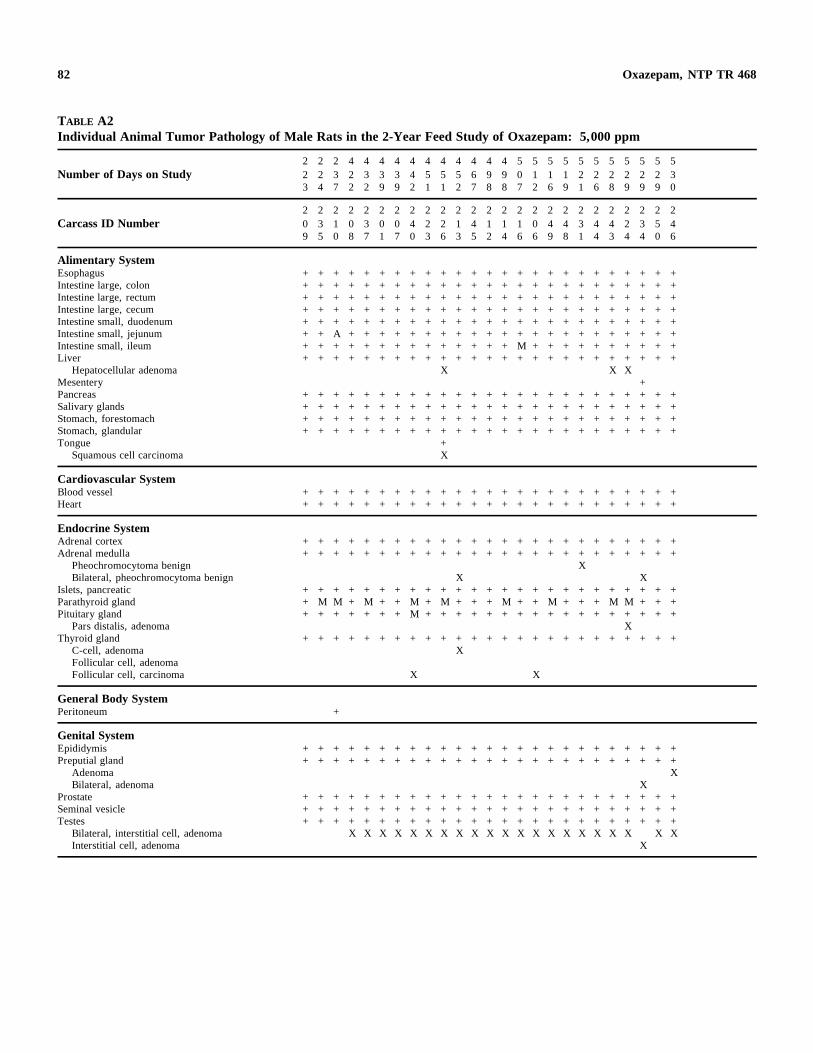
82 Oxazepam, NTP TR 468
TABLE A2 Individual Animal Tumor Pathology of Male Rats in the 2-Year Feed Study of Oxazepam: 5,000 ppm
Number of Days on Study 2 2 2 4 4 4 4 4 4 4 4 4 4 4 5 5 5 5 5 5 5 5 5 5 5 2 2 3 2 3 3 3 4 5 5 5 6 9 9 0 1 1 1 2 2 2 2 2 2 3 3 4 7 2 2 9 9 2 1 1 2 7 8 8 7 2 6 9 1 6 8 9 9 9 0
Carcass ID Number 2 2 2 2 2 2 2 2 2 2 2 2 2 2 2 2 2 2 2 2 2 2 2 2 2 0 3 1 0 3 0 0 4 2 2 1 4 1 1 1 0 4 4 3 4 4 2 3 5 4 9 5 0 8 7 1 7 0 3 6 3 5 2 4 6 6 9 8 1 4 3 4 4 0 6
Alimentary System Esophagus Intestine large, colon Intestine large, rectum Intestine large, cecum Intestine small, duodenum Intestine small, jejunum Intestine small, ileum Liver
Hepatocellular adenoma Mesentery Pancreas Salivary glands Stomach, forestomach Stomach, glandular Tongue
Squamous cell carcinoma
+ + + + + + + + + + + + + + + + + + + + + + + + + + + + + + + + + + + + + + + + + + + + + + + + + + + + + + + + + + + + + + + + + + + + + + + + + + + + + + + + + + + + + + + + + + + + + + + + + + + + + + + + + + + + + + + + + + + + + + + + + + + + + + + A + + + + + + + + + + + + + + + + + + + + + + + + + + + + + + + + + + + + M + + + + + + + + + + + + + + + + + + + + + + + + + + + + + + + + + + +
X X X +
+ + + + + + + + + + + + + + + + + + + + + + + + + + + + + + + + + + + + + + + + + + + + + + + + + + + + + + + + + + + + + + + + + + + + + + + + + + + + + + + + + + + + + + + + + + + + + + + + + + + +
+ X
Cardiovascular System Blood vessel + + + + + + + + + + + + + + + + + + + + + + + + + Heart + + + + + + + + + + + + + + + + + + + + + + + + +
Endocrine System Adrenal cortex + + + + + + + + + + + + + + + + + + + + + + + + + Adrenal medulla + + + + + + + + + + + + + + + + + + + + + + + + +
Pheochromocytoma benign X Bilateral, pheochromocytoma benign X X
Islets, pancreatic + + + + + + + + + + + + + + + + + + + + + + + + + Parathyroid gland + M M + M + + M + M + + + M + + M + + + M M + + + Pituitary gland + + + + + + + M + + + + + + + + + + + + + + + + +
Pars distalis, adenoma X Thyroid gland + + + + + + + + + + + + + + + + + + + + + + + + +
C-cell, adenoma X Follicular cell, adenoma Follicular cell, carcinoma X X
General Body System Peritoneum +
Genital System Epididymis + + + + + + + + + + + + + + + + + + + + + + + + + Preputial gland + + + + + + + + + + + + + + + + + + + + + + + + +
Adenoma X Bilateral, adenoma X
Prostate + + + + + + + + + + + + + + + + + + + + + + + + + Seminal vesicle + + + + + + + + + + + + + + + + + + + + + + + + + Testes + + + + + + + + + + + + + + + + + + + + + + + + +
Bilateral, interstitial cell, adenoma X X X X X X X X X X X X X X X X X X X X X Interstitial cell, adenoma X
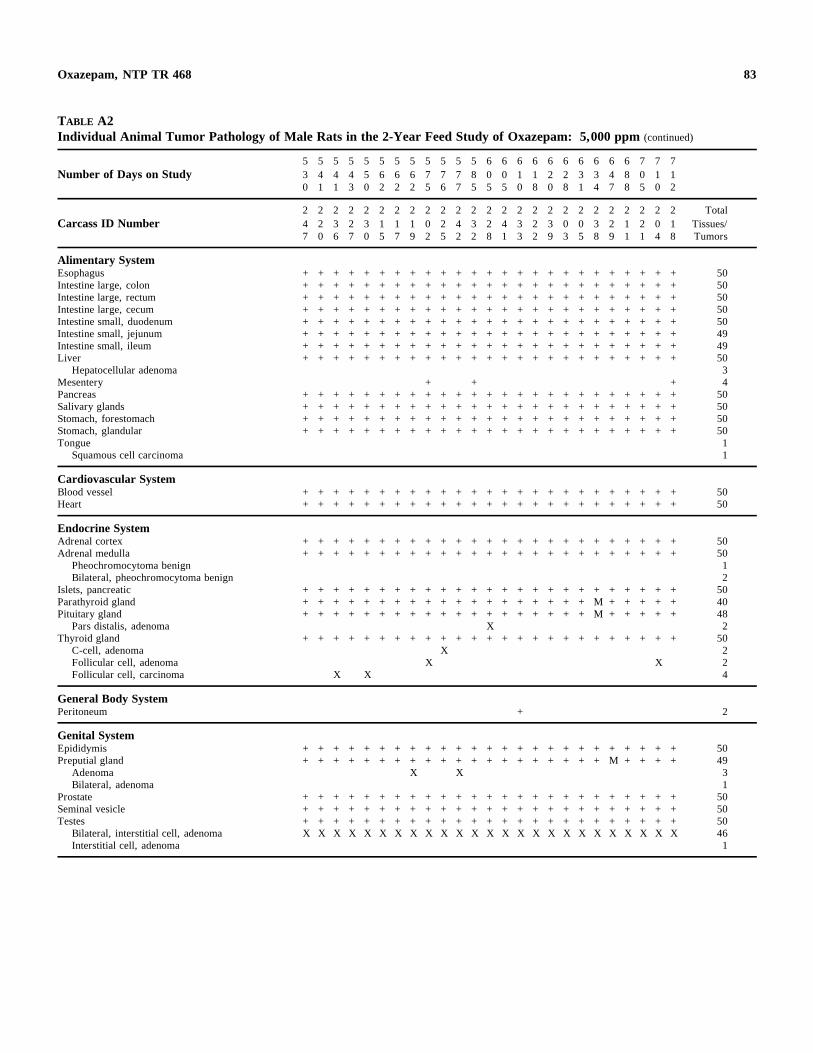
83 Oxazepam, NTP TR 468
TABLE A2 Individual Animal Tumor Pathology of Male Rats in the 2-Year Feed Study of Oxazepam: 5,000 ppm (continued)
5 5 5 5 5 5 5 5 5 5 5 5 6 6 6 6 6 6 6 6 6 6 7 7 7 Number of Days on Study 3 4 4 4 5 6 6 6 7 7 7 8 0 0 1 1 2 2 3 3 4 8 0 1 1
0 1 1 3 0 2 2 2 5 6 7 5 5 5 0 8 0 8 1 4 7 8 5 0 2
2 2 2 2 2 2 2 2 2 2 2 2 2 2 2 2 2 2 2 2 2 2 2 2 2 Total Carcass ID Number 4 2 3 2 3 1 1 1 0 2 4 3 2 4 3 2 3 0 0 3 2 1 2 0 1 Tissues/
7 0 6 7 0 5 7 9 2 5 2 2 8 1 3 2 9 3 5 8 9 1 1 4 8 Tumors
Alimentary System Esophagus + + + + + + + + + + + + + + + + + + + + + + + + + 50 Intestine large, colon + + + + + + + + + + + + + + + + + + + + + + + + + 50 Intestine large, rectum + + + + + + + + + + + + + + + + + + + + + + + + + 50 Intestine large, cecum + + + + + + + + + + + + + + + + + + + + + + + + + 50 Intestine small, duodenum + + + + + + + + + + + + + + + + + + + + + + + + + 50 Intestine small, jejunum + + + + + + + + + + + + + + + + + + + + + + + + + 49 Intestine small, ileum + + + + + + + + + + + + + + + + + + + + + + + + + 49 Liver + + + + + + + + + + + + + + + + + + + + + + + + + 50
Hepatocellular adenoma 3 Mesentery + + + 4 Pancreas + + + + + + + + + + + + + + + + + + + + + + + + + 50 Salivary glands + + + + + + + + + + + + + + + + + + + + + + + + + 50 Stomach, forestomach + + + + + + + + + + + + + + + + + + + + + + + + + 50 Stomach, glandular + + + + + + + + + + + + + + + + + + + + + + + + + 50 Tongue 1
Squamous cell carcinoma 1
Cardiovascular System Blood vessel + + + + + + + + + + + + + + + + + + + + + + + + + 50 Heart + + + + + + + + + + + + + + + + + + + + + + + + + 50
Endocrine System Adrenal cortex + + + + + + + + + + + + + + + + + + + + + + + + + 50 Adrenal medulla + + + + + + + + + + + + + + + + + + + + + + + + + 50
Pheochromocytoma benign 1 Bilateral, pheochromocytoma benign 2
Islets, pancreatic + + + + + + + + + + + + + + + + + + + + + + + + + 50 Parathyroid gland + + + + + + + + + + + + + + + + + + + M + + + + + 40 Pituitary gland + + + + + + + + + + + + + + + + + + + M + + + + + 48
Pars distalis, adenoma X 2 Thyroid gland + + + + + + + + + + + + + + + + + + + + + + + + + 50
C-cell, adenoma X 2 Follicular cell, adenoma X X 2 Follicular cell, carcinoma X X 4
General Body System Peritoneum +
Genital System Epididymis + + + + + + + + + + + + + + + + + + + + + + + + + 50 Preputial gland + + + + + + + + + + + + + + + + + + + + M + + + + 49
Adenoma X X 3 Bilateral, adenoma 1
Prostate + + + + + + + + + + + + + + + + + + + + + + + + + 50 Seminal vesicle + + + + + + + + + + + + + + + + + + + + + + + + + 50 Testes + + + + + + + + + + + + + + + + + + + + + + + + + 50
Bilateral, interstitial cell, adenoma X X X X X X X X X X X X X X X X X X X X X X X X X 46 Interstitial cell, adenoma 1
2
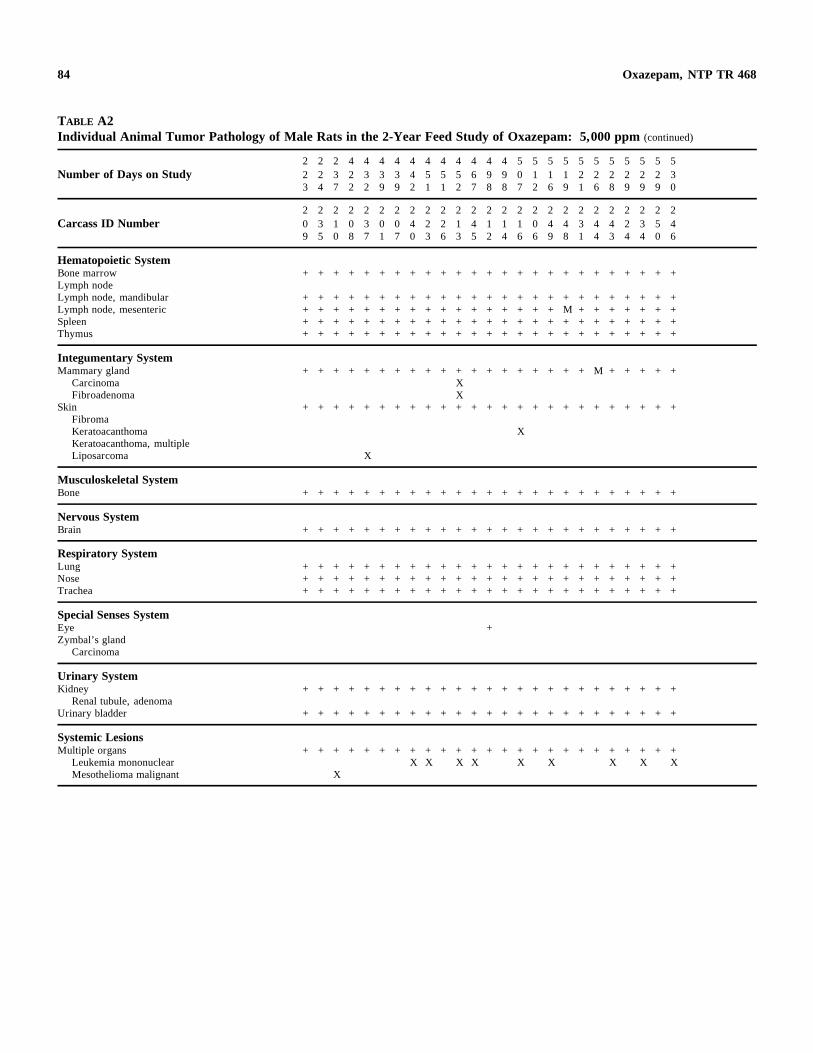
84 Oxazepam, NTP TR 468
TABLE A2 Individual Animal Tumor Pathology of Male Rats in the 2-Year Feed Study of Oxazepam: 5,000 ppm (continued)
Number of Days on Study 2 2 3
2 2 4
2 3 7
4 2 2
4 3 2
4 3 9
4 3 9
4 4 2
4 5 1
4 5 1
4 5 2
4 6 7
4 9 8
4 9 8
5 0 7
5 1 2
5 1 6
5 1 9
5 2 1
5 2 6
5 2 8
5 2 9
5 2 9
5 2 9
5 3 0
Carcass ID Number 2 0 9
2 3 5
2 1 0
2 0 8
2 3 7
2 0 1
2 0 7
2 4 0
2 2 3
2 2 6
2 1 3
2 4 5
2 1 2
2 1 4
2 1 6
2 0 6
2 4 9
2 4 8
2 3 1
2 4 4
2 4 3
2 2 4
2 3 4
2 5 0
2 4 6
Hematopoietic System Bone marrow Lymph node Lymph node, mandibular Lymph node, mesenteric Spleen Thymus
+ + + + + + + + + + + + + + + + + + + + + + + + +
+ + + + + + + + + + + + + + + + + + + + + + + + + + + + + + + + + + + + + + + + + + M + + + + + + + + + + + + + + + + + + + + + + + + + + + + + + + + + + + + + + + + + + + + + + + + + + + + + + + + +
Integumentary System Mammary gland
Carcinoma Fibroadenoma
Skin Fibroma Keratoacanthoma Keratoacanthoma, multiple Liposarcoma
+ + + + + + + + + + + + + + + + + + + M + + + + + X X
+ + + + + + + + + + + + + + + + + + + + + + + + +
X
X
Musculoskeletal System Bone + + + + + + + + + + + + + + + + + + + + + + + + +
Nervous System Brain + + + + + + + + + + + + + + + + + + + + + + + + +
Respiratory System Lung Nose Trachea
+ + + + + + + + + + + + + + + + + + + + + + + + + + + + + + + + + + + + + + + + + + + + + + + + + + + + + + + + + + + + + + + + + + + + + + + + + + +
Special Senses System Eye Zymbal’s gland
Carcinoma
+
Urinary System Kidney
Renal tubule, adenoma Urinary bladder
+ + + + + + + + + + + + + + + + + + + + + + + + +
+ + + + + + + + + + + + + + + + + + + + + + + + +
Systemic Lesions Multiple organs
Leukemia mononuclear Mesothelioma malignant
+ + + + + + + + + + + + + + + + + + + + + + + + + X X X X X X X X X
X
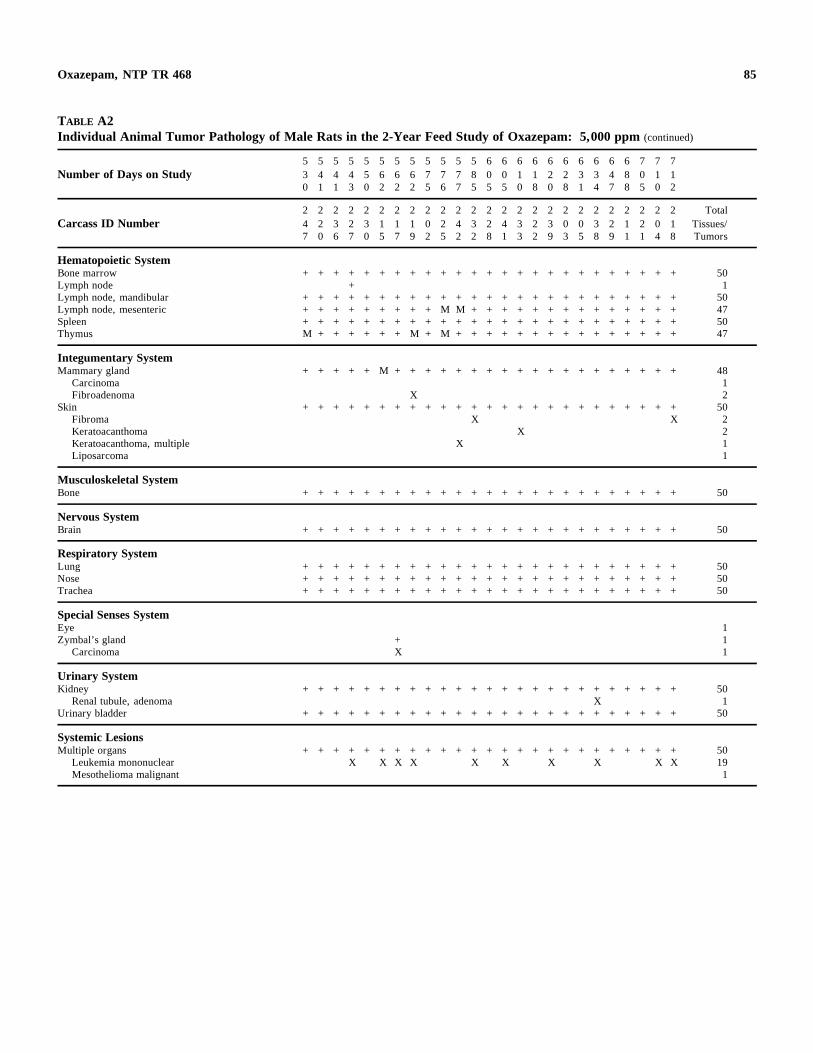
85 Oxazepam, NTP TR 468
TABLE A2 Individual Animal Tumor Pathology of Male Rats in the 2-Year Feed Study of Oxazepam: 5,000 ppm (continued)
5 5 5 5 5 5 5 5 5 5 5 5 6 6 6 6 6 6 6 6 6 6 7 7 7 Number of Days on Study 3 4 4 4 5 6 6 6 7 7 7 8 0 0 1 1 2 2 3 3 4 8 0 1 1
0 1 1 3 0 2 2 2 5 6 7 5 5 5 0 8 0 8 1 4 7 8 5 0 2
2 2 2 2 2 2 2 2 2 2 2 2 2 2 2 2 2 2 2 2 2 2 2 2 2 Total Carcass ID Number 4 2 3 2 3 1 1 1 0 2 4 3 2 4 3 2 3 0 0 3 2 1 2 0 1 Tissues/
7 0 6 7 0 5 7 9 2 5 2 2 8 1 3 2 9 3 5 8 9 1 1 4 8 Tumors
Hematopoietic System Bone marrow + + + + + + + + + + + + + + + + + + + + + + + + + 50 Lymph node + 1 Lymph node, mandibular + + + + + + + + + + + + + + + + + + + + + + + + + 50 Lymph node, mesenteric + + + + + + + + + M M + + + + + + + + + + + + + + 47 Spleen + + + + + + + + + + + + + + + + + + + + + + + + + 50 Thymus M + + + + + + M + M + + + + + + + + + + + + + + + 47
Integumentary System Mammary gland + + + + + M + + + + + + + + + + + + + + + + + + + 48
Carcinoma 1 Fibroadenoma X 2
Skin + + + + + + + + + + + + + + + + + + + + + + + + + 50 Fibroma X X 2 Keratoacanthoma X 2 Keratoacanthoma, multiple X 1 Liposarcoma 1
Musculoskeletal System Bone + + + + + + + + + + + + + + + + + + + + + + + + +
Nervous System Brain + + + + + + + + + + + + + + + + + + + + + + + + +
Respiratory System Lung + + + + + + + + + + + + + + + + + + + + + + + + + 50 Nose + + + + + + + + + + + + + + + + + + + + + + + + + 50 Trachea + + + + + + + + + + + + + + + + + + + + + + + + + 50
Special Senses System Eye 1 Zymbal’s gland + 1
Carcinoma X 1
Urinary System Kidney + + + + + + + + + + + + + + + + + + + + + + + + + 50
Renal tubule, adenoma X 1 Urinary bladder + + + + + + + + + + + + + + + + + + + + + + + + + 50
Systemic Lesions Multiple organs + + + + + + + + + + + + + + + + + + + + + + + + + 50
Leukemia mononuclear X X X X X X X X X X 19 Mesothelioma malignant 1
50
50
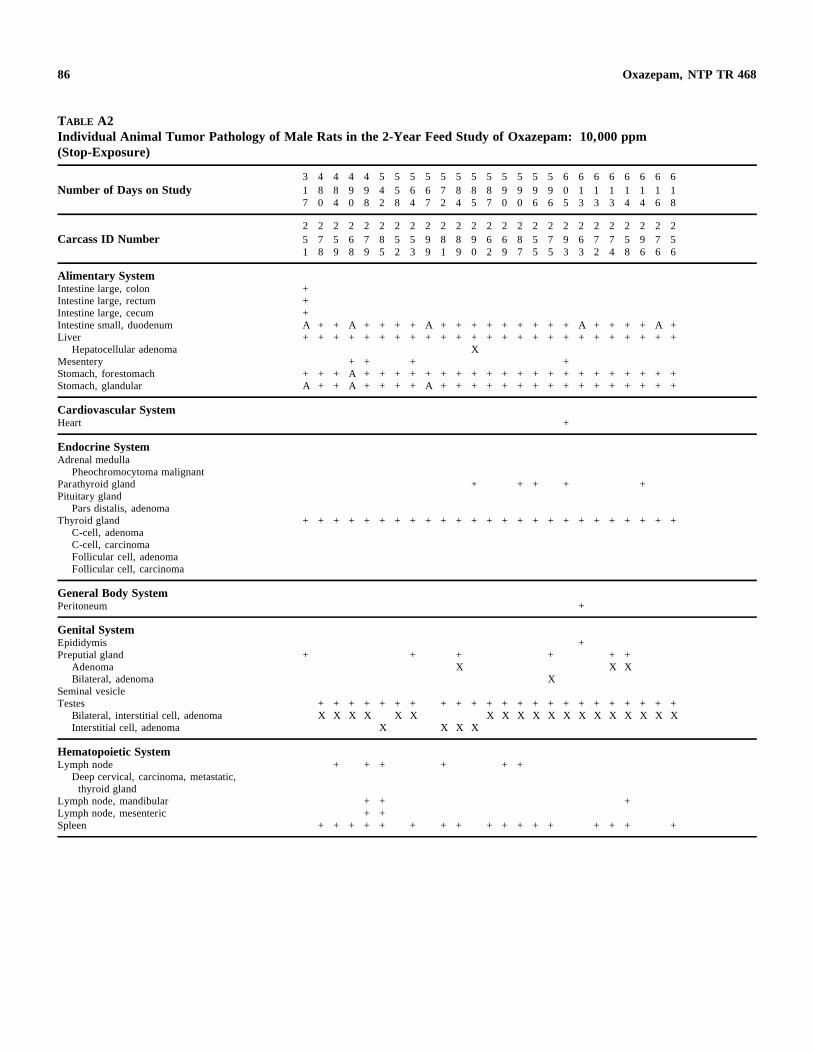
86 Oxazepam, NTP TR 468
TABLE A2 Individual Animal Tumor Pathology of Male Rats in the 2-Year Feed Study of Oxazepam: 10,000 ppm (Stop-Exposure)
3 4 4 4 4 5 5 5 5 5 5 5 5 5 5 5 5 6 6 6 6 6 6 6 6 Number of Days on Study 1
7 8 0
8 4
9 0
9 8
4 2
5 8
6 4
6 7
7 2
8 4
8 5
8 7
9 0
9 0
9 6
9 6
0 5
1 3
1 3
1 3
1 4
1 4
1 6
1 8
2 2 2 2 2 2 2 2 2 2 2 2 2 2 2 2 2 2 2 2 2 2 2 2 2 Carcass ID Number 5 7 5 6 7 8 5 5 9 8 8 9 6 6 8 5 7 9 6 7 7 5 9 7 5
1 8 9 8 9 5 2 3 9 1 9 0 2 9 7 5 5 3 3 2 4 8 6 6 6
Alimentary System Intestine large, colon Intestine large, rectum Intestine large, cecum Intestine small, duodenum Liver
+ + + A + + A + + + + A + + + + + + + + + A + + + + A + + + + + + + + + + + + + + + + + + + + + + + + + +
Hepatocellular adenoma Mesentery Stomach, forestomach Stomach, glandular
X + + + +
+ + + A + + + + + + + + + + + + + + + + + + + + + A + + A + + + + A + + + + + + + + + + + + + + + +
Cardiovascular System Heart +
Endocrine System Adrenal medulla
Pheochromocytoma malignant Parathyroid gland Pituitary gland
Pars distalis, adenoma Thyroid gland
C-cell, adenoma C-cell, carcinoma Follicular cell, adenoma Follicular cell, carcinoma
+ + + + +
+ + + + + + + + + + + + + + + + + + + + + + + + +
General Body System Peritoneum +
Genital System Epididymis Preputial gland
Adenoma + + +
X +
+ + + X X
Bilateral, adenoma Seminal vesicle
X
Testes + + + + + + + + + + + + + + + + + + + + + + + Bilateral, interstitial cell, adenoma Interstitial cell, adenoma
X X X X X
X X X X X
X X X X X X X X X X X X X
Hematopoietic System Lymph node
Deep cervical, carcinoma, metastatic, thyroid gland
Lymph node, mandibular Lymph node, mesenteric Spleen
+ + +
+ + + +
+ + + + + +
+
+ +
+ +
+ + + + +
+
+ + + +
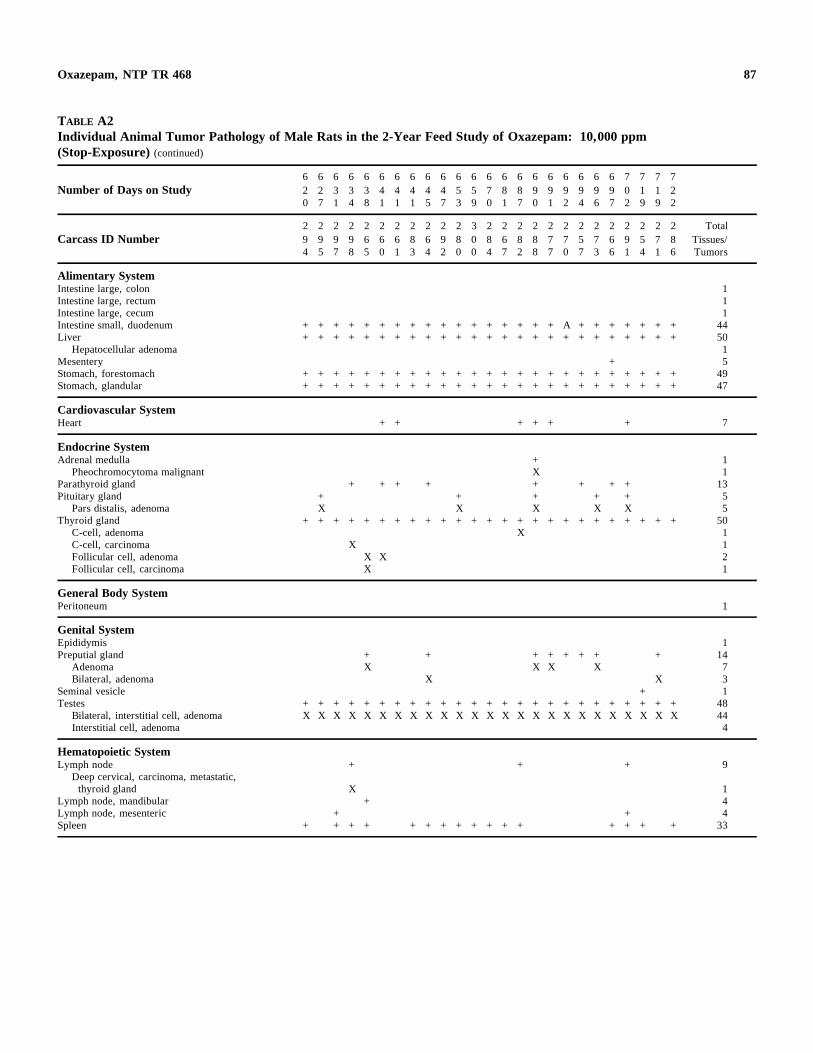
87 Oxazepam, NTP TR 468
TABLE A2 Individual Animal Tumor Pathology of Male Rats in the 2-Year Feed Study of Oxazepam: 10,000 ppm (Stop-Exposure) (continued)
6 6 6 6 6 6 6 6 6 6 6 6 6 6 6 6 6 6 6 6 6 7 7 7 7 Number of Days on Study 2 2 3 3 3 4 4 4 4 4 5 5 7 8 8 9 9 9 9 9 9 0 1 1 2
0 7 1 4 8 1 1 1 5 7 3 9 0 1 7 0 1 2 4 6 7 2 9 9 2
2 2 2 2 2 2 2 2 2 2 2 3 2 2 2 2 2 2 2 2 2 2 2 2 2 Total Carcass ID Number 9 9 9 9 6 6 6 8 6 9 8 0 8 6 8 8 7 7 5 7 6 9 5 7 8 Tissues/
4 5 7 8 5 0 1 3 4 2 0 0 4 7 2 8 7 0 7 3 6 1 4 1 6 Tumors
Alimentary System Intestine large, colon 1 Intestine large, rectum 1 Intestine large, cecum 1 Intestine small, duodenum + + + + + + + + + + + + + + + + + A + + + + + + + 44 Liver + + + + + + + + + + + + + + + + + + + + + + + + + 50
Hepatocellular adenoma 1 Mesentery + 5 Stomach, forestomach + + + + + + + + + + + + + + + + + + + + + + + + + 49 Stomach, glandular + + + + + + + + + + + + + + + + + + + + + + + + + 47
Cardiovascular System Heart + + + + + + 7
Endocrine System Adrenal medulla + 1
Pheochromocytoma malignant X 1 Parathyroid gland + + + + + + + + 13 Pituitary gland + + + + + 5
Pars distalis, adenoma X X X X X 5 Thyroid gland + + + + + + + + + + + + + + + + + + + + + + + + + 50
C-cell, adenoma X 1 C-cell, carcinoma X 1 Follicular cell, adenoma X X 2 Follicular cell, carcinoma X 1
General Body System Peritoneum
Genital System Epididymis 1 Preputial gland + + + + + + + + 14
Adenoma X X X X 7 Bilateral, adenoma X X 3
Seminal vesicle + 1 Testes + + + + + + + + + + + + + + + + + + + + + + + + + 48
Bilateral, interstitial cell, adenoma X X X X X X X X X X X X X X X X X X X X X X X X X 44 Interstitial cell, adenoma 4
Hematopoietic System Lymph node + + + 9
Deep cervical, carcinoma, metastatic, thyroid gland X 1
Lymph node, mandibular + 4 Lymph node, mesenteric + + 4 Spleen + + + + + + + + + + + + + + + + 33
1
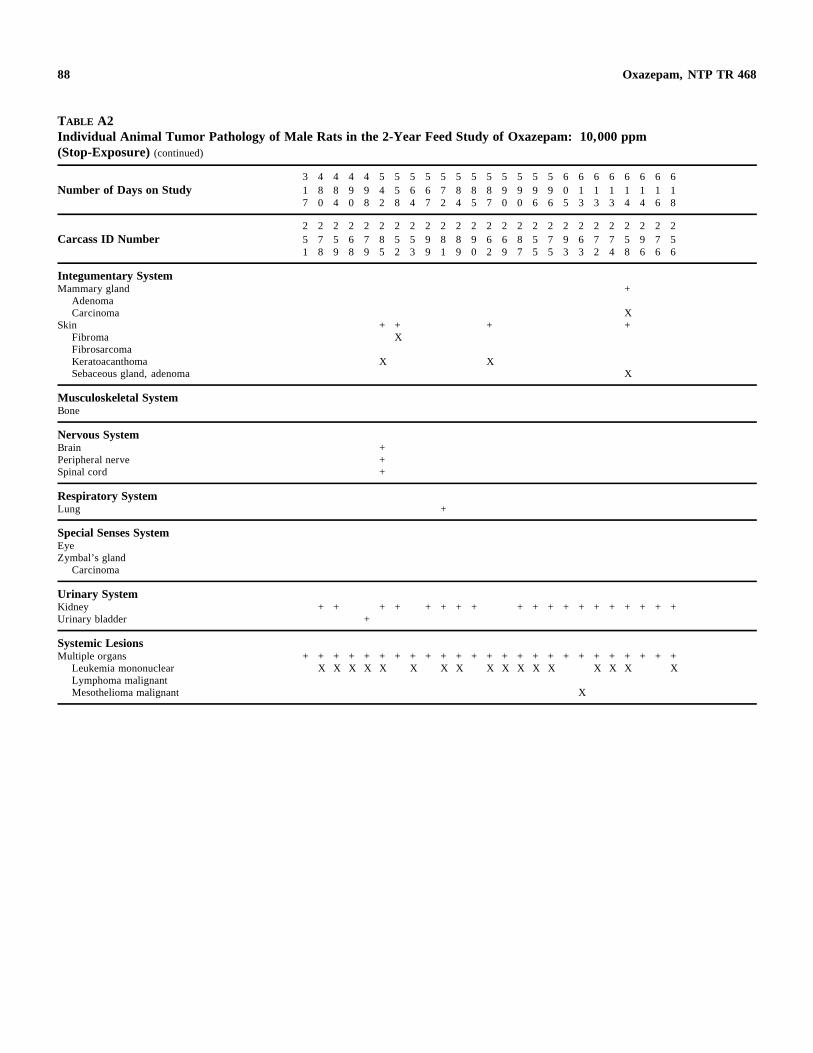
88 Oxazepam, NTP TR 468
TABLE A2 Individual Animal Tumor Pathology of Male Rats in the 2-Year Feed Study of Oxazepam: 10,000 ppm (Stop-Exposure) (continued)
Number of Days on Study 3 1 7
4 8 0
4 8 4
4 9 0
4 9 8
5 4 2
5 5 8
5 6 4
5 6 7
5 7 2
5 8 4
5 8 5
5 8 7
5 9 0
5 9 0
5 9 6
5 9 6
6 0 5
6 1 3
6 1 3
6 1 3
6 1 4
6 1 4
6 1 6
6 1 8
Carcass ID Number 2 5 1
2 7 8
2 5 9
2 6 8
2 7 9
2 8 5
2 5 2
2 5 3
2 9 9
2 8 1
2 8 9
2 9 0
2 6 2
2 6 9
2 8 7
2 5 5
2 7 5
2 9 3
2 6 3
2 7 2
2 7 4
2 5 8
2 9 6
2 7 6
2 5 6
Integumentary System Mammary gland +
Adenoma Carcinoma X
Skin + + + + Fibroma X Fibrosarcoma Keratoacanthoma X X Sebaceous gland, adenoma X
Musculoskeletal System Bone
Nervous System Brain Peripheral nerve Spinal cord
+ + +
Respiratory System Lung +
Special Senses System Eye Zymbal’s gland
Carcinoma
Urinary System Kidney Urinary bladder
+ + + + +
+ + + + + + + + + + + + + + +
Systemic Lesions Multiple organs
Leukemia mononuclear + + + + + + + + + + + + + + + + + + + + + + + + +
X X X X X X X X X X X X X X X X X Lymphoma malignant Mesothelioma malignant X
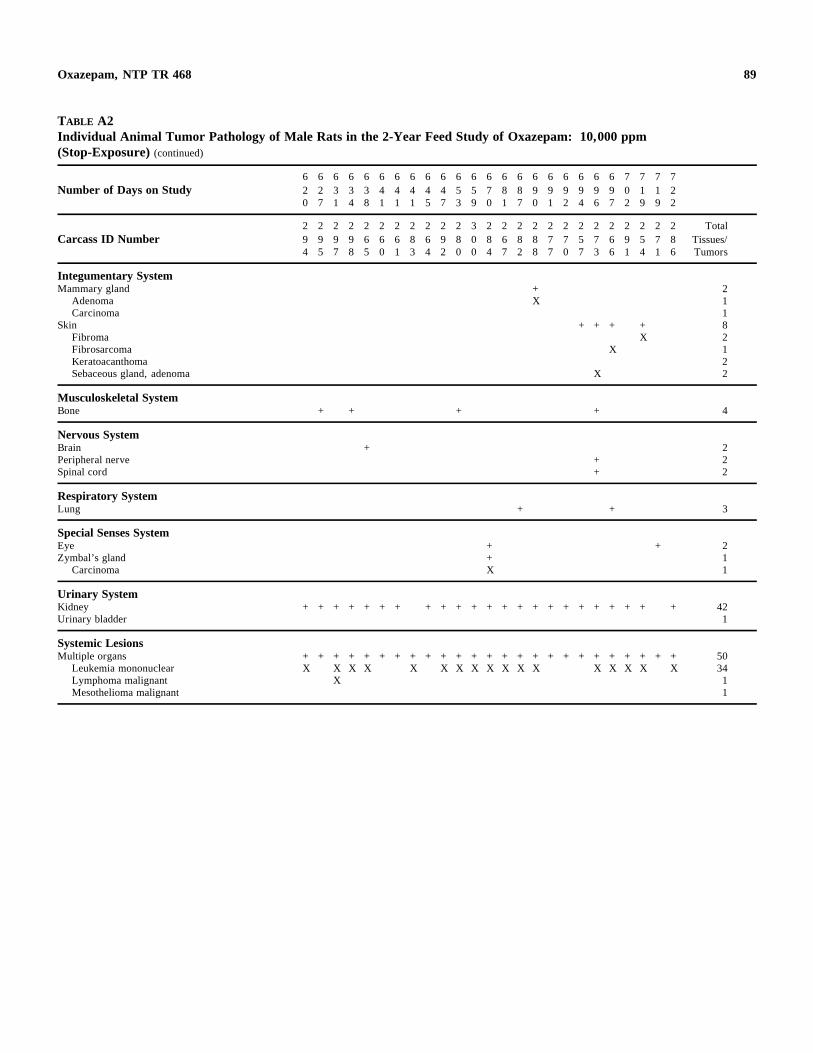
89 Oxazepam, NTP TR 468
TABLE A2 Individual Animal Tumor Pathology of Male Rats in the 2-Year Feed Study of Oxazepam: 10,000 ppm (Stop-Exposure) (continued)
Number of Days on Study 6 2 0
6 2 7
6 3 1
6 3 4
6 3 8
6 4 1
6 4 1
6 4 1
6 4 5
6 4 7
6 5 3
6 5 9
6 7 0
6 8 1
6 8 7
6 9 0
6 9 1
6 9 2
6 9 4
6 9 6
6 9 7
7 0 2
7 1 9
7 1 9
7 2 2
Carcass ID Number 2 9 4
2 9 5
2 9 7
2 9 8
2 6 5
2 6 0
2 6 1
2 8 3
2 6 4
2 9 2
2 8 0
3 0 0
2 8 4
2 6 7
2 8 2
2 8 8
2 7 7
2 7 0
2 5 7
2 7 3
2 6 6
2 9 1
2 5 4
2 7 1
2 8 6
Total Tissues/ Tumors
Integumentary System Mammary gland
Adenoma Carcinoma
Skin Fibroma Fibrosarcoma KeratoacanthomaSebaceous gland, adenoma
+X
+ + +
X
X
+X
2 1 1 8 2 1 2 2
Musculoskeletal System Bone + + + + 4
Nervous System Brain Peripheral nerve Spinal cord
+++
2 2 2
Respiratory System Lung + + 3
Special Senses System Eye Zymbal’s gland
Carcinoma
+ +X
+ 2 1 1
Urinary System Kidney Urinary bladder
+ + + + + + + + + + + + + + + + + + + + + + + 42 1
Systemic Lesions Multiple organs
Leukemia mononuclear Lymphoma malignant Mesothelioma malignant
+ + + + + + + + + + + + + + + + + + + + + + + + + X X X X X X X X X X X X X X X X X
X
50 34 1 1
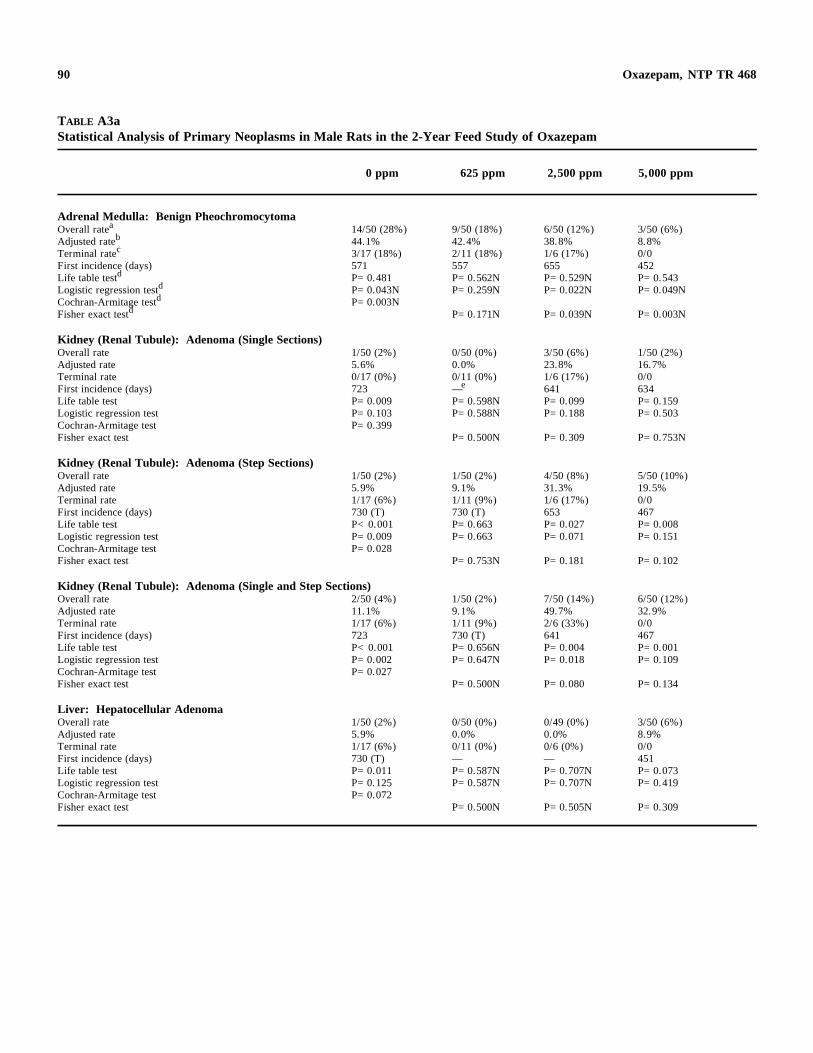
90 Oxazepam, NTP TR 468
TABLE A3a Statistical Analysis of Primary Neoplasms in Male Rats in the 2-Year Feed Study of Oxazepam
0 ppm 625 ppm 2,500 ppm 5,000 ppm
Adrenal Medulla: Benign Pheochromocytoma aOverall rate 14/50 (28%) 9/50 (18%) 6/50 (12%) 3/50 (6%)
Adjusted rateb 44.1% 42.4% 38.8% 8.8% cTerminal rate 3/17 (18%) 2/11 (18%) 1/6 (17%) 0/0
First incidence (days) 571 557 655 452 dLife table test P=0.481 P=0.562N P=0.529N P=0.543
Logistic regression testd P=0.043N P=0.259N P=0.022N P=0.049N Cochran-Armitage testd P=0.003N
dFisher exact test P=0.171N P=0.039N P=0.003N
Kidney (Renal Tubule): Adenoma (Single Sections) Overall rate 1/50 (2%) 0/50 (0%) 3/50 (6%) 1/50 (2%) Adjusted rate 5.6% 0.0% 23.8% 16.7% Terminal rate 0/17 (0%) 0/11 (0%) 1/6 (17%) 0/0
eFirst incidence (days) 723 — 641 634 Life table test P=0.009 P=0.598N P=0.099 P=0.159 Logistic regression test P=0.103 P=0.588N P=0.188 P=0.503 Cochran-Armitage test P=0.399 Fisher exact test P=0.500N P=0.309 P=0.753N
Kidney (Renal Tubule): Adenoma (Step Sections) Overall rate 1/50 (2%) 1/50 (2%) 4/50 (8%) 5/50 (10%) Adjusted rate 5.9% 9.1% 31.3% 19.5% Terminal rate 1/17 (6%) 1/11 (9%) 1/6 (17%) 0/0 First incidence (days) 730 (T) 730 (T) 653 467 Life table test P<0.001 P=0.663 P=0.027 P=0.008 Logistic regression test P=0.009 P=0.663 P=0.071 P=0.151 Cochran-Armitage test P=0.028 Fisher exact test P=0.753N P=0.181 P=0.102
Kidney (Renal Tubule): Adenoma (Single and Step Sections) Overall rate 2/50 (4%) 1/50 (2%) 7/50 (14%) 6/50 (12%) Adjusted rate 11.1% 9.1% 49.7% 32.9% Terminal rate 1/17 (6%) 1/11 (9%) 2/6 (33%) 0/0 First incidence (days) 723 730 (T) 641 467 Life table test P<0.001 P=0.656N P=0.004 P=0.001 Logistic regression test P=0.002 P=0.647N P=0.018 P=0.109 Cochran-Armitage test P=0.027 Fisher exact test P=0.500N P=0.080 P=0.134
Liver: Hepatocellular Adenoma Overall rate 1/50 (2%) 0/50 (0%) 0/49 (0%) 3/50 (6%) Adjusted rate 5.9% 0.0% 0.0% 8.9% Terminal rate 1/17 (6%) 0/11 (0%) 0/6 (0%) 0/0 First incidence (days) 730 (T) — — 451 Life table test P=0.011 P=0.587N P=0.707N P=0.073 Logistic regression test P=0.125 P=0.587N P=0.707N P=0.419 Cochran-Armitage test P=0.072 Fisher exact test P=0.500N P=0.505N P=0.309
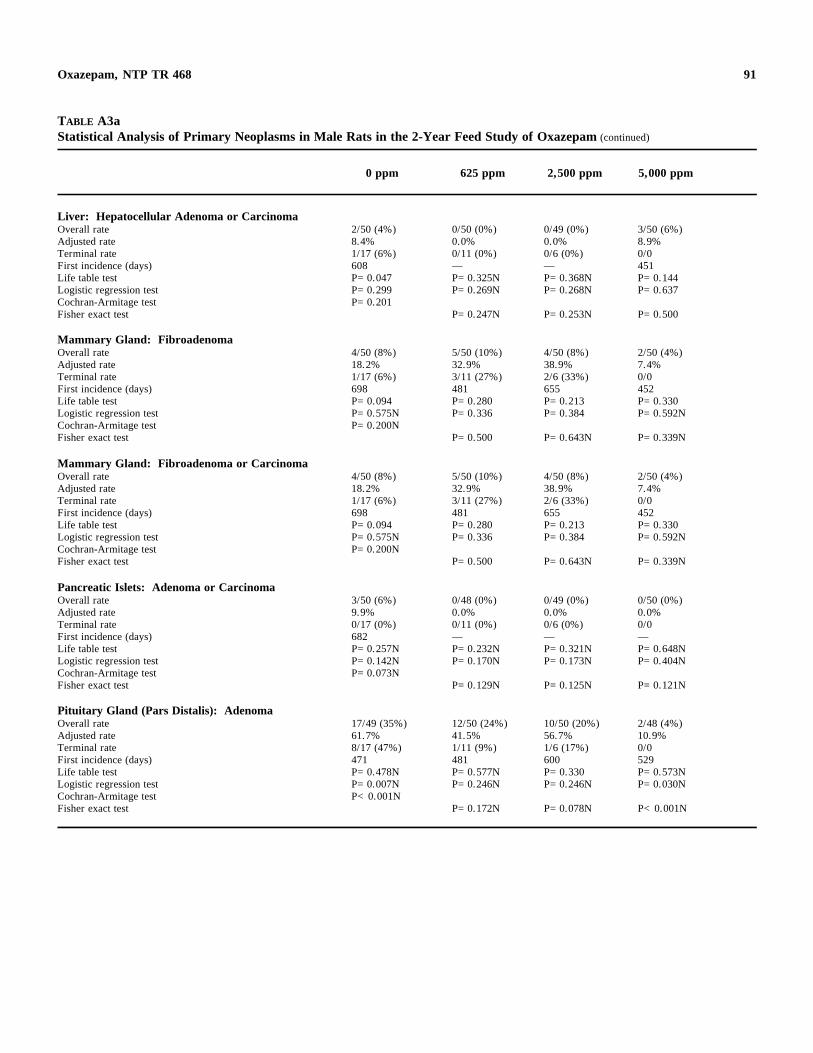
91 Oxazepam, NTP TR 468
TABLE A3a Statistical Analysis of Primary Neoplasms in Male Rats in the 2-Year Feed Study of Oxazepam (continued)
0 ppm 625 ppm 2,500 ppm 5,000 ppm
Liver: Hepatocellular Adenoma or Carcinoma Overall rate 2/50 (4%) 0/50 (0%) 0/49 (0%) 3/50 (6%) Adjusted rate 8.4% 0.0% 0.0% 8.9% Terminal rate 1/17 (6%) 0/11 (0%) 0/6 (0%) 0/0 First incidence (days) 608 — — 451 Life table test P=0.047 P=0.325N P=0.368N P=0.144 Logistic regression test P=0.299 P=0.269N P=0.268N P=0.637 Cochran-Armitage test P=0.201 Fisher exact test P=0.247N P=0.253N P=0.500
Mammary Gland: Fibroadenoma Overall rate 4/50 (8%) 5/50 (10%) 4/50 (8%) 2/50 (4%) Adjusted rate 18.2% 32.9% 38.9% 7.4% Terminal rate 1/17 (6%) 3/11 (27%) 2/6 (33%) 0/0 First incidence (days) 698 481 655 452 Life table test P=0.094 P=0.280 P=0.213 P=0.330 Logistic regression test P=0.575N P=0.336 P=0.384 P=0.592N Cochran-Armitage test P=0.200N Fisher exact test P=0.500 P=0.643N P=0.339N
Mammary Gland: Fibroadenoma or Carcinoma Overall rate 4/50 (8%) 5/50 (10%) 4/50 (8%) 2/50 (4%) Adjusted rate 18.2% 32.9% 38.9% 7.4% Terminal rate 1/17 (6%) 3/11 (27%) 2/6 (33%) 0/0 First incidence (days) 698 481 655 452 Life table test P=0.094 P=0.280 P=0.213 P=0.330 Logistic regression test P=0.575N P=0.336 P=0.384 P=0.592N Cochran-Armitage test P=0.200N Fisher exact test P=0.500 P=0.643N P=0.339N
Pancreatic Islets: Adenoma or Carcinoma Overall rate 3/50 (6%) 0/48 (0%) 0/49 (0%) 0/50 (0%) Adjusted rate 9.9% 0.0% 0.0% 0.0% Terminal rate 0/17 (0%) 0/11 (0%) 0/6 (0%) 0/0 First incidence (days) 682 — — — Life table test P=0.257N P=0.232N P=0.321N P=0.648N Logistic regression test P=0.142N P=0.170N P=0.173N P=0.404N Cochran-Armitage test P=0.073N Fisher exact test P=0.129N P=0.125N P=0.121N
Pituitary Gland (Pars Distalis): Adenoma Overall rate 17/49 (35%) 12/50 (24%) 10/50 (20%) 2/48 (4%) Adjusted rate 61.7% 41.5% 56.7% 10.9% Terminal rate 8/17 (47%) 1/11 (9%) 1/6 (17%) 0/0 First incidence (days) 471 481 600 529 Life table test P=0.478N P=0.577N P=0.330 P=0.573N Logistic regression test P=0.007N P=0.246N P=0.246N P=0.030N Cochran-Armitage test P<0.001N Fisher exact test P=0.172N P=0.078N P<0.001N
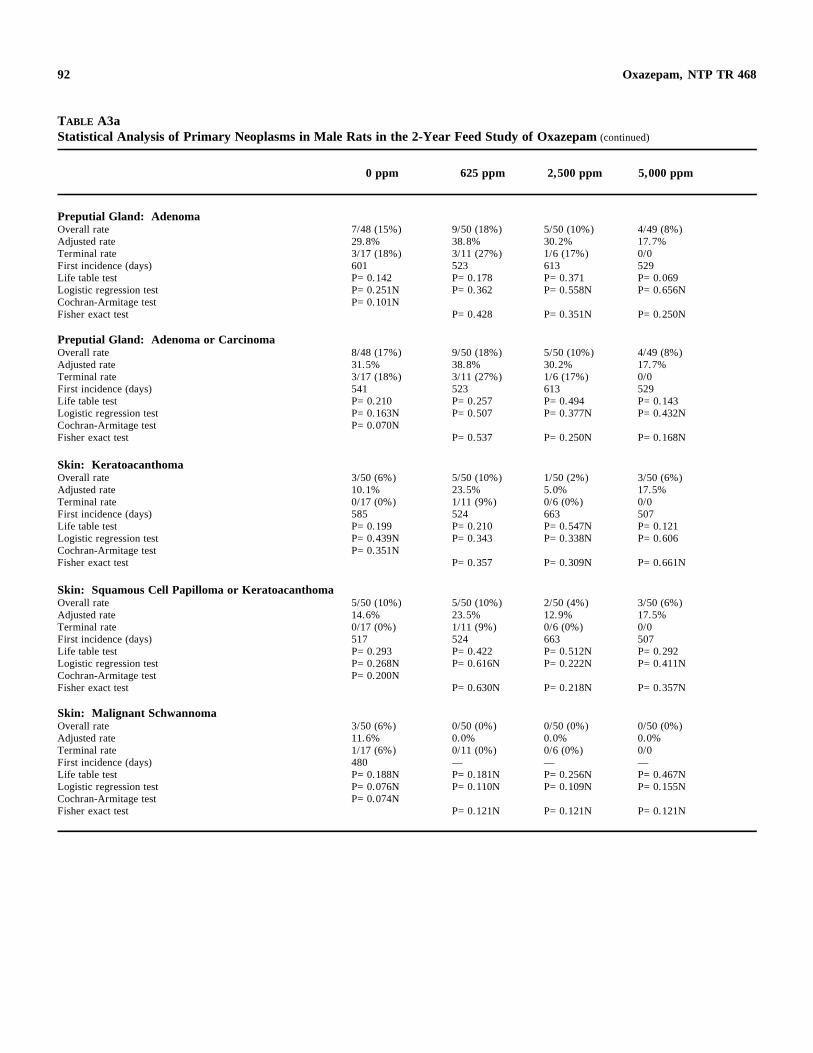
92 Oxazepam, NTP TR 468
TABLE A3a Statistical Analysis of Primary Neoplasms in Male Rats in the 2-Year Feed Study of Oxazepam (continued)
0 ppm 625 ppm 2,500 ppm 5,000 ppm
Preputial Gland: Adenoma Overall rate 7/48 (15%) 9/50 (18%) 5/50 (10%) 4/49 (8%) Adjusted rate 29.8% 38.8% 30.2% 17.7% Terminal rate 3/17 (18%) 3/11 (27%) 1/6 (17%) 0/0 First incidence (days) 601 523 613 529 Life table test P=0.142 P=0.178 P=0.371 P=0.069 Logistic regression test P=0.251N P=0.362 P=0.558N P=0.656N Cochran-Armitage test P=0.101N Fisher exact test P=0.428 P=0.351N P=0.250N
Preputial Gland: Adenoma or Carcinoma Overall rate 8/48 (17%) 9/50 (18%) 5/50 (10%) 4/49 (8%) Adjusted rate 31.5% 38.8% 30.2% 17.7% Terminal rate 3/17 (18%) 3/11 (27%) 1/6 (17%) 0/0 First incidence (days) 541 523 613 529 Life table test P=0.210 P=0.257 P=0.494 P=0.143 Logistic regression test P=0.163N P=0.507 P=0.377N P=0.432N Cochran-Armitage test P=0.070N Fisher exact test P=0.537 P=0.250N P=0.168N
Skin: Keratoacanthoma Overall rate 3/50 (6%) 5/50 (10%) 1/50 (2%) 3/50 (6%) Adjusted rate 10.1% 23.5% 5.0% 17.5% Terminal rate 0/17 (0%) 1/11 (9%) 0/6 (0%) 0/0 First incidence (days) 585 524 663 507 Life table test P=0.199 P=0.210 P=0.547N P=0.121 Logistic regression test P=0.439N P=0.343 P=0.338N P=0.606 Cochran-Armitage test P=0.351N Fisher exact test P=0.357 P=0.309N P=0.661N
Skin: Squamous Cell Papilloma or Keratoacanthoma Overall rate 5/50 (10%) 5/50 (10%) 2/50 (4%) 3/50 (6%) Adjusted rate 14.6% 23.5% 12.9% 17.5% Terminal rate 0/17 (0%) 1/11 (9%) 0/6 (0%) 0/0 First incidence (days) 517 524 663 507 Life table test P=0.293 P=0.422 P=0.512N P=0.292 Logistic regression test P=0.268N P=0.616N P=0.222N P=0.411N Cochran-Armitage test P=0.200N Fisher exact test P=0.630N P=0.218N P=0.357N
Skin: Malignant Schwannoma Overall rate 3/50 (6%) 0/50 (0%) 0/50 (0%) 0/50 (0%) Adjusted rate 11.6% 0.0% 0.0% 0.0% Terminal rate 1/17 (6%) 0/11 (0%) 0/6 (0%) 0/0 First incidence (days) 480 — — — Life table test P=0.188N P=0.181N P=0.256N P=0.467N Logistic regression test P=0.076N P=0.110N P=0.109N P=0.155N Cochran-Armitage test P=0.074N Fisher exact test P=0.121N P=0.121N P=0.121N
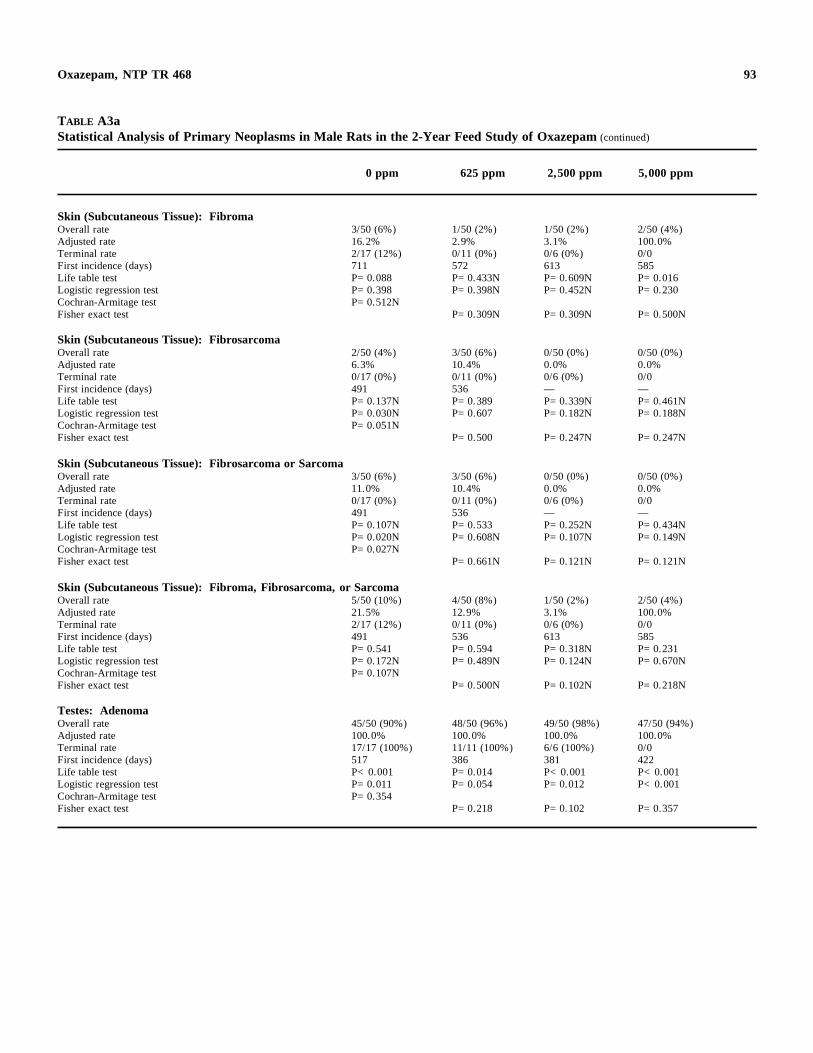
93 Oxazepam, NTP TR 468
TABLE A3a Statistical Analysis of Primary Neoplasms in Male Rats in the 2-Year Feed Study of Oxazepam (continued)
0 ppm 625 ppm 2,500 ppm 5,000 ppm
Skin (Subcutaneous Tissue): Fibroma Overall rate 3/50 (6%) 1/50 (2%) 1/50 (2%) 2/50 (4%) Adjusted rate 16.2% 2.9% 3.1% 100.0% Terminal rate 2/17 (12%) 0/11 (0%) 0/6 (0%) 0/0 First incidence (days) 711 572 613 585 Life table test P=0.088 P=0.433N P=0.609N P=0.016 Logistic regression test P=0.398 P=0.398N P=0.452N P=0.230 Cochran-Armitage test P=0.512N Fisher exact test P=0.309N P=0.309N P=0.500N
Skin (Subcutaneous Tissue): Fibrosarcoma Overall rate 2/50 (4%) 3/50 (6%) 0/50 (0%) 0/50 (0%) Adjusted rate 6.3% 10.4% 0.0% 0.0% Terminal rate 0/17 (0%) 0/11 (0%) 0/6 (0%) 0/0 First incidence (days) 491 536 — — Life table test P=0.137N P=0.389 P=0.339N P=0.461N Logistic regression test P=0.030N P=0.607 P=0.182N P=0.188N Cochran-Armitage test P=0.051N Fisher exact test P=0.500 P=0.247N P=0.247N
Skin (Subcutaneous Tissue): Fibrosarcoma or Sarcoma Overall rate 3/50 (6%) 3/50 (6%) 0/50 (0%) 0/50 (0%) Adjusted rate 11.0% 10.4% 0.0% 0.0% Terminal rate 0/17 (0%) 0/11 (0%) 0/6 (0%) 0/0 First incidence (days) 491 536 — — Life table test P=0.107N P=0.533 P=0.252N P=0.434N Logistic regression test P=0.020N P=0.608N P=0.107N P=0.149N Cochran-Armitage test P=0.027N Fisher exact test P=0.661N P=0.121N P=0.121N
Skin (Subcutaneous Tissue): Fibroma, Fibrosarcoma, or Sarcoma Overall rate 5/50 (10%) 4/50 (8%) 1/50 (2%) 2/50 (4%) Adjusted rate 21.5% 12.9% 3.1% 100.0% Terminal rate 2/17 (12%) 0/11 (0%) 0/6 (0%) 0/0 First incidence (days) 491 536 613 585 Life table test P=0.541 P=0.594 P=0.318N P=0.231 Logistic regression test P=0.172N P=0.489N P=0.124N P=0.670N Cochran-Armitage test P=0.107N Fisher exact test P=0.500N P=0.102N P=0.218N
Testes: Adenoma Overall rate 45/50 (90%) 48/50 (96%) 49/50 (98%) 47/50 (94%) Adjusted rate 100.0% 100.0% 100.0% 100.0% Terminal rate 17/17 (100%) 11/11 (100%) 6/6 (100%) 0/0 First incidence (days) 517 386 381 422 Life table test P<0.001 P=0.014 P<0.001 P<0.001 Logistic regression test P=0.011 P=0.054 P=0.012 P<0.001 Cochran-Armitage test P=0.354 Fisher exact test P=0.218 P=0.102 P=0.357

94 Oxazepam, NTP TR 468
TABLE A3a Statistical Analysis of Primary Neoplasms in Male Rats in the 2-Year Feed Study of Oxazepam (continued)
0 ppm 625 ppm 2,500 ppm 5,000 ppm
Thyroid Gland (C-cell): Adenoma Overall rate 10/50 (20%) 5/49 (10%) 6/50 (12%) 2/50 (4%) Adjusted rate 35.5% 34.6% 31.7% 8.6% Terminal rate 3/17 (18%) 3/11 (27%) 0/6 (0%) 0/0 First incidence (days) 571 614 558 452 Life table test P=0.299 P=0.400N P=0.444 P=0.564 Logistic regression test P=0.210N P=0.312N P=0.351N P=0.145N Cochran-Armitage test P=0.023N Fisher exact test P=0.140N P=0.207N P=0.014N
Thyroid Gland (Follicular Cell): Carcinoma Overall rate 3/50 (6%) 3/49 (6%) 3/50 (6%) 4/50 (8%) Adjusted rate 12.5% 16.3% 12.6% 13.4% Terminal rate 1/17 (6%) 1/11 (9%) 0/6 (0%) 0/0 First incidence (days) 688 614 424 442 Life table test P=0.021 P=0.456 P=0.339 P=0.057 Logistic regression test P=0.395 P=0.546 P=0.656 P=0.516 Cochran-Armitage test P=0.405 Fisher exact test P=0.651 P=0.661N P=0.500
Thyroid Gland (Follicular Cell): Adenoma or Carcinoma Overall rate 4/50 (8%) 3/49 (6%) 4/50 (8%) 6/50 (12%) Adjusted rate 14.6% 16.3% 15.4% 59.2% Terminal rate 1/17 (6%) 1/11 (9%) 0/6 (0%) 0/0 First incidence (days) 554 614 424 442 Life table test P=0.002 P=0.603 P=0.354 P=0.010 Logistic regression test P=0.188 P=0.582N P=0.617N P=0.318 Cochran-Armitage test P=0.218 Fisher exact test P=0.511N P=0.643N P=0.370
All Organs: Mononuclear Cell Leukemia Overall rate 27/50 (54%) 36/50 (72%) 33/50 (66%) 19/50 (38%) Adjusted rate 72.4% 91.4% 86.0% 100.0% Terminal rate 8/17 (47%) 8/11 (73%) 3/6 (50%) 0/0 First incidence (days) 498 426 381 442 Life table test P<0.001 P=0.005 P=0.002 P<0.001 Logistic regression test P=0.049N P=0.020 P=0.187 P=0.459N Cochran-Armitage test P=0.009N Fisher exact test P=0.048 P=0.154 P=0.080N
All Organs: Benign Neoplasms Overall rate 47/50 (94%) 50/50 (100%) 50/50 (100%) 47/50 (94%) Adjusted rate 100.0% 100.0% 100.0% 100.0% Terminal rate 17/17 (100%) 11/11 (100%) 6/6 (100%) 0/0 First incidence (days) 471 386 381 422 Life table test P<0.001 P=0.014 P<0.001 P<0.001 Logistic regression test P=0.040 P=0.011 P=0.014 P=0.001 Cochran-Armitage test P=0.370N Fisher exact test P=0.121 P=0.121 P=0.661N
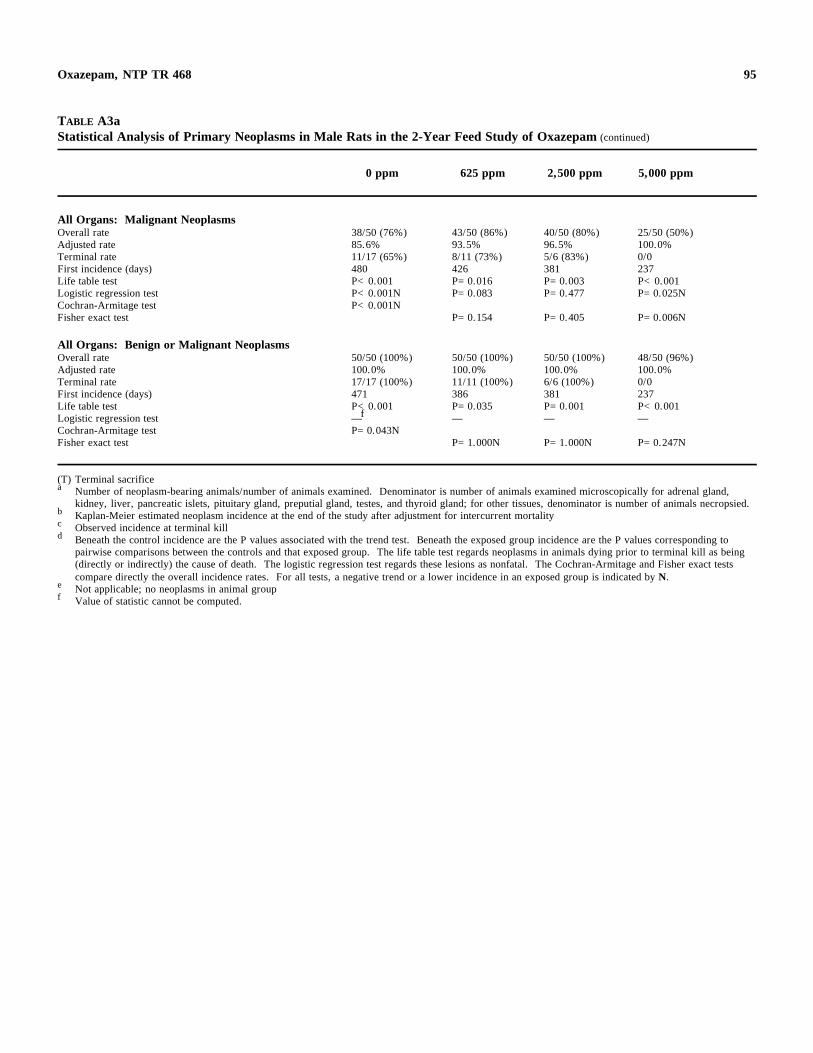
95
c
Oxazepam, NTP TR 468
TABLE A3a Statistical Analysis of Primary Neoplasms in Male Rats in the 2-Year Feed Study of Oxazepam (continued)
0 ppm 625 ppm 2,500 ppm 5,000 ppm
All Organs: Malignant Neoplasms Overall rate 38/50 (76%) 43/50 (86%) 40/50 (80%) 25/50 (50%) Adjusted rate 85.6% 93.5% 96.5% 100.0% Terminal rate 11/17 (65%) 8/11 (73%) 5/6 (83%) 0/0 First incidence (days) 480 426 381 237 Life table test P<0.001 P=0.016 P=0.003 P<0.001 Logistic regression test P<0.001N P=0.083 P=0.477 P=0.025N Cochran-Armitage test P<0.001N Fisher exact test P=0.154 P=0.405 P=0.006N
All Organs: Benign or Malignant Neoplasms Overall rate 50/50 (100%) 50/50 (100%) 50/50 (100%) 48/50 (96%) Adjusted rate 100.0% 100.0% 100.0% 100.0% Terminal rate 17/17 (100%) 11/11 (100%) 6/6 (100%) 0/0 First incidence (days) 471 386 381 237 Life table test Logistic regression test
P<0.001 —f
P=0.035 —
P=0.001 —
P<0.001 —
Cochran-Armitage test P=0.043N Fisher exact test P=1.000N P=1.000N P=0.247N
(T) Terminal sacrifice a Number of neoplasm-bearing animals/number of animals examined. Denominator is number of animals examined microscopically for adrenal gland,
kidney, liver, pancreatic islets, pituitary gland, preputial gland, testes, and thyroid gland; for other tissues, denominator is number of animals necropsied.b Kaplan-Meier estimated neoplasm incidence at the end of the study after adjustment for intercurrent mortality
Observed incidence at terminal kill d Beneath the control incidence are the P values associated with the trend test. Beneath the exposed group incidence are the P values corresponding to
pairwise comparisons between the controls and that exposed group. The life table test regards neoplasms in animals dying prior to terminal kill as being (directly or indirectly) the cause of death. The logistic regression test regards these lesions as nonfatal. The Cochran-Armitage and Fisher exact tests compare directly the overall incidence rates. For all tests, a negative trend or a lower incidence in an exposed group is indicated by N.
e Not applicable; no neoplasms in animal groupf Value of statistic cannot be computed.
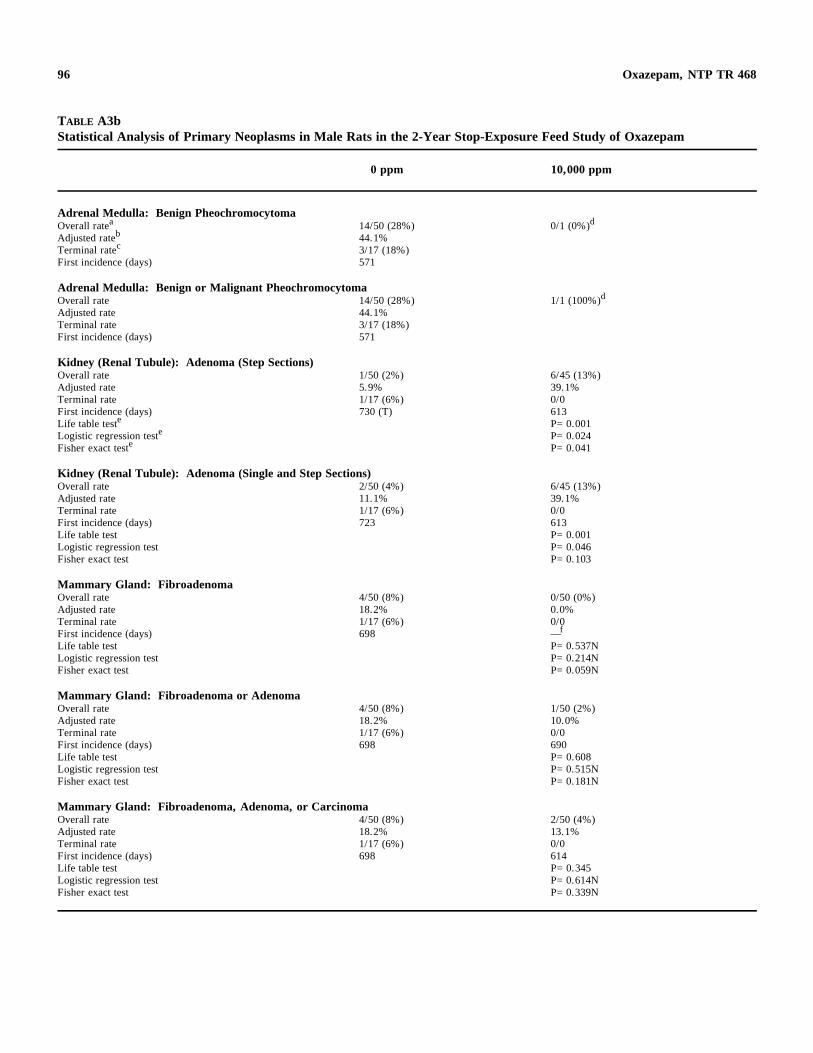
96 Oxazepam, NTP TR 468
TABLE A3b Statistical Analysis of Primary Neoplasms in Male Rats in the 2-Year Stop-Exposure Feed Study of Oxazepam
0 ppm 10,000 ppm
Adrenal Medulla: Benign Pheochromocytoma Overall ratea 14/50 (28%) 0/1 (0%)d
Adjusted rateb 44.1% cTerminal rate 3/17 (18%)
First incidence (days) 571
Adrenal Medulla: Benign or Malignant Pheochromocytoma Overall rate 14/50 (28%) 1/1 (100%)d
Adjusted rate 44.1% Terminal rate 3/17 (18%) First incidence (days) 571
Kidney (Renal Tubule): Adenoma (Step Sections) Overall rate 1/50 (2%) 6/45 (13%) Adjusted rate 5.9% 39.1% Terminal rate 1/17 (6%) 0/0 First incidence (days) 730 (T) 613 Life table teste P=0.001
eLogistic regression test P=0.024 Fisher exact teste P=0.041
Kidney (Renal Tubule): Adenoma (Single and Step Sections) Overall rate 2/50 (4%) 6/45 (13%) Adjusted rate 11.1% 39.1% Terminal rate 1/17 (6%) 0/0 First incidence (days) 723 613 Life table test P=0.001 Logistic regression test P=0.046 Fisher exact test P=0.103
Mammary Gland: Fibroadenoma Overall rate 4/50 (8%) 0/50 (0%) Adjusted rate 18.2% 0.0% Terminal rate 1/17 (6%) 0/0 First incidence (days) 698 —f
Life table test P=0.537N Logistic regression test P=0.214N Fisher exact test P=0.059N
Mammary Gland: Fibroadenoma or Adenoma Overall rate 4/50 (8%) 1/50 (2%) Adjusted rate 18.2% 10.0% Terminal rate 1/17 (6%) 0/0 First incidence (days) 698 690 Life table test P=0.608 Logistic regression test P=0.515N Fisher exact test P=0.181N
Mammary Gland: Fibroadenoma, Adenoma, or Carcinoma Overall rate 4/50 (8%) 2/50 (4%) Adjusted rate 18.2% 13.1% Terminal rate 1/17 (6%) 0/0 First incidence (days) 698 614 Life table test P=0.345 Logistic regression test P=0.614N Fisher exact test P=0.339N
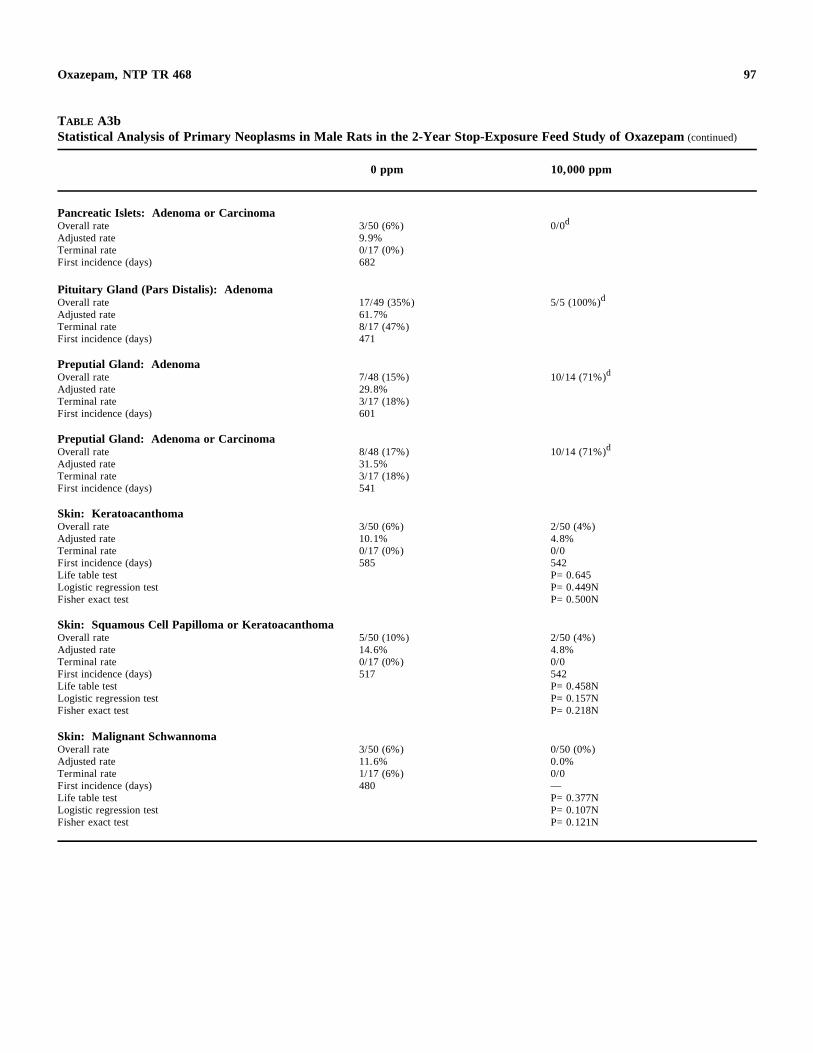
97 Oxazepam, NTP TR 468
TABLE A3b Statistical Analysis of Primary Neoplasms in Male Rats in the 2-Year Stop-Exposure Feed Study of Oxazepam (continued)
0 ppm 10,000 ppm
Pancreatic Islets: Adenoma or Carcinoma Overall rate Adjusted rate Terminal rate First incidence (days)
3/50 (6%) 9.9% 0/17 (0%) 682
0/0d
Pituitary Gland (Pars Distalis): Adenoma Overall rate Adjusted rate Terminal rate First incidence (days)
17/49 (35%) 61.7% 8/17 (47%) 471
5/5 (100%)d
Preputial Gland: Adenoma Overall rate Adjusted rate Terminal rate First incidence (days)
7/48 (15%) 29.8% 3/17 (18%) 601
10/14 (71%)d
Preputial Gland: Adenoma or Carcinoma Overall rate Adjusted rate Terminal rate First incidence (days)
8/48 (17%) 31.5% 3/17 (18%) 541
10/14 (71%)d
Skin: Keratoacanthoma Overall rate Adjusted rate Terminal rate First incidence (days) Life table test
3/50 (6%) 10.1% 0/17 (0%) 585
2/50 (4%) 4.8% 0/0 542 P=0.645
Logistic regression test Fisher exact test
P=0.449N P=0.500N
Skin: Squamous Cell Papilloma or Keratoacanthoma Overall rate Adjusted rate Terminal rate First incidence (days) Life table test
5/50 (10%) 14.6% 0/17 (0%) 517
2/50 (4%) 4.8% 0/0 542 P=0.458N
Logistic regression test Fisher exact test
P=0.157N P=0.218N
Skin: Malignant Schwannoma Overall rate Adjusted rate Terminal rate First incidence (days) Life table test
3/50 (6%) 11.6% 1/17 (6%) 480
0/50 (0%) 0.0% 0/0 — P=0.377N
Logistic regression test Fisher exact test
P=0.107N P=0.121N
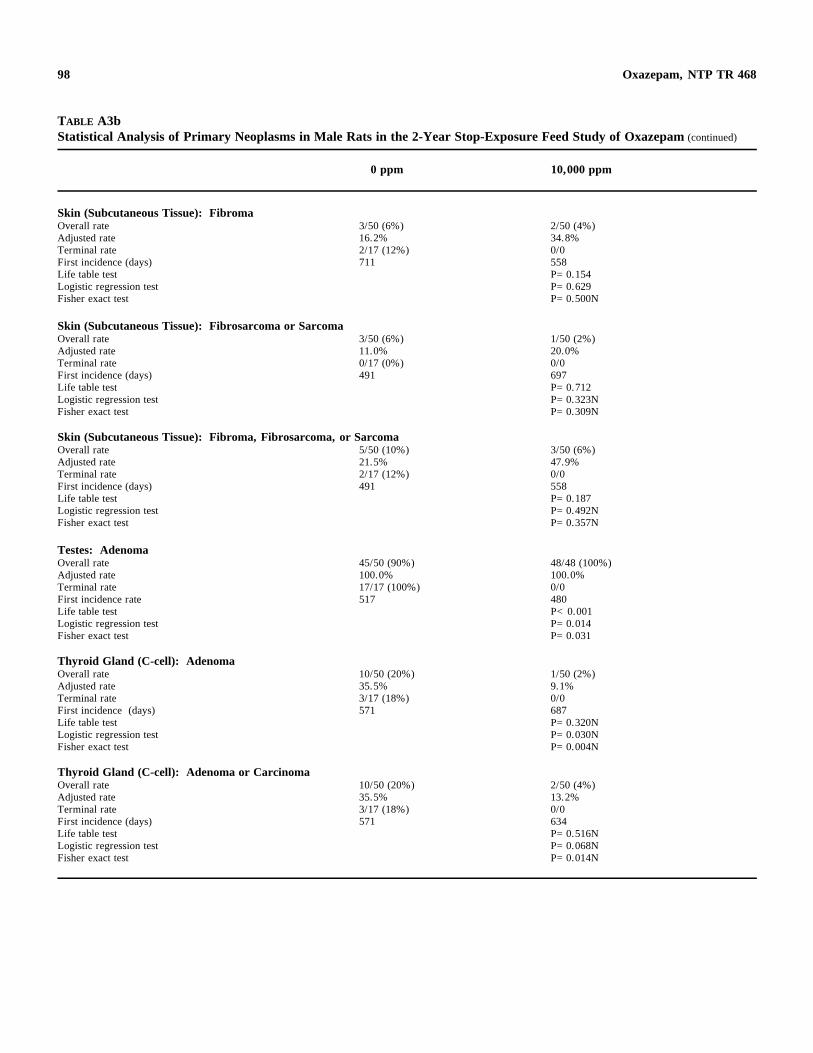
98 Oxazepam, NTP TR 468
TABLE A3b Statistical Analysis of Primary Neoplasms in Male Rats in the 2-Year Stop-Exposure Feed Study of Oxazepam (continued)
0 ppm 10,000 ppm
Skin (Subcutaneous Tissue): Fibroma Overall rate 3/50 (6%) 2/50 (4%) Adjusted rate 16.2% 34.8% Terminal rate 2/17 (12%) 0/0 First incidence (days) 711 558 Life table test P=0.154 Logistic regression test P=0.629 Fisher exact test P=0.500N
Skin (Subcutaneous Tissue): Fibrosarcoma or Sarcoma Overall rate 3/50 (6%) 1/50 (2%) Adjusted rate 11.0% 20.0% Terminal rate 0/17 (0%) 0/0 First incidence (days) 491 697 Life table test P=0.712 Logistic regression test P=0.323N Fisher exact test P=0.309N
Skin (Subcutaneous Tissue): Fibroma, Fibrosarcoma, or Sarcoma Overall rate 5/50 (10%) 3/50 (6%) Adjusted rate 21.5% 47.9% Terminal rate 2/17 (12%) 0/0 First incidence (days) 491 558 Life table test P=0.187 Logistic regression test P=0.492N Fisher exact test P=0.357N
Testes: Adenoma Overall rate 45/50 (90%) 48/48 (100%) Adjusted rate 100.0% 100.0% Terminal rate 17/17 (100%) 0/0 First incidence rate 517 480 Life table test P<0.001 Logistic regression test P=0.014 Fisher exact test P=0.031
Thyroid Gland (C-cell): Adenoma Overall rate 10/50 (20%) 1/50 (2%) Adjusted rate 35.5% 9.1% Terminal rate 3/17 (18%) 0/0 First incidence (days) 571 687 Life table test P=0.320N Logistic regression test P=0.030N Fisher exact test P=0.004N
Thyroid Gland (C-cell): Adenoma or Carcinoma Overall rate 10/50 (20%) 2/50 (4%) Adjusted rate 35.5% 13.2% Terminal rate 3/17 (18%) 0/0 First incidence (days) 571 634 Life table test P=0.516N Logistic regression test P=0.068N Fisher exact test P=0.014N
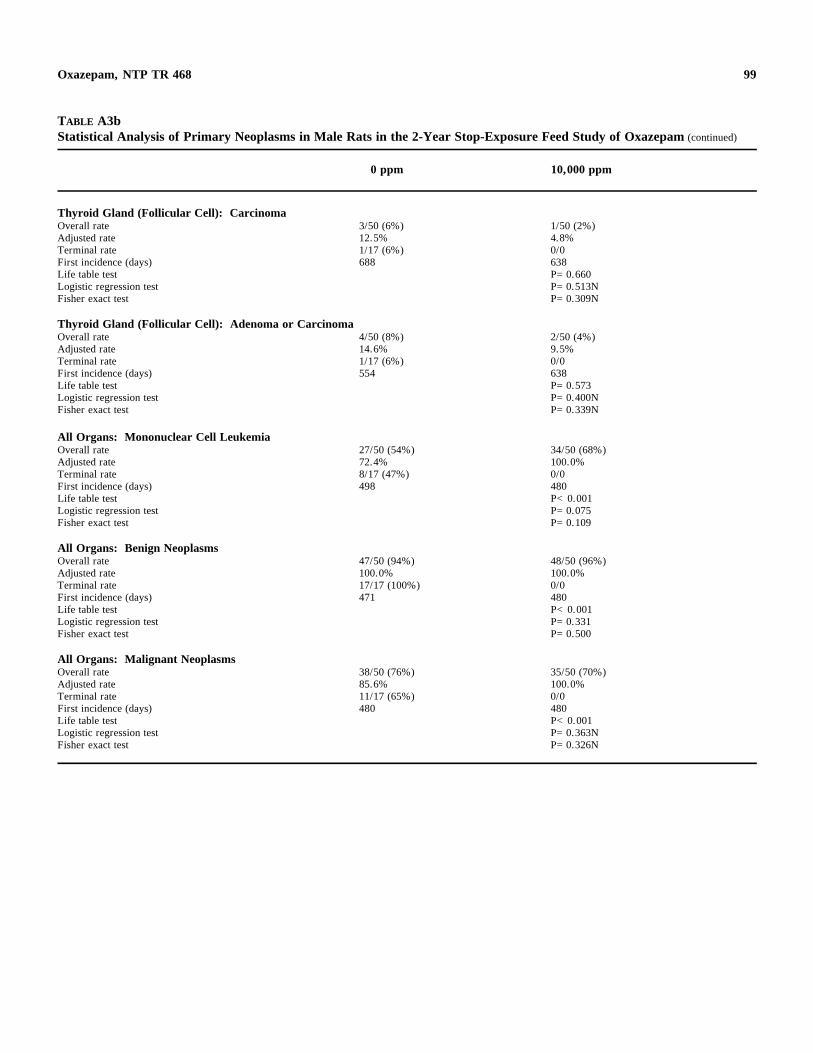
99 Oxazepam, NTP TR 468
TABLE A3b Statistical Analysis of Primary Neoplasms in Male Rats in the 2-Year Stop-Exposure Feed Study of Oxazepam (continued)
0 ppm 10,000 ppm
Thyroid Gland (Follicular Cell): Carcinoma Overall rate 3/50 (6%) 1/50 (2%) Adjusted rate 12.5% 4.8% Terminal rate 1/17 (6%) 0/0 First incidence (days) 688 638 Life table test P=0.660 Logistic regression test P=0.513N Fisher exact test P=0.309N
Thyroid Gland (Follicular Cell): Adenoma or Carcinoma Overall rate 4/50 (8%) 2/50 (4%) Adjusted rate 14.6% 9.5% Terminal rate 1/17 (6%) 0/0 First incidence (days) 554 638 Life table test P=0.573 Logistic regression test P=0.400N Fisher exact test P=0.339N
All Organs: Mononuclear Cell Leukemia Overall rate 27/50 (54%) 34/50 (68%) Adjusted rate 72.4% 100.0% Terminal rate 8/17 (47%) 0/0 First incidence (days) 498 480 Life table test P<0.001 Logistic regression test P=0.075 Fisher exact test P=0.109
All Organs: Benign Neoplasms Overall rate 47/50 (94%) 48/50 (96%) Adjusted rate 100.0% 100.0% Terminal rate 17/17 (100%) 0/0 First incidence (days) 471 480 Life table test P<0.001 Logistic regression test P=0.331 Fisher exact test P=0.500
All Organs: Malignant Neoplasms Overall rate 38/50 (76%) 35/50 (70%) Adjusted rate 85.6% 100.0% Terminal rate 11/17 (65%) 0/0 First incidence (days) 480 480 Life table test P<0.001 Logistic regression test P=0.363N Fisher exact test P=0.326N
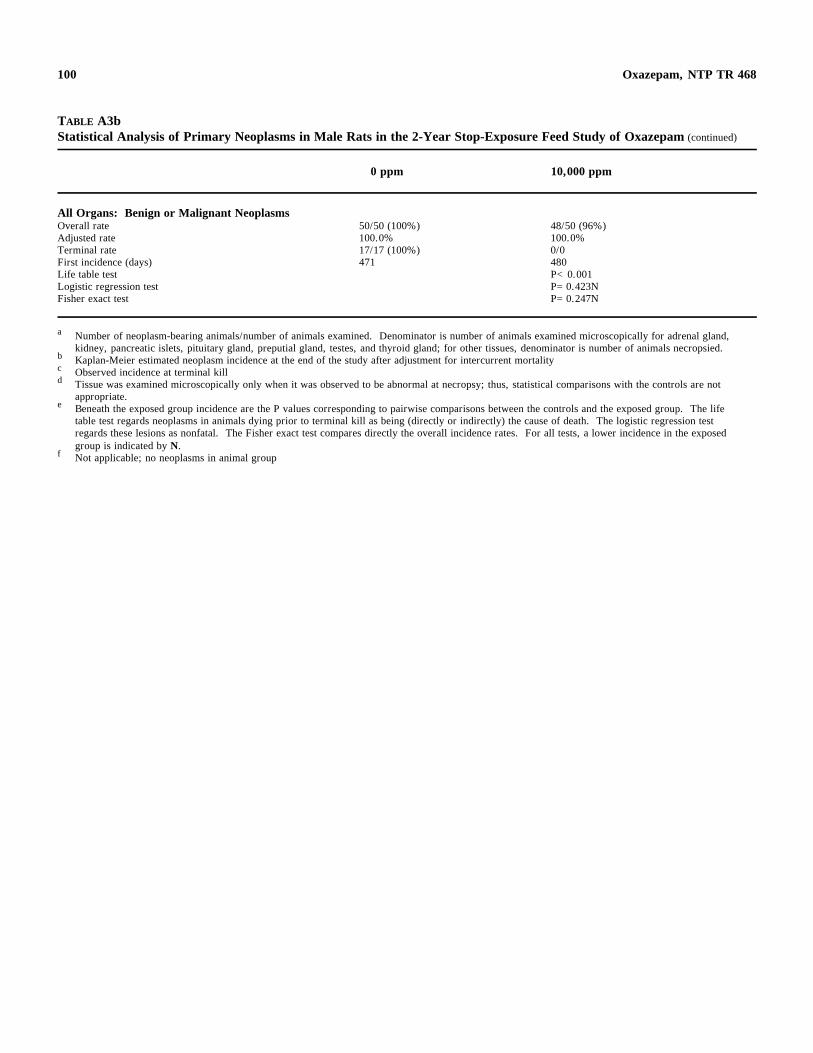
100
c
Oxazepam, NTP TR 468
TABLE A3b Statistical Analysis of Primary Neoplasms in Male Rats in the 2-Year Stop-Exposure Feed Study of Oxazepam (continued)
0 ppm 10,000 ppm
All Organs: Benign or Malignant Neoplasms Overall rate 50/50 (100%) 48/50 (96%) Adjusted rate 100.0% 100.0% Terminal rate 17/17 (100%) 0/0 First incidence (days) 471 480 Life table test P<0.001 Logistic regression test P=0.423N Fisher exact test P=0.247N
a Number of neoplasm-bearing animals/number of animals examined. Denominator is number of animals examined microscopically for adrenal gland, kidney, pancreatic islets, pituitary gland, preputial gland, testes, and thyroid gland; for other tissues, denominator is number of animals necropsied.
b Kaplan-Meier estimated neoplasm incidence at the end of the study after adjustment for intercurrent mortality Observed incidence at terminal kill
d Tissue was examined microscopically only when it was observed to be abnormal at necropsy; thus, statistical comparisons with the controls are not appropriate.
e Beneath the exposed group incidence are the P values corresponding to pairwise comparisons between the controls and the exposed group. The life table test regards neoplasms in animals dying prior to terminal kill as being (directly or indirectly) the cause of death. The logistic regression test regards these lesions as nonfatal. The Fisher exact test compares directly the overall incidence rates. For all tests, a lower incidence in the exposed group is indicated by N.
f Not applicable; no neoplasms in animal group
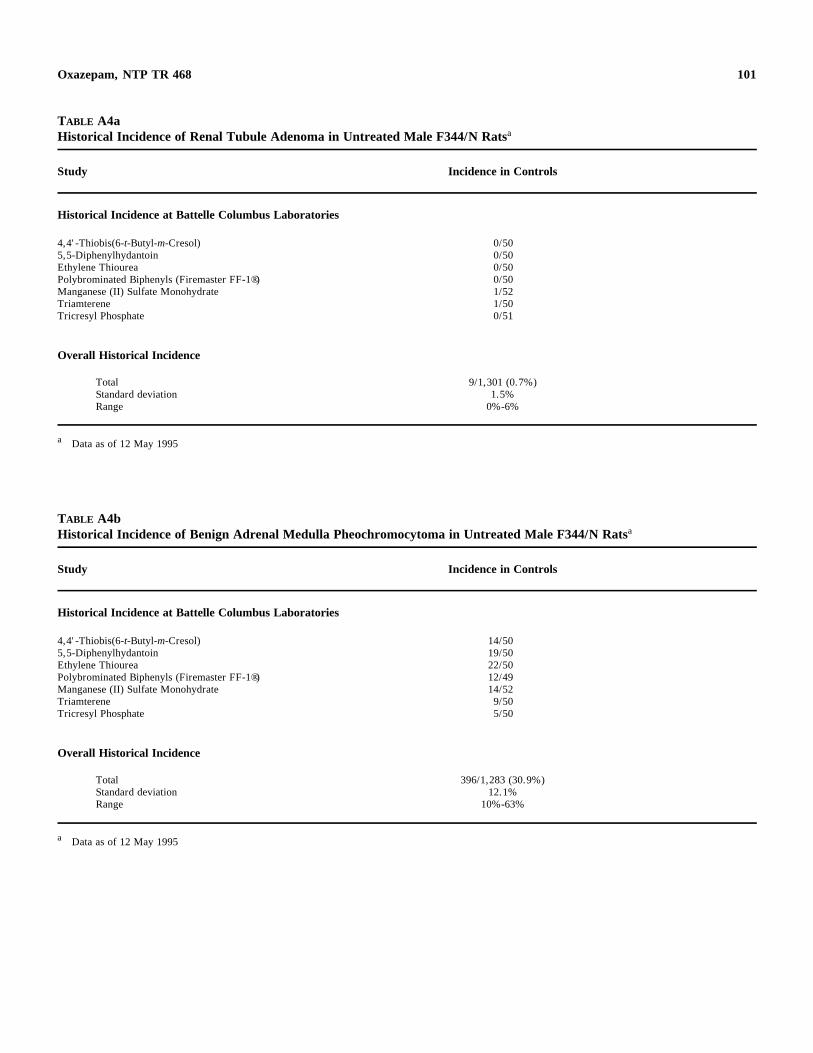
101 Oxazepam, NTP TR 468
TABLE A4a Historical Incidence of Renal Tubule Adenoma in Untreated Male F344/N Ratsa
Study Incidence in Controls
Historical Incidence at Battelle Columbus Laboratories
4,4'-Thiobis(6-t-Butyl-m-Cresol) 0/50 5,5-Diphenylhydantoin 0/50 Ethylene Thiourea 0/50 Polybrominated Biphenyls (Firemaster FF-1®) 0/50 Manganese (II) Sulfate Monohydrate 1/52 Triamterene 1/50 Tricresyl Phosphate 0/51
Overall Historical Incidence
Total 9/1,301 (0.7%) Standard deviation 1.5% Range 0%-6%
a Data as of 12 May 1995
TABLE A4b Historical Incidence of Benign Adrenal Medulla Pheochromocytoma in Untreated Male F344/N Ratsa
Study Incidence in Controls
Historical Incidence at Battelle Columbus Laboratories
4,4'-Thiobis(6-t-Butyl-m-Cresol) 14/50 5,5-Diphenylhydantoin 19/50 Ethylene Thiourea 22/50 Polybrominated Biphenyls (Firemaster FF-1®) 12/49 Manganese (II) Sulfate Monohydrate 14/52 Triamterene 9/50 Tricresyl Phosphate 5/50
Overall Historical Incidence
Total 396/1,283 (30.9%) Standard deviation 12.1% Range 10%-63%
a Data as of 12 May 1995
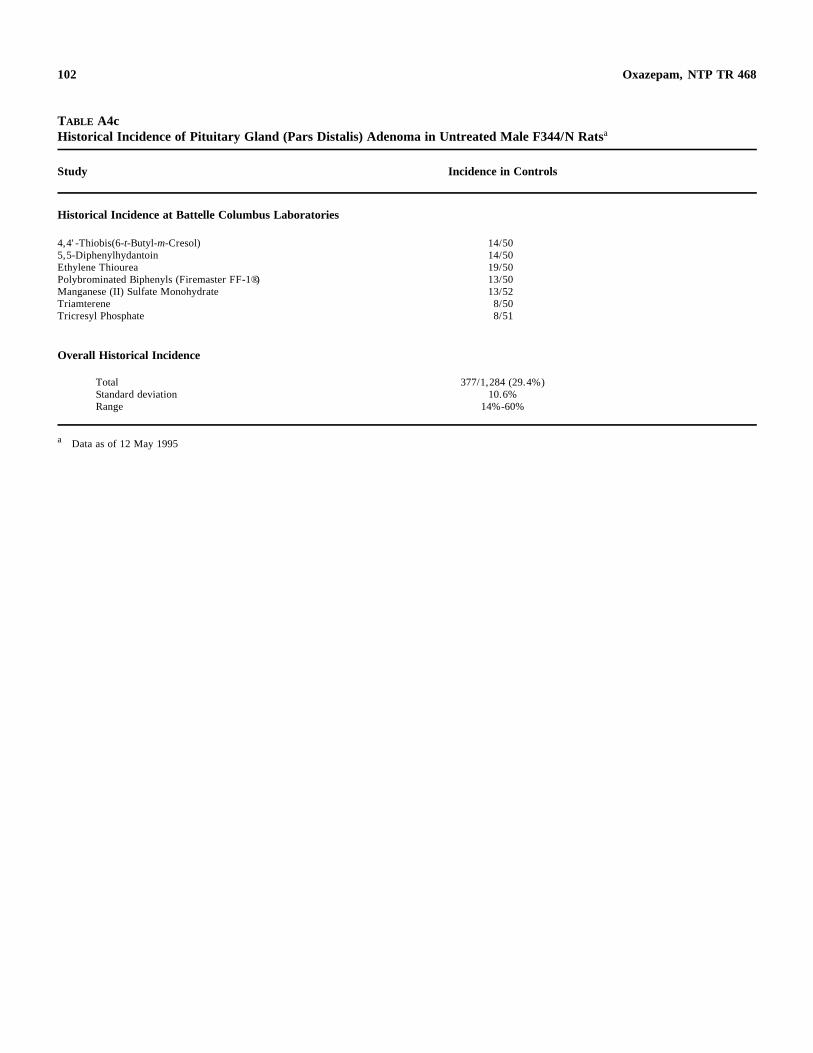
102 Oxazepam, NTP TR 468
TABLE A4c Historical Incidence of Pituitary Gland (Pars Distalis) Adenoma in Untreated Male F344/N Ratsa
Study Incidence in Controls
Historical Incidence at Battelle Columbus Laboratories
4,4'-Thiobis(6-t-Butyl-m-Cresol) 14/50 5,5-Diphenylhydantoin 14/50 Ethylene Thiourea 19/50 Polybrominated Biphenyls (Firemaster FF-1®) 13/50 Manganese (II) Sulfate Monohydrate 13/52 Triamterene 8/50 Tricresyl Phosphate 8/51
Overall Historical Incidence
Total 377/1,284 (29.4%) Standard deviation 10.6% Range 14%-60%
a Data as of 12 May 1995
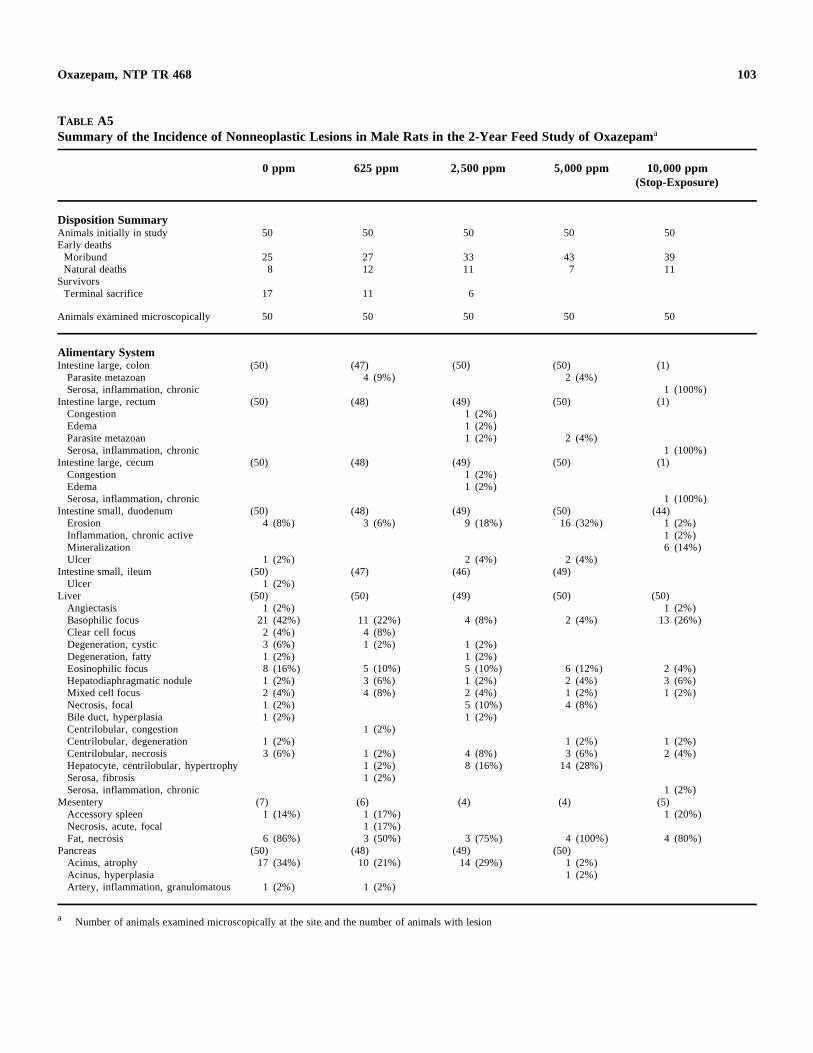
103 Oxazepam, NTP TR 468
TABLE A5 Summary of the Incidence of Nonneoplastic Lesions in Male Rats in the 2-Year Feed Study of Oxazepama
0 ppm 625 ppm 2,500 ppm 5,000 ppm 10,000 ppm (Stop-Exposure)
Disposition Summary Animals initially in study 50 50 50 50 50 Early deaths Moribund 25 27 33 43 39 Natural deaths 8 12 11 7 11
Survivors Terminal sacrifice 17 11 6
Animals examined microscopically 50 50 50 50 50
Alimentary System Intestine large, colon (50) (47) (50) (50) (1)
Parasite metazoan 4 (9%) 2 (4%) Serosa, inflammation, chronic 1 (100%)
Intestine large, rectum (50) (48) (49) (50) (1) Congestion 1 (2%) Edema 1 (2%) Parasite metazoan 1 (2%) 2 (4%) Serosa, inflammation, chronic 1 (100%)
Intestine large, cecum (50) (48) (49) (50) (1) Congestion 1 (2%) Edema 1 (2%) Serosa, inflammation, chronic 1 (100%)
Intestine small, duodenum (50) (48) (49) (50) (44) Erosion 4 (8%) 3 (6%) 9 (18%) 16 (32%) 1 (2%) Inflammation, chronic active 1 (2%) Mineralization 6 (14%) Ulcer 1 (2%) 2 (4%) 2 (4%)
Intestine small, ileum (50) (47) (46) (49) Ulcer 1 (2%)
Liver (50) (50) (49) (50) (50) Angiectasis 1 (2%) 1 (2%) Basophilic focus 21 (42%) 11 (22%) 4 (8%) 2 (4%) 13 (26%) Clear cell focus 2 (4%) 4 (8%) Degeneration, cystic 3 (6%) 1 (2%) 1 (2%) Degeneration, fatty 1 (2%) 1 (2%) Eosinophilic focus 8 (16%) 5 (10%) 5 (10%) 6 (12%) 2 (4%) Hepatodiaphragmatic nodule 1 (2%) 3 (6%) 1 (2%) 2 (4%) 3 (6%) Mixed cell focus 2 (4%) 4 (8%) 2 (4%) 1 (2%) 1 (2%) Necrosis, focal 1 (2%) 5 (10%) 4 (8%) Bile duct, hyperplasia 1 (2%) 1 (2%) Centrilobular, congestion 1 (2%) Centrilobular, degeneration 1 (2%) 1 (2%) 1 (2%) Centrilobular, necrosis 3 (6%) 1 (2%) 4 (8%) 3 (6%) 2 (4%) Hepatocyte, centrilobular, hypertrophy 1 (2%) 8 (16%) 14 (28%) Serosa, fibrosis 1 (2%) Serosa, inflammation, chronic 1 (2%)
Mesentery (7) (6) (4) (4) (5) Accessory spleen 1 (14%) 1 (17%) 1 (20%) Necrosis, acute, focal 1 (17%) Fat, necrosis 6 (86%) 3 (50%) 3 (75%) 4 (100%) 4 (80%)
Pancreas (50) (48) (49) (50) Acinus, atrophy 17 (34%) 10 (21%) 14 (29%) 1 (2%) Acinus, hyperplasia 1 (2%) Artery, inflammation, granulomatous 1 (2%) 1 (2%)
a Number of animals examined microscopically at the site and the number of animals with lesion
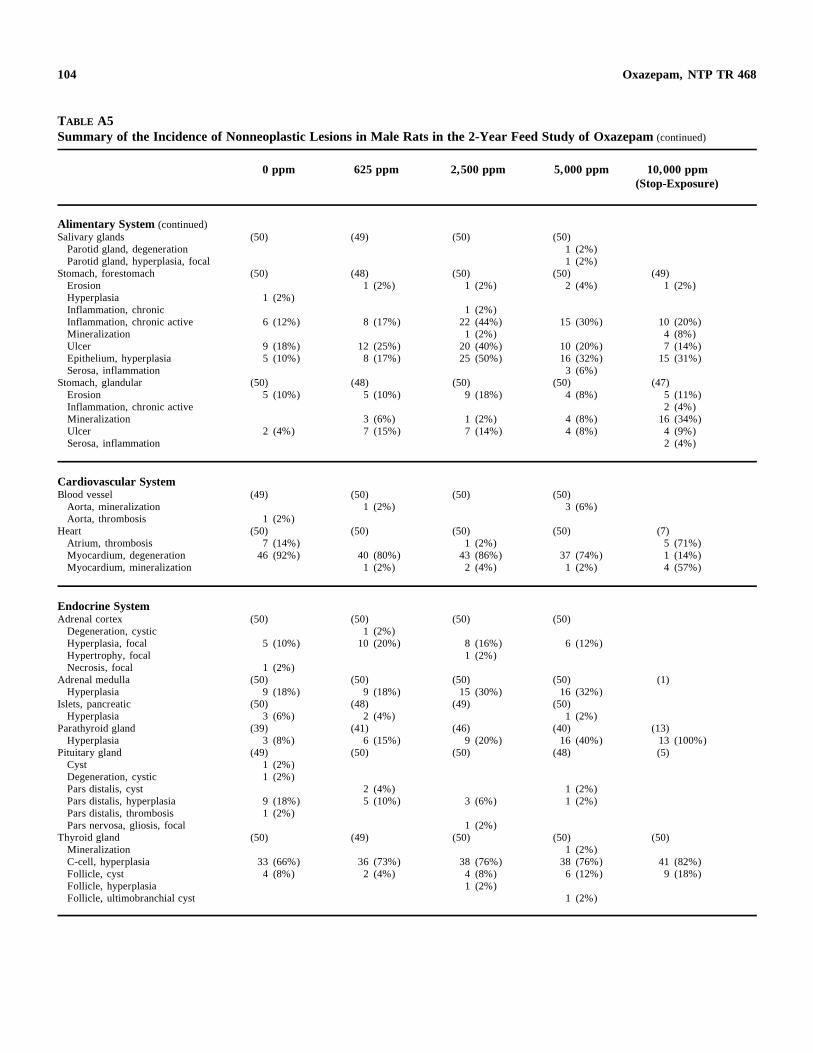
104 Oxazepam, NTP TR 468
TABLE A5 Summary of the Incidence of Nonneoplastic Lesions in Male Rats in the 2-Year Feed Study of Oxazepam (continued)
0 ppm 625 ppm 2,500 ppm 5,000 ppm 10,000 ppm (Stop-Exposure)
Alimentary System (continued) Salivary glands (50) (49) (50) (50)
Parotid gland, degeneration 1 (2%) Parotid gland, hyperplasia, focal 1 (2%)
Stomach, forestomach (50) (48) (50) (50) (49) Erosion 1 (2%) 1 (2%) 2 (4%) 1 (2%) Hyperplasia 1 (2%) Inflammation, chronic 1 (2%) Inflammation, chronic active 6 (12%) 8 (17%) 22 (44%) 15 (30%) 10 (20%) Mineralization 1 (2%) 4 (8%) Ulcer 9 (18%) 12 (25%) 20 (40%) 10 (20%) 7 (14%) Epithelium, hyperplasia 5 (10%) 8 (17%) 25 (50%) 16 (32%) 15 (31%) Serosa, inflammation 3 (6%)
Stomach, glandular (50) (48) (50) (50) (47) Erosion 5 (10%) 5 (10%) 9 (18%) 4 (8%) 5 (11%) Inflammation, chronic active 2 (4%) Mineralization 3 (6%) 1 (2%) 4 (8%) 16 (34%) Ulcer 2 (4%) 7 (15%) 7 (14%) 4 (8%) 4 (9%) Serosa, inflammation 2 (4%)
Cardiovascular System Blood vessel (49) (50) (50) (50)
Aorta, mineralization 1 (2%) 3 (6%) Aorta, thrombosis 1 (2%)
Heart (50) (50) (50) (50) (7) Atrium, thrombosis 7 (14%) 1 (2%) 5 (71%) Myocardium, degeneration 46 (92%) 40 (80%) 43 (86%) 37 (74%) 1 (14%) Myocardium, mineralization 1 (2%) 2 (4%) 1 (2%) 4 (57%)
Endocrine System Adrenal cortex (50) (50) (50) (50)
Degeneration, cystic 1 (2%) Hyperplasia, focal 5 (10%) 10 (20%) 8 (16%) 6 (12%) Hypertrophy, focal 1 (2%) Necrosis, focal 1 (2%)
Adrenal medulla (50) (50) (50) (50) (1) Hyperplasia 9 (18%) 9 (18%) 15 (30%) 16 (32%)
Islets, pancreatic (50) (48) (49) (50) Hyperplasia 3 (6%) 2 (4%) 1 (2%)
Parathyroid gland (39) (41) (46) (40) (13) Hyperplasia 3 (8%) 6 (15%) 9 (20%) 16 (40%) 13 (100%)
Pituitary gland (49) (50) (50) (48) (5) Cyst 1 (2%) Degeneration, cystic 1 (2%) Pars distalis, cyst 2 (4%) 1 (2%) Pars distalis, hyperplasia 9 (18%) 5 (10%) 3 (6%) 1 (2%) Pars distalis, thrombosis 1 (2%) Pars nervosa, gliosis, focal 1 (2%)
Thyroid gland (50) (49) (50) (50) (50) Mineralization 1 (2%) C-cell, hyperplasia 33 (66%) 36 (73%) 38 (76%) 38 (76%) 41 (82%) Follicle, cyst 4 (8%) 2 (4%) 4 (8%) 6 (12%) 9 (18%) Follicle, hyperplasia 1 (2%) Follicle, ultimobranchial cyst 1 (2%)
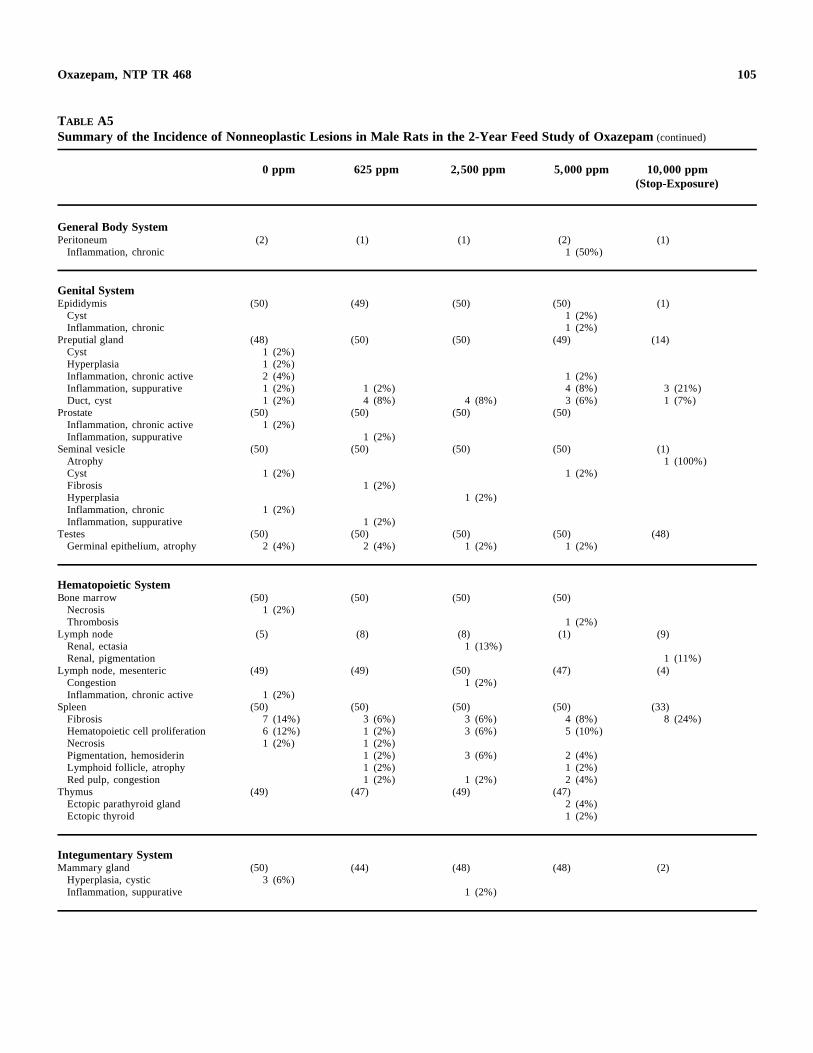
105 Oxazepam, NTP TR 468
TABLE A5 Summary of the Incidence of Nonneoplastic Lesions in Male Rats in the 2-Year Feed Study of Oxazepam (continued)
0 ppm 625 ppm 2,500 ppm 5,000 ppm 10,000 ppm (Stop-Exposure)
General Body System Peritoneum (2) (1) (1) (2) (1)
Inflammation, chronic 1 (50%)
Genital System Epididymis (50) (49) (50) (50) (1)
Cyst 1 (2%) Inflammation, chronic 1 (2%)
Preputial gland (48) (50) (50) (49) (14) Cyst 1 (2%) Hyperplasia 1 (2%) Inflammation, chronic active 2 (4%) 1 (2%) Inflammation, suppurative 1 (2%) 1 (2%) 4 (8%) 3 (21%) Duct, cyst 1 (2%) 4 (8%) 4 (8%) 3 (6%) 1 (7%)
Prostate (50) (50) (50) (50) Inflammation, chronic active 1 (2%) Inflammation, suppurative 1 (2%)
Seminal vesicle (50) (50) (50) (50) (1) Atrophy 1 (100%) Cyst 1 (2%) 1 (2%) Fibrosis 1 (2%) Hyperplasia 1 (2%) Inflammation, chronic 1 (2%) Inflammation, suppurative 1 (2%)
Testes (50) (50) (50) (50) (48) Germinal epithelium, atrophy 2 (4%) 2 (4%) 1 (2%) 1 (2%)
Hematopoietic System Bone marrow (50) (50) (50) (50)
Necrosis 1 (2%) Thrombosis 1 (2%)
Lymph node (5) (8) (8) (1) (9) Renal, ectasia 1 (13%) Renal, pigmentation 1 (11%)
Lymph node, mesenteric (49) (49) (50) (47) (4) Congestion 1 (2%) Inflammation, chronic active 1 (2%)
Spleen (50) (50) (50) (50) (33) Fibrosis 7 (14%) 3 (6%) 3 (6%) 4 (8%) 8 (24%) Hematopoietic cell proliferation 6 (12%) 1 (2%) 3 (6%) 5 (10%) Necrosis 1 (2%) 1 (2%) Pigmentation, hemosiderin 1 (2%) 3 (6%) 2 (4%) Lymphoid follicle, atrophy 1 (2%) 1 (2%) Red pulp, congestion 1 (2%) 1 (2%) 2 (4%)
Thymus (49) (47) (49) (47) Ectopic parathyroid gland 2 (4%) Ectopic thyroid 1 (2%)
Integumentary System Mammary gland (50) (44) (48) (48) (2)
Hyperplasia, cystic 3 (6%) Inflammation, suppurative 1 (2%)
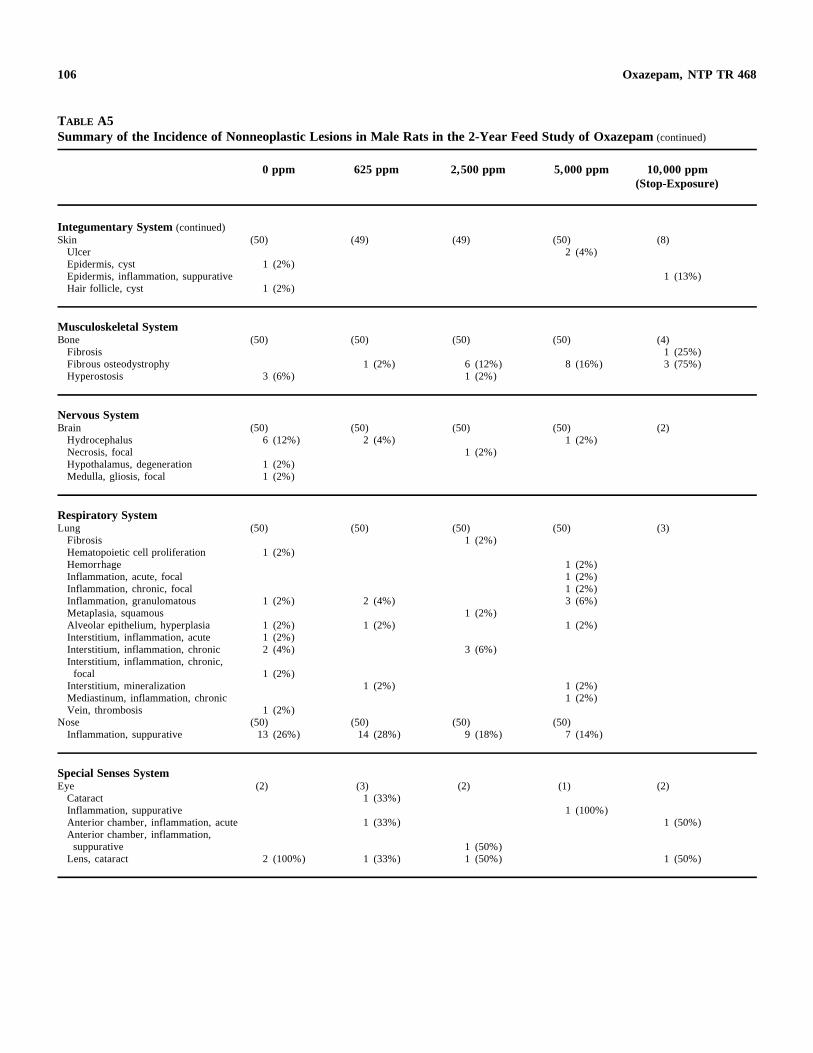
106 Oxazepam, NTP TR 468
TABLE A5 Summary of the Incidence of Nonneoplastic Lesions in Male Rats in the 2-Year Feed Study of Oxazepam (continued)
0 ppm 625 ppm 2,500 ppm 5,000 ppm 10,000 ppm (Stop-Exposure)
Integumentary System (continued) Skin (50) (49) (49) (50) (8)
Ulcer 2 (4%) Epidermis, cyst 1 (2%) Epidermis, inflammation, suppurative 1 (13%) Hair follicle, cyst 1 (2%)
Musculoskeletal System Bone (50) (50) (50) (50) (4)
Fibrosis 1 (25%) Fibrous osteodystrophy 1 (2%) 6 (12%) 8 (16%) 3 (75%) Hyperostosis 3 (6%) 1 (2%)
Nervous System Brain (50) (50) (50) (50) (2)
Hydrocephalus 6 (12%) 2 (4%) 1 (2%) Necrosis, focal 1 (2%) Hypothalamus, degeneration 1 (2%) Medulla, gliosis, focal 1 (2%)
Respiratory System Lung (50) (50) (50) (50) (3)
Fibrosis 1 (2%) Hematopoietic cell proliferation 1 (2%) Hemorrhage 1 (2%) Inflammation, acute, focal 1 (2%) Inflammation, chronic, focal 1 (2%) Inflammation, granulomatous 1 (2%) 2 (4%) 3 (6%) Metaplasia, squamous 1 (2%) Alveolar epithelium, hyperplasia 1 (2%) 1 (2%) 1 (2%) Interstitium, inflammation, acute 1 (2%) Interstitium, inflammation, chronic 2 (4%) 3 (6%) Interstitium, inflammation, chronic, focal 1 (2%)
Interstitium, mineralization 1 (2%) 1 (2%) Mediastinum, inflammation, chronic 1 (2%) Vein, thrombosis 1 (2%)
Nose (50) (50) (50) (50) Inflammation, suppurative 13 (26%) 14 (28%) 9 (18%) 7 (14%)
Special Senses System Eye (2) (3) (2) (1) (2)
Cataract 1 (33%) Inflammation, suppurative 1 (100%) Anterior chamber, inflammation, acute 1 (33%) 1 (50%) Anterior chamber, inflammation, suppurative 1 (50%) Lens, cataract 2 (100%) 1 (33%) 1 (50%) 1 (50%)
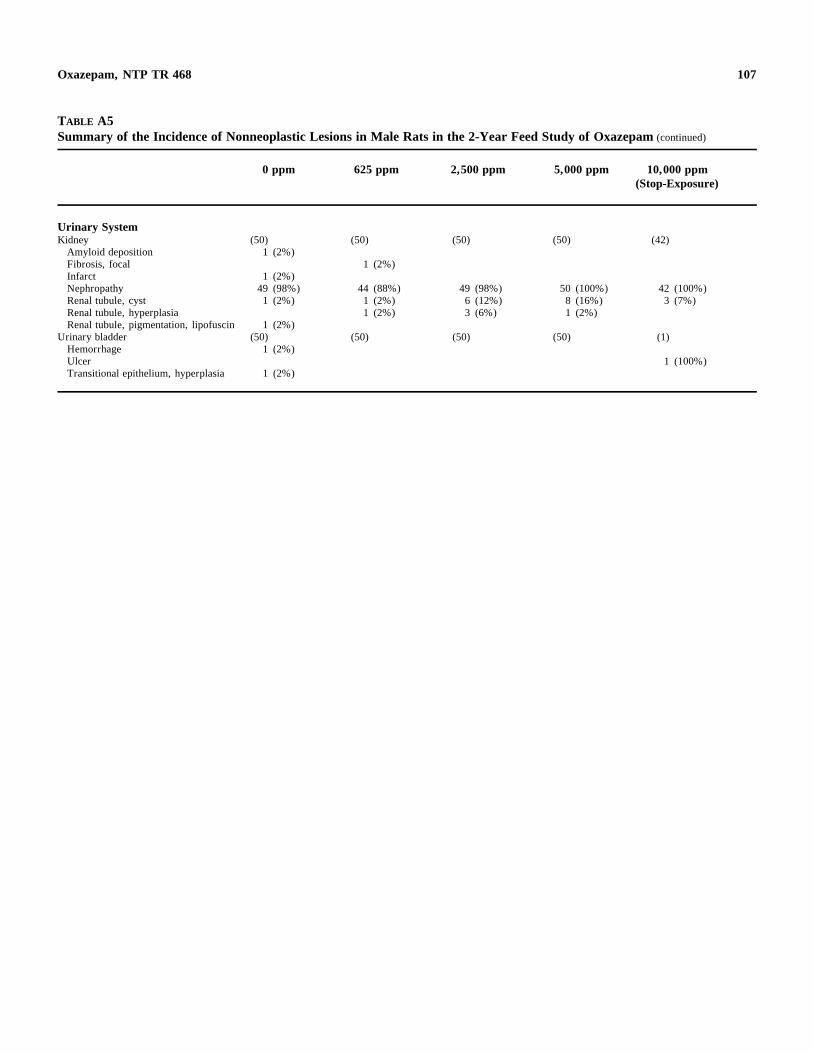
107 Oxazepam, NTP TR 468
TABLE A5 Summary of the Incidence of Nonneoplastic Lesions in Male Rats in the 2-Year Feed Study of Oxazepam (continued)
0 ppm 625 ppm 2,500 ppm 5,000 ppm 10,000 ppm (Stop-Exposure)
Urinary System Kidney (50) (50) (50) (50) (42)
Amyloid deposition 1 (2%) Fibrosis, focal 1 (2%) Infarct 1 (2%) Nephropathy 49 (98%) 44 (88%) 49 (98%) 50 (100%) 42 (100%) Renal tubule, cyst 1 (2%) 1 (2%) 6 (12%) 8 (16%) 3 (7%) Renal tubule, hyperplasia 1 (2%) 3 (6%) 1 (2%) Renal tubule, pigmentation, lipofuscin 1 (2%)
Urinary bladder (50) (50) (50) (50) (1) Hemorrhage 1 (2%) Ulcer 1 (100%) Transitional epithelium, hyperplasia 1 (2%)

108 Oxazepam, NTP TR 468
109
APPENDIX B SUMMARY OF LESIONS IN FEMALE RATS
IN THE 2-YEAR FEED STUDY OF OXAZEPAM
TABLE B1
TABLE B2
TABLE B3a
TABLE B3b
TABLE B4a
TABLE B4b
TABLE B5
Summary of the Incidence of Neoplasms in Female Rats in the 2-Year Feed Study of Oxazepam . . . . . . . . . . . . . . . . . . . . . . . . . . . . . . . . . . Individual Animal Tumor Pathology of Female Rats in the 2-Year Feed Study of Oxazepam . . . . . . . . . . . . . . . . . . . . . . . . . . . . . . . . . . Statistical Analysis of Primary Neoplasms in Female Rats in the 2-Year Feed Study of Oxazepam . . . . . . . . . . . . . . . . . . . . . . . . . . . . . . . . . . Statistical Analysis of Primary Neoplasms in Female Rats in the 2-Year Stop-Exposure Feed Study of Oxazepam . . . . . . . . . . . . . . . . . . . . . . . . Historical Incidence of Mammary Gland Neoplasms in Untreated Female F344/N Rats . . . . . . . . . . . . . . . . . . . . . . . . . . . . . . . . . . . . . . Historical Incidence of Pituitary Gland (Pars Distalis) Neoplasms in Untreated Female F344/N Rats . . . . . . . . . . . . . . . . . . . . . . . . . . . . . . . . . . . . . . Summary of the Incidence of Nonneoplastic Lesions in Female Rats in the 2-Year Feed Study of Oxazepam . . . . . . . . . . . . . . . . . . . . . . . . . . . . . . . . . .
111
114
134
139
142
142
143

110 Oxazepam, NTP TR 468
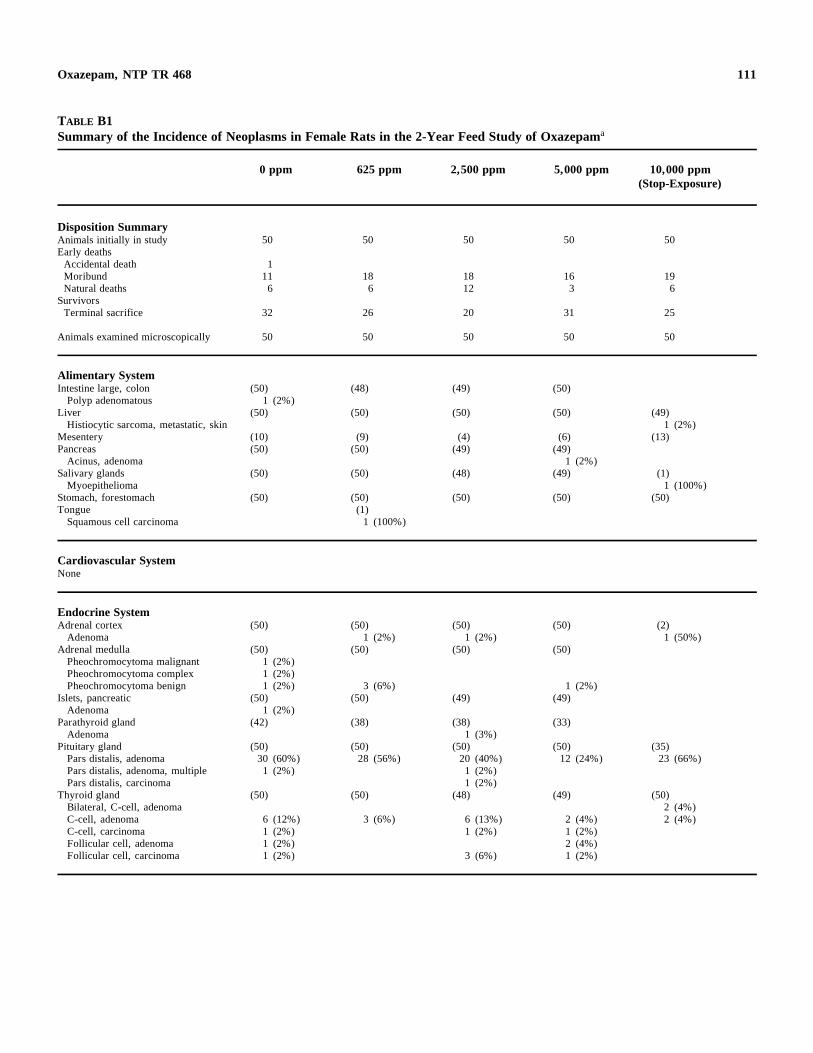
111 Oxazepam, NTP TR 468
TABLE B1 Summary of the Incidence of Neoplasms in Female Rats in the 2-Year Feed Study of Oxazepama
0 ppm 625 ppm 2,500 ppm 5,000 ppm 10,000 ppm (Stop-Exposure)
Disposition Summary Animals initially in study 50 50 50 50 50 Early deaths Accidental death 1 Moribund 11 18 18 16 19 Natural deaths 6 6 12 3 6
Survivors Terminal sacrifice 32 26 20 31 25
Animals examined microscopically 50 50 50 50 50
Alimentary System Intestine large, colon (50) (48) (49) (50)
Polyp adenomatous 1 (2%) Liver (50) (50) (50) (50) (49)
Histiocytic sarcoma, metastatic, skin 1 (2%) Mesentery (10) (9) (4) (6) (13) Pancreas (50) (50) (49) (49)
Acinus, adenoma 1 (2%) Salivary glands (50) (50) (48) (49) (1)
Myoepithelioma 1 (100%) Stomach, forestomach (50) (50) (50) (50) (50) Tongue (1)
Squamous cell carcinoma 1 (100%)
Cardiovascular System None
Endocrine System Adrenal cortex (50) (50) (50) (50) (2)
Adenoma 1 (2%) 1 (2%) 1 (50%) Adrenal medulla (50) (50) (50) (50)
Pheochromocytoma malignant 1 (2%) Pheochromocytoma complex 1 (2%) Pheochromocytoma benign 1 (2%) 3 (6%) 1 (2%)
Islets, pancreatic (50) (50) (49) (49) Adenoma 1 (2%)
Parathyroid gland (42) (38) (38) (33) Adenoma 1 (3%)
Pituitary gland (50) (50) (50) (50) (35) Pars distalis, adenoma 30 (60%) 28 (56%) 20 (40%) 12 (24%) 23 (66%) Pars distalis, adenoma, multiple 1 (2%) 1 (2%) Pars distalis, carcinoma 1 (2%)
Thyroid gland (50) (50) (48) (49) (50) Bilateral, C-cell, adenoma 2 (4%) C-cell, adenoma 6 (12%) 3 (6%) 6 (13%) 2 (4%) 2 (4%) C-cell, carcinoma 1 (2%) 1 (2%) 1 (2%) Follicular cell, adenoma 1 (2%) 2 (4%) Follicular cell, carcinoma 1 (2%) 3 (6%) 1 (2%)
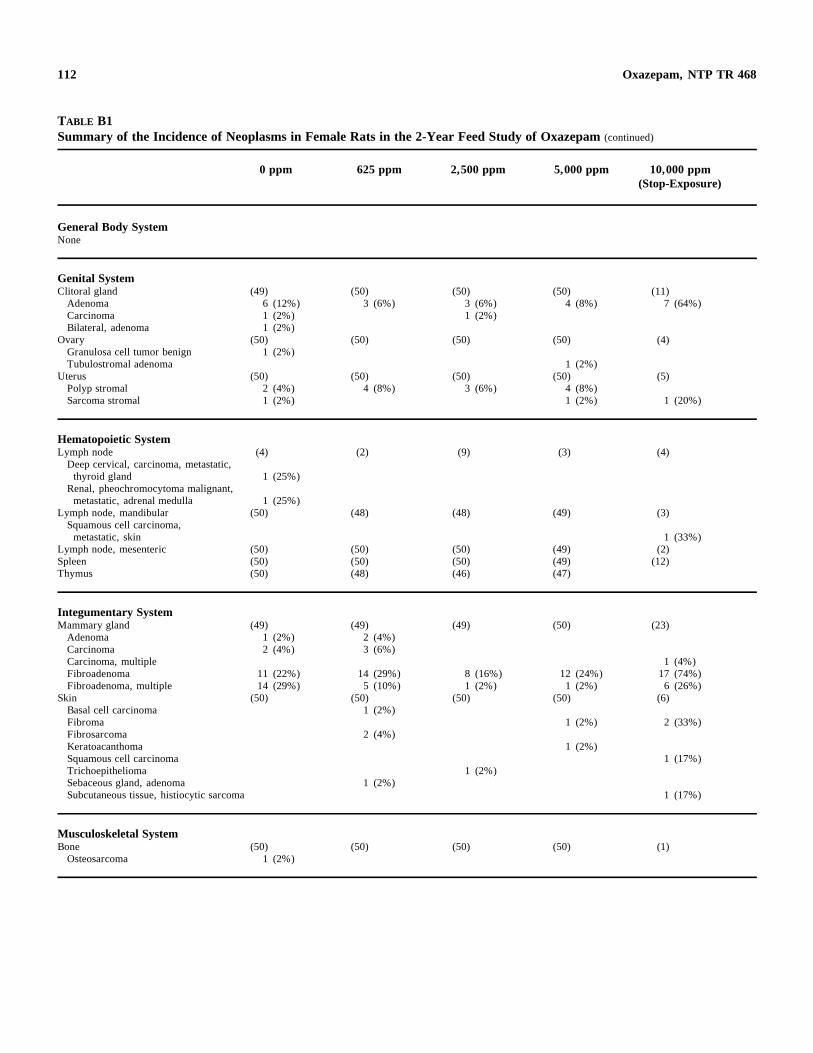
112 Oxazepam, NTP TR 468
TABLE B1 Summary of the Incidence of Neoplasms in Female Rats in the 2-Year Feed Study of Oxazepam (continued)
0 ppm 625 ppm 2,500 ppm 5,000 ppm 10,000 ppm (Stop-Exposure)
General Body System None
Genital System Clitoral gland (49) (50) (50) (50) (11)
Adenoma 6 (12%) 3 (6%) 3 (6%) 4 (8%) 7 (64%) Carcinoma 1 (2%) 1 (2%) Bilateral, adenoma 1 (2%)
Ovary (50) (50) (50) (50) (4) Granulosa cell tumor benign 1 (2%) Tubulostromal adenoma 1 (2%)
Uterus (50) (50) (50) (50) (5) Polyp stromal 2 (4%) 4 (8%) 3 (6%) 4 (8%) Sarcoma stromal 1 (2%) 1 (2%) 1 (20%)
Hematopoietic System Lymph node (4) (2) (9) (3) (4)
Deep cervical, carcinoma, metastatic, thyroid gland 1 (25%) Renal, pheochromocytoma malignant, metastatic, adrenal medulla 1 (25%)
Lymph node, mandibular (50) (48) (48) (49) (3) Squamous cell carcinoma, metastatic, skin 1 (33%)
Lymph node, mesenteric (50) (50) (50) (49) (2) Spleen (50) (50) (50) (49) (12) Thymus (50) (48) (46) (47)
Integumentary System Mammary gland (49) (49) (49) (50) (23)
Adenoma 1 (2%) 2 (4%) Carcinoma 2 (4%) 3 (6%) Carcinoma, multiple 1 (4%) Fibroadenoma 11 (22%) 14 (29%) 8 (16%) 12 (24%) 17 (74%) Fibroadenoma, multiple 14 (29%) 5 (10%) 1 (2%) 1 (2%) 6 (26%)
Skin (50) (50) (50) (50) (6) Basal cell carcinoma 1 (2%) Fibroma 1 (2%) 2 (33%) Fibrosarcoma 2 (4%) Keratoacanthoma 1 (2%) Squamous cell carcinoma 1 (17%) Trichoepithelioma 1 (2%) Sebaceous gland, adenoma 1 (2%) Subcutaneous tissue, histiocytic sarcoma 1 (17%)
Musculoskeletal System Bone (50) (50) (50) (50) (1)
Osteosarcoma 1 (2%)
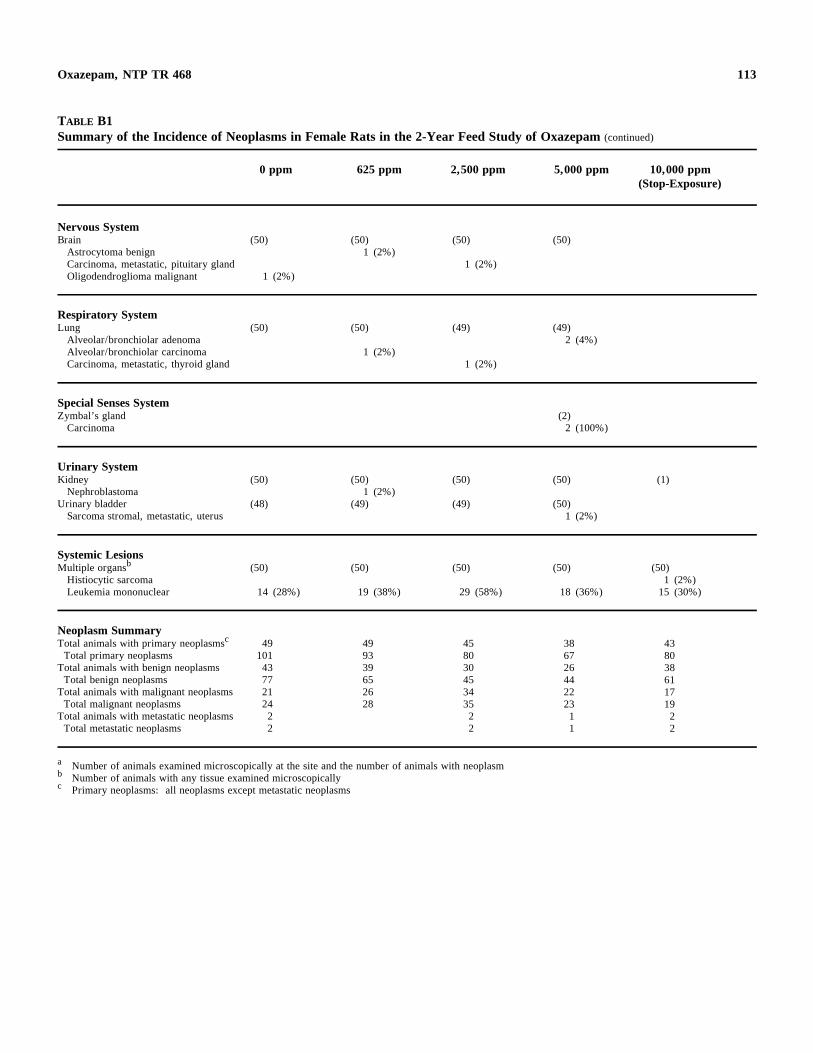
113
c
Oxazepam, NTP TR 468
TABLE B1 Summary of the Incidence of Neoplasms in Female Rats in the 2-Year Feed Study of Oxazepam (continued)
0 ppm 625 ppm 2,500 ppm 5,000 ppm 10,000 ppm (Stop-Exposure)
Nervous System Brain
Astrocytoma benign Carcinoma, metastatic, pituitary gland Oligodendroglioma malignant
(50)
1 (2%)
(50) 1 (2%)
(50)
1 (2%)
(50)
Respiratory System Lung
Alveolar/bronchiolar adenoma Alveolar/bronchiolar carcinoma Carcinoma, metastatic, thyroid gland
(50) (50)
1 (2%)
(49)
1 (2%)
(49) 2 (4%)
Special Senses System Zymbal’s gland
Carcinoma (2)
2 (100%)
Urinary System Kidney
Nephroblastoma Urinary bladder
Sarcoma stromal, metastatic, uterus
(50)
(48)
(50) 1 (2%)
(49)
(50)
(49)
(50)
(50) 1 (2%)
(1)
Systemic Lesions Multiple organsb
Histiocytic sarcoma Leukemia mononuclear
(50)
14 (28%)
(50)
19 (38%)
(50)
29 (58%)
(50)
18 (36%)
(50) 1 (2%)
15 (30%)
Neoplasm Summary Total animals with primary neoplasmsc
Total primary neoplasms Total animals with benign neoplasms
Total benign neoplasms Total animals with malignant neoplasms
Total malignant neoplasms Total animals with metastatic neoplasms
Total metastatic neoplasms
49 101 43 77 21 24 2 2
49 93 39 65 26 28
45 80 30 45 34 35 2 2
38 67 26 44 22 23 1 1
43 80 3861 1719 22
a Number of animals examined microscopically at the site and the number of animals with neoplasmb Number of animals with any tissue examined microscopically
Primary neoplasms: all neoplasms except metastatic neoplasms
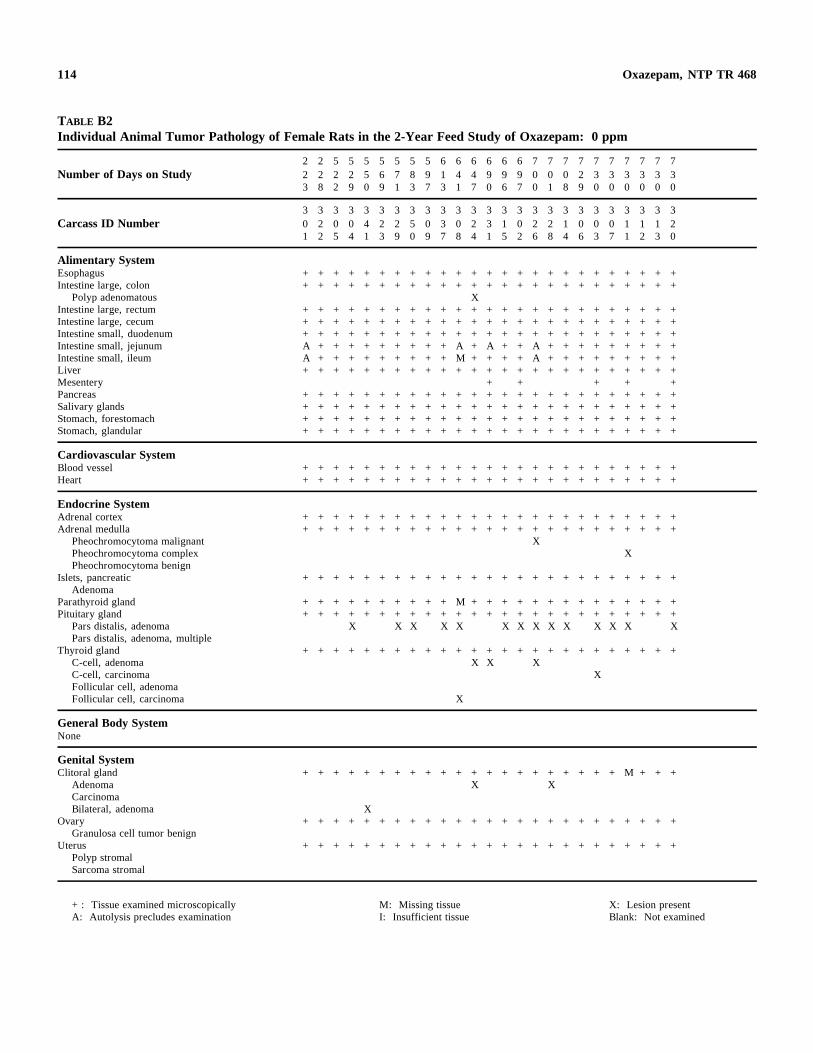
114 Oxazepam, NTP TR 468
TABLE B2 Individual Animal Tumor Pathology of Female Rats in the 2-Year Feed Study of Oxazepam: 0 ppm
Number of Days on Study 2 2 5 5 5 5 5 5 5 6 6 6 6 6 6 7 7 7 7 7 7 7 7 7 7 2 2 2 2 5 6 7 8 9 1 4 4 9 9 9 0 0 0 2 3 3 3 3 3 3 3 8 2 9 0 9 1 3 7 3 1 7 0 6 7 0 1 8 9 0 0 0 0 0 0
Carcass ID Number 3 3 3 3 3 3 3 3 3 3 3 3 3 3 3 3 3 3 3 3 3 3 3 3 3 0 2 0 0 4 2 2 5 0 3 0 2 3 1 0 2 2 1 0 0 0 1 1 1 2 1 2 5 4 1 3 9 0 9 7 8 4 1 5 2 6 8 4 6 3 7 1 2 3 0
Alimentary System Esophagus Intestine large, colon
Polyp adenomatous Intestine large, rectum Intestine large, cecum Intestine small, duodenum Intestine small, jejunum Intestine small, ileum Liver Mesentery Pancreas Salivary glands Stomach, forestomach Stomach, glandular
+ + + + + + + + + + + + + + + + + + + + + + + + + + + + + + + + + + + + + + + + + + + + + + + + + +
X + + + + + + + + + + + + + + + + + + + + + + + + + + + + + + + + + + + + + + + + + + + + + + + + + + + + + + + + + + + + + + + + + + + + + + + + + + + A + + + + + + + + + A + A + + A + + + + + + + + + A + + + + + + + + + M + + + + A + + + + + + + + + + + + + + + + + + + + + + + + + + + + + + + + + +
+ + + + + + + + + + + + + + + + + + + + + + + + + + + + + + + + + + + + + + + + + + + + + + + + + + + + + + + + + + + + + + + + + + + + + + + + + + + + + + + + + + + + + + + + + + + + + + + + + + + + + + + + +
Cardiovascular System Blood vessel + + + + + + + + + + + + + + + + + + + + + + + + + Heart + + + + + + + + + + + + + + + + + + + + + + + + +
Endocrine System Adrenal cortex + + + + + + + + + + + + + + + + + + + + + + + + + Adrenal medulla + + + + + + + + + + + + + + + + + + + + + + + + +
Pheochromocytoma malignant X Pheochromocytoma complex X Pheochromocytoma benign
Islets, pancreatic + + + + + + + + + + + + + + + + + + + + + + + + + Adenoma
Parathyroid gland + + + + + + + + + + M + + + + + + + + + + + + + + Pituitary gland + + + + + + + + + + + + + + + + + + + + + + + + +
Pars distalis, adenoma X X X X X X X X X X X X X X Pars distalis, adenoma, multiple
Thyroid gland + + + + + + + + + + + + + + + + + + + + + + + + + C-cell, adenoma X X X C-cell, carcinoma X Follicular cell, adenoma Follicular cell, carcinoma X
General Body System None
Genital System Clitoral gland + + + + + + + + + + + + + + + + + + + + + M + + +
Adenoma X X Carcinoma Bilateral, adenoma X
Ovary + + + + + + + + + + + + + + + + + + + + + + + + + Granulosa cell tumor benign
Uterus + + + + + + + + + + + + + + + + + + + + + + + + + Polyp stromal Sarcoma stromal
+: Tissue examined microscopically M: Missing tissue X: Lesion present A: Autolysis precludes examination I: Insufficient tissue Blank: Not examined
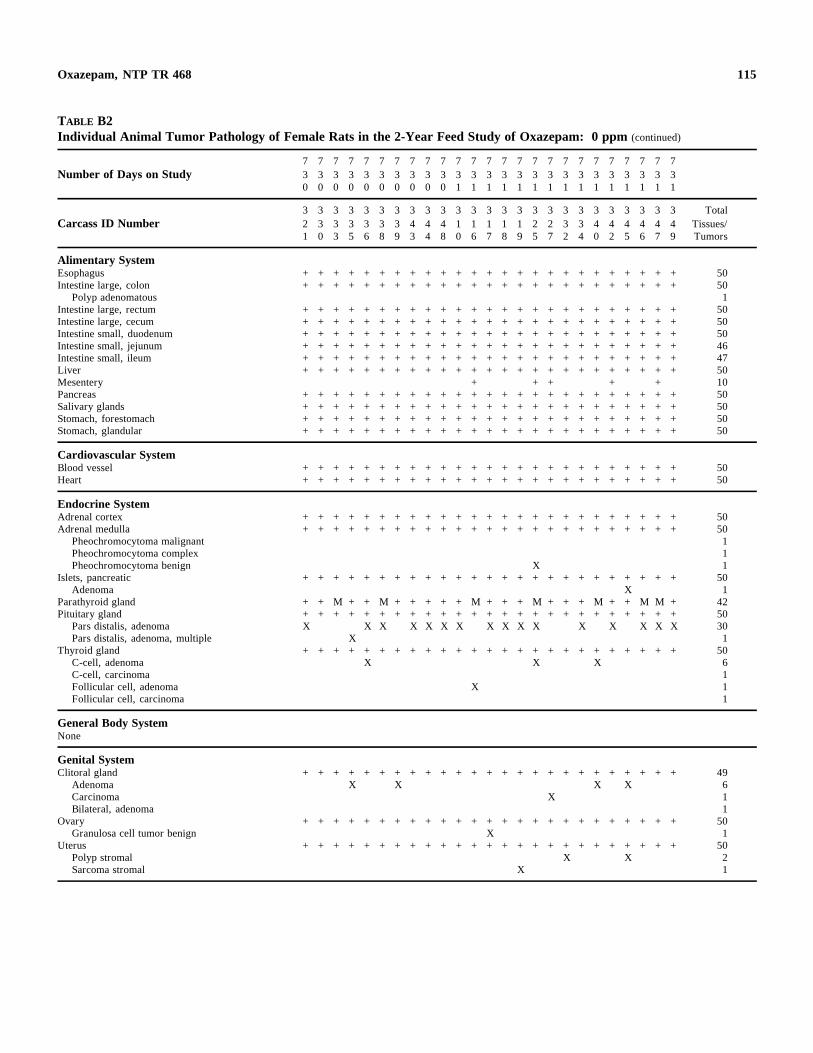
115 Oxazepam, NTP TR 468
TABLE B2 Individual Animal Tumor Pathology of Female Rats in the 2-Year Feed Study of Oxazepam: 0 ppm (continued)
7 7 7 7 7 7 7 7 7 7 7 7 7 7 7 7 7 7 7 7 7 7 7 7 7 Number of Days on Study 3 3 3 3 3 3 3 3 3 3 3 3 3 3 3 3 3 3 3 3 3 3 3 3 3
0 0 0 0 0 0 0 0 0 0 1 1 1 1 1 1 1 1 1 1 1 1 1 1 1
3 3 3 3 3 3 3 3 3 3 3 3 3 3 3 3 3 3 3 3 3 3 3 3 3 Total Carcass ID Number 2 3 3 3 3 3 3 4 4 4 1 1 1 1 1 2 2 3 3 4 4 4 4 4 4 Tissues/
1 0 3 5 6 8 9 3 4 8 0 6 7 8 9 5 7 2 4 0 2 5 6 7 9 Tumors
Alimentary System Esophagus + + + + + + + + + + + + + + + + + + + + + + + + + 50 Intestine large, colon + + + + + + + + + + + + + + + + + + + + + + + + + 50
Polyp adenomatous 1 Intestine large, rectum + + + + + + + + + + + + + + + + + + + + + + + + + 50 Intestine large, cecum + + + + + + + + + + + + + + + + + + + + + + + + + 50 Intestine small, duodenum + + + + + + + + + + + + + + + + + + + + + + + + + 50 Intestine small, jejunum + + + + + + + + + + + + + + + + + + + + + + + + + 46 Intestine small, ileum + + + + + + + + + + + + + + + + + + + + + + + + + 47 Liver + + + + + + + + + + + + + + + + + + + + + + + + + 50 Mesentery + + + + + 10 Pancreas + + + + + + + + + + + + + + + + + + + + + + + + + 50 Salivary glands + + + + + + + + + + + + + + + + + + + + + + + + + 50 Stomach, forestomach + + + + + + + + + + + + + + + + + + + + + + + + + 50 Stomach, glandular + + + + + + + + + + + + + + + + + + + + + + + + + 50
Cardiovascular System Blood vessel + + + + + + + + + + + + + + + + + + + + + + + + + 50 Heart + + + + + + + + + + + + + + + + + + + + + + + + + 50
Endocrine System Adrenal cortex + + + + + + + + + + + + + + + + + + + + + + + + + 50 Adrenal medulla + + + + + + + + + + + + + + + + + + + + + + + + + 50
Pheochromocytoma malignant 1 Pheochromocytoma complex 1 Pheochromocytoma benign X 1
Islets, pancreatic + + + + + + + + + + + + + + + + + + + + + + + + + 50 Adenoma X 1
Parathyroid gland + + M + + M + + + + + M + + + M + + + M + + M M + 42 Pituitary gland + + + + + + + + + + + + + + + + + + + + + + + + + 50
Pars distalis, adenoma X X X X X X X X X X X X X X X X 30 Pars distalis, adenoma, multiple X 1
Thyroid gland + + + + + + + + + + + + + + + + + + + + + + + + + 50 C-cell, adenoma X X X 6 C-cell, carcinoma 1 Follicular cell, adenoma X 1 Follicular cell, carcinoma 1
General Body System None
Genital System Clitoral gland + + + + + + + + + + + + + + + + + + + + + + + + + 49
Adenoma X X X X 6 Carcinoma X 1 Bilateral, adenoma 1
Ovary + + + + + + + + + + + + + + + + + + + + + + + + + 50 Granulosa cell tumor benign X 1
Uterus + + + + + + + + + + + + + + + + + + + + + + + + + 50 Polyp stromal X X 2 Sarcoma stromal X 1
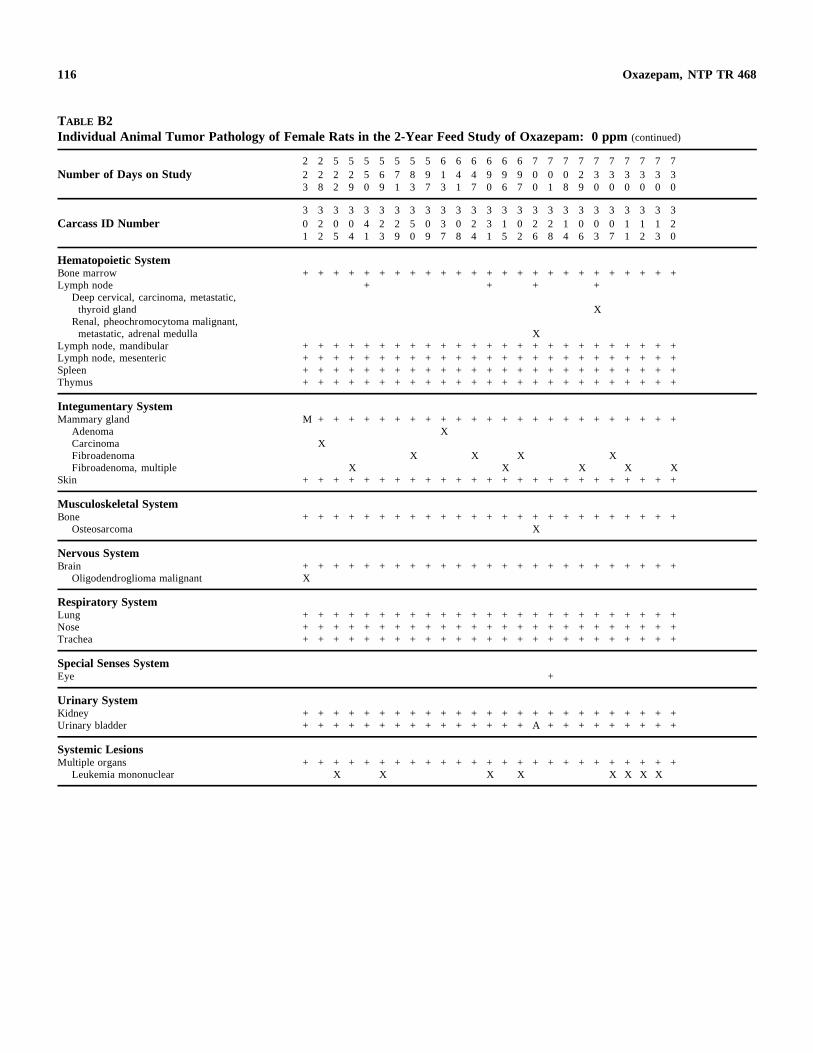
116 Oxazepam, NTP TR 468
TABLE B2 Individual Animal Tumor Pathology of Female Rats in the 2-Year Feed Study of Oxazepam: 0 ppm (continued)
Number of Days on Study 2 2 3
2 2 8
5 2 2
5 2 9
5 5 0
5 6 9
5 7 1
5 8 3
5 9 7
6 1 3
6 4 1
6 4 7
6 9 0
6 9 6
6 9 7
7 0 0
7 0 1
7 0 8
7 2 9
7 3 0
7 3 0
7 3 0
7 3 0
7 3 0
7 3 0
Carcass ID Number 3 0 1
3 2 2
3 0 5
3 0 4
3 4 1
3 2 3
3 2 9
3 5 0
3 0 9
3 3 7
3 0 8
3 2 4
3 3 1
3 1 5
3 0 2
3 2 6
3 2 8
3 1 4
3 0 6
3 0 3
3 0 7
3 1 1
3 1 2
3 1 3
3 2 0
Hematopoietic System Bone marrow Lymph node
Deep cervical, carcinoma, metastatic, thyroid gland
Renal, pheochromocytoma malignant, metastatic, adrenal medulla
Lymph node, mandibular Lymph node, mesenteric Spleen Thymus
+ + + + + + + + + + + + + + + + + + + + + + + + + + + + +
X
X + + + + + + + + + + + + + + + + + + + + + + + + + + + + + + + + + + + + + + + + + + + + + + + + + + + + + + + + + + + + + + + + + + + + + + + + + + + + + + + + + + + + + + + + + + + + + + + + + + + +
Integumentary System Mammary gland
Adenoma Carcinoma Fibroadenoma Fibroadenoma, multiple
Skin
M + + + + + + + + + + + + + + + + + + + + + + + + X
X X X X X
X X X X X + + + + + + + + + + + + + + + + + + + + + + + + +
Musculoskeletal System Bone
Osteosarcoma + + + + + + + + + + + + + + + + + + + + + + + + +
X
Nervous System Brain
Oligodendroglioma malignant + + + + + + + + + + + + + + + + + + + + + + + + + X
Respiratory System Lung Nose Trachea
+ + + + + + + + + + + + + + + + + + + + + + + + + + + + + + + + + + + + + + + + + + + + + + + + + + + + + + + + + + + + + + + + + + + + + + + + + + +
Special Senses System Eye +
Urinary System Kidney Urinary bladder
+ + + + + + + + + + + + + + + + + + + + + + + + + + + + + + + + + + + + + + + + A + + + + + + + + +
Systemic Lesions Multiple organs
Leukemia mononuclear + + + + + + + + + + + + + + + + + + + + + + + + +
X X X X X X X X
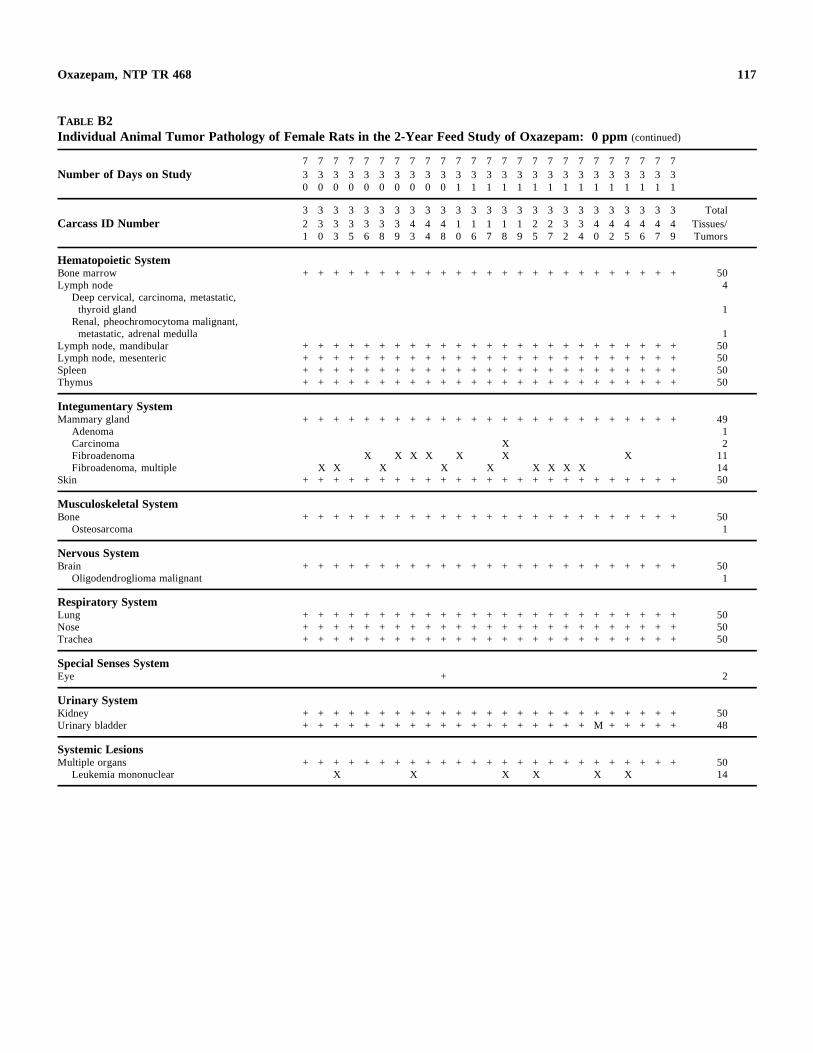
117 Oxazepam, NTP TR 468
TABLE B2 Individual Animal Tumor Pathology of Female Rats in the 2-Year Feed Study of Oxazepam: 0 ppm (continued)
7 7 7 7 7 7 7 7 7 7 7 7 7 7 7 7 7 7 7 7 7 7 7 7 7 Number of Days on Study 3 3 3 3 3 3 3 3 3 3 3 3 3 3 3 3 3 3 3 3 3 3 3 3 3
0 0 0 0 0 0 0 0 0 0 1 1 1 1 1 1 1 1 1 1 1 1 1 1 1
3 3 3 3 3 3 3 3 3 3 3 3 3 3 3 3 3 3 3 3 3 3 3 3 3 Total Carcass ID Number 2 3 3 3 3 3 3 4 4 4 1 1 1 1 1 2 2 3 3 4 4 4 4 4 4 Tissues/
1 0 3 5 6 8 9 3 4 8 0 6 7 8 9 5 7 2 4 0 2 5 6 7 9 Tumors
Hematopoietic System Bone marrow + + + + + + + + + + + + + + + + + + + + + + + + + 50 Lymph node 4
Deep cervical, carcinoma, metastatic, thyroid gland 1
Renal, pheochromocytoma malignant, metastatic, adrenal medulla 1
Lymph node, mandibular + + + + + + + + + + + + + + + + + + + + + + + + + 50 Lymph node, mesenteric + + + + + + + + + + + + + + + + + + + + + + + + + 50 Spleen + + + + + + + + + + + + + + + + + + + + + + + + + 50 Thymus + + + + + + + + + + + + + + + + + + + + + + + + + 50
Integumentary System Mammary gland + + + + + + + + + + + + + + + + + + + + + + + + + 49
Adenoma 1 Carcinoma X 2 Fibroadenoma X X X X X X X 11 Fibroadenoma, multiple X X X X X X X X X 14
Skin + + + + + + + + + + + + + + + + + + + + + + + + + 50
Musculoskeletal System Bone + + + + + + + + + + + + + + + + + + + + + + + + + 50
Osteosarcoma 1
Nervous System Brain + + + + + + + + + + + + + + + + + + + + + + + + + 50
Oligodendroglioma malignant 1
Respiratory System Lung + + + + + + + + + + + + + + + + + + + + + + + + + 50 Nose + + + + + + + + + + + + + + + + + + + + + + + + + 50 Trachea + + + + + + + + + + + + + + + + + + + + + + + + + 50
Special Senses System Eye +
Urinary System Kidney + + + + + + + + + + + + + + + + + + + + + + + + + 50 Urinary bladder + + + + + + + + + + + + + + + + + + + M + + + + + 48
Systemic Lesions Multiple organs + + + + + + + + + + + + + + + + + + + + + + + + + 50
Leukemia mononuclear X X X X X X 14
2
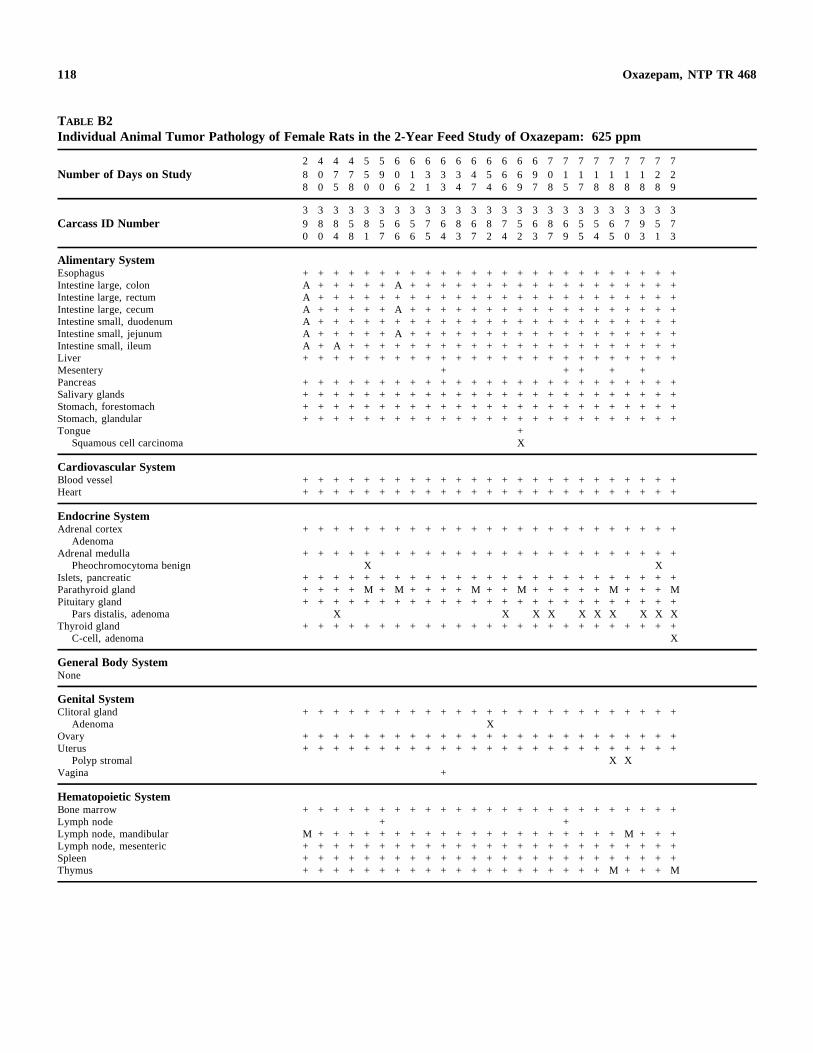
118 Oxazepam, NTP TR 468
TABLE B2 Individual Animal Tumor Pathology of Female Rats in the 2-Year Feed Study of Oxazepam: 625 ppm
Number of Days on Study 2 4 4 4 5 5 6 6 6 6 6 6 6 6 6 6 7 7 7 7 7 7 7 7 7 8 0 7 7 5 9 0 1 3 3 3 4 5 6 6 9 0 1 1 1 1 1 1 2 2 8 0 5 8 0 0 6 2 1 3 4 7 4 6 9 7 8 5 7 8 8 8 8 8 9
Carcass ID Number 3 3 3 3 3 3 3 3 3 3 3 3 3 3 3 3 3 3 3 3 3 3 3 3 3 9 8 8 5 8 5 6 5 7 6 8 6 8 7 5 6 8 6 5 5 6 7 9 5 7 0 0 4 8 1 7 6 6 5 4 3 7 2 4 2 3 7 9 5 4 5 0 3 1 3
Alimentary System Esophagus Intestine large, colon Intestine large, rectum Intestine large, cecum Intestine small, duodenum Intestine small, jejunum Intestine small, ileum Liver Mesentery Pancreas Salivary glands Stomach, forestomach Stomach, glandular Tongue
Squamous cell carcinoma
+ + + + + + + + + + + + + + + + + + + + + + + + + A + + + + + A + + + + + + + + + + + + + + + + + + A + + + + + + + + + + + + + + + + + + + + + + + + A + + + + + A + + + + + + + + + + + + + + + + + + A + + + + + + + + + + + + + + + + + + + + + + + + A + + + + + A + + + + + + + + + + + + + + + + + + A + A + + + + + + + + + + + + + + + + + + + + + + + + + + + + + + + + + + + + + + + + + + + + + + +
+ + + + + + + + + + + + + + + + + + + + + + + + + + + + + + + + + + + + + + + + + + + + + + + + + + + + + + + + + + + + + + + + + + + + + + + + + + + + + + + + + + + + + + + + + + + + + + + + + + + + + + + + +
+ X
Cardiovascular System Blood vessel + + + + + + + + + + + + + + + + + + + + + + + + + Heart + + + + + + + + + + + + + + + + + + + + + + + + +
Endocrine System Adrenal cortex + + + + + + + + + + + + + + + + + + + + + + + + +
Adenoma Adrenal medulla + + + + + + + + + + + + + + + + + + + + + + + + +
Pheochromocytoma benign X X Islets, pancreatic + + + + + + + + + + + + + + + + + + + + + + + + + Parathyroid gland + + + + M + M + + + + M + + M + + + + + M + + + M Pituitary gland + + + + + + + + + + + + + + + + + + + + + + + + +
Pars distalis, adenoma X X X X X X X X X X Thyroid gland + + + + + + + + + + + + + + + + + + + + + + + + +
C-cell, adenoma X
General Body System None
Genital System Clitoral gland + + + + + + + + + + + + + + + + + + + + + + + + +
Adenoma X Ovary + + + + + + + + + + + + + + + + + + + + + + + + + Uterus + + + + + + + + + + + + + + + + + + + + + + + + +
Polyp stromal X X Vagina +
Hematopoietic System Bone marrow + + + + + + + + + + + + + + + + + + + + + + + + + Lymph node + + Lymph node, mandibular M + + + + + + + + + + + + + + + + + + + + M + + + Lymph node, mesenteric + + + + + + + + + + + + + + + + + + + + + + + + + Spleen + + + + + + + + + + + + + + + + + + + + + + + + + Thymus + + + + + + + + + + + + + + + + + + + + M + + + M
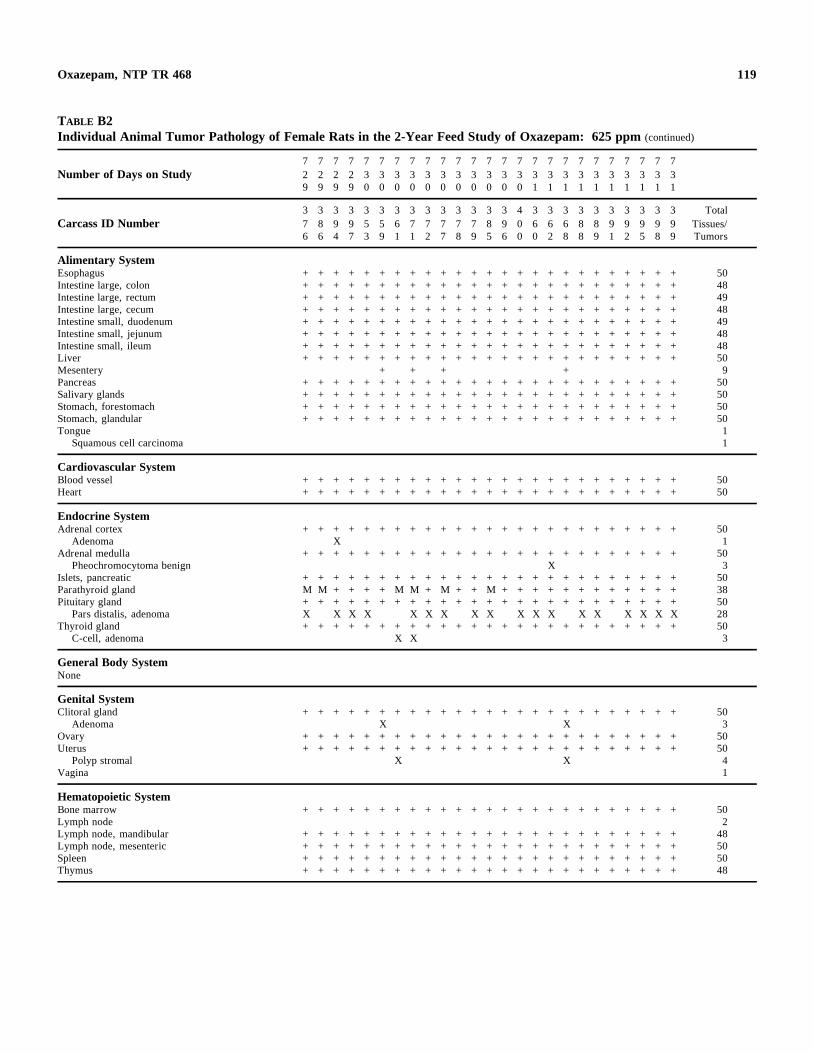
119 Oxazepam, NTP TR 468
TABLE B2 Individual Animal Tumor Pathology of Female Rats in the 2-Year Feed Study of Oxazepam: 625 ppm (continued)
7 7 7 7 7 7 7 7 7 7 7 7 7 7 7 7 7 7 7 7 7 7 7 7 7 Number of Days on Study 2 2 2 2 3 3 3 3 3 3 3 3 3 3 3 3 3 3 3 3 3 3 3 3 3
9 9 9 9 0 0 0 0 0 0 0 0 0 0 0 1 1 1 1 1 1 1 1 1 1
3 3 3 3 3 3 3 3 3 3 3 3 3 3 4 3 3 3 3 3 3 3 3 3 3 Total Carcass ID Number 7 8 9 9 5 5 6 7 7 7 7 7 8 9 0 6 6 6 8 8 9 9 9 9 9 Tissues/
6 6 4 7 3 9 1 1 2 7 8 9 5 6 0 0 2 8 8 9 1 2 5 8 9 Tumors
Alimentary System Esophagus + + + + + + + + + + + + + + + + + + + + + + + + + 50 Intestine large, colon + + + + + + + + + + + + + + + + + + + + + + + + + 48 Intestine large, rectum + + + + + + + + + + + + + + + + + + + + + + + + + 49 Intestine large, cecum + + + + + + + + + + + + + + + + + + + + + + + + + 48 Intestine small, duodenum + + + + + + + + + + + + + + + + + + + + + + + + + 49 Intestine small, jejunum + + + + + + + + + + + + + + + + + + + + + + + + + 48 Intestine small, ileum + + + + + + + + + + + + + + + + + + + + + + + + + 48 Liver + + + + + + + + + + + + + + + + + + + + + + + + + 50 Mesentery + + + + 9 Pancreas + + + + + + + + + + + + + + + + + + + + + + + + + 50 Salivary glands + + + + + + + + + + + + + + + + + + + + + + + + + 50 Stomach, forestomach + + + + + + + + + + + + + + + + + + + + + + + + + 50 Stomach, glandular + + + + + + + + + + + + + + + + + + + + + + + + + 50 Tongue 1
Squamous cell carcinoma 1
Cardiovascular System Blood vessel + + + + + + + + + + + + + + + + + + + + + + + + + 50 Heart + + + + + + + + + + + + + + + + + + + + + + + + + 50
Endocrine System Adrenal cortex + + + + + + + + + + + + + + + + + + + + + + + + + 50
Adenoma X 1 Adrenal medulla + + + + + + + + + + + + + + + + + + + + + + + + + 50
Pheochromocytoma benign X 3 Islets, pancreatic + + + + + + + + + + + + + + + + + + + + + + + + + 50 Parathyroid gland M M + + + + M M + M + + M + + + + + + + + + + + + 38 Pituitary gland + + + + + + + + + + + + + + + + + + + + + + + + + 50
Pars distalis, adenoma X X X X X X X X X X X X X X X X X X 28 Thyroid gland + + + + + + + + + + + + + + + + + + + + + + + + + 50
C-cell, adenoma X X 3
General Body System None
Genital System Clitoral gland + + + + + + + + + + + + + + + + + + + + + + + + + 50
Adenoma X X 3 Ovary + + + + + + + + + + + + + + + + + + + + + + + + + 50 Uterus + + + + + + + + + + + + + + + + + + + + + + + + + 50
Polyp stromal X X 4 Vagina 1
Hematopoietic System Bone marrow + + + + + + + + + + + + + + + + + + + + + + + + + 50 Lymph node 2 Lymph node, mandibular + + + + + + + + + + + + + + + + + + + + + + + + + 48 Lymph node, mesenteric + + + + + + + + + + + + + + + + + + + + + + + + + 50 Spleen + + + + + + + + + + + + + + + + + + + + + + + + + 50 Thymus + + + + + + + + + + + + + + + + + + + + + + + + + 48
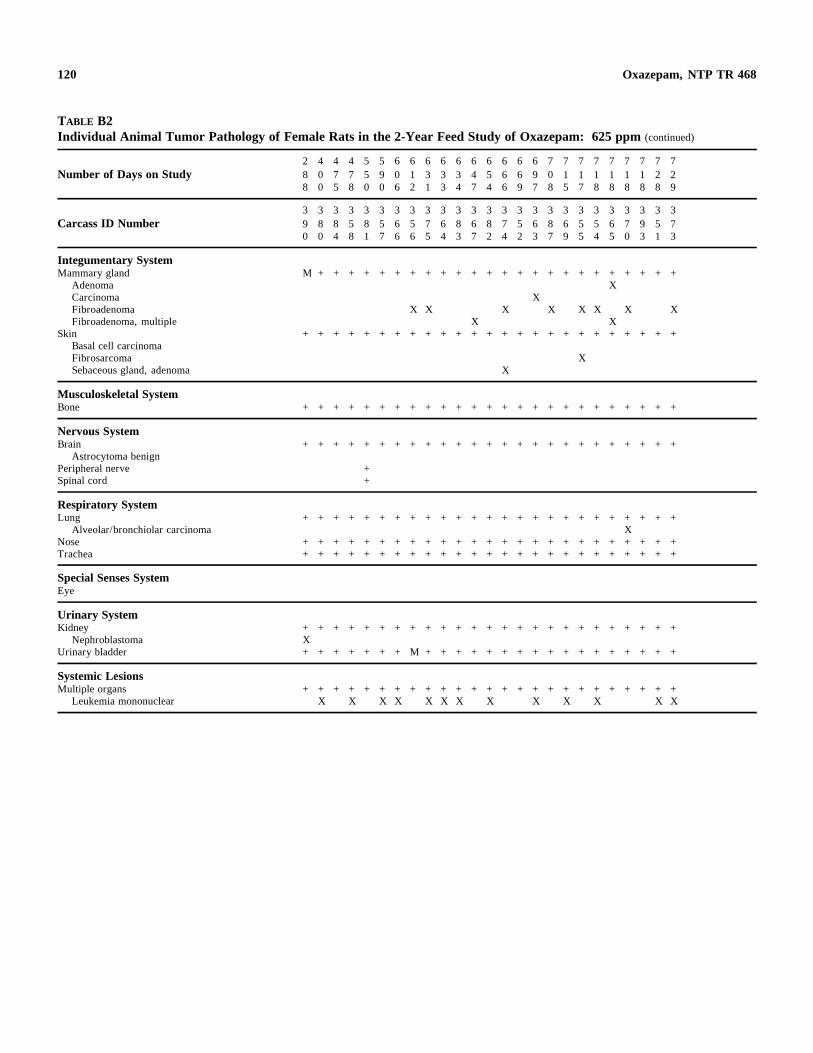
120 Oxazepam, NTP TR 468
TABLE B2 Individual Animal Tumor Pathology of Female Rats in the 2-Year Feed Study of Oxazepam: 625 ppm (continued)
Number of Days on Study 2 8 8
4 0 0
4 7 5
4 7 8
5 5 0
5 9 0
6 0 6
6 1 2
6 3 1
6 3 3
6 3 4
6 4 7
6 5 4
6 6 6
6 6 9
6 9 7
7 0 8
7 1 5
7 1 7
7 1 8
7 1 8
7 1 8
7 1 8
7 2 8
7 2 9
Carcass ID Number 3 9 0
3 8 0
3 8 4
3 5 8
3 8 1
3 5 7
3 6 6
3 5 6
3 7 5
3 6 4
3 8 3
3 6 7
3 8 2
3 7 4
3 5 2
3 6 3
3 8 7
3 6 9
3 5 5
3 5 4
3 6 5
3 7 0
3 9 3
3 5 1
3 7 3
Integumentary System Mammary gland M + + + + + + + + + + + + + + + + + + + + + + + +
Adenoma X Carcinoma X Fibroadenoma X X X X X X X X Fibroadenoma, multiple X X
Skin + + + + + + + + + + + + + + + + + + + + + + + + + Basal cell carcinoma Fibrosarcoma X Sebaceous gland, adenoma X
Musculoskeletal System Bone + + + + + + + + + + + + + + + + + + + + + + + + +
Nervous System Brain
Astrocytoma benign Peripheral nerve Spinal cord
+ + + + + + + + + + + + + + + + + + + + + + + + +
+ +
Respiratory System Lung
Alveolar/bronchiolar carcinoma Nose Trachea
Special Senses System Eye
+ + + + + + + + + + + + + + + + + + + + + + + + + X
+ + + + + + + + + + + + + + + + + + + + + + + + + + + + + + + + + + + + + + + + + + + + + + + + + +
Urinary System Kidney
Nephroblastoma Urinary bladder
+ + + + + + + + + + + + + + + + + + + + + + + + + X + + + + + + + M + + + + + + + + + + + + + + + + +
Systemic Lesions Multiple organs
Leukemia mononuclear + + + + + + + + + + + + + + + + + + + + + + + + +
X X X X X X X X X X X X X
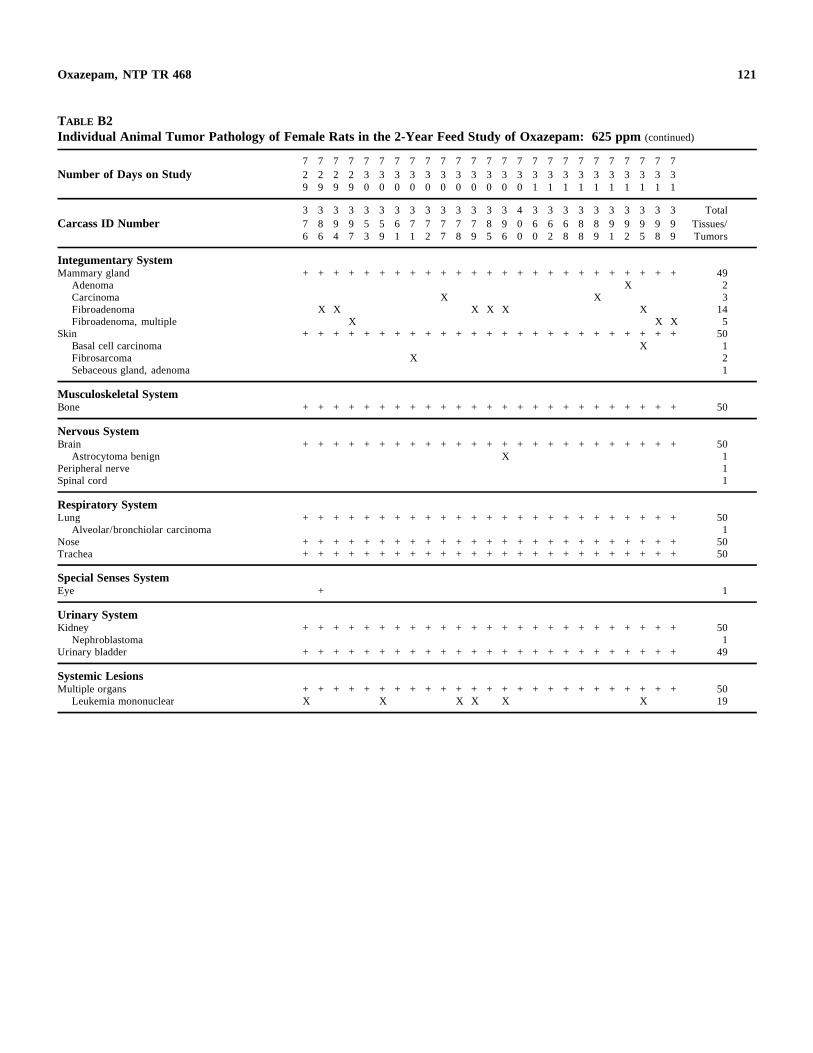
121 Oxazepam, NTP TR 468
TABLE B2 Individual Animal Tumor Pathology of Female Rats in the 2-Year Feed Study of Oxazepam: 625 ppm (continued)
7 7 7 7 7 7 7 7 7 7 7 7 7 7 7 7 7 7 7 7 7 7 7 7 7 Number of Days on Study 2 2 2 2 3 3 3 3 3 3 3 3 3 3 3 3 3 3 3 3 3 3 3 3 3
9 9 9 9 0 0 0 0 0 0 0 0 0 0 0 1 1 1 1 1 1 1 1 1 1
3 3 3 3 3 3 3 3 3 3 3 3 3 3 4 3 3 3 3 3 3 3 3 3 3 Total Carcass ID Number 7 8 9 9 5 5 6 7 7 7 7 7 8 9 0 6 6 6 8 8 9 9 9 9 9 Tissues/
6 6 4 7 3 9 1 1 2 7 8 9 5 6 0 0 2 8 8 9 1 2 5 8 9 Tumors
Integumentary System Mammary gland + + + + + + + + + + + + + + + + + + + + + + + + + 49
Adenoma X 2 Carcinoma X X 3 Fibroadenoma X X X X X X 14 Fibroadenoma, multiple X X X 5
Skin + + + + + + + + + + + + + + + + + + + + + + + + + 50 Basal cell carcinoma X 1 Fibrosarcoma X 2 Sebaceous gland, adenoma 1
Musculoskeletal System Bone + + + + + + + + + + + + + + + + + + + + + + + + +
Nervous System Brain + + + + + + + + + + + + + + + + + + + + + + + + + 50
Astrocytoma benign X 1 Peripheral nerve 1 Spinal cord 1
Respiratory System Lung + + + + + + + + + + + + + + + + + + + + + + + + + 50
Alveolar/bronchiolar carcinoma 1 Nose + + + + + + + + + + + + + + + + + + + + + + + + + 50 Trachea + + + + + + + + + + + + + + + + + + + + + + + + + 50
Special Senses System Eye +
Urinary System Kidney + + + + + + + + + + + + + + + + + + + + + + + + + 50
Nephroblastoma 1 Urinary bladder + + + + + + + + + + + + + + + + + + + + + + + + + 49
Systemic Lesions Multiple organs + + + + + + + + + + + + + + + + + + + + + + + + + 50
Leukemia mononuclear X X X X X X 19
50
1
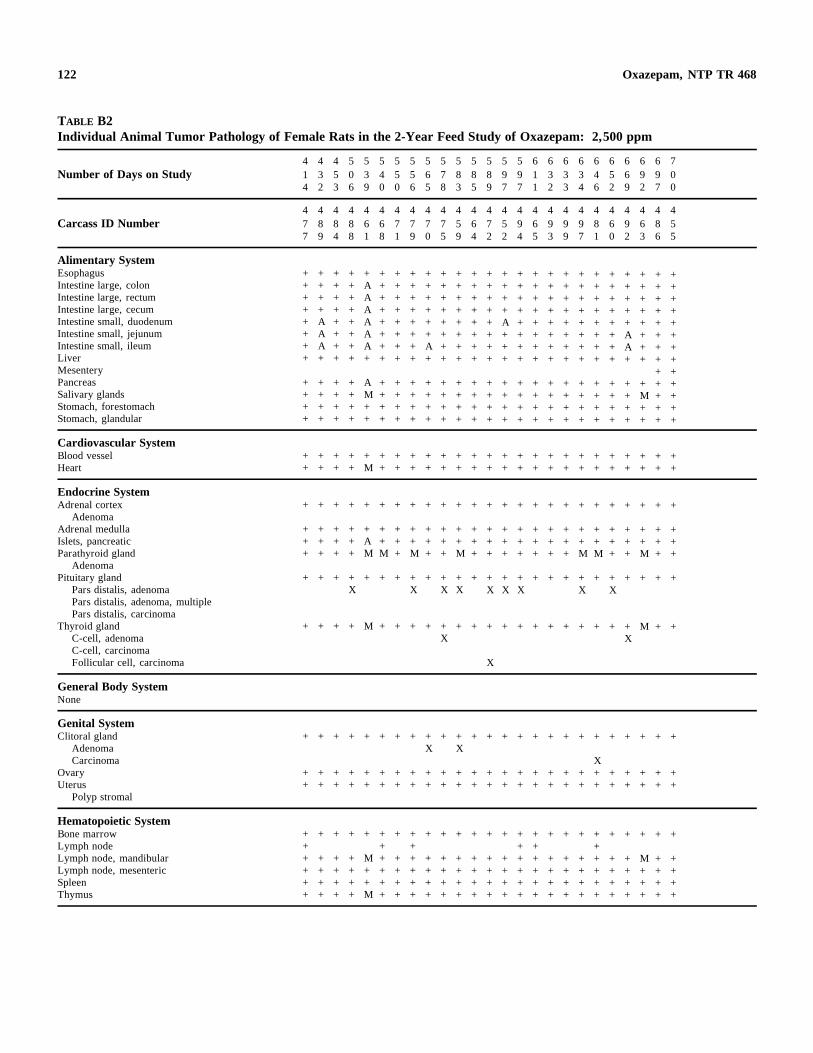
122 Oxazepam, NTP TR 468
TABLE B2 Individual Animal Tumor Pathology of Female Rats in the 2-Year Feed Study of Oxazepam: 2,500 ppm
Number of Days on Study 4 1 4
4 3 2
4 5 3
5 0 6
5 3 9
5 4 0
5 5 0
5 5 6
5 6 5
5 7 8
5 8 3
5 8 5
5 8 9
5 9 7
5 9 7
6 1 1
6 3 2
6 3 3
6 3 4
6 4 6
6 5 2
6 6 9
6 9 2
6 9 7
7 0 0
Carcass ID Number 4 7 7
4 8 9
4 8 4
4 8 8
4 6 1
4 6 8
4 7 1
4 7 9
4 7 0
4 7 5
4 5 9
4 6 4
4 7 2
4 5 2
4 9 4
4 6 5
4 9 3
4 9 9
4 9 7
4 8 1
4 6 0
4 9 2
4 6 3
4 8 6
4 5 5
Alimentary System Esophagus Intestine large, colon Intestine large, rectum Intestine large, cecum Intestine small, duodenum Intestine small, jejunum Intestine small, ileum Liver Mesentery Pancreas Salivary glands Stomach, forestomach Stomach, glandular
+ + + + + + + +
+ + + +
+ + + + A A A +
+ + + +
+ + + + + + + +
+ + + +
+ + + + + + + +
+ + + +
+ A A A A A A +
A M + +
+ + + + + + + +
+ + + +
+ + + + + + + +
+ + + +
+ + + + + + + +
+ + + +
+ + + + + + A +
+ + + +
+ + + + + + + +
+ + + +
+ + + + + + + +
+ + + +
+ + + + + + + +
+ + + +
+ + + + + + + +
+ + + +
+ + + + A + + +
+ + + +
+ + + + + + + +
+ + + +
+ + + + + + + +
+ + + +
+ + + + + + + +
+ + + +
+ + + + + + + +
+ + + +
+ + + + + + + +
+ + + +
+ + + + + + + +
+ + + +
+ + + + + + + +
+ + + +
+ + + + + A A +
+ + + +
+ + + + + + + +
+ M + +
+ + + + + + + + + + + + +
+ + + + + + + + + + + + +
Cardiovascular System Blood vessel + Heart +
Endocrine System Adrenal cortex +
Adenoma Adrenal medulla + Islets, pancreatic + Parathyroid gland +
Adenoma Pituitary gland +
Pars distalis, adenoma Pars distalis, adenoma, multiple Pars distalis, carcinoma
Thyroid gland + C-cell, adenoma C-cell, carcinoma Follicular cell, carcinoma
General Body System None
+ +
+
+ + +
+
+
+ +
+
+ + +
+
+
+ +
+
+ + +
+ X
+
+ M
+
+ A M
+
M
+ +
+
+ + M
+
+
+ +
+
+ + +
+
+
+ +
+
+ + M
+ X
+
+ +
+
+ + +
+
+
+ +
+
+ + +
+ X
+ X
+ +
+
+ + M
+ X
+
+ +
+
+ + +
+
+
+ +
+
+ + +
+ X
+
X
+ +
+
+ + +
+ X
+
+ +
+
+ + +
+ X
+
+ +
+
+ + +
+
+
+ +
+
+ + +
+
+
+ +
+
+ + +
+
+
+ +
+
+ + M
+ X
+
+ +
+
+ + M
+
+
+ +
+
+ + +
+ X
+
+ +
+
+ + +
+
+ X
+ +
+
+ + M
+
M
+ +
+
+ + +
+
+
+ +
+
+ + +
+
+
Genital System Clitoral gland +
Adenoma Carcinoma
Ovary + Uterus +
Polyp stromal
+
+ +
+
+ +
+
+ +
+
+ +
+
+ +
+
+ +
+
+ +
+ X
+ +
+
+ +
+ X
+ +
+
+ +
+
+ +
+
+ +
+
+ +
+
+ +
+
+ +
+
+ +
+
+ +
+
X + +
+
+ +
+
+ +
+
+ +
+
+ +
+
+ +
Hematopoietic System Bone marrow + Lymph node + Lymph node, mandibular + Lymph node, mesenteric + Spleen + Thymus +
+
+ + + +
+
+ + + +
+
+ + + +
+
M + + M
+ + + + + +
+
+ + + +
+ + + + + +
+
+ + + +
+
+ + + +
+
+ + + +
+
+ + + +
+
+ + + +
+
+ + + +
+ + + + + +
+ + + + + +
+
+ + + +
+
+ + + +
+
+ + + +
+ + + + + +
+
+ + + +
+
+ + + +
+
M + + +
+
+ + + +
+
+ + + +
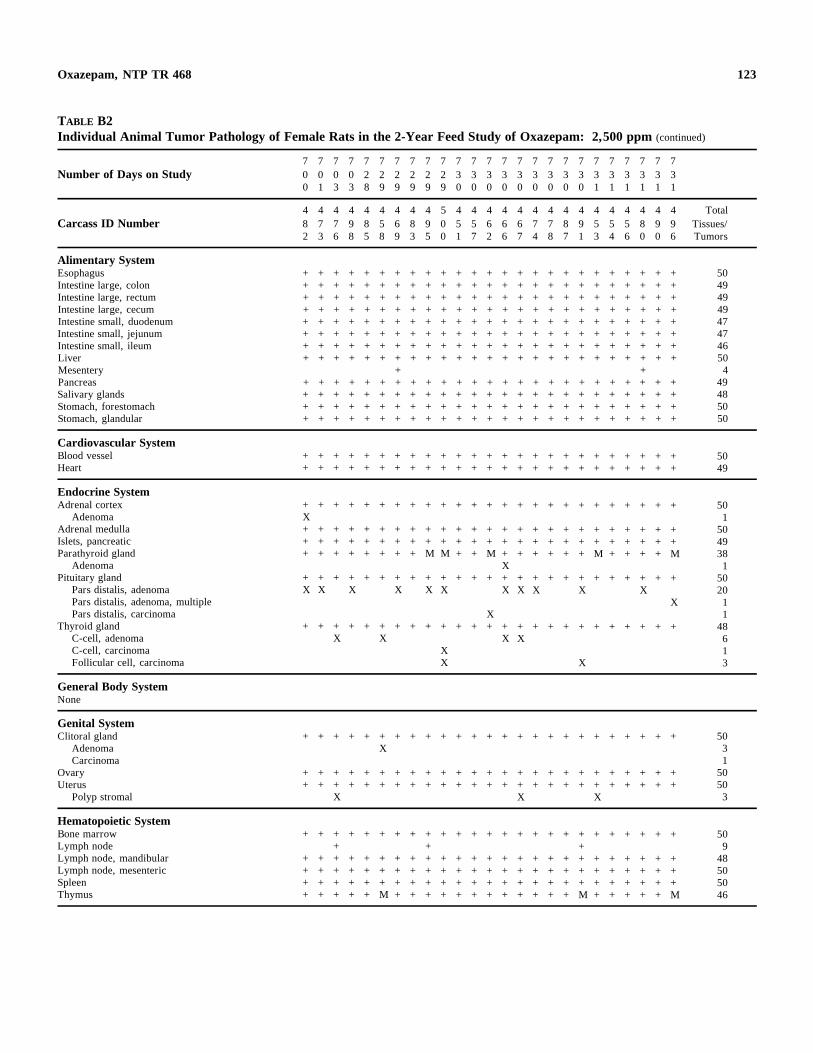
123 Oxazepam, NTP TR 468
TABLE B2 Individual Animal Tumor Pathology of Female Rats in the 2-Year Feed Study of Oxazepam: 2,500 ppm (continued)
7 7 7 7 7 7 7 7 7 7 7 7 7 7 7 7 7 7 7 7 7 7 7 7 7 Number of Days on Study 0 0 0 0 2 2 2 2 2 2 3 3 3 3 3 3 3 3 3 3 3 3 3 3 3
0 1 3 3 8 9 9 9 9 9 0 0 0 0 0 0 0 0 0 1 1 1 1 1 1
4 4 4 4 4 4 4 4 4 5 4 4 4 4 4 4 4 4 4 4 4 4 4 4 4 Total Carcass ID Number 8 7 7 9 8 5 6 8 9 0 5 5 6 6 6 7 7 8 9 5 5 5 8 9 9 Tissues/
2 3 6 8 5 8 9 3 5 0 1 7 2 6 7 4 8 7 1 3 4 6 0 0 6 Tumors
Alimentary System Esophagus + + + + + + + + + + + + + + + + + + + + + + + + + 50 Intestine large, colon + + + + + + + + + + + + + + + + + + + + + + + + + 49 Intestine large, rectum + + + + + + + + + + + + + + + + + + + + + + + + + 49 Intestine large, cecum + + + + + + + + + + + + + + + + + + + + + + + + + 49 Intestine small, duodenum + + + + + + + + + + + + + + + + + + + + + + + + + 47 Intestine small, jejunum + + + + + + + + + + + + + + + + + + + + + + + + + 47 Intestine small, ileum + + + + + + + + + + + + + + + + + + + + + + + + + 46 Liver + + + + + + + + + + + + + + + + + + + + + + + + + 50 Mesentery + + 4 Pancreas + + + + + + + + + + + + + + + + + + + + + + + + + 49 Salivary glands + + + + + + + + + + + + + + + + + + + + + + + + + 48 Stomach, forestomach + + + + + + + + + + + + + + + + + + + + + + + + + 50 Stomach, glandular + + + + + + + + + + + + + + + + + + + + + + + + + 50
Cardiovascular System Blood vessel + Heart +
Endocrine System Adrenal cortex +
Adenoma XAdrenal medulla + Islets, pancreatic + Parathyroid gland +
Adenoma Pituitary gland +
Pars distalis, adenoma X Pars distalis, adenoma, multiple Pars distalis, carcinoma
Thyroid gland + C-cell, adenoma C-cell, carcinoma Follicular cell, carcinoma
General Body System None
+ +
+
+ + +
+ X
+
+ +
+
+ + +
+
+ X
+ +
+
+ + +
+ X
+
+ +
+
+ + +
+
+
+ +
+
+ + +
+
+ X
+ +
+
+ + +
+ X
+
+ +
+
+ + +
+
+
+ +
+
+ + M
+ X
+
+ +
+
+ + M
+ X
+
XX
+ +
+
+ + +
+
+
+ +
+
+ + +
+
+
+ +
+
+ + M
+
X+
+ +
+
+ + + X+ X
+ X
+ +
+
+ + +
+ X
+ X
+ +
+
+ + +
+ X
+
+ +
+
+ + +
+
+
+ +
+
+ + +
+
+
+ +
+
+ + +
+ X
+
X
+ +
+
+ + M
+
+
+ +
+
+ + +
+
+
+ +
+
+ + +
+
+
+ +
+
+ + +
+ X
+
+ +
+
+ + +
+
+
+ 50 + 49
+ 50 1
+ 50 + 49 M 38
1 + 50
20 X 1
1 + 48
6 1 3
Genital System Clitoral gland +
Adenoma Carcinoma
Ovary + Uterus +
Polyp stromal
+
+ +
+
+ + X
+
+ +
+
+ +
+ X
+ +
+
+ +
+
+ +
+
+ +
+
+ +
+
+ +
+
+ +
+
+ +
+
+ +
+
+ + X
+
+ +
+
+ +
+
+ +
+
+ +
+
+ + X
+
+ +
+
+ +
+
+ +
+
+ +
+ 50 3 1
+ 50 + 50
3
Hematopoietic System Bone marrow + Lymph node Lymph node, mandibular + Lymph node, mesenteric + Spleen + Thymus +
+
+ + + +
+ + + + + +
+
+ + + +
+
+ + + +
+
+ + + M
+
+ + + +
+
+ + + +
+ + + + + +
+
+ + + +
+
+ + + +
+
+ + + +
+
+ + + +
+
+ + + +
+
+ + + +
+
+ + + +
+
+ + + +
+
+ + + +
+ ++ + + M
+
+ + + +
+
+ + + +
+
+ + + +
+
+ + + +
+
+ + + +
+ 50 9
+ 48 + 50 + 50 M 46
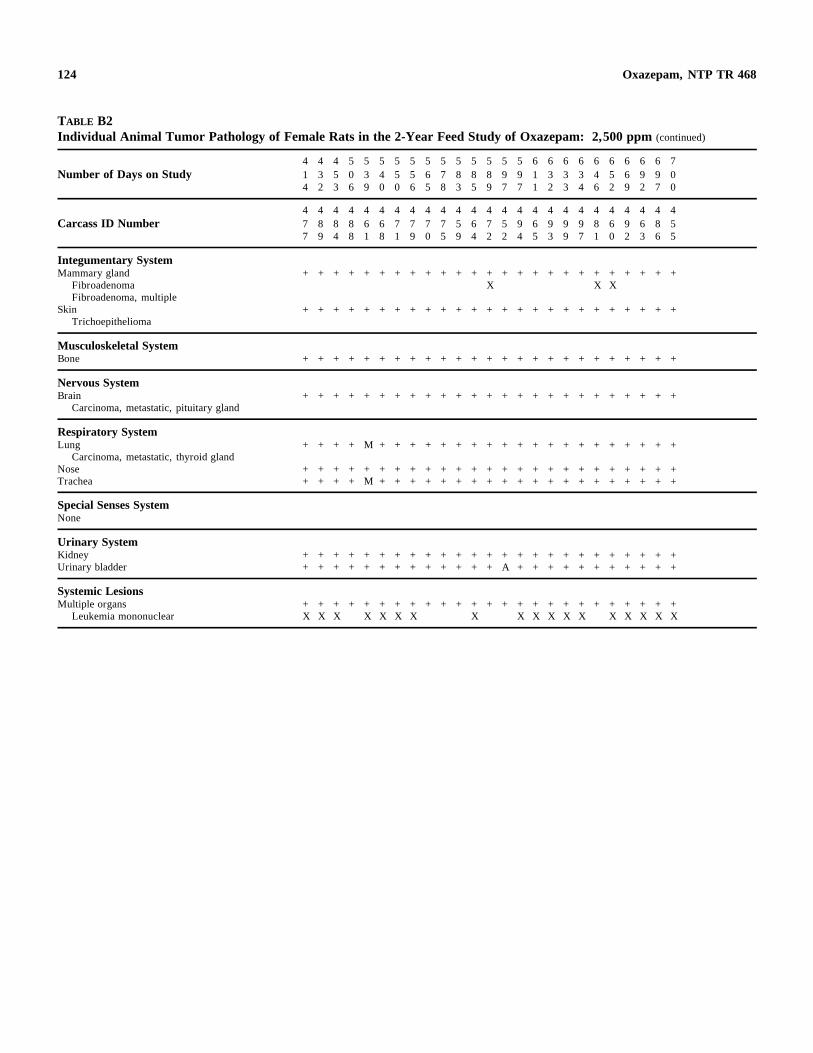
124 Oxazepam, NTP TR 468
TABLE B2 Individual Animal Tumor Pathology of Female Rats in the 2-Year Feed Study of Oxazepam: 2,500 ppm (continued)
Number of Days on Study 4 1 4
4 3 2
4 5 3
5 0 6
5 3 9
5 4 0
5 5 0
5 5 6
5 6 5
5 7 8
5 8 3
5 8 5
5 8 9
5 9 7
5 9 7
6 1 1
6 3 2
6 3 3
6 3 4
6 4 6
6 5 2
6 6 9
6 9 2
6 9 7
7 0 0
Carcass ID Number 4 7 7
4 8 9
4 8 4
4 8 8
4 6 1
4 6 8
4 7 1
4 7 9
4 7 0
4 7 5
4 5 9
4 6 4
4 7 2
4 5 2
4 9 4
4 6 5
4 9 3
4 9 9
4 9 7
4 8 1
4 6 0
4 9 2
4 6 3
4 8 6
4 5 5
Integumentary System Mammary gland
Fibroadenoma Fibroadenoma, multiple
Skin Trichoepithelioma
+
+
+
+
+
+
+
+
+
+
+
+
+
+
+
+
+
+
+
+
+
+
+
+
+ X
+
+
+
+
+
+
+
+
+
+
+
+
+
+ X
+
+ X
+
+
+
+
+
+
+
+
+
Musculoskeletal System Bone + + + + + + + + + + + + + + + + + + + + + + + + +
Nervous System Brain +
Carcinoma, metastatic, pituitary gland
Respiratory System Lung +
Carcinoma, metastatic, thyroid gland Nose + Trachea +
Special Senses System None
Urinary System Kidney + Urinary bladder +
+
+
+ +
+ +
+
+
+ +
+ +
+
+
+ +
+ +
+
M
+ M
+ +
+
+
+ +
+ +
+
+
+ +
+ +
+
+
+ +
+ +
+
+
+ +
+ +
+
+
+ +
+ +
+
+
+ +
+ +
+
+
+ +
+ +
+
+
+ +
+ +
+
+
+ +
+ A
+
+
+ +
+ +
+
+
+ +
+ +
+
+
+ +
+ +
+
+
+ +
+ +
+
+
+ +
+ +
+
+
+ +
+ +
+
+
+ +
+ +
+
+
+ +
+ +
+
+
+ +
+ +
+
+
+ +
+ +
+
+
+ +
+ +
Systemic Lesions Multiple organs + + + + + + + + + + + + + + + + + + + + + + + + +
Leukemia mononuclear X X X X X X X X X X X X X X X X X X
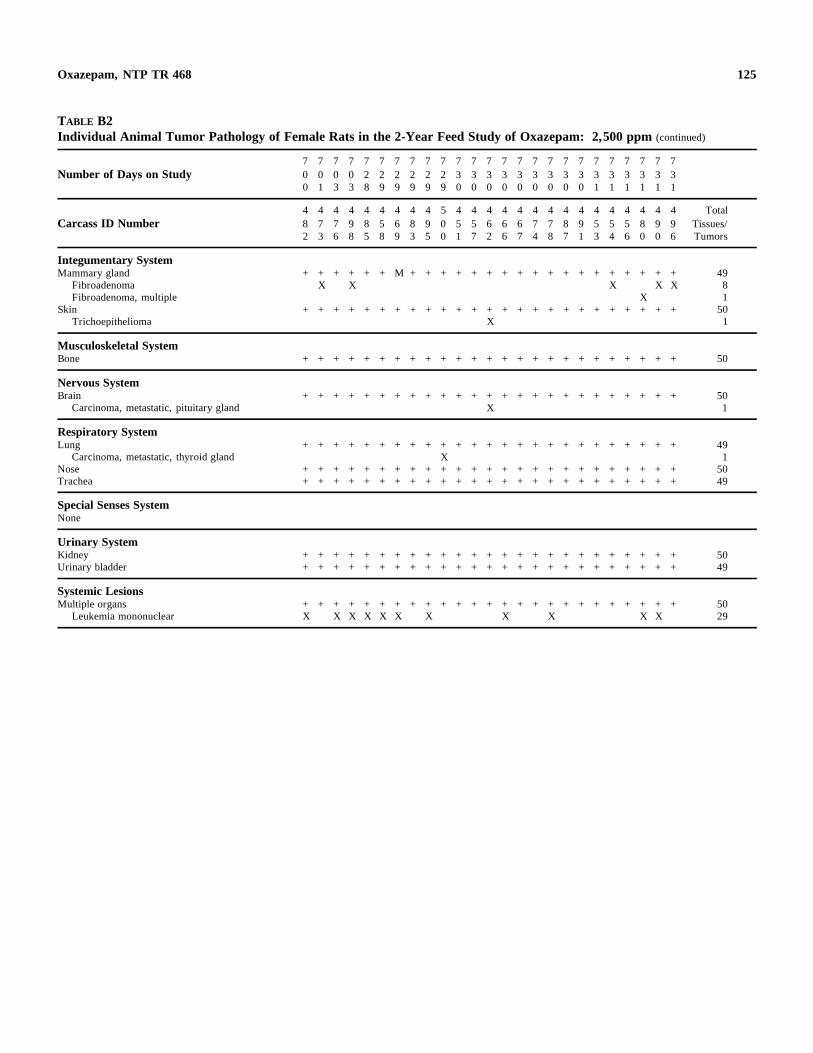
125 Oxazepam, NTP TR 468
TABLE B2 Individual Animal Tumor Pathology of Female Rats in the 2-Year Feed Study of Oxazepam: 2,500 ppm (continued)
7 7 7 7 7 7 7 7 7 7 7 7 7 7 7 7 7 7 7 7 7 7 7 7 7 Number of Days on Study 0 0 0 0 2 2 2 2 2 2 3 3 3 3 3 3 3 3 3 3 3 3 3 3 3
0 1 3 3 8 9 9 9 9 9 0 0 0 0 0 0 0 0 0 1 1 1 1 1 1
4 4 4 4 4 4 4 4 4 5 4 4 4 4 4 4 4 4 4 4 4 4 4 4 4 Total Carcass ID Number 8 7 7 9 8 5 6 8 9 0 5 5 6 6 6 7 7 8 9 5 5 5 8 9 9 Tissues/
2 3 6 8 5 8 9 3 5 0 1 7 2 6 7 4 8 7 1 3 4 6 0 0 6 Tumors
Integumentary System Mammary gland + + + + + + M + + + + + + + + + + + + + + + + + + 49
Fibroadenoma X X X X X 8 Fibroadenoma, multiple X 1
Skin + + + + + + + + + + + + + + + + + + + + + + + + + 50 Trichoepithelioma X 1
Musculoskeletal System Bone + + + + + + + + + + + + + + + + + + + + + + + + + 50
Nervous System Brain +
Carcinoma, metastatic, pituitary gland
Respiratory System Lung +
Carcinoma, metastatic, thyroid gland Nose + Trachea +
Special Senses System None
Urinary System Kidney + Urinary bladder +
+
+
+ +
+ +
+
+
+ +
+ +
+
+
+ +
+ +
+
+
+ +
+ +
+
+
+ +
+ +
+
+
+ +
+ +
+
+
+ +
+ +
+
+
+ +
+ +
+
+ X+ +
+ +
+
+
+ +
+ +
+
+
+ +
+ +
+ X
+
+ +
+ +
+
+
+ +
+ +
+
+
+ +
+ +
+
+
+ +
+ +
+
+
+ +
+ +
+
+
+ +
+ +
+
+
+ +
+ +
+
+
+ +
+ +
+
+
+ +
+ +
+
+
+ +
+ +
+
+
+ +
+ +
+
+
+ +
+ +
+ 50 1
+ 49 1
+ 50 + 49
+ 50 + 49
Systemic Lesions Multiple organs +
Leukemia mononuclear X + +
X + X
+ X
+ X
+ X
+ + X
+ + + + + X
+ + + X
+ + + + + + X
+ X
+ 50 29
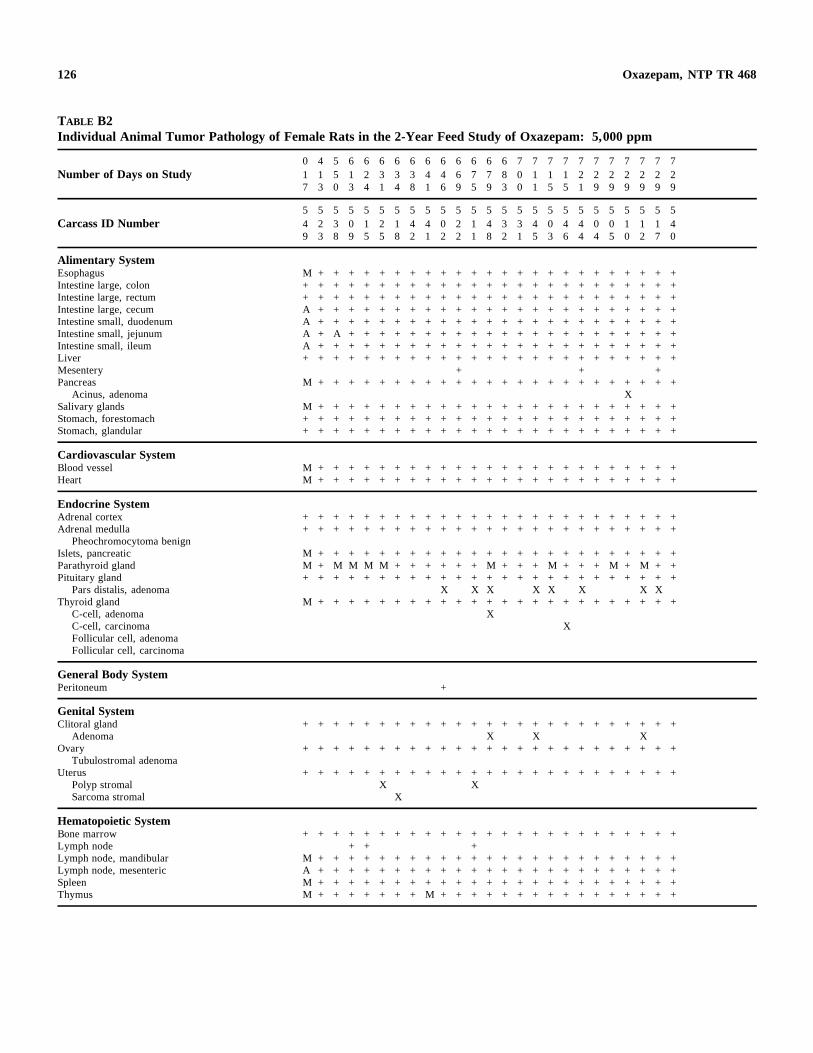
126 Oxazepam, NTP TR 468
TABLE B2 Individual Animal Tumor Pathology of Female Rats in the 2-Year Feed Study of Oxazepam: 5,000 ppm
0 4 5 6 6 6 6 6 6 6 6 6 6 6 7 7 7 7 7 7 7 7 7 7 7 Number of Days on Study 1 1 5 1 2 3 3 3 4 4 6 7 7 8 0 1 1 1 2 2 2 2 2 2 2
7 3 0 3 4 1 4 8 1 6 9 5 9 3 0 1 5 5 1 9 9 9 9 9 9
5 5 5 5 5 5 5 5 5 5 5 5 5 5 5 5 5 5 5 5 5 5 5 5 5 Carcass ID Number 4 2 3 0 1 2 1 4 4 0 2 1 4 3 3 4 0 4 4 0 0 1 1 1 4
9 3 8 9 5 5 8 2 1 2 2 1 8 2 1 5 3 6 4 4 5 0 2 7 0
Alimentary System Esophagus M + + + + + + + + + + + + + + + + + + + + + + + + Intestine large, colon + + + + + + + + + + + + + + + + + + + + + + + + + Intestine large, rectum + + + + + + + + + + + + + + + + + + + + + + + + + Intestine large, cecum A + + + + + + + + + + + + + + + + + + + + + + + + Intestine small, duodenum A + + + + + + + + + + + + + + + + + + + + + + + + Intestine small, jejunum A + A + + + + + + + + + + + + + + + + + + + + + + Intestine small, ileum A + + + + + + + + + + + + + + + + + + + + + + + + Liver + + + + + + + + + + + + + + + + + + + + + + + + + Mesentery + + + Pancreas M + + + + + + + + + + + + + + + + + + + + + + + +
Acinus, adenoma X Salivary glands M + + + + + + + + + + + + + + + + + + + + + + + + Stomach, forestomach + + + + + + + + + + + + + + + + + + + + + + + + + Stomach, glandular + + + + + + + + + + + + + + + + + + + + + + + + +
Cardiovascular System Blood vessel M + + + + + + + + + + + + + + + + + + + + + + + + Heart M + + + + + + + + + + + + + + + + + + + + + + + +
Endocrine System Adrenal cortex + + + + + + + + + + + + + + + + + + + + + + + + + Adrenal medulla + + + + + + + + + + + + + + + + + + + + + + + + +
Pheochromocytoma benign Islets, pancreatic M + + + + + + + + + + + + + + + + + + + + + + + + Parathyroid gland M + M M M M + + + + + + M + + + M + + + M + M + + Pituitary gland + + + + + + + + + + + + + + + + + + + + + + + + +
Pars distalis, adenoma X X X X X X X X Thyroid gland M + + + + + + + + + + + + + + + + + + + + + + + +
C-cell, adenoma X C-cell, carcinoma X Follicular cell, adenoma Follicular cell, carcinoma
General Body System Peritoneum +
Genital System Clitoral gland + + + + + + + + + + + + + + + + + + + + + + + + +
Adenoma X X X Ovary + + + + + + + + + + + + + + + + + + + + + + + + +
Tubulostromal adenoma Uterus + + + + + + + + + + + + + + + + + + + + + + + + +
Polyp stromal X X Sarcoma stromal X
Hematopoietic System Bone marrow + + + + + + + + + + + + + + + + + + + + + + + + + Lymph node + + + Lymph node, mandibular M + + + + + + + + + + + + + + + + + + + + + + + + Lymph node, mesenteric A + + + + + + + + + + + + + + + + + + + + + + + + Spleen M + + + + + + + + + + + + + + + + + + + + + + + + Thymus M + + + + + + + M + + + + + + + + + + + + + + + +
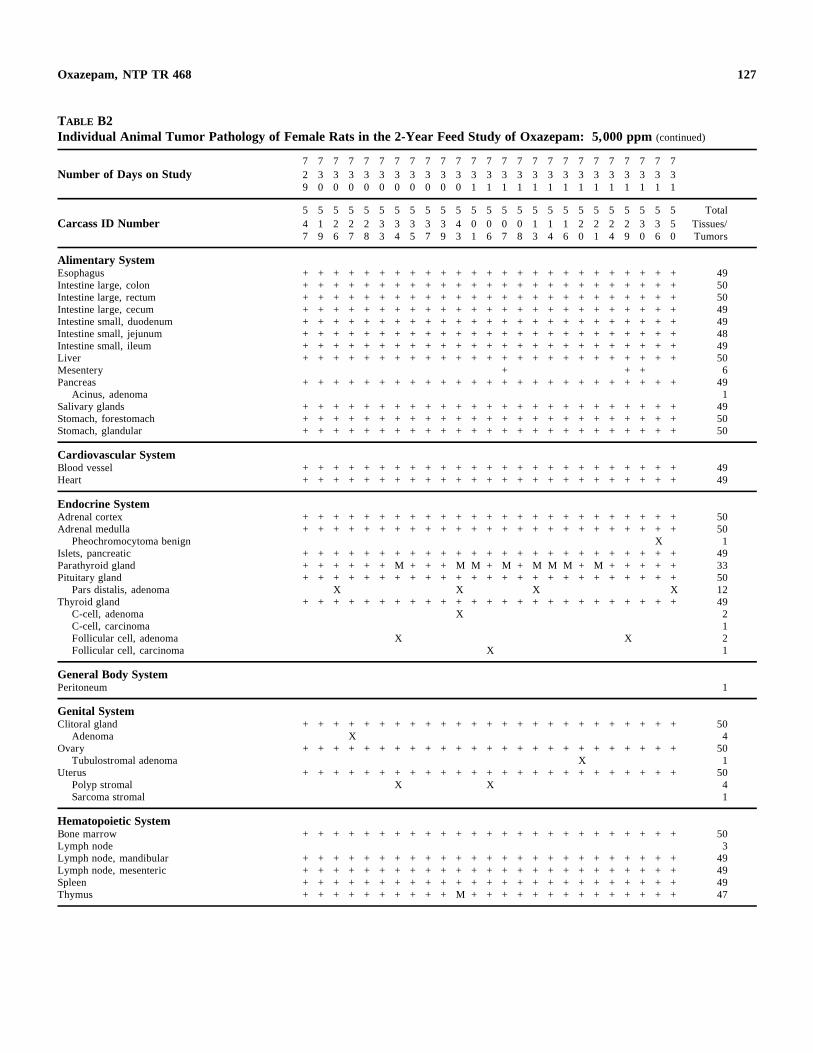
127 Oxazepam, NTP TR 468
TABLE B2 Individual Animal Tumor Pathology of Female Rats in the 2-Year Feed Study of Oxazepam: 5,000 ppm (continued)
7 7 7 7 7 7 7 7 7 7 7 7 7 7 7 7 7 7 7 7 7 7 7 7 7 Number of Days on Study 2 3 3 3 3 3 3 3 3 3 3 3 3 3 3 3 3 3 3 3 3 3 3 3 3
9 0 0 0 0 0 0 0 0 0 0 1 1 1 1 1 1 1 1 1 1 1 1 1 1
5 5 5 5 5 5 5 5 5 5 5 5 5 5 5 5 5 5 5 5 5 5 5 5 5 Total Carcass ID Number 4 1 2 2 2 3 3 3 3 3 4 0 0 0 0 1 1 1 2 2 2 2 3 3 5 Tissues/
7 9 6 7 8 3 4 5 7 9 3 1 6 7 8 3 4 6 0 1 4 9 0 6 0 Tumors
Alimentary System Esophagus + + + + + + + + + + + + + + + + + + + + + + + + + 49 Intestine large, colon + + + + + + + + + + + + + + + + + + + + + + + + + 50 Intestine large, rectum + + + + + + + + + + + + + + + + + + + + + + + + + 50 Intestine large, cecum + + + + + + + + + + + + + + + + + + + + + + + + + 49 Intestine small, duodenum + + + + + + + + + + + + + + + + + + + + + + + + + 49 Intestine small, jejunum + + + + + + + + + + + + + + + + + + + + + + + + + 48 Intestine small, ileum + + + + + + + + + + + + + + + + + + + + + + + + + 49 Liver + + + + + + + + + + + + + + + + + + + + + + + + + 50 Mesentery + + + 6 Pancreas + + + + + + + + + + + + + + + + + + + + + + + + + 49
Acinus, adenoma 1 Salivary glands + + + + + + + + + + + + + + + + + + + + + + + + + 49 Stomach, forestomach + + + + + + + + + + + + + + + + + + + + + + + + + 50 Stomach, glandular + + + + + + + + + + + + + + + + + + + + + + + + + 50
Cardiovascular System Blood vessel + + + + + + + + + + + + + + + + + + + + + + + + + 49 Heart + + + + + + + + + + + + + + + + + + + + + + + + + 49
Endocrine System Adrenal cortex + + + + + + + + + + + + + + + + + + + + + + + + + 50 Adrenal medulla + + + + + + + + + + + + + + + + + + + + + + + + + 50
Pheochromocytoma benign X 1 Islets, pancreatic + + + + + + + + + + + + + + + + + + + + + + + + + 49 Parathyroid gland + + + + + + M + + + M M + M + M M M + M + + + + + 33 Pituitary gland + + + + + + + + + + + + + + + + + + + + + + + + + 50
Pars distalis, adenoma X X X X 12 Thyroid gland + + + + + + + + + + + + + + + + + + + + + + + + + 49
C-cell, adenoma X 2 C-cell, carcinoma 1 Follicular cell, adenoma X X 2 Follicular cell, carcinoma X 1
General Body System Peritoneum 1
Genital System Clitoral gland + + + + + + + + + + + + + + + + + + + + + + + + + 50
Adenoma X 4 Ovary + + + + + + + + + + + + + + + + + + + + + + + + + 50
Tubulostromal adenoma X 1 Uterus + + + + + + + + + + + + + + + + + + + + + + + + + 50
Polyp stromal X X 4 Sarcoma stromal 1
Hematopoietic System Bone marrow + + + + + + + + + + + + + + + + + + + + + + + + + 50 Lymph node 3 Lymph node, mandibular + + + + + + + + + + + + + + + + + + + + + + + + + 49 Lymph node, mesenteric + + + + + + + + + + + + + + + + + + + + + + + + + 49 Spleen + + + + + + + + + + + + + + + + + + + + + + + + + 49 Thymus + + + + + + + + + + M + + + + + + + + + + + + + + 47
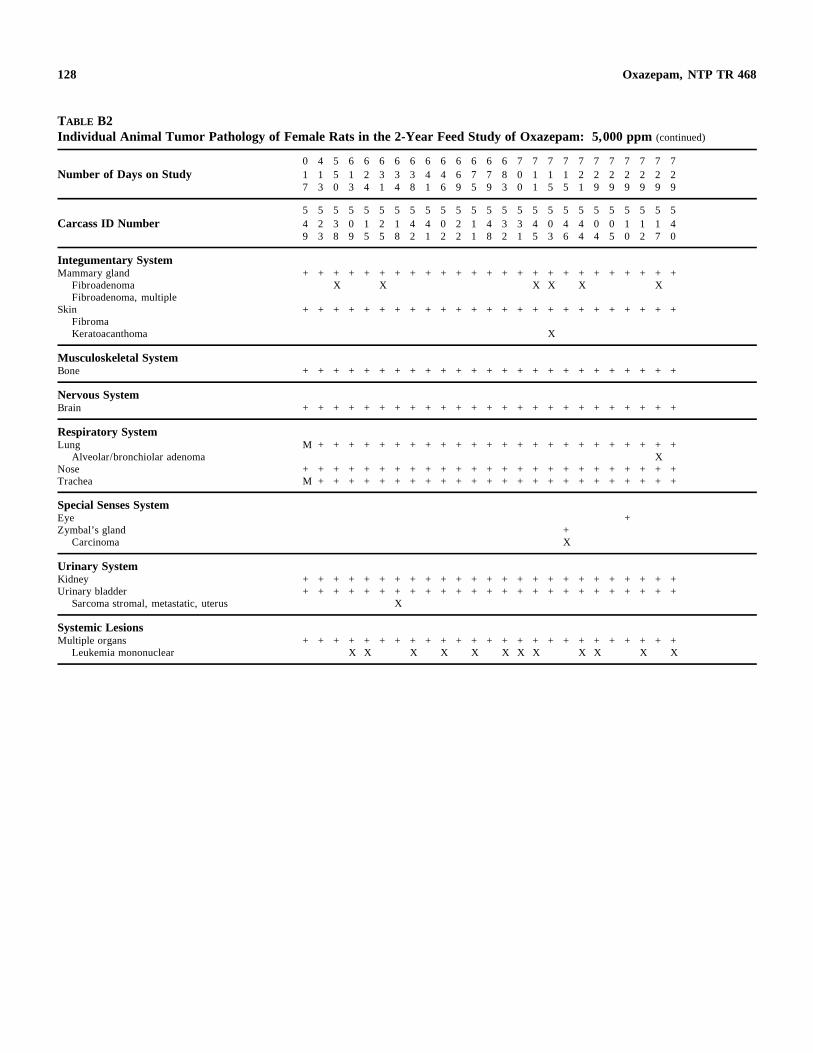
128 Oxazepam, NTP TR 468
TABLE B2 Individual Animal Tumor Pathology of Female Rats in the 2-Year Feed Study of Oxazepam: 5,000 ppm (continued)
Number of Days on Study 0 1 7
4 1 3
5 5 0
6 1 3
6 2 4
6 3 1
6 3 4
6 3 8
6 4 1
6 4 6
6 6 9
6 7 5
6 7 9
6 8 3
7 0 0
7 1 1
7 1 5
7 1 5
7 2 1
7 2 9
7 2 9
7 2 9
7 2 9
7 2 9
7 2 9
Carcass ID Number 5 4 9
5 2 3
5 3 8
5 0 9
5 1 5
5 2 5
5 1 8
5 4 2
5 4 1
5 0 2
5 2 2
5 1 1
5 4 8
5 3 2
5 3 1
5 4 5
5 0 3
5 4 6
5 4 4
5 0 4
5 0 5
5 1 0
5 1 2
5 1 7
5 4 0
Integumentary System Mammary gland
Fibroadenoma Fibroadenoma, multiple
Skin Fibroma Keratoacanthoma
+ + + + + + + + + + + + + + + + + + + + + + + + + X X X X X X
+ + + + + + + + + + + + + + + + + + + + + + + + +
X
Musculoskeletal System Bone + + + + + + + + + + + + + + + + + + + + + + + + +
Nervous System Brain + + + + + + + + + + + + + + + + + + + + + + + + +
Respiratory System Lung
Alveolar/bronchiolar adenoma Nose Trachea
M + + + + + + + + + + + + + + + + + + + + + + + + X
+ + + + + + + + + + + + + + + + + + + + + + + + + M + + + + + + + + + + + + + + + + + + + + + + + +
Special Senses System Eye Zymbal’s gland
Carcinoma + X
+
Urinary System Kidney Urinary bladder
Sarcoma stromal, metastatic, uterus
+ + + + + + + + + + + + + + + + + + + + + + + + + + + + + + + + + + + + + + + + + + + + + + + + + +
X
Systemic Lesions Multiple organs
Leukemia mononuclear + + + + + + + + + + + + + + + + + + + + + + + + +
X X X X X X X X X X X X
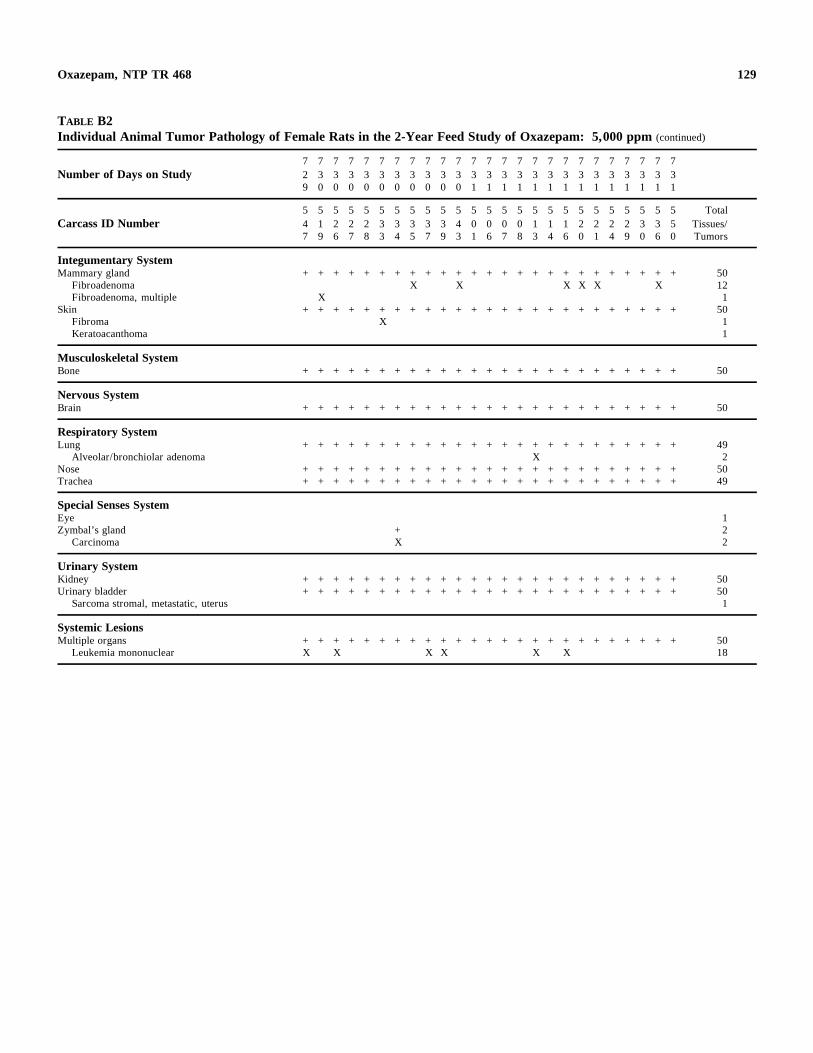
129 Oxazepam, NTP TR 468
TABLE B2 Individual Animal Tumor Pathology of Female Rats in the 2-Year Feed Study of Oxazepam: 5,000 ppm (continued)
Number of Days on Study 7 2 9
7 3 0
7 3 0
7 3 0
7 3 0
7 3 0
7 3 0
7 3 0
7 3 0
7 3 0
7 3 0
7 3 1
7 3 1
7 3 1
7 3 1
7 3 1
7 3 1
7 3 1
7 3 1
7 3 1
7 3 1
7 3 1
7 3 1
7 3 1
7 3 1
Carcass ID Number 5 4 7
5 1 9
5 2 6
5 2 7
5 2 8
5 3 3
5 3 4
5 3 5
5 3 7
5 3 9
5 4 3
5 0 1
5 0 6
5 0 7
5 0 8
5 1 3
5 1 4
5 1 6
5 2 0
5 2 1
5 2 4
5 2 9
5 3 0
5 3 6
5 5 0
Total Tissues/ Tumors
Integumentary System Mammary gland
Fibroadenoma Fibroadenoma, multiple
Skin Fibroma Keratoacanthoma
+ + + + + + + + + + + + + + + + + + + + + + + + + X X X X X X
X+ + + + + + + + + + + + + + + + + + + + + + + + +
X
50 12 1
50 1 1
Musculoskeletal System Bone + + + + + + + + + + + + + + + + + + + + + + + + + 50
Nervous System Brain + + + + + + + + + + + + + + + + + + + + + + + + + 50
Respiratory System Lung
Alveolar/bronchiolar adenoma Nose Trachea
+ + + + + + + + + + + + + + + + + + + + + + + + + X
+ + + + + + + + + + + + + + + + + + + + + + + + + + + + + + + + + + + + + + + + + + + + + + + + + +
49 2
50 49
Special Senses System EyeZymbal’s gland
Carcinoma +X
1 2 2
Urinary System Kidney Urinary bladder
Sarcoma stromal, metastatic, uterus
+ + + + + + + + + + + + + + + + + + + + + + + + + + + + + + + + + + + + + + + + + + + + + + + + + +
50 50 1
Systemic Lesions Multiple organs
Leukemia mononuclear + + + + + + + + + + + + + + + + + + + + + + + + + X X X X X X
50 18
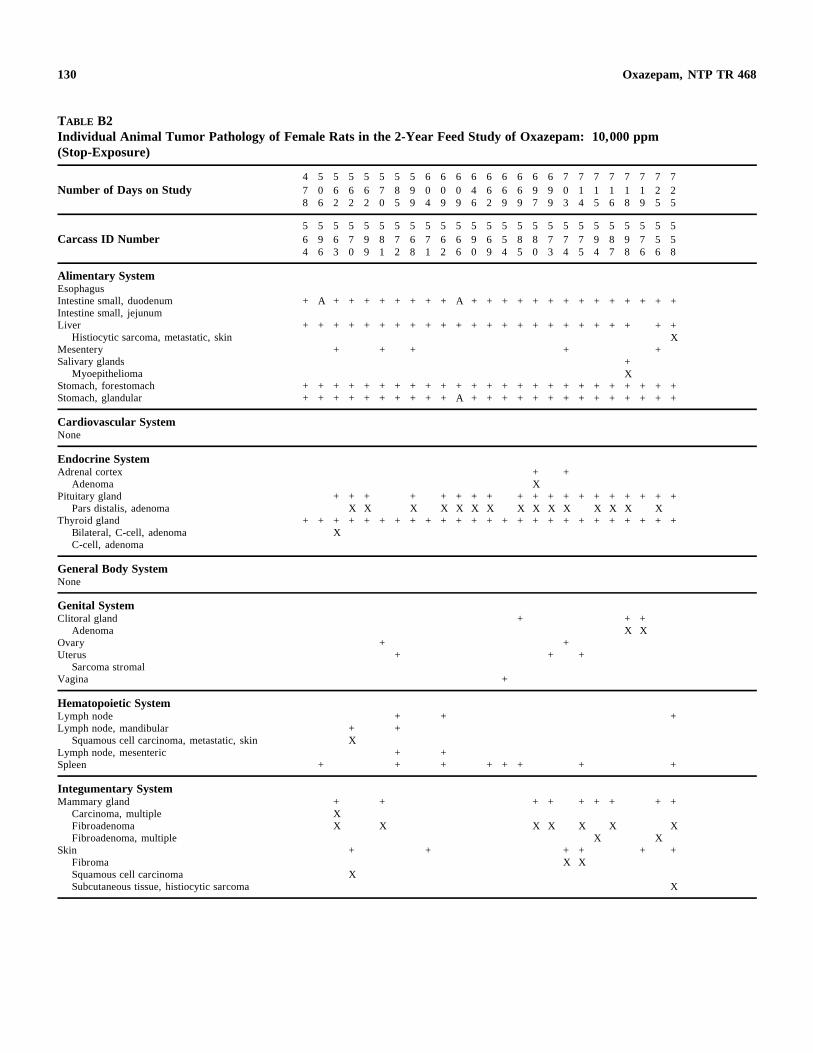
130 Oxazepam, NTP TR 468
TABLE B2 Individual Animal Tumor Pathology of Female Rats in the 2-Year Feed Study of Oxazepam: 10,000 ppm (Stop-Exposure)
Number of Days on Study 4 7 8
5 0 6
5 6 2
5 6 2
5 6 2
5 7 0
5 8 5
5 9 9
6 0 4
6 0 9
6 0 9
6 4 6
6 6 2
6 6 9
6 6 9
6 9 7
6 9 9
7 0 3
7 1 4
7 1 5
7 1 6
7 1 8
7 1 9
7 2 5
7 2 5
Carcass ID Number 5 6 4
5 9 6
5 6 3
5 7 0
5 9 9
5 8 1
5 7 2
5 6 8
5 7 1
5 6 2
5 6 6
5 9 0
5 6 9
5 5 4
5 8 5
5 8 0
5 7 3
5 7 4
5 7 5
5 9 4
5 8 7
5 9 8
5 7 6
5 5 6
5 5 8
Alimentary System Esophagus Intestine small, duodenum Intestine small, jejunum Liver
Histiocytic sarcoma, metastatic, skin Mesentery Salivary glands
Myoepithelioma Stomach, forestomach Stomach, glandular
+
+
+ +
A
+
+ +
+
+
+
+ +
+
+
+ +
+
+
+ +
+
+
+
+ +
+
+
+ +
+
+
+
+ +
+
+
+ +
+
+
+ +
A
+
+ A
+
+
+ +
+
+
+ +
+
+
+ +
+
+
+ +
+
+
+ +
+
+
+ +
+
+
+
+ +
+
+
+ +
+
+
+ +
+
+
+ +
+
+
+ X + +
+
+ +
+
+
+
+ +
+
+ X
+ +
Cardiovascular System None
Endocrine System Adrenal cortex
Adenoma Pituitary gland
Pars distalis, adenoma Thyroid gland +
Bilateral, C-cell, adenoma C-cell, adenoma
General Body System None
+
+
+ X
+ X +
+ X + + +
+ X + +
+ X +
+ X +
+ X +
+ X + +
+ X +
+ X + X +
+ X +
+
+ X +
+
+
+ X +
+ X +
+ X +
+
+
+ X +
+
+
Genital System Clitoral gland + + +
Adenoma X X Ovary + + Uterus + + +
Sarcoma stromal Vagina +
Hematopoietic System Lymph node + + + Lymph node, mandibular + +
Squamous cell carcinoma, metastatic, skin X Lymph node, mesenteric + + Spleen + + + + + + + +
Integumentary System Mammary gland + + + + + + + + +
Carcinoma, multiple X Fibroadenoma X X X X X X X Fibroadenoma, multiple X X
Skin + + + + + + Fibroma X X Squamous cell carcinoma X Subcutaneous tissue, histiocytic sarcoma X
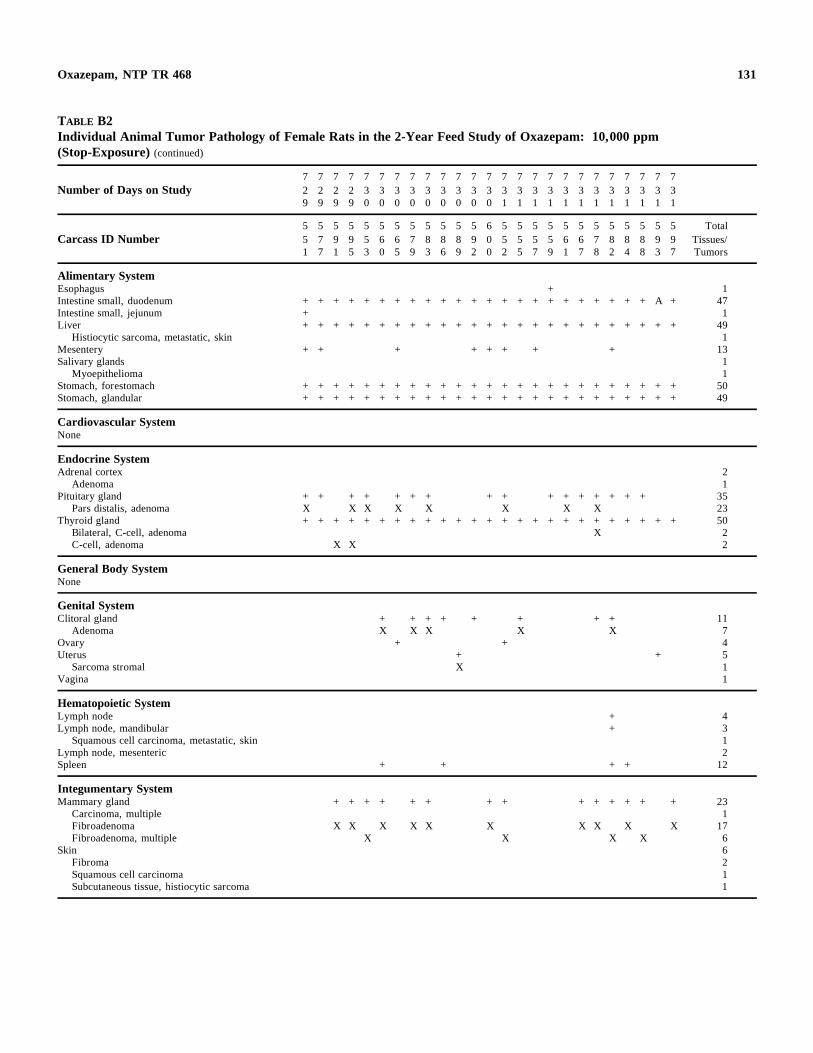
131 Oxazepam, NTP TR 468
TABLE B2 Individual Animal Tumor Pathology of Female Rats in the 2-Year Feed Study of Oxazepam: 10,000 ppm (Stop-Exposure) (continued)
Number of Days on Study 7 2 9
7 2 9
7 2 9
7 2 9
7 3 0
7 3 0
7 3 0
7 3 0
7 3 0
7 3 0
7 3 0
7 3 0
7 3 0
7 3 1
7 3 1
7 3 1
7 3 1
7 3 1
7 3 1
7 3 1
7 3 1
7 3 1
7 3 1
7 3 1
7 3 1
Carcass ID Number 5 5 1
5 7 7
5 9 1
5 9 5
5 5 3
5 6 0
5 6 5
5 7 9
5 8 3
5 8 6
5 8 9
5 9 2
6 0 0
5 5 2
5 5 5
5 5 7
5 5 9
5 6 1
5 6 7
5 7 8
5 8 2
5 8 4
5 8 8
5 9 3
5 9 7
Total Tissues/ Tumors
Alimentary System Esophagus Intestine small, duodenum Intestine small, jejunum Liver
Histiocytic sarcoma, metastatic, skinMesentery Salivary glands
MyoepitheliomaStomach, forestomach Stomach, glandular
Cardiovascular System None
++ + + + + + + + + + + + + + + + + + + + + + + A + ++ + + + + + + + + + + + + + + + + + + + + + + + +
+ + + + + + + +
+ + + + + + + + + + + + + + + + + + + + + + + + + + + + + + + + + + + + + + + + + + + + + + + + + +
1 47 1
49 1
13 1 1
50 49
Endocrine System Adrenal cortex
AdenomaPituitary gland
Pars distalis, adenoma Thyroid gland
Bilateral, C-cell, adenoma C-cell, adenoma
General Body System None
+ + + + + + + + + + + + + + + + X X X X X X X X + + + + + + + + + + + + + + + + + + + + + + + + +
XX X
2 1
35 23 50 2 2
Genital System Clitoral gland
Adenoma Ovary Uterus
Sarcoma stromal Vagina
+ X
+
+ + + X X
+ X
+
+
+ X
+ + X
+
11 7 4 5 1 1
Hematopoietic System Lymph node Lymph node, mandibular
Squamous cell carcinoma, metastatic, skinLymph node, mesentericSpleen + +
++
+ +
4 3 1 2
12
Integumentary System Mammary gland
Carcinoma, multipleFibroadenoma Fibroadenoma, multiple
SkinFibromaSquamous cell carcinomaSubcutaneous tissue, histiocytic sarcoma
+ + + +
X X X X
+ +
X X
+ +
X X
+ + + + +
X X X X X
+
X
23 1
17 6 6 2 1 1
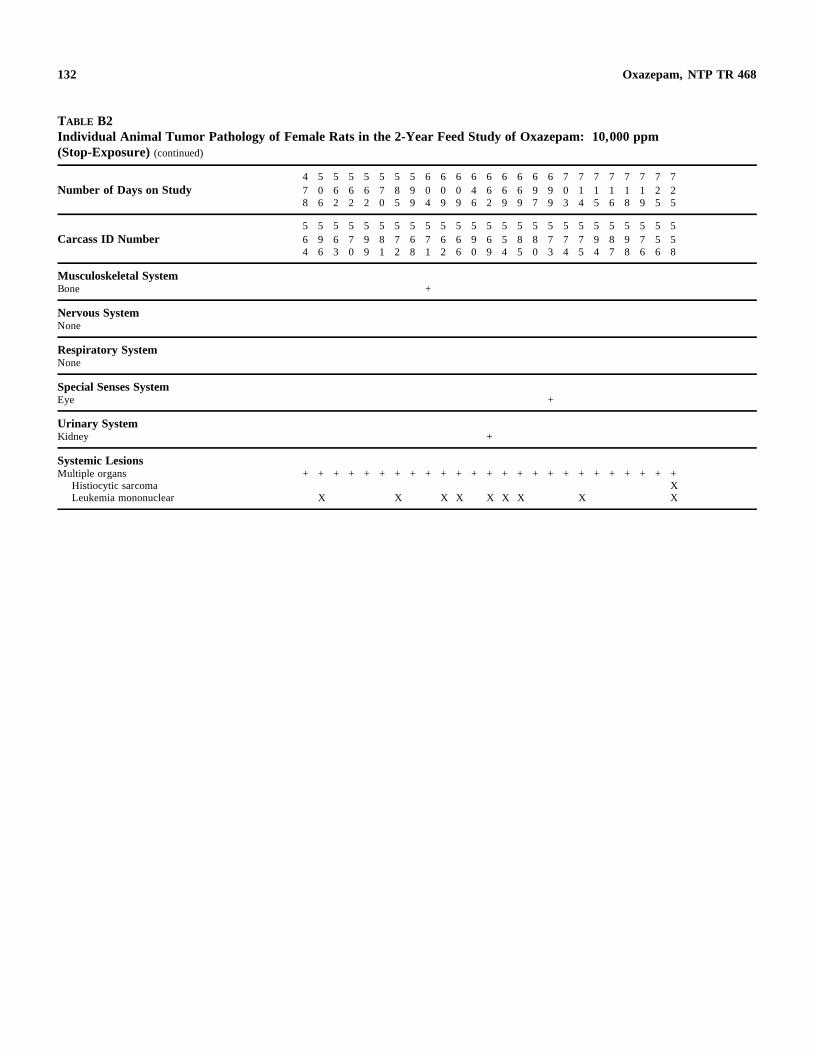
132 Oxazepam, NTP TR 468
TABLE B2 Individual Animal Tumor Pathology of Female Rats in the 2-Year Feed Study of Oxazepam: 10,000 ppm (Stop-Exposure) (continued)
Number of Days on Study 4 7 8
5 0 6
5 6 2
5 6 2
5 6 2
5 7 0
5 8 5
5 9 9
6 0 4
6 0 9
6 0 9
6 4 6
6 6 2
6 6 9
6 6 9
6 9 7
6 9 9
7 0 3
7 1 4
7 1 5
7 1 6
7 1 8
7 1 9
7 2 5
7 2 5
Carcass ID Number 5 6 4
5 9 6
5 6 3
5 7 0
5 9 9
5 8 1
5 7 2
5 6 8
5 7 1
5 6 2
5 6 6
5 9 0
5 6 9
5 5 4
5 8 5
5 8 0
5 7 3
5 7 4
5 7 5
5 9 4
5 8 7
5 9 8
5 7 6
5 5 6
5 5 8
Musculoskeletal System Bone +
Nervous System None
Respiratory System None
Special Senses System Eye +
Urinary System Kidney +
Systemic Lesions Multiple organs
Histiocytic sarcoma Leukemia mononuclear
+ + + + + + + + + + + + + + + + + + + + + + + + + X
X X X X X X X X X
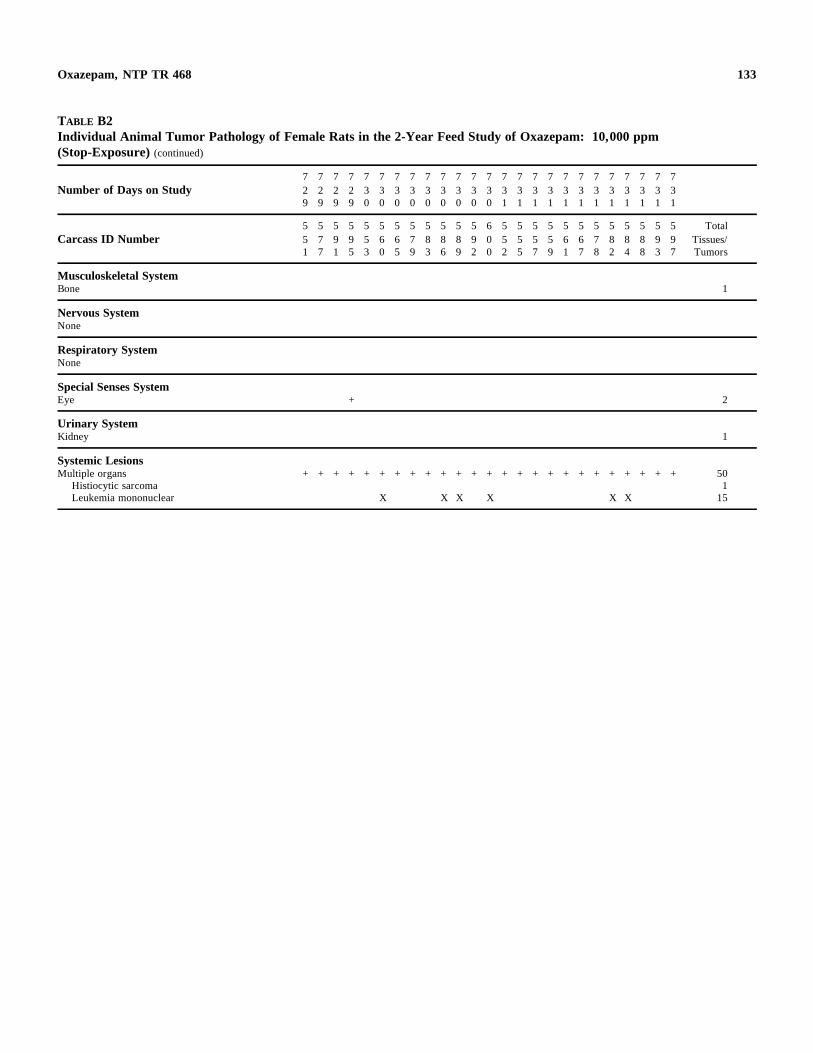
133 Oxazepam, NTP TR 468
TABLE B2 Individual Animal Tumor Pathology of Female Rats in the 2-Year Feed Study of Oxazepam: 10,000 ppm (Stop-Exposure) (continued)
Number of Days on Study 7 2 9
7 2 9
7 2 9
7 2 9
7 3 0
7 3 0
7 3 0
7 3 0
7 3 0
7 3 0
7 3 0
7 3 0
7 3 0
7 3 1
7 3 1
7 3 1
7 3 1
7 3 1
7 3 1
7 3 1
7 3 1
7 3 1
7 3 1
7 3 1
7 3 1
Carcass ID Number 5 5 1
5 7 7
5 9 1
5 9 5
5 5 3
5 6 0
5 6 5
5 7 9
5 8 3
5 8 6
5 8 9
5 9 2
6 0 0
5 5 2
5 5 5
5 5 7
5 5 9
5 6 1
5 6 7
5 7 8
5 8 2
5 8 4
5 8 8
5 9 3
5 9 7
Total Tissues/ Tumors
Musculoskeletal System Bone 1
Nervous System None
Respiratory System None
Special Senses System Eye + 2
Urinary System Kidney 1
Systemic Lesions Multiple organs
Histiocytic sarcomaLeukemia mononuclear
+ + + + + + + + + + + + + + + + + + + + + + + + +
X X X X X X
50 1
15
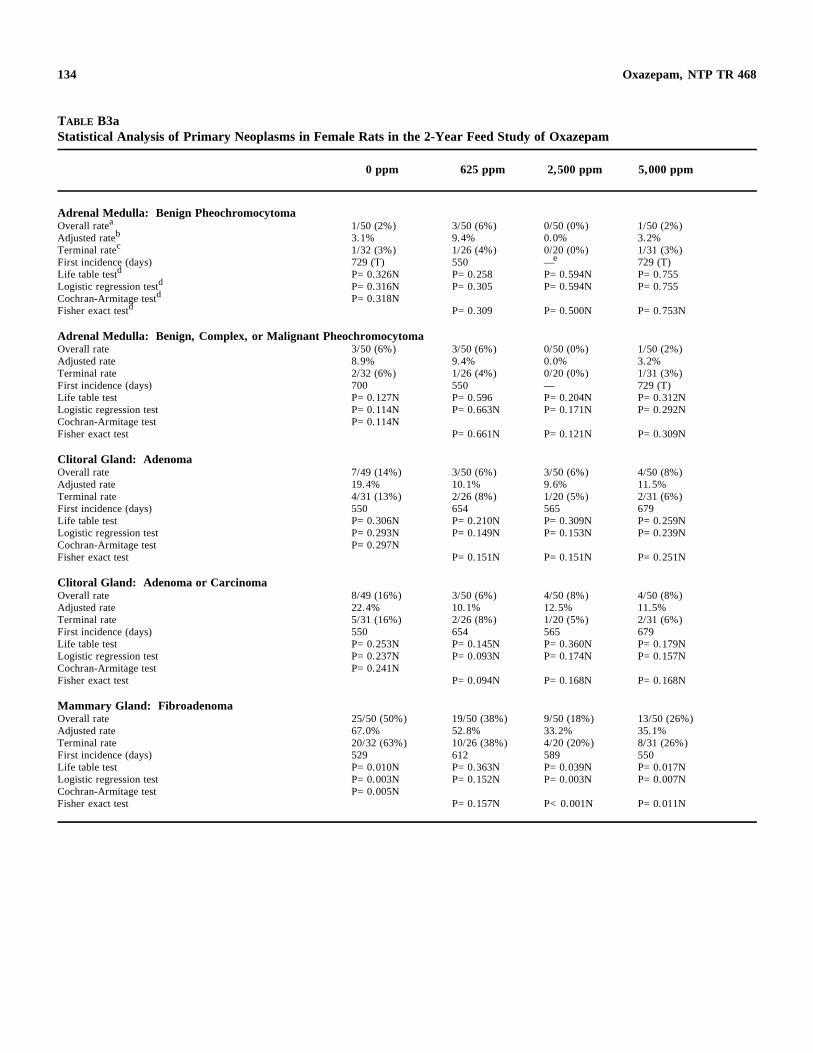
134 Oxazepam, NTP TR 468
TABLE B3a Statistical Analysis of Primary Neoplasms in Female Rats in the 2-Year Feed Study of Oxazepam
0 ppm 625 ppm 2,500 ppm 5,000 ppm
Adrenal Medulla: Benign Pheochromocytoma aOverall rate 1/50 (2%) 3/50 (6%) 0/50 (0%) 1/50 (2%)
Adjusted rateb 3.1% 9.4% 0.0% 3.2% cTerminal rate 1/32 (3%) 1/26 (4%) 0/20 (0%) 1/31 (3%)
eFirst incidence (days) 729 (T) 550 — 729 (T)dLife table test P=0.326N P=0.258 P=0.594N P=0.755
Logistic regression testd P=0.316N P=0.305 P=0.594N P=0.755 Cochran-Armitage testd P=0.318N
dFisher exact test P=0.309 P=0.500N P=0.753N
Adrenal Medulla: Benign, Complex, or Malignant Pheochromocytoma Overall rate 3/50 (6%) 3/50 (6%) 0/50 (0%) 1/50 (2%) Adjusted rate 8.9% 9.4% 0.0% 3.2% Terminal rate 2/32 (6%) 1/26 (4%) 0/20 (0%) 1/31 (3%) First incidence (days) 700 550 — 729 (T) Life table test P=0.127N P=0.596 P=0.204N P=0.312N Logistic regression test P=0.114N P=0.663N P=0.171N P=0.292N Cochran-Armitage test P=0.114N Fisher exact test P=0.661N P=0.121N P=0.309N
Clitoral Gland: Adenoma Overall rate 7/49 (14%) 3/50 (6%) 3/50 (6%) 4/50 (8%) Adjusted rate 19.4% 10.1% 9.6% 11.5% Terminal rate 4/31 (13%) 2/26 (8%) 1/20 (5%) 2/31 (6%) First incidence (days) 550 654 565 679 Life table test P=0.306N P=0.210N P=0.309N P=0.259N Logistic regression test P=0.293N P=0.149N P=0.153N P=0.239N Cochran-Armitage test P=0.297N Fisher exact test P=0.151N P=0.151N P=0.251N
Clitoral Gland: Adenoma or Carcinoma Overall rate 8/49 (16%) 3/50 (6%) 4/50 (8%) 4/50 (8%) Adjusted rate 22.4% 10.1% 12.5% 11.5% Terminal rate 5/31 (16%) 2/26 (8%) 1/20 (5%) 2/31 (6%) First incidence (days) 550 654 565 679 Life table test P=0.253N P=0.145N P=0.360N P=0.179N Logistic regression test P=0.237N P=0.093N P=0.174N P=0.157N Cochran-Armitage test P=0.241N Fisher exact test P=0.094N P=0.168N P=0.168N
Mammary Gland: Fibroadenoma Overall rate 25/50 (50%) 19/50 (38%) 9/50 (18%) 13/50 (26%) Adjusted rate 67.0% 52.8% 33.2% 35.1% Terminal rate 20/32 (63%) 10/26 (38%) 4/20 (20%) 8/31 (26%) First incidence (days) 529 612 589 550 Life table test P=0.010N P=0.363N P=0.039N P=0.017N Logistic regression test P=0.003N P=0.152N P=0.003N P=0.007N Cochran-Armitage test P=0.005N Fisher exact test P=0.157N P<0.001N P=0.011N
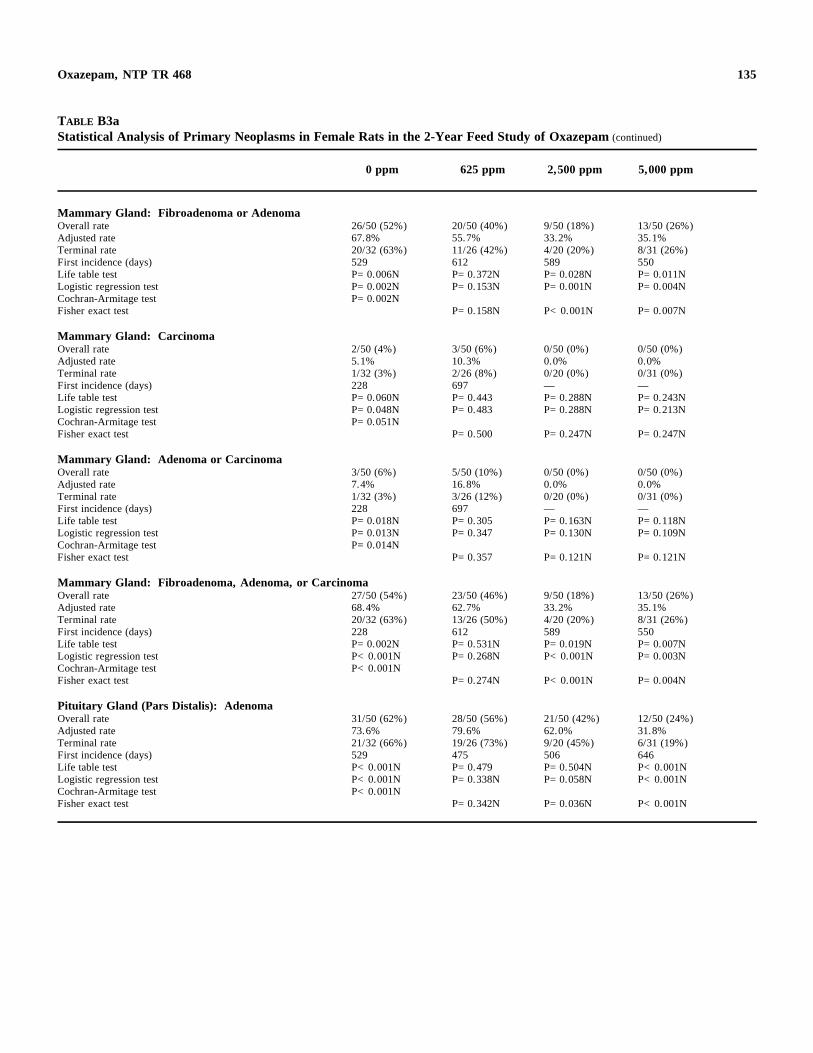
135 Oxazepam, NTP TR 468
TABLE B3a Statistical Analysis of Primary Neoplasms in Female Rats in the 2-Year Feed Study of Oxazepam (continued)
0 ppm 625 ppm 2,500 ppm 5,000 ppm
Mammary Gland: Fibroadenoma or Adenoma Overall rate 26/50 (52%) 20/50 (40%) 9/50 (18%) 13/50 (26%) Adjusted rate 67.8% 55.7% 33.2% 35.1% Terminal rate 20/32 (63%) 11/26 (42%) 4/20 (20%) 8/31 (26%) First incidence (days) 529 612 589 550 Life table test P=0.006N P=0.372N P=0.028N P=0.011N Logistic regression test P=0.002N P=0.153N P=0.001N P=0.004N Cochran-Armitage test P=0.002N Fisher exact test P=0.158N P<0.001N P=0.007N
Mammary Gland: Carcinoma Overall rate 2/50 (4%) 3/50 (6%) 0/50 (0%) 0/50 (0%) Adjusted rate 5.1% 10.3% 0.0% 0.0% Terminal rate 1/32 (3%) 2/26 (8%) 0/20 (0%) 0/31 (0%) First incidence (days) 228 697 — — Life table test P=0.060N P=0.443 P=0.288N P=0.243N Logistic regression test P=0.048N P=0.483 P=0.288N P=0.213N Cochran-Armitage test P=0.051N Fisher exact test P=0.500 P=0.247N P=0.247N
Mammary Gland: Adenoma or Carcinoma Overall rate 3/50 (6%) 5/50 (10%) 0/50 (0%) 0/50 (0%) Adjusted rate 7.4% 16.8% 0.0% 0.0% Terminal rate 1/32 (3%) 3/26 (12%) 0/20 (0%) 0/31 (0%) First incidence (days) 228 697 — — Life table test P=0.018N P=0.305 P=0.163N P=0.118N Logistic regression test P=0.013N P=0.347 P=0.130N P=0.109N Cochran-Armitage test P=0.014N Fisher exact test P=0.357 P=0.121N P=0.121N
Mammary Gland: Fibroadenoma, Adenoma, or Carcinoma Overall rate 27/50 (54%) 23/50 (46%) 9/50 (18%) 13/50 (26%) Adjusted rate 68.4% 62.7% 33.2% 35.1% Terminal rate 20/32 (63%) 13/26 (50%) 4/20 (20%) 8/31 (26%) First incidence (days) 228 612 589 550 Life table test P=0.002N P=0.531N P=0.019N P=0.007N Logistic regression test P<0.001N P=0.268N P<0.001N P=0.003N Cochran-Armitage test P<0.001N Fisher exact test P=0.274N P<0.001N P=0.004N
Pituitary Gland (Pars Distalis): Adenoma Overall rate 31/50 (62%) 28/50 (56%) 21/50 (42%) 12/50 (24%) Adjusted rate 73.6% 79.6% 62.0% 31.8% Terminal rate 21/32 (66%) 19/26 (73%) 9/20 (45%) 6/31 (19%) First incidence (days) 529 475 506 646 Life table test P<0.001N P=0.479 P=0.504N P<0.001N Logistic regression test P<0.001N P=0.338N P=0.058N P<0.001N Cochran-Armitage test P<0.001N Fisher exact test P=0.342N P=0.036N P<0.001N
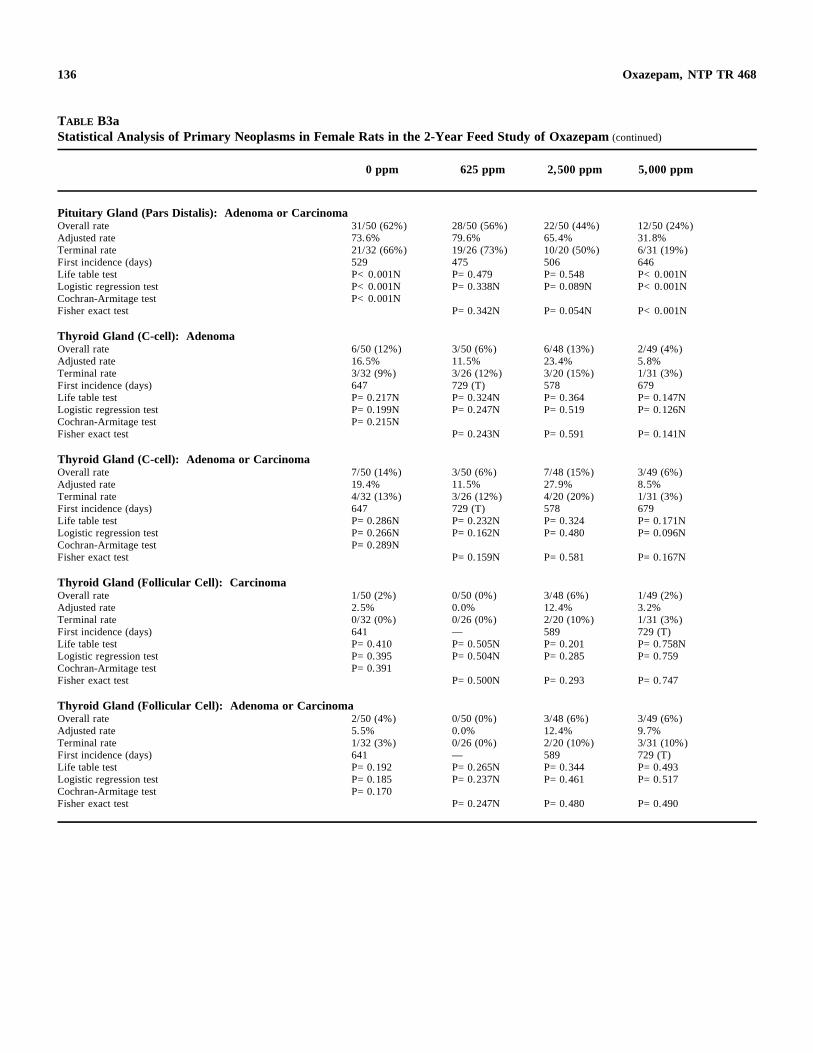
136 Oxazepam, NTP TR 468
TABLE B3a Statistical Analysis of Primary Neoplasms in Female Rats in the 2-Year Feed Study of Oxazepam (continued)
0 ppm 625 ppm 2,500 ppm 5,000 ppm
Pituitary Gland (Pars Distalis): Adenoma or Carcinoma Overall rate 31/50 (62%) 28/50 (56%) 22/50 (44%) 12/50 (24%) Adjusted rate 73.6% 79.6% 65.4% 31.8% Terminal rate 21/32 (66%) 19/26 (73%) 10/20 (50%) 6/31 (19%) First incidence (days) 529 475 506 646 Life table test P<0.001N P=0.479 P=0.548 P<0.001N Logistic regression test P<0.001N P=0.338N P=0.089N P<0.001N Cochran-Armitage test P<0.001N Fisher exact test P=0.342N P=0.054N P<0.001N
Thyroid Gland (C-cell): Adenoma Overall rate 6/50 (12%) 3/50 (6%) 6/48 (13%) 2/49 (4%) Adjusted rate 16.5% 11.5% 23.4% 5.8% Terminal rate 3/32 (9%) 3/26 (12%) 3/20 (15%) 1/31 (3%) First incidence (days) 647 729 (T) 578 679 Life table test P=0.217N P=0.324N P=0.364 P=0.147N Logistic regression test P=0.199N P=0.247N P=0.519 P=0.126N Cochran-Armitage test P=0.215N Fisher exact test P=0.243N P=0.591 P=0.141N
Thyroid Gland (C-cell): Adenoma or Carcinoma Overall rate 7/50 (14%) 3/50 (6%) 7/48 (15%) 3/49 (6%) Adjusted rate 19.4% 11.5% 27.9% 8.5% Terminal rate 4/32 (13%) 3/26 (12%) 4/20 (20%) 1/31 (3%) First incidence (days) 647 729 (T) 578 679 Life table test P=0.286N P=0.232N P=0.324 P=0.171N Logistic regression test P=0.266N P=0.162N P=0.480 P=0.096N Cochran-Armitage test P=0.289N Fisher exact test P=0.159N P=0.581 P=0.167N
Thyroid Gland (Follicular Cell): Carcinoma Overall rate 1/50 (2%) 0/50 (0%) 3/48 (6%) 1/49 (2%) Adjusted rate 2.5% 0.0% 12.4% 3.2% Terminal rate 0/32 (0%) 0/26 (0%) 2/20 (10%) 1/31 (3%) First incidence (days) 641 — 589 729 (T) Life table test P=0.410 P=0.505N P=0.201 P=0.758N Logistic regression test P=0.395 P=0.504N P=0.285 P=0.759 Cochran-Armitage test P=0.391 Fisher exact test P=0.500N P=0.293 P=0.747
Thyroid Gland (Follicular Cell): Adenoma or Carcinoma Overall rate 2/50 (4%) 0/50 (0%) 3/48 (6%) 3/49 (6%) Adjusted rate 5.5% 0.0% 12.4% 9.7% Terminal rate 1/32 (3%) 0/26 (0%) 2/20 (10%) 3/31 (10%) First incidence (days) 641 — 589 729 (T) Life table test P=0.192 P=0.265N P=0.344 P=0.493 Logistic regression test P=0.185 P=0.237N P=0.461 P=0.517 Cochran-Armitage test P=0.170 Fisher exact test P=0.247N P=0.480 P=0.490
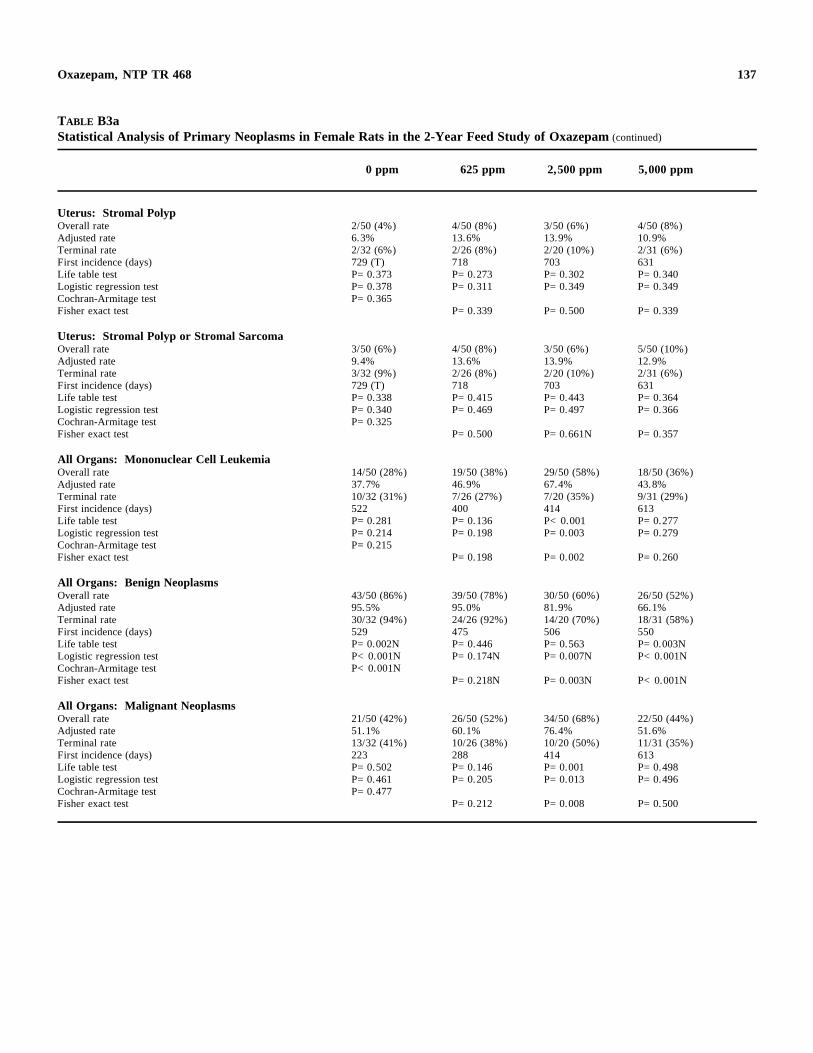
137 Oxazepam, NTP TR 468
TABLE B3a Statistical Analysis of Primary Neoplasms in Female Rats in the 2-Year Feed Study of Oxazepam (continued)
0 ppm 625 ppm 2,500 ppm 5,000 ppm
Uterus: Stromal Polyp Overall rate 2/50 (4%) 4/50 (8%) 3/50 (6%) 4/50 (8%) Adjusted rate 6.3% 13.6% 13.9% 10.9% Terminal rate 2/32 (6%) 2/26 (8%) 2/20 (10%) 2/31 (6%) First incidence (days) 729 (T) 718 703 631 Life table test P=0.373 P=0.273 P=0.302 P=0.340 Logistic regression test P=0.378 P=0.311 P=0.349 P=0.349 Cochran-Armitage test P=0.365 Fisher exact test P=0.339 P=0.500 P=0.339
Uterus: Stromal Polyp or Stromal Sarcoma Overall rate 3/50 (6%) 4/50 (8%) 3/50 (6%) 5/50 (10%) Adjusted rate 9.4% 13.6% 13.9% 12.9% Terminal rate 3/32 (9%) 2/26 (8%) 2/20 (10%) 2/31 (6%) First incidence (days) 729 (T) 718 703 631 Life table test P=0.338 P=0.415 P=0.443 P=0.364 Logistic regression test P=0.340 P=0.469 P=0.497 P=0.366 Cochran-Armitage test P=0.325 Fisher exact test P=0.500 P=0.661N P=0.357
All Organs: Mononuclear Cell Leukemia Overall rate 14/50 (28%) 19/50 (38%) 29/50 (58%) 18/50 (36%) Adjusted rate 37.7% 46.9% 67.4% 43.8% Terminal rate 10/32 (31%) 7/26 (27%) 7/20 (35%) 9/31 (29%) First incidence (days) 522 400 414 613 Life table test P=0.281 P=0.136 P<0.001 P=0.277 Logistic regression test P=0.214 P=0.198 P=0.003 P=0.279 Cochran-Armitage test P=0.215 Fisher exact test P=0.198 P=0.002 P=0.260
All Organs: Benign Neoplasms Overall rate 43/50 (86%) 39/50 (78%) 30/50 (60%) 26/50 (52%) Adjusted rate 95.5% 95.0% 81.9% 66.1% Terminal rate 30/32 (94%) 24/26 (92%) 14/20 (70%) 18/31 (58%) First incidence (days) 529 475 506 550 Life table test P=0.002N P=0.446 P=0.563 P=0.003N Logistic regression test P<0.001N P=0.174N P=0.007N P<0.001N Cochran-Armitage test P<0.001N Fisher exact test P=0.218N P=0.003N P<0.001N
All Organs: Malignant Neoplasms Overall rate 21/50 (42%) 26/50 (52%) 34/50 (68%) 22/50 (44%) Adjusted rate 51.1% 60.1% 76.4% 51.6% Terminal rate 13/32 (41%) 10/26 (38%) 10/20 (50%) 11/31 (35%) First incidence (days) 223 288 414 613 Life table test P=0.502 P=0.146 P=0.001 P=0.498 Logistic regression test P=0.461 P=0.205 P=0.013 P=0.496 Cochran-Armitage test P=0.477 Fisher exact test P=0.212 P=0.008 P=0.500
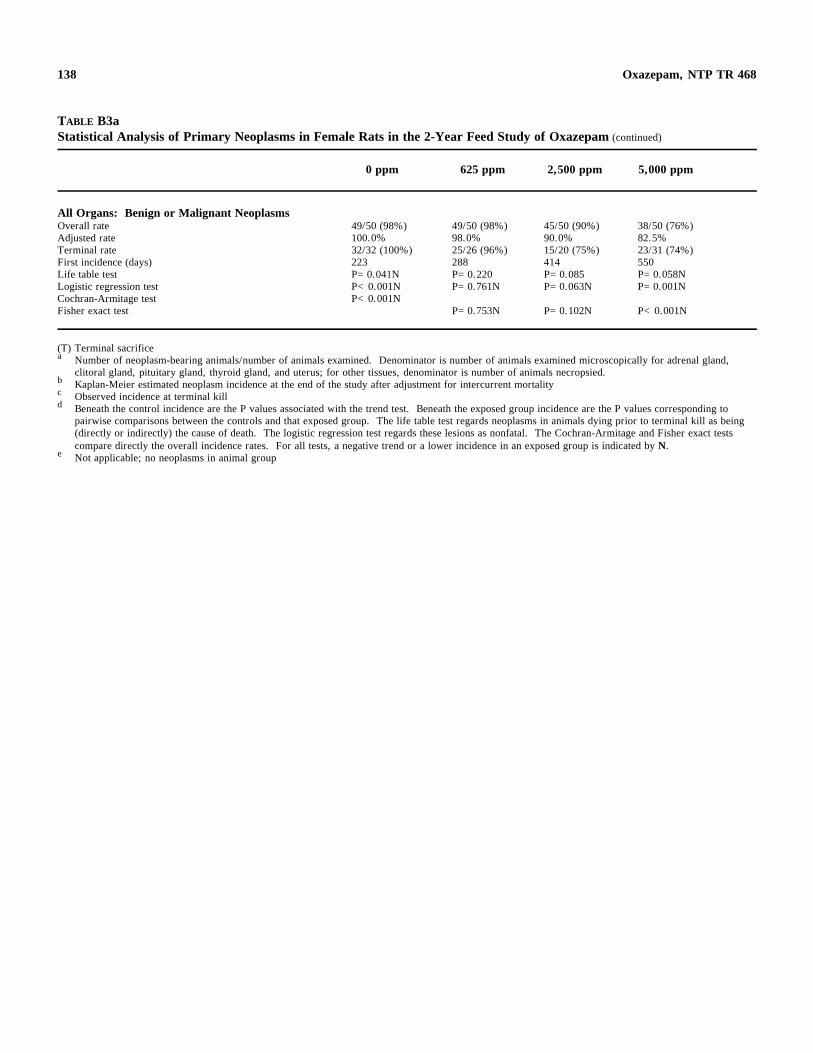
138
c
Oxazepam, NTP TR 468
TABLE B3a Statistical Analysis of Primary Neoplasms in Female Rats in the 2-Year Feed Study of Oxazepam (continued)
0 ppm 625 ppm 2,500 ppm 5,000 ppm
All Organs: Benign or Malignant Neoplasms Overall rate 49/50 (98%) 49/50 (98%) 45/50 (90%) 38/50 (76%) Adjusted rate 100.0% 98.0% 90.0% 82.5% Terminal rate 32/32 (100%) 25/26 (96%) 15/20 (75%) 23/31 (74%) First incidence (days) 223 288 414 550 Life table test P=0.041N P=0.220 P=0.085 P=0.058N Logistic regression test P<0.001N P=0.761N P=0.063N P=0.001N Cochran-Armitage test P<0.001N Fisher exact test P=0.753N P=0.102N P<0.001N
(T) Terminal sacrifice a Number of neoplasm-bearing animals/number of animals examined. Denominator is number of animals examined microscopically for adrenal gland,
clitoral gland, pituitary gland, thyroid gland, and uterus; for other tissues, denominator is number of animals necropsied.b Kaplan-Meier estimated neoplasm incidence at the end of the study after adjustment for intercurrent mortality
Observed incidence at terminal kill d Beneath the control incidence are the P values associated with the trend test. Beneath the exposed group incidence are the P values corresponding to
pairwise comparisons between the controls and that exposed group. The life table test regards neoplasms in animals dying prior to terminal kill as being (directly or indirectly) the cause of death. The logistic regression test regards these lesions as nonfatal. The Cochran-Armitage and Fisher exact tests compare directly the overall incidence rates. For all tests, a negative trend or a lower incidence in an exposed group is indicated by N.
e Not applicable; no neoplasms in animal group
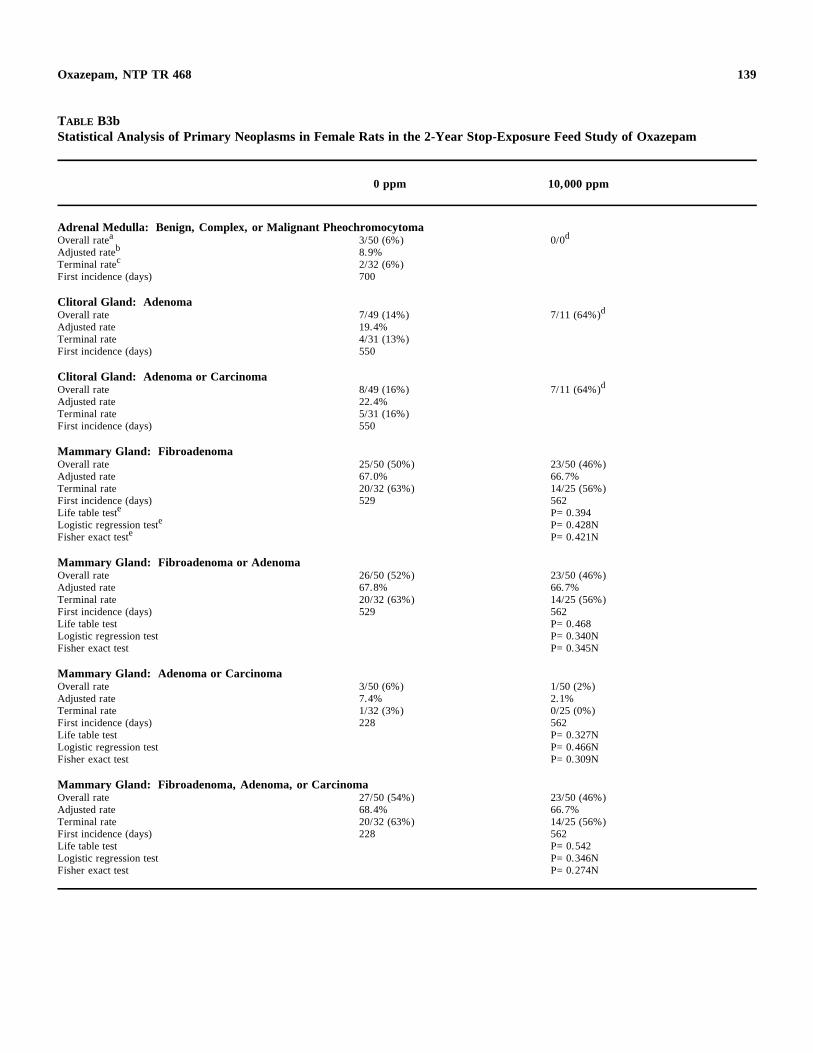
139 Oxazepam, NTP TR 468
TABLE B3b Statistical Analysis of Primary Neoplasms in Female Rats in the 2-Year Stop-Exposure Feed Study of Oxazepam
0 ppm 10,000 ppm
Adrenal Medulla: Benign, Complex, or Malignant Pheochromocytoma Overall ratea 3/50 (6%) 0/0d
Adjusted rateb 8.9% cTerminal rate 2/32 (6%)
First incidence (days) 700
Clitoral Gland: Adenoma Overall rate 7/49 (14%) 7/11 (64%)d
Adjusted rate 19.4% Terminal rate 4/31 (13%) First incidence (days) 550
Clitoral Gland: Adenoma or Carcinoma Overall rate 8/49 (16%) 7/11 (64%)d
Adjusted rate 22.4% Terminal rate 5/31 (16%) First incidence (days) 550
Mammary Gland: Fibroadenoma Overall rate 25/50 (50%) 23/50 (46%) Adjusted rate 67.0% 66.7% Terminal rate 20/32 (63%) 14/25 (56%) First incidence (days) 529 562 Life table teste P=0.394
eLogistic regression test P=0.428N Fisher exact teste P=0.421N
Mammary Gland: Fibroadenoma or Adenoma Overall rate 26/50 (52%) 23/50 (46%) Adjusted rate 67.8% 66.7% Terminal rate 20/32 (63%) 14/25 (56%) First incidence (days) 529 562 Life table test P=0.468 Logistic regression test P=0.340N Fisher exact test P=0.345N
Mammary Gland: Adenoma or Carcinoma Overall rate 3/50 (6%) 1/50 (2%) Adjusted rate 7.4% 2.1% Terminal rate 1/32 (3%) 0/25 (0%) First incidence (days) 228 562 Life table test P=0.327N Logistic regression test P=0.466N Fisher exact test P=0.309N
Mammary Gland: Fibroadenoma, Adenoma, or Carcinoma Overall rate 27/50 (54%) 23/50 (46%) Adjusted rate 68.4% 66.7% Terminal rate 20/32 (63%) 14/25 (56%) First incidence (days) 228 562 Life table test P=0.542 Logistic regression test P=0.346N Fisher exact test P=0.274N
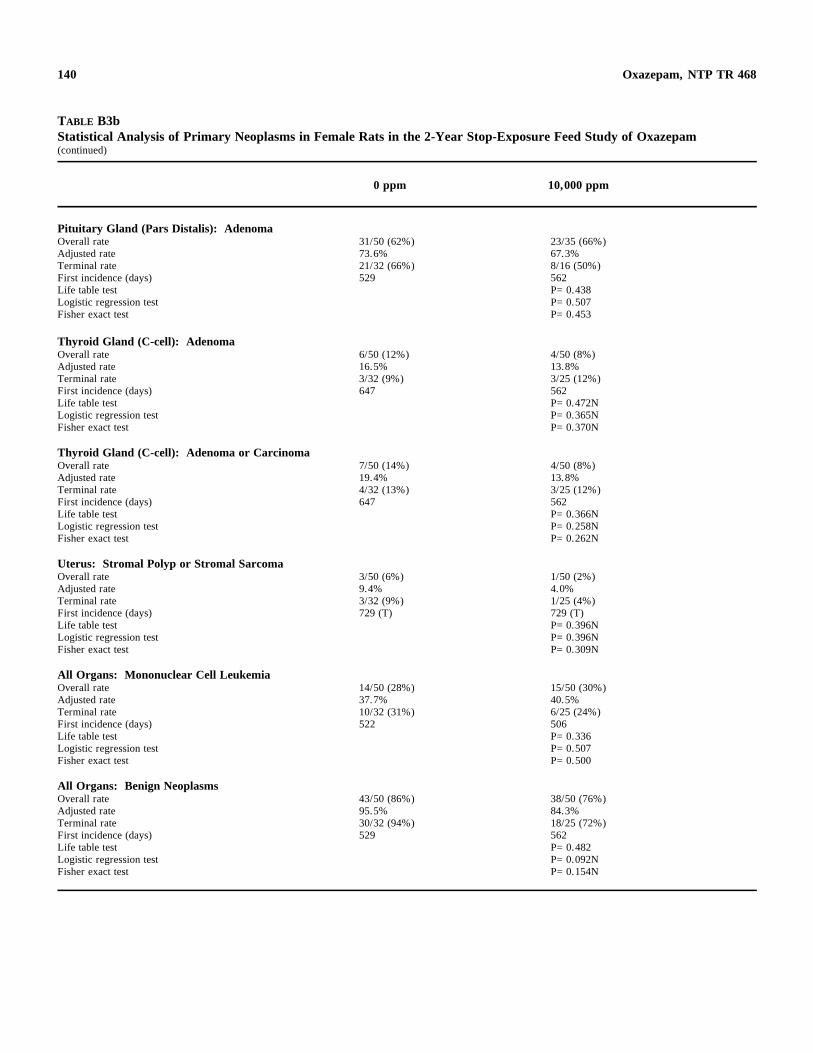
140 Oxazepam, NTP TR 468
TABLE B3b Statistical Analysis of Primary Neoplasms in Female Rats in the 2-Year Stop-Exposure Feed Study of Oxazepam (continued)
0 ppm 10,000 ppm
Pituitary Gland (Pars Distalis): Adenoma Overall rate 31/50 (62%) 23/35 (66%) Adjusted rate 73.6% 67.3% Terminal rate 21/32 (66%) 8/16 (50%) First incidence (days) 529 562 Life table test P=0.438 Logistic regression test P=0.507 Fisher exact test P=0.453
Thyroid Gland (C-cell): Adenoma Overall rate 6/50 (12%) 4/50 (8%) Adjusted rate 16.5% 13.8% Terminal rate 3/32 (9%) 3/25 (12%) First incidence (days) 647 562 Life table test P=0.472N Logistic regression test P=0.365N Fisher exact test P=0.370N
Thyroid Gland (C-cell): Adenoma or Carcinoma Overall rate 7/50 (14%) 4/50 (8%) Adjusted rate 19.4% 13.8% Terminal rate 4/32 (13%) 3/25 (12%) First incidence (days) 647 562 Life table test P=0.366N Logistic regression test P=0.258N Fisher exact test P=0.262N
Uterus: Stromal Polyp or Stromal Sarcoma Overall rate 3/50 (6%) 1/50 (2%) Adjusted rate 9.4% 4.0% Terminal rate 3/32 (9%) 1/25 (4%) First incidence (days) 729 (T) 729 (T) Life table test P=0.396N Logistic regression test P=0.396N Fisher exact test P=0.309N
All Organs: Mononuclear Cell Leukemia Overall rate 14/50 (28%) 15/50 (30%) Adjusted rate 37.7% 40.5% Terminal rate 10/32 (31%) 6/25 (24%) First incidence (days) 522 506 Life table test P=0.336 Logistic regression test P=0.507 Fisher exact test P=0.500
All Organs: Benign Neoplasms Overall rate 43/50 (86%) 38/50 (76%) Adjusted rate 95.5% 84.3% Terminal rate 30/32 (94%) 18/25 (72%) First incidence (days) 529 562 Life table test P=0.482 Logistic regression test P=0.092N Fisher exact test P=0.154N
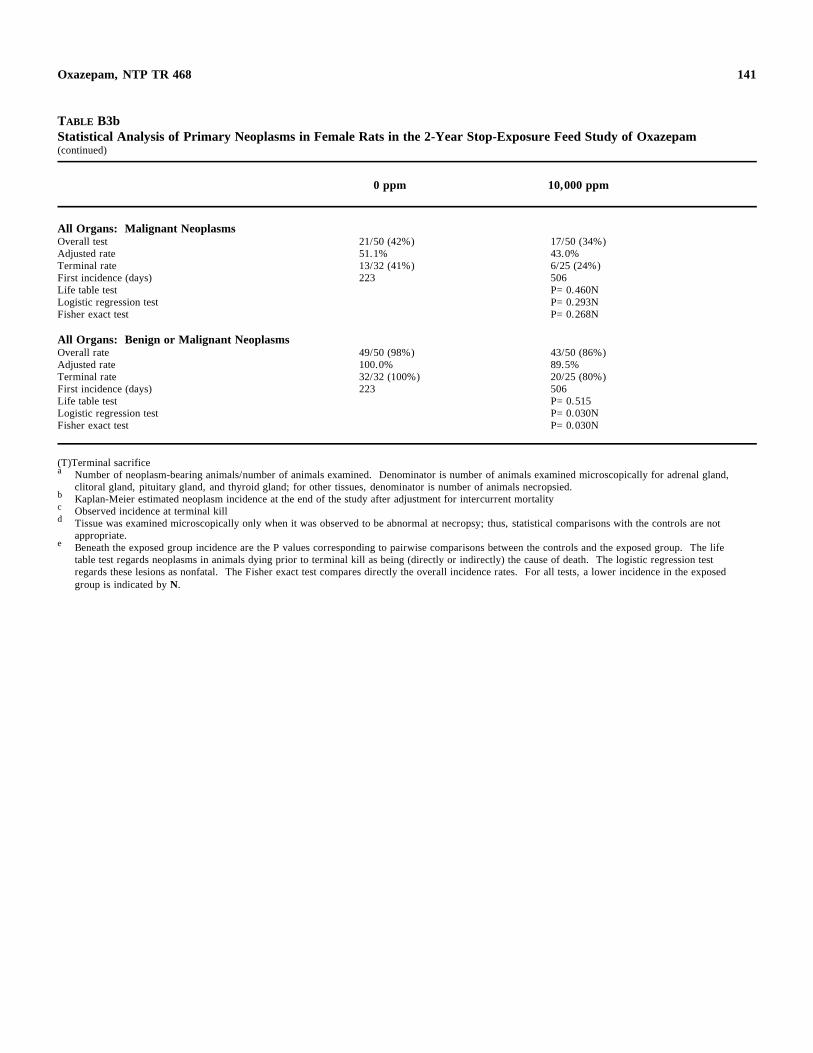
141
c
Oxazepam, NTP TR 468
TABLE B3b Statistical Analysis of Primary Neoplasms in Female Rats in the 2-Year Stop-Exposure Feed Study of Oxazepam (continued)
0 ppm 10,000 ppm
All Organs: Malignant Neoplasms Overall test 21/50 (42%) 17/50 (34%) Adjusted rate 51.1% 43.0% Terminal rate 13/32 (41%) 6/25 (24%) First incidence (days) 223 506 Life table test P=0.460N Logistic regression test P=0.293N Fisher exact test P=0.268N
All Organs: Benign or Malignant Neoplasms Overall rate 49/50 (98%) 43/50 (86%) Adjusted rate 100.0% 89.5% Terminal rate 32/32 (100%) 20/25 (80%) First incidence (days) 223 506 Life table test P=0.515 Logistic regression test P=0.030N Fisher exact test P=0.030N
(T)Terminal sacrifice a Number of neoplasm-bearing animals/number of animals examined. Denominator is number of animals examined microscopically for adrenal gland,
clitoral gland, pituitary gland, and thyroid gland; for other tissues, denominator is number of animals necropsied.b Kaplan-Meier estimated neoplasm incidence at the end of the study after adjustment for intercurrent mortality
Observed incidence at terminal kill d Tissue was examined microscopically only when it was observed to be abnormal at necropsy; thus, statistical comparisons with the controls are not
appropriate. e Beneath the exposed group incidence are the P values corresponding to pairwise comparisons between the controls and the exposed group. The life
table test regards neoplasms in animals dying prior to terminal kill as being (directly or indirectly) the cause of death. The logistic regression test regards these lesions as nonfatal. The Fisher exact test compares directly the overall incidence rates. For all tests, a lower incidence in the exposed group is indicated by N.
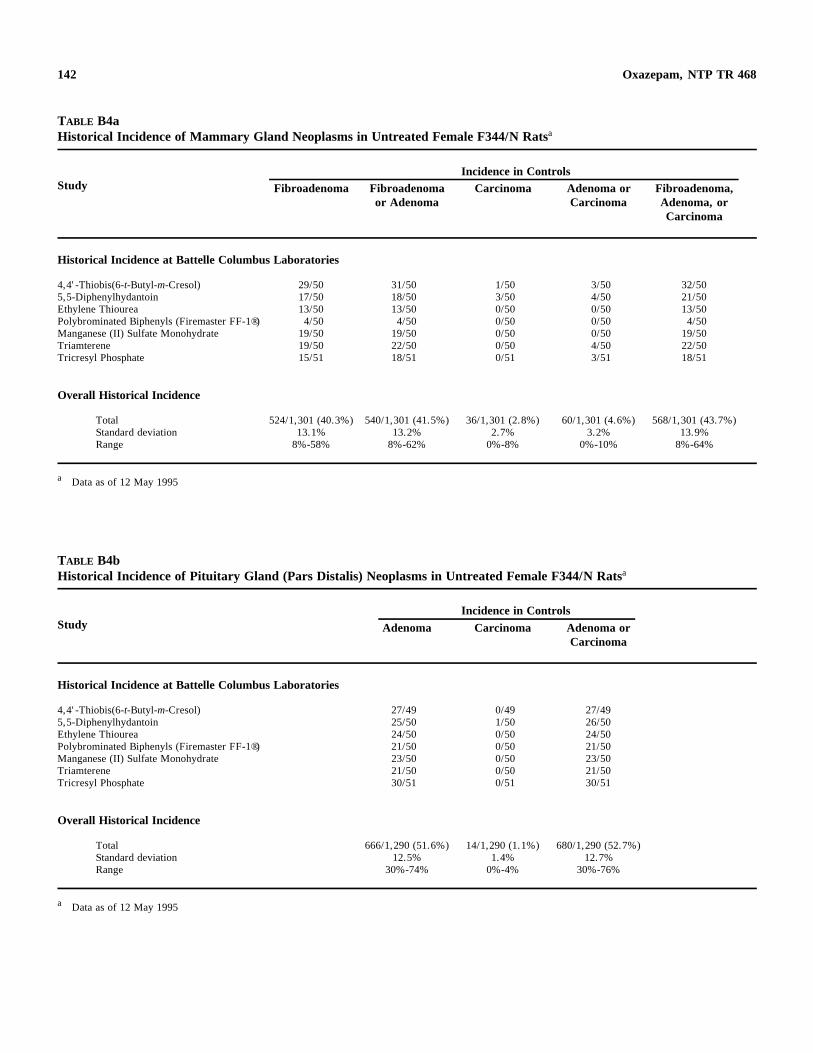
142 Oxazepam, NTP TR 468
TABLE B4a Historical Incidence of Mammary Gland Neoplasms in Untreated Female F344/N Ratsa
Incidence in Controls Study Fibroadenoma Fibroadenoma Carcinoma Adenoma or Fibroadenoma,
or Adenoma Carcinoma Adenoma, or Carcinoma
Historical Incidence at Battelle Columbus Laboratories
4,4'-Thiobis(6-t-Butyl-m-Cresol) 29/50 31/50 1/50 3/50 32/50 5,5-Diphenylhydantoin 17/50 18/50 3/50 4/50 21/50 Ethylene Thiourea 13/50 13/50 0/50 0/50 13/50 Polybrominated Biphenyls (Firemaster FF-1®) 4/50 4/50 0/50 0/50 4/50 Manganese (II) Sulfate Monohydrate 19/50 19/50 0/50 0/50 19/50 Triamterene 19/50 22/50 0/50 4/50 22/50 Tricresyl Phosphate 15/51 18/51 0/51 3/51 18/51
Overall Historical Incidence
Total 524/1,301 (40.3%) 540/1,301 (41.5%) 36/1,301 (2.8%) 60/1,301 (4.6%) 568/1,301 (43.7%) Standard deviation 13.1% 13.2% 2.7% 3.2% 13.9% Range 8%-58% 8%-62% 0%-8% 0%-10% 8%-64%
a Data as of 12 May 1995
TABLE B4b Historical Incidence of Pituitary Gland (Pars Distalis) Neoplasms in Untreated Female F344/N Ratsa
Incidence in Controls Study Adenoma Carcinoma Adenoma or
Carcinoma
Historical Incidence at Battelle Columbus Laboratories
4,4'-Thiobis(6-t-Butyl-m-Cresol) 27/49 0/49 27/49 5,5-Diphenylhydantoin 25/50 1/50 26/50 Ethylene Thiourea 24/50 0/50 24/50 Polybrominated Biphenyls (Firemaster FF-1®) 21/50 0/50 21/50 Manganese (II) Sulfate Monohydrate 23/50 0/50 23/50 Triamterene 21/50 0/50 21/50 Tricresyl Phosphate 30/51 0/51 30/51
Overall Historical Incidence
Total 666/1,290 (51.6%) 14/1,290 (1.1%) 680/1,290 (52.7%) Standard deviation 12.5% 1.4% 12.7% Range 30%-74% 0%-4% 30%-76%
a Data as of 12 May 1995
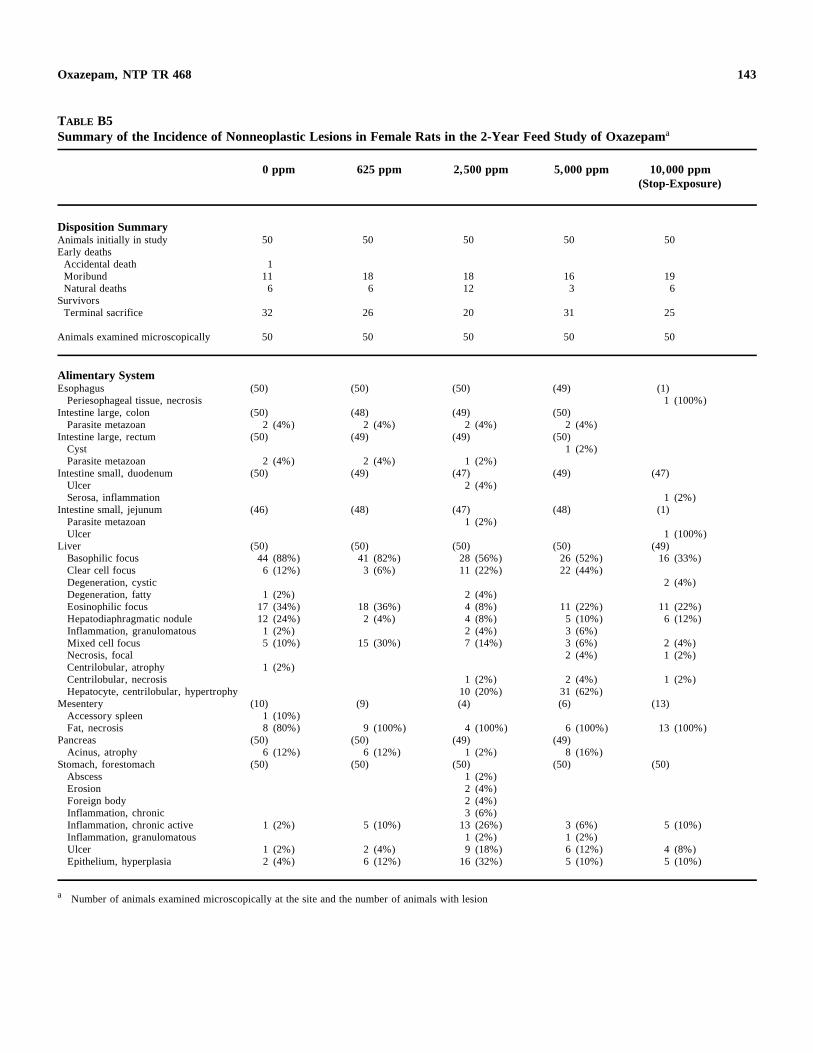
143 Oxazepam, NTP TR 468
TABLE B5 Summary of the Incidence of Nonneoplastic Lesions in Female Rats in the 2-Year Feed Study of Oxazepama
0 ppm 625 ppm 2,500 ppm 5,000 ppm 10,000 ppm (Stop-Exposure)
Disposition Summary Animals initially in study 50 50 50 50 50 Early deaths Accidental death 1 Moribund 11 18 18 16 19 Natural deaths 6 6 12 3 6
Survivors Terminal sacrifice 32 26 20 31 25
Animals examined microscopically 50 50 50 50 50
Alimentary System Esophagus (50) (50) (50) (49) (1)
Periesophageal tissue, necrosis 1 (100%) Intestine large, colon (50) (48) (49) (50)
Parasite metazoan 2 (4%) 2 (4%) 2 (4%) 2 (4%) Intestine large, rectum (50) (49) (49) (50)
Cyst 1 (2%) Parasite metazoan 2 (4%) 2 (4%) 1 (2%)
Intestine small, duodenum (50) (49) (47) (49) (47) Ulcer 2 (4%) Serosa, inflammation 1 (2%)
Intestine small, jejunum (46) (48) (47) (48) (1) Parasite metazoan 1 (2%) Ulcer 1 (100%)
Liver (50) (50) (50) (50) (49) Basophilic focus 44 (88%) 41 (82%) 28 (56%) 26 (52%) 16 (33%) Clear cell focus 6 (12%) 3 (6%) 11 (22%) 22 (44%) Degeneration, cystic 2 (4%) Degeneration, fatty 1 (2%) 2 (4%) Eosinophilic focus 17 (34%) 18 (36%) 4 (8%) 11 (22%) 11 (22%) Hepatodiaphragmatic nodule 12 (24%) 2 (4%) 4 (8%) 5 (10%) 6 (12%) Inflammation, granulomatous 1 (2%) 2 (4%) 3 (6%) Mixed cell focus 5 (10%) 15 (30%) 7 (14%) 3 (6%) 2 (4%) Necrosis, focal 2 (4%) 1 (2%) Centrilobular, atrophy 1 (2%) Centrilobular, necrosis 1 (2%) 2 (4%) 1 (2%) Hepatocyte, centrilobular, hypertrophy 10 (20%) 31 (62%)
Mesentery (10) (9) (4) (6) (13) Accessory spleen 1 (10%) Fat, necrosis 8 (80%) 9 (100%) 4 (100%) 6 (100%) 13 (100%)
Pancreas (50) (50) (49) (49) Acinus, atrophy 6 (12%) 6 (12%) 1 (2%) 8 (16%)
Stomach, forestomach (50) (50) (50) (50) (50) Abscess 1 (2%) Erosion 2 (4%) Foreign body 2 (4%) Inflammation, chronic 3 (6%) Inflammation, chronic active 1 (2%) 5 (10%) 13 (26%) 3 (6%) 5 (10%) Inflammation, granulomatous 1 (2%) 1 (2%) Ulcer 1 (2%) 2 (4%) 9 (18%) 6 (12%) 4 (8%) Epithelium, hyperplasia 2 (4%) 6 (12%) 16 (32%) 5 (10%) 5 (10%)
a Number of animals examined microscopically at the site and the number of animals with lesion
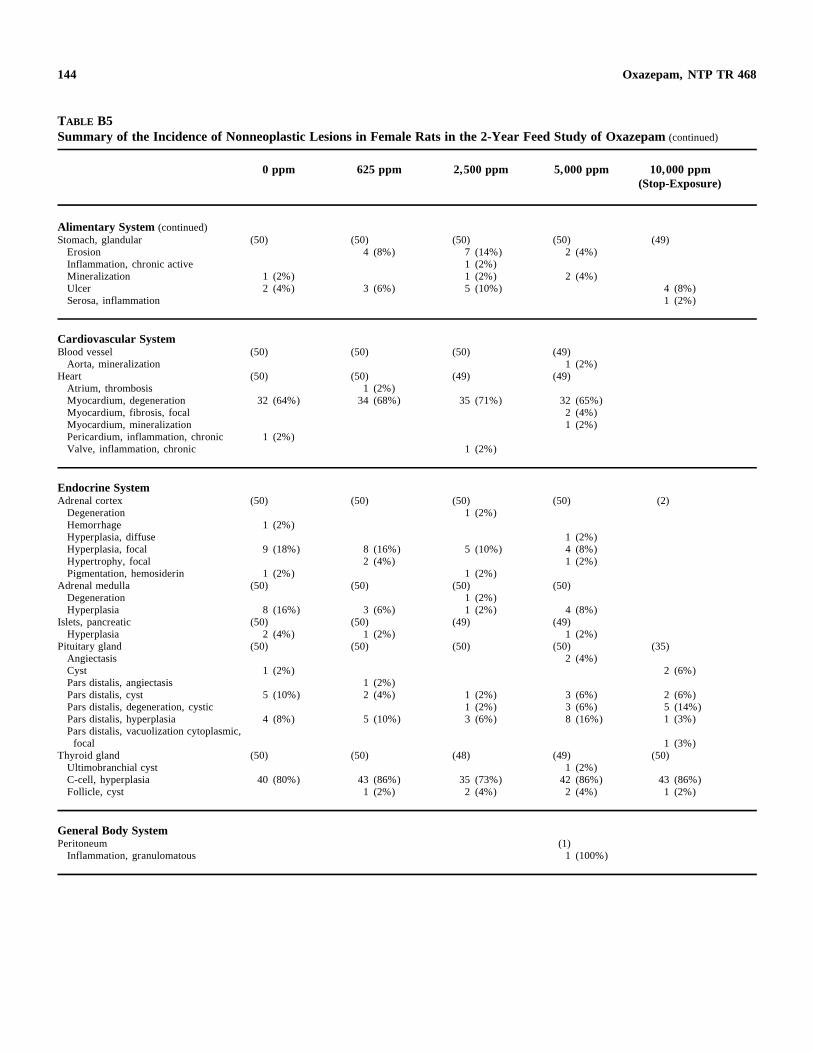
144 Oxazepam, NTP TR 468
TABLE B5 Summary of the Incidence of Nonneoplastic Lesions in Female Rats in the 2-Year Feed Study of Oxazepam (continued)
0 ppm 625 ppm 2,500 ppm 5,000 ppm 10,000 ppm (Stop-Exposure)
Alimentary System (continued) Stomach, glandular (50) (50) (50) (50) (49)
Erosion 4 (8%) 7 (14%) 2 (4%) Inflammation, chronic active 1 (2%) Mineralization 1 (2%) 1 (2%) 2 (4%) Ulcer 2 (4%) 3 (6%) 5 (10%) 4 (8%) Serosa, inflammation 1 (2%)
Cardiovascular System Blood vessel (50) (50) (50) (49)
Aorta, mineralization 1 (2%) Heart (50) (50) (49) (49)
Atrium, thrombosis 1 (2%) Myocardium, degeneration 32 (64%) 34 (68%) 35 (71%) 32 (65%) Myocardium, fibrosis, focal 2 (4%) Myocardium, mineralization 1 (2%) Pericardium, inflammation, chronic 1 (2%) Valve, inflammation, chronic 1 (2%)
Endocrine System Adrenal cortex (50) (50) (50) (50) (2)
Degeneration 1 (2%) Hemorrhage 1 (2%) Hyperplasia, diffuse 1 (2%) Hyperplasia, focal 9 (18%) 8 (16%) 5 (10%) 4 (8%) Hypertrophy, focal 2 (4%) 1 (2%) Pigmentation, hemosiderin 1 (2%) 1 (2%)
Adrenal medulla (50) (50) (50) (50) Degeneration 1 (2%) Hyperplasia 8 (16%) 3 (6%) 1 (2%) 4 (8%)
Islets, pancreatic (50) (50) (49) (49) Hyperplasia 2 (4%) 1 (2%) 1 (2%)
Pituitary gland (50) (50) (50) (50) (35) Angiectasis 2 (4%) Cyst 1 (2%) 2 (6%) Pars distalis, angiectasis 1 (2%) Pars distalis, cyst 5 (10%) 2 (4%) 1 (2%) 3 (6%) 2 (6%) Pars distalis, degeneration, cystic 1 (2%) 3 (6%) 5 (14%) Pars distalis, hyperplasia 4 (8%) 5 (10%) 3 (6%) 8 (16%) 1 (3%) Pars distalis, vacuolization cytoplasmic, focal 1 (3%)
Thyroid gland (50) (50) (48) (49) (50) Ultimobranchial cyst 1 (2%) C-cell, hyperplasia 40 (80%) 43 (86%) 35 (73%) 42 (86%) 43 (86%) Follicle, cyst 1 (2%) 2 (4%) 2 (4%) 1 (2%)
General Body System Peritoneum (1)
Inflammation, granulomatous 1 (100%)
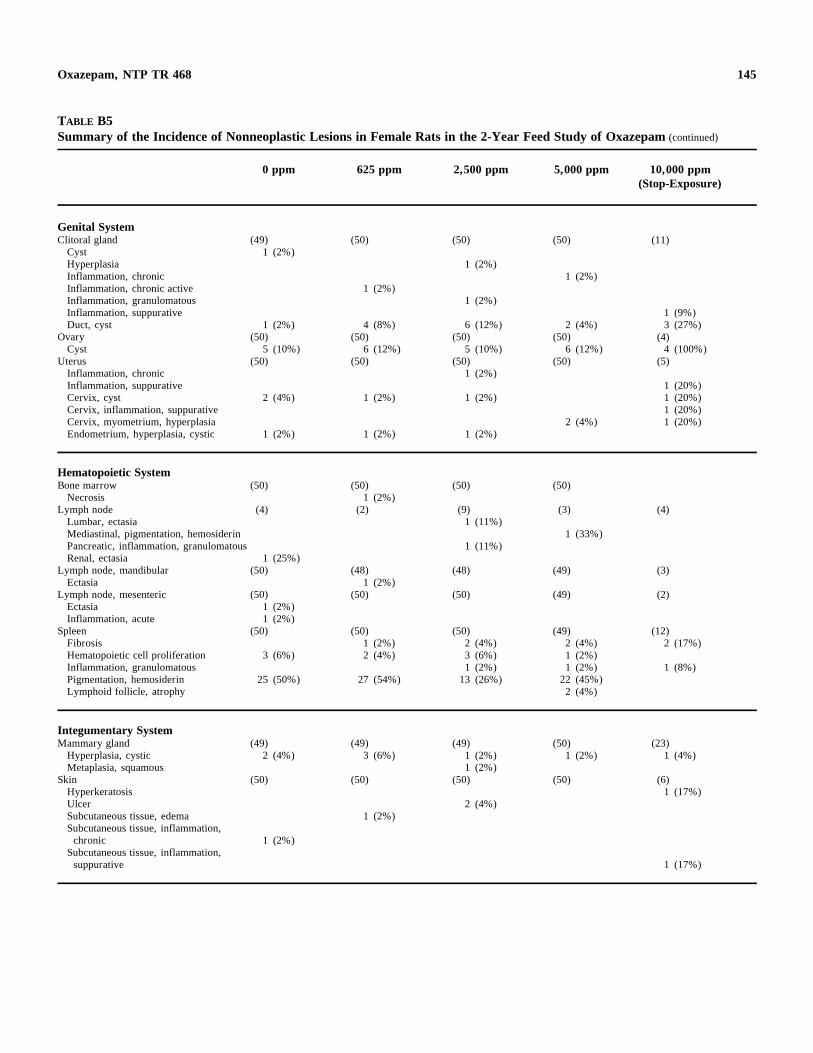
145 Oxazepam, NTP TR 468
TABLE B5 Summary of the Incidence of Nonneoplastic Lesions in Female Rats in the 2-Year Feed Study of Oxazepam (continued)
0 ppm 625 ppm 2,500 ppm 5,000 ppm 10,000 ppm (Stop-Exposure)
Genital System Clitoral gland (49) (50) (50) (50) (11)
Cyst 1 (2%) Hyperplasia 1 (2%) Inflammation, chronic 1 (2%) Inflammation, chronic active 1 (2%) Inflammation, granulomatous 1 (2%) Inflammation, suppurative 1 (9%) Duct, cyst 1 (2%) 4 (8%) 6 (12%) 2 (4%) 3 (27%)
Ovary (50) (50) (50) (50) (4) Cyst 5 (10%) 6 (12%) 5 (10%) 6 (12%) 4 (100%)
Uterus (50) (50) (50) (50) (5) Inflammation, chronic 1 (2%) Inflammation, suppurative 1 (20%) Cervix, cyst 2 (4%) 1 (2%) 1 (2%) 1 (20%) Cervix, inflammation, suppurative 1 (20%) Cervix, myometrium, hyperplasia 2 (4%) 1 (20%) Endometrium, hyperplasia, cystic 1 (2%) 1 (2%) 1 (2%)
Hematopoietic System Bone marrow (50) (50) (50) (50)
Necrosis 1 (2%) Lymph node (4) (2) (9) (3) (4)
Lumbar, ectasia 1 (11%) Mediastinal, pigmentation, hemosiderin 1 (33%) Pancreatic, inflammation, granulomatous 1 (11%) Renal, ectasia 1 (25%)
Lymph node, mandibular (50) (48) (48) (49) (3) Ectasia 1 (2%)
Lymph node, mesenteric (50) (50) (50) (49) (2) Ectasia 1 (2%) Inflammation, acute 1 (2%)
Spleen (50) (50) (50) (49) (12) Fibrosis 1 (2%) 2 (4%) 2 (4%) 2 (17%) Hematopoietic cell proliferation 3 (6%) 2 (4%) 3 (6%) 1 (2%) Inflammation, granulomatous 1 (2%) 1 (2%) 1 (8%) Pigmentation, hemosiderin 25 (50%) 27 (54%) 13 (26%) 22 (45%) Lymphoid follicle, atrophy 2 (4%)
Integumentary System Mammary gland (49) (49) (49) (50) (23)
Hyperplasia, cystic 2 (4%) 3 (6%) 1 (2%) 1 (2%) 1 (4%) Metaplasia, squamous 1 (2%)
Skin (50) (50) (50) (50) (6) Hyperkeratosis 1 (17%) Ulcer 2 (4%) Subcutaneous tissue, edema 1 (2%) Subcutaneous tissue, inflammation, chronic 1 (2%)
Subcutaneous tissue, inflammation, suppurative 1 (17%)
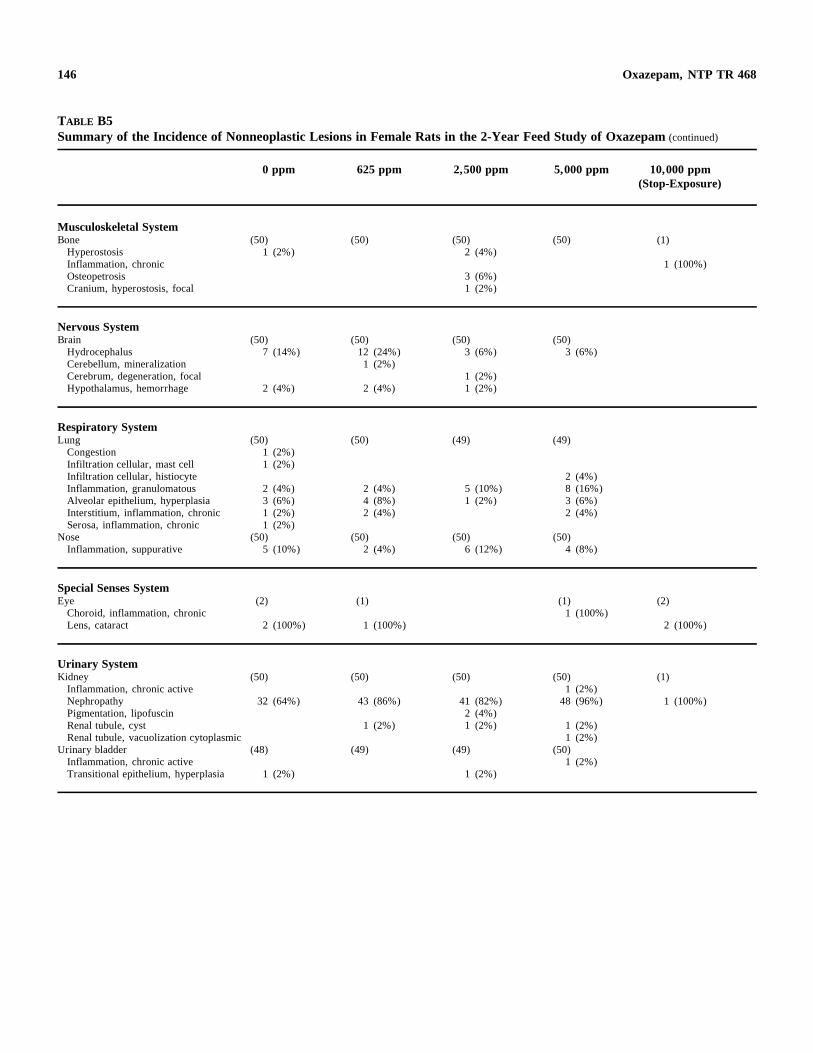
146 Oxazepam, NTP TR 468
TABLE B5 Summary of the Incidence of Nonneoplastic Lesions in Female Rats in the 2-Year Feed Study of Oxazepam (continued)
0 ppm 625 ppm 2,500 ppm 5,000 ppm 10,000 ppm (Stop-Exposure)
Musculoskeletal System Bone (50) (50) (50) (50) (1)
Hyperostosis 1 (2%) 2 (4%) Inflammation, chronic 1 (100%) Osteopetrosis 3 (6%) Cranium, hyperostosis, focal 1 (2%)
Nervous System Brain (50) (50) (50) (50)
Hydrocephalus 7 (14%) 12 (24%) 3 (6%) 3 (6%) Cerebellum, mineralization 1 (2%) Cerebrum, degeneration, focal 1 (2%) Hypothalamus, hemorrhage 2 (4%) 2 (4%) 1 (2%)
Respiratory System Lung (50) (50) (49) (49)
Congestion 1 (2%) Infiltration cellular, mast cell 1 (2%) Infiltration cellular, histiocyte 2 (4%) Inflammation, granulomatous 2 (4%) 2 (4%) 5 (10%) 8 (16%) Alveolar epithelium, hyperplasia 3 (6%) 4 (8%) 1 (2%) 3 (6%) Interstitium, inflammation, chronic 1 (2%) 2 (4%) 2 (4%) Serosa, inflammation, chronic 1 (2%)
Nose (50) (50) (50) (50) Inflammation, suppurative 5 (10%) 2 (4%) 6 (12%) 4 (8%)
Special Senses System Eye (2) (1) (1) (2)
Choroid, inflammation, chronic 1 (100%) Lens, cataract 2 (100%) 1 (100%) 2 (100%)
Urinary System Kidney (50) (50) (50) (50) (1)
Inflammation, chronic active 1 (2%) Nephropathy 32 (64%) 43 (86%) 41 (82%) 48 (96%) 1 (100%) Pigmentation, lipofuscin 2 (4%) Renal tubule, cyst 1 (2%) 1 (2%) 1 (2%) Renal tubule, vacuolization cytoplasmic 1 (2%)
Urinary bladder (48) (49) (49) (50) Inflammation, chronic active 1 (2%) Transitional epithelium, hyperplasia 1 (2%) 1 (2%)
147
APPENDIX C GENETIC TOXICOLOGY
SALMONELLA MUTAGENICITY TEST PROTOCOL . . . . . . . . . . . . . . . . . . . . . . . . . . . . . . . . . . . . . . . . 148 CHINESE HAMSTER OVARY CELL CYTOGENETICS PROTOCOLS . . . . . . . . . . . . . . . . . . . . . . . . . . . . . . 148 MOUSE PERIPHERAL BLOOD MICRONUCLEUS TEST PROTOCOL . . . . . . . . . . . . . . . . . . . . . . . . . . . . . 149 RESULTS . . . . . . . . . . . . . . . . . . . . . . . . . . . . . . . . . . . . . . . . . . . . . . . . . . . . . . . . . . . . . . . . 150 TABLE C1 Mutagenicity of Oxazepam in Salmonella typhimurium . . . . . . . . . . . . . . . . . . . . . . . 151 TABLE C2 Induction of Sister Chromatid Exchanges in Chinese Hamster Ovary Cells
by Oxazepam . . . . . . . . . . . . . . . . . . . . . . . . . . . . . . . . . . . . . . . . . . . . . . . . . . . 153 TABLE C3 Induction of Chromosomal Aberrations in Chinese Hamster Ovary Cells
by Oxazepam . . . . . . . . . . . . . . . . . . . . . . . . . . . . . . . . . . . . . . . . . . . . . . . . . . . 154 TABLE C4 Frequency of Micronuclei in Peripheral Blood Erythrocytes
of Mice Following Treatment with Oxazepam by Feed for 14 Weeks . . . . . . . . . . . . . . 154
148 Oxazepam, NTP TR 468
GENETIC TOXICOLOGY
SALMONELLA MUTAGENICITY TEST PROTOCOL Testing was performed as reported by Zeiger et al. (1992). Oxazepam was sent to the laboratory as a coded aliquot from Radian Corporation (Austin, TX). Oxazepam was incubated with the Salmonella typhimurium tester strains TA97, TA98, TA100, TA102, and TA1535 either in buffer or S9 mix (metabolic activation enzymes and cofactors from Aroclor 1254-induced male Sprague-Dawley rat or Syrian hamster liver) for 20 minutes at 37E C. Top agar supplemented with L-histidine and d-biotin was added, and the contents of the tubes were mixed and poured onto the surfaces of minimal glucose agar plates. Histidine-independent mutant colonies arising on these plates were counted following incubation for 2 days at 37E C.
Each trial consisted of triplicate plates of concurrent positive and negative controls and at least three doses of oxazepam. The high dose was limited by solubility and toxicity.
In this assay, a positive response is defined as a reproducible, dose-related increase in histidine-independent (revertant) colonies in any one strain/activation combination. An equivocal response is defined as an increase in revertants that is not dose related, not reproducible, or not of sufficient magnitude to support a determination of mutagenicity. A negative response is obtained when no increase in revertant colonies is observed following chemical treatment. No minimum percentage or fold increase is required for a chemical to be judged positive or weakly positive.
CHINESE HAMSTER OVARY CELL CYTOGENETICS PROTOCOLS Testing was performed as reported by Galloway et al. (1987). Oxazepam was sent to the laboratory as a coded aliquot by Radian Corporation. Oxazepam was tested in cultured Chinese hamster ovary (CHO) cells for induction of sister chromatid exchanges (SCEs) and chromosomal aberrations (Abs), both in the presence and absence of Aroclor 1254-induced male Sprague-Dawley rat liver S9 and cofactor mix. Cultures were handled under gold lights to prevent photolysis of bromodeoxyuridine-substituted DNA. Each test consisted of concurrent solvent and positive controls and of at least three doses of oxazepam. The high dose was limited by toxicity. A single flask per dose was used, and tests yielding positive results were repeated.
Sister Chromatid Exchange Test: In the SCE test without S9, CHO cells were incubated for 26 hours with oxazepam in McCoy’s 5A medium. Bromodeoxyuridine (BrdU) was added 2 hours after culture initiation. After 26 hours, the medium containing oxazepam was removed and replaced with fresh medium plus BrdU and Colcemid, and incubation was continued for 2 hours. Cells were then harvested by mitotic shake-off, fixed, and stained with Hoechst 33258 and Giemsa. In the SCE test with S9, cells were incubated with oxazepam, serum-free medium, and S9 for 2 hours. The medium was then removed and replaced with medium containing serum and BrdU and no oxazepam, and incubation proceeded for an additional 26 hours, with Colcemid present for the final 2 hours. Harvesting and staining were the same as for cells treated without S9. All slides were scored blind, and those from a single test were read by the same person. Fifty second-division metaphase cells were scored for frequency of SCEs/cell from each dose level. Because significant chemical-induced cell cycle delay was seen at the 50 µg/mL dose without S9, incubation time was lengthened to ensure a sufficient number of scorable (second-division metaphase) cells.
Statistical analyses were conducted on the slopes of the dose-response curves and the individual dose points (Galloway et al., 1987). An SCE frequency 20% above the concurrent solvent control value was chosen as a statistically conservative positive response. The probability of this level of difference occurring by chance at one dose point is less than 0.01; the probability for such a chance occurrence at two dose points is less than 0.001. An increase of 20% or greater at any single dose was considered weak evidence of activity; increases
149 Oxazepam, NTP TR 468
at two or more doses resulted in a determination that the trial was positive. A statistically significant trend (P#0.05) in the absence of any responses reaching 20% above background led to a call of equivocal.
Chromosomal Aberrations Test: In the Abs test without S9, cells were incubated in McCoy’s 5A medium with oxazepam for 12 hours; Colcemid was added and incubation continued for 2 hours. The cells were then harvested by mitotic shake-off, fixed, and stained with Giemsa. For the Abs test with S9, cells were treated with oxazepam and S9 for 2 hours, after which the treatment medium was removed and the cells were incubated for 10 hours in fresh medium, with Colcemid present for the final 2 hours. Cells were harvested in the same manner as for the treatment without S9.
Cells were selected for scoring on the basis of good morphology and completeness of karyotype (21 ± 2 chromosomes). All slides were scored blind and those from a single test were read by the same person. Two hundred first-division metaphase cells were scored at each dose level. Classes of aberrations included simple (breaks and terminal deletions), complex (rearrangements and translocations), and other (pulverized cells, despiralized chromosomes, and cells containing 10 or more aberrations).
Chromosomal aberration data are presented as percentage of cells with aberrations. To arrive at a statistical call for a trial, analyses were conducted on both the dose response curve and individual dose points. For a single trial, a statistically significant (P#0.05) difference for one dose point and a significant trend (P#0.015) were considered weak evidence for a positive response; significant differences for two or more doses indicated the trial was positive. A positive trend test in the absence of a statistically significant increase at any one dose resulted in an equivocal call (Galloway et al., 1987). Ultimately, the trial calls were based on a consideration of the statistical analyses as well as the biological information available to the reviewers.
MOUSE PERIPHERAL BLOOD MICRONUCLEUS TEST PROTOCOL A detailed discussion of this assay is presented in MacGregor et al. (1990). At the end of a 14-week study (NTP, 1993), peripheral blood samples were obtained from male and female B6C3F mice from each dose1
group and smears were immediately prepared and fixed in absolute methanol. The methanol-fixed slides were stained with a chromatin-specific fluorescent dye mixture of Hoechst 33258/pyronin Y (MacGregor et al., 1983), and coded. Slides were scanned to determine the frequency of micronuclei in 10,000 normochromatic erythrocytes (NCEs) in each of 10 animals per dose group.
The results were tabulated as the mean of the pooled results from all animals within a treatment group plus or minus the standard error of the mean. The frequency of micronucleated cells among NCEs was analyzed by a statistical software package that tested for increasing trend over dose groups with a one-tailed Cochran-Armitage trend test, followed by pairwise comparisions between each dosed group and the control group (Margolin et al., 1990). In the presence of excess binomial variation, as detected by a binomial dispersion test, the binomial variance of the Cochran-Armitage test was adjusted upward in proportion to the excess variation. In the micronucleus test, an individual trial is considered positive if the trend test P value is less than or equal to 0.025 or if the P value for any single dose group is less than or equal to 0.025 divided by the number of dose groups. A final call of positive for micronucleus induction is preferably based on reproducibly positive trial (as noted above). Results of the 14-week studies were accepted without repeat tests because additional test data could not be obtained. Ultimately, the final call is determined by the scientific staff after considering the results of statistical analyses, the reproducibility of any effects observed, and the magnitude of those effects.
RESULTS Oxazepam (3 to 3,333 µg/plate) did not induce mutations in S. typhimurium strains TA97, TA98, TA100, TA102, or TA1535 when tested in a preincubation protocol with or without Aroclor 1254-induced male
150 Oxazepam, NTP TR 468
Sprague-Dawley rat or Syrian hamster liver S9 (Table C1). In cytogenetic tests with cultured CHO cells, oxazepam did not induce sister chromatid exchanges (Table C2) or chromosomal Abs (Table C3), with or without S9. Cell cycle delay was noted at the 50 Fg/mL dose in the SCE test without S9; harvest time was extended to allow accumulation of sufficient second-division metaphase cells for analysis. Peripheral blood samples obtained from B6C3F mice in a 14-week toxicity study were analyzed for frequency of1
micronucleated NCEs; no increase in frequencies of micronucleated NCEs was observed in any of the dose groups (Table C4).
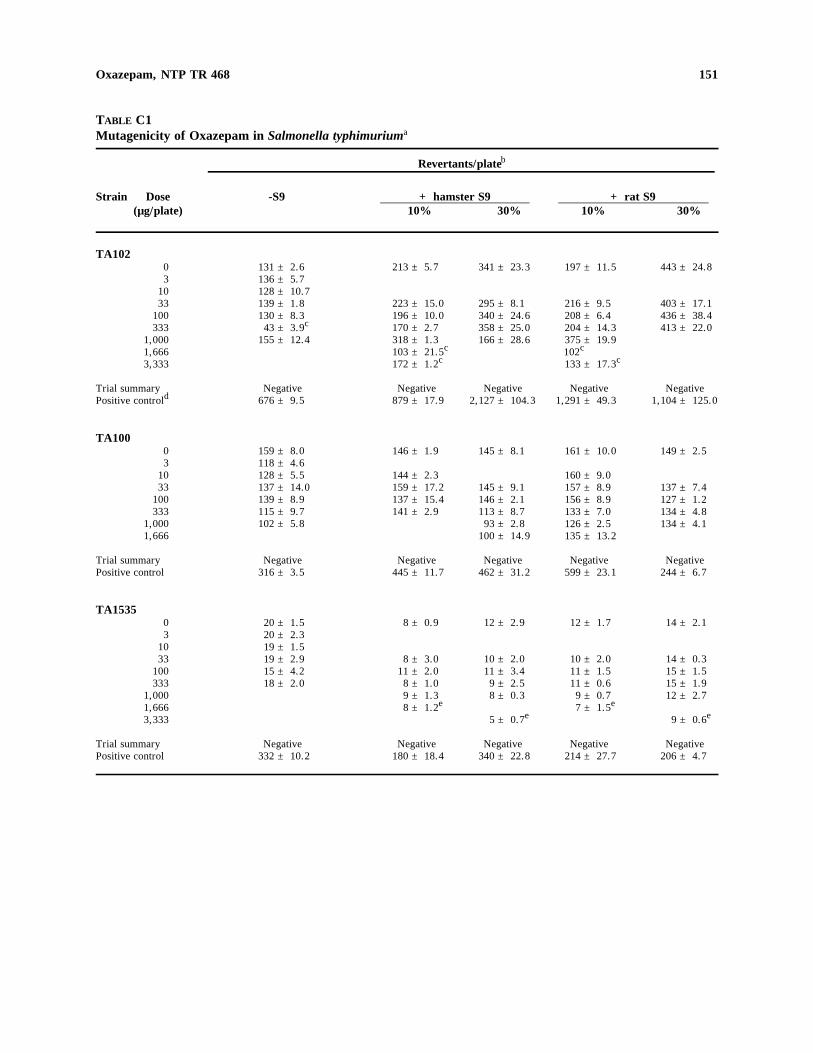
151 Oxazepam, NTP TR 468
TABLE C1 Mutagenicity of Oxazepam in Salmonella typhimuriuma
Revertants/plateb
Strain Dose (µg/plate)
-S9 + hamster S9 10% 30% 10%
+ rat S9 30%
TA102 0 3
10 33
100 333
1,000 1,666 3,333
131 ± 2.6 136 ± 5.7 128 ± 10.7 139 ± 1.8 130 ± 8.3 43 ± 3.9c
155 ± 12.4
213 ± 5.7
223 ± 15.0 196 ± 10.0 170 ± 2.7 318 ± 1.3 103 ± 21.5c
172 ± 1.2c
341 ± 23.3
295 ± 8.1 340 ± 24.6 358 ± 25.0 166 ± 28.6
197 ± 11.5
216 ± 9.5 208 ± 6.4 204 ± 14.3 375 ± 19.9 102c
133 ± 17.3c
443 ± 24.8
403 ± 17.1 436 ± 38.4 413 ± 22.0
Trial summary Positive controld
Negative 676 ± 9.5
Negative 879 ± 17.9
Negative 2,127 ± 104.3
Negative 1,291 ± 49.3
Negative 1,104 ± 125.0
TA100 0 3
10 33
100 333
1,000 1,666
159 ± 8.0 118 ± 4.6 128 ± 5.5 137 ± 14.0 139 ± 8.9 115 ± 9.7 102 ± 5.8
146 ± 1.9
144 ± 2.3 159 ± 17.2 137 ± 15.4 141 ± 2.9
145 ± 8.1
145 ± 9.1 146 ± 2.1 113 ± 8.7 93 ± 2.8
100 ± 14.9
161 ± 10.0
160 ± 9.0 157 ± 8.9 156 ± 8.9 133 ± 7.0 126 ± 2.5 135 ± 13.2
149 ± 2.5
137 ± 7.4 127 ± 1.2 134 ± 4.8 134 ± 4.1
Trial summary Positive control
Negative 316 ± 3.5
Negative 445 ± 11.7
Negative 462 ± 31.2
Negative 599 ± 23.1
Negative 244 ± 6.7
TA1535 0 3
10 33
100 333
1,000 1,666 3,333
20 ± 1.5 20 ± 2.3 19 ± 1.5 19 ± 2.9 15 ± 4.2 18 ± 2.0
8 ± 0.9
8 ± 3.0 11 ± 2.0 8 ± 1.0 9 ± 1.3 8 ± 1.2e
12 ± 2.9
10 ± 2.0 11 ± 3.4 9 ± 2.5 8 ± 0.3
5 ± 0.7e
12 ± 1.7
10 ± 2.0 11 ± 1.5 11 ± 0.6 9 ± 0.7 7 ± 1.5e
14 ± 2.1
14 ± 0.3 15 ± 1.5 15 ± 1.9 12 ± 2.7
9 ± 0.6e
Trial summary Positive control
Negative 332 ± 10.2
Negative 180 ± 18.4
Negative 340 ± 22.8
Negative 214 ± 27.7
Negative 206 ± 4.7
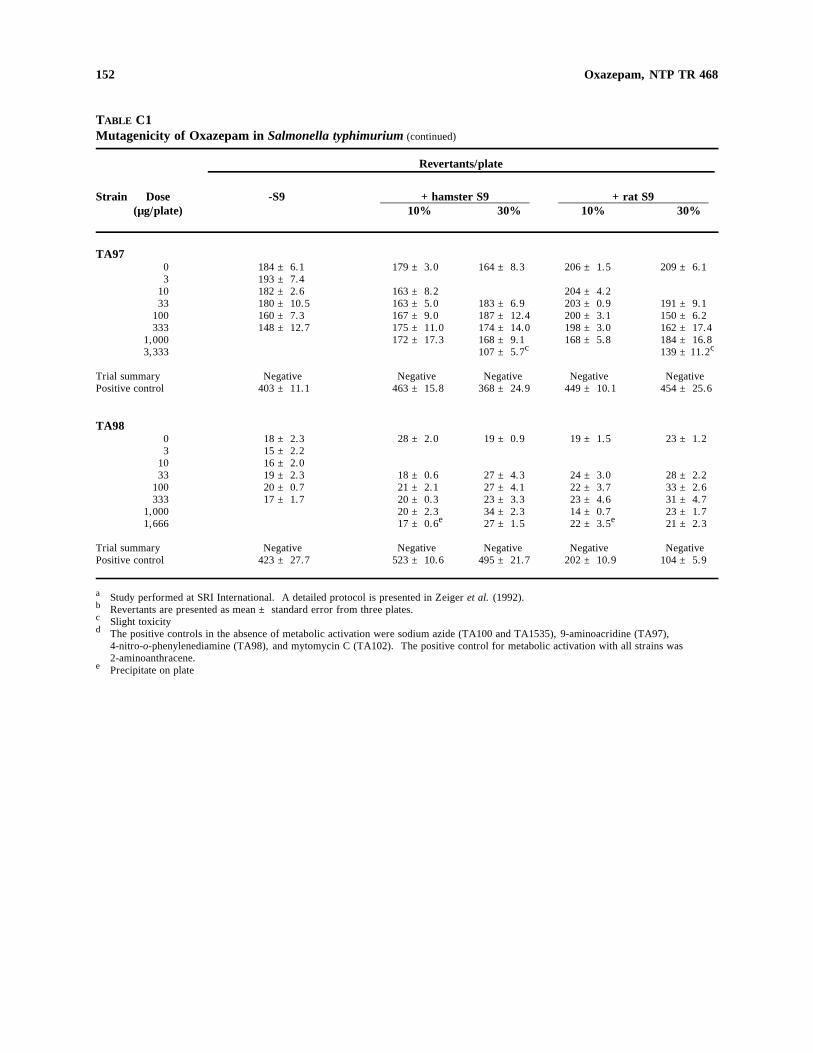
152
c
Oxazepam, NTP TR 468
TABLE C1 Mutagenicity of Oxazepam in Salmonella typhimurium (continued)
Revertants/plate
Strain Dose -S9 +hamster S9 +rat S9 (µg/plate) 10% 30% 10% 30%
TA97 0 184 ± 6.1 179 ± 3.0 164 ± 8.3 206 ± 1.5 209 ± 6.1 3 193 ± 7.4
10 182 ± 2.6 163 ± 8.2 204 ± 4.2 33 180 ± 10.5 163 ± 5.0 183 ± 6.9 203 ± 0.9 191 ± 9.1
100 160 ± 7.3 167 ± 9.0 187 ± 12.4 200 ± 3.1 150 ± 6.2 333 148 ± 12.7 175 ± 11.0 174 ± 14.0 198 ± 3.0 162 ± 17.4
1,000 172 ± 17.3 168 ± 9.1 168 ± 5.8 184 ± 16.8 c c3,333 107 ± 5.7 139 ± 11.2
Trial summary Negative Negative Negative Negative Negative Positive control 403 ± 11.1 463 ± 15.8 368 ± 24.9 449 ± 10.1 454 ± 25.6
TA98 0 18 ± 2.3 28 ± 2.0 19 ± 0.9 19 ± 1.5 23 ± 1.2 3 15 ± 2.2
10 16 ± 2.0 33 19 ± 2.3 18 ± 0.6 27 ± 4.3 24 ± 3.0 28 ± 2.2
100 20 ± 0.7 21 ± 2.1 27 ± 4.1 22 ± 3.7 33 ± 2.6 333 17 ± 1.7 20 ± 0.3 23 ± 3.3 23 ± 4.6 31 ± 4.7
1,000 20 ± 2.3 34 ± 2.3 14 ± 0.7 23 ± 1.7 e e1,666 17 ± 0.6 27 ± 1.5 22 ± 3.5 21 ± 2.3
Trial summary Negative Negative Negative Negative Negative Positive control 423 ± 27.7 523 ± 10.6 495 ± 21.7 202 ± 10.9 104 ± 5.9
a Study performed at SRI International. A detailed protocol is presented in Zeiger et al. (1992).b Revertants are presented as mean ± standard error from three plates.
Slight toxicityd The positive controls in the absence of metabolic activation were sodium azide (TA100 and TA1535), 9-aminoacridine (TA97),
4-nitro-o-phenylenediamine (TA98), and mytomycin C (TA102). The positive control for metabolic activation with all strains was 2-aminoanthracene.
e Precipitate on plate
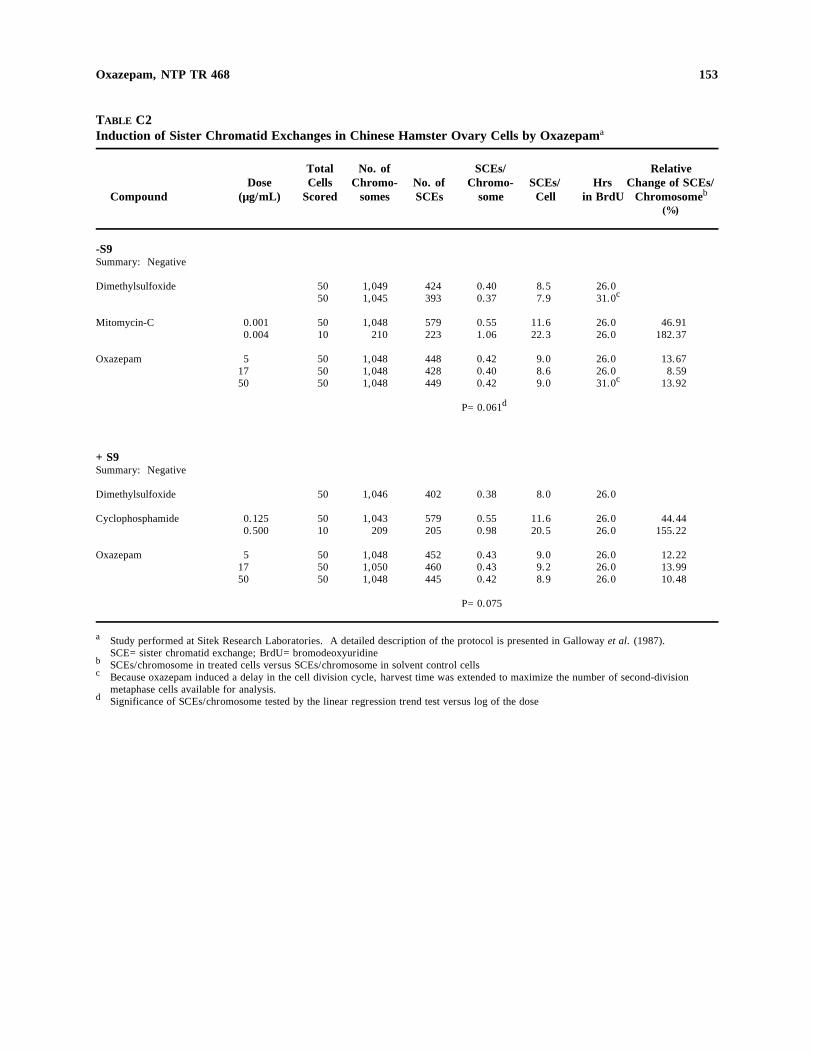
153
c
Oxazepam, NTP TR 468
TABLE C2 Induction of Sister Chromatid Exchanges in Chinese Hamster Ovary Cells by Oxazepama
Total No. of SCEs/ Relative Dose Cells Chromo- No. of Chromo- SCEs/ Hrs Change of SCEs/
Compound (µg/mL) Scored somes SCEs some Cell in BrdU Chromosomeb
(%)
-S9 Summary: Negative
Dimethylsulfoxide 50 1,049 424 0.40 8.5 26.0 50 1,045 393 0.37 7.9 31.0c
Mitomycin-C 0.001 50 1,048 579 0.55 11.6 26.0 46.91 0.004 10 210 223 1.06 22.3 26.0 182.37
Oxazepam 5 50 1,048 448 0.42 9.0 26.0 13.67 17 50 1,048 428 0.40 8.6 26.0 8.59
c50 50 1,048 449 0.42 9.0 31.0 13.92
P=0.061d
+S9 Summary: Negative
Dimethylsulfoxide 50 1,046 402 0.38 8.0 26.0
Cyclophosphamide 0.125 50 1,043 579 0.55 11.6 26.0 44.44 0.500 10 209 205 0.98 20.5 26.0 155.22
Oxazepam 5 50 1,048 452 0.43 9.0 26.0 12.22 17 50 1,050 460 0.43 9.2 26.0 13.99 50 50 1,048 445 0.42 8.9 26.0 10.48
P=0.075
a Study performed at Sitek Research Laboratories. A detailed description of the protocol is presented in Galloway et al. (1987). SCE=sister chromatid exchange; BrdU=bromodeoxyuridine
b SCEs/chromosome in treated cells versus SCEs/chromosome in solvent control cells Because oxazepam induced a delay in the cell division cycle, harvest time was extended to maximize the number of second-division metaphase cells available for analysis.
d Significance of SCEs/chromosome tested by the linear regression trend test versus log of the dose
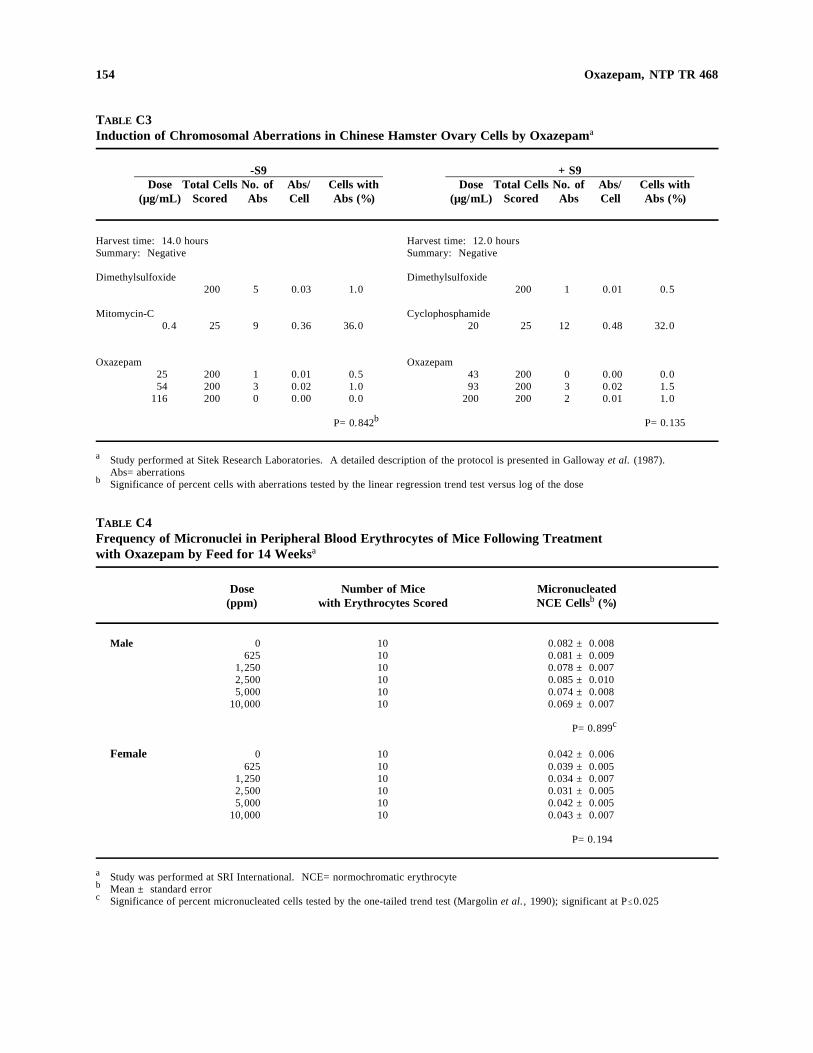
154 Oxazepam, NTP TR 468
TABLE C3 Induction of Chromosomal Aberrations in Chinese Hamster Ovary Cells by Oxazepama
-S9 +S9 Dose Total Cells No. of Abs/ Cells with Dose Total Cells No. of Abs/ Cells with
(µg/mL) Scored Abs Cell Abs (%) (µg/mL) Scored Abs Cell Abs (%)
Harvest time: 14.0 hours Summary: Negative
Harvest time: 12.0 hours Summary: Negative
Dimethylsulfoxide 200 5 0.03 1.0
Dimethylsulfoxide 200 1 0.01 0.5
Mitomycin-C 0.4 25 9 0.36 36.0
Cyclophosphamide 20 25 12 0.48 32.0
Oxazepam 25 54
116
200 200 200
1 3 0
0.01 0.02 0.00
0.5 1.0 0.0
Oxazepam 43 93
200
200 200 200
0 3 2
0.00 0.02 0.01
0.0 1.5 1.0
P=0.842b P=0.135
a Study performed at Sitek Research Laboratories. A detailed description of the protocol is presented in Galloway et al. (1987). Abs=aberrations
b Significance of percent cells with aberrations tested by the linear regression trend test versus log of the dose
TABLE C4 Frequency of Micronuclei in Peripheral Blood Erythrocytes of Mice Following Treatment with Oxazepam by Feed for 14 Weeksa
Dose Number of Mice Micronucleated (ppm) with Erythrocytes Scored NCE Cellsb (%)
Male 0 10 0.082 ± 0.008 625 10 0.081 ± 0.009
1,250 10 0.078 ± 0.007 2,500 10 0.085 ± 0.010 5,000 10 0.074 ± 0.008
10,000 10 0.069 ± 0.007
P=0.899c
Female 0 10 0.042 ± 0.006 625 10 0.039 ± 0.005
1,250 10 0.034 ± 0.007 2,500 10 0.031 ± 0.005 5,000 10 0.042 ± 0.005
10,000 10 0.043 ± 0.007
P=0.194
a Study was performed at SRI International. NCE=normochromatic erythrocyteb Mean ± standard error
Significance of percent micronucleated cells tested by the one-tailed trend test (Margolin et al., 1990); significant at P#0.025 c

155
APPENDIX D CHEMICAL CHARACTERIZATION
AND DOSE FORMULATION STUDIES
PROCUREMENT AND CHARACTERIZATION OF OXAZEPAM . . . . . . . . . . . . . . . . . . . . . . . . . . . . . . . . . . . 156 PREPARATION AND ANALYSIS OF DOSE FORMULATIONS . . . . . . . . . . . . . . . . . . . . . . . . . . . . . . . . . . . 157 FIGURE D1 Infrared Absorption Spectrum of Oxazepam . . . . . . . . . . . . . . . . . . . . . . . . . . . . . . . 158 FIGURE D2 Nuclear Magnetic Resonance Spectrum of Oxazepam . . . . . . . . . . . . . . . . . . . . . . . . . 159 TABLE D1 Preparation and Storage of Dose Formulations
in the 2-Year Feed Study of Oxazepam . . . . . . . . . . . . . . . . . . . . . . . . . . . . . . . . . . . 160 TABLE D2 Analysis of Dose Formulations Administered to Rats
in the 2-Year Feed Study of Oxazepam . . . . . . . . . . . . . . . . . . . . . . . . . . . . . . . . . . . 161
156 Oxazepam, NTP TR 468
CHEMICAL CHARACTERIZATION AND DOSE FORMULATION STUDIES
PROCUREMENT AND CHARACTERIZATION OF OXAZEPAM Oxazepam was obtained from Roussel Corporation (Englewood Cliffs, NJ) in one lot (86017.01), which was used during the 2-year study. Identity, purity, and stability analyses were conducted by the analytical chemistry laboratory, Midwest Research Institute (Kansas City, MO). Reports on analyses performed in support of the oxazepam studies are on file at the National Institute of Environmental Health Sciences.
Initially, comparisons were made between samples from the two shipping containers of lot 86017.01. The samples were blended for 15 minutes before being analyzed by high-performance liquid chromatography (HPLC) using the following system: Hewlett-Packard RP-18 column using a solvent system consisting of A) water containing 1% glacial acetic acid and B) methanol containing 1% glacial acetic acid, with a solvent ratio of A:B (50:50), at a flow rate of 1 mL/minute. Detection was with ultraviolet light at 254 nm. Results indicated that the two subbatches were identical within the limits of experimental error.
The chemical, a white, powdered solid, was identified as oxazepam by infrared, ultraviolet/visible, and nuclear magnetic resonance spectroscopy. All spectra were consistent with the literature spectra (Florey, 1974) of oxazepam. The infrared and nuclear magnetic resonance spectra are presented in Figures D1 and D2. The observed melting point of 204.5E C was consistent with a literature reference (Merck Index, 1989), although the sample decomposed upon heating.
The purity of oxazepam was determined by elemental analyses, Karl Fischer water analysis, functional group titration for phenol, thin-layer chromatography (TLC), and HPLC. Functional group titration was performed by dissolving a sample in dimethylformamide and titrating with 0.1 N tetrabutylammonium hydroxide. The titration was monitored potentiometrically with a glass indicating electrode and a calomel reference electrode containing methanolic 1 M tetrabutylammonium chloride. TLC was performed on Silica Gel 60 F-254 plates with two solvent systems: 1) chloroform:methanol (10:1) and 2) ethyl acetate: methanol:glacial acetic acid (80:20:10). Anthracene in methanol was used as an internal standard. Visualization was accomplished with ultraviolet light (254 and 366 nm) and a spray of 37% formaldehyde solution in concentrated sulfuric acid followed by heating for 5 to 10 minutes at 120E C. HPLC was performed with the system described in the subbatch comparison.
Elemental analyses for carbon, hydrogen, nitrogen, and chlorine were in agreement with the theoretical values for oxazepam. Karl Fischer water analysis indicated 0.026% ± 0.001% water. Functional group titration indicated a purity of 101.4% ± 0.5%. TLC analysis using system 1 indicated a major spot and one trace impurity; using system 2, a major spot was observed. HPLC resolved a major peak with no impurity peaks with areas 0.1% or greater relative to the major peak. Major peak comparison between this lot and a United States Pharmacopeia XXI (USP) oxazepam standard indicated a purity of 103% ± 1% for lot 86017.01 relative to the reference standard. The overall purity of lot 86017.01 was determined to be greater than 99%.
Accelerated stability studies of the bulk chemical were performed by the analytical chemistry laboratory. HPLC was performed using the system described above except with a solvent ratio of 35:65. These studies indicated that oxazepam was stable as a bulk chemical for 2 weeks when stored protected from light at temperatures up to 60E C. To ensure the stability during the 2-year study, the bulk chemical was stored at room temperature, protected from light, in metal cans or amber glass bottles. The stability of the bulk chemical was monitored periodically at the study laboratory with the HPLC system described above. No degradation of the bulk chemical was observed.
157 Oxazepam, NTP TR 468
PREPARATION AND ANALYSIS OF DOSE FORMULATIONS The dose formulations were prepared every 2 weeks by mixing oxazepam with feed (Table D1). Mixtures were made by preparing an oxazepam/feed premix by hand and then blending the premix with feed in a Patterson-Kelly twin-shell blender for 15 minutes, using an intensifier bar for the initial 5 minutes. Formulations were stored in polyethylene bags inside polypropylene buckets at 5E C, protected from light, for up to 21 days.
Homogeneity and stability studies of a 500 ppm dose formulation were performed by the analytical chemistry laboratory. Samples were extracted with methanol, centrifuged, and mixed with internal standard solution (acetophenone in methanol). The samples were then mixed with additional methanol and further diluted with deionized water. HPLC was performed with a Burdick and Jackson C18 column with a mobile phase of water:methanol:glacial acetic acid (43:57:1) at a flow rate of 1 mL/minute and ultraviolet detection at 254 nm. Homogeneity was confirmed, and the dose formulation was determined to be stable for at least 3 weeks when stored protected from light at 5E C.
Periodic analyses of the dose formulations of oxazepam were conducted at the study laboratory using HPLC. Dose formulations were analyzed every 8 weeks during the study; animal room samples were analyzed initially and twice a year thereafter (Table D2). All 50 dose formulations were within 10% of the target concentrations; 89% (17/19) of the animal room samples analyzed were within 10% of the target concentrations. One animal room sample was 12% greater than the theoretical value; this was attributed to a difference between the standard curves for the dose formulation and animal room sample analyses.
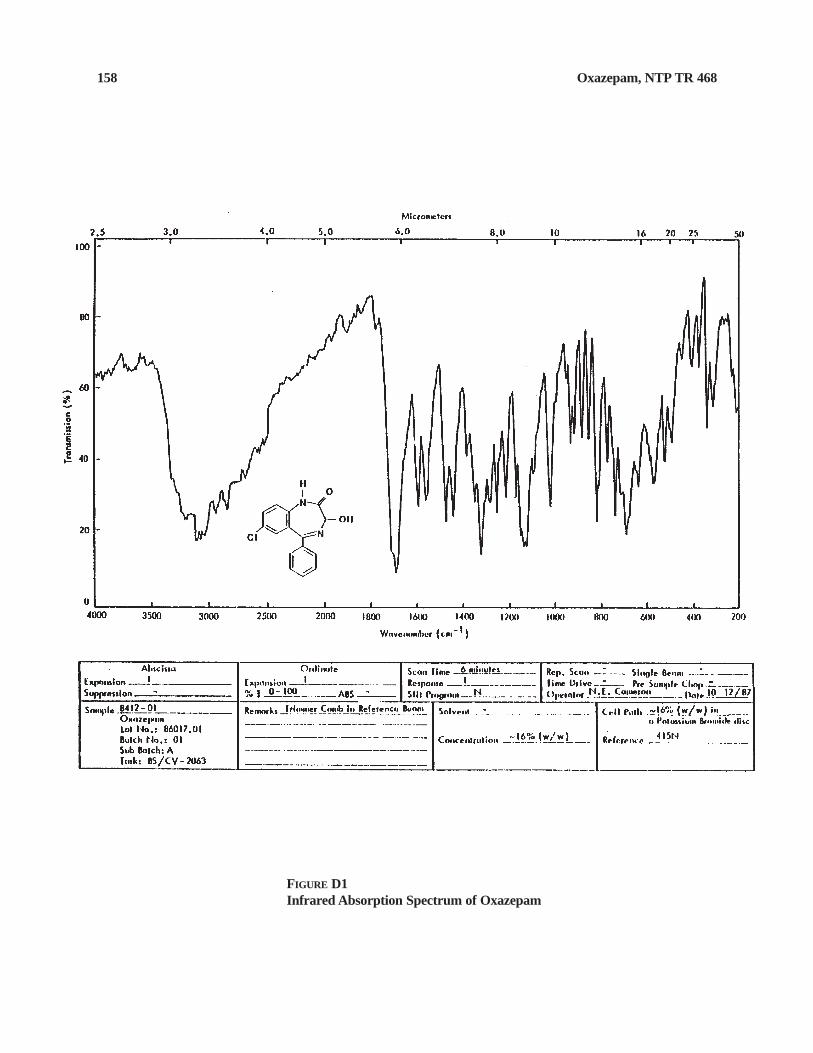
158 Oxazepam, NTP TR 468
FIGURE D1 Infrared Absorption Spectrum of Oxazepam
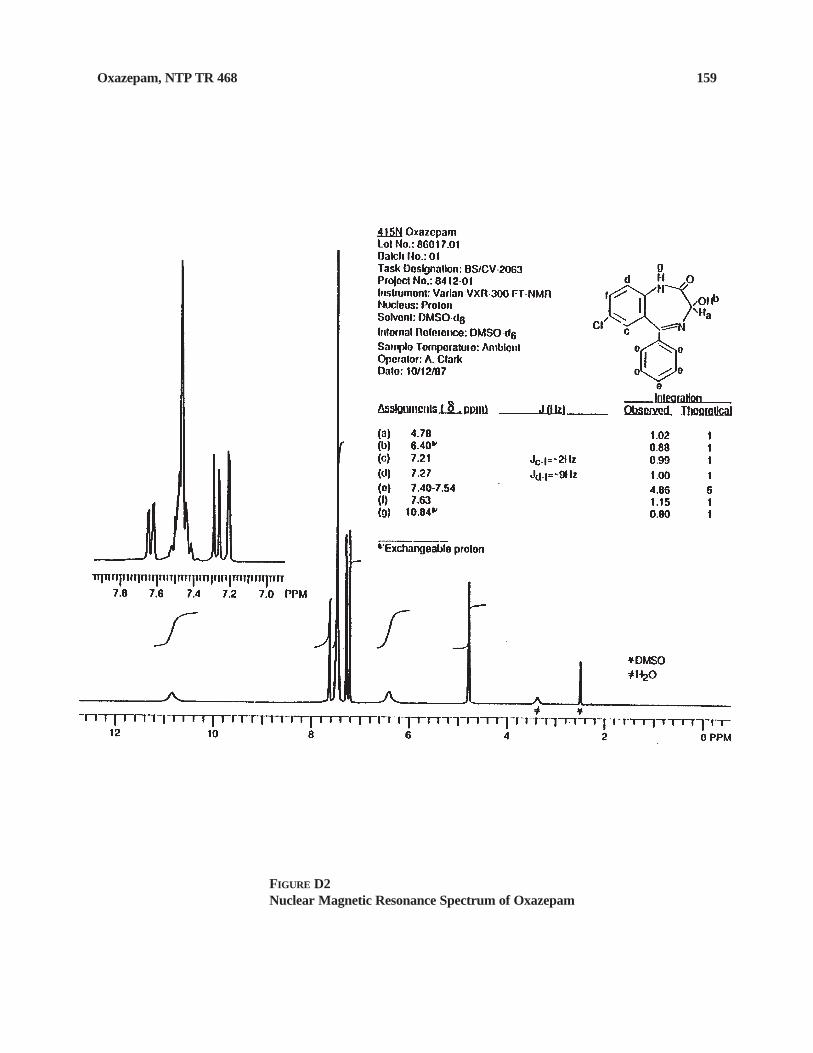
159 Oxazepam, NTP TR 468
FIGURE D2 Nuclear Magnetic Resonance Spectrum of Oxazepam
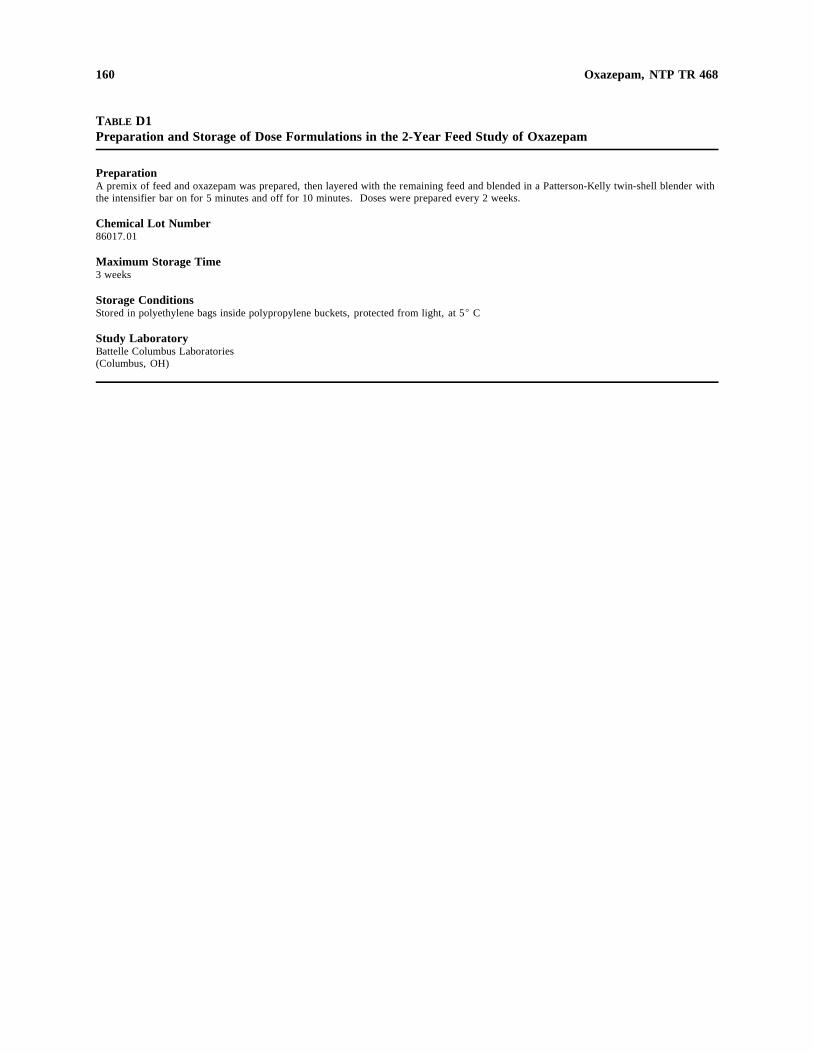
160
86017.01
Oxazepam, NTP TR 468
TABLE D1 Preparation and Storage of Dose Formulations in the 2-Year Feed Study of Oxazepam
Preparation A premix of feed and oxazepam was prepared, then layered with the remaining feed and blended in a Patterson-Kelly twin-shell blender with the intensifier bar on for 5 minutes and off for 10 minutes. Doses were prepared every 2 weeks.
Chemical Lot Number
Maximum Storage Time 3 weeks
Storage Conditions Stored in polyethylene bags inside polypropylene buckets, protected from light, at 5E C
Study Laboratory Battelle Columbus Laboratories (Columbus, OH)
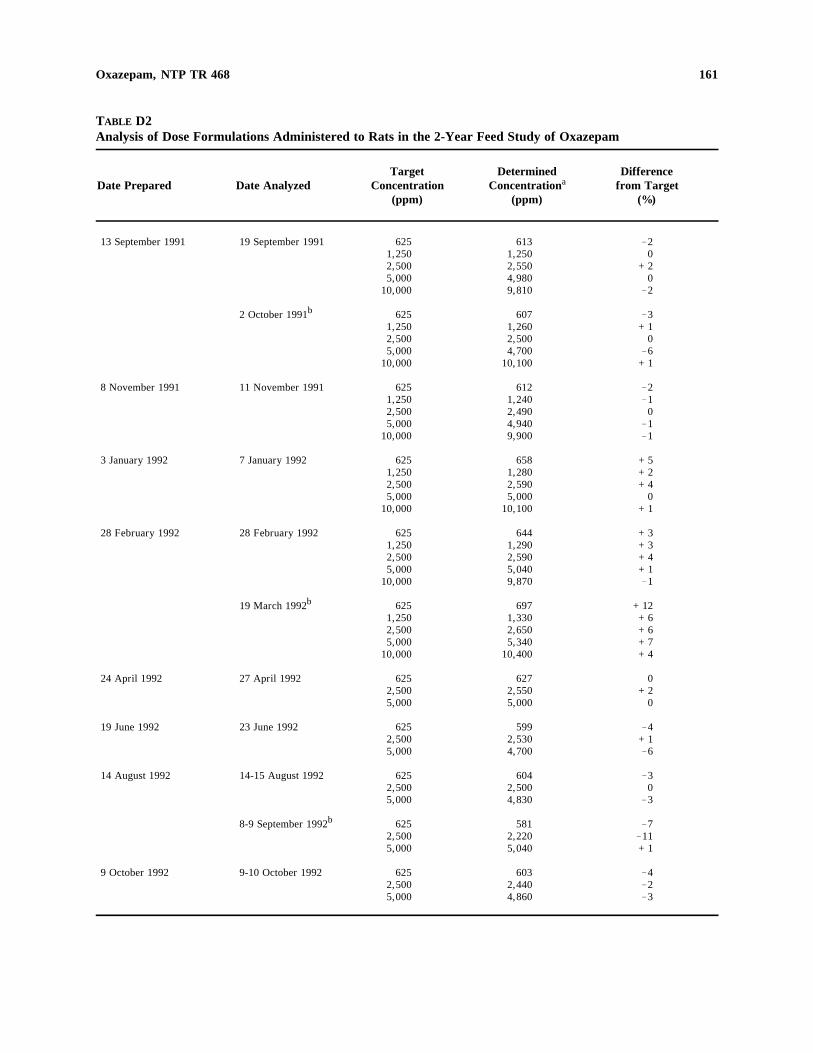
161 Oxazepam, NTP TR 468
TABLE D2 Analysis of Dose Formulations Administered to Rats in the 2-Year Feed Study of Oxazepam
Target Determined Difference aDate Prepared Date Analyzed Concentration Concentration from Target
(ppm) (ppm) (%)
13 September 1991 19 September 1991 625 613 !2 1,250 1,250 0 2,500 2,550 +2 5,000 4,980 0
10,000 9,810 !2
2 October 1991b 625 607 !3 1,250 1,260 +1 2,500 2,500 0 5,000 4,700 !6
10,000 10,100 +1
8 November 1991 11 November 1991 625 612 !2 1,250 1,240 !1 2,500 2,490 0 5,000 4,940 !1
10,000 9,900 !1
3 January 1992 7 January 1992 625 658 +5 1,250 1,280 +2 2,500 2,590 +4 5,000 5,000 0
10,000 10,100 +1
28 February 1992 28 February 1992 625 644 +3 1,250 1,290 +3 2,500 2,590 +4 5,000 5,040 +1
10,000 9,870 !1
19 March 1992b 625 697 +12 1,250 1,330 +6 2,500 2,650 +6 5,000 5,340 +7
10,000 10,400 +4
24 April 1992 27 April 1992 625 627 0 2,500 2,550 +2 5,000 5,000 0
19 June 1992 23 June 1992 625 599 !4 2,500 2,530 +1 5,000 4,700 !6
14 August 1992 14-15 August 1992 625 604 !3 2,500 2,500 0 5,000 4,830 !3
8-9 September 1992b 625 581 !7 2,500 2,220 !11 5,000 5,040 +1
9 October 1992 9-10 October 1992 625 603 !4 2,500 2,440 !2 5,000 4,860 !3
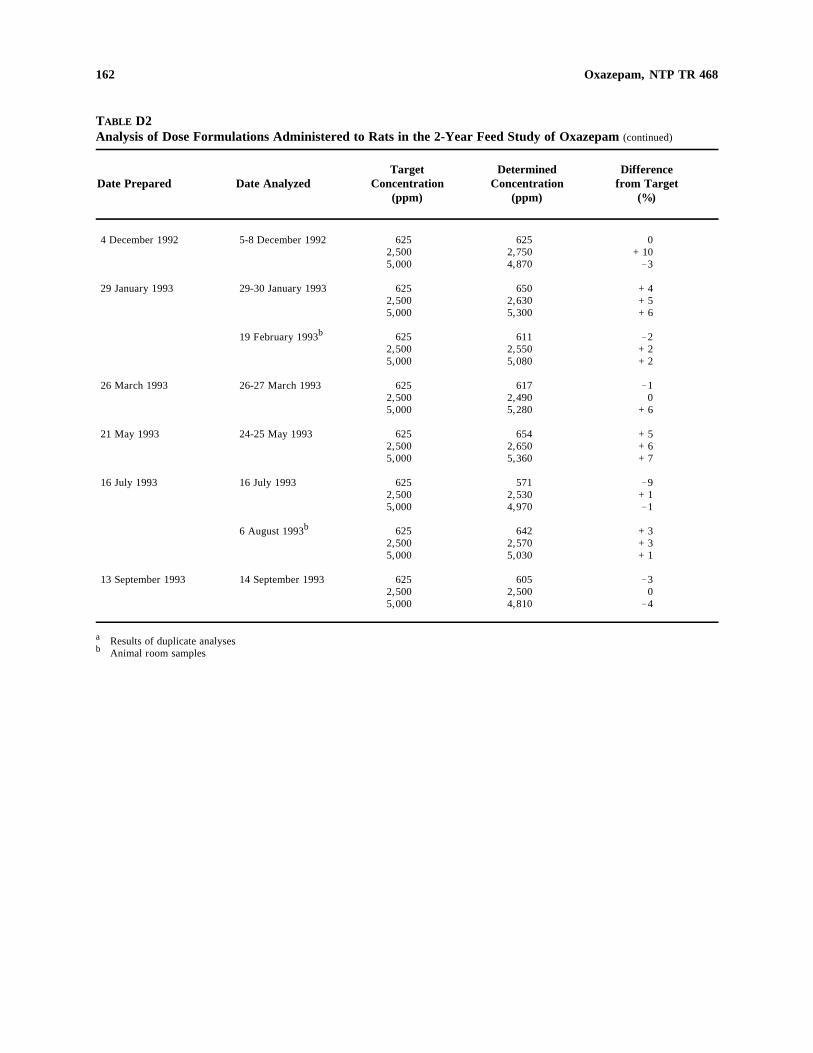
162 Oxazepam, NTP TR 468
TABLE D2 Analysis of Dose Formulations Administered to Rats in the 2-Year Feed Study of Oxazepam (continued)
Target Determined Difference Date Prepared Date Analyzed Concentration Concentration from Target
(ppm) (ppm) (%)
4 December 1992 5-8 December 1992 625 2,500 5,000
625 2,750 4,870
0 +10 !3
29 January 1993 29-30 January 1993 625 2,500 5,000
650 2,630 5,300
+4 +5 +6
19 February 1993b 625 2,500 5,000
611 2,550 5,080
!2 +2 +2
26 March 1993 26-27 March 1993 625 2,500 5,000
617 2,490 5,280
!1 0
+6
21 May 1993 24-25 May 1993 625 2,500 5,000
654 2,650 5,360
+5 +6 +7
16 July 1993 16 July 1993 625 2,500 5,000
571 2,530 4,970
!9 +1 !1
6 August 1993b 625 2,500 5,000
642 2,570 5,030
+3 +3 +1
13 September 1993 14 September 1993 625 2,500 5,000
605 2,500 4,810
!3 0
!4
a b
Results of duplicate analyses Animal room samples
163
APPENDIX E FEED AND COMPOUND CONSUMPTION
IN THE 2-YEAR FEED STUDIES OF OXAZEPAM
TABLE E1
TABLE E2
Feed and Compound Consumption by Male Rats in the 2-Year Feed Study of Oxazepam . . . . . . . . . . . . . . . . . . . . . . . . . . . . . . . . . . . . . . . . . . . . . . . . . . . . Feed and Compound Consumption by Female Rats in the 2-Year Feed Study of Oxazepam . . . . . . . . . . . . . . . . . . . . . . . . . . . . . . . . . . . . . . . . . . . . . . . . . . . .
164
166
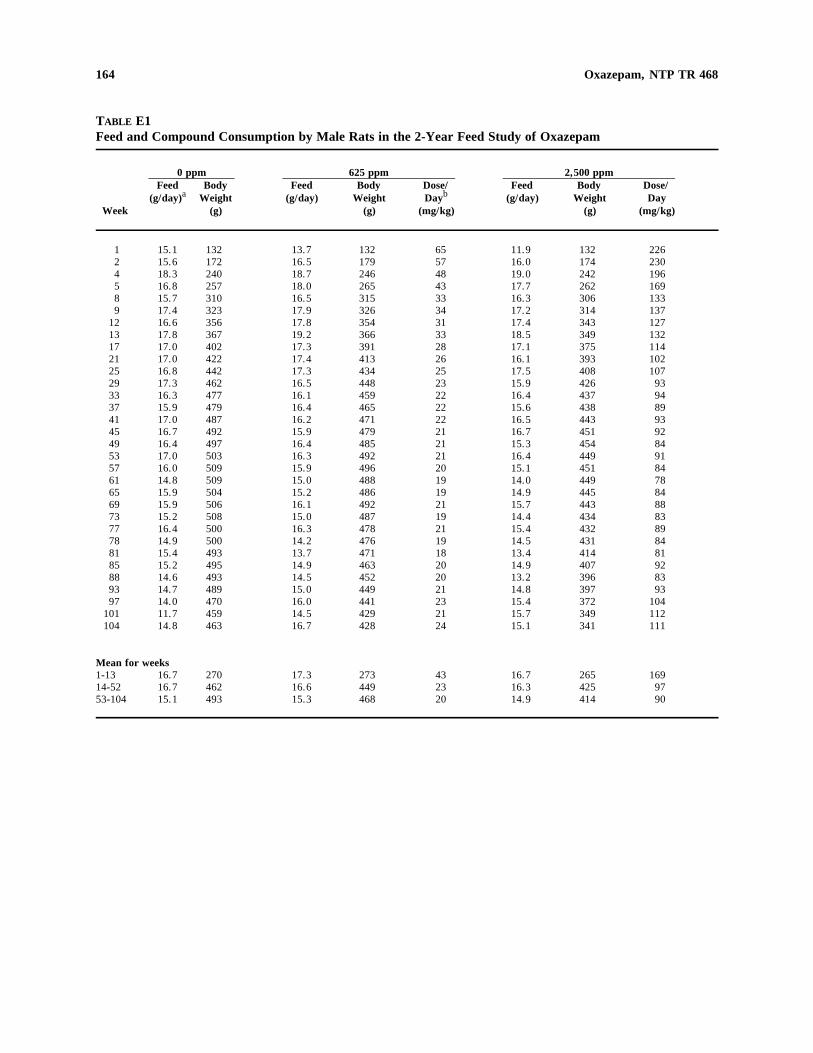
164 Oxazepam, NTP TR 468
TABLE E1 Feed and Compound Consumption by Male Rats in the 2-Year Feed Study of Oxazepam
0 ppm 625 ppm 2,500 ppm Feed
(g/day)a Body
Weight Feed
(g/day) Body
Weight Dose/ Dayb
Feed (g/day)
Body Weight
Dose/ Day
Week (g) (g) (mg/kg) (g) (mg/kg)
1 15.1 132 13.7 132 65 11.9 132 226 2 15.6 172 16.5 179 57 16.0 174 230 4 18.3 240 18.7 246 48 19.0 242 196 5 16.8 257 18.0 265 43 17.7 262 169 8 15.7 310 16.5 315 33 16.3 306 133 9 17.4 323 17.9 326 34 17.2 314 137
12 16.6 356 17.8 354 31 17.4 343 127 13 17.8 367 19.2 366 33 18.5 349 132 17 17.0 402 17.3 391 28 17.1 375 114 21 17.0 422 17.4 413 26 16.1 393 102 25 16.8 442 17.3 434 25 17.5 408 107 29 17.3 462 16.5 448 23 15.9 426 93 33 16.3 477 16.1 459 22 16.4 437 94 37 15.9 479 16.4 465 22 15.6 438 89 41 17.0 487 16.2 471 22 16.5 443 93 45 16.7 492 15.9 479 21 16.7 451 92 49 16.4 497 16.4 485 21 15.3 454 84 53 17.0 503 16.3 492 21 16.4 449 91 57 16.0 509 15.9 496 20 15.1 451 84 61 14.8 509 15.0 488 19 14.0 449 78 65 15.9 504 15.2 486 19 14.9 445 84 69 15.9 506 16.1 492 21 15.7 443 88 73 15.2 508 15.0 487 19 14.4 434 83 77 16.4 500 16.3 478 21 15.4 432 89 78 14.9 500 14.2 476 19 14.5 431 84 81 15.4 493 13.7 471 18 13.4 414 81 85 15.2 495 14.9 463 20 14.9 407 92 88 14.6 493 14.5 452 20 13.2 396 83 93 14.7 489 15.0 449 21 14.8 397 93 97 14.0 470 16.0 441 23 15.4 372 104
101 11.7 459 14.5 429 21 15.7 349 112 104 14.8 463 16.7 428 24 15.1 341 111
Mean for weeks 1-13 16.7 270 17.3 273 43 16.7 265 169 14-52 16.7 462 16.6 449 23 16.3 425 97 53-104 15.1 493 15.3 468 20 14.9 414 90

165 Oxazepam, NTP TR 468
TABLE E1 Feed and Compound Consumption by Male Rats in the 2-Year Feed Study of Oxazepam (continued)
0 ppm 5,000 ppm 10,000 ppm Feed Body Feed Body Dose/ Feed Body Dose/
(g/day) Weight (g/day) Weight Day (g/day) Weight Day Week (g) (g) (mg/kg) (g) (mg/kg)
1 15.1 132 10.8 132 409 10.4 132 791 2 15.6 172 15.3 168 456 14.8 164 901 4 18.3 240 19.1 238 400 19.3 232 833 5 16.8 257 17.5 254 346 17.5 247 711 8 15.7 310 17.3 294 294 16.1 284 568 9 17.4 323 18.6 304 307 17.1 290 591
12 16.6 356 16.7 331 253 16.9 322 524 13 17.8 367 18.8 338 277 18.1 323 561 17 17.0 402 16.5 355 233 17.4 344 506 21 17.0 422 18.0 375 240 17.3 358 485 25 16.8 442 16.3 386 212 16.7 366 457 29 17.3 462 16.5 400 207 16.0 361 33 16.3 477 15.5 401 193 17.9 404 37 15.9 479 15.6 401 194 17.3 424 41 17.0 487 16.2 411 197 17.4 437 45 16.7 492 17.7 420 211 16.6 449 49 16.4 497 16.6 421 197 17.0 462 53 17.0 503 16.6 420 198 17.3 467 57 16.0 509 16.0 417 191 16.2 472 61 14.8 509 15.1 403 187 15.6 473 65 15.9 504 15.6 396 197 16.0 469 69 15.9 506 16.2 388 209 15.6 469 73 15.2 508 16.4 363 226 15.3 474 77 16.4 500 14.9 358 207 16.2 469 78 14.9 500 15.2 351 216 15.6 469 81 15.4 493 14.3 334 214 14.7 458 85 15.2 495 15.8 328 241 14.7 445 88 14.6 493 14.3 313 229 12.6 425 93 14.7 489 14.6 314 233 12.9 427 97 14.0 470 16.8 333 252 14.5 403
101 11.7 459 7.6 285 133 104 14.8 463
Mean for weeks 1-13 16.7 270 16.8 258 343 16.3 249 685 14-52 16.7 462 16.5 397 209 17.1 401 482c
53-104 15.1 493 15.0 357 210 15.2 455
a b c
Grams of feed consumed per animal per day Milligrams of oxazepam consumed per kilogram body weight per day Mean for weeks 14-27
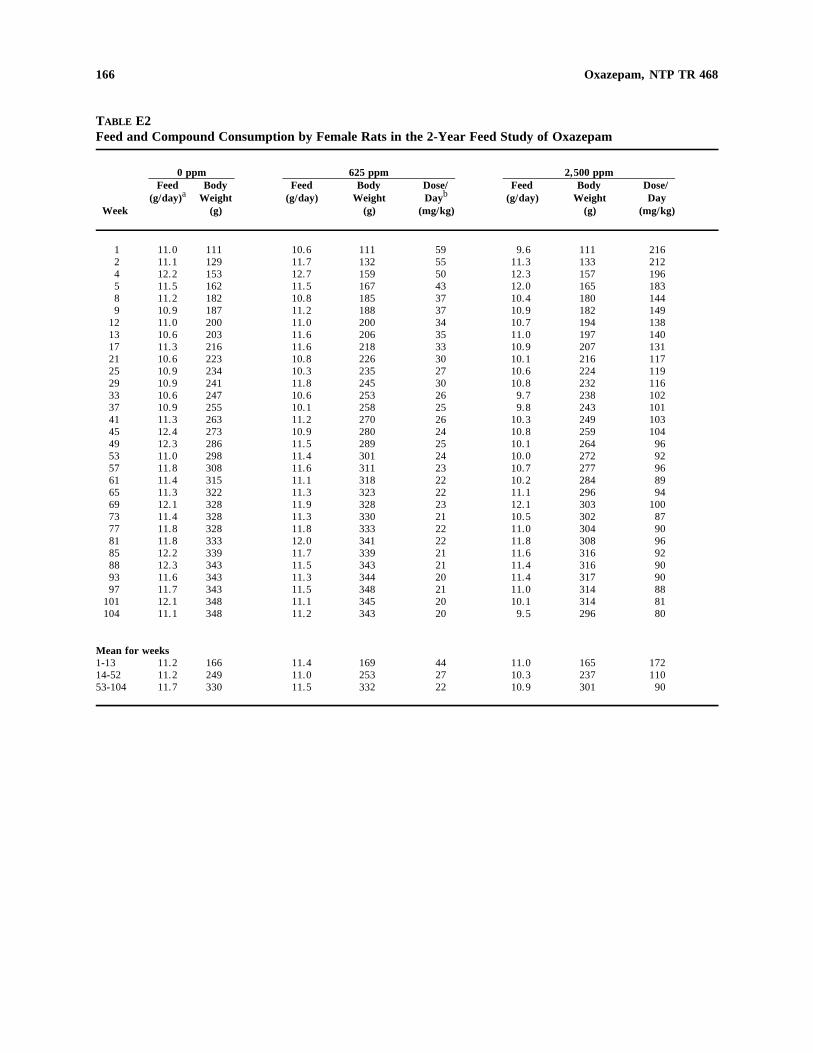
166 Oxazepam, NTP TR 468
TABLE E2 Feed and Compound Consumption by Female Rats in the 2-Year Feed Study of Oxazepam
0 ppm 625 ppm 2,500 ppm Feed
(g/day)a Body
Weight Feed
(g/day) Body
Weight Dose/ Dayb
Feed (g/day)
Body Weight
Dose/ Day
Week (g) (g) (mg/kg) (g) (mg/kg)
1 11.0 111 10.6 111 59 9.6 111 216 2 11.1 129 11.7 132 55 11.3 133 212 4 12.2 153 12.7 159 50 12.3 157 196 5 11.5 162 11.5 167 43 12.0 165 183 8 11.2 182 10.8 185 37 10.4 180 144 9 10.9 187 11.2 188 37 10.9 182 149
12 11.0 200 11.0 200 34 10.7 194 138 13 10.6 203 11.6 206 35 11.0 197 140 17 11.3 216 11.6 218 33 10.9 207 131 21 10.6 223 10.8 226 30 10.1 216 117 25 10.9 234 10.3 235 27 10.6 224 119 29 10.9 241 11.8 245 30 10.8 232 116 33 10.6 247 10.6 253 26 9.7 238 102 37 10.9 255 10.1 258 25 9.8 243 101 41 11.3 263 11.2 270 26 10.3 249 103 45 12.4 273 10.9 280 24 10.8 259 104 49 12.3 286 11.5 289 25 10.1 264 96 53 11.0 298 11.4 301 24 10.0 272 92 57 11.8 308 11.6 311 23 10.7 277 96 61 11.4 315 11.1 318 22 10.2 284 89 65 11.3 322 11.3 323 22 11.1 296 94 69 12.1 328 11.9 328 23 12.1 303 100 73 11.4 328 11.3 330 21 10.5 302 87 77 11.8 328 11.8 333 22 11.0 304 90 81 11.8 333 12.0 341 22 11.8 308 96 85 12.2 339 11.7 339 21 11.6 316 92 88 12.3 343 11.5 343 21 11.4 316 90 93 11.6 343 11.3 344 20 11.4 317 90 97 11.7 343 11.5 348 21 11.0 314 88
101 12.1 348 11.1 345 20 10.1 314 81 104 11.1 348 11.2 343 20 9.5 296 80
Mean for weeks 1-13 11.2 166 11.4 169 44 11.0 165 172 14-52 11.2 249 11.0 253 27 10.3 237 110 53-104 11.7 330 11.5 332 22 10.9 301 90
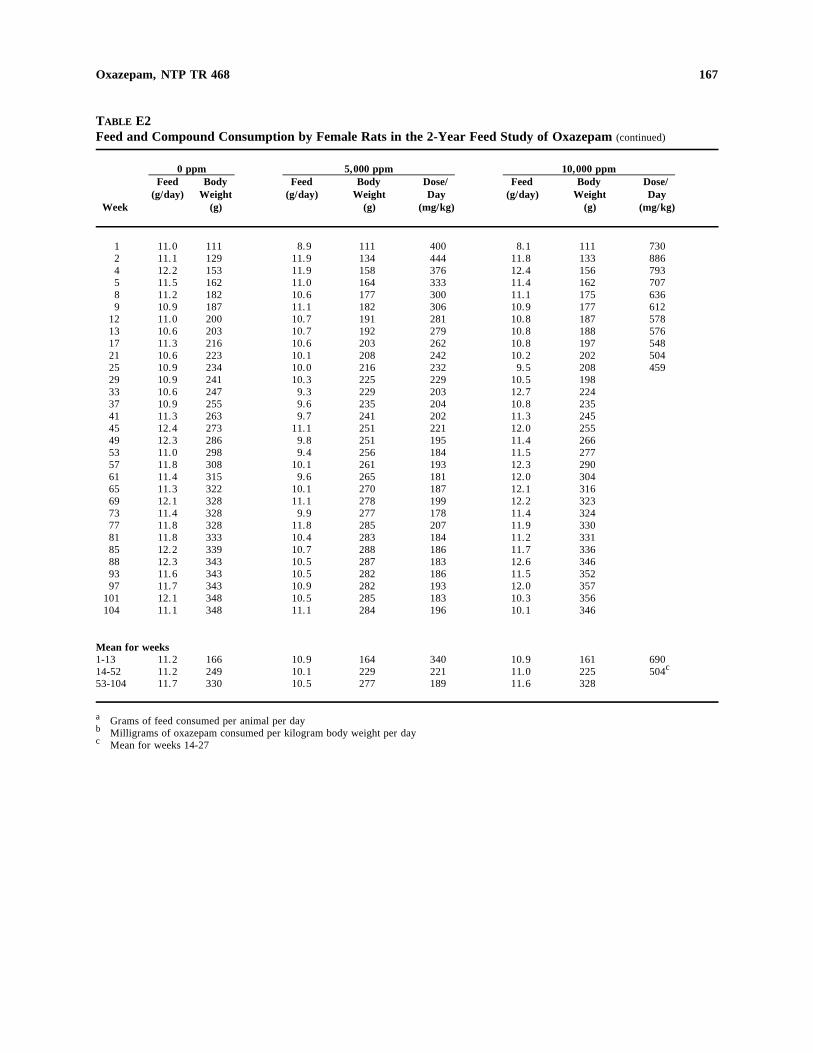
167
c
Oxazepam, NTP TR 468
TABLE E2 Feed and Compound Consumption by Female Rats in the 2-Year Feed Study of Oxazepam (continued)
0 ppm 5,000 ppm 10,000 ppm Feed Body Feed Body Dose/ Feed Body Dose/
(g/day) Weight (g/day) Weight Day (g/day) Weight Day Week (g) (g) (mg/kg) (g) (mg/kg)
1 11.0 111 8.9 111 400 8.1 111 730 2 11.1 129 11.9 134 444 11.8 133 886 4 12.2 153 11.9 158 376 12.4 156 793 5 11.5 162 11.0 164 333 11.4 162 707 8 11.2 182 10.6 177 300 11.1 175 636 9 10.9 187 11.1 182 306 10.9 177 612
12 11.0 200 10.7 191 281 10.8 187 578 13 10.6 203 10.7 192 279 10.8 188 576 17 11.3 216 10.6 203 262 10.8 197 548 21 10.6 223 10.1 208 242 10.2 202 504 25 10.9 234 10.0 216 232 9.5 208 459 29 10.9 241 10.3 225 229 10.5 198 33 10.6 247 9.3 229 203 12.7 224 37 10.9 255 9.6 235 204 10.8 235 41 11.3 263 9.7 241 202 11.3 245 45 12.4 273 11.1 251 221 12.0 255 49 12.3 286 9.8 251 195 11.4 266 53 11.0 298 9.4 256 184 11.5 277 57 11.8 308 10.1 261 193 12.3 290 61 11.4 315 9.6 265 181 12.0 304 65 11.3 322 10.1 270 187 12.1 316 69 12.1 328 11.1 278 199 12.2 323 73 11.4 328 9.9 277 178 11.4 324 77 11.8 328 11.8 285 207 11.9 330 81 11.8 333 10.4 283 184 11.2 331 85 12.2 339 10.7 288 186 11.7 336 88 12.3 343 10.5 287 183 12.6 346 93 11.6 343 10.5 282 186 11.5 352 97 11.7 343 10.9 282 193 12.0 357
101 12.1 348 10.5 285 183 10.3 356 104 11.1 348 11.1 284 196 10.1 346
Mean for weeks 1-13 11.2 166 10.9 164 340 10.9 161 690 14-52 11.2 249 10.1 229 221 11.0 225 504c
53-104 11.7 330 10.5 277 189 11.6 328
a Grams of feed consumed per animal per dayb Milligrams of oxazepam consumed per kilogram body weight per day
Mean for weeks 14-27

168 Oxazepam, NTP TR 468
169
APPENDIX F INGREDIENTS, NUTRIENT COMPOSITION,
AND CONTAMINANT LEVELS IN NIH-07 RAT AND MOUSE RATION
TABLE F1 TABLE F2 TABLE F3 TABLE F4
Ingredients of NIH-07 Rat and Mouse Ration . . . . . . . . . . . . . . . . . . . . . . . . . . . . . Vitamins and Minerals in NIH-07 Rat and Mouse Ration . . . . . . . . . . . . . . . . . . . . . Nutrient Composition of NIH-07 Rat and Mouse Ration . . . . . . . . . . . . . . . . . . . . . Contaminant Levels in NIH-07 Rat and Mouse Ration . . . . . . . . . . . . . . . . . . . . . . .
170 170 171 172
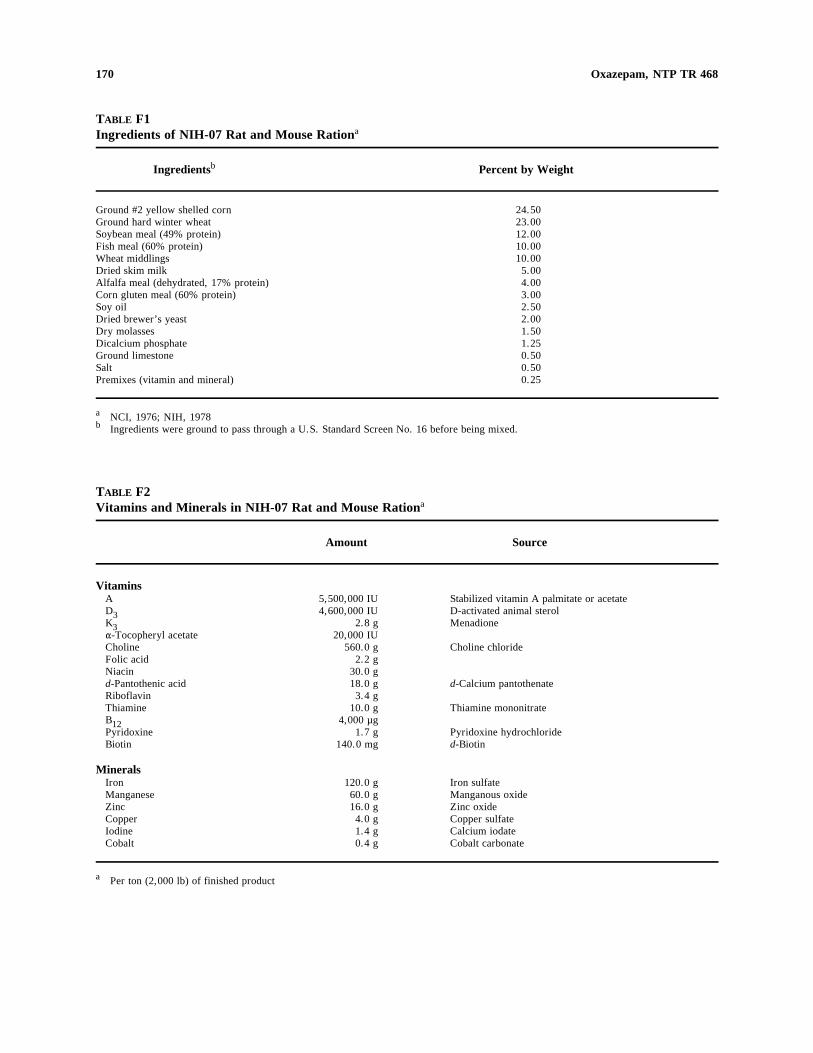
170 Oxazepam, NTP TR 468
TABLE F1 Ingredients of NIH-07 Rat and Mouse Rationa
Ingredientsb Percent by Weight
Ground #2 yellow shelled corn 24.50 Ground hard winter wheat 23.00 Soybean meal (49% protein) 12.00 Fish meal (60% protein) 10.00 Wheat middlings 10.00 Dried skim milk 5.00 Alfalfa meal (dehydrated, 17% protein) 4.00 Corn gluten meal (60% protein) 3.00 Soy oil 2.50 Dried brewer’s yeast 2.00 Dry molasses 1.50 Dicalcium phosphate 1.25 Ground limestone 0.50 Salt 0.50 Premixes (vitamin and mineral) 0.25
a NCI, 1976; NIH, 1978b Ingredients were ground to pass through a U.S. Standard Screen No. 16 before being mixed.
TABLE F2 Vitamins and Minerals in NIH-07 Rat and Mouse Rationa
Amount Source
Vitamins A 5,500,000 IU Stabilized vitamin A palmitate or acetate D3 4,600,000 IU D-activated animal sterol K3 "-Tocopheryl acetate
2.8 g 20,000 IU
Menadione
Choline 560.0 g Choline chloride Folic acid 2.2 g Niacin 30.0 g d-Pantothenic acid 18.0 g d-Calcium pantothenate Riboflavin 3.4 g Thiamine 10.0 g Thiamine mononitrate B12 4,000 µg Pyridoxine 1.7 g Pyridoxine hydrochloride Biotin 140.0 mg d-Biotin
Minerals Iron 120.0 g Iron sulfate Manganese 60.0 g Manganous oxide Zinc 16.0 g Zinc oxide Copper 4.0 g Copper sulfate Iodine 1.4 g Calcium iodate Cobalt 0.4 g Cobalt carbonate
a Per ton (2,000 lb) of finished product
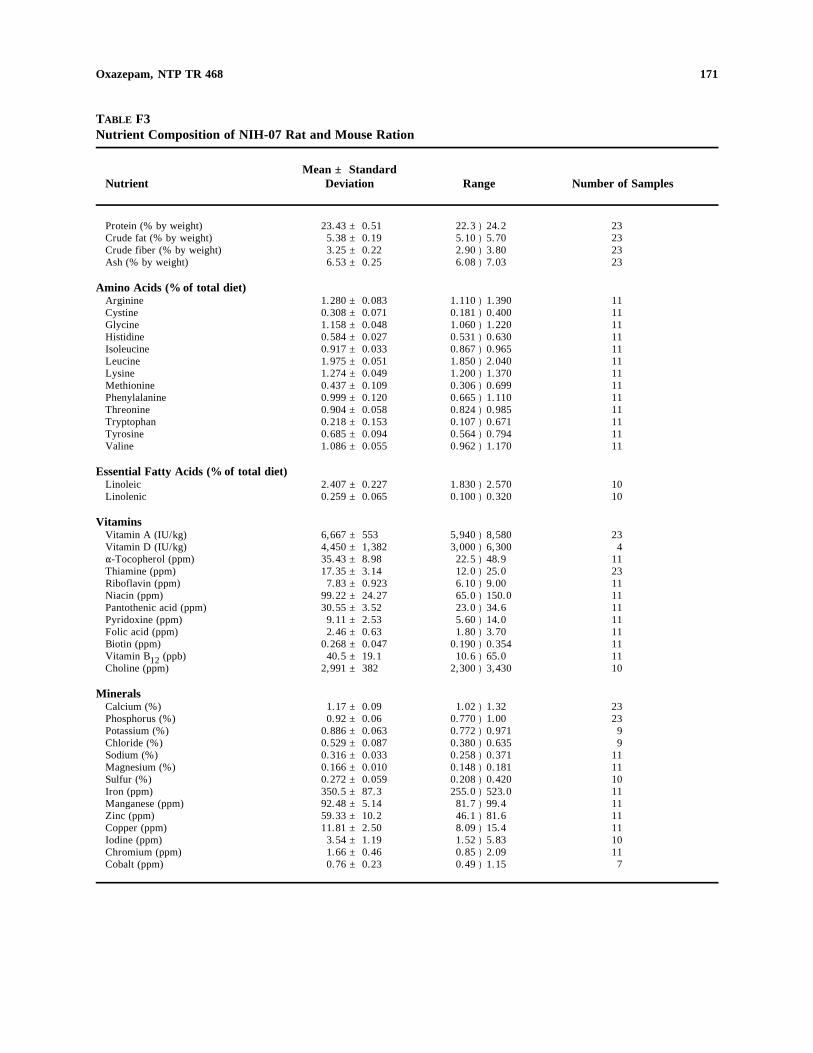
171 Oxazepam, NTP TR 468
TABLE F3 Nutrient Composition of NIH-07 Rat and Mouse Ration
Mean ± Standard Nutrient Deviation Range Number of Samples
Protein (% by weight) 23.43 ± 0.51 22.3 ) 24.2 23 Crude fat (% by weight) 5.38 ± 0.19 5.10 ) 5.70 23 Crude fiber (% by weight) 3.25 ± 0.22 2.90 ) 3.80 23 Ash (% by weight) 6.53 ± 0.25 6.08 ) 7.03 23
Amino Acids (% of total diet) Arginine 1.280 ± 0.083 1.110 ) 1.390 11 Cystine 0.308 ± 0.071 0.181 ) 0.400 11 Glycine 1.158 ± 0.048 1.060 ) 1.220 11 Histidine 0.584 ± 0.027 0.531 ) 0.630 11 Isoleucine 0.917 ± 0.033 0.867 ) 0.965 11 Leucine 1.975 ± 0.051 1.850 ) 2.040 11 Lysine 1.274 ± 0.049 1.200 ) 1.370 11 Methionine 0.437 ± 0.109 0.306 ) 0.699 11 Phenylalanine 0.999 ± 0.120 0.665 ) 1.110 11 Threonine 0.904 ± 0.058 0.824 ) 0.985 11 Tryptophan 0.218 ± 0.153 0.107 ) 0.671 11 Tyrosine 0.685 ± 0.094 0.564 ) 0.794 11 Valine 1.086 ± 0.055 0.962 ) 1.170 11
Essential Fatty Acids (% of total diet) Linoleic 2.407 ± 0.227 1.830 ) 2.570 10 Linolenic 0.259 ± 0.065 0.100 ) 0.320 10
Vitamins Vitamin A (IU/kg) 6,667 ± 553 5,940 ) 8,580 23 Vitamin D (IU/kg) 4,450 ± 1,382 3,000 ) 6,300 4 "-Tocopherol (ppm) 35.43 ± 8.98 22.5 ) 48.9 11 Thiamine (ppm) 17.35 ± 3.14 12.0 ) 25.0 23 Riboflavin (ppm) 7.83 ± 0.923 6.10 ) 9.00 11 Niacin (ppm) 99.22 ± 24.27 65.0 ) 150.0 11 Pantothenic acid (ppm) 30.55 ± 3.52 23.0 ) 34.6 11 Pyridoxine (ppm) 9.11 ± 2.53 5.60 ) 14.0 11 Folic acid (ppm) 2.46 ± 0.63 1.80 ) 3.70 11 Biotin (ppm) 0.268 ± 0.047 0.190 ) 0.354 11 Vitamin B (ppb) 40.5 ± 19.1 10.6 ) 65.0 1112 Choline (ppm) 2,991 ± 382 2,300 ) 3,430 10
Minerals Calcium (%) 1.17 ± 0.09 1.02 ) 1.32 23 Phosphorus (%) 0.92 ± 0.06 0.770 ) 1.00 23 Potassium (%) 0.886 ± 0.063 0.772 ) 0.971 9 Chloride (%) 0.529 ± 0.087 0.380 ) 0.635 9 Sodium (%) 0.316 ± 0.033 0.258 ) 0.371 11 Magnesium (%) 0.166 ± 0.010 0.148 ) 0.181 11 Sulfur (%) 0.272 ± 0.059 0.208 ) 0.420 10 Iron (ppm) 350.5 ± 87.3 255.0 ) 523.0 11 Manganese (ppm) 92.48 ± 5.14 81.7 ) 99.4 11 Zinc (ppm) 59.33 ± 10.2 46.1 ) 81.6 11 Copper (ppm) 11.81 ± 2.50 8.09 ) 15.4 11 Iodine (ppm) 3.54 ± 1.19 1.52 ) 5.83 10 Chromium (ppm) 1.66 ± 0.46 0.85 ) 2.09 11 Cobalt (ppm) 0.76 ± 0.23 0.49 ) 1.15 7
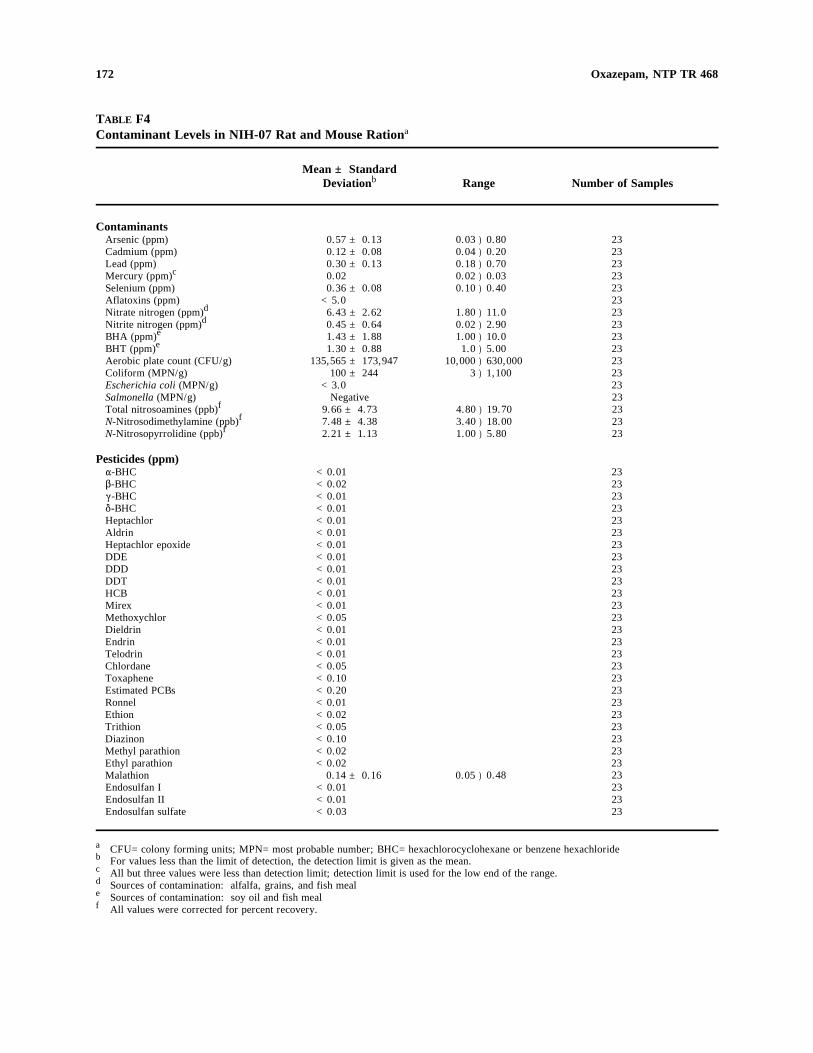
172 Oxazepam, NTP TR 468
TABLE F4 Contaminant Levels in NIH-07 Rat and Mouse Rationa
Mean ± Standard Deviationb Range Number of Samples
Contaminants Arsenic (ppm) 0.57 ± 0.13 0.03 ) 0.80 23 Cadmium (ppm) 0.12 ± 0.08 0.04 ) 0.20 23 Lead (ppm) 0.30 ± 0.13 0.18 ) 0.70 23
cMercury (ppm) 0.02 0.02 ) 0.03 23 Selenium (ppm) 0.36 ± 0.08 0.10 ) 0.40 23 Aflatoxins (ppm) <5.0 23 Nitrate nitrogen (ppm)d 6.43 ± 2.62 1.80 ) 11.0 23 Nitrite nitrogen (ppm)d 0.45 ± 0.64 0.02 ) 2.90 23
eBHA (ppm) 1.43 ± 1.88 1.00 ) 10.0 23 eBHT (ppm) 1.30 ± 0.88 1.0 ) 5.00 23
Aerobic plate count (CFU/g) 135,565 ± 173,947 10,000 ) 630,000 23 Coliform (MPN/g) 100 ± 244 3 ) 1,100 23 Escherichia coli (MPN/g) <3.0 23 Salmonella (MPN/g) Negative 23 Total nitrosoamines (ppb)f 9.66 ± 4.73 4.80 ) 19.70 23 N-Nitrosodimethylamine (ppb)f 7.48 ± 4.38 3.40 ) 18.00 23 N-Nitrosopyrrolidine (ppb)f 2.21 ± 1.13 1.00 ) 5.80 23
Pesticides (ppm) "-BHC <0.01 23 $-BHC <0.02 23 (-BHC <0.01 23 *-BHC <0.01 23 Heptachlor <0.01 23 Aldrin <0.01 23 Heptachlor epoxide <0.01 23 DDE <0.01 23 DDD <0.01 23 DDT <0.01 23 HCB <0.01 23 Mirex <0.01 23 Methoxychlor <0.05 23 Dieldrin <0.01 23 Endrin <0.01 23 Telodrin <0.01 23 Chlordane <0.05 23 Toxaphene <0.10 23 Estimated PCBs <0.20 23 Ronnel <0.01 23 Ethion <0.02 23 Trithion <0.05 23 Diazinon <0.10 23 Methyl parathion <0.02 23 Ethyl parathion <0.02 23 Malathion 0.14 ± 0.16 0.05 ) 0.48 23 Endosulfan I <0.01 23 Endosulfan II <0.01 23 Endosulfan sulfate <0.03 23
a CFU=colony forming units; MPN=most probable number; BHC=hexachlorocyclohexane or benzene hexachlorideb For values less than the limit of detection, the detection limit is given as the mean.
All but three values were less than detection limit; detection limit is used for the low end of the range.d Sources of contamination: alfalfa, grains, and fish meal e Sources of contamination: soy oil and fish mealf All values were corrected for percent recovery.
c
173
APPENDIX G SENTINEL ANIMAL PROGRAM
METHODS
RESULTS
. . . . . . . . . . . . . . . . . . . . . . . . . . . . . . . . . . . . . . . . . . . . . . . . . . . . . . . . . . . . . . .
. . . . . . . . . . . . . . . . . . . . . . . . . . . . . . . . . . . . . . . . . . . . . . . . . . . . . . . . . . . . . . . 174 174
174 Oxazepam, NTP TR 468
SENTINEL ANIMAL PROGRAM
METHODS Rodents used in the Carcinogenesis Program of the National Toxicology Program are produced in optimally clean facilities to eliminate potential pathogens that may affect study results. The Sentinel Animal Program is part of the periodic monitoring of animal health that occurs during the toxicologic evaluation of chemical compounds. Under this program, the disease state of rodents is monitored via serology on sera from extra (sentinel) animals in the study rooms. These animals and the study animals are all subject to identical environmental conditions. The sentinel animals come from the same production source and weanling groups as the animals used for the studies of chemical compounds.
Serum samples were collected from randomly selected rats during the 2-year study. Blood from each animal was collected and allowed to clot, and the serum was separated. The samples were processed appropriately and sent to Microbiological Associates Inc. (Bethesda, MD), for determination of antibody titers. The laboratory serology methods and viral agents for which testing was performed are tabulated below; the times at which the blood was collected during the studies are also listed.
Method and Test Time of Analysis
2-Year Study ELISA
Mycoplasma arthritidis Mycoplasma pulmonis PVM (pneumonia virus of mice) RCV/SDA (rat coronavirus/sialodacryoadenitis virus) Sendai
Study termination Study termination6, 12, and 18 months, study termination6, 12, and 18 months, study termination6, 12, and 18 months, study termination
Hemagglutination Inhibition H-1 (Toolan’s H-1 virus) KRV (Kilham rat virus)
6, 12, and 18 months, study termination6, 12, and 18 months, study termination
RESULTS Two rats had positive titers to M. arthritidis at study termination. Further evaluations of the serum positive for M. arthritidis by immunoblot and Western blot procedures indicated that the positive titers may have been due to cross reaction with antibodies of nonpathogenic Mycoplasma or other agents. Only sporadic samples were positive, and there were no clinical findings or histopathologic changes of M. arthritidis infection in animals with positive titers. Accordingly, the M. arthritidis-positive titers were considered false positives.
175
APPENDIX H EARLY RESPONSES OF F344/N RATS
TO OXAZEPAM
Michael L. Cunningham and John R. Bucher Environmental Toxicology Program
National Institute of Environmental Health Sciences Research Triangle Park, North Carolina
INTRODUCTION . . . . . . . . . . . . . . . . . . . . . . . . . . . . . . . . . . . . . . . . . . . . . . . . . . . . . . . . . . . . 176 MATERIALS AND METHODS . . . . . . . . . . . . . . . . . . . . . . . . . . . . . . . . . . . . . . . . . . . . . . . . . . . . 176 RESULTS . . . . . . . . . . . . . . . . . . . . . . . . . . . . . . . . . . . . . . . . . . . . . . . . . . . . . . . . . . . . . . . . 178 REFERENCES . . . . . . . . . . . . . . . . . . . . . . . . . . . . . . . . . . . . . . . . . . . . . . . . . . . . . . . . . . . . . . 180 TABLE H1 Survival, Body Weights, and Feed Consumption of Male F344/N Rats
Administered Oxazepam in Feed for 90 Days . . . . . . . . . . . . . . . . . . . . . . . . . . . . . . 181 TABLE H2 BrdU and Proliferating Cell Nuclear Antigen Labeling Indices,
Liver Weight/Body Weight Ratios, and Total Body Burden of Male F344/N Rats Administered Oxazepam in Feed for 90 Days . . . . . . . . . . . . . . . . . . . . . . . . . . . . . . 182
TABLE H3 Clinical Chemistry Data for Male F344/N Rats Administered Oxazepam in Feed for 90 Days . . . . . . . . . . . . . . . . . . . . . . . . . . . . . . . . . . . . . . . . . . . . . . . 183
TABLE H4 Serum Oxazepam Concentrations in Male F344/N Rats Administered Oxazepam in Feed for 90 Days . . . . . . . . . . . . . . . . . . . . . . . . . . . . . . . . . . . . . . . . . . . . . . . 184
176 Oxazepam, NTP TR 468
EARLY RESPONSES OF F344/N RATS TO OXAZEPAM
INTRODUCTION Oxazepam and related benzodiazepine drugs are used in the treatment of anxiety. Most clinically useful drugs for this purpose are variants of the 1,4-benzodiazepine structure comprising two aromatic rings and a seven-membered heterocycle. One of the aromatic rings is fused to the seven-membered ring and contains a chloro-substituent or some other electronegative group. All clinically important derivatives contain a 5-aryl or 5-cyclohexenyl group. Most of the drugs vary in substituent groups at the 1 and 3 positions (Goodman and Gilman’s, 1990). Oxazepam, known under the trade name Serax®, is produced and sold by Wyeth Laboratories and has been on the market since 1965.
Two million six hundred thousand prescriptions for oxazepam were written in the United States in 1983, and oxazepam ranked 132nd and 125th in overall frequency of prescriptions written for all drugs in 1984 and 1985, respectively (Anonymous, 1986; C. Baum correspondence, 1986). Oxazepam is also a common metabolite of several other benzodiazepines, some of which are more widely prescribed. These include diazepam (Valium®), for which 25.5 million prescriptions were written in 1983, making it the fourth most prescribed drug. The use of benzodiazepines in the general population in the United States has been reported to be as high as 7% (Pedersen and Lavik, 1991).
In NTP studies, oxazepam was not mutagenic in any of several strains of Salmonella typhimurium, nor did it induce sister chromatid exchanges or chromosomal aberrations in cultured Chinese hamster ovary cells with or without metabolic activation. However, Fox and Lahcen (1974) observed liver neoplasms in oxazepamtreated Swiss-Webster mice during the course of reproductive toxicity studies, and oxazepam caused increased incidences of liver neoplasms in male and female Swiss-Webster and B6C3F mice in 2-year NTP1
feed studies (NTP, 1993). A 2-year feed study was subsequently started using F344/N rats. Because of the resemblance of the mouse results to those with other apparently nonnecrogenic and nongenotoxic liver carcinogens and the earlier observation that oxazepam was hepatocarcinogenic in both Swiss-Webster and B6C3F mice, oxazepam was concurrently evaluated for clinical pathology and hepatocellular cell replication1
in a 13-week feed study with male F344/N rats. Exposure concentrations administered via feed were identical to those in the B6C3F mouse study (Cunningham et al., 1994a). Serum oxazepam levels were also1
evaluated for comparison to the previous mouse studies and to therapeutic human levels.
MATERIALS AND METHODS Animals Male Fisher 344/N rats (Charles River Breeding Laboratories, Raleigh, NC) weighing 150 g were fed a standard NIH 31 diet ad libitum and exposed to a daily cycle of alternating 12-hour periods of light and dark. The rats were acclimated to this environment for 2 weeks prior to the beginning of the study; animal rooms were maintained at 21E to 23E C and 40% to 60% relative humidity throughout the study. Rats were randomly assigned to exposure groups of 10 animals per group and allowed 7 days to adapt to a new cage environment and the powdered chow mixture (without oxazepam) described below. Experiments were performed according to the guidelines established in the NIH Guide for the Care and Use of Laboratory Animals. Animals were killed by CO asphyxiation and exsanguination. Blood samples were allowed to clot2
for approximately 30 minutes at room temperature, after which they were centrifuged at 5,000 × g for 5 minutes. Serum was collected and immediately analyzed for activities or concentrations of the following: albumin, total protein, alkaline phosphatase, alanine aminotransferase, creatine kinase, sorbitol dehydrogenase, 5N-nucleotidase, total bile acids, creatinine, and total cholesterol. All analyses were performed using a Monarch 2000 chemistry analyzer (Instrumentation Laboratories, Lexington, MA). Except for total bile acids and 5N-nucleotidase, all assays were performed using reagent kits and standard applications developed for the analyzer by the manufacturer. Assays for total bile acids and 5N-nucleotidase
177 Oxazepam, NTP TR 468
were developed for the analyzer using reagent kits obtained from Sigma Chemical Company (St. Louis, MO). Experimental effects for clinical chemistry measurements were identified by analysis of variance. Significant differences between animals in exposed and control groups were detected using Dunnett’s multiple comparison test (Dunnett, 1955).
Chemical Exposure Oxazepam was acquired from the National Toxicology Program repository from the lots used for the 2-year carcinogenicity studies. Dosed feed was prepared biweekly in 7-kg batches by Radian Corporation (Research Triangle Park, NC) by mixing ground feed and oxazepam in a Patterson-Kelly blender for 15 minutes with the intensifier bar in operation for the first 5 minutes. Aliquots were analyzed by highperformance liquid chromatography (HPLC) using acetophenone as the internal standard (details available upon request). Concentrations of oxazepam in feed were within 10% of target concentrations. Control animals received an identical powdered chow mixture with no oxazepam. Powdered chow was delivered to rats in stainless steel hanging feeders covered with wire mesh to prevent feed scattering. Estimations of feed consumption were performed weekly.
Cell Proliferation Measurements Seven days before the end of the study, osmotic minipumps (Model 2002, Alza Corporation, Palo Alto, CA) were implanted subcutaneously into the backs of the rats. These minipumps delivered 30 mg bromodeoxyuridine (BrdU) (Sigma Chemical Co.) per hour, which was incorporated into the DNA of newly replicating cells. At the end of the study, animals were killed by CO inhalation, and blood was collected for2
clinical chemistry measurements and analysis of oxazepam levels. Livers and kidneys were blotted and weighed. A mid-lobe radial section of the right anterior lobe was fixed in neutral buffered formalin for 24 hours. A cross section of small intestine was also fixed as a positive control for the proper operation of the minipump and the staining technique because these cells are constantly in S phase. Tissues were embedded in paraffin, and serial sections were mounted onto slides coated with poly-l-lysine. Following deparaffination and rehydration, one set of slides was stained with hematoxylin and eosin for histological analysis, and another set was stained immunohistochemically for BrdU incorporation as described previously (Cunningham and Matthews, 1991; Cunningham et al., 1991, 1994a, 1994b). Slides were treated with 2 N HCl for 30 minutes at 37 EC to allow the DNA to become single stranded. The acid treatment was quenched with boric acid buffer (pH 7.6) for 1 minute at room temperature, followed by digestion in 0.01% trypsin (Sigma Chemical Co.) and rinsed in PBT [phosphate buffer, pH 7.2, containing 1% bovine serum albumin (Sigma Chemical Co.), 0.05% Tween 20 (Bio-Rad, Richmond, CA) and 7.2% NaCl]. Nonspecific antibody binding was eliminated by blocking (20 minutes) with normal horse serum (1:20) (Vector Laboratories, Inc., Burlington, CA). Following a PBT wash, the slides were incubated with a 1:50 dilution of mouse monoclonal antibody to BrdU (Becton Dickenson, Mountain View, CA) for 20 minutes at room temperature. Following two PBT washes, the slides were incubated with a 1:100 dilution of a biotinylated horse antimouse antibody (Vector Laboratories, Inc.; rat absorbed) for 20 minutes at room temperature and visualized with the avidin biotin peroxidase complex (ABC) method using a Vectastain peroxidase standard kit (Vector Laboratories, Inc.). Nuclei binding the ABC reagent (labeled nuclei) were stained for 6 minutes with 3,3Ndiaminobenzidine (Sigma Chemical Co.) to give a dark brown color, and nonlabeled nuclei were stained with hematoxylin to yield a blue color. Random areas of the slides were chosen for counting stained and unstained hepatocyte nuclei (>1,000 hepatocytes/rat). Statistics were performed using Student’s t-test.
Serum Oxazepam Analysis Frozen serum was allowed to thaw, and 0.1 mL aliquots were made basic with 10 µL 0.1 M NaOH. Parent oxazepam was extracted from the aqueous layer with 1 mL ethyl acetate followed by centrifugation (1,500 rpm for 5 minutes). The organic layer containing the oxazepam was removed and evaporated to dryness under nitrogen. Samples were reconstituted in 100 µL 0.05 M 60% methanol:40% phosphate buffer; pH 2.8). Samples were analyzed for oxazepam by HPLC (Waters Associates, Milford, MA); the system consisted of two Model 510 HPLC pumps, a 712 WISP multiple sample injector, a
178 Oxazepam, NTP TR 468
490E multiwavelength detector at 230 nm, and a C18 column. Samples were run isocratically at 0.8 mL/minute in a methanol:phosphate buffer (60:40) carrier. Serum oxazepam was quantitated against an oxazepam standard curve created with spiked serum standards.
RESULTS All rats survived to the end of the study, although oxazepam had a sedative effect on the rats in the 5,000 ppm groups. Rats in the 2,500 and 5,000 ppm groups consumed significantly less feed than did controls at the 15-, 30-, and 45-day intervals (Table H1). Other sporadic differences in feed consumption were also noted. Animals in the 2,500 and 5,000 ppm groups were observed to be sluggish for the first 2 to 4 weeks, but activity levels appeared normal thereafter. On day 15, the final mean body weights and body weight gains of the 2,500 and 5,000 ppm groups were significantly less than those of the control group, but were similar on day 30. The mean body weight gains of the 5,000 ppm group were less than those of the control group on days 45 and 90 as was that of 2,500 ppm rats on day 90 (Table H1).
The amount of hepatocellular proliferation was examined in relation to the amount of oxazepam consumed and the relative increase in liver weight over the course of this study. Male rats exposed to 2,500 or 5,000 ppm oxazepam exhibited a significant increase in the rate of hepatocyte cell proliferation as determined by BrdU incorporation as well as by PCNA staining at the 15-day time point (Table H2). By day 15, BrdU labeling indices in these groups were approximately three- to five-fold the untreated control indices, respectively. Both labeling indices in these groups were also significantly elevated compared to those of the controls on day 30, but this increase more likely reflects the variably lowered control labeling observed for both BrdU labeling and PCNA labeling. Labeling indices of all exposed groups were similar to those of the controls for both BrdU and PCNA at the 45- and 90-day time points.
Liver weight/body weight ratios in the 2,500 and 5,000 ppm groups were significantly greater than the control value at all time points (Table H2). Liver weight/body weight ratios in the 25 and 125 ppm groups were slightly elevated only at the 45-day time point. Rats exposed to 5,000 ppm oxazepam received approximately 19,000 mg oxazepam/kg body weight over 90 days.
Slight variations in serum activities of alanine aminotransferase, alkaline phosphatase, and 5N-nucleotidase were observed in the serum of rats exposed to 2,500 or 5,000 ppm oxazepam at various time points (Table H3). Other mild but statistically significant changes included decreases in cholesterol concentrations in the 2,500 and 5,000 ppm groups on days 30 and 90 and in the 5,000 ppm group on day 45, and an increase in bile acid concentration in the 5,000 ppm group on day 30. Increases in albumin concentrations occurred in 5,000 ppm rats on days 30 and 45 and in 2,500 and 5,000 ppm rats on day 90. Mild, statistically significant decreases in activities of sorbitol dehydrogenase and creatinine occurred in exposed groups. None of these changes was considered to have biological importance.
Histopathologic evaluation of hematoxylin- and eosin-stained slides revealed little histologic evidence of cytotoxicity or hepatocyte degeneration and no generalized or periportal inflammation. The major histological feature of rats exposed to oxazepam was hypertrophy, characterized by enlarged hepatocytes with pale pink, nonvacuolated cytoplasm. In the 25 and 125 ppm groups, hypertrophy was centrilobular, was consistent with proliferation of smooth endoplasmic reticulum, and encompassed hepatocytes two to six cells deep emanating from the central vein. At 2,500 and 5,000 ppm, hypertrophy became more extensive, and the area of enlargement of hepatocytes included the periportal region. Although the largest
179 Oxazepam, NTP TR 468
hepatocytes were usually found around the central vein, all hepatocytes in rats exposed to 2,500 or 5,000 ppm were markedly enlarged and pale, causing generalized occlusion of sinusoids.
Serum oxazepam concentrations increased as a function of exposure concentration in all groups (Table H4). The highest serum oxazepam concentration, approximately 3.63 µg/mL, occurred in the 5,000 ppm group on day 90. Serum oxazepam concentrations appeared unstable between 15 and 90 days in the 2,500 and 5,000 ppm groups, dropping after 15 days and returning to high concentrations by 90 days. This was apparently due to the induction of drug metabolizing (Phase I) and conjugating enzymes (Phase II), with a concomitant increase in total body clearance of oxazepam (Griffin and Burka, 1995). The serum oxazepam concentrations observed in rats are approximately 10% of those attained in mice exposed for the same amount of time to the same exposure concentrations in earlier studies (Cunningham et al., 1994a).
180 Oxazepam, NTP TR 468
REFERENCES Anonymous (1986). Top 200 Drugs of 1985: A 1.4% increase in refills nudges 1985 rxs 1.1% ahead of 1984 volume. Pharm. Times 52, 25-33.
Cunningham, M.L., and Matthews, H.B. (1991). Relationship of hepatocarcinogenicity and hepatocellular proliferation induced by mutagenic noncarcinogens vs carcinogens. II. 1- vs 2-nitropropane. Toxicol. Appl. Pharmacol. 110, 505-513.
Cunningham, M.L., Foley, J., Maronpot, R.R., and Matthews, H.B. (1991). Correlation of hepatocellular proliferation with hepatocarcinogenicity induced by the mutagenic noncarcinogen:carcinogen pair — 2,6- and 2,4-diaminotoluene. Toxicol. Appl. Pharmacol. 107, 562-567.
Cunningham, M.L., Maronpot, R.R., Thompson, M., and Bucher, J.R. (1994a). Early responses of the liver of B6C3F1 mice to the hepatocarcinogen oxazepam. Toxicol. Appl. Pharmacol. 124, 31-38.
Cunningham, M.L., Elwell, M.R., and Matthews, H.B. (1994b). Relationship of carcinogenicity and cellular proliferation induced by mutagenic noncarcinogens vs carcinogens. III. Organophosphate pesticides vs tris(2,3-dibromopropyl)phosphate. Fundam. Appl. Toxicol. 23, 363-369.
Dunnett, C.W. (1955). A multiple comparison procedure for comparing several treatments with a control. J. Am. Stat. Assoc. 50, 1096-1121.
Fox, K.A., and Lahcen, R.B. (1974). Liver-cell adenomas and peliosis hepatis in mice associated with oxazepam. Res. Commun. Chem. Pathol. Pharmacol. 8, 481-488.
Goodman and Gilman’s The Pharmacological Basis of Therapeutics (1990). 8th ed. (A.G. Gilman, T.W. Rall, A.S. Nies, and P. Taylor, Eds.), p. 357. Pergamon Press, Inc., New York.
Griffin, R.J., and Burka, L.T. (1995). Metabolism and elimination of oxazepam in F344 rats. Drug Metab. Dispos. 23, 232-239.
National Toxicology Program (NTP) (1993). Toxicology and Carcinogenesis Studies of Oxazepam (CAS No. 604-75-1) in Swiss-Webster and B6C3F Mice (Feed Studies). Technical Report Series No. 443. NIH1
Publication No. 93-3359. U.S. Department of Health and Human Services, Public Health Service, National Institutes of Health, Research Triangle Park, NC.
Pedersen, W., and Lavik, N.J. (1991). Adolescents and benzodiazepines: Prescribed use, self-medication and intoxication. Acta Psychiatr. Scand. 84, 94-98.
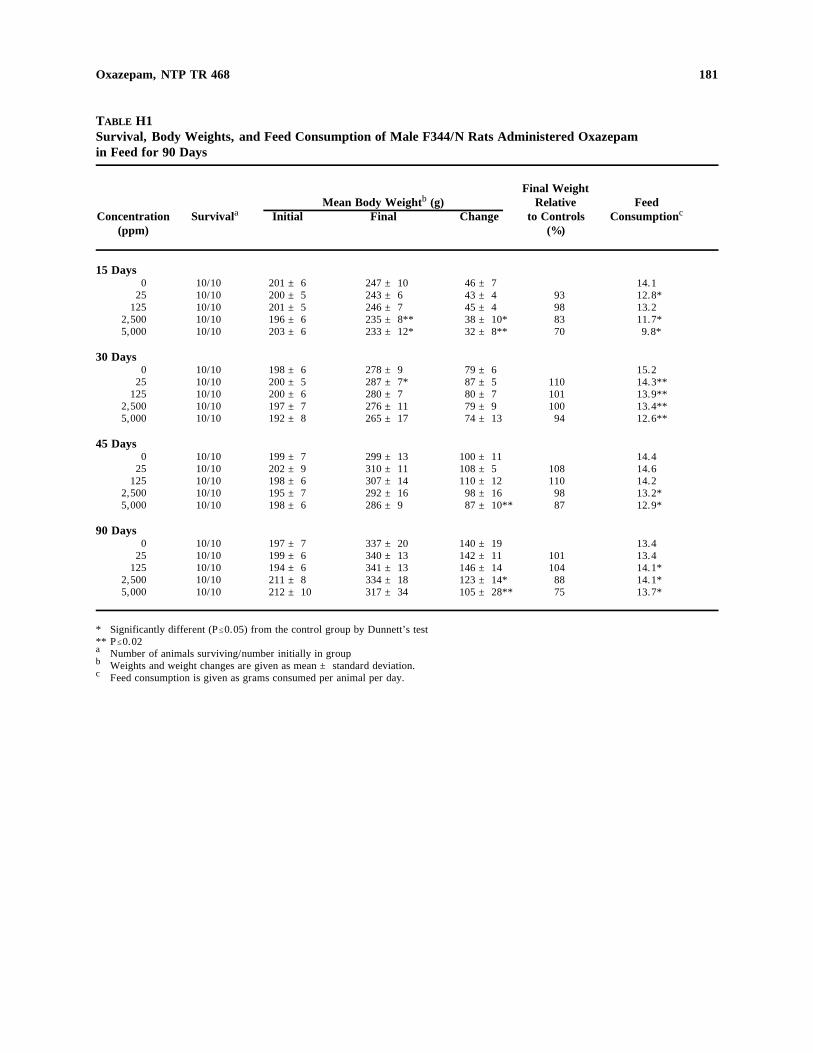
181
c
Oxazepam, NTP TR 468
TABLE H1 Survival, Body Weights, and Feed Consumption of Male F344/N Rats Administered Oxazepam in Feed for 90 Days
Concentration (ppm)
Survivala Initial Mean Body Weight (g) b
Final Change
Final Weight Relative
to Controls (%)
Feed Consumptionc
15 Days 0
25 125
2,500 5,000
10/10 10/10 10/10 10/10 10/10
201 ± 6 200 ± 5 201 ± 5 196 ± 6 203 ± 6
247 ± 10 243 ± 6 246 ± 7 235 ± 8** 233 ± 12*
46 ± 7 43 ± 4 45 ± 4 38 ± 10* 32 ± 8**
93 98 83 70
14.1 12.8* 13.2 11.7* 9.8*
30 Days 0
25 125
2,500 5,000
10/10 10/10 10/10 10/10 10/10
198 ± 6 200 ± 5 200 ± 6 197 ± 7 192 ± 8
278 ± 9 287 ± 7* 280 ± 7 276 ± 11 265 ± 17
79 ± 6 87 ± 5 80 ± 7 79 ± 9 74 ± 13
110 101 100 94
15.2 14.3** 13.9** 13.4** 12.6**
45 Days 0
25 125
2,500 5,000
10/10 10/10 10/10 10/10 10/10
199 ± 7 202 ± 9 198 ± 6 195 ± 7 198 ± 6
299 ± 13 310 ± 11 307 ± 14 292 ± 16 286 ± 9
100 ± 11 108 ± 5 110 ± 12 98 ± 16 87 ± 10**
108 110 98 87
14.4 14.6 14.2 13.2* 12.9*
90 Days 0
25 125
2,500 5,000
10/10 10/10 10/10 10/10 10/10
197 ± 7 199 ± 6 194 ± 6 211 ± 8 212 ± 10
337 ± 20 340 ± 13 341 ± 13 334 ± 18 317 ± 34
140 ± 19 142 ± 11 146 ± 14 123 ± 14* 105 ± 28**
101 104 88 75
13.4 13.4 14.1* 14.1* 13.7*
* Significantly different (P#0.05) from the control group by Dunnett’s test ** P#0.02 a Number of animals surviving/number initially in groupb Weights and weight changes are given as mean ± standard deviation.
Feed consumption is given as grams consumed per animal per day.
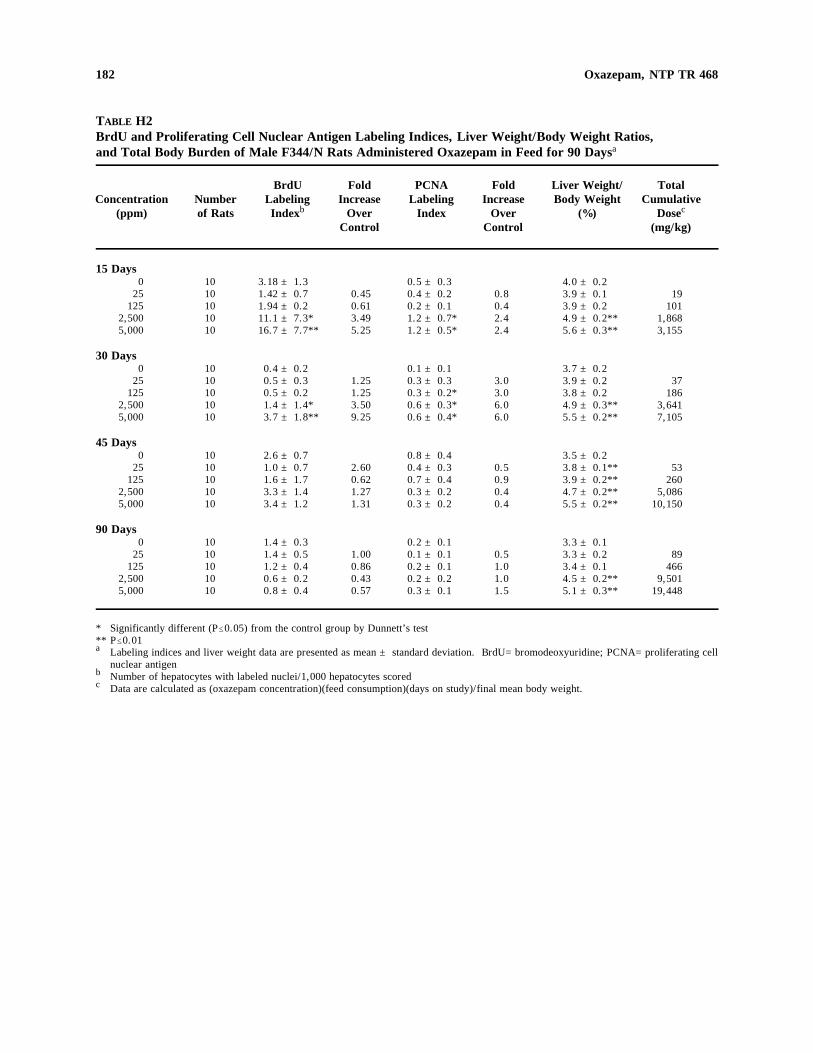
182
c
Oxazepam, NTP TR 468
TABLE H2 BrdU and Proliferating Cell Nuclear Antigen Labeling Indices, Liver Weight/Body Weight Ratios, and Total Body Burden of Male F344/N Rats Administered Oxazepam in Feed for 90 Daysa
Concentration (ppm)
Number of Rats
BrdU Labeling Indexb
Fold Increase
Over Control
PCNA Labeling
Index
Fold Increase
Over Control
Liver Weight/ Body Weight
(%)
Total Cumulative
Dosec
(mg/kg)
15 Days 0
25 125
2,500 5,000
10 10 10 10 10
3.18 ± 1.3 1.42 ± 0.7 1.94 ± 0.2 11.1 ± 7.3* 16.7 ± 7.7**
0.45 0.61 3.49 5.25
0.5 ± 0.3 0.4 ± 0.2 0.2 ± 0.1 1.2 ± 0.7* 1.2 ± 0.5*
0.8 0.4 2.4 2.4
4.0 ± 0.2 3.9 ± 0.1 3.9 ± 0.2 4.9 ± 0.2** 5.6 ± 0.3**
19 101
1,868 3,155
30 Days 0
25 125
2,500 5,000
10 10 10 10 10
0.4 ± 0.2 0.5 ± 0.3 0.5 ± 0.2 1.4 ± 1.4* 3.7 ± 1.8**
1.25 1.25 3.50 9.25
0.1 ± 0.1 0.3 ± 0.3 0.3 ± 0.2* 0.6 ± 0.3* 0.6 ± 0.4*
3.0 3.0 6.0 6.0
3.7 ± 0.2 3.9 ± 0.2 3.8 ± 0.2 4.9 ± 0.3** 5.5 ± 0.2**
37 186
3,641 7,105
45 Days 0
25 125
2,500 5,000
10 10 10 10 10
2.6 ± 0.7 1.0 ± 0.7 1.6 ± 1.7 3.3 ± 1.4 3.4 ± 1.2
2.60 0.62 1.27 1.31
0.8 ± 0.4 0.4 ± 0.3 0.7 ± 0.4 0.3 ± 0.2 0.3 ± 0.2
0.5 0.9 0.4 0.4
3.5 ± 0.2 3.8 ± 0.1** 3.9 ± 0.2** 4.7 ± 0.2** 5.5 ± 0.2**
53 260
5,086 10,150
90 Days 0
25 125
2,500 5,000
10 10 10 10 10
1.4 ± 0.3 1.4 ± 0.5 1.2 ± 0.4 0.6 ± 0.2 0.8 ± 0.4
1.00 0.86 0.43 0.57
0.2 ± 0.1 0.1 ± 0.1 0.2 ± 0.1 0.2 ± 0.2 0.3 ± 0.1
0.5 1.0 1.0 1.5
3.3 ± 0.1 3.3 ± 0.2 3.4 ± 0.1 4.5 ± 0.2** 5.1 ± 0.3**
89 466
9,501 19,448
* Significantly different (P#0.05) from the control group by Dunnett’s test ** P#0.01 a Labeling indices and liver weight data are presented as mean ± standard deviation. BrdU=bromodeoxyuridine; PCNA=proliferating cell
nuclear antigenb Number of hepatocytes with labeled nuclei/1,000 hepatocytes scored
Data are calculated as (oxazepam concentration)(feed consumption)(days on study)/final mean body weight.
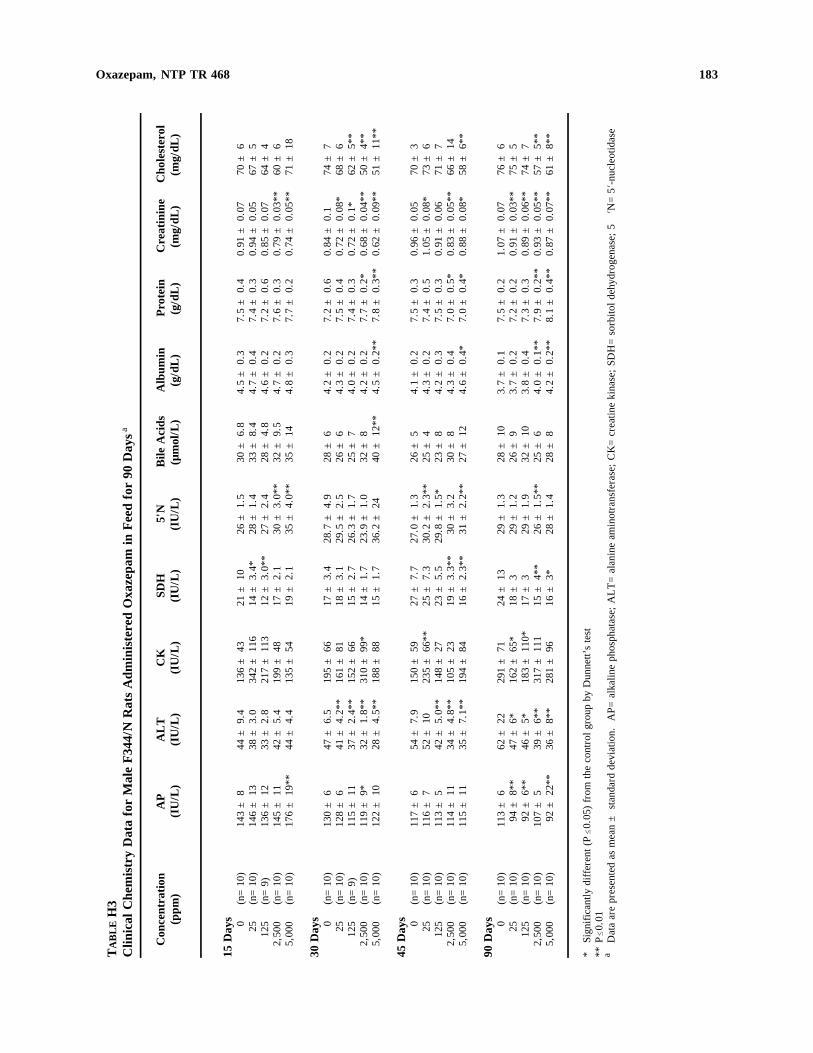
183
TA
BL
E H
3C
linic
al C
hem
istr
y D
ata
for
Mal
e F
344/
N R
ats
Adm
inis
tere
d O
xaze
pam
in F
eed
for
90 D
ays a
Con
cent
rati
on
AP
A
LT
C
K
SDH
5'
N
Bile
Aci
ds
Alb
umin
P
rote
in
Cre
atin
ine
Cho
lest
erol
(ppm
) (I
U/L
) (I
U/L
) (I
U/L
) (I
U/L
) (I
U/L
) (µ
mol
/L)
(g/d
L)
(g/d
L)
(mg/
dL)
(mg/
dL)
15 D
ays 0
(n=
10)
143
± 8
44
± 9
.4
136
± 4
3 21
± 1
0 26
± 1
.5
30 ±
6.8
4.
5 ±
0.3
7.
5 ±
0.4
0.
91 ±
0.0
7 70
± 6
25
(n
=10
) 14
6 ±
13
38 ±
3.0
34
2 ±
116
14
± 3
.4*
28 ±
1.4
33
± 8
.4
4.7
± 0
.4
7.4
± 0
.3
0.94
± 0
.05
67 ±
5
125
(n=
9)
136
± 1
2 33
± 2
.8
217
± 1
13
12 ±
3.0
**
27 ±
2.4
28
± 4
.8
4.6
± 0
.2
7.2
± 0
.6
0.85
± 0
.07
64 ±
4
2,50
0 (n
=10
) 14
5 ±
11
42 ±
5.4
19
9 ±
48
17 ±
2.1
30
± 3
.0**
32
± 9
.5
4.7
± 0
.2
7.6
± 0
.3
0.79
± 0
.03*
* 60
± 6
5,
000
(n=
10)
176
± 1
9**
44 ±
4.4
13
5 ±
54
19 ±
2.1
35
± 4
.0**
35
± 1
4 4.
8 ±
0.3
7.
7 ±
0.2
0.
74 ±
0.0
5**
71 ±
18
30 D
ays 0
(n=
10)
130
± 6
47
± 6
.5
195
± 6
6 17
± 3
.4
28.7
± 4
.9
28 ±
6
4.2
± 0
.2
7.2
± 0
.6
0.84
± 0
.1
74 ±
7
25
(n=
10)
128
± 6
41
± 4
.2**
16
1 ±
81
18 ±
3.1
29
.5 ±
2.5
26
± 6
4.
3 ±
0.2
7.
5 ±
0.4
0.
72 ±
0.0
8*
68 ±
6
125
(n=
9)
115
± 1
1 37
± 2
.4**
15
2 ±
66
15 ±
2.7
26
.3 ±
1.7
25
± 7
4.
0 ±
0.2
7.
4 ±
0.3
0.
72 ±
0.1
* 62
± 5
**
2,50
0 (n
=10
) 11
9 ±
9*
32 ±
1.8
**
310
± 9
9*
14 ±
1.7
23
.9 ±
1.0
32
± 8
4.
2 ±
0.2
7.
7 ±
0.2
* 0.
68 ±
0.0
4**
50 ±
4**
5,
000
(n=
10)
122
± 1
0 28
± 4
.5**
18
8 ±
88
15 ±
1.7
36
.2 ±
24
40 ±
12*
* 4.
5 ±
0.2
**
7.8
± 0
.3**
0.
62 ±
0.0
9**
51 ±
11*
*
45 D
ays 0
(n=
10)
117
± 6
54
± 7
.9
150
± 5
9 27
± 7
.7
27.0
± 1
.3
26 ±
5
4.1
± 0
.2
7.5
± 0
.3
0.96
± 0
.05
70 ±
3
25
(n=
10)
116
± 7
52
± 1
0 23
5 ±
66*
* 25
± 7
.3
30.2
± 2
.3**
25
± 4
4.
3 ±
0.2
7.
4 ±
0.5
1.
05 ±
0.0
8*
73 ±
6
125
(n=
10)
113
± 5
42
± 5
.0**
14
8 ±
27
23 ±
5.5
29
.8 ±
1.5
* 23
± 8
4.
2 ±
0.3
7.
5 ±
0.3
0.
91 ±
0.0
6 71
± 7
2,
500
(n=
10)
114
± 1
1 34
± 4
.8**
10
5 ±
23
19 ±
3.3
**
30 ±
3.2
30
± 8
4.
3 ±
0.4
7.
0 ±
0.5
* 0.
83 ±
0.0
5**
66 ±
14
5,00
0 (n
=10
) 11
5 ±
11
35 ±
7.1
**
194
± 8
4 16
± 2
.3**
31
± 2
.2**
27
± 1
2 4.
6 ±
0.4
* 7.
0 ±
0.4
* 0.
88 ±
0.0
8*
58 ±
6**
90 D
ays 0
(n=
10)
113
± 6
62
± 2
2 29
1 ±
71
24 ±
13
29 ±
1.3
28
± 1
0 3.
7 ±
0.1
7.
5 ±
0.2
1.
07 ±
0.0
7 76
± 6
25
(n
=10
) 94
± 8
**
47 ±
6*
162
± 6
5*
18 ±
3
29 ±
1.2
26
± 9
3.
7 ±
0.2
7.
2 ±
0.2
0.
91 ±
0.0
3**
75 ±
5
125
(n=
10)
92 ±
6**
46
± 5
* 18
3 ±
110
* 17
± 3
29
± 1
.9
32 ±
10
3.8
± 0
.4
7.3
± 0
.3
0.89
± 0
.06*
* 74
± 7
2,
500
(n=
10)
107
± 5
39
± 6
**
317
± 1
11
15 ±
4**
26
± 1
.5**
25
± 6
4.
0 ±
0.1
**
7.9
± 0
.2**
0.
93 ±
0.0
5**
57 ±
5**
5,
000
(n=
10)
92 ±
22*
* 36
± 8
**
281
± 9
6 16
± 3
* 28
± 1
.4
28 ±
8
4.2
± 0
.2**
8.
1 ±
0.4
**
0.87
± 0
.07*
* 61
± 8
**
* Si
gnif
ican
tly d
iffe
rent
(P#
0.05
) fr
om th
e co
ntro
l gro
up b
y D
unne
tt’s
test
** P#
0.01
a D
ata
are
pres
ente
d as
mea
n ±
sta
ndar
d de
viat
ion.
AP=
alka
line
phos
phat
ase;
AL
T=
alan
ine
amin
otra
nsfe
rase
; C
K=
crea
tine
kina
se;
SDH
=so
rbito
l deh
ydro
gena
se;
5 NN
=5N
-nuc
leot
idas
e
Oxazepam, NTP TR 468
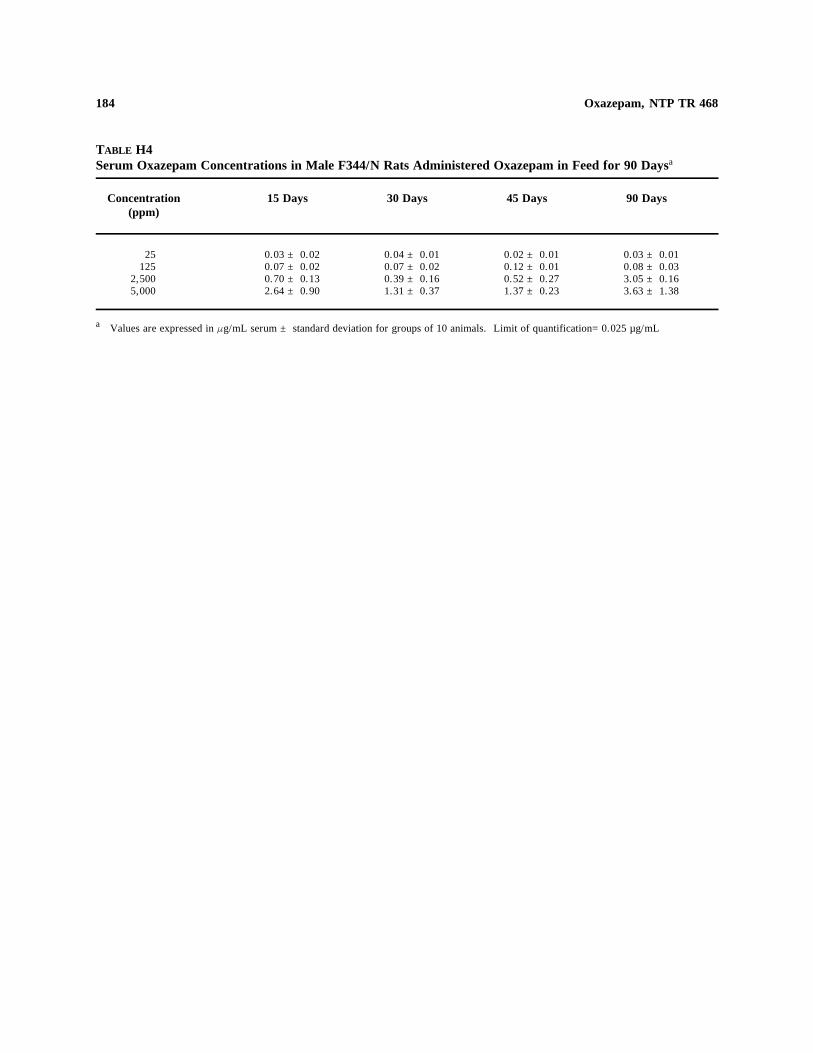
184 Oxazepam, NTP TR 468
TABLE H4 Serum Oxazepam Concentrations in Male F344/N Rats Administered Oxazepam in Feed for 90 Daysa
Concentration (ppm)
15 Days 30 Days 45 Days 90 Days
25 125
2,500 5,000
0.03 ± 0.02 0.07 ± 0.02 0.70 ± 0.13 2.64 ± 0.90
0.04 ± 0.01 0.07 ± 0.02 0.39 ± 0.16 1.31 ± 0.37
0.02 ± 0.01 0.12 ± 0.01 0.52 ± 0.27 1.37 ± 0.23
0.03 ± 0.01 0.08 ± 0.03 3.05 ± 0.16 3.63 ± 1.38
a Values are expressed in Fg/mL serum ± standard deviation for groups of 10 animals. Limit of quantification=0.025 µg/mL