toyo ink annual report 2002 · 2018-11-30 · annual report 2002 表紙 1 c myk cyan cyan cyan...
TRANSCRIPT

c1
50p10/66p2
TOY
O IN
K M
FG. C
O.,LTD
.A
NN
UA
L REPO
RT 2002
表紙 1
CCC M Y KCYANCYANCYAN MAGEN- YEL- BLACK
ANNUAL REPORT 2002YEAR ENDED MARCH 31, 2002
CF0302
CF0452
CF0060
CF0190
CF0385
CF0347
CF0130

50p10/66p2 50p10/66p
c2 表紙 2
1 Financial Highlights (Consolidated Basis)
2 Toward Industry-Leading Networking
and Client-Response Capabilities
4 Toyo Ink’s Strategy for Building the No.1 Brand
5 R&D Strengths
6 Leveraging Intragroup Synergies
8 Review of Operations
16 Financial Section
43 Domestic Network
44 International Network
46 Board of Directors and Corporate Auditors/
Corporate Data
Incorporated in 1907 as a manufacturer of
printing inks, TOYO INK MFG. CO., LTD., has
strategically diversified its operations into
industrial chemicals, synthetic resin colorants,
and printing equipment and systems. The
Company is meeting the wide-ranging and
sophisticated needs of its customers through
its extensive network in Japan and an inter-
national network of more than 60 sub-
sidiaries, factories, and representative
offices in North America, Europe, Asia, and
Oceania. The Company maintains a particularly
large number of centers in China, where it is
implementing wide-ranging business develop-
ment. In its quest to expand the scope
of its operations, Toyo Ink has established
cooperative business relationships with promi-
nent domestic and overseas companies and
is listed on the First Section of the Tokyo
Stock Exchange.

Thousands ofMillions of yen U.S. dollars
2002 2001 2002
For the year:
Net sales.............................................................................................................................. ¥222,359 ¥222,246 $1,671,872
Operating income............................................................................................................... 6,942 10,242 52,195
Income before income taxes and minority interests ............................................................. 1,571 4,935 11,812
Net income......................................................................................................................... 805 1,712 6,053
Free cash in-flow (out-flow) ................................................................................................ (2,834) 13,111 (21,308)
Capital expenditures ........................................................................................................... 17,776 13,615 133,654
Depreciation and amortization............................................................................................ 10,318 10,007 77,579
R&D expenses..................................................................................................................... 7,845 6,790 58,985
At year-end:
Net property, plant and equipment ........................................................................................ 88,524 83,001 665,594
Total investments and other assets ..................................................................................... 49,342 52,017 370,992
Total assets......................................................................................................................... 283,221 283,993 2,129,481
Total shareholders’ equity ................................................................................................... 118,087 117,236 887,872
Interest-bearing debt .......................................................................................................... 94,368 93,905 709,534
Working capital .................................................................................................................. 36,300 54,873 272,932
Yen U.S. dollars
Per share of common stock:
Net income......................................................................................................................... ¥2.91 ¥6.19 $0.022
Fully diluted net income...................................................................................................... — 5.50 —
Cash dividends applicable to the year ................................................................................. 6.00 5.50 0.045
Notes: 1. U.S. dollar amounts have been translated, for convenience only, at the rate of ¥133 to US$1, the approximate exchange rate at March 31, 2002.2. Fully diluted net income per share at March 31, 2002, is not disclosed because it is anti-dilutive.3. Free cash in-flow and out-flow are defined as net cash provided by operating activities less net cash used for investments. Such cash flows are amounts the Company
considers to be freely usable.
Financial Highlights (Consolidated Basis)TOYO INK MFG. CO., LTD. and Subsidiaries Years ended March 31, 2002 and 2001
1
’98 ’99 ’00 ’01 ’02
(Millions of yen)
NET SALES
241,
351
223,
506
215,
825
222,
246
222,
359
(Years ended March 31)
’98 ’99 ’00 ’01 ’02
NET INCOME AND NET INCOME PER SHARE
4,29
8
5,02
6
805
(Years ended March 31)
Net income (Millions of yen)Net income per share (Yen)
14.7
1.4
17.3
6.2
2.9
415
1,71
2
’98 ’99 ’00 ’01 ’02
TOTAL ASSETS AND EQUITY RATIO
320,
941
301,
762
299,
569
283,
993
283,
221
Total assets (Millions of yen)Equity ratio (%)
(At March 31)
37.8 39.7 40.1 41.3 41.7
’98 ’99 ’00 ’01 ’02
RETURN ON EQUITY(%)
(At March 31)
3.58
0.34
4.19
1.44
0.68

Toward Industry-Leading Networking and Client-Response Capabilities
2
Review of Fiscal 2001
Fiscal 2001, ended March 31, 2002, was the second of three years covered by the STEP 2 medium-term
business plan, part of TOYO INK MFG. CO., LTD.’s Take Off 2007 long-term business plan. In line with
the plan’s objectives of establishing the No. 1 brand in the Company’s fields of operation and boosting
the Toyo Ink Group’s profit generating capabilities, the Company placed strong emphasis on three strate-
gic themes:
• further increasing the speed of the Group’s industry-leading business development initiatives while
maintaining strong emphases on customer satisfaction, employee satisfaction, and societal satisfaction;
• more effectively leveraging synergies generated through collaboration among Group members to maxi-
mize Group profitability; and
• increasing environmental awareness and launching new environment-friendly products and businesses.
Based on these themes, Toyo Ink made various efforts—such as those aimed at strengthening its exist-
ing environment-friendly operations, strengthening systems for proposing business development in
potential growth fields, and bolstering existing production systems while innovatively reforming manufac-
turing processes. Through these and numerous other efforts made during the year under review, the
Company worked concertedly to more comprehensively cater to customers’ diverse needs, reduce costs,
rationalize operations, and strengthen manufacturing systems, thereby laying a solid basis for improved
performance.
In fiscal 2001, the Company continued striving to boost profitability by introducing and standardizing
supply chain management and value chain management techniques. In two fields—the chemicals and
Kunio SakumaPresident

3
media materials field and the polymer chemicals field—additional management decentralization steps
were made to expedite decision making, and additional resources were shifted to growth business sectors.
Since establishing its Audit Office as an independent unit in 1994, Toyo Ink has taken various mea-
sures to upgrade its capabilities for auditing and ensuring the soundness of its operations. During fiscal
2001, the Company took the additional step of establishing a Risk Management Committee that is
endeavoring to comprehensively evaluate and manage the risks it faces.
To augment its disclosure of information to investors, the Company holds performance explanation
meetings twice each year and has broadened the range of its publications, which include an annual
environmental report.
Important Tasks
In fiscal 2002, the last year of the STEP 2 medium-term business plan, Toyo Ink will step up its efforts to
attain the plan’s objectives of establishing the No. 1 brand in its fields of operation and boosting
Group profitability. The Company is striving to use supply chain management and value chain manage-
ment techniques throughout its operations and maximize corporate value by increasing the share of
growing businesses in its business structure. The Company is moving forward with measures for increas-
ing management emphases on total cash flow and improving the balance sheet structure, and it is com-
mitted to boosting ROE and ROA to at least 5.0% and 2.5%, respectively.
Toyo Ink has also begun drafting the details of the JUMP 1 medium-term business plan, which covers
the three years from April 1, 2003, and preparing to implement that plan. JUMP 1 will be aimed at pro-
moting further progress toward the central two goals of establishing the No. 1 brand in the Company’s
fields of operation and boosting the Toyo Ink Group’s profit generating capabilities. Through JUMP 1, the
Group is going to work hard to maximize its value by accurately responding to structural economic
changes throughout the world as well as to the increasing diversity of demand.
Overseas, Toyo Ink is intensifying its efforts to develop business related to China and is also proactively
augmenting its operations in such relatively new markets as those of the Middle East and Vietnam.
Toyo Ink recognizes the crucial importance of building a business structure that dependably generates
profits even if the current severity of conditions in its operating environment are protracted. Faced with
this challenge, the Group has effectively leveraged its accumulated technologies and know-how to supply
excellent products and services that anticipate contemporary user requirements with favorable results.
August 2002
TAKE OFF 2007—Long-Term Business Plan to Accomplish Our Corporate Vision
Themes of the Plan
Establishment of the vision
Strengthening of overall Group power
Creation of new value to be a company that creates
living culture
Fiscal Years
1994-96
1997-99
2000-02
2003-05
2006-07
HOP
STEP 1
Current STEP 2
JUMP 1
JUMP 2

TitleToyo Ink’s Strategy for Building the No. 1 Brand
—Boosting Our Brand Value through Customer-Oriented Responsiveness
The last year of the three-year STEP 2 stage of Toyo Ink’s Take Off 2007 long-term business plan, fiscal 2002 is an important year
in which the Company will continue its efforts to lay a solid basis for attaining the two central Take Off 2007 goals of establishing the No. 1 brand
in the Company’s fields of operation and boosting the Toyo Ink Group’s profit generating capabilities. From fiscal 2003, Toyo Ink will begin
implementing the JUMP stages of Take Off 2007, which are designed to create new value to be a company that creates living culture.
Realizing Toyo Ink’s Corporate Vision —Effectively Promoting Customer Satisfaction, Employee Satisfaction,
and Societal Satisfaction
To promote robust business development and establish the No. 1 brand in its fields of operation, Toyo
Ink is building on the trust and confidence that it and its products have inspired for more than 90 years.
Based on this long tradition and the appeal of its product portfolio, the Company intends to solidly posi-
tion itself as the No. 1 brand in the eyes of all its stakeholders while steadily increasing the number of
Toyo Ink Group stakeholders throughout the world.
Key Strategies for Stakeholder Satisfaction
Customer Satisfaction: Raising the quality of products and services by incorporating responses to
customer needs
Employee Satisfaction: Creating and implementing a fair system for evaluating employee performance
that inspires employee understanding
Societal Satisfaction: Leveraging the Group’s full potential to create products that take into
consideration both society and the environment
Stakeholder Satisfaction Measures in Individual Business Fields
In graphic arts-related business, Toyo Ink is striving to provide total customer solutions comprising
systems, materials, and services. The Company’s premium brand image is to be reinforced through
stepped-up marketing campaigns focused on high-value-added, high-performance products that are
environment-friendly. Not restricting itself to inks for analog printing processes, the Company is upgrad-
ing its capabilities for supplying a broad range of ink-jet inks and other ink and toner offer-
ings for use with digital equipment.
In the chemicals field, the Company is responding to sophisticated needs for high-
performance materials by supplying color filter materials for high-color-purity LCDs,
memory media materials for CD-Rs, and key materials for organic light emitting diode
(OLED) displays. The Company is seeking to expand its presence in the information
media materials market while astutely anticipating future demand trends in that
market and launching diverse new products in line with those trends.
4
Market Trends and R&D Themes
Toyo Ink believes it must undertake an environment-friendly business development program that empha-
sizes comprehensive cost reductions. The Company’s R&D programs are targeting products that offer an
optimal balance of cost and quality as well as multifunctionality. Accordingly, the Company has integrat-
ed R&D programs that are concurrently seeking to improve the environment-friendliness and functionality
of products in its two principal basic materials business segments—coloring agents and resins. These pro-
grams are producing highly sophisticated new functional materials that are solid bases for developing
new products and businesses.
Toyo Ink is seeking to organize various Groupwide R&D programs, and the top objective of such
programs is currently the promotion of a shift to water-based products to enhance profitability. As one
means of expediting R&D programs and boosting the cost effectiveness of R&D investments, the Company
is increasing its R&D collaboration with other companies as well as government and academic entities.
The Company has begun using technology value chain systems to better allocate and strategically
concentrate its R&D resources. Two principal themes that are receiving concentrated R&D efforts are:
• the development of water-based ink, coating, and adhesive products that have relatively low levels
of environmental impact; and
• the use of optical-electric conversion materials, engineered light-energy conversion particles, and photo-
lithography technologies to develop materials for optical data recording media and electronic displays.
Toyo Ink views its capabilities for developing new technologies and products and for ensuring superior
product quality as key means of boosting its brand power. Accordingly, the Company is placing strong
emphasis on maintaining powerful product development capabilities based on diverse basic and applied
technologies. At the same time, the Company is working to better coordinate and integrate its R&D and
manufacturing activities. Research facilities are giving considerable attention to product designs that
facilitate superior product quality as well as to quality assurance systems.
R&D Strengths—A Solid and Dynamic Foundation for the No. 1 Brand
5
To promote still greater confidence in its products and services and thereby establish the No. 1 brand,
Toyo Ink is tenaciously striving to elevate the levels of its R&D capabilities, technologies, and product quality.

Comprehensive Management of Corporate Resources
In marketing operations, Toyo Ink is providing Groupwide support for customer satisfaction boosting
measures, such as quick-response delivery and customer color adjustment services, designed to halt a
trend of price decreases due to deflationary economic conditions in Japan. The Company is restructuring
its marketing systems and reevaluating current marketing channels. Toyo Ink’s network of indirect mar-
keting agencies is being rebuilt, and affiliated marketing companies are taking steps to concentrate their
operations in relatively profitable fields.
Regarding strategies for thoroughly reducing manufacturing costs, Toyo Ink is devising and applying
a variety of innovative production process technologies, principally at four domestic facilities—the Kawagoe,
Saitama, Fuji, and Moriyama plants—that have been designated “mother factories.” Anticipating consid-
erable growth in its new media materials business, the Company is constructing new factories in Moriyama
and Taiwan. The Company is also accelerating its moves to create corporate alliances that provide for
manufacturing-related cooperation, such as the recently arranged alliance with Sakata INX Corp.
Another cost-cutting strategy is the introduction of supply chain management systems to increase
logistics efficiency and boost the Group’s procurement power. For example, the upgrading of information
systems is enabling the optimization of manufacturing volumes and reduction of inventory levels, and
Groupwide procurement methods are being used to procure a growing range of materials at lower cost.
With respect to personnel systems, Toyo Ink has systems that offer standardized welfare benefits to all
employees but link pay with job performance, which is evaluated separately for each individual employee.
To facilitate management decisions regarding the selection of strategic business fields and the concentra-
tion of resources in such fields, Toyo Ink has introduced a number of business evaluation systems cen-
tered on the TOYO INK VALUE CREATED (TIVC) system.
6
LeveragingIntragroup Synergies
—Diverse Initiatives to Enhance Profitability and Build the No. 1 Brand
Maximizing Profitability by Leveraging Intragroup Synergies
To realize one of the central Take Off 2007 goals of boosting the Toyo Ink Group’s profit generating
capabilities, Toyo Ink is seeking to increase collaboration and coordination among Group companies.
The Company anticipates that greater emphasis on consolidated management strategies and methods
will lead to growth in consolidated profitability.

Graphic Arts Operations
Throughout its graphic arts operations, Toyo Ink is striving to ensure that great attention is always given
to the changing nature of customers’ existing and emerging needs. The Company is also promoting more
emphasis on leveraging its long-term relationships with customers in graphic arts.
Toyo Ink intends to retain its current policies regarding price increases for ink and pigment products
while emphasizing additional cost reductions. The Company is endeavoring to maintain its strong posi-
tions in key markets while seeking additional growth markets related to core products.
To expand its operations in the wrapping and packaging field, Toyo Ink is aiming to assess customers’
process flows and present proposals for optimal wrapping and packaging systems. The Company is also
focusing on such initiatives as those to provide environment-friendly products and expand operations
associated with radiation-cure (RC)* materials. To take advantage of opportunities involving digital print-
ing technologies, Toyo Ink is rebuilding and upgrading its capabilities for proposing total business solu-
tions for customers in the graphic arts and printing industries.
*Radiation-cure (RC) is a method of curing ink or paint by applying beams of light to a given surface.
Chemicals Operations
Toyo Ink’s strategy for chemicals operations involves enhancing profitability in each established business
field and exploring the potential for expanding established businesses in the Asian region. The Company
has also revised its approach to investments in chemicals operations, giving greater emphasis to new
product and business development and the development of environment-friendly products.
• In polymer operations, the Company is giving high priority to the objectives of strengthening its busi-
ness in adhesives, maintaining its market share in paints, developing the market for converting systems,
and augmenting collaboration among affiliated polymer companies.
• Regarding color materials, the Company is emphasizing the development of OLED display materials
and other electronic display materials, the improvement of structural profitability in pigment operations
and strengthening of its pigment dispersal business, fundamental measures for improving the prof-
itability of colorant operations, and initiatives for strengthening its fine chemicals business.
7
Strategies for the Future Development of Graphic Artsand Chemicals Operations
Toyo Ink is tenaciously working to strengthen its business base in core operational fields and develop new
businesses in high-value-added products. Such businesses remain a core area of operations for Toyo Ink,
which has built a very strong brand image in graphic arts markets over many years. Accordingly, the
Company plans to proactively develop high-performance products with the potential for revitalizing slug-
gish markets and otherwise take the measures needed to effectively leverage its accumulated strengths
and large customer base in this field.

Title
Printing Inks
’98 ’99 ’00 ’01 ’02
(Millions of yen)
Total Sales and Operating Income
Total Sales Capital Expenditures
87,991
(Years ended March 31)
8,164
Total salesOperating income
38.1% 37.5%
Toyo Ink is seeking to achieve dynamic growth in the sales of printing ink
products by maintaining a lineup of products that have the top shares of
their respective market segments in Japan.
Review of Operations
8
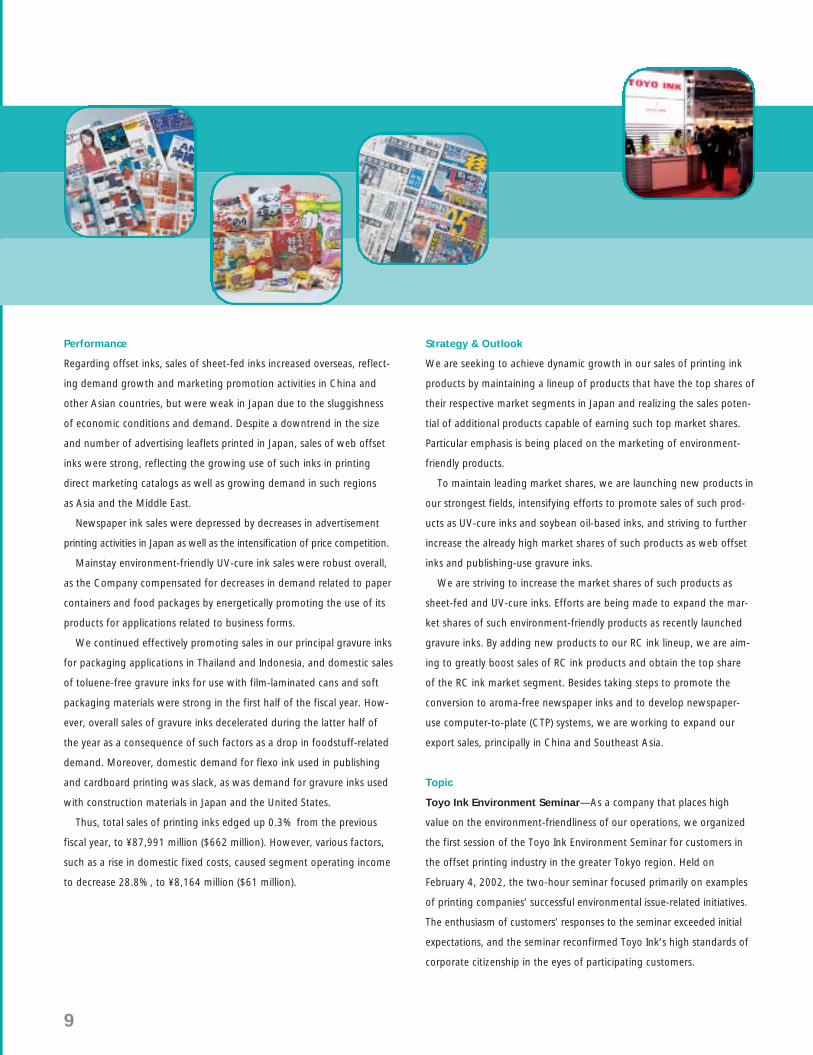
Performance
Regarding offset inks, sales of sheet-fed inks increased overseas, reflect-
ing demand growth and marketing promotion activities in China and
other Asian countries, but were weak in Japan due to the sluggishness
of economic conditions and demand. Despite a downtrend in the size
and number of advertising leaflets printed in Japan, sales of web offset
inks were strong, reflecting the growing use of such inks in printing
direct marketing catalogs as well as growing demand in such regions
as Asia and the Middle East.
Newspaper ink sales were depressed by decreases in advertisement
printing activities in Japan as well as the intensification of price competition.
Mainstay environment-friendly UV-cure ink sales were robust overall,
as the Company compensated for decreases in demand related to paper
containers and food packages by energetically promoting the use of its
products for applications related to business forms.
We continued effectively promoting sales in our principal gravure inks
for packaging applications in Thailand and Indonesia, and domestic sales
of toluene-free gravure inks for use with film-laminated cans and soft
packaging materials were strong in the first half of the fiscal year. How-
ever, overall sales of gravure inks decelerated during the latter half of
the year as a consequence of such factors as a drop in foodstuff-related
demand. Moreover, domestic demand for flexo ink used in publishing
and cardboard printing was slack, as was demand for gravure inks used
with construction materials in Japan and the United States.
Thus, total sales of printing inks edged up 0.3% from the previous
fiscal year, to ¥87,991 million ($662 million). However, various factors,
such as a rise in domestic fixed costs, caused segment operating income
to decrease 28.8%, to ¥8,164 million ($61 million).
Strategy & Outlook
We are seeking to achieve dynamic growth in our sales of printing ink
products by maintaining a lineup of products that have the top shares of
their respective market segments in Japan and realizing the sales poten-
tial of additional products capable of earning such top market shares.
Particular emphasis is being placed on the marketing of environment-
friendly products.
To maintain leading market shares, we are launching new products in
our strongest fields, intensifying efforts to promote sales of such prod-
ucts as UV-cure inks and soybean oil-based inks, and striving to further
increase the already high market shares of such products as web offset
inks and publishing-use gravure inks.
We are striving to increase the market shares of such products as
sheet-fed and UV-cure inks. Efforts are being made to expand the mar-
ket shares of such environment-friendly products as recently launched
gravure inks. By adding new products to our RC ink lineup, we are aim-
ing to greatly boost sales of RC ink products and obtain the top share
of the RC ink market segment. Besides taking steps to promote the
conversion to aroma-free newspaper inks and to develop newspaper-
use computer-to-plate (CTP) systems, we are working to expand our
export sales, principally in China and Southeast Asia.
Topic
Toyo Ink Environment Seminar—As a company that places high
value on the environment-friendliness of our operations, we organized
the first session of the Toyo Ink Environment Seminar for customers in
the offset printing industry in the greater Tokyo region. Held on
February 4, 2002, the two-hour seminar focused primarily on examples
of printing companies’ successful environmental issue-related initiatives.
The enthusiasm of customers’ responses to the seminar exceeded initial
expectations, and the seminar reconfirmed Toyo Ink’s high standards of
corporate citizenship in the eyes of participating customers.
9
Title
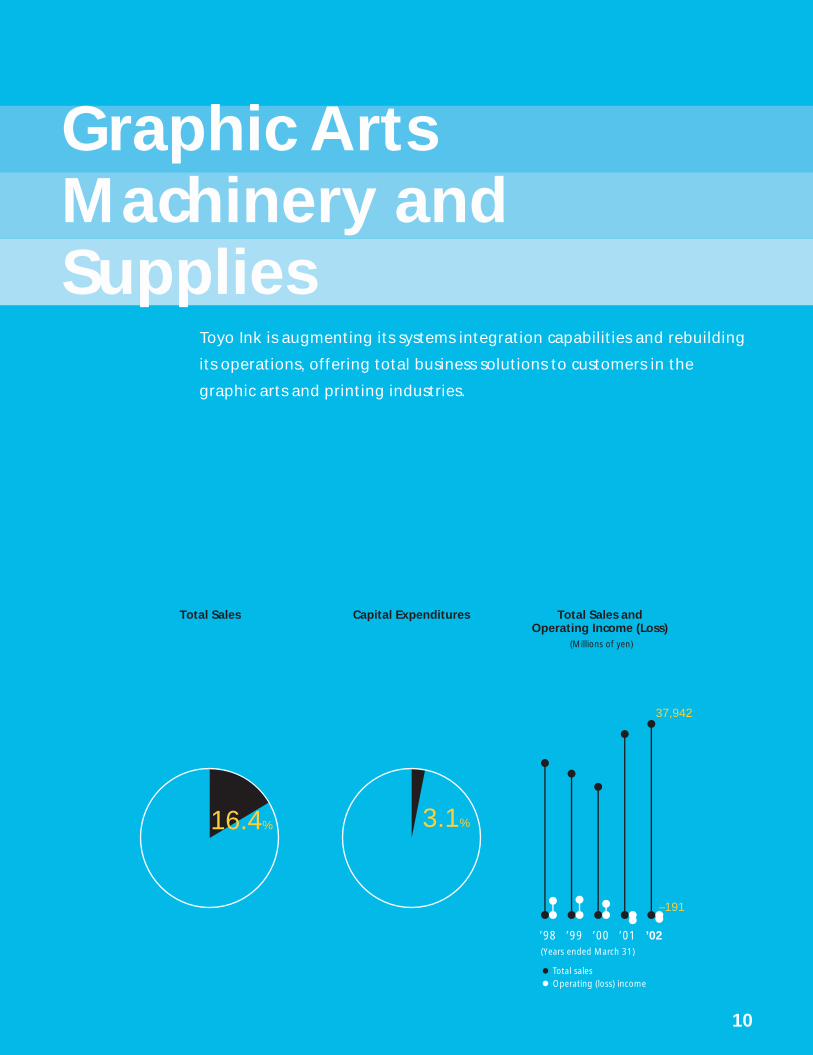
Graphic ArtsMachinery andSupplies
’98 ’99 ’00 ’01 ’02
(Millions of yen)
(Years ended March 31)
Total Sales and Operating Income (Loss)
Total Sales Capital Expenditures
37,942
–191
Total salesOperating (loss) income
16.4% 3.1%
Toyo Ink is augmenting its systems integration capabilities and rebuilding
its operations, offering total business solutions to customers in the
graphic arts and printing industries.
10
11
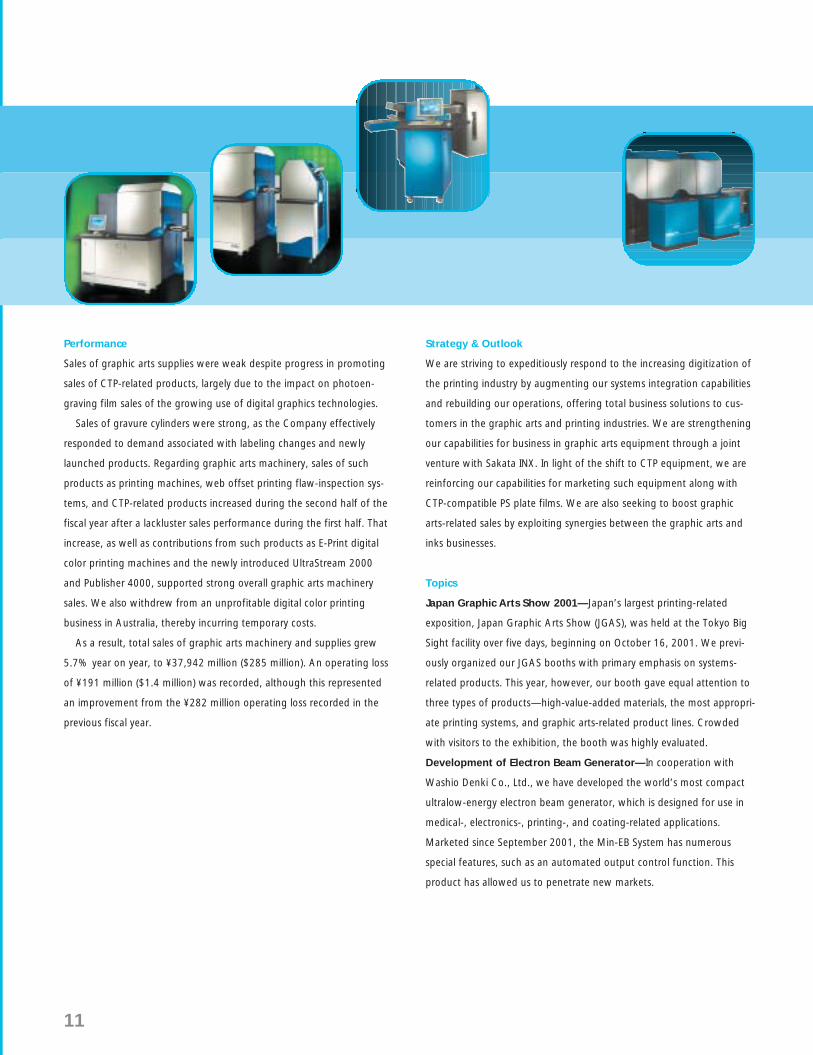
Performance
Sales of graphic arts supplies were weak despite progress in promoting
sales of CTP-related products, largely due to the impact on photoen-
graving film sales of the growing use of digital graphics technologies.
Sales of gravure cylinders were strong, as the Company effectively
responded to demand associated with labeling changes and newly
launched products. Regarding graphic arts machinery, sales of such
products as printing machines, web offset printing flaw-inspection sys-
tems, and CTP-related products increased during the second half of the
fiscal year after a lackluster sales performance during the first half. That
increase, as well as contributions from such products as E-Print digital
color printing machines and the newly introduced UltraStream 2000
and Publisher 4000, supported strong overall graphic arts machinery
sales. We also withdrew from an unprofitable digital color printing
business in Australia, thereby incurring temporary costs.
As a result, total sales of graphic arts machinery and supplies grew
5.7% year on year, to ¥37,942 million ($285 million). An operating loss
of ¥191 million ($1.4 million) was recorded, although this represented
an improvement from the ¥282 million operating loss recorded in the
previous fiscal year.
Strategy & Outlook
We are striving to expeditiously respond to the increasing digitization of
the printing industry by augmenting our systems integration capabilities
and rebuilding our operations, offering total business solutions to cus-
tomers in the graphic arts and printing industries. We are strengthening
our capabilities for business in graphic arts equipment through a joint
venture with Sakata INX. In light of the shift to CTP equipment, we are
reinforcing our capabilities for marketing such equipment along with
CTP-compatible PS plate films. We are also seeking to boost graphic
arts-related sales by exploiting synergies between the graphic arts and
inks businesses.
Topics
Japan Graphic Arts Show 2001—Japan’s largest printing-related
exposition, Japan Graphic Arts Show (JGAS), was held at the Tokyo Big
Sight facility over five days, beginning on October 16, 2001. We previ-
ously organized our JGAS booths with primary emphasis on systems-
related products. This year, however, our booth gave equal attention to
three types of products—high-value-added materials, the most appropri-
ate printing systems, and graphic arts-related product lines. Crowded
with visitors to the exhibition, the booth was highly evaluated.
Development of Electron Beam Generator—In cooperation with
Washio Denki Co., Ltd., we have developed the world’s most compact
ultralow-energy electron beam generator, which is designed for use in
medical-, electronics-, printing-, and coating-related applications.
Marketed since September 2001, the Min-EB System has numerous
special features, such as an automated output control function. This
product has allowed us to penetrate new markets.
Title
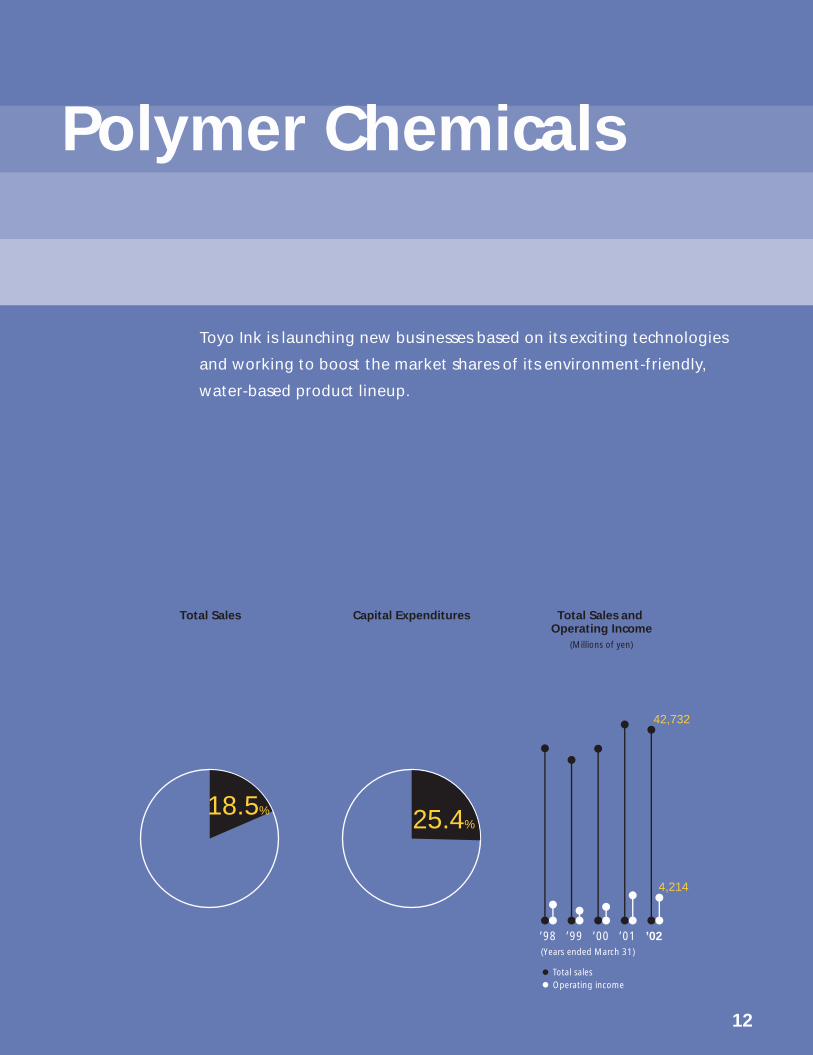
Polymer Chemicals
’98 ’99 ’00 ’01 ’02
(Millions of yen)
(Years ended March 31)
Total Sales and Operating Income
Total Sales Capital Expenditures
42,732
4,214
Total salesOperating income
18.5% 25.4%
Toyo Ink is launching new businesses based on its exciting technologies
and working to boost the market shares of its environment-friendly,
water-based product lineup.
12

13
Performance
Sales of FINISHES metallic coatings for cans were strong in Thailand.
Domestic sales were weak, however, due to the continued displacement
of cans by PET bottles as well as to the difficulty of quickly responding to
the trend toward water-based coatings. Sales of metallic inks were
robust, due to factors including the promotion of their use in the pack-
aging of happoshu (low-malt beer) products. Despite a decrease in the
number of new public works and housing construction projects, we
sustained strong sales of our mainstay resin products for construction-
related applications by addressing demand related to repair and refur-
bishment activities.
Sales of adhesives for labels were strongly impacted by the shift of
Japanese customers’ manufacturing operations to overseas facilities, and
overall adhesives sales were weak. Although demand for adhesive tape
used in electronics applications was slack, sales of adhesive tape were
strong overall, reflecting a large increase in sales of marking film-related
products. Such products became increasingly used in place of paints in out-
door advertising sign creation and in automobile painting, and sign-related
demand rose due to large-scale corporate image promotion programs.
Thus, total sales of polymer chemicals decreased 2.7% from the pre-
vious fiscal year, to ¥42,732 million ($321 million). Operating income
totaled ¥4,214 million ($32 million), down 11.3%.
Strategy & Outlook
We are working to strengthen our RC operations by achieving the full-
scale start-up of profitable EB* operations and otherwise launching new
businesses based on our exciting technologies. We are also working to
bolster our adhesives operations and maintain our share of the paint
and coating markets. To boost the market shares of our environment-
friendly product lineup, we are developing water-based adhesives and
proactively marketing water-based can coatings. We are also taking
measures to increase our share of the wrapping and packaging market.
*Electron-beam (EB) is an RC method in which electron beams are
applied to cure ink or paint.
Topics
New Manufacturing Facilities—On October 31, 2001, Toyo Ink held
a ceremony to commemorate the completion of its new resin manu-
facturing facility at its Kawagoe plant. The new facility was constructed
to meet rising demand for acrylic adhesives and solvent-type urethane
resins. Plans also call for responding to growing demand for environment-
friendly products by installing water-based product manufacturing
equipment at the new resin manufacturing facility and making this
facility the principal base for resin manufacturing operations in the
Kawagoe district.
On February 26, 2002, Malaysia-based T.I.P.P. (Malaysia) Sdn. Bhd.
completed a new facility for manufacturing emulsion-type acrylic adhe-
sives. Built to meet increasing demand from major customers, the new
facility will roughly double T.I.P.P.’s production capacity and is designed
to be adaptable to potential use in manufacturing environment-friendly
water-based versions of solvent-type acrylic adhesives.
Dynacal Ecosign—As part of our environmental protection strategy,
we have used our unique technologies to develop an environment-
friendly marking film to replace vinyl chloride films that are considered
environmentally harmful. Marketed as Dynacal Ecosign since October
2001, the new film has been highly evaluated by the sign manufactur-
ing industry. It features superior color brightness, durability, and usability
and it is relatively environment-friendly because it does not emit toxic
gases when incinerated.

Title
Chemicals and Media Materials
’98 ’99 ’00 ’01 ’02(Years ended March 31)
Total Sales and Operating Income (Loss)
Total Sales Capital Expenditures
49,975
5,767
Total salesOperating income (loss)
21.7% 26.0%
Toyo Ink is emphasizing strategic investments for the development of
new media-related products, particularly those related to LCDs, EL displays,
CDs, and other digital memory media.
14

15
Performance
Despite robust sales in Europe and Japan, overall sales of pigments
decreased due to the slackness of sales in North America as well as to
the progressive discontinuation of business in unprofitable products.
Sales of high-value-added chips for such applications as cosmetics
were strong, but sales of chips for use in automobile paints and other
preexisting products were relatively weak.
Despite progress made in promoting plastics colorants in new mar-
kets, sales of plastics colorants were sluggish due to the depressed
domestic manufacturing volume of plastic containers, films, pipes, and
components of automobiles and consumer electric products as well as
the strong negative impact on domestic demand from the shift of
Japanese manufacturing operations to overseas plants.
Regarding color filter materials for high-color-purity LCDs, sales of
products for use in portable phones were weak but increasing demand
resulting from the development of large LCDs and the shift from CRTs
to LCDs supported strong growth in overall sales.
Electronics materials sales were slack due to a drop in overseas demand
following the terrorist incidents in the United States.
With respect to functional materials, sales of optical memory media
materials for use in CDs were strong. We took various measures to
improve the quality of our newly developed materials for OLED displays,
but the market for such materials has not been developed yet and sales
of such materials did not make a large contribution to performance in
the fiscal year under review.
Total sales of chemicals and media materials declined 1.8% from the
previous fiscal year, to ¥49,975 million ($376 million). Operating income
totaled ¥5,767 million ($43 million), up 2.7% from the previous fiscal year.
Strategy & Outlook
We are emphasizing strategic investments related to the development
of new media-related products, particularly LCD- and EL display-related
products. Efforts are being made to establish additional manufacturing
bases for color resist inks for LCD color filters and to increase the quality
of such inks. We are also expediting our development and intensifying
our marketing of such functional materials as color elements for CD disks
and other materials used in digital memory media.
In the colorant business, we are undertaking fundamental restructur-
ing measures to improve profitability while also working to develop
high-performance color elements and launch new products. Similarly,
we are striving to enhance the profit structure of our pigments and
processed products business, with particular attention to establishing a
global product mix through global purchasing activities. We are stepping
up our development of water- and oil-based ink-jet inks and are imple-
menting a strategy for bolstering our fine chemicals business through
the provision of additional services.
Topics
New Color Resist Ink Plant—On April 16, 2002, Toyo Ink completed
a new color resist ink manufacturing facility in Moriyama that is designed
to respond to rising demand related to LCDs by improving production
capacity and efficiency for color resist inks used in color filters. Space has
also been reserved at the facility for the future mass production of OLED
display materials. We are also proceeding with the construction of a color
resist ink manufacturing facility in Taiwan, and plans call for these plants
to cooperate closely with the Saitama plant as the Group strives to expand
the display materials business.

Financial Section
16
Thousands ofMillions of yen U.S. dollars
2002 2001 2000 1999 1998 2002
For the year:
Net sales ........................................................... ¥222,359 ¥222,246 ¥215,825 ¥223,506 ¥241,351 $1,671,872
Operating income ............................................. 6,942 10,242 6,494 3,747 7,236 52,195
Net income ....................................................... 805 1,712 5,026 415 4,298 6,053
At year-end:
Net property, plant and equipment ................... 88,524 83,001 82,206 87,760 91,291 665,594
Total investments and other assets .................... 49,342 52,017 43,277 39,554 41,036 370,992
Total assets ....................................................... 283,221 283,993 299,569 301,762 320,941 2,129,481
Total shareholders’ equity ................................. 118,087 117,236 120,204 119,781 121,226 887,872
Interest-bearing debt ........................................ 94,368 93,905 114,270 119,122 127,453 709,534
Working capital ................................................ 36,300 54,873 69,807 82,578 80,597 272,932
Yen U.S. dollars
Per share data:
Net income ....................................................... ¥2.91 ¥6.19 ¥17.30 ¥1.42 ¥14.73 $0.022
Fully diluted net income .................................... — 5.50 13.76 — 11.66 —
Cash dividends applicable to the year................ 6.00 5.50 5.00 5.00 7.00 0.045
Ratio:
Gross profit margin ........................................... 20.6% 22.5% 21.6% 19.8% 20.8%
Equity ratio ....................................................... 41.7 41.3 40.1 39.7 37.8
Return on equity ............................................... 0.68 1.44 4.19 0.34 3.58
Return on assets ............................................... 0.28 0.59 1.67 0.13 1.34
Notes: 1. U.S. dollar amounts have been translated, for convenience only, at the rate of ¥133 to US$1, the approximate exchange rate at March 31, 2002.2. Fully diluted net income per share at March 31, 2002 and 1999, is not disclosed because it is anti-dilutive.
Consolidated Five-Year SummaryTOYO INK MFG. CO., LTD. and Subsidiaries Years ended March 31
’98 ’99 ’00 ’01 ’02
(Millions of yen)
(Years ended March 31)
OPERATING INCOME
7,23
6
3,74
7
6,49
4
10,2
42
6,94
2
’98 ’99 ’00 ’01 ’02
(Millions of yen)
NET PROPERTY, PLANT AND EQUIPMENT
91,2
91
87,7
60
82,2
06
83,0
01 88,5
24
(At March 31)
’98 ’99 ’00 ’01 ’02
GROSS PROFIT MARGIN(%)
(Years ended March 31)
20.8
19.8
21.622.5
20.6

Financial Review
17
Net Sales
Toyo Ink’s consolidated net sales amounted to ¥222,359 million ($1,672 million) in fiscal 2002, up
0.1% from ¥222,246 million in net sales recorded in the previous year. This reflected strong sales of
media materials and increases of sales in China and other Asian countries, which slightly more than
covered declines in sales within Japan of mainstay printing inks and such mainstay polymer chemicals
products as can coatings and adhesives due to the slackness of domestic demand.
Performance by business segment is described in the Review of Operations section. Performance
by geographic segment was as follows.
Japan—The slackness of demand combined with a delay in adjusting the prices of principal prod-
ucts in light of changing market conditions reduced segment sales by 1.5%, to ¥184,549 million
($1,388 million). The decline in sales along with such factors as a rise in retirement benefit expenses
led to a 27.6% drop in segment operating income, to ¥5,888 million ($44 million).
Asia and Oceania—Sales in China of inks, pigments, and other products grew considerably, while
sales in such other Asian countries as Thailand and Indonesia were also generally robust. Segment
sales thus grew 14.6%, to ¥27,890 million ($210 million). However, temporary expenses were
incurred due to the discontinuation of unprofitable operations in Australia, and the profitability of
operations in Hong Kong decreased. Other factors that impacted profitability included a rise in raw
materials costs due to the depreciation of certain Asian currencies value versus the U.S. dollar.
Consequently, segment operating income decreased 11.6%, to ¥1,497 million ($11 million).
Europe—A rise in the sales volume of principal pigment products was the principal factor that
boosted segment sales 12.7%, to ¥8,669 million ($65 million). Raw materials costs increased, howev-
er, and the printing ink business in Hungary remained unprofitable. Thus, a segment operating loss
of ¥54 million ($0.4 million) was recorded.
North America—A drop in demand following the terrorist incidents and an intensification of
competition decreased sales of the Company’s principal offset ink, gravure ink, pigment products,
and other products. Other factors reducing sales included the strategic reduction of sales of certain
unprofitable products and the shift from selling media materials locally to directly exporting those
materials from Japan. As a result, segment sales dropped 22.8%, to ¥10,349 million ($78 million),
and segment operating income decreased 77.6%, to ¥69 million ($0.5 million).
Costs, Expenses, and Earnings
The cost of sales increased 2.5% compared to the previous fiscal year, to ¥176,594 million ($1,328
million), causing the gross profit ratio to decline 1.9 percentage points, to 20.6%. The cost of sales
increased due to growth in labor costs, which resulted from a rise in retirement-related expenses,
and due to a rise in sales of procured products, which have relatively low profit margins. Gross profit
decreased 8.5%, to ¥45,765 million ($344 million).
Selling, general and administrative (SG&A) expenses declined 2.4% from the previous fiscal year,
to ¥38,823 million ($292 million), principally due to the lower volume of materials handled, which
caused a ¥413 million drop in packing and freight costs. Thus, the SG&A expenses ratio decreased
0.4 percentage point, to 17.5%. Due to the large drop in gross profit, however, operating income
decreased 32.2%, to ¥6,942 million ($52 million), and operating income ratio declined 1.5 percent-
age points, to 3.1%.
Other income (expenses), net, amounted to an expense of ¥5,371 million ($40 million), approximate-
ly the same as the expense of ¥5,307 million in the previous fiscal year. Principal factors contributing
to net other expenses in the current fiscal year included interest expense of ¥1,740 million and the
loss on impairment of investment securities of ¥3,804 million. Principal factors contributing to net
other expenses in the prior fiscal year included interest expense of ¥2,249 million, a charge for transi-
tional obligations for retirement benefits of ¥12,835 million, and the loss on impairment of investment
securities of ¥372 million, which were partially offset by income from a beneficial interest in real
estate trust of ¥4,900 million.
Income before income taxes and minority interests dropped 68.2% from the ¥4,935 million level
in the previous fiscal year, to ¥1,571 million ($12 million). Net income for the year fell 53.0%, from
¥1,712 million in the previous fiscal year, to ¥805 million ($6 million), and the net income ratio
decreased from 0.8% to 0.4%. The rate of return on shareholders’ equity declined 0.8 percentage
point, to 0.7%.
Financial Condition
Total assets decreased 0.3%, to ¥283,221 million ($2,129 million). The principal factors behind the
decline included decreases of ¥5,535 million in cash and cash equivalents and ¥4,184 million in invest-
ment securities. One factor behind the drop in investment securities was the introduction of the mark-
to-market financial securities valuation method, which led to a decrease in the book values of such
securities. Principal increases in assets comprised a ¥1,544 million rise in inventories, a ¥2,110 million
increase in noncurrent deferred income tax assets, and a ¥5,523 million rise in net property, plant and
equipment. The Group made ¥16,804 million ($126 million) in capital investments during the fiscal
year, principally for ongoing investments aimed at expanding and rationalizing manufacturing facilities
and strengthening and raising the efficiency of R&D facilities.
Total Group liabilities decreased 1.4%, to ¥161,371 million ($1,213 million). Among the main
factors behind the decrease were a ¥16,398 million decrease in long-term debt and the recognition
of previously unrecognized losses from previous fiscal years, which caused a ¥3,124 million drop in
accrued income taxes. Increases in total liabilities were mainly due to a ¥3,164 million rise in payables.
Total shareholders’ equity increased 0.7%, to ¥118,087 million ($888 million). The main factors
behind the increase included a ¥2,598 million decrease in the negative value of foreign currency
translation adjustments due to the depreciation of the yen. As a result, the equity ratio increased
0.4 percentage point, to 41.7%.
Cash Flows
Cash and cash equivalents, end of year, decreased ¥5,535 million during the fiscal year and amount-
ed to ¥20,646 million ($155 million) at March 31, 2002. In addition to the cash-flow trends described
later in this section, this decrease included a ¥1,270 million ($9.5 million) increase in cash and cash
equivalents due to foreign currency translation adjustments.
Net cash provided by operating activities was ¥12,005 million ($90 million), ¥1,379 million less
than in the previous fiscal year.
18
The principal sources of cash inflow included (1) such non-cash items as depreciation and amorti-
zation, which increased ¥311 million, to ¥10,318 million ($78 million), and loss on impairment of
investment securities, which increased ¥3,432 million, to ¥3,804 million ($29 million), and (2) a
¥3,245 million decrease in accounts receivable and notes receivable, compared with a ¥770 million
increase in the previous fiscal year. The principal factors contributing to cash outflow included income
taxes paid, which increased ¥2,413 million, to ¥6,512 million ($49 million).
Net cash used in investing activities amounted to ¥14,839 million ($112 million), a ¥14,566 million
increase from the previous fiscal year.
The principal sources of net cash inflow included proceeds from sales of fixed assets, which
totaled ¥3,664 million ($28 million), a ¥5,593 million decrease from the previous fiscal year, and pro-
ceeds from sales of marketable securities, which totaled ¥3,360 million ($25 million), an increase of
¥1,582 million from the previous fiscal year. The principal sources of net cash outflow included pur-
chases of fixed assets, which totaled ¥13,704 million ($103 million), a ¥3,221 million increase from
the previous fiscal year.
Net cash used in financing activities amounted to ¥3,971 million ($30 million), a ¥17,938 million
decrease from the previous fiscal year.
The principal sources of net cash inflow included a ¥2,505 million ($19 million) increase in short-
term borrowings, net, compared with the ¥4,497 million in net cash outflow due to the decrease in
short-term borrowings, net, in the previous fiscal year. The principal sources of net cash outflow
included (1) repayments of long-term debt, which totaled ¥4,220 million ($32 million), a ¥11,744
million decrease from the previous fiscal year, and (2) dividends paid, which totaled ¥1,749 million
($13 million), a ¥315 million increase from the previous fiscal year. The Company places emphasis on
the maintenance of stable dividend payments to its shareholders and has worked to return corporate
profits to shareholders. Based on this posture, the Company increased dividends per share applicable
to the fiscal year to ¥6 ($0.045), up ¥0.5 from the previous fiscal year.
Forward-Looking Statements
There is a growing perception that the Japanese economy has bottomed out, while it appears that
the U.S. economy has begun recovering. It is believed, however, that more time will be required
before the Japanese economy musters a full-fledged recovery. Accordingly, it is expected that the
market environment in which the Toyo Ink Group operates will continue to be harsh. Thus, in fiscal
2003, the Company projects that it will increase its net sales 3.4%, to ¥230,000 million, and boost
its net income 645.6%, to ¥6,000 million.
However, it must be noted that these forward-looking statements represent the Group’s judg-
ments based on the information presently available and include latent risks and assumptions that
may turn out to be incorrect. Actual performance may be very different from the above forecasts
due to factors that differ from the assumptions upon which the projections are based.
19

Thousands ofMillions of yen U.S. dollars (Note 1)
2002 2001 2002
ASSETS
Current assets:
Cash and cash equivalents ............................................................................................ ¥ 20,646 ¥ 26,181 $ 155,233
Marketable securities (Note 3)....................................................................................... 1,116 355 8,391
Receivables:
Trade notes (Note 16) ............................................................................................... 33,068 34,636 248,632
Trade accounts (Note 16) .......................................................................................... 51,524 51,704 387,398
Associated companies............................................................................................... 1,275 1,378 9,586
Other........................................................................................................................ 1,221 848 9,180
Allowance for doubtful receivables ........................................................................... (842) (746) (6,330)
Inventories (Note 4) ...................................................................................................... 31,399 29,855 236,083
Deferred income tax assets (Note 8) .............................................................................. 1,821 2,109 13,692
Prepaid expenses and other .......................................................................................... 4,127 2,655 31,030
Total current assets ........................................................................................... 145,355 148,975 1,092,895
Property, plant and equipment:
Land (Note 5)................................................................................................................ 27,101 25,635 203,767
Buildings and structures (Note 5) .................................................................................. 64,348 61,395 483,820
Machinery and equipment (Note 5)............................................................................... 135,353 128,947 1,017,692
Construction in progress ............................................................................................... 1,514 1,112 11,383
Total ..................................................................................................................... 228,316 217,089 1,716,662
Accumulated depreciation ............................................................................................ (139,792) (134,088) (1,051,068)
Net property, plant and equipment ................................................................. 88,524 83,001 665,594
Investments and other assets:
Investment securities (Notes 3 and 5) ............................................................................ 26,329 30,513 197,962
Investments in and advances to associated companies .................................................. 7,312 7,196 54,977
Deferred income tax assets (Note 8) .............................................................................. 7,985 5,875 60,038
Other assets (Note 5) .................................................................................................... 7,716 8,433 58,015
Total investments and other assets ................................................................. 49,342 52,017 370,992
Total ................................................................................................................................ ¥283,221 ¥283,993 $2,129,481
See notes to consolidated financial statements.
Consolidated Balance SheetsTOYO INK MFG. CO., LTD. and Subsidiaries March 31, 2002 and 2001
20
Thousands ofMillions of yen U.S. dollars (Note 1)
2002 2001 2002
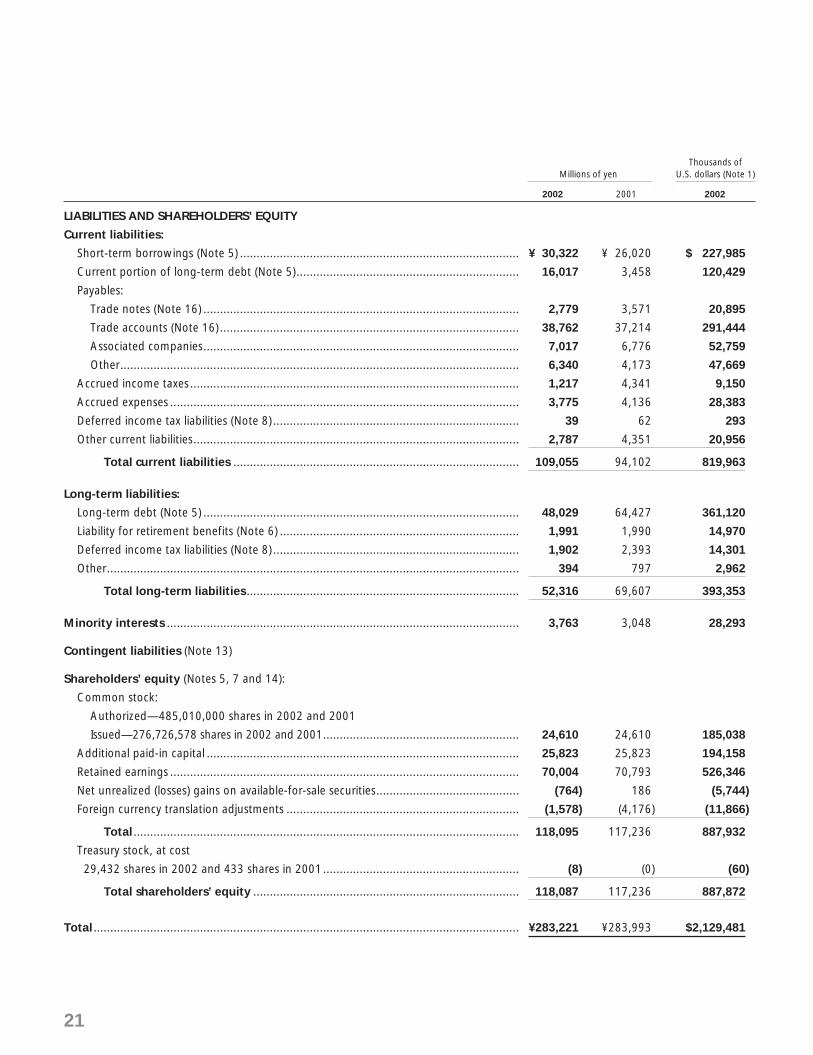
LIABILITIES AND SHAREHOLDERS’ EQUITY
Current liabilities:
Short-term borrowings (Note 5) .................................................................................... ¥ 30,322 ¥ 26,020 $ 227,985
Current portion of long-term debt (Note 5)................................................................... 16,017 3,458 120,429
Payables:
Trade notes (Note 16) ............................................................................................... 2,779 3,571 20,895
Trade accounts (Note 16) .......................................................................................... 38,762 37,214 291,444
Associated companies............................................................................................... 7,017 6,776 52,759
Other........................................................................................................................ 6,340 4,173 47,669
Accrued income taxes ................................................................................................... 1,217 4,341 9,150
Accrued expenses ......................................................................................................... 3,775 4,136 28,383
Deferred income tax liabilities (Note 8) .......................................................................... 39 62 293
Other current liabilities.................................................................................................. 2,787 4,351 20,956
Total current liabilities ...................................................................................... 109,055 94,102 819,963
Long-term liabilities:
Long-term debt (Note 5) ............................................................................................... 48,029 64,427 361,120
Liability for retirement benefits (Note 6) ........................................................................ 1,991 1,990 14,970
Deferred income tax liabilities (Note 8) .......................................................................... 1,902 2,393 14,301
Other............................................................................................................................ 394 797 2,962
Total long-term liabilities .................................................................................. 52,316 69,607 393,353
Minority interests .......................................................................................................... 3,763 3,048 28,293
Contingent liabilities (Note 13)
Shareholders’ equity (Notes 5, 7 and 14):
Common stock:
Authorized—485,010,000 shares in 2002 and 2001
Issued—276,726,578 shares in 2002 and 2001........................................................... 24,610 24,610 185,038
Additional paid-in capital .............................................................................................. 25,823 25,823 194,158
Retained earnings ......................................................................................................... 70,004 70,793 526,346
Net unrealized (losses) gains on available-for-sale securities........................................... (764) 186 (5,744)
Foreign currency translation adjustments ...................................................................... (1,578) (4,176) (11,866)
Total .................................................................................................................... 118,095 117,236 887,932
Treasury stock, at cost
29,432 shares in 2002 and 433 shares in 2001........................................................... (8) (0) (60)
Total shareholders’ equity ................................................................................ 118,087 117,236 887,872
Total ................................................................................................................................ ¥283,221 ¥283,993 $2,129,481
21
Thousands ofMillions of yen U.S. dollars (Note 1)
2002 2001 2002
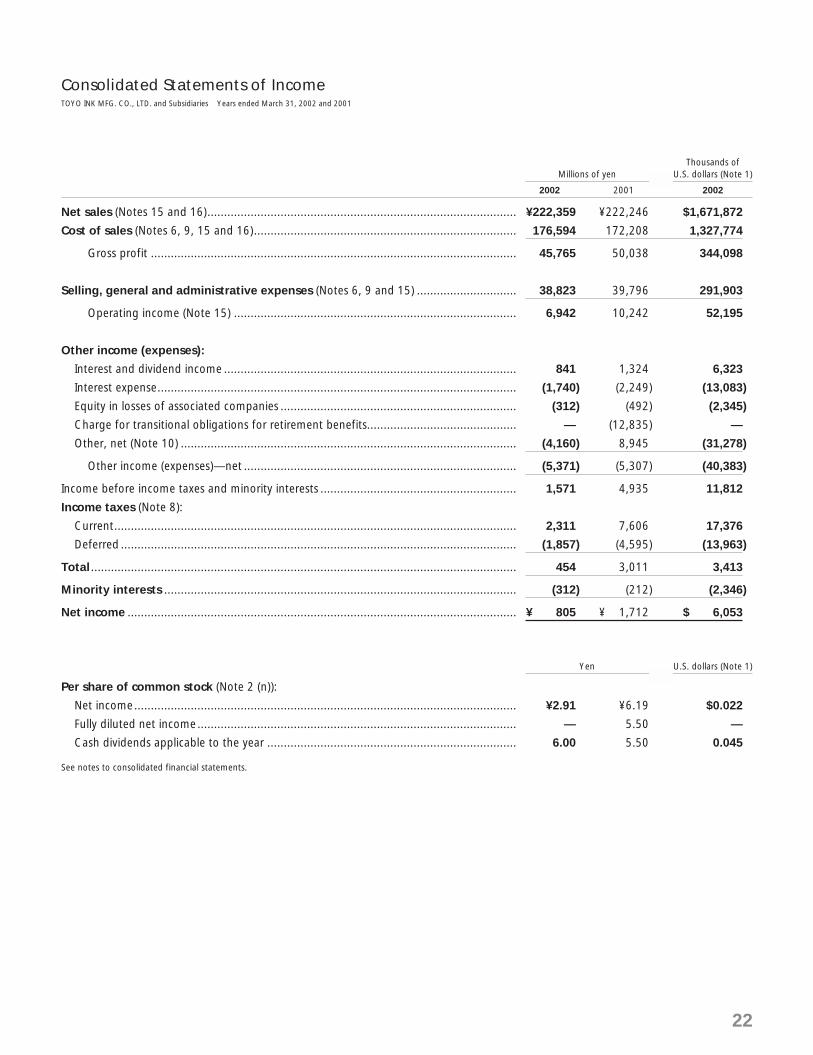
Net sales (Notes 15 and 16)............................................................................................. ¥222,359 ¥222,246 $1,671,872
Cost of sales (Notes 6, 9, 15 and 16)............................................................................... 176,594 172,208 1,327,774
Gross profit .............................................................................................................. 45,765 50,038 344,098
Selling, general and administrative expenses (Notes 6, 9 and 15) .............................. 38,823 39,796 291,903
Operating income (Note 15) ..................................................................................... 6,942 10,242 52,195
Other income (expenses):
Interest and dividend income ........................................................................................ 841 1,324 6,323
Interest expense............................................................................................................ (1,740) (2,249) (13,083)
Equity in losses of associated companies ....................................................................... (312) (492) (2,345)
Charge for transitional obligations for retirement benefits............................................. — (12,835) —
Other, net (Note 10) ..................................................................................................... (4,160) 8,945 (31,278)
Other income (expenses)—net .................................................................................. (5,371) (5,307) (40,383)
Income before income taxes and minority interests ........................................................... 1,571 4,935 11,812
Income taxes (Note 8):
Current......................................................................................................................... 2,311 7,606 17,376
Deferred ....................................................................................................................... (1,857) (4,595) (13,963)
Total ................................................................................................................................ 454 3,011 3,413
Minority interests .......................................................................................................... (312) (212) (2,346)
Net income ..................................................................................................................... ¥ 805 ¥ 1,712 $ 6,053
Yen U.S. dollars (Note 1)
Per share of common stock (Note 2 (n)):
Net income................................................................................................................... ¥2.91 ¥6.19 $0.022
Fully diluted net income................................................................................................ — 5.50 —
Cash dividends applicable to the year ........................................................................... 6.00 5.50 0.045
See notes to consolidated financial statements.
Consolidated Statements of IncomeTOYO INK MFG. CO., LTD. and Subsidiaries Years ended March 31, 2002 and 2001
22

Thousands Millions of yen
Number of Additional Net unrealized gains Foreign currency Treasuryshares Common paid-in Retained (losses) on available- translation stock,
outstanding stock capital earnings for-sale securities adjustments at cost
Balance at March 31, 2000 .................................. 276,727 ¥24,610 ¥25,823 ¥69,772 ¥ — ¥ — ¥(1)
Net income ........................................................ 1,712
Cash dividends, ¥5.00 per share (Note 7) ........... (1,384)
Bonuses to directors and corporate auditors ....... (79)
Net unrealized gain on available-for-sale securities ..... 186
Foreign currency translation adjustments............... (4,176)
Decrease in treasury stock .................................. 1
Increase resulting from non-consolidation of subsidiaries .................................................. 2
Increase resulting from revaluation of fixed assets of a consolidated subsidiary .................... 809
Decrease resulting from excluding associated companies from equity method ......................... (39)
Balance at March 31, 2001 .................................. 276,727 24,610 25,823 70,793 186 (4,176) (0)
Net income ........................................................ 805
Cash dividends, ¥6.00 per share (Note 7) ........... (1,661)
Bonuses to directors and corporate auditors ....... (93)
Net unrealized loss on available-for-sale securities ...... (950)
Foreign currency translation adjustments............... 2,598
Increase in treasury stock.................................... (8)
Increase resulting from non-consolidation of subsidiaries .................................................. 1
Increase resulting from revaluation of fixed assets of a consolidated subsidiary .................... 157
Increase resulting from excluding associated companies from equity method ......................... 2
Balance at March 31, 2002 .................................. 276,727 ¥24,610 ¥25,823 ¥70,004 ¥(764) ¥(1,578) ¥(8)
Thousands of U.S. dollars (Note 1)
Additional Net unrealized gains Foreign currency TreasuryCommon paid-in Retained (losses) on available- translation stock,
stock capital earnings for-sale securities adjustments at cost
Balance at March 31, 2001 ................................................... $185,038 $194,158 $532,278 $ 1,398 $(31,398) $ (0)
Net income ......................................................................... 6,053
Cash dividends, $0.045 per share (Note 7) .......................... (12,489)
Bonuses to directors and corporate auditors ........................ (699)
Net unrealized loss on available-for-sale securities ................... (7,142)
Foreign currency translation adjustments ............................. 19,532
Increase in treasury stock..................................................... (60)
Increase resulting from non-consolidation of subsidiaries ................................................................... 8
Increase resulting from revaluation of fixed assets of a consolidated subsidiary..................................... 1,180
Increase resulting from excluding associated companies from equity method .......................................... 15
Balance at March 31, 2002 ................................................... $185,038 $194,158 $526,346 $(5,744) $(11,866) $(60)
See notes to consolidated financial statements.
Consolidated Statements of Shareholders’ EquityTOYO INK MFG. CO., LTD. and Subsidiaries Years ended March 31, 2002 and 2001
23

Thousands ofMillions of yen U.S. dollars (Note 1)
2002 2001 2002
Operating activities:Income before income taxes and minority interests............................................................ ¥ 1,571 ¥ 4,935 $ 11,812Adjustments for:
Income taxes—paid....................................................................................................... (6,512) (4,099) (48,962)Depreciation and amortization ...................................................................................... 10,318 10,007 77,579Gain on sales of property, plant and equipment and other fixed assets, net................... (2,437) (7,352) (18,323)Loss on disposal of property, plant and equipment and other fixed assets ..................... 819 233 6,158Gains on sales of investment securities, net ................................................................... (56) (1,914) (421)Loss on impairment of investment securities .................................................................. 3,804 372 28,602Gain on transfer of securities to retirement benefit trust................................................ — (480) —Charge for transitional obligations for retirement benefits ............................................. — 12,835 —Payments to establish a trust for retirement benefits...................................................... — (2,142) —Changes in assets and liabilities:
Decrease (increase) in accounts receivable and notes receivable................................. 3,245 (770) 24,398Increase in inventories ............................................................................................... (811) (1,223) (6,098)(Decrease) increase in accounts payable and notes payable ....................................... (675) 3,601 (5,075)Other, net ................................................................................................................. 2,739 (619) 20,593
Net cash provided by operating activities ............................................................... 12,005 13,384 90,263
Investing activities:Purchases of marketable securities .................................................................................... (3,000) (30) (22,556)Proceeds from sales of marketable securities ..................................................................... 3,360 1,779 25,263Purchases of fixed assets ................................................................................................... (13,704) (10,483) (103,038)Proceeds from sales of fixed assets .................................................................................... 3,664 9,257 27,549Purchases of investment securities ..................................................................................... (4,031) (7,153) (30,308)Proceeds from sales of investment securities...................................................................... 1,845 6,705 13,872(Increase) decrease in loans receivable—net ...................................................................... (709) 168 (5,331)Increase in other assets—net............................................................................................. (2,264) (516) (17,022)
Net cash used in investing activities ....................................................................... (14,839) (273) (111,571)
Financing activities:Increase (decrease) in short-term borrowings—net ............................................................ 2,505 (4,497) 18,835Proceeds from long-term debt........................................................................................... 749 582 5,632Repayments of long-term debt .......................................................................................... (4,969) (16,546) (37,361)Dividends paid .................................................................................................................. (1,749) (1,434) (13,150)Other, net ......................................................................................................................... (507) (14) (3,813)
Net cash used in financing activities ...................................................................... (3,971) (21,909) (29,857)
Foreign currency translation adjustments on cash and cash equivalents ..................... 1,270 881 9,548
Net decrease in cash and cash equivalents ...................................................................... (5,535) (7,917) (41,617)Cash and cash equivalents, beginning of year ................................................................ 26,181 34,272 196,850Decrease in cash and cash equivalents by unconsolidation of subsidiaries previously consolidated............................................................................ — (174) —
Cash and cash equivalents, end of year ........................................................................... ¥20,646 ¥26,181 $155,233
See notes to consolidated financial statements.
Consolidated Statements of Cash FlowsTOYO INK MFG. CO., LTD. and Subsidiaries Years ended March 31, 2002 and 2001
24

25
Notes to Consolidated Financial StatementsTOYO INK MFG. CO., LTD. and Subsidiaries Years ended March 31, 2002 and 2001
The accompanying consolidated financial statements have been prepared in accordance with theprovisions set forth in the Japanese Securities and Exchange Law (the “Law”) and its related account-ing regulations, and in conformity with accounting principles and practices generally accepted in Japan,which are different in certain respects as to application and disclosure requirements of InternationalAccounting Standards.
The consolidated financial statements are not intended to present the financial position, results ofoperations and cash flows in accordance with accounting principles and practices generally acceptedin countries and jurisdictions other than Japan.
In preparing these consolidated financial statements, certain reclassifications and rearrangements havebeen made to the consolidated financial statements issued domestically in order to present them in aform which is more familiar to readers outside Japan.
Certain 2001 amounts have been reclassified to conform to the 2002 presentation.The consolidated financial statements are stated in Japanese yen, the currency of the country in
which TOYO INK MFG. CO., LTD. (the “Company”) is incorporated and operates. The translations ofJapanese yen amounts into U.S. dollar amounts are included solely for the convenience of readersoutside Japan and have been made at the rate of ¥133 to US$1, the approximate rate of exchangeat March 31, 2002. Such translations should not be construed as representations that the Japaneseyen amounts could be converted into U.S. dollars at that or any other rate.
(a) Principles of consolidationThe consolidated financial statements include the accounts of the Company and all its 68 (73 in 2001)subsidiaries (collectively, the “Companies”). The Companies adopted the control or influence conceptas the consolidation scope of subsidiaries and associated companies in accordance with the newaccounting standard for consolidation. Under the control or influence concept, those companies inwhich the Parent, directly or indirectly, is able to exercise control over operations are fully consolidated,and those companies over which the Companies have the ability to exercise significant influence areaccounted for by the equity method.
Investments in 13 (14 in 2001) associated companies are accounted for using the equity method.The excess of the cost of an acquisition over the fair value of the net assets of the acquired sub-
sidiary at the date of acquisition is amortized over 20 years.All significant intercompany balances and transactions have been eliminated in consolidation. All mater-
ial unrealized profit included in assets resulting from transactions within the Companies is eliminated.
(b) Cash equivalentsCash equivalents are short-term investments that are readily convertible into cash and that are exposedto insignificant risk of changes in value.
Cash equivalents include time deposits, certificates of deposit, commercial paper and mutual fundsinvesting in bonds that represent short-term investments, all of which mature or become due withinthree months of the date of acquisition.
(c) InventoriesFinished goods, work in process and raw materials are principally valued at average cost.
Merchandise and supplies are valued principally at the latest purchase cost.
1. BASIS OF PRESENTING CONSOLIDATEDFINANCIAL STATEMENTS
2. SUMMARY OF SIGNIFICANTACCOUNTING POLICIES

26
(d) Marketable and investment securitiesEffective April 1, 2000, the Company and domestic subsidiaries adopted a new Japanese accountingstandard for financial instruments, including marketable and investment securities.
The standard requires all applicable securities to be classified and accounted for, depending onmanagement’s intent, as follows:i) Trading securitiesSecurities which are held for the purpose of earning capital gains in the near term are reported at fairvalue, and the related unrealized gains and losses are included in earnings. The Companies do not holdtrading securities.ii) Held-to-maturity securitiesSecurities which are expected to be held to maturity with the positive intent and ability to hold tomaturity are reported at amortized cost.iii) Available-for-sale securitiesSecurities which are not classified as either of the aforementioned securities are classified as available-for-sale securities and reported at fair value, with unrealized gains and losses, net of applicable taxes,reported in a separate component of shareholders’ equity. Nonmarketable available-for-sale securitiesare stated at cost determined by the moving-average method. For other than temporary declines in fairvalue, investment securities are reduced to net realizable value by a charge to income.
Prior to April 1, 2000, marketable securities and investment securities listed on stock exchanges andover-the-counter markets were principally stated at the lower of cost, determined by the moving-average method, or market. Other securities were principally stated at cost, determined by the moving-average method.
(e) Property, plant and equipmentProperty, plant and equipment are stated at cost. Depreciation for property, plant and equipment of theCompany and its domestic subsidiaries is generally computed by the declining-balance method while thestraight-line method is applied to buildings acquired after April 1, 1998 and the straight-line method isprincipally applied to the property, plant and equipment of consolidated foreign subsidiaries.
Estimated useful lives are as follows:Buildings and structures 8 to 50 yearsMachinery and vehicles 4 to 17 yearsTools, furniture and fixtures 3 to 6 years
(f) Other assetsOther assets included memberships of ¥305 million (US$2,293 thousand) as of March 31, 2002.
Effective April 1, 2000, the Company and domestic subsidiaries adopted a new Japanese accountingstandard for financial instruments, including memberships.
The standard requires memberships to be written down to fair value and charged to income in the eventof a significant decline in value.
(g) Retirement benefitsThe Company has a contributory funded pension plan together with certain domestic subsidiariescovering substantially all employees. Other domestic consolidated subsidiaries have either non-contributory funded pension plans or defined retirement lump-sum benefit plans covering sub-stantially all of their employees. Prior to April 1, 2000, the annual provision for retirement benefitswas calculated to state the liability at the amount that would be required if all employees voluntarilyterminated their employment at each balance sheet date.
A foreign consolidated subsidiary has a local pension plan covering its employees.Certain foreign consolidated subsidiaries also have local employees’ retirement benefit plans and
provide for the amount to state the liability for these employees’ retirement benefits, primarily deter-mined by an actuarial method.
27
Effective April 1, 2000, the Company and domestic subsidiaries adopted a new accounting stan-dard for employees’ retirement benefits and accounted for the liability for retirement benefits basedon the projected benefit obligations and plan assets at the balance sheet date.
The Company and certain subsidiaries provide for retirement allowances for directors and corporateauditors in the amount required under their internal rules.
The amounts payable to directors and corporate auditors upon retirement are subject to theapproval of the shareholders in accordance with the Japanese Commercial Code (the “Code”).
(h) LeasesAll leases are accounted for as operating leases. Under Japanese accounting standards for leases,finance leases that do not transfer ownership of the leased property to the lessee are permitted to beaccounted for as rental transactions if certain “as if capitalized” information is disclosed in the notesto the consolidated financial statements.
(i) Income taxesDeferred income taxes are recorded to reflect the impact of temporary differences between assetsand liabilities recognized for financial reporting purposes and such amounts recognized for tax purposes.These deferred taxes are measured by applying currently enacted tax laws to the temporary differences.
(j) Appropriations of retained earningsAppropriations of retained earnings are reflected in the financial statements for the following year uponshareholders’ approval.
(k) Translation of foreign currency accountsPrior to April 1, 2000, short-term receivables and payables denominated in foreign currencies weretranslated into Japanese yen at the current exchange rates at each balance sheet date, while long-term receivables and payables denominated in foreign currencies were translated at historical rates.
Effective April 1, 2000, the Companies adopted a revised Japanese accounting standard for foreigncurrency transactions. In accordance with the revised standard, all short-term and long-term monetaryreceivables and payables denominated in foreign currencies are translated into Japanese yen at theexchange rates at the balance sheet date. The foreign exchange gains and losses from translation arerecognized in the consolidated statements of income.
(l) Translation of foreign currency financial statementsThe financial statements of the foreign consolidated subsidiaries are translated into Japanese yenat the current exchange rates as of the balance sheet date except for shareholders’ equity, whichis translated at historical rates.
Prior to April 1, 2000, differences arising from such translations were shown as “Foreign currencytranslation adjustments” as either assets or liabilities in the consolidated balance sheet.
Effective April 1, 2000, such differences are shown as “Foreign currency translation adjustments”in a separate component of shareholders’ equity in accordance with the revised Japanese accountingstandards for foreign currency transactions.
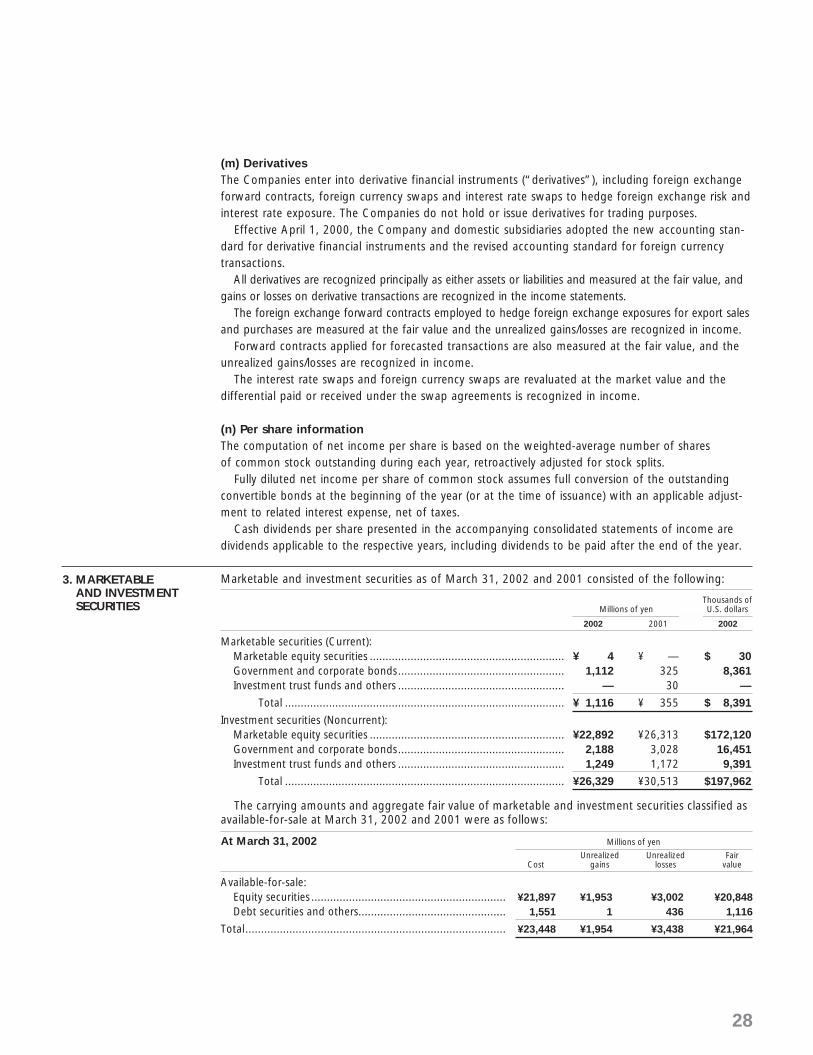
28
(m) DerivativesThe Companies enter into derivative financial instruments (“derivatives”), including foreign exchangeforward contracts, foreign currency swaps and interest rate swaps to hedge foreign exchange risk andinterest rate exposure. The Companies do not hold or issue derivatives for trading purposes.
Effective April 1, 2000, the Company and domestic subsidiaries adopted the new accounting stan-dard for derivative financial instruments and the revised accounting standard for foreign currencytransactions.
All derivatives are recognized principally as either assets or liabilities and measured at the fair value, andgains or losses on derivative transactions are recognized in the income statements.
The foreign exchange forward contracts employed to hedge foreign exchange exposures for export salesand purchases are measured at the fair value and the unrealized gains/losses are recognized in income.
Forward contracts applied for forecasted transactions are also measured at the fair value, and theunrealized gains/losses are recognized in income.
The interest rate swaps and foreign currency swaps are revaluated at the market value and thedifferential paid or received under the swap agreements is recognized in income.
(n) Per share informationThe computation of net income per share is based on the weighted-average number of sharesof common stock outstanding during each year, retroactively adjusted for stock splits.
Fully diluted net income per share of common stock assumes full conversion of the outstandingconvertible bonds at the beginning of the year (or at the time of issuance) with an applicable adjust-ment to related interest expense, net of taxes.
Cash dividends per share presented in the accompanying consolidated statements of income aredividends applicable to the respective years, including dividends to be paid after the end of the year.
Marketable and investment securities as of March 31, 2002 and 2001 consisted of the following:
Thousands of Millions of yen U.S. dollars
2002 2001 2002
Marketable securities (Current):Marketable equity securities .............................................................. ¥ 4 ¥ — $ 30Government and corporate bonds..................................................... 1,112 325 8,361Investment trust funds and others ..................................................... — 30 —
Total ......................................................................................... ¥ 1,116 ¥ 355 $ 8,391
Investment securities (Noncurrent):Marketable equity securities .............................................................. ¥22,892 ¥26,313 $172,120Government and corporate bonds..................................................... 2,188 3,028 16,451Investment trust funds and others ..................................................... 1,249 1,172 9,391
Total ......................................................................................... ¥26,329 ¥30,513 $197,962
The carrying amounts and aggregate fair value of marketable and investment securities classified asavailable-for-sale at March 31, 2002 and 2001 were as follows:
At March 31, 2002 Millions of yen
Unrealized Unrealized FairCost gains losses value
Available-for-sale:Equity securities .............................................................. ¥21,897 ¥1,953 ¥3,002 ¥20,848Debt securities and others............................................... 1,551 1 436 1,116
Total................................................................................... ¥23,448 ¥1,954 ¥3,438 ¥21,964
3. MARKETABLEAND INVESTMENTSECURITIES
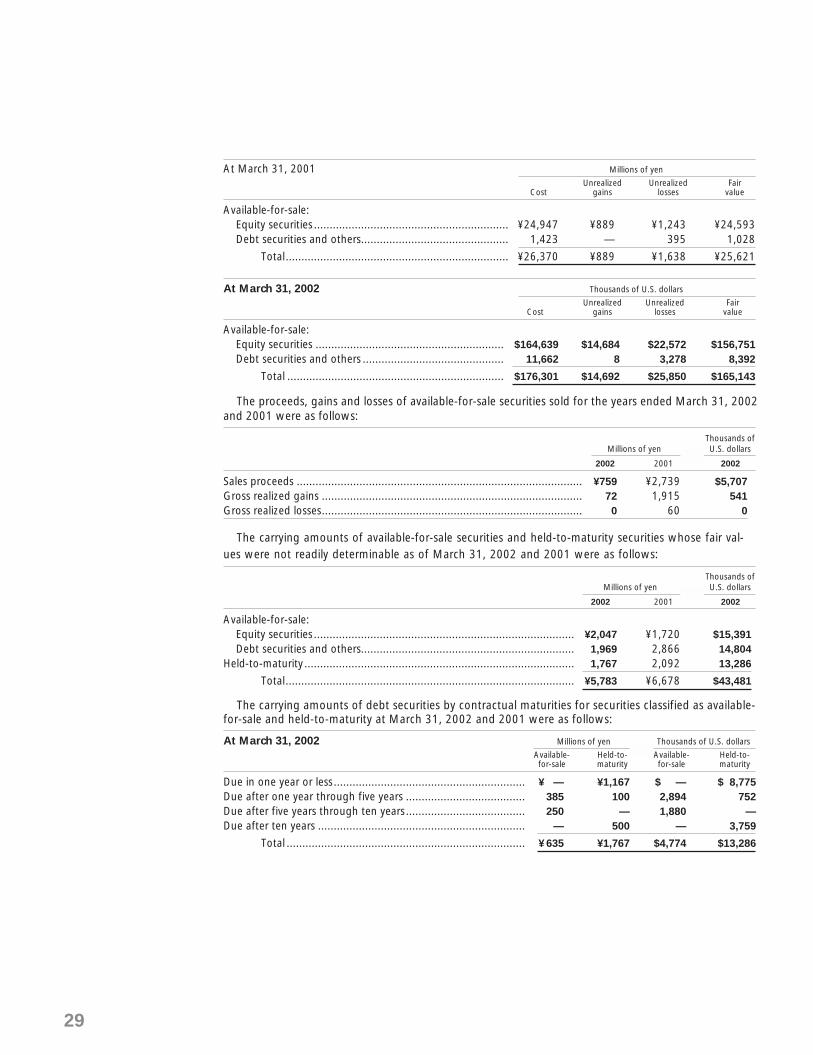
At March 31, 2001 Millions of yen
Unrealized Unrealized FairCost gains losses value
Available-for-sale:Equity securities .............................................................. ¥24,947 ¥889 ¥1,243 ¥24,593Debt securities and others............................................... 1,423 — 395 1,028
Total....................................................................... ¥26,370 ¥889 ¥1,638 ¥25,621
At March 31, 2002 Thousands of U.S. dollars
Unrealized Unrealized FairCost gains losses value
Available-for-sale:Equity securities ............................................................ $164,639 $14,684 $22,572 $156,751Debt securities and others ............................................. 11,662 8 3,278 8,392
Total ..................................................................... $176,301 $14,692 $25,850 $165,143
The proceeds, gains and losses of available-for-sale securities sold for the years ended March 31, 2002and 2001 were as follows:
Thousands of Millions of yen U.S. dollars
2002 2001 2002
Sales proceeds ........................................................................................... ¥759 ¥2,739 $5,707Gross realized gains ................................................................................... 72 1,915 541Gross realized losses................................................................................... 0 60 0
The carrying amounts of available-for-sale securities and held-to-maturity securities whose fair val-ues were not readily determinable as of March 31, 2002 and 2001 were as follows:
Thousands of Millions of yen U.S. dollars
2002 2001 2002
Available-for-sale:Equity securities ................................................................................... ¥2,047 ¥1,720 $15,391Debt securities and others.................................................................... 1,969 2,866 14,804
Held-to-maturity ...................................................................................... 1,767 2,092 13,286
Total............................................................................................ ¥5,783 ¥6,678 $43,481
The carrying amounts of debt securities by contractual maturities for securities classified as available-for-sale and held-to-maturity at March 31, 2002 and 2001 were as follows:
At March 31, 2002 Millions of yen Thousands of U.S. dollars
Available- Held-to- Available- Held-to-for-sale maturity for-sale maturity
Due in one year or less............................................................. ¥ — ¥1,167 $ — $ 8,775Due after one year through five years ...................................... 385 100 2,894 752Due after five years through ten years...................................... 250 — 1,880 —Due after ten years .................................................................. — 500 — 3,759
Total ............................................................................ ¥ 635 ¥1,767 $4,774 $13,286
29
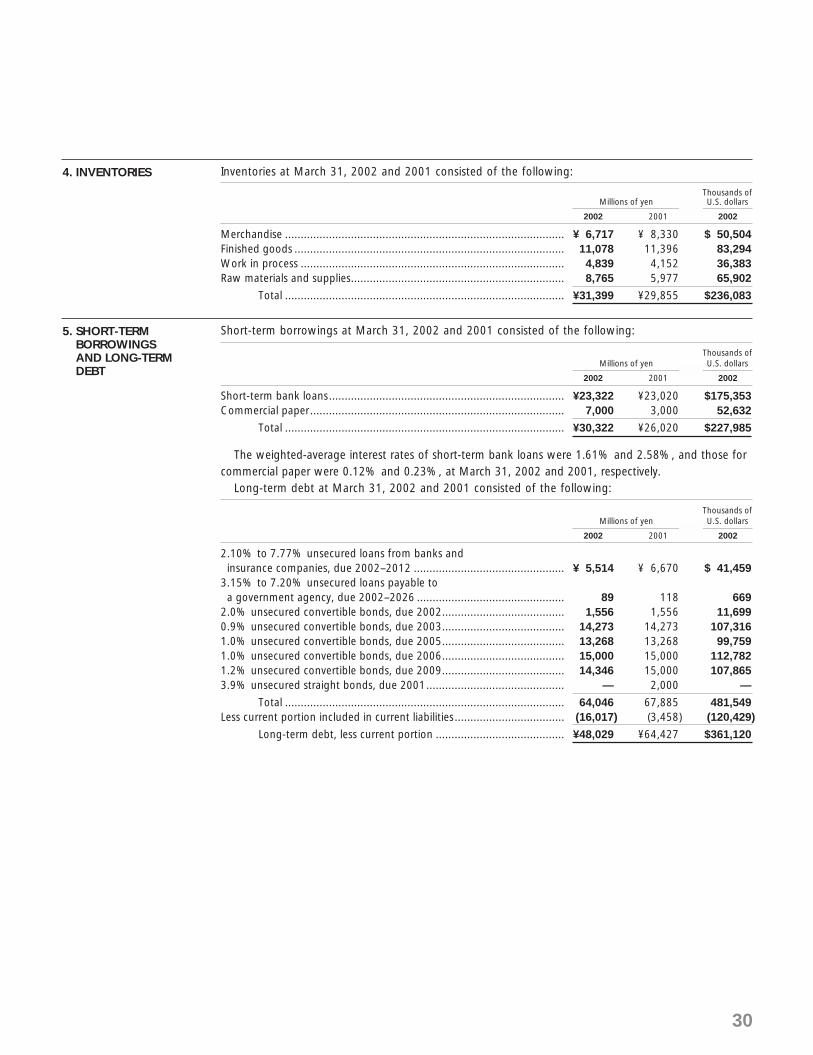
30
Inventories at March 31, 2002 and 2001 consisted of the following:
Thousands of Millions of yen U.S. dollars
2002 2001 2002
Merchandise ......................................................................................... ¥ 6,717 ¥ 8,330 $ 50,504Finished goods ...................................................................................... 11,078 11,396 83,294Work in process .................................................................................... 4,839 4,152 36,383Raw materials and supplies.................................................................... 8,765 5,977 65,902
Total ......................................................................................... ¥31,399 ¥29,855 $236,083
Short-term borrowings at March 31, 2002 and 2001 consisted of the following:
Thousands of Millions of yen U.S. dollars
2002 2001 2002
Short-term bank loans........................................................................... ¥23,322 ¥23,020 $175,353Commercial paper................................................................................. 7,000 3,000 52,632
Total ......................................................................................... ¥30,322 ¥26,020 $227,985
The weighted-average interest rates of short-term bank loans were 1.61% and 2.58%, and those forcommercial paper were 0.12% and 0.23%, at March 31, 2002 and 2001, respectively.
Long-term debt at March 31, 2002 and 2001 consisted of the following:
Thousands of Millions of yen U.S. dollars
2002 2001 2002
2.10% to 7.77% unsecured loans from banks andinsurance companies, due 2002–2012 ................................................ ¥ 5,514 ¥ 6,670 $ 41,459
3.15% to 7.20% unsecured loans payable toa government agency, due 2002–2026 ............................................... 89 118 669
2.0% unsecured convertible bonds, due 2002....................................... 1,556 1,556 11,6990.9% unsecured convertible bonds, due 2003....................................... 14,273 14,273 107,3161.0% unsecured convertible bonds, due 2005....................................... 13,268 13,268 99,7591.0% unsecured convertible bonds, due 2006....................................... 15,000 15,000 112,7821.2% unsecured convertible bonds, due 2009....................................... 14,346 15,000 107,8653.9% unsecured straight bonds, due 2001............................................ — 2,000 —
Total ......................................................................................... 64,046 67,885 481,549Less current portion included in current liabilities................................... (16,017) (3,458) (120,429)
Long-term debt, less current portion ......................................... ¥48,029 ¥64,427 $361,120
5. SHORT-TERM BORROWINGS AND LONG-TERMDEBT
4. INVENTORIES

31
A summary of the terms of conversion and redemption of convertible bonds at March 31, 2002 isas follows:
Conversion priceper share Redeemable
2.0% unsecured convertible bonds, due 2002 ............. ¥757.00 At 106%, decreasing 1% per yearto 100% of the principal amounton or after October 1, 1995 at theCompany’s option
0.9% unsecured convertible bonds, due 2003 ............. ¥617.70 At 103%, decreasing 1% per yearto 100% of the principal amounton or after April 1, 1999 at theCompany’s option
1.0% unsecured convertible bonds, due 2005 ............. ¥617.70 At 104%, decreasing 1% per yearto 100% of the principal amounton or after April 1, 2000 at theCompany’s option
1.0% unsecured convertible bonds, due 2006 ............. ¥539.00 —1.2% unsecured convertible bonds, due 2009 ............. ¥539.00 —
The aforementioned conversion prices are subject to adjustments in certain circumstances, includingin the event of a common stock split.
Convertible bonds outstanding at March 31, 2002 were convertible into 101,087,120 shares ofcommon stock of the Company on the basis of the above conversion prices.
The annual maturities of long-term debt for the years subsequent to March 31, 2002 were as follows:
Millions of Thousands ofYear ending March 31 yen U.S. dollars
2003.......................................................................................................................... ¥16,017 $120,4292004.......................................................................................................................... 1,512 11,3682005.......................................................................................................................... 15,362 115,5042006.......................................................................................................................... 15,041 113,0902007.......................................................................................................................... 27 2032008 and thereafter................................................................................................... 16,087 120,955
Total .............................................................................................................. ¥64,046 $481,549
The carrying amounts of assets pledged as collateral for short-term and long-term bank loans of¥1,802 million (US$13,549 thousand) and ¥1,134 million at March 31, 2002 and 2001, respectively,were as follows:
Thousands of Millions of yen U.S. dollars
2002 2001 2002
Cash and time deposits ................................................................................. ¥ 2 ¥ 2 $ 15Land ............................................................................................................. 420 390 3,158Buildings and structures, net ......................................................................... 1,699 1,562 12,774Machinery and equipment, net ..................................................................... 10 — 76Intangible fixed assets ................................................................................... 301 343 2,263Investment securities ..................................................................................... 739 597 5,556
......................................................................................................... ¥3,171 ¥2,894 $23,842
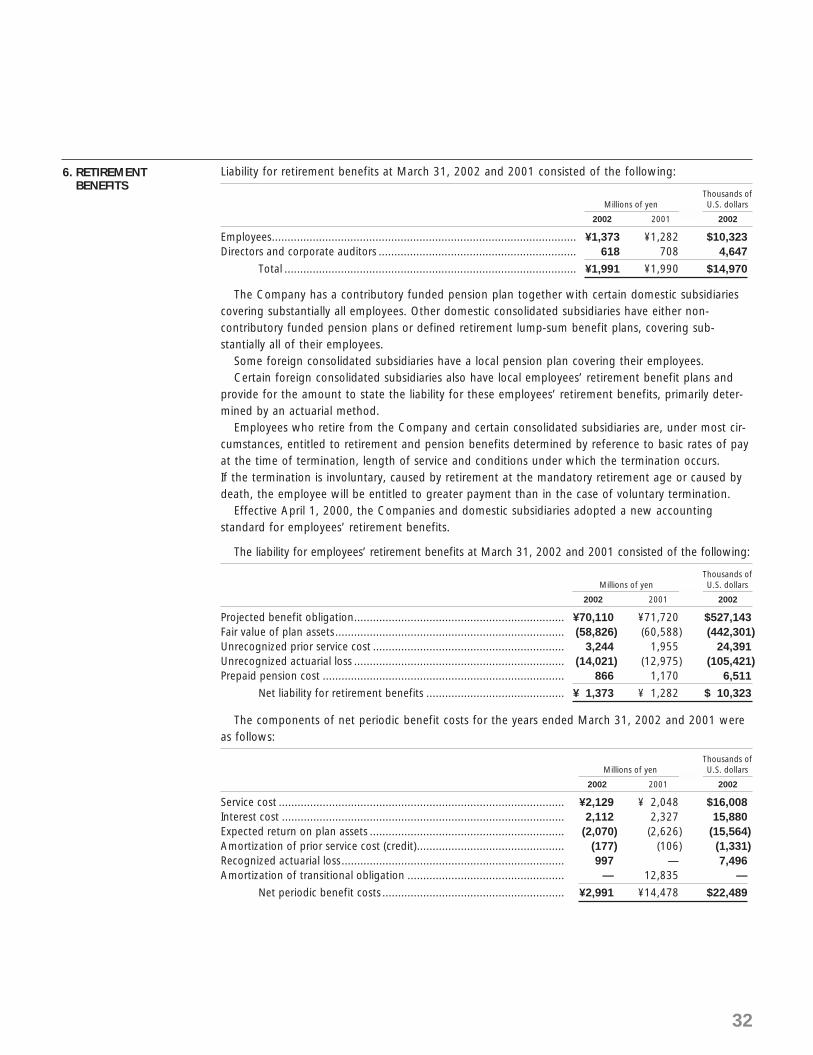
32
Liability for retirement benefits at March 31, 2002 and 2001 consisted of the following:
Thousands of Millions of yen U.S. dollars
2002 2001 2002
Employees................................................................................................. ¥1,373 ¥1,282 $10,323Directors and corporate auditors ............................................................... 618 708 4,647
Total ............................................................................................. ¥1,991 ¥1,990 $14,970
The Company has a contributory funded pension plan together with certain domestic subsidiariescovering substantially all employees. Other domestic consolidated subsidiaries have either non-contributory funded pension plans or defined retirement lump-sum benefit plans, covering sub-stantially all of their employees.
Some foreign consolidated subsidiaries have a local pension plan covering their employees.Certain foreign consolidated subsidiaries also have local employees’ retirement benefit plans and
provide for the amount to state the liability for these employees’ retirement benefits, primarily deter-mined by an actuarial method.
Employees who retire from the Company and certain consolidated subsidiaries are, under most cir-cumstances, entitled to retirement and pension benefits determined by reference to basic rates of payat the time of termination, length of service and conditions under which the termination occurs. If the termination is involuntary, caused by retirement at the mandatory retirement age or caused bydeath, the employee will be entitled to greater payment than in the case of voluntary termination.
Effective April 1, 2000, the Companies and domestic subsidiaries adopted a new accountingstandard for employees’ retirement benefits.
The liability for employees’ retirement benefits at March 31, 2002 and 2001 consisted of the following:
Thousands of Millions of yen U.S. dollars
2002 2001 2002
Projected benefit obligation................................................................... ¥70,110 ¥71,720 $527,143Fair value of plan assets......................................................................... (58,826) (60,588) (442,301)Unrecognized prior service cost ............................................................. 3,244 1,955 24,391Unrecognized actuarial loss ................................................................... (14,021) (12,975) (105,421)Prepaid pension cost ............................................................................. 866 1,170 6,511
Net liability for retirement benefits ............................................ ¥ 1,373 ¥ 1,282 $ 10,323
The components of net periodic benefit costs for the years ended March 31, 2002 and 2001 wereas follows:
Thousands of Millions of yen U.S. dollars
2002 2001 2002
Service cost ........................................................................................... ¥2,129 ¥ 2,048 $16,008Interest cost .......................................................................................... 2,112 2,327 15,880Expected return on plan assets .............................................................. (2,070) (2,626) (15,564)Amortization of prior service cost (credit)............................................... (177) (106) (1,331)Recognized actuarial loss....................................................................... 997 — 7,496Amortization of transitional obligation .................................................. — 12,835 —
Net periodic benefit costs .......................................................... ¥2,991 ¥14,478 $22,489
6. RETIREMENT BENEFITS
33
Assumptions used for the year ended March 31, 2002 were set forth as follows:2002 2001
Discount rate ................................................................................. Primarily 3.0% Primarily 3.0%Expected rate of return on plan assets ........................................... Primarily 3.4% Primarily 4.0%Amortization period of prior service cost ....................................... Primarily 13 years Primarily 13 yearsRecognition period of actuarial gain/loss........................................ Primarily 13 years Primarily 13 years
Besides the above net periodic benefit costs, the costs for supplemental retirement benefits for theyears ended March 31, 2002 and 2001 were ¥516 million (US$3,880 thousand) and ¥140 million,respectively. The amounts charged to income for retirement benefits for directors and corporate auditorsfor the years ended March 31, 2002 and 2001 were ¥33 million (US$248 thousand) and ¥82 million,respectively.
The total charges to income for the pension and retirement plans for the years ended March 31,2002 and 2001 were ¥3,540 million (US$26,617 thousand) and ¥14,700 million, respectively.
Japanese companies are subject to the Code, to which certain amendments became effective fromOctober 1, 2001.
Prior to October 1, 2001, the Code required at least 50% of the issue price of new shares, with a mini-mum of the par value thereof, to be designated as stated capital as determined by resolution of the Boardof Directors. Proceeds in excess of amounts designated as stated capital were credited to additional paid-in capital. Effective October 1, 2001, the Code was revised and common stock par values were eliminatedresulting in all shares being recorded with no par value.
Prior to October 1, 2001, the Code also provided that an amount at least equal to 10% of the aggre-gate amount of cash dividends and certain other cash payments which are made as an appropriation ofretained earnings applicable to each fiscal period shall be appropriated and set aside as a legal reserve untilsuch reserve equals 25% of stated capital. Effective October 1, 2001, the revised Code allows for suchappropriations to be set aside as a legal reserve until the total additional paid-in capital and legal reserveequals 25% of stated capital. The amount of total additional paid-in capital and legal reserve whichexceeds 25% of stated capital can be transferred to retained earnings by resolution of the shareholders,which may be available for dividends. The Company’s legal reserve amount, which is included in retainedearnings, totaled ¥5,207 million ($39,150 thousand) and ¥5,119 million as of March 31, 2002 and 2001,respectively. Under the Code, companies may issue new common shares to existing shareholders withoutconsideration as a stock split pursuant to a resolution of the Board of Directors. Prior to October 1, 2001,the amount calculated by dividing the total amount of shareholders’ equity by the number of outstandingshares after the stock split could not be less than ¥50 thousand. The revised Code eliminated this restriction.
Prior to October 1, 2001, the Code imposed certain restrictions on the repurchase and use of treasurystock. Effective October 1, 2001, the Code eliminated these restrictions, allowing companies to repurchasetreasury stock by a resolution of the shareholders at the general shareholders’ meeting and dispose ofsuch treasury stock by resolution of the Board of Directors after March 31, 2002. The repurchasedamount of treasury stock cannot exceed the amount available for future dividends plus the amount ofstated capital, additional paid-in capital or legal reserve to be reduced in the case where such reductionwas resolved at the general shareholders’ meeting.
The Code permits companies to transfer a portion of additional paid-in capital and legal reserve to statedcapital by resolution of the Board of Directors. The Code also permits companies to transfer a portion ofunappropriated retained earnings, available for dividends, to stated capital by resolution of the shareholders.
Dividends are approved by the shareholders at a meeting held subsequent to the fiscal year to whichthe dividends are applicable. Semiannual interim dividends may also be paid upon resolution of the Boardof Directors, subject to certain limitations imposed by the Code.
7. SHAREHOLDERS’EQUITY

34
The Company and its domestic subsidiaries are subject to Japanese national and local income taxes,which, in the aggregate, resulted in a normal effective statutory tax rate of approximately 42% foreach of the years ended March 31, 2002 and 2001.
The tax effects of significant temporary differences and loss carryforwards, which resulted in deferredtax assets and liabilities at March 31, 2002 and 2001 were as follows:
Thousands of Millions of yen U.S. dollars
2002 2001 2002
Deferred income tax assets:Accrued bonuses............................................................................... ¥ 909 ¥ 740 $ 6,835Inventories ........................................................................................ 484 633 3,639Investment securities ......................................................................... 3,397 2,274 25,541Depreciation...................................................................................... 2,243 2,132 16,865Tax loss carryforwards ....................................................................... 957 740 7,196Liability for retirement benefits .......................................................... 5,129 4,956 38,564Unrealized losses on investment securities ......................................... 876 448 6,586Others............................................................................................... 2,229 2,396 16,759Less valuation allowance ................................................................... (1,034) (1,608) (7,774)
Total ......................................................................................... 15,190 12,711 114,211
Deferred income tax liabilities:Revaluation of fixed assets in accordance with special tax measures ...... 5,041 4,622 37,902Investments in affiliates ..................................................................... 1,486 1,486 11,173Unrealized gains on investment securities .......................................... 374 514 2,812Others............................................................................................... 424 560 3,188
Total ......................................................................................... 7,325 7,182 55,075
Net deferred income tax assets.............................................................. ¥ 7,865 ¥ 5,529 $ 59,136
The reconciliations between the normal effective statutory tax rate for the years ended March 31, 2002and 2001 and the actual effective tax rates reflected in the accompanying consolidated statements of incomewere as follows:
2002 2001
Normal effective statutory tax rate ................................................................................... 42.05% 42.05%Adjustments:
Permanently nondeductible expense ............................................................................ 21.94 6.24Permanently nontaxable income .................................................................................. (101.35) (3.33)Inhabitants taxes per capita ......................................................................................... 3.93 1.16Valuation allowance .................................................................................................... (36.52) 3.93Equity in loss of associated companies ......................................................................... 8.35 4.19Elimination of cash dividends in consolidation.............................................................. 120.98 14.40Elimination of deferred income tax assets of deficit subsidiaries in consolidation .......... (30.03) (3.78)Others ......................................................................................................................... (0.43) (3.85)
Actual effective tax rate ....................................................................................... 28.92% 61.01%
Expenses relating to research and development activities were ¥7,845 million (US$58,985 thousand)and ¥6,790 million for the years ended March 31, 2002 and 2001, respectively.
9. RESEARCH ANDDEVELOPMENTEXPENSES
8. INCOME TAXES

35
Other income (expenses)—other, net, for the years ended March 31, 2002 and 2001 consisted of thefollowing:
Thousands of Millions of yen U.S. dollars
2002 2001 2002
Gains on foreign currency exchange....................................................... ¥ 724 ¥1,009 $ 5,444Gain on disposals or sales of property, plant and equipment, net..................................................................... 1,614 1,991 12,135
Beneficial interest in real estate trust ...................................................... — 4,900 —Gain on sales of investment securities, net.............................................. 56 1,914 421Gain on adjustment of amortization of long-term prepaid expenses ....... 191 — 1,436Damage compensation........................................................................... (302) (115) (2,271)Loss on redemption of marketable securities .......................................... (425) — (3,195)Loss on impairment of investment securities ........................................... (3,804) (372) (28,602)Provision of allowance for doubtful receivables....................................... (332) (60) (2,496)Loss on impairment of memberships ...................................................... (192) (240) (1,444)Loss on impairment of merchandise ....................................................... (522) (935) (3,925)Loss on discontinued operations............................................................. (449) — (3,376)Special retirement allowance .................................................................. (335) — (2,519)Lawsuit settlement ................................................................................. (736) — (5,534)Others, net............................................................................................. 352 853 2,648
Total .......................................................................................... ¥(4,160) ¥8,945 $(31,278)
Total lease payments and receipts under finance lease agreements that do not transfer ownership ofthe leased property to the lessee included in cost of sales and selling, general and administrative expens-es for the years ended March 31, 2002 and 2001 were as follows:
Thousands of Millions of yen U.S. dollars
2002 2001 2002
Payments .................................................................................................. ¥1,065 ¥1,030 $8,008Receipts .................................................................................................... 54 28 406
Pro forma information on leased property, such as acquisition cost, accumulated depreciation,obligation under finance leases, depreciation expense and interest expense of finance leases that donot transfer ownership of the leased property to the lessee on an “as if capitalized” basis for theyears ended March 31, 2002 and 2001, was as follows:
Year ended March 31, 2002 Millions of yen Thousands of U.S. dollars
Machinery Machineryand and
equipment Others Total equipment Others Total
Payments:Acquisition cost ......................................... ¥3,770 ¥1,149 ¥4,919 $28,346 $8,639 $36,985Accumulated depreciation............................ 2,600 650 3,250 19,549 4,887 24,436
Net leased property ............................... ¥1,170 ¥ 499 ¥1,669 $ 8,797 $3,752 $12,549Receipts:
Acquisition cost ......................................... ¥ 251 ¥ — ¥ 251 $ 1,887 $ — $ 1,887Accumulated depreciation............................ 142 — 142 1,067 — 1,067
Net leased property ............................... ¥ 109 ¥ — ¥ 109 $ 820 $ — $ 820
11. LEASES
10. OTHER INCOME(EXPENSES)—OTHER, NET
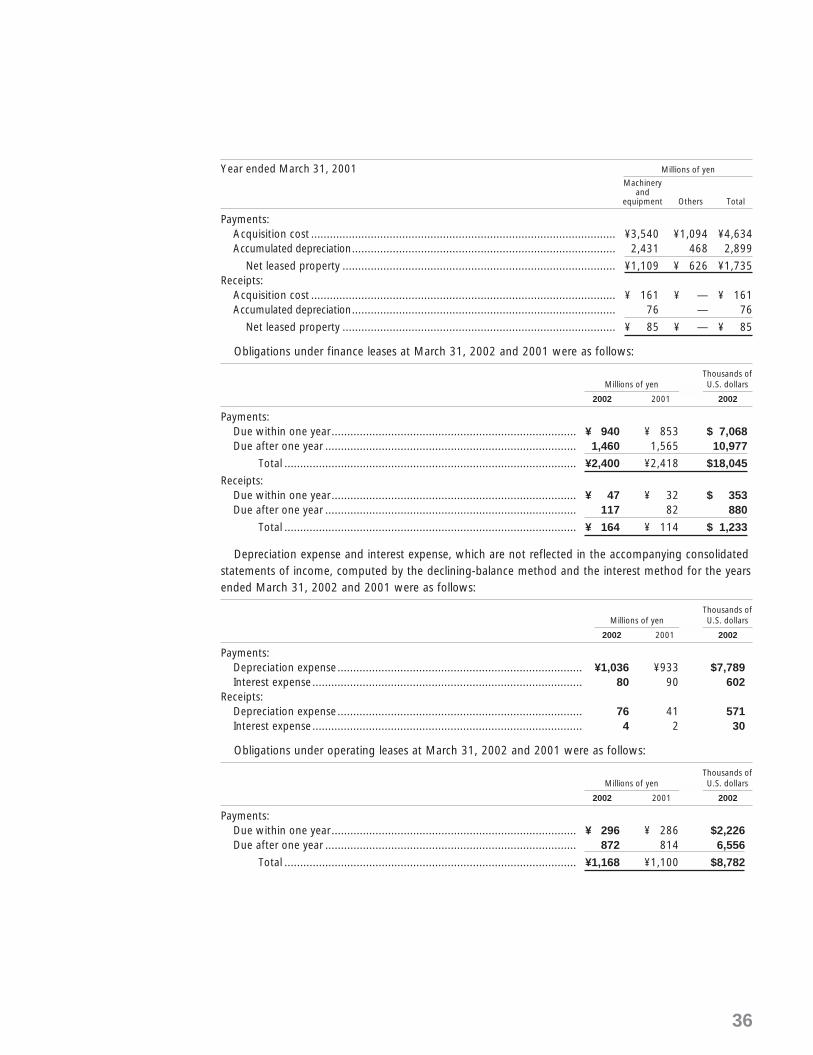
36
Year ended March 31, 2001 Millions of yen
Machineryand
equipment Others Total
Payments:Acquisition cost ................................................................................................. ¥3,540 ¥1,094 ¥4,634Accumulated depreciation.................................................................................... 2,431 468 2,899
Net leased property ....................................................................................... ¥1,109 ¥ 626 ¥1,735Receipts:
Acquisition cost ................................................................................................. ¥ 161 ¥ — ¥ 161Accumulated depreciation.................................................................................... 76 — 76
Net leased property ....................................................................................... ¥ 85 ¥ — ¥ 85
Obligations under finance leases at March 31, 2002 and 2001 were as follows:
Thousands of Millions of yen U.S. dollars
2002 2001 2002
Payments:Due within one year.............................................................................. ¥ 940 ¥ 853 $ 7,068Due after one year ................................................................................ 1,460 1,565 10,977
Total ............................................................................................. ¥2,400 ¥2,418 $18,045
Receipts:Due within one year.............................................................................. ¥ 47 ¥ 32 $ 353Due after one year ................................................................................ 117 82 880
Total ............................................................................................. ¥ 164 ¥ 114 $ 1,233
Depreciation expense and interest expense, which are not reflected in the accompanying consolidatedstatements of income, computed by the declining-balance method and the interest method for the yearsended March 31, 2002 and 2001 were as follows:
Thousands of Millions of yen U.S. dollars
2002 2001 2002
Payments:Depreciation expense.............................................................................. ¥1,036 ¥933 $7,789Interest expense...................................................................................... 80 90 602
Receipts:Depreciation expense.............................................................................. 76 41 571Interest expense...................................................................................... 4 2 30
Obligations under operating leases at March 31, 2002 and 2001 were as follows:
Thousands of Millions of yen U.S. dollars
2002 2001 2002
Payments:Due within one year.............................................................................. ¥ 296 ¥ 286 $2,226Due after one year ................................................................................ 872 814 6,556
Total ............................................................................................. ¥1,168 ¥1,100 $8,782
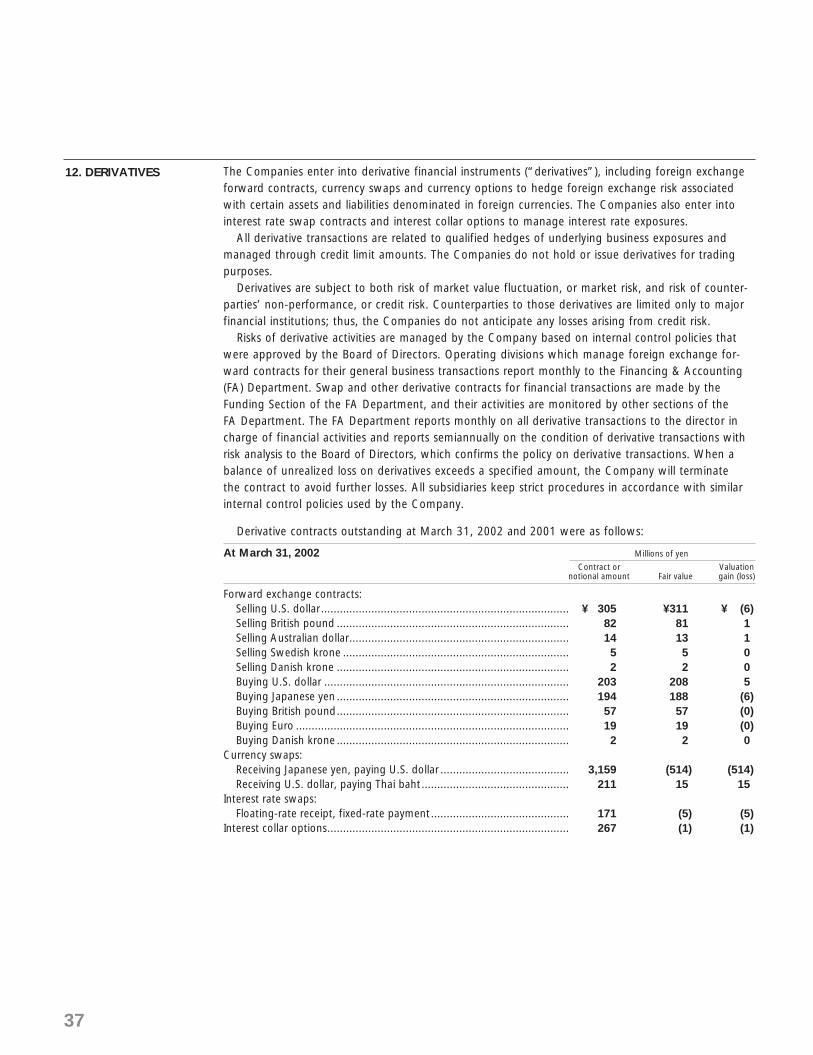
37
The Companies enter into derivative financial instruments (“derivatives”), including foreign exchangeforward contracts, currency swaps and currency options to hedge foreign exchange risk associatedwith certain assets and liabilities denominated in foreign currencies. The Companies also enter intointerest rate swap contracts and interest collar options to manage interest rate exposures.
All derivative transactions are related to qualified hedges of underlying business exposures andmanaged through credit limit amounts. The Companies do not hold or issue derivatives for tradingpurposes.
Derivatives are subject to both risk of market value fluctuation, or market risk, and risk of counter-parties’ non-performance, or credit risk. Counterparties to those derivatives are limited only to majorfinancial institutions; thus, the Companies do not anticipate any losses arising from credit risk.
Risks of derivative activities are managed by the Company based on internal control policies thatwere approved by the Board of Directors. Operating divisions which manage foreign exchange for-ward contracts for their general business transactions report monthly to the Financing & Accounting(FA) Department. Swap and other derivative contracts for financial transactions are made by theFunding Section of the FA Department, and their activities are monitored by other sections of theFA Department. The FA Department reports monthly on all derivative transactions to the director incharge of financial activities and reports semiannually on the condition of derivative transactions withrisk analysis to the Board of Directors, which confirms the policy on derivative transactions. When abalance of unrealized loss on derivatives exceeds a specified amount, the Company will terminatethe contract to avoid further losses. All subsidiaries keep strict procedures in accordance with similarinternal control policies used by the Company.
Derivative contracts outstanding at March 31, 2002 and 2001 were as follows:
At March 31, 2002 Millions of yen
Contract or Valuationnotional amount Fair value gain (loss)
Forward exchange contracts:Selling U.S. dollar............................................................................... ¥ 305 ¥311 ¥ (6)Selling British pound .......................................................................... 82 81 1Selling Australian dollar...................................................................... 14 13 1Selling Swedish krone ........................................................................ 5 5 0Selling Danish krone .......................................................................... 2 2 0Buying U.S. dollar .............................................................................. 203 208 5Buying Japanese yen .......................................................................... 194 188 (6)Buying British pound.......................................................................... 57 57 (0)Buying Euro ....................................................................................... 19 19 (0)Buying Danish krone .......................................................................... 2 2 0
Currency swaps:Receiving Japanese yen, paying U.S. dollar ......................................... 3,159 (514) (514)Receiving U.S. dollar, paying Thai baht............................................... 211 15 15
Interest rate swaps:Floating-rate receipt, fixed-rate payment............................................ 171 (5) (5)
Interest collar options............................................................................. 267 (1) (1)
12. DERIVATIVES
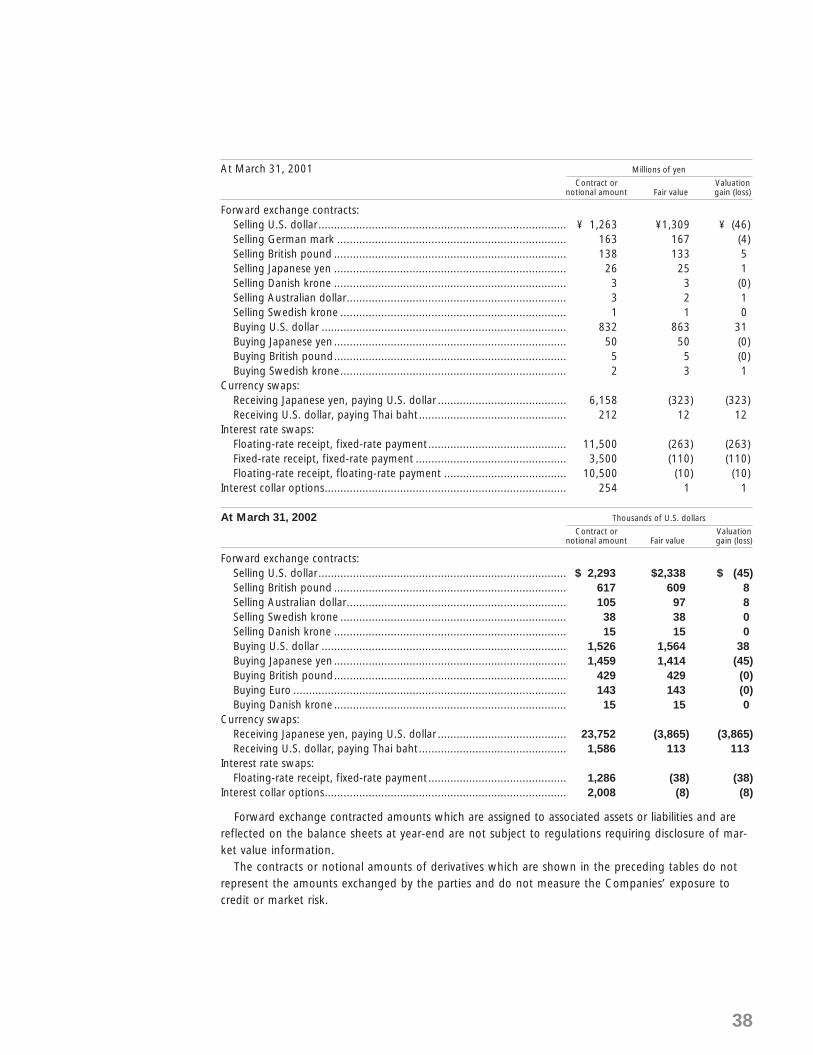
38
At March 31, 2001 Millions of yen
Contract or Valuationnotional amount Fair value gain (loss)
Forward exchange contracts:Selling U.S. dollar............................................................................... ¥ 1,263 ¥1,309 ¥ (46)Selling German mark ......................................................................... 163 167 (4)Selling British pound .......................................................................... 138 133 5Selling Japanese yen .......................................................................... 26 25 1Selling Danish krone .......................................................................... 3 3 (0)Selling Australian dollar...................................................................... 3 2 1Selling Swedish krone ........................................................................ 1 1 0Buying U.S. dollar .............................................................................. 832 863 31Buying Japanese yen .......................................................................... 50 50 (0)Buying British pound.......................................................................... 5 5 (0)Buying Swedish krone........................................................................ 2 3 1
Currency swaps:Receiving Japanese yen, paying U.S. dollar ......................................... 6,158 (323) (323)Receiving U.S. dollar, paying Thai baht............................................... 212 12 12
Interest rate swaps:Floating-rate receipt, fixed-rate payment............................................ 11,500 (263) (263)Fixed-rate receipt, fixed-rate payment ................................................ 3,500 (110) (110)Floating-rate receipt, floating-rate payment ....................................... 10,500 (10) (10)
Interest collar options............................................................................. 254 1 1
At March 31, 2002 Thousands of U.S. dollars
Contract or Valuationnotional amount Fair value gain (loss)
Forward exchange contracts:Selling U.S. dollar............................................................................... $ 2,293 $2,338 $ (45)Selling British pound .......................................................................... 617 609 8Selling Australian dollar...................................................................... 105 97 8Selling Swedish krone ........................................................................ 38 38 0Selling Danish krone .......................................................................... 15 15 0Buying U.S. dollar .............................................................................. 1,526 1,564 38Buying Japanese yen .......................................................................... 1,459 1,414 (45)Buying British pound.......................................................................... 429 429 (0)Buying Euro ....................................................................................... 143 143 (0)Buying Danish krone .......................................................................... 15 15 0
Currency swaps:Receiving Japanese yen, paying U.S. dollar ......................................... 23,752 (3,865) (3,865)Receiving U.S. dollar, paying Thai baht............................................... 1,586 113 113
Interest rate swaps:Floating-rate receipt, fixed-rate payment............................................ 1,286 (38) (38)
Interest collar options............................................................................. 2,008 (8) (8)
Forward exchange contracted amounts which are assigned to associated assets or liabilities and arereflected on the balance sheets at year-end are not subject to regulations requiring disclosure of mar-ket value information.
The contracts or notional amounts of derivatives which are shown in the preceding tables do notrepresent the amounts exchanged by the parties and do not measure the Companies’ exposure tocredit or market risk.
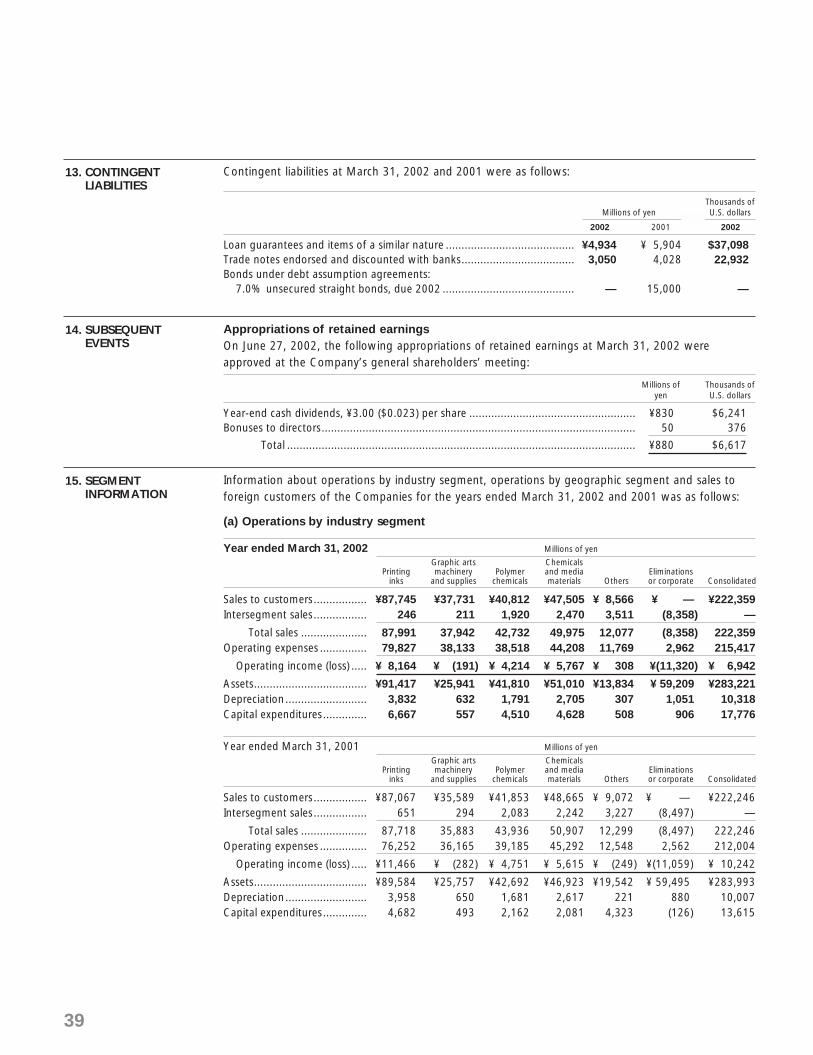
39
Contingent liabilities at March 31, 2002 and 2001 were as follows:
Thousands of Millions of yen U.S. dollars
2002 2001 2002
Loan guarantees and items of a similar nature ......................................... ¥4,934 ¥ 5,904 $37,098Trade notes endorsed and discounted with banks.................................... 3,050 4,028 22,932Bonds under debt assumption agreements:
7.0% unsecured straight bonds, due 2002 .......................................... — 15,000 —
Appropriations of retained earningsOn June 27, 2002, the following appropriations of retained earnings at March 31, 2002 wereapproved at the Company’s general shareholders’ meeting:
Millions of Thousands of yen U.S. dollars
Year-end cash dividends, ¥3.00 ($0.023) per share ..................................................... ¥830 $6,241Bonuses to directors.................................................................................................... 50 376
Total ............................................................................................................... ¥880 $6,617
Information about operations by industry segment, operations by geographic segment and sales toforeign customers of the Companies for the years ended March 31, 2002 and 2001 was as follows:
(a) Operations by industry segment
Year ended March 31, 2002 Millions of yen
Graphic arts Chemicals Printing machinery Polymer and media Eliminations
inks and supplies chemicals materials Others or corporate Consolidated
Sales to customers................. ¥87,745 ¥37,731 ¥40,812 ¥47,505 ¥ 8,566 ¥ — ¥222,359Intersegment sales................. 246 211 1,920 2,470 3,511 (8,358) —
Total sales ..................... 87,991 37,942 42,732 49,975 12,077 (8,358) 222,359Operating expenses ............... 79,827 38,133 38,518 44,208 11,769 2,962 215,417
Operating income (loss) ..... ¥ 8,164 ¥ (191) ¥ 4,214 ¥ 5,767 ¥ 308 ¥(11,320) ¥ 6,942
Assets.................................... ¥91,417 ¥25,941 ¥41,810 ¥51,010 ¥13,834 ¥ 59,209 ¥283,221Depreciation.......................... 3,832 632 1,791 2,705 307 1,051 10,318Capital expenditures.............. 6,667 557 4,510 4,628 508 906 17,776
Year ended March 31, 2001 Millions of yen
Graphic arts Chemicals Printing machinery Polymer and media Eliminations
inks and supplies chemicals materials Others or corporate Consolidated
Sales to customers................. ¥87,067 ¥35,589 ¥41,853 ¥48,665 ¥ 9,072 ¥ — ¥222,246Intersegment sales................. 651 294 2,083 2,242 3,227 (8,497) —
Total sales ..................... 87,718 35,883 43,936 50,907 12,299 (8,497) 222,246Operating expenses ............... 76,252 36,165 39,185 45,292 12,548 2,562 212,004
Operating income (loss) ..... ¥11,466 ¥ (282) ¥ 4,751 ¥ 5,615 ¥ (249) ¥(11,059) ¥ 10,242
Assets.................................... ¥89,584 ¥25,757 ¥42,692 ¥46,923 ¥19,542 ¥ 59,495 ¥283,993Depreciation.......................... 3,958 650 1,681 2,617 221 880 10,007Capital expenditures.............. 4,682 493 2,162 2,081 4,323 (126) 13,615
15. SEGMENTINFORMATION
14. SUBSEQUENTEVENTS
13. CONTINGENT LIABILITIES

Year ended March 31, 2002 Thousands of U.S. dollars
Graphic arts Chemicals Printing machinery Polymer and media Eliminations
inks and supplies chemicals materials Others or corporate Consolidated
Sales to customers................. $659,737 $283,692 $306,857 $357,180 $ 64,406 $ — $1,671,872Intersegment sales................. 1,850 1,586 14,436 18,571 26,399 (62,842) —
Total sales ..................... 661,587 285,278 321,293 375,751 90,805 (62,842) 1,671,872Operating expenses ............... 600,204 286,714 289,609 332,390 88,489 22,271 1,619,677
Operating income (loss) ..... $ 61,383 $ (1,436) $ 31,684 $ 43,361 $ 2,316 $ (85,113) $ 52,195
Assets.................................... $687,346 $195,045 $314,361 $383,534 $104,015 $445,180 $2,129,481Depreciation.......................... 28,812 4,752 13,466 20,338 2,309 7,902 77,579Capital expenditures.............. 50,128 4,188 33,910 34,797 3,819 6,812 133,654
Note: Printing inks Offset inks, newspaper inks, gravure inksGraphic arts machinery and supplies Printing machinery, prepress systems, printing supplies, gravure cylindersPolymer chemicals Metal coatings, resins, adhesives, waxes, adhesive tapesChemicals and media materials Pigments, plastic colorants, electronic materials, magnetic coatingsOthers Software, services
(b) Operations by geographic segment
Year ended March 31, 2002 Millions of yen
Asia North EliminationsJapan and Oceania Europe America or corporate Consolidated
Sales to customers ........................... ¥176,912 ¥26,747 ¥8,365 ¥10,335 ¥ — ¥222,359Intersegment sales ........................... 7,637 1,143 304 14 (9,098) —
Total sales................................ 184,549 27,890 8,669 10,349 (9,098) 222,359Operating expenses ......................... 178,661 26,393 8,723 10,280 (8,640) 215,417
Operating income (loss) ............... ¥ 5,888 ¥ 1,497 ¥ (54) ¥ 69 ¥ (458) ¥ 6,942
Assets .............................................. ¥174,776 ¥36,698 ¥7,431 ¥ 8,066 ¥56,250 ¥283,221
Year ended March 31, 2001 Millions of yen
Asia North EliminationsJapan and Oceania Europe America or corporate Consolidated
Sales to customers ........................... ¥178,066 ¥23,543 ¥7,239 ¥13,398 ¥ — ¥222,246Intersegment sales ........................... 9,207 796 455 2 (10,460) —
Total sales................................ 187,273 24,339 7,694 13,400 (10,460) 222,246Operating expenses ......................... 179,137 22,646 7,591 13,090 (10,460) 212,004
Operating income ........................ ¥ 8,136 ¥ 1,693 ¥ 103 ¥ 310 ¥ — ¥ 10,242
Assets .............................................. ¥175,286 ¥35,795 ¥8,158 ¥ 8,641 ¥ 56,113 ¥283,993
Year ended March 31, 2002 Thousands of U.S. dollars
Asia North EliminationsJapan and Oceania Europe America or corporate Consolidated
Sales to customers ........................ $1,330,165 $201,105 $62,895 $77,707 $ — $1,671,872Intersegment sales ........................ 57,421 8,594 2,286 105 (68,406) —
Total sales ............................. 1,387,586 209,699 65,181 77,812 (68,406) 1,671,872Operating expenses....................... 1,343,315 198,444 65,587 77,293 (64,962) 1,619,677
Operating income (loss)............. $ 44,271 $ 11,255 $ (406) $ 519 $ (3,444) $ 52,195
Assets ........................................... $1,314,105 $275,925 $55,872 $60,647 $422,932 $2,129,481
40

(c) Sales to foreign customers
Thousands of Millions of yen U.S. dollars
2002 2001 2002
Asia and Oceania .................................................................................. ¥29,026 ¥25,230 $218,241Europe .................................................................................................. 7,603 6,851 57,165The Americas ........................................................................................ 13,201 14,819 99,256Africa .................................................................................................... 49 69 368
Total sales to foreign customers ........................................................ ¥49,879 ¥46,969 $375,030
Transactions with and balances due from and to TOPPAN PRINTING CO., LTD., which owned 21.81%and 21.63% of the shares of the Company at March 31, 2002 and 2001, respectively, and transactionswith associated companies at March 31, 2002 and 2001 and for the years then ended were as follows:
Thousands of Millions of yen U.S. dollars
2002 2001 2002
(1) TOPPAN PRINTING CO., LTD.:Transactions:
Sales ................................................................................................. ¥19,060 ¥17,881 $143,308Purchases .......................................................................................... 37 51 278
Balances at year-end:Notes and accounts receivable........................................................... 10,597 9,902 79,677Notes and accounts payable .............................................................. 47 7 353
(2) Associated companies:Transactions:
Sales ................................................................................................. 3,152 3,755 23,699Purchases .......................................................................................... 19,875 21,684 149,436
16. RELATED PARTYTRANSACTIONS
41

Independent Auditors’ Report
42
To the Board of Directors and Shareholders of
TOYO INK MFG. CO., LTD.:
We have examined the consolidated balance sheets of TOYO INK MFG. CO., LTD. and subsidiaries as of March 31, 2002 and 2001,
and the related consolidated statements of income, shareholders’ equity and cash flows for the years then ended, all expressed in
Japanese yen. Our examinations were made in accordance with auditing standards, procedures and practices generally accepted
and applied in Japan and, accordingly, included such tests of the accounting records and such other auditing procedures as we
considered necessary in the circumstances.
In our opinion, the consolidated financial statements referred to above present fairly the financial position of TOYO INK MFG.
CO., LTD. and subsidiaries as of March 31, 2002 and 2001, and the results of their operations and their cash flows for the years
then ended in conformity with accounting principles and practices generally accepted in Japan applied on a consistent basis.
Our examinations also comprehended the translation of Japanese yen amounts into U.S. dollar amounts and, in our opinion,
such translation has been made in conformity with the basis stated in Note 1. Such U.S. dollar amounts are presented solely
for the convenience of readers outside Japan.
June 27, 2002

10,11,24,27
137,8,9,20,25,26,28,29,30
619
12,14,18
2
1,5
22
1715,23
211634
43
Domestic Network
1. TOYO INK HOKKAIDO CO., LTD.
2. TOYO INK TOHOKU CO., LTD.
3. TOYO INK CHU-SHIKOKU CO., LTD.
4. TOYO INK KYUSHU CO., LTD.
5. TOYO SEIHAN CO., LTD.
6. ORIENTAL KASEI CO., LTD.
7. TOYO B-NET CO., LTD.
8. TOYO-PETROLITE CO., LTD.
9. TOYO-MORTON, LTD.
10. TOYO PREPRESS CO., LTD.
11. FUKUJU SANGYO CO., LTD.
12. TOYO F.C.C. CO., LTD.
13. TOYO INK JOTO HANBAI CO., LTD.
14. TOYO INK ENGINEERING CO., LTD.
15. TOYO INK OSAKA HANBAI CO., LTD.
16. NIHON POLYMER INDUSTRIES CO., LTD.
17. AICHI TOYO INK CO., LTD.
18. TOYO INK TOKYO HANBAI CO., LTD.
19. JOHNSON POLYMER CORPORATION
20. i&i CO., LTD.
21. MATSUI CHEMICAL CO., LTD.
22. TOYO INK NAGOYA HANBAI CO., LTD.
23. TOYO INSPECTIONS CO., LTD.
24. TOYO COLORTECH CO., LTD.
25. TOYO INK CUSTOMER SERVICE CO., LTD.
26. ga city CORP.
27. LOGI CO-NET CORP.
28. TOYO MANAGEMENT SERVICE CO., LTD.
29. TOYO HUMAN ASSET CO., LTD.
30. TOYO INK MFG. CO., LTD.
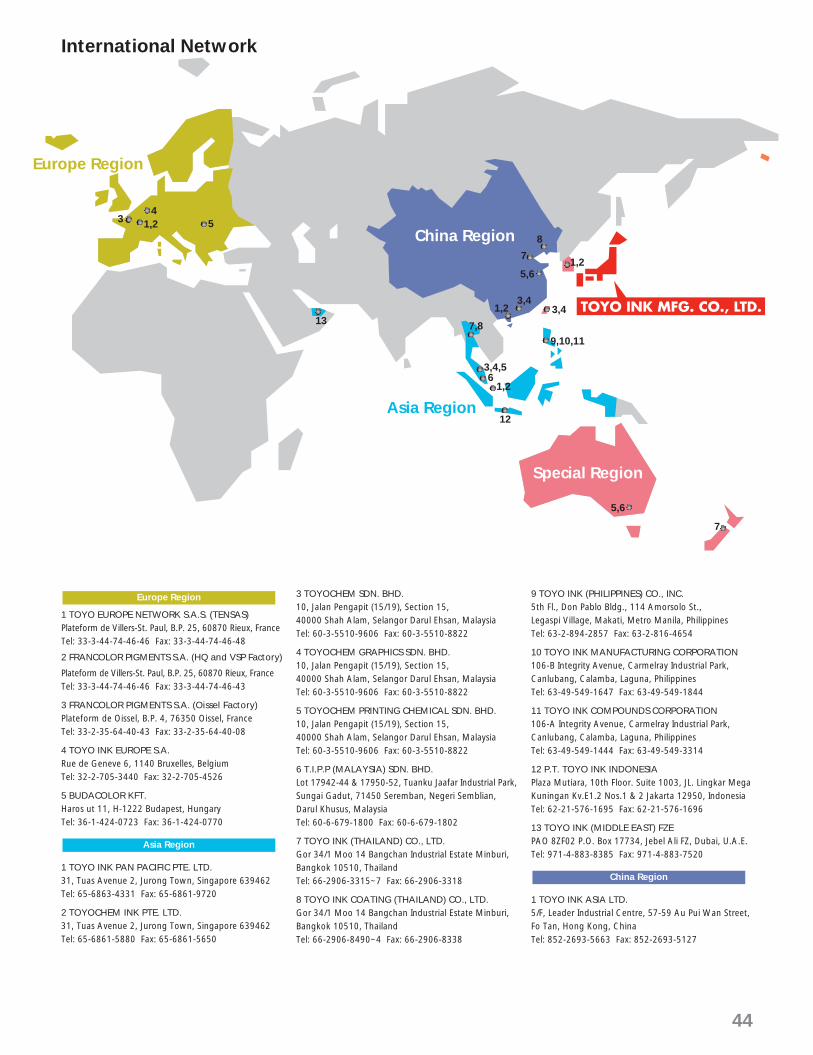
44
Europe Region
China Region
Special Region
Asia Region
1,234
5
13 1,2
3,4
5,6
7
8
1,2
3,4
9,10,117,8
3,4,56
1,2
12
5,6
7
1 TOYO EUROPE NETWORK S.A.S. (TENSAS)Plateform de Villers-St. Paul, B.P. 25, 60870 Rieux, FranceTel: 33-3-44-74-46-46 Fax: 33-3-44-74-46-48
2 FRANCOLOR PIGMENTS S.A. (HQ and VSP Factory)
Plateform de Villers-St. Paul, B.P. 25, 60870 Rieux, FranceTel: 33-3-44-74-46-46 Fax: 33-3-44-74-46-43
3 FRANCOLOR PIGMENTS S.A. (Oissel Factory)Plateform de Oissel, B.P. 4, 76350 Oissel, FranceTel: 33-2-35-64-40-43 Fax: 33-2-35-64-40-08
4 TOYO INK EUROPE S.A.Rue de Geneve 6, 1140 Bruxelles, BelgiumTel: 32-2-705-3440 Fax: 32-2-705-4526
5 BUDACOLOR KFT.Haros ut 11, H-1222 Budapest, HungaryTel: 36-1-424-0723 Fax: 36-1-424-0770
1 TOYO INK PAN PACIFIC PTE. LTD.31, Tuas Avenue 2, Jurong Town, Singapore 639462Tel: 65-6863-4331 Fax: 65-6861-9720
2 TOYOCHEM INK PTE. LTD.31, Tuas Avenue 2, Jurong Town, Singapore 639462Tel: 65-6861-5880 Fax: 65-6861-5650
3 TOYOCHEM SDN. BHD.10, Jalan Pengapit (15/19), Section 15, 40000 Shah Alam, Selangor Darul Ehsan, MalaysiaTel: 60-3-5510-9606 Fax: 60-3-5510-8822
4 TOYOCHEM GRAPHICS SDN. BHD.10, Jalan Pengapit (15/19), Section 15, 40000 Shah Alam, Selangor Darul Ehsan, MalaysiaTel: 60-3-5510-9606 Fax: 60-3-5510-8822
5 TOYOCHEM PRINTING CHEMICAL SDN. BHD.10, Jalan Pengapit (15/19), Section 15, 40000 Shah Alam, Selangor Darul Ehsan, MalaysiaTel: 60-3-5510-9606 Fax: 60-3-5510-8822
6 T.I.P.P (MALAYSIA) SDN. BHD.Lot 17942-44 & 17950-52, Tuanku Jaafar Industrial Park,Sungai Gadut, 71450 Seremban, Negeri Semblian,Darul Khusus, MalaysiaTel: 60-6-679-1800 Fax: 60-6-679-1802
7 TOYO INK (THAILAND) CO., LTD.Gor 34/1 Moo 14 Bangchan Industrial Estate Minburi,Bangkok 10510, ThailandTel: 66-2906-3315~7 Fax: 66-2906-3318
8 TOYO INK COATING (THAILAND) CO., LTD.Gor 34/1 Moo 14 Bangchan Industrial Estate Minburi,Bangkok 10510, ThailandTel: 66-2906-8490~4 Fax: 66-2906-8338
9 TOYO INK (PHILIPPINES) CO., INC.5th Fl., Don Pablo Bldg., 114 Amorsolo St., Legaspi Village, Makati, Metro Manila, PhilippinesTel: 63-2-894-2857 Fax: 63-2-816-4654
10 TOYO INK MANUFACTURING CORPORATION106-B Integrity Avenue, Carmelray Industrial Park,Canlubang, Calamba, Laguna, PhilippinesTel: 63-49-549-1647 Fax: 63-49-549-1844
11 TOYO INK COMPOUNDS CORPORATION106-A Integrity Avenue, Carmelray Industrial Park,Canlubang, Calamba, Laguna, PhilippinesTel: 63-49-549-1444 Fax: 63-49-549-3314
12 P.T. TOYO INK INDONESIAPlaza Mutiara, 10th Floor. Suite 1003, JL. Lingkar MegaKuningan Kv.E1.2 Nos.1 & 2 Jakarta 12950, IndonesiaTel: 62-21-576-1695 Fax: 62-21-576-1696
13 TOYO INK (MIDDLE EAST) FZEPAO 8ZF02 P.O. Box 17734, Jebel Ali FZ, Dubai, U.A.E.Tel: 971-4-883-8385 Fax: 971-4-883-7520
1 TOYO INK ASIA LTD.5/F, Leader Industrial Centre, 57-59 Au Pui Wan Street,Fo Tan, Hong Kong, ChinaTel: 852-2693-5663 Fax: 852-2693-5127
China Region
Asia Region
Europe Region
International Network
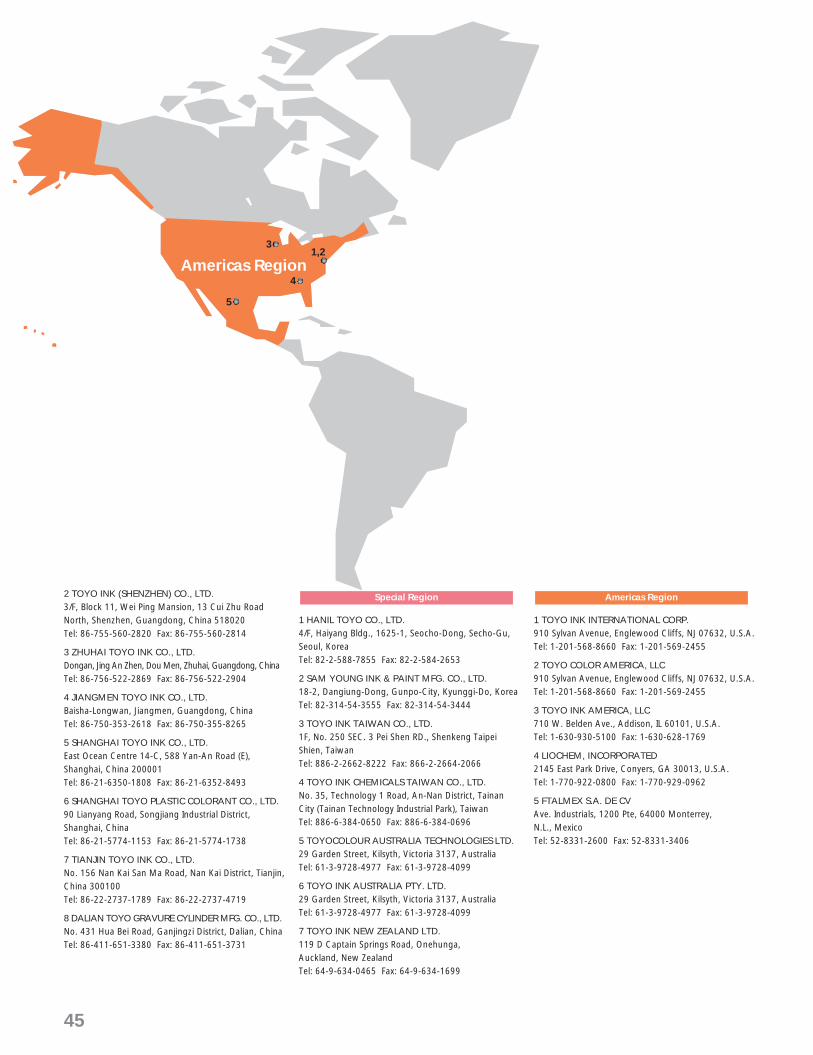
45
Americas Region1,2
3
4
5
2 TOYO INK (SHENZHEN) CO., LTD.3/F, Block 11, Wei Ping Mansion, 13 Cui Zhu RoadNorth, Shenzhen, Guangdong, China 518020Tel: 86-755-560-2820 Fax: 86-755-560-2814
3 ZHUHAI TOYO INK CO., LTD.Dongan, Jing An Zhen, Dou Men, Zhuhai, Guangdong, ChinaTel: 86-756-522-2869 Fax: 86-756-522-2904
4 JIANGMEN TOYO INK CO., LTD.Baisha-Longwan, Jiangmen, Guangdong, ChinaTel: 86-750-353-2618 Fax: 86-750-355-8265
5 SHANGHAI TOYO INK CO., LTD.East Ocean Centre 14-C, 588 Yan-An Road (E),Shanghai, China 200001Tel: 86-21-6350-1808 Fax: 86-21-6352-8493
6 SHANGHAI TOYO PLASTIC COLORANT CO., LTD.90 Lianyang Road, Songjiang Industrial District,Shanghai, ChinaTel: 86-21-5774-1153 Fax: 86-21-5774-1738
7 TIANJIN TOYO INK CO., LTD.No. 156 Nan Kai San Ma Road, Nan Kai District, Tianjin,China 300100Tel: 86-22-2737-1789 Fax: 86-22-2737-4719
8 DALIAN TOYO GRAVURE CYLINDER MFG. CO., LTD.No. 431 Hua Bei Road, Ganjingzi District, Dalian, ChinaTel: 86-411-651-3380 Fax: 86-411-651-3731
1 HANIL TOYO CO., LTD.4/F, Haiyang Bldg., 1625-1, Seocho-Dong, Secho-Gu,Seoul, KoreaTel: 82-2-588-7855 Fax: 82-2-584-2653
2 SAM YOUNG INK & PAINT MFG. CO., LTD.18-2, Dangiung-Dong, Gunpo-City, Kyunggi-Do, KoreaTel: 82-314-54-3555 Fax: 82-314-54-3444
3 TOYO INK TAIWAN CO., LTD.1F, No. 250 SEC. 3 Pei Shen RD., Shenkeng TaipeiShien, TaiwanTel: 886-2-2662-8222 Fax: 866-2-2664-2066
4 TOYO INK CHEMICALS TAIWAN CO., LTD.No. 35, Technology 1 Road, An-Nan District, TainanCity (Tainan Technology Industrial Park), Taiwan Tel: 886-6-384-0650 Fax: 886-6-384-0696
5 TOYOCOLOUR AUSTRALIA TECHNOLOGIES LTD.29 Garden Street, Kilsyth, Victoria 3137, AustraliaTel: 61-3-9728-4977 Fax: 61-3-9728-4099
6 TOYO INK AUSTRALIA PTY. LTD.29 Garden Street, Kilsyth, Victoria 3137, AustraliaTel: 61-3-9728-4977 Fax: 61-3-9728-4099
7 TOYO INK NEW ZEALAND LTD.119 D Captain Springs Road, Onehunga, Auckland, New ZealandTel: 64-9-634-0465 Fax: 64-9-634-1699
1 TOYO INK INTERNATIONAL CORP.910 Sylvan Avenue, Englewood Cliffs, NJ 07632, U.S.A.Tel: 1-201-568-8660 Fax: 1-201-569-2455
2 TOYO COLOR AMERICA, LLC910 Sylvan Avenue, Englewood Cliffs, NJ 07632, U.S.A.Tel: 1-201-568-8660 Fax: 1-201-569-2455
3 TOYO INK AMERICA, LLC710 W. Belden Ave., Addison, IL 60101, U.S.A.Tel: 1-630-930-5100 Fax: 1-630-628-1769
4 LIOCHEM, INCORPORATED2145 East Park Drive, Conyers, GA 30013, U.S.A.Tel: 1-770-922-0800 Fax: 1-770-929-0962
5 FTALMEX S.A. DE CVAve. Industrials, 1200 Pte, 64000 Monterrey, N.L., MexicoTel: 52-8331-2600 Fax: 52-8331-3406
Americas RegionSpecial Region
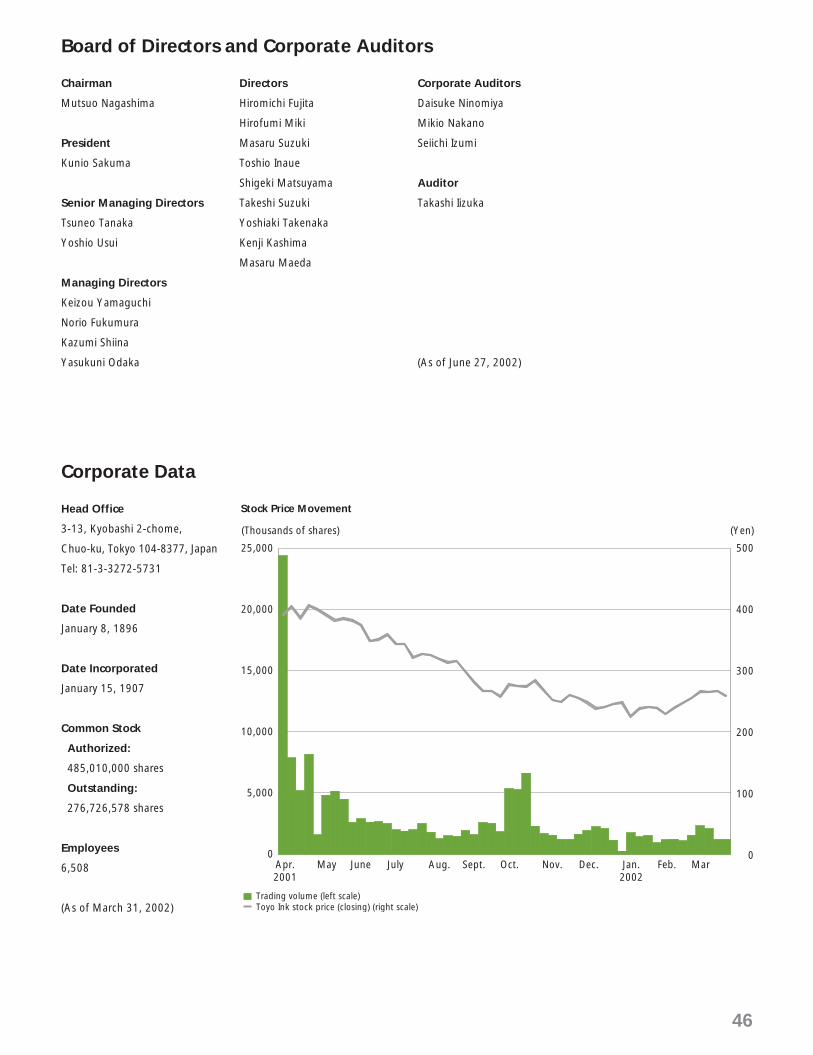
Chairman
Mutsuo Nagashima
President
Kunio Sakuma
Senior Managing Directors
Tsuneo Tanaka
Yoshio Usui
Managing Directors
Keizou Yamaguchi
Norio Fukumura
Kazumi Shiina
Yasukuni Odaka
Directors
Hiromichi Fujita
Hirofumi Miki
Masaru Suzuki
Toshio Inaue
Shigeki Matsuyama
Takeshi Suzuki
Yoshiaki Takenaka
Kenji Kashima
Masaru Maeda
Corporate Auditors
Daisuke Ninomiya
Mikio Nakano
Seiichi Izumi
Auditor
Takashi Iizuka
(As of June 27, 2002)
Head Office
3-13, Kyobashi 2-chome,
Chuo-ku, Tokyo 104-8377, Japan
Tel: 81-3-3272-5731
Date Founded
January 8, 1896
Date Incorporated
January 15, 1907
Common Stock
Authorized:
485,010,000 shares
Outstanding:
276,726,578 shares
Employees
6,508
(As of March 31, 2002)
Stock Price Movement
Board of Directors and Corporate Auditors
Corporate Data
46
Apr.2001
0
10,000
5,000
15,000
20,000
25,000
(Thousands of shares) (Yen)
0
200
100
300
400
500
May June July Aug. Sept. Oct. Nov. Dec. Jan.2002
Feb. Mar
Trading volume (left scale)Toyo Ink stock price (closing) (right scale)

c3
50p10/66p2
表紙 3
CCC M Y KCYANCYANCYAN MAGEN- YEL- BLACK
50p10/66p2 50p10/66p
c4
TOY
O IN
K M
FG. C
O.,LTD
.A
NN
UA
L REPO
RT 2002
表紙 4
This annual report is printed on recycled paper with SOY INK, a soybean-based ink.Printed in Japan
3-13, Kyobashi 2-chome, Chuo-ku, Tokyo 104-8377, JapanURL: http://www.toyoink.co.jp/