toyota cdp
TRANSCRIPT

Toyota.com
Communication Dashboard Project—Toyota Website
AssessmentBy Rui Yu
1

Toyota.com
Communication Dashboard Project
Toyota Motor Corporation
Toyota.com Assessment
Northeastern University
CMN 6910: Organizational Communication Assessment
Rui Yu
May 31, 2015
2

Toyota.com
Section I. Description of Communication Vehicle
Communication Vehicle
Toyota Motor Corporation is an international organization, which has its
headquarters in Japan, but has different branch offices in different countries
throughout the world. Although Toyota has various websites, this paper will focus on
only one of its websites, toyota.com.
About the Organization
When Kiichiro Toyota, the founder of Toyota Motor Corporation and the automotive
centered Toyota Group, founded Toyota Motor Corporation in Japan back in 1937,
they had only 20 dealers around the world: 18 domestics dealers and one dealer
each in Korea and Taiwan (toyota-global.com, n.d., para. 3). According to the section
“our story”, it says, “we first came to the U.S. in 1957, when we opened a dealership
in Hollywood, California. That year just 287 customers purchased the ‘Toyopet
Crown’, our first vehicle sold here. More than a half century later, our story in
America includes ten plants across the U.S. that produce over a million and a quarter
vehicles a year. It’s a story of 39,000 jobs and charitable commitments totaling over
$700 million to support safety, education and the environment in America.”
(toyota.com, n.d., para. 2). During recent years, Toyota is transforming their business
from selling cars, trucks, SUVs and Hybrids into being more engaged in the
community by—taking more initiative to protect the environment and giving back to
the community to help people.
Website Overview
The main communication vehicle for Toyota Motor Corporation is its website,
www.toyota.com where you can find both company information and retail
information. For Toyota company information, the website provides the link to
different branches of Toyota so that the customer can easily get to the information
they are looking for. In addition, there is also the latest news about Toyota on their
3

Toyota.com
website, which included the special deal offers to vehicle’s trade-in value. For retail
information, customers are able to access a very detailed shopping process from
vehicle selection, finding a local dealer to building their own model and getting a
quote from the local dealer. It serves a broad range of customers’ needs and is a very
resourceful site.
Homepage Layout and Functions
Right after opening the site toyota.com, an organized and logical homepage, which is
made up of pictures, tabs and links is revealed to the visitors. The whole homepage
could be divided into three major parts. The first part, shown in figure 1.1 is about
the company’s retail information.
(Figure 1.1) Source: Toyota.com
On the very top center towards right, there is a function bar, (1) which provides
visitors with different information. It shows where visitors are located with the area
zip code. A notebook function provides visitors convenience to take notes about all
the cars they viewed. Also, the link “Certified Used Vehicles” leads visitors who are
looking for used cars to a page where it only contains used cars information. The
“owner” tab gives owners of Toyota cars a place to retrieve more resources about
1
2
3
4

Toyota.com
and for their Toyota cars and also connect with other Toyota owners. When visitors
click into the “Owner” tab, it leads them to a brand new page called “ToyotaOwners”.
There, visitors can check their vehicle profiles, find a local dealer service, service
history and resources about owner community and questions about different
vehicles. Since Spanish is largely spoken besides English, there is also an “Español”
tab, which converts the whole page into Spanish. Lastly, a search tab allows visitors
to search whatever information they want on Toyota’s website. There is the main
dealership tool bar (2) right under the function bar. In this tool bar, visitors can
access and explore more about Toyota vehicles and shopping tools. (Figure 1.2)
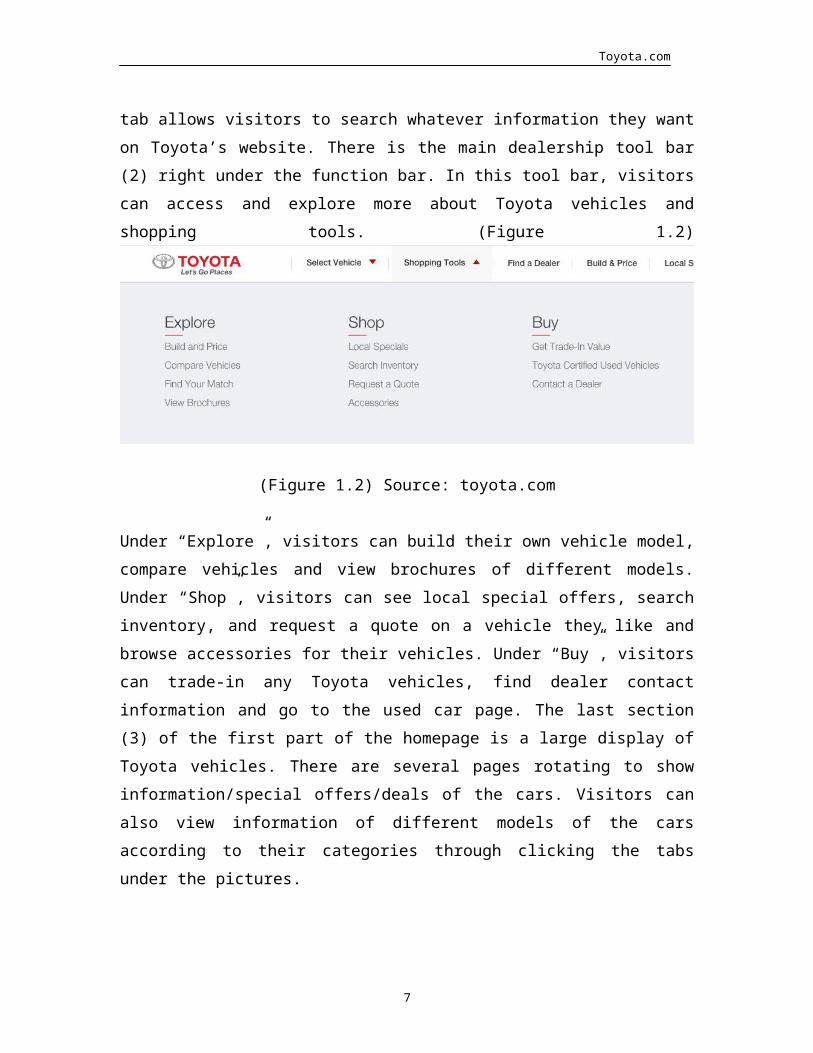
(Figure 1.2) Source: toyota.com
Under “Explore”, visitors can build their own vehicle model, compare vehicles and
view brochures of different models. Under “Shop”, visitors can see local special
offers, search inventory, and request a quote on a vehicle they like and browse
accessories for their vehicles. Under “Buy”, visitors can trade-in any Toyota vehicles,
find dealer contact information and go to the used car page. The last section (3) of
the first part of the homepage is a large display of Toyota vehicles. There are several
pages rotating to show information/special offers/deals of the cars. Visitors can also
view information of different models of the cars according to their categories
through clicking the tabs under the pictures.
5

Toyota.com
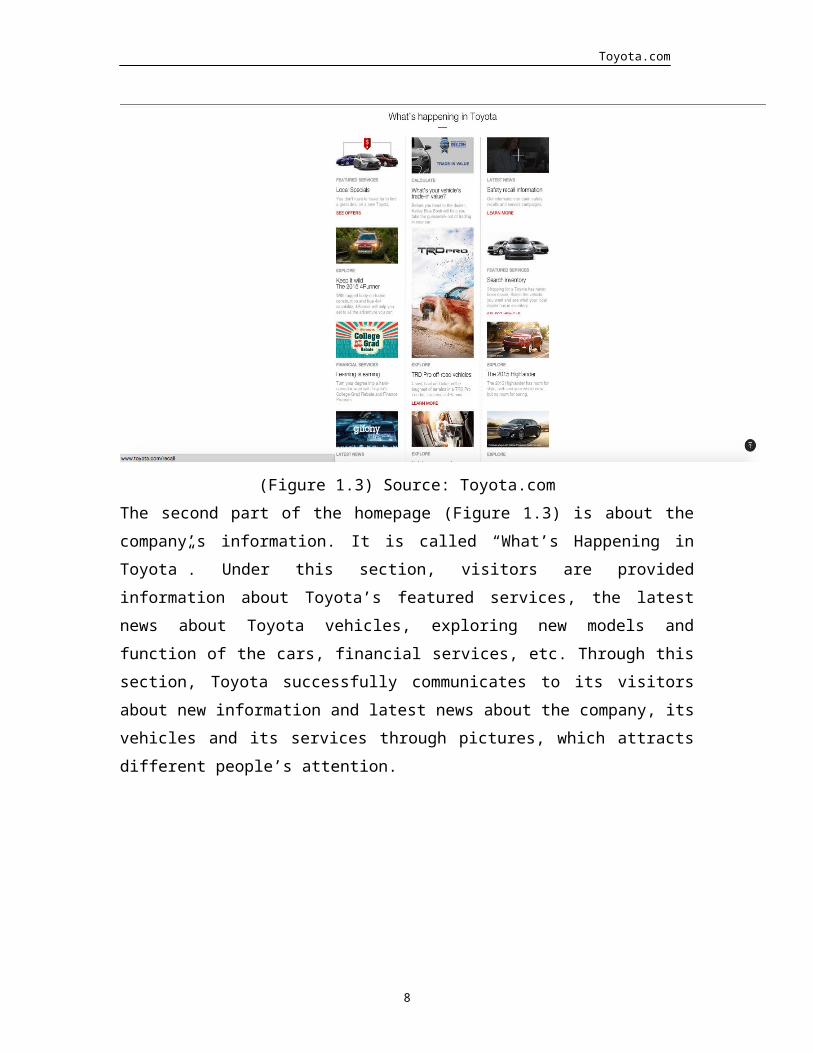
(Figure 1.3) Source: Toyota.com
The second part of the homepage (Figure 1.3) is about the company’s information. It
is called “What’s Happening in Toyota”. Under this section, visitors are provided
information about Toyota’s featured services, the latest news about Toyota vehicles,
exploring new models and function of the cars, financial services, etc. Through this
section, Toyota successfully communicates to its visitors about new information and
latest news about the company, its vehicles and its services through pictures, which
attracts different people’s attention.
6
Toyota.com
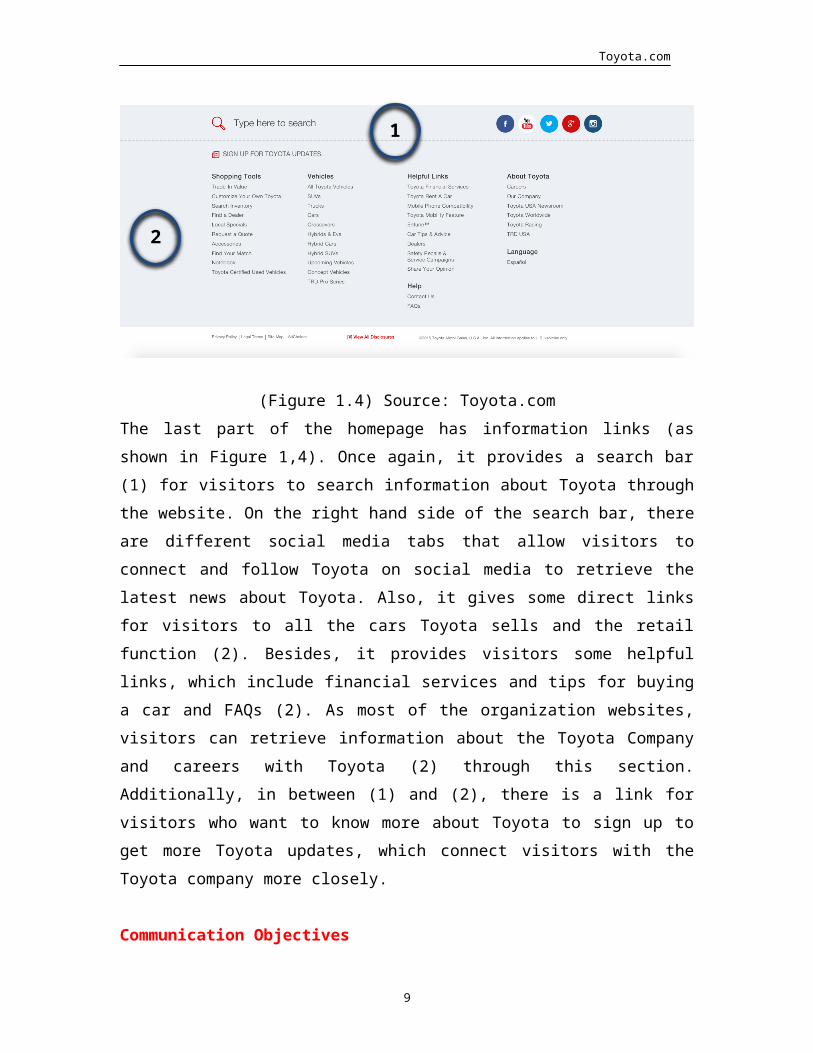
(Figure 1.4) Source: Toyota.com
The last part of the homepage has information links (as shown in Figure 1,4). Once
again, it provides a search bar (1) for visitors to search information about Toyota
through the website. On the right hand side of the search bar, there are different
social media tabs that allow visitors to connect and follow Toyota on social media to
retrieve the latest news about Toyota. Also, it gives some direct links for visitors to
all the cars Toyota sells and the retail function (2). Besides, it provides visitors some
helpful links, which include financial services and tips for buying a car and FAQs (2).
As most of the organization websites, visitors can retrieve information about the
Toyota Company and careers with Toyota (2) through this section. Additionally, in
between (1) and (2), there is a link for visitors who want to know more about Toyota
to sign up to get more Toyota updates, which connect visitors with the Toyota
company more closely.
Communication Objectives
After studying Toyota’s website, there are three communication objectives the
website conveys to its visitors:
Generate the sales and the visit of the local dealers through
comprehensive product information displaying on website and the fun
experience building your own vehicle;
1
2
7
Toyota.com
The key communication objective of toyota.com is to give visitors (potential
customers) comprehensive product information and the fun experience of
building your own vehicle through the website hence bringing the visitors to
local dealers to know more about the cars they have seen on the website and
eventually generate sales of the vehicles and increase the profits for the Toyota
Company.
Increase brand awareness by displaying the latest news and information
about what’s happening in Toyota on homepage;
Toyota also places emphasis on its brand awareness. Through the latest news
and information about what’s happening at Toyota on its homepage, it gives
visitors a broader view of the Toyota Company. Just like the slogan shows under
the Toyota sign on its homepage, “let’s go places”, it conveys a sense of Toyota
being a friend traveling with people rather than just a transportation tool for
people. In addition, the increasing news about engaging in passenger safety,
environment protection and education also shapes people’s awareness of Toyota.
Engage more visitors and strengthen customer relationships to form a
Toyota community worldwide.
According to Toyota Global Mission, “highlighting the mission statement is a
commitment to being a company that customers will choose and will feel good
about having chosen. Toyota has expressed that commitment with the slogan:
‘Rewarded with a smile by exceeding your expectations’.” (toyota-global.com, n.d.,
para. 2) Through providing more tips and advice so that customers will have
more information about their cars and how to take care of them and a place for
car owners to give their thoughts and opinions, Toyota is engaging more visitors
and enhancing customer relationships to form a “family-like” Toyota community
worldwide.
8
Toyota.com
Section II. Organizational Environment & Target Audience
Organizational Environment
In spite of the high labor cost and land cost in the United States, an increasing
number of automotive organizations have opened facilities in the United States.
According to SELECTUSA, “The United States has one of the largest automotive
markets in the world and is home to 13 auto manufacturers”
(selectusa.commerce.gov, n.d., para. 1). SELECTUSA reports that besides Honda and
the big three U.S. auto companies—General Motors, Ford and Chrysler—Toyota,
Nissan, Hyundai-Kia, BMW, Mercedes-Benz, Mazda, Mitsubishi, Subaru and
Volkswagen all have U.S. manufacturing facilities.
However, the development of the automotive industry has not always been smooth.
As described in A 75-Year History of Toyota, “By early 2008, the housing bubble in
the United States had burst, and in September of that year, Lehman Brothers, a
major investment bank deeply involved in subprime loans, collapsed and filed in U.S.
federal court for protection under Chapter 11 of the U.S. Federal Bankruptcy Code…
The credit-market chaos originating in the United States soon expanded into a global
financial crisis” (toyota-global.com, n.d., para. 1). The financial crisis severely
impacted the automobile industry. New-car markets in developed countries rapidly
cooled because of the stricter screening of auto loans in the United States and other
countries, as well as other factors. (toyota-global.com, n.d., para. 2)
Fortunately, “despite challenges within the industry in recent years, the U.S.
automotive sector is at the forefront of innovation” (selectusa.commerce.gov, n.d.,
para. 4). Research and development initiatives are bringing new knowledge into the
industry to help them better respond to challenges and opportunities in the current
market. The rich resources, advanced technology and large customer demand
enables the United States to protect its premier place in the automotive industry.
9
Toyota.com
Marketing Strategy
Toyota, being one of the world largest automotive company and manufacturers, has
been changing and readjusting its marketing strategies in respond to the rapidly
changing market and customers’ demand. As different customers have different
demands according to their social status or financial ability, “Toyota has already
embraced product differentiation as a major strategy in market penetration and the
strategy is working well” (Barcelona, n.d., para 19). In fact, visitors can get a strong
sense of the marketing strategy from Toyota.com through the variety of offers and
product attributes. As UKessays points out, “Toyota has targeted from Economy class
to lower class. Toyota has also developed specific car for middle class people and for
those who love luxury cars like the Lexus. And the Prius for the environmentally
sensitive people.” (ukessays.com. n.d., para. 11)
Toyota not only designs its marketing strategy horizontally, but also vertically. They
implement different marketing strategies within the global, regional, and national
levels according to the data gathered from customer demands and choices within
each of these levels. According to Bhandari (n.d.), Toyota’s analysis is always based
on the condition of market, economy, purchasing capacity, and consumers’ choices.
Based on these factors Toyota is launching its global motorization strategy with
leading-edge technology (p.10. pp. 2).
As modern media has shifted from traditional to digital media, automakers have
begun to notice this trend. According to Beene, “Digital marketing has long
supplemented mainstream advertising on traditional mediums such as television,
print publications and radio. But the explosion of digital media consumption and
mobile access to content has forced automakers to change how they pitch their
products” (para. 2). Toyota has also emphasized the importance of digital media.
They are active on social media sites to connect with people and promote their
products, and they use mobile apps to reach out to customers to provide better
services.
10
Toyota.com
Target Audience
As mentioned in the marketing strategy section, Toyota has various geodemographic
and psychographic market segments. Based on the content of its website, its target
audiences are the following:
Families, students and office workers
The basic models of sedans target students and office workers who need to
commuted daily with comfortable space and economical cost. Minivans target
families who need spacious room to fit the entire family.
Outdoor adventurers
Various crossovers and SUVs target those who like outdoor activities, and may
need a vehicle that can drive under extreme weather and road conditions.
Construction workers
Trucks with large horsepower target construction workers or people who live
in rural areas. They provide everything from large horsepower to high stamina
and spacious room to load.
Environmentalist
According to Toyota Motor Corporation’s 2014 annual report, as Toyota
increasingly focuses on “seeking harmony between people, society and the
global environment as well as the sustainable development of society through
manufacturing,” (p.36) it also targets people who are environmentally friendly.
A series of hybrid sedans and SUVs satisfy the environmentalists’ values.
Audience Profile
As mentioned above, one of Toyota’s target groups is families. According to
Alexa.com, the majority of visitors to the website have children (Figure 2.1).
Moreover, according to figure 2.2, the composition of the visitors’ ages is skewed
11

Toyota.com
towards 55 and older as compared to the average Internet population, although
there is also a good spread amongst visitors of other ages. This indicates that Toyota
is successfully reaching out to and providing information to its target groups.
(Figure 2.1) Source: Alexa
(Figure 2.2) Source: Alexa
Figure 2.3 shows that the percentage of browsing from school locations is extremely
high. It is almost double of the internet average, whereas the percentage of people
browsing from home and work is close to average. It is unclear what causes this
trend; however, it may be related to the observation that Toyota’s website features
many more models of economic and affordable sedans than other car models.
12

Toyota.com
(Figure 2.3) Source: Alexa
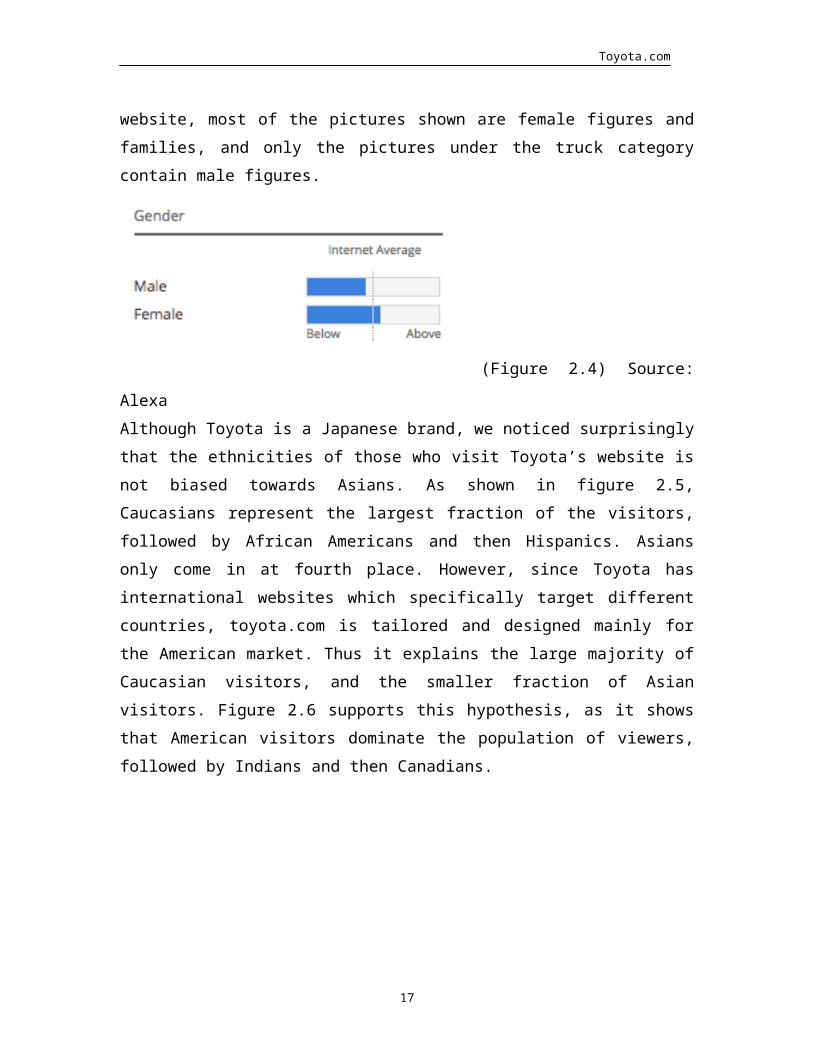
Interestingly, among Toyota’s visitors, the number of females is higher than males
(Figure 2.4). Similar to other Asian automobile brands, Toyota does not emphasize a
masculine image as some American cars brands do. On Toyota’s website, most of the
pictures shown are female figures and families, and only the pictures under the
truck category contain male figures.
(Figure 2.4) Source: Alexa
Although Toyota is a Japanese brand, we noticed surprisingly that the ethnicities of
those who visit Toyota’s website is not biased towards Asians. As shown in figure
2.5, Caucasians represent the largest fraction of the visitors, followed by African
Americans and then Hispanics. Asians only come in at fourth place. However, since
Toyota has international websites which specifically target different countries,
toyota.com is tailored and designed mainly for the American market. Thus it
explains the large majority of Caucasian visitors, and the smaller fraction of Asian
visitors. Figure 2.6 supports this hypothesis, as it shows that American visitors
dominate the population of viewers, followed by Indians and then Canadians.
13
Toyota.com
(Figure 2.5) Source: Alexa
(Figure 2.6) Source: Alexa
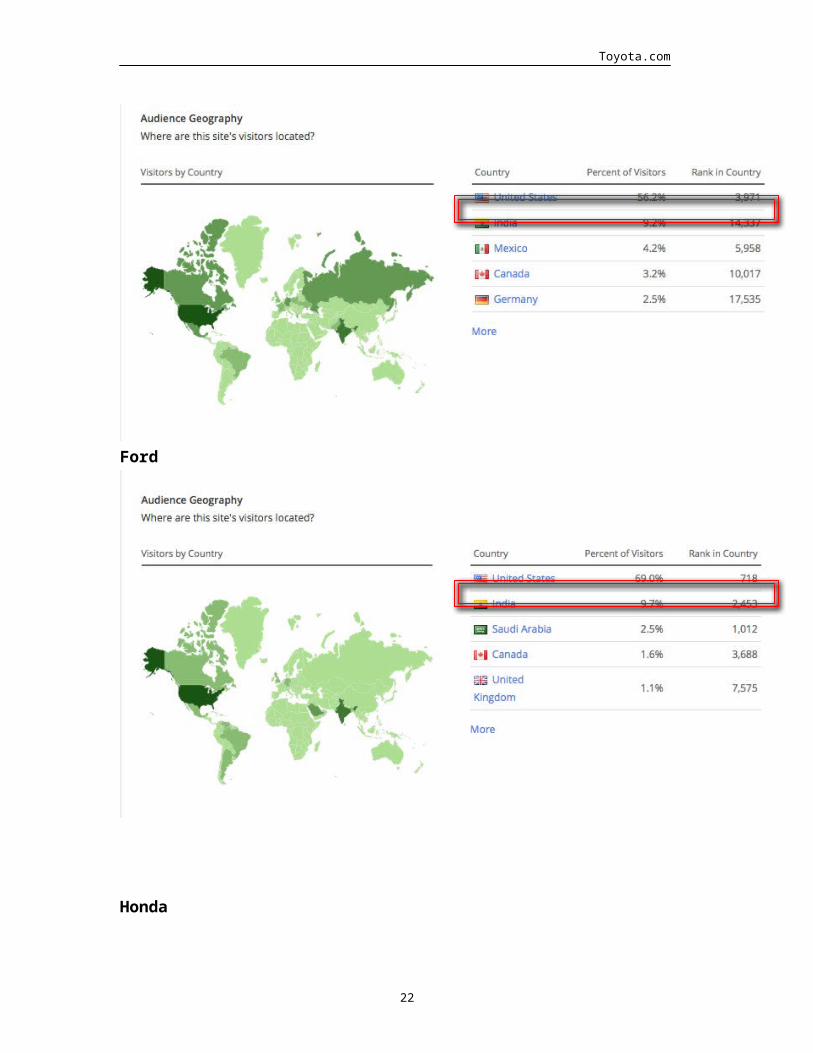
Competitor Audience Profile Comparison
Being the world’s largest automobile manufacturer, Toyota’s main competitors are
General Motor, Ford and Honda. The following figures compare the demographics of
the audience of Toyota to the audiences of these three major competitors.
14

Toyota.com
(Figure 2.7) Source: Alexa
(Figure 2.8) Source: Alexa
(Figure 2.9) Source: Alexa
15

Toyota.com
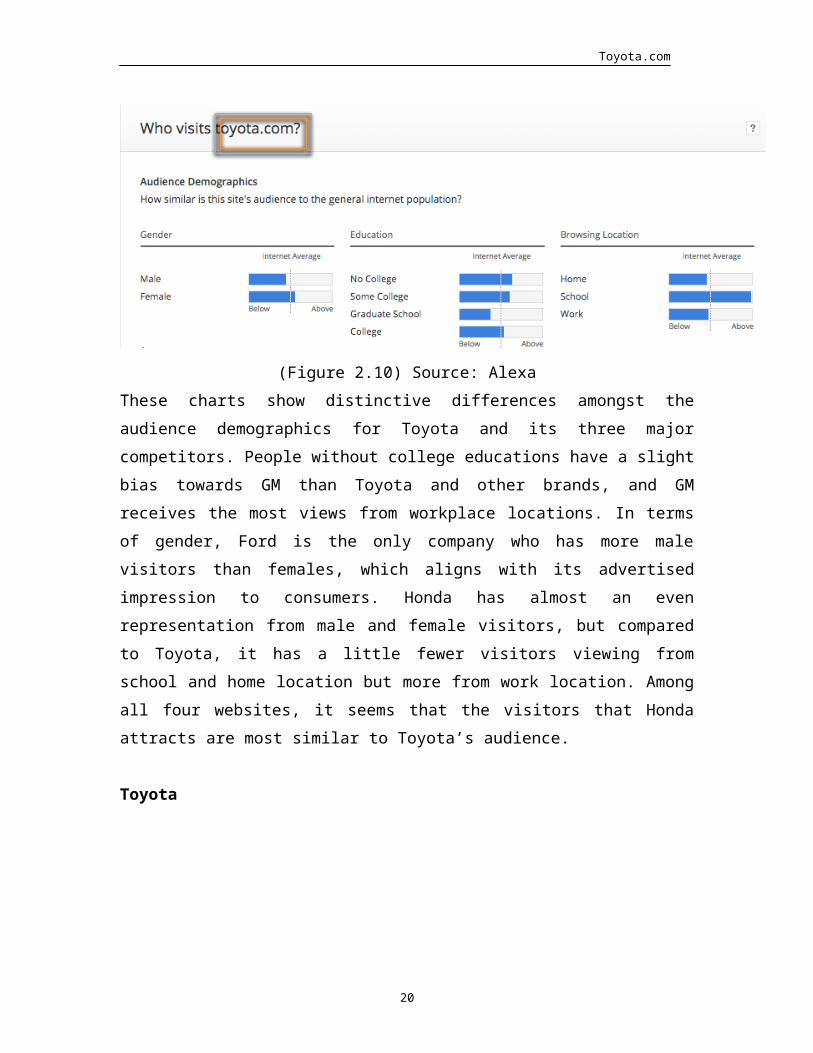
(Figure 2.10) Source: Alexa
These charts show distinctive differences amongst the audience demographics for
Toyota and its three major competitors. People without college educations have a
slight bias towards GM than Toyota and other brands, and GM receives the most
views from workplace locations. In terms of gender, Ford is the only company who
has more male visitors than females, which aligns with its advertised impression to
consumers. Honda has almost an even representation from male and female visitors,
but compared to Toyota, it has a little fewer visitors viewing from school and home
location but more from work location. Among all four websites, it seems that the
visitors that Honda attracts are most similar to Toyota’s audience.
Toyota
16
Toyota.com
GM
17

Toyota.com
Ford
Honda
18

Toyota.com
(Figure 2.11) Source: Alexa
In comparing the audience geography for all four companies (Figure 2.11), although
America ranks first for all four brands, there are still differences in the percentage of
visitors it represents. Toyota has the highest percentage (81.5%) while GM has
56.2%, Ford has 69% and Honda has 78.2%. However, Ford has the highest rank in
country (718) while Honda comes next (797), Toyota the third (1043) and GM the
last (3971). This reveals that although Toyota has a high percentage of visitors in
America, it does not lead to a high ranking in the country. This indicates that Toyota
may need to improve its content quality and richness so that visitors loyalty will
increase.
Section III. Benchmarks
Internal Benchmarks
According to Paine (2011), “A key point to remember about any evaluation program
is that measurement is a comparative tool; to decide if you are successful you
compare your results to something else” (p. 37). In order for Toyota to see whether
19
Toyota.com
or not it is doing better (both internally and externally) this year than the past years,
it is important to compare Toyota’s performance this year to its past performance.
Like Paine says, one of the most effective benchmarks is to compare your company
to its past performance (Paine, 2011).
Toyota’s website serves as a transitional function under retail tabs. Although visitors
can’t purchase any products online, it directs visitors to the nearest dealers to
complete the transaction. Due to this special feature, we use the following key
question to benchmark Toyota internally:
Revenue:
How many customers reach out to dealers through the website?
How many new vehicles are sold through dealers after a person has visited
the website?
How many used vehicles are purchased through dealers after a person has
visited the website?
How many accessories are sold through dealers after a person visited the
website?
Is there any particular model which has a notably high sales increase or
decrease?
These questions help to identify how the website generates revenue, and we
track the results over time to compare performance from quarter to quarter.
Engagement/Awareness
How do visitors connect with Toyota through the social media?
How much time do visitors spend on the website in total?
Which pages are most frequently visited, and to which depth within the
webpage hierarchy do visitors browse to on the website?
Which content on the website receives the most or least clicks?
How many returned visitors versus new visitors?
These questions allow Toyota to understand what content and mediums of
20

Toyota.com
communication (e.g. photos, articles, videos) its customers find most engaging.
Therefore, Toyota can proceed to improve its website strategy in order to
achieve the next levels of engagement, such as increased page views or duration
spent per visit.
External Benchmarks
When it comes to setting external benchmarks, Paine (2011) suggests, “ideally you
would benchmarks against two or three competitors: a stretch goal, a peer company
and an underdog who’s just beginning to nip at your heels” (p. 37). Therefore, in the
following session we will compare Toyota to three other massive car brands (GM,
Ford and Honda) to identify Toyota’s strengths and areas for improvements.
Amongst these competitors, Ford can be considered a stretch goal for Toyota, and
Honda is the peer company. GM is quite interesting; although it is a big automotive
manufacturer, its website is not very well managed or used. In searching for more in-
depth information for external benchmarking, there are two crucial areas: best
practices and competitors.
Best Practices
The following shows a list of best practices for effective and efficient automotive
websites.
Search
According to The Cobalt Group (2010), “a web page’s URL must be unique and
descriptive of the page’s contents to help search engine robots or spiders
understand the purpose of the page, easily index and send referral traffic” (p.4)
If a website’s URL is too long and not descriptive enough, it is difficult for
customers to discover it through searches. In addition, the on-site search
function is also very important for the companies. As Nambiar (n.d.) says, the
search functionality should enable customers to easily navigate the website and
find their desired vehicle (p. 9). The website should provide clear guidance and
directions to the customers step by step as they navigate the website until they
21
Toyota.com
locate the information that they are looking for.
Cost/Model Comparison
After making a decision to buy a car, it takes a customer much time and effort to
browse through and compare different models of cars to eventually reach a
decision. Customers rarely visit the website, choose a model on the first visit,
and decide to buy immediately. Therefore, a good website should have the
functionality to compare cost and models within the same brand and across
different brands. Just as Gifford (2012) says, “Remember, most consumers only
buy a handful of cars in a lifetime, so it’s a very unfamiliar process for most of
your customers—help them understand the process” (para. 6).
Link to Social Media
In the current society, social media is popular and powerful in our everyday life,
and it could also be influential and powerful for automotive websites. On good
website, the links to the major social media sites should be easy to find on each
page. It allows visitors to share what they like about the content in order to
attract more awareness and traffic.
Mobile
As mentioned in the previous point, people need easy access to the trending
news and updates anytime and anywhere. Thus, it is crucial to have a website
that is compatible with a mobile device. Mobile apps will help users not only to
find the information they need, but also to connect with other users to
information and experiences.
Competitors
The following (Figure 3.1) compares the global traffic trends among Toyota and its
three benchmark competitors.
22

Toyota.com
(Figure 3.1) Source: Alexa
All four company’s traffic ranking has remained the same in the past six months,
with Ford ranked the highest, Honda ranked second, Toyota ranked third, and GM
ranked last. Toyota, Ford and GM have relatively small fluctuations in their traffic
within the past six months; only Honda has a growth in traffic starting from April
2015 till now (June 2015).
In comparing the visitor engagement amongst all four company’s websites, we
observe that Toyota has a relatively poor performance in engaging its visitors. Figure
3.2 shows that there are three tiers of visitors bounce rate: Ford is the best, scoring a
26.30% bounce rate, Honda is second best and scores a 30.30% bounce rate, and
Toyota and GM score a similarly around 35% bounce rate. On daily pageviews per
visitor, Toyota scores the lowest of 3.05 pageviews per visitor compares to Ford
(4.21 pageviews), Honda (4.58 pageviews) and GM (4.34 pageviews). Once again,
Toyota (4:53) falls into the third tier with Honda (4:23) when it comes to daily time
23
Toyota.com
on site per visitor, while Ford has 5:54 and GM 6:13. The data tells us toyota.com
doesn’t effectively incentivize its visitors to view more pages and stay longer on the
website for deeper discovery.
(Figure 3.2) Source: Alexa
Functionality Comparison
The following table shows Toyota’s benchmark data in compare with its three
competitors: Ford, Honda and GM.
Toyota Ford Honda GM
24

Toyota.com
Basic Traffic Details (Source: Alexa.com)
Global Traffic Rank 4,467 2,597 3,353 13,065
U.S. Traffic Rank 1,035 718 793 3,894
Bounce Rate 34.50% 26.30% 30.30% 35.80%
Pageviews Per Visitor 3.05 4.21 4.58 4.34
Avg. Time Spent on Site 0:04:53 0:05:34 0:04:23 0:06:13
Basic Website Functions
Navigational Tabs ✔ ✔ ✔ ✔
Various Detailed Product
Information✔ ✔ ✔ ✔
Find A Dealer ✔ ✔ ✔ ✔
Build-Your-Own Car ✔ ✔ ✔ ✔
Request A Quote ✔ ✔ ✔ ✔
Compare Vehicle ✔ ✔ ✔ ✖
Current Offers ✔ ✔ ✔ ✔
Owners Support ✔ ✔ ✔ ✔
Pre-owned Car
Information✔ ✔ ✔ ✔
Search Function ✔ ✔ ✔ ✔
Contact Us ✔ ✔ ✔ ✔
Careers ✔ ✔ ✔ ✔
Site Map ✔ ✔ ✔ ✔
News & Events ✔ ✔ ✔ ✔
Social Media
Facebook,
YouTube,
Twitter,
Google+,
Facebook,
YouTube,
Twitter,
, Vine
Facebook,
YouTube,
Twitter,
Google+,
Instagram,
Vine,
Facebook,
YouTube,
Twitter,
Google+,
25
Toyota.com
Pinterest,
LinkedIn,
Tumblr
Mobile App
Toyota
Owners,
Toyota Entune,
Toyota
Financial
Services,World
Toyota Dealer
App
Ford
Remote
Access,
MyFord
Touch
Guide
HondaLink
Aha, Honda
Accessories
for iPhone,
HondaLink
Navigation,
HondaLink
Connect
GM Careers
News, GM
Dealer
SalesAssistant,
GM Field
Product
Reporter
Although the table shows that there are not many differences between all four
company’s websites, the differences still exist and can be measured by the richness
and how easy they can be reached.
If we focus on the provided tools for compare vehicles on each website, Toyota and
Honda provide more specifications for visitors to compare with, while Ford has less
specification listed. GM, however, is special because it contains many different
brands under the General Motors Company, so the tool or function for comparing
vehicles is not available on GM’s homepage, but must be found in the different
brands’ website homepages.
Ford, Honda and GM have their Owners Support tab easily seen among the main
functional tabs on the homepage, while Toyota has its Owner Support tab on the top
menu bar above the navigation tabs with a much smaller font (Figure 3.3). It is hard
for visitors to find if they don’t pay close attention to it.
26
Toyota.com
(Figure 3.3) Source: Toyota.com
For pre-owned car information, Toyota, Ford and Honda all have their certified pre-
owned car tabs easily found under one of the navigation tabs. However, GM, similar
to the case for the compare vehicles function, does not have such a function on its
homepage. Visitors can get the pre-owned cars information from the different
brands’ website homepages.
All four websites are connecting with their social media sites. Toyota, GM and Honda
all have their social media links on their homepages, but Ford doesn’t show its social
media links on its homepage. Visitors need to click “Ford Social” link (Figure 3.4) on
the bottom to go into its social media page.
(Figure 3.4) Source: Ford.com
27

Toyota.com
Section IV. Key Performance Indicators
Communication
Objective
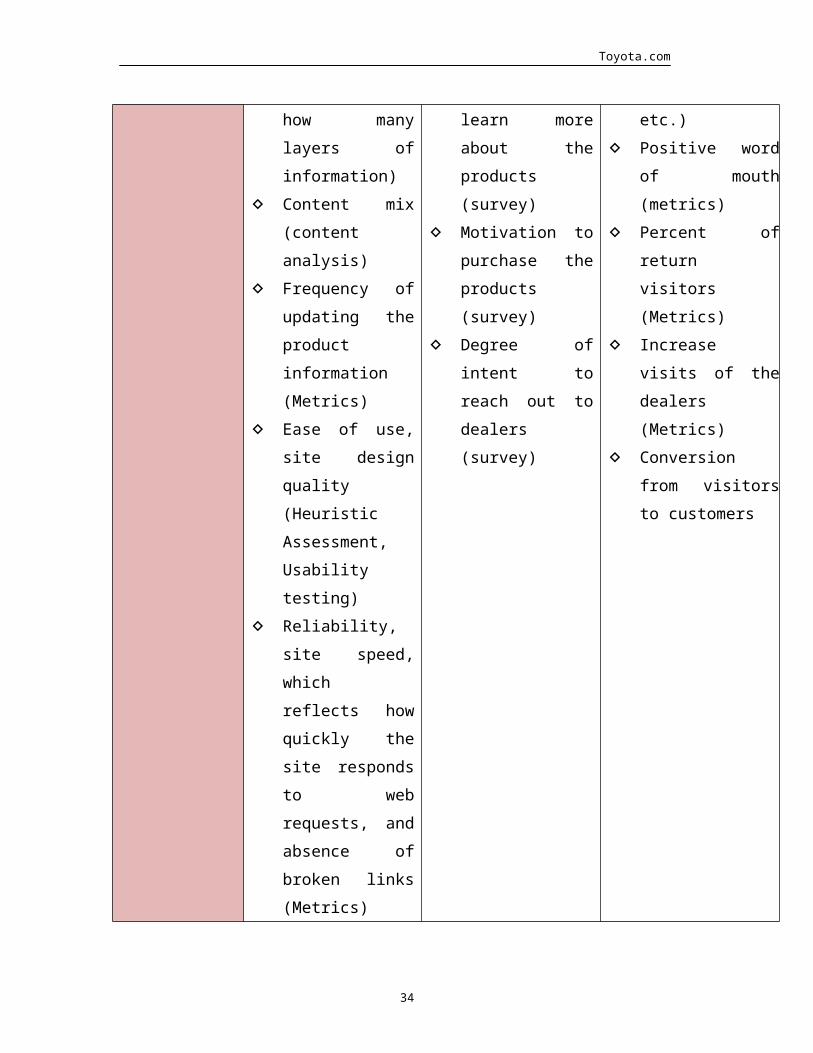
Output KPIs Attitudinal KPIs Behavioral KPIs
Generate the
sales and the
visit of the local
dealers
Quality and the
richness of content
(number of pages,
depth of content-
how many layers
of information)
Content mix
(content analysis)
Frequency of
updating the
product
information
(Metrics)
Ease of use, site
design quality
(Heuristic
Assessment,
Usability testing)
Reliability, site
speed, which
reflects how
quickly the site
responds to web
requests, and
Perceived value of
content (survey,
focus group)
Motivation to learn
more about the
products (survey)
Motivation to
purchase the
products (survey)
Degree of intent to
reach out to
dealers (survey)
More in depth
engagement of
website content
(Metrics such
pageviews, etc.)
Positive word of
mouth (metrics)
Percent of return
visitors (Metrics)
Increase visits of the
dealers (Metrics)
Conversion from
visitors to
customers
28

Toyota.com
absence of broken
links (Metrics)
Increase brand
awareness
Frequency of
company news
post in “What’s
happening in
Toyota” and the
“Newsroom”
(Metrics)
Quality of news
content (number
of pages, depth of
content, links to
external content)
The varieties of
content posted in
“What’s happening
in Toyota” and the
“Newsroom”
(content analysis)
Strength of brand
identity (Heuristic
Assessment)
Perceived strength
of brand
awareness (survey,
focus group)
Degree of the
knowledge of the
brand (survey,
focus group)
Level of preference
toward the brand
(survey, focus
group)
Degree of
motivation to read
“What’s happening
in Toyota” and the
“Newsroom”
regularly (survey)
Percent increase of
new visitors
(Metrics)
Percent of
returning visitors
(Metrics)
More clicks into
“What’s happening
in Toyota” and the
“Newsroom”
(Metrics)
Engage more
visitors and
strengthen
customer
relationships
Variety and quality
of personalizing
experience
(Heuristic
Assessment)
Quality of content
Degree of
satisfaction to get
to know more
about personalize
products (surveys)
Perceived the
More pageviews of
build your own car
on website
(Metric)
Percent increase of
pageviews and
29

Toyota.com
of social media
sites (Heuristic
Assessment,
Metrics)
Quality of content
under “Owner”
page (content
analysis, Heuristic
Assessment)
Quality of owner
service (Heuristic
Assessment)
interest to be
engaged through
social media
(survey, focus
group)
Degree of
motivation to
continue to use
Toyota products
(survey)
Perceived the
interest to
recommend the
service to friends
(survey)
followers of the
social media sites
(Metric)
Percent increase of
return visitors of
the “Owner” page
Percent increase of
“referred” visitors
KPI Rationale
In order to derive the KPIs, I followed what Paine suggested in her book: select a
communication vehicle, identify business objectives, identify target audience, and
determine the benchmarks (Paine, 2011). As we know, the website is just a tool
which Toyota Motor Corporation uses to communicate with its customers and the
world, but it is also very critical what role the website plays in attracting more
traffic, engaging more visitors and eventually generating revenue for the company.
Therefore, measuring how the website helps to support the communication
objective is important.
Paine (2011) also suggests, “Because you become what you measure, it is critical to
carefully choose the metrics by which you will track your success. Presumably, the
KPIs you select are the most important metrics for you organization” (p. 87).
30

Toyota.com
Therefore, each KPI is chosen carefully based on Toyota website’s communication
objectives. After I gathered a pool of KPIs, I filtered some that are not relevant to the
company communication objectives.
Also, KPIs are interrelated with one another. The output KPIs, which are the
activities that a website has, are tools that a company uses to achieve attitudinal
KPIs, which are the reactions and feelings people have feeling when they visit the
website. The goal is to generate the behavioral KPIs, which are the call of action,
through the attitudinal KPIs. The KPI table above reveals this interrelationship.
Eventually, through the chosen KPIs, Toyota will understand how effectively and
efficiently its website supports the company communication objectives and
marketing strategy. They will also indicate the areas Toyota should invest money to
improve. Additionally, it will guide the company’s future business path and decision-
making process.
Section V. Measurement Tools and Key Data
There are two measurement tools designed and deployed to assess Toyota’s website
and to help us better understand the strengths and weaknesses of it. One of them is
heuristic assessment and the other is survey.
Heuristic Assessment
A heuristic assessment was created and deployed to compare and analyze Toyota’s
website against three of its major competitors, Ford, Honda and GM. The heuristic
assessment was mainly focus on three output KPIs, ease of use, strength of brand
identity and quality of content under owner page. Each question was ranked on a
scale from 1 to 5 with 1 being the least effective and 5 being the most effective.
Therefore, the possible maximum score would be 50. The heuristic assessment with
results can be found in Appendix A.
31

Toyota.com
The following graphic (figure 5.1) reveals the grand score of each company’s website
that we got from the heuristic assessment. From the graphic we see that Toyota got
the highest score (48) among all four companies following by Ford (47), Honda (45)
and GM (42).
Toyota Ford Honda GM0
10
20
30
40
50
48 4745
42
Heuristic Assessment Result
(Figure 5.1)
The graphic (figure 5.2) below depicts the result details of heuristic assessment for
each criterion. Through this break down, it clearly reveals the strengths and
deficiencies of each company website after the comparison.
At a brief review of the graphic, there are couples of message stand out. First, across
all four companies, Toyota’s website is the most effective overall while Ford is not far
away from it. Second, Ford and GM perform really strong in getting feedback. Both of
the websites provides live chat with their specialists. Third, Toyota and GM are doing
well in posting up-to-date news, though Toyota and Ford have the direct access to
32

Toyota.com
the news section on their homepage. Lastly, Asian companies (Toyota and Honda)
are doing better in the interaction with customers (community function) compare to
American companies (Ford and GM).
Navigation Clarity
Product Search
Feedback
News Update Frequency
News Preview
Variety of Engagement Methods
Joining Membership
Owner Resources
Owned Car Information
Community
0 1 2 3 4 5 6
Heuristic Assessment Result Details
GMHondaFordToyota
Note: 0 being the least effective and 5 being the most effective
Figure 5.2
Survey
The second measurement tool that selected was survey questions. It was created
and launched through Survey Monkey. While we discussed the differences between
the websites of all four companies in heuristic assessment, this survey was focus on
the attitudinal KPIs. In the survey, questions were asked from mostly four areas of
attitudinal KIPs, they are perceived value of content, degree of intent to reach out to
dealers, degree of motivation to read “What’s happening in Toyota” and the
“Newsroom” regularly and perceived the interest to use the engagement methods—
33
Toyota.com
social media. The survey questions can be found in appendix B and the survey
results can be found in appendix C.
Hoping to get a broader view from both car owner and people without a car of how
the website is helping them to find the information they want. I distributed the
survey to ten people with four car owners and six people who don’t have a car. All of
them are graduate students between the ages of 24 to 33.
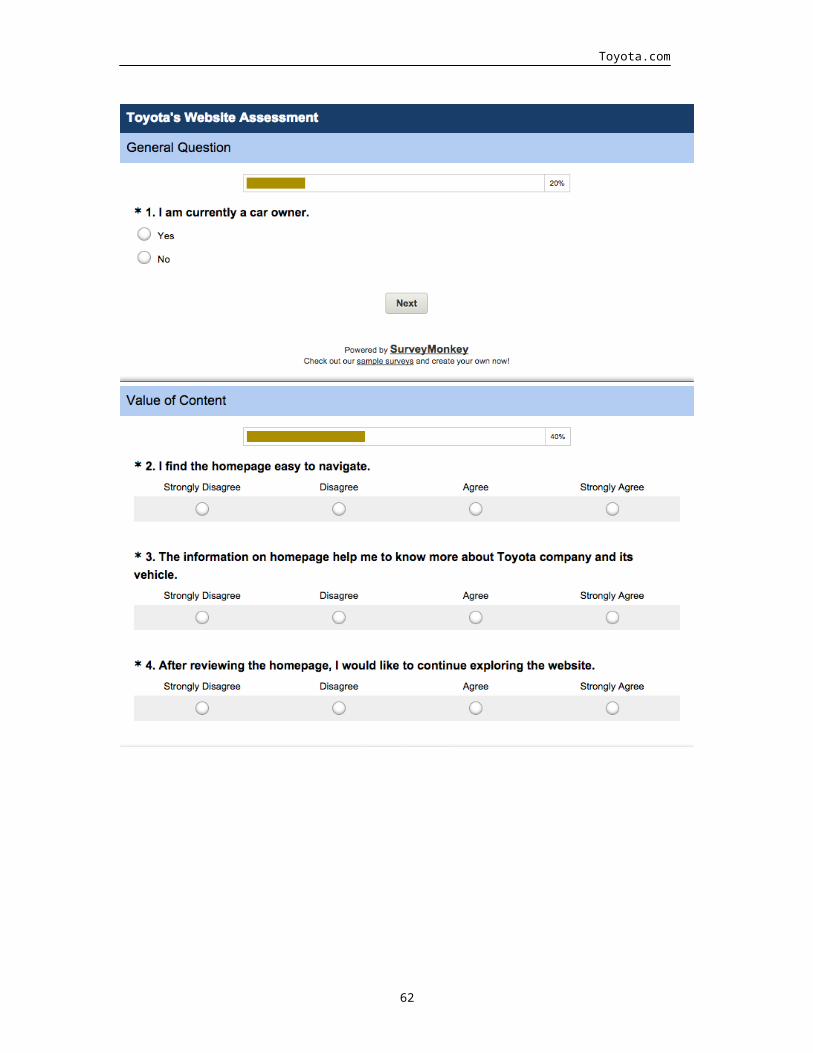
The survey was designed with eleven questions including one yes or no question,
nine rating scale questions (four levels of agreement) and one Likert scale question
(five point scale). The purpose of all eleven questions is to get an all-round view of
the survey takers and understand how people in different status view Toyota’s
website.
The beginning question was a yes or no question. It mainly helps us to understand
the ratio of car owner and people don’t have a car among the survey takers. Also, it
will provide more information for us later when we look into the specific
preferences of two different groups of people. Next, I started to ask questions that
related to the four attitudinal KPIs I chose. I asked three questions regarding the
value of content. First I asked whether the homepage was easy to navigate, while all
of the answers were positive. Then, based on the content on the homepage, I asked
people if the content on the homepage provide them information about the company
and the vehicles and whether or not people would stay on the website and continue
to browse it. Most of the answers of those two questions were positive too. (Figure
5.3)
Strongly
Disagree
Disagree Agree Strongly Agree
Ease of Use 0 0 7 3
Information 0 2 4 4
34

Toyota.com
Helpful
Stay on the
Website
0 1 7 2
(Figure 5.3)
Next, I asked about questions regarding to how the website is helping visitors to find
a local dealer. The results of these two questions, as it’s shown in figure 5.4, indicate
that about 80% of the survey takers are motivated to talk to a dealer after browsing
the website and the website helps them to locate a dealer accurately.
Strongly
Disagree
Disagree Agree Strongly Agree
Motivated to
Talk to a
Dealer
0 2 8 0
Find a Dealer
Easily
0 2 5 3
(Figure 5.4)
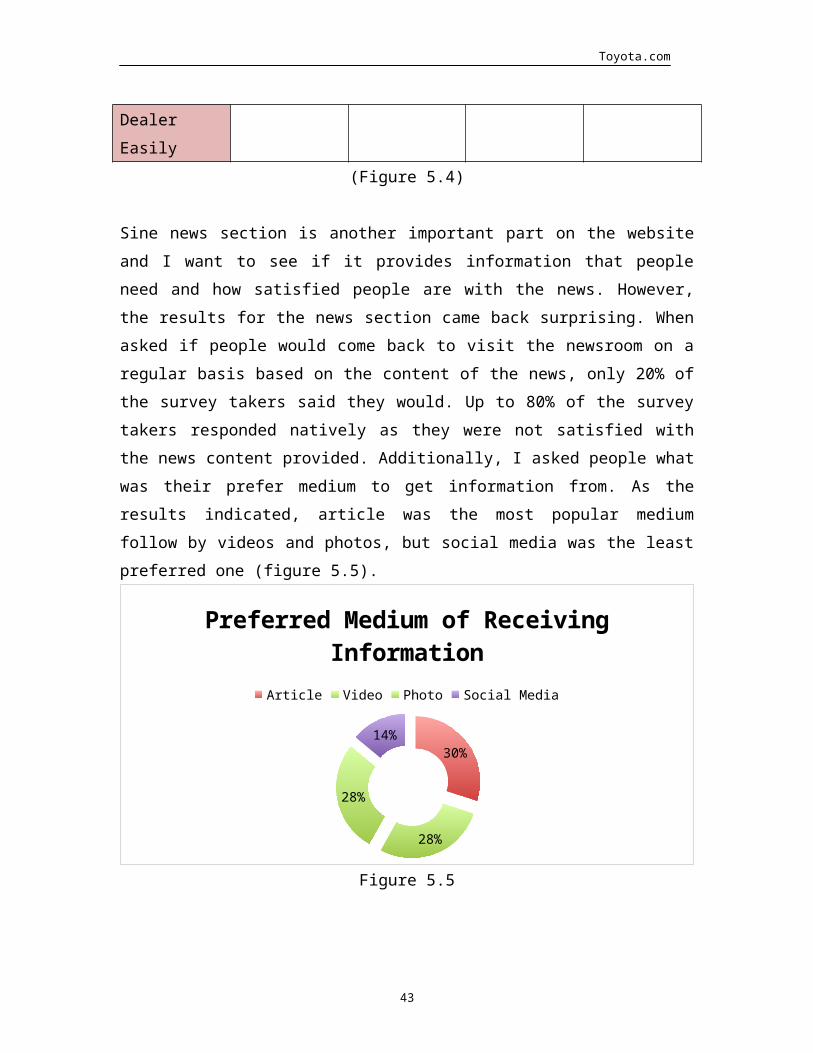
Sine news section is another important part on the website and I want to see if it
provides information that people need and how satisfied people are with the news.
However, the results for the news section came back surprising. When asked if
people would come back to visit the newsroom on a regular basis based on the
content of the news, only 20% of the survey takers said they would. Up to 80% of
the survey takers responded natively as they were not satisfied with the news
content provided. Additionally, I asked people what was their prefer medium to get
information from. As the results indicated, article was the most popular medium
follow by videos and photos, but social media was the least preferred one (figure
5.5).
35

Toyota.com
30%
28%
28%
14%
Preferred Medium of Receiving Infor-mation
Article Video Photo Social Media
Figure 5.5
Finally, trying to understand how the website is engaging visitors, I asked two
questions regarding the social media sites and one question regarding the
willingness to spread the word. As figure 5.6 indicates, although it is simple and
clear for people to connect with the company’s social media sites, the content are
not appealing enough for most of the visitors.
Strongly
Disagree
Disagree Agree Strongly Agree
Easy to
Connect
0 2 7 1
Content being
helpful
1 3 4 2
Figure 5.6
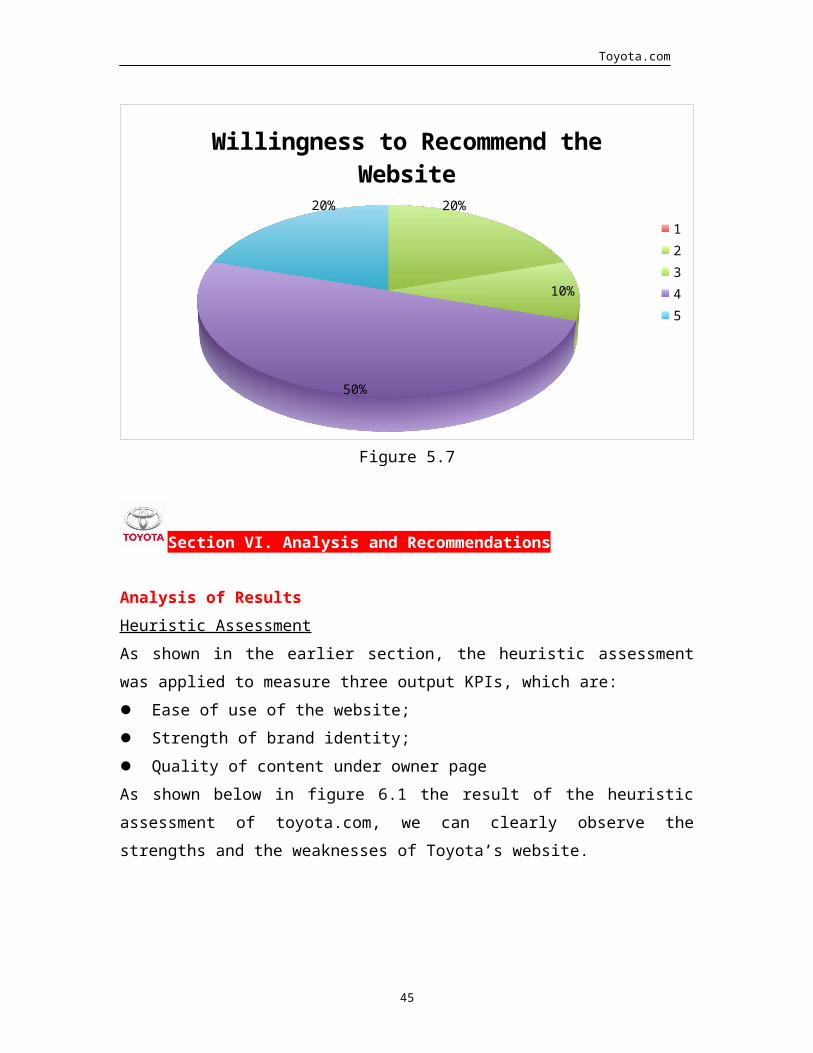
Also, regarding the willingness of recommend the website to their friends, 80% of
people said they were willing to do so which tells us people are overall satisfied with
the website. (Figure 5.7)
36

Toyota.com
20%
10%
50%
20%
Willingness to Recommend the Website
12345
Figure 5.7
Section VI. Analysis and Recommendations
Analysis of Results
Heuristic Assessment
As shown in the earlier section, the heuristic assessment was applied to measure
three output KPIs, which are:
Ease of use of the website;
Strength of brand identity;
Quality of content under owner page
As shown below in figure 6.1 the result of the heuristic assessment of toyota.com, we
can clearly observe the strengths and the weaknesses of Toyota’s website.
37

Toyota.com
Navigation
Product Information
Feedback
News Update
News Summary
Ways to Connect
Easy to Sign Up
Resources
Car Information
Community
0
5
toyota.com Heuristic Assessment Result
Score
Figure 6.1
As the graphic above indicates, Toyota’s website is performing well in most of the
areas. Particularly, the website is performing strongly in navigation and product
information (KPI: ease of use). The homepage is very simple with clear tabs for
visitor to explore. Under the selecting vehicle tab, there is very detailed and rich
information and specification regarding all the vehicle models. Besides, according to
the heuristic assessment, Toyota is doing a good job on news updating and
presenting summaries on the homepage (KPI: strength of brand identity). It also
gives clear instructions for people to connect to its social media sites on their
homepage. Moreover, on their owner page, a great variety of resources, up-to-date
car information and strong owners community (KPI: quality of content under owner
page) are provided for Toyota owners so that they can stay on top of the latest
trends and keep track on their vehicles.
While most areas of the website seems have strong performing, there are still some
areas where the website falls short of. For instance, Toyota’s website does provide an
effective and clear channel on its homepage for visitors to give feedback (KPI: ease
38

Toyota.com
of use). Unlike some of its competitors have a feedback link on their homepage
where visitors can click and leave their feedback and comments; visitors can only
get the contact information under contact us to write Toyota emails or give them
calls to leave feedback. Toyota also falls short of the convenience and clarity for
people to sign up as owners (KPI: quality of content under owner page). While most
of it’s competitors give comprehensive instructions and description on what are
some benefits one can get once he signed up became an owner, Toyota only provides
three short description about three basic functionalities one can enjoy as an Toyota
owner.
Survey
Similarly, as shown in the earlier section, the survey was designed and applied to
measure four attitudinal KPIs, which are:
Perceived value of content;
Degree of intent to reach out to dealers;
Degree of motivation to read “What’s happening in Toyota” and “newsroom”
regularly;
Perceived the interest to use the engagement methods—social media
Through the survey questions, we got two different groups of people’s opinions--one
group with people who have a car and the other do not. We will look at two different
groups of people’s opinion in the following since their focuses might be different.
Among the total four car owners, regarding the KPI perceived value of content, a
large number of them agree that the homepage is easy to navigate (100%), it
provides clear information of all car models (75%), and they would like to continue
exploring the website (100%). Also, regarding the KPI degree of intent to reach out
to dealers, each single one of the car owners (100%) say they are motivated to talk
to a dealer after browsing the car selections on the website. Most of them (75%)
agree that find a deal function helps them locate a nearby dealer smoothly. However,
regarding the KPI degree of motivation to read “What’s happening in Toyota” and
39

Toyota.com
“newsroom” regularly, up to 75% of people say they would not return to the news
section based on the content. Nevertheless, regarding the KPI perceived the interest
to use the engagement methods—social media, 75% of the car owners agree that the
ways to connect to Toyota’s social media sites are simple and clear, although only
50% of them find the content related and helpful. In the end, 75% of the car owners
say they will recommend the website to their friends.
Interestingly, the result of non-car owners came out a little different. Regarding the
KPI perceived value of content, similar to the car owners, most of the non-car
owners agree that the homepage is easy to navigate (100%), it provides clear
information of all car models (84%), and they would continue exploring the website
(84%). Regarding the KPI degree of intent to reach out to dealers, although 84% of
people agree that find a dealer tab helps them locate the dealer easily, only 66% of
people feel motivated to talk to a dealer after browsing the website. Regarding the
KPI degree of motivation to read “What’s happening in Toyota” and “newsroom”
regularly, compare to the car owners result, the result of non-car owners about their
opinion about the news section is even worse. It shows up to 84% of people
wouldn’t return to the news section based on the content. Additionally, regarding
the KPI perceived the interest to use the engagement methods—social media, 84%
of people think it is easy and simple to connect with Toyota on social media and 66%
of them find the content related and helpful. In the end, 84% of the non-car owners
say they will recommend the website to their friends.
Key Findings
According to the analysis of the heuristic assessment and the survey, there are a
number of key findings I find important:
Although Toyota’s website is pretty impressive, it still lack of a more effective
way to communicate with its visitors/customers and lack of feedback channel.
Interestingly, its other Asian competitor Honda also doesn’t do well on
providing a feedback channel. Ford and GM are performing strongly on
40

Toyota.com
feedback providing;
It’s important that Toyota is doing a good job in presenting its vehicles to
people. The presentation is very clear with full specifications so that visitors
will learn about its products in their first visit;
One thing we are sure is Toyota’s section fails in conveying appealing news
updates to visitors. A large number of both car owners and non-car owners are
dissatisfied with the content provided in the news section. Although,
interestingly, the updates of news section is very spontaneous. It seems like the
contents are not appealing enough;
Similar to the news section, Toyota’s social media sites are not very well
connecting with its visitors/customers. There are still 40% of the survey takers
not content with the information provided on the social media sites, though the
contents of its social media sites have a great variety;
Toyota is doing great in building a community for Toyota owners with various
information and resources provided to the owners. It is not only just Toyota’s
website, but also on the mobile apps. Customers can enjoy a comprehensive
service through the owner page or on their smartphones.
Recommendation
After studying and assessing Toyota’s website for almost 6 weeks, I have to admit
that Toyota does a good job on building its communication vehicle. However, there is
still room for improvement:
Provide feedback channel
Toyota should provide an effective feedback channel other than emails and calls
41

Toyota.com
through contact us. An individual feedback link will give visitors or customers
to provide their thoughts and opinions regarding the website content, design,
etc.
Make owner page link more obvious on homepage
Owner page is a vital functional page for Toyota. With the good content
provided inside, it deserves a better and more obvious location on Toyota’s
homepage. Currently the homepage link locates on the top right of the
homepage with a much smaller size. I would suggest to move it to the main tool
bar (see in figure 1.1) with a bigger size as most of Toyota’s competitors do.②
Improve the richness and variety of news content to make it more appealing
The dissatisfaction of the news content is the biggest shortcoming of Toyota’s
website throughout the assessment. Visitors/customers are not willing to
return to the news section based on the current content. Toyota should come up
with more appealing news that connect itself and the visitors more effectively.
Improve the content on its social media sites
Similar to the problem of Toyota’s news section, visitors’ reaction to Toyota’s
social media is also not the most positive. Toyota should find a way to connect
to its visitors/customers more effectively. Also, from survey question #8, social
media is the least preferred medium people would use to retrieve information
from when they go on Toyota’s website. I think Toyota needs to raise their
emphasis on using social media as well as improve the content on its social
media sites since social media plays an important role in the modern world
today.
Section VII. Dashboard Visuals
42
Toyota.com
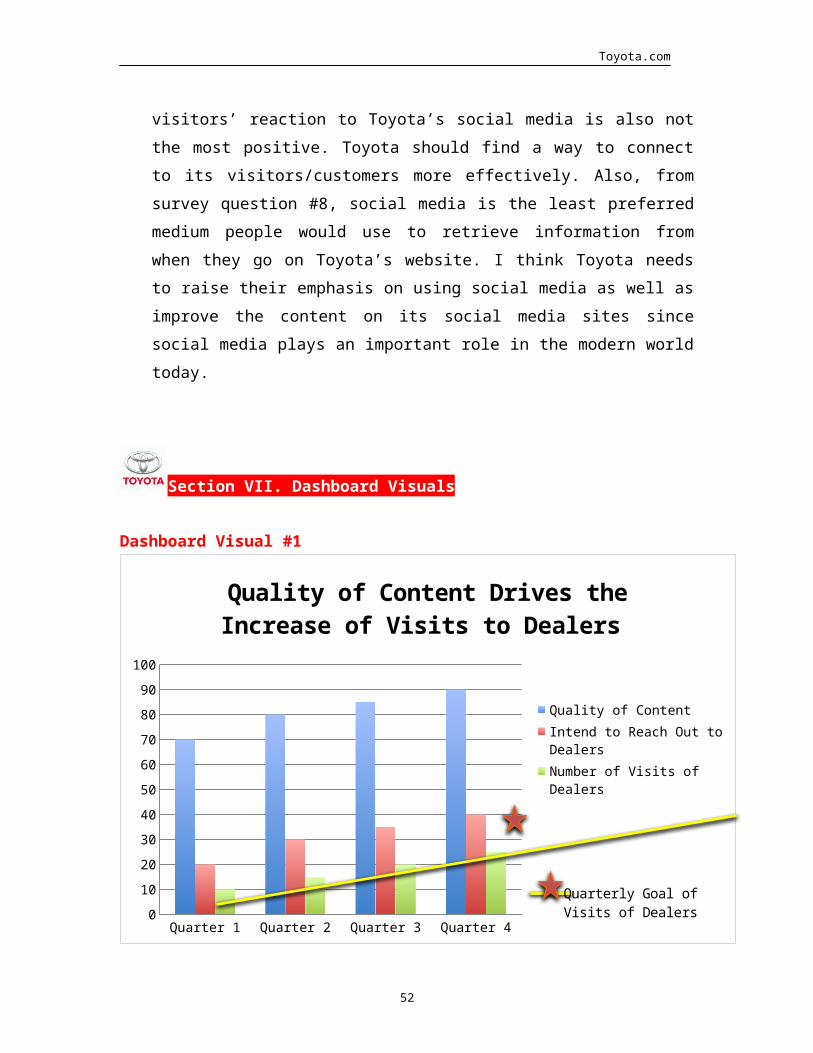
Dashboard Visual #1
Quarter 1 Quarter 2 Quarter 3 Quarter 40
10
20
30
40
50
60
70
80
90
100
Quality of Content Drives the Increase of Visits to Dealers
Quality of ContentIntend to Reach Out to DealersNumber of Visits of Dealers
Quarterly Goal of Visits of Dealers
Figure 7.1
Rationale
Since the first communication objective of Toyota’s website is to generate the sales
and the visits of local dealers, I think it is important to study how the quality of the
web content drives the interest of visitors to visit local dealers and eventually raises
the actual visits of local dealers.
This dashboard, taken one output KPI (the quality of the web content), one
attitudinal KPI (Intend to reach out to dealers) and one behavioral KPI (visits of
local dealers), illustrates the relationship between the quality of the web content
and the intention to reach out to dealers. In addition, it also shows the relationship
between the intention to reach out to dealers and the actual visits of the local
dealers. The higher quality and more related the website content is, the more
visitors will find the information they want and they will reach out to a dealer. These
43

Toyota.com
three KPIs were chosen because they were very important in helping generate the
sales potentially.
From figure 7.1 we know the quality of the web content is increasing each quarter. It
drives the increase of the intention to reach out to dealers. Furthermore, it increases
the actual visits of the local dealers. However, there is still a little gap to reach the
goal of actual visits. Therefore, Toyota can continue to improve the ease of use of its
website so that.
Dashboard Visual #2
Quarter 1 Quarter 2 Quarter 3 Quarter 40
10
20
30
40
50
60
70
80
90
The Quality of Social Media Posts Drives Number Increase of Followers
Quality of Posts on Social Media SitesPerception of Interest to Engage in Social MediaNumber Increase of Followers
Quarterly Goal of Followers Increase
Figure 7.2
Rationale
One of the important elements to determine whether a website is successful or not
these days is the effectiveness of its social media sites. Toyota also knows how
important its social media means to increase the visitor engagement. As it’s Toyota’s
last communication objective, I figured how to engage visitor through social media
and its relationship with social media posts would be worthy studying.
44
Toyota.com
This dashboard demonstrates the relationship between the quality of content on
social media sites and the percent increase of followers on its social media sites.
Also, there is a benchmark of the goal of percent of followers increase. I set the
timeline as quarterly since it will help Toyota to make immediate adjustments if
there is any problem. In general, quality of content of social media sites (output KPI)
will not change too much, and the interest of engagement (attitudinal KPI) would
just follow the trend of quality of social media content. Moreover, the interest of
engagement could directly influence the actual percent increase of followers
(behavioral KPI). Percent increase of followers is something that Toyota needs to
keep track with since it might bring more potential customers.
As we can see in figure 7.2, the quality of content of Toyota’s social media sites
increases every quarter, and the interest of visitors to engage in social media also
increases steadily follow with the content increase. Therefore, the percent of
increase of followers increases steadily every quarter. Though it still does not meet
the goal of the increase rate.
References
75 Years of Toyota. (n.d.). Taking on the Automotive Business. Retrieved from:
45

Toyota.com
http://www.toyota-global.com/company/history_of_toyota/75years/text/
taking_on_the_automotive_business/chapter2/section2/item5_a.html
75 Years of Toyota. (n.d.). Current Conditions. Retrieved from: http://www.toyota-
global.com/company/history_of_toyota/75years/data/conditions/
philosophy/globalvision.html
Alexa. (n.d.). Retrieved from: http://www.alexa.com/siteinfo/toyota.com
Barcelona. J. (n.d.). Marketing Plan For Toyota Motor Company. Academia.edu.
Retrieved from:
http://www.academia.edu/4784977/Running_Head_MARKETING_PLAN_FOR_
TOYOTA_MOTOR_COMPANY
Beene, R. (2014, January 14). “Digital first” is now automaker marketing execs’
mantra. Automotive News. Retrieved from:
http://www.autonews.com/article/20140114/OEM09/140119776/digital-
first-is-now-automaker-marketing-execs-mantra
Bhandari. S. (n.d.). An Analysis of Toyota’s Marketing Strategy. Retrieved from:
http://poseidon01.ssrn.com/delivery.php?
ID=1331130850740661270961200691050181120060640560580690291040
0402211911000411202911306709803301910102212201012409107408906
9097114059052014001081102122031066075125110058006051092103026
0971270910031020750110970811090650171210670091171210260070240
89103&EXT=pdf&TYPE=2
Gifford, G. (2012, November 20). 4 Content Ideas for Your Car Dealer Website.
Retrieved June 5, 2015, from: http://www.autorevo.com/blog/4-content-ideas-
for-your-car-dealer-website/
46

Toyota.com
Nambiar.R. (n.d.). Auto Industry Website Practice Research. Retrieved from:
http://www.slideshare.net/rahulnambiar/best-practices-in-for-auto-industry-
websites
Paine, K. D. (2011). Measure What Matters: Online Tools for Understanding Customers,
Social Media, Engagement, and Key Relationship. Hoboken, NJ: John Wiley &
Sons, Inc.
SELECTUSA. (n.d.). The Automotive Industry in the United States. Retrieved from:
http://selectusa.commerce.gov/industry-snapshots/automotive-industry-
united-states
The Cobalt Group. (October 2010). Trend Brief: SEO 101 and Best Practices in the
Automotive Industry. Retrieved from:
http://www.cdkglobaldigitalmarketing.com/pdf/SEO%20101%20and%20Best
%20Practices.pdf
Toyota. (n.d.). Retrieved from:
http://www.toyota.com/usa/ourstory/articles/morethan_greatcars_trucks.htm
l
Toyota Motor Corporation. (n.d.). Annual Report 2014. Retrieved June 4, 2015, from:
http://www.toyota-global.com/investors/ir_library/annual/pdf/2014/
ar14_e.pdf
UKessays. (n.d.) The Toyota Marketing Strategy Marketing Essay. UKessays. Retrieved
from: http://www.ukessays.com/essays/marketing/the-toyota-marketing-
strategy-marketing-essay.php
47
Toyota.com
Appendix
Appendix A: Heuristic Assessment
Note: each item was ranked on a scale of 1 to 5 with 1 being the least effective and 5
being the most effective.
48

Toyota.com
Toyota Ford Honda GM
1. Navigation is simple and clear.
Navigation labels are clear, consistent, and
intuitive. Navigation options are always in the
same way and same place on different pages.
5 5 5 4
2. Product information can be searched for
effectively by various means.
The range of search methods includes a sitemap,
directory and other search function with clear
descriptions.
5 5 5 5
3. The website provides various ways to receive
feedback and to be reached.
There are multiple ways for people to interact
with the organization, such as contact us, site
feedback, FAQs, etc.
4 5 4 5
4. There are several recent news posted in news
section.
There are several news posted within a month
regarding the company’s new products and new
innovations.
5 4 3 5
5. The website homepage provides a summarize
section for the news.
There is a section on homepage where visitors
can get a preview of what’s happening within the
organization.
5 5 4 3
6. The website provides multiple ways for people to
connect with the organization.
There are multiple ways, such as Facebook,
Twitter, etc. on the homepage where visitors can
5 4 5 5
49

Toyota.com
connect with the organization.
7. The sign up/join process is simple and clear.
Each step of creating an account and joining the
community is very clear for new customers.
4 5 4 3
8. The owner page provides numerous links to
resources that might be of interest to Toyota
owners.
There are various resources of which car owners
can be beneficial of, such as safety service,
warranty, etc.
5 5 5 4
9. The owner page provides owners all information
about their cars.
Car owners can keep track about the history of
their cars. They are provides information also
regarding how-to with their vehicles.
5 5 5 4
10. The owner page provides a community for
owners to interact with one another.
Owners can share their resources, questions and
tips with each other.
5 4 5 3
Total 48 47 45 42
Appendix B: Survey Questions
50
Toyota.com
51
Toyota.com
52

Toyota.com
53

Toyota.com
Appendix C: Survey Results
54

Toyota.com
55
Toyota.com
56
Toyota.com
57

Toyota.com
58

Toyota.com
59

Toyota.com
60

Toyota.com
61
Toyota.com
62

Toyota.com
63

Toyota.com
64