tpo board. 25-year planning horizon update lrtp every 5 years identify needed major improvements...
TRANSCRIPT

TPO Board
2040 Long Range Transportation Plan
for River to Sea Transportation Planning Organization
November 25, 2014

2040 Long Range Plan
• 25-Year Planning Horizon• Update LRTP every 5 years• Identify needed major improvements• Determine those that are “cost feasible”
(i.e., highest priority for expected funds)• Preserve and maintain prior investments• Transportation Improvement Program (TIP)
must be fully funded
Needed Projects
Available Funds

Methodology
Revenue Forecasts were calculated in accordance with the...

Revenue Forecasting Process
Adopted Cost Feasible Plan
Capacity Elements
State and Federal
LocalNon-
Capacity Elements
Planned Improvements Revenue Estimates

“Statewide”• SIS Highways Construction & ROW• Statewide Public Transportation Programs
(Aviation, Rail, Intermodal, Seaport Development)
Other• Other Arterials
Construction & ROW• Transit
Capacity Programs

• Safety• Resurfacing• Bridge (repair and replace)• Product Support (planning and
engineering)• Operations and Maintenance• Administration
Non-Capacity Programs

Sources of Revenue
Federal (DOT)
State (FDOT)
Local

Federal Revenue Sources
• Federal Highway Trust Fund
(Highways and Transit) Primary source – motor fuel tax (gasoline,
diesel, special fuels, CNG)
Miscellaneous – tires, new tractor/trailer
purchases, etc.
Most Highways and Transit funds allocated to
states via complex funding formulas in Federal
Authorization Acts
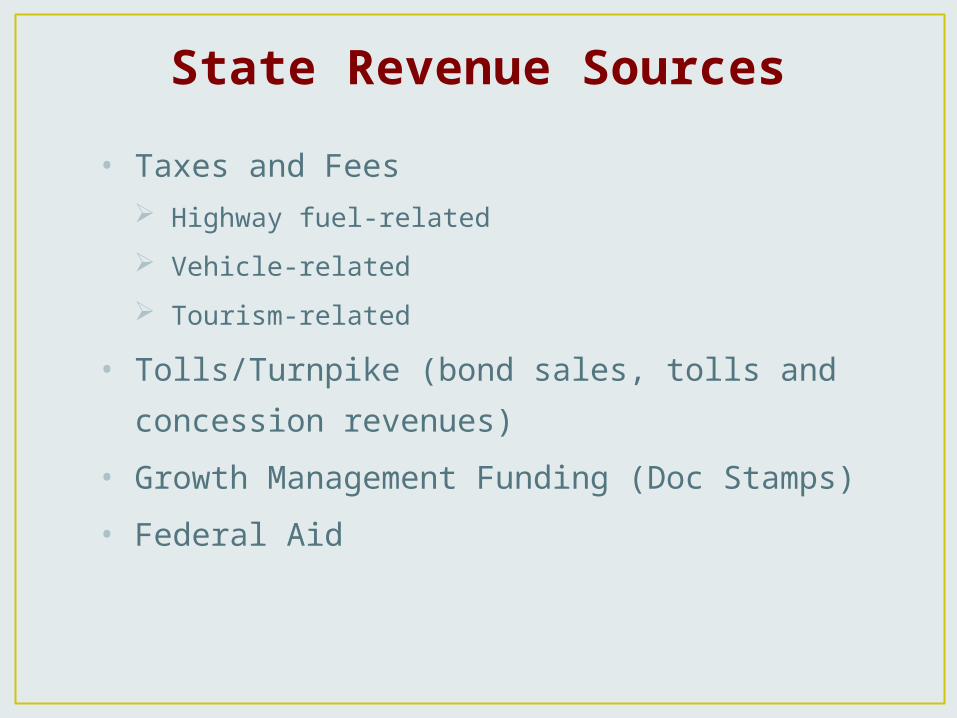
State Revenue Sources
• Taxes and Fees Highway fuel-related
Vehicle-related
Tourism-related
• Tolls/Turnpike (bond sales, tolls and
concession revenues)
• Growth Management Funding (Doc Stamps)
• Federal Aid

Statewide Revenue Forecast2040 vs. 2035
Source: 2040 Revenue Forecast and Guidance, FDOT, Statewide Workshop, August 21, 2013
5-Year Time Period (Fiscal Years)

Projected State & Federal Revenues ($ Millions)
Source: FDOT 2040 Forecast of State and Federal Revenues for Statewide and Metropolitan Plans; March 2014
Capacity Programs 2019-2020 2021-2025 2026-2030 2031-2040 Total (2040)
SIS Highway Construction & ROW
$200.7 - $557.4 $428.7 $1,186.7
Arterial Construction & ROW
$45.6 $101.9 $96.3 $210.8 $454.6
Transit $22.2 $57.3 $60.2 $126.2 $265.9
Total Capacity Program
$268.5 $159.2 $713.9 $765.7 $1,907.2
TMA Funds (SU) $9.4 $23.6 $23.6 $47.2 $103.7

Projected Votran Revenues($ Millions)
• Virtual status quo level• Operating policy of indefinite deferral of service expansion
Type 2019-2020 2021-2025 2026-2030 2031-2035 2036-2040 Total
Volusia County Operating Budget for Votran
$20,045,309 $55,617,955 $64,476,456 $74,745,884 $86,650,966 $301,536,570
Volusia County Financial Support for SunRail
$8,150,283 $17,084,456 $15,122,111 $17,530,671 $20,322,853 $78,210,374
Total $28,195,592 $72,702,411 $79,598,567 $92,276,555 $106,973,818 $379,746,944
Source: Votran

Local Revenue Sources
• Local Option Gas Tax• Impact Fees
Local Sources Include…
Volusia County
City of Palm Coast
Flagler County

Projected Local Revenue($ Millions)
Local Government Fuel Tax (CIP) Impact Fees Total
Volusia County $219,044,354 $48,141,480 $267,185,834
Flagler County $23,836,054 $4,968,704 $28,804,758
City of Palm Coast $31,032,527 $26,507,893 $57,540,420
TOTAL $273,912,935 $79,618,077 $353,531,012
Source: Fishkind & Associates, Inc.

Projected Total (2019-2040)($ Millions)
1 Flagler County transit revenue forecast under development
System, Agency, Local GovernmentState/Federal
FundsLocal Revenues Total
River to Sea TPO
• Capacity Programs $1,907,200,000 $1,907,200,000
• TMA Funds $103,700,000 $103,700,000
Votran $379,746,9441 $379,746,944
Volusia County $267,185,834 $267,185,834
Flagler County $28,804,758 $28,804,758
City of Palm Coast $57,540,420 $57,540,420
SunRail $0 $0 $0
TOTAL $2,010,900,000 $353,531,012 $2,364,431,012
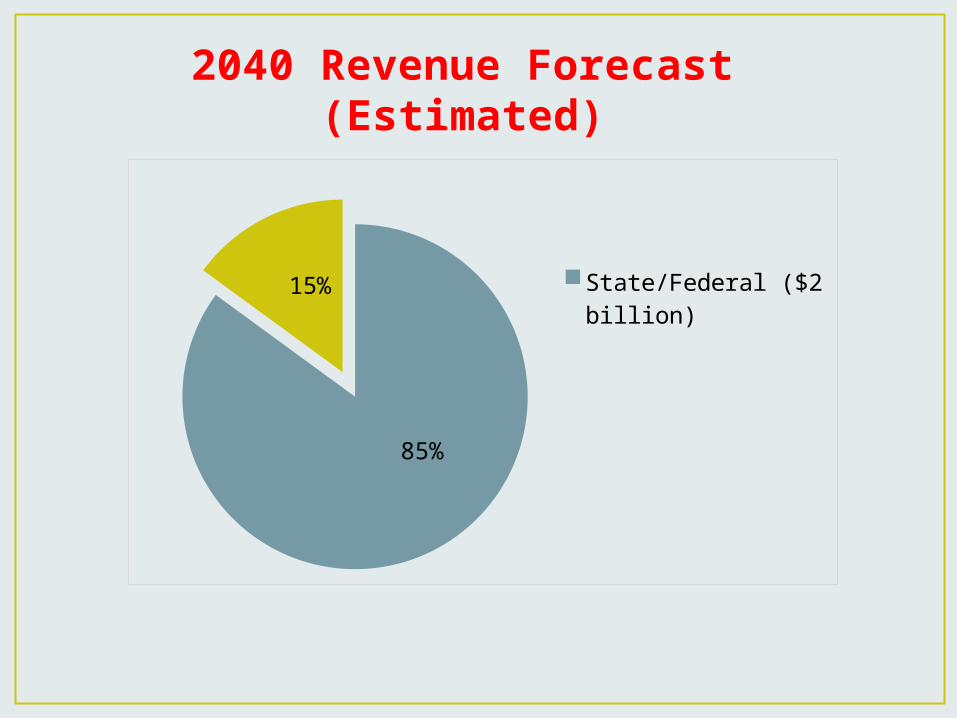
2040 Revenue Forecast(Estimated)
State/Federal ($2 bil-lion)
15%
85%

Potential Revenues Sources
• Local Option Sales Tax (1-cent limit for infrastructure) Volusia County has none implemented Flagler County has ½ cent option Palm Coast shares in Flagler County local option sales tax
• Mobility Fee Charge on new development for impacts on transportation facilities Sensitive to vehicle or person miles traveled Fund multimodal transportation improvements
• Miles Driven Fee Keyed to amount of vehicle travel rather than fuel consumption
• Rental Car Surtax A surcharge of $2.00 per day for the lease or rental in Florida of a for hire
passenger motor vehicle. Revenues generated would not be a significant revenue source for
transportation infrastructure funding.

Thank You