tr 125 951 - v6.3.0 - universal mobile telecommunications ... · etsi tr 125 951 v6.3.0 (2006-10)...
TRANSCRIPT

ETSI TR 125 951 V6.3.0 (2006-10)
Technical Report
Universal Mobile Telecommunications System (UMTS);Base Station (BS) classification (FDD)
(3GPP TR 25.951 version 6.3.0 Release 6)
ETSI
ETSI TR 125 951 V6.3.0 (2006-10) 1 3GPP TR 25.951 version 6.3.0 Release 6
Reference RTR/TSGR-0425951v630
Keywords UMTS
ETSI
650 Route des Lucioles F-06921 Sophia Antipolis Cedex - FRANCE
Tel.: +33 4 92 94 42 00 Fax: +33 4 93 65 47 16
Siret N° 348 623 562 00017 - NAF 742 C
Association à but non lucratif enregistrée à la Sous-Préfecture de Grasse (06) N° 7803/88
Important notice
Individual copies of the present document can be downloaded from: http://www.etsi.org
The present document may be made available in more than one electronic version or in print. In any case of existing or perceived difference in contents between such versions, the reference version is the Portable Document Format (PDF).
In case of dispute, the reference shall be the printing on ETSI printers of the PDF version kept on a specific network drive within ETSI Secretariat.
Users of the present document should be aware that the document may be subject to revision or change of status. Information on the current status of this and other ETSI documents is available at
http://portal.etsi.org/tb/status/status.asp
If you find errors in the present document, please send your comment to one of the following services: http://portal.etsi.org/chaircor/ETSI_support.asp
Copyright Notification
No part may be reproduced except as authorized by written permission. The copyright and the foregoing restriction extend to reproduction in all media.
© European Telecommunications Standards Institute 2006.
All rights reserved.
DECTTM, PLUGTESTSTM and UMTSTM are Trade Marks of ETSI registered for the benefit of its Members. TIPHONTM and the TIPHON logo are Trade Marks currently being registered by ETSI for the benefit of its Members. 3GPPTM is a Trade Mark of ETSI registered for the benefit of its Members and of the 3GPP Organizational Partners.

ETSI
ETSI TR 125 951 V6.3.0 (2006-10) 2 3GPP TR 25.951 version 6.3.0 Release 6
Intellectual Property Rights IPRs essential or potentially essential to the present document may have been declared to ETSI. The information pertaining to these essential IPRs, if any, is publicly available for ETSI members and non-members, and can be found in ETSI SR 000 314: "Intellectual Property Rights (IPRs); Essential, or potentially Essential, IPRs notified to ETSI in respect of ETSI standards", which is available from the ETSI Secretariat. Latest updates are available on the ETSI Web server (http://webapp.etsi.org/IPR/home.asp).
Pursuant to the ETSI IPR Policy, no investigation, including IPR searches, has been carried out by ETSI. No guarantee can be given as to the existence of other IPRs not referenced in ETSI SR 000 314 (or the updates on the ETSI Web server) which are, or may be, or may become, essential to the present document.
Foreword This Technical Report (TR) has been produced by ETSI 3rd Generation Partnership Project (3GPP).
The present document may refer to technical specifications or reports using their 3GPP identities, UMTS identities or GSM identities. These should be interpreted as being references to the corresponding ETSI deliverables.
The cross reference between GSM, UMTS, 3GPP and ETSI identities can be found under http://webapp.etsi.org/key/queryform.asp .
ETSI
ETSI TR 125 951 V6.3.0 (2006-10) 3 3GPP TR 25.951 version 6.3.0 Release 6
Contents
Intellectual Property Rights ................................................................................................................................2
Foreword.............................................................................................................................................................2
Foreword.............................................................................................................................................................6
1 Scope ........................................................................................................................................................7
2 References ................................................................................................................................................7
3 Definitions, symbols and abbreviations ...................................................................................................7
4 General .....................................................................................................................................................7
5 System scenarios ......................................................................................................................................7 5.1 Indoor Environment ...........................................................................................................................................7 5.1.1 Path Loss Model ...........................................................................................................................................7 5.2 Mixed Indoor – Outdoor Environment...............................................................................................................8 5.2.1 Propagation Model........................................................................................................................................8 5.3 Minimum coupling loss (MCL)..........................................................................................................................9 5.3.1 MCL for Local Area scenario .......................................................................................................................9 5.4 FDD Base Station Classification for Medium range BS class..........................................................................10 5.4.1 Proposal for Medium range (micro) BS class output power .......................................................................10 5.4.1.1 Discussion .............................................................................................................................................10 5.4.1.2 Proposal.................................................................................................................................................10 5.5 FDD Base Station Classification for Local area BS class ................................................................................10 5.5.1 Proposal for Local area (pico) BS class output power ................................................................................10 5.5.1.1 Discussion .............................................................................................................................................10 5.5.1.2 Proposal.................................................................................................................................................11
6 Base station classes ................................................................................................................................11 6.1 Base station class criteria .................................................................................................................................11 6.1.1 Text proposal for 4.2 Base station classes ..................................................................................................11
7 Changes for the Release 6 in addition to Release 5................................................................................12 7.1 Changes in 25.104 ............................................................................................................................................12 7.1.1 Frequency error...........................................................................................................................................12 7.1.1.1 New requirement...................................................................................................................................12 7.1.1.2 Text proposal for 6.3.1 Minimum requirement .....................................................................................12 7.1.2 Adjacent Channel Leakage power Ratio (ACLR) ......................................................................................13 7.1.3 Reference sensitivity level ..........................................................................................................................14 7.1.4 Spectrum emission mask ............................................................................................................................14 7.1.5 Adjacent Channel Selectivity (ACS) ..........................................................................................................14 7.1.6 Blocking characteristics ..............................................................................................................................14 7.1.7 Intermodulation characteristics...................................................................................................................16 7.1.8 Demodulation in static propagation conditions...........................................................................................18 7.1.9 Demodulation of DCH in multipath fading conditions...............................................................................18 7.1.10 Demodulation of DCH in moving propagation conditions .........................................................................18 7.1.11 Demodulation of DCH in birth/death propagation conditions ....................................................................18 7.1.12 Output power dynamics ..............................................................................................................................18 7.1.13 Spurious emissions .....................................................................................................................................19 7.1.14 Transmit intermodulation ...........................................................................................................................21 7.1.15 Transmit modulation...................................................................................................................................21 7.1.16 Receiver dynamic range..............................................................................................................................21 7.1.17 Receiver spurious emissions .......................................................................................................................22 7.1.18 Base station maximum output power..........................................................................................................22 7.2 Changes in 25.133 ............................................................................................................................................22 7.2.1 Received total wideband power ..................................................................................................................22 7.3 Changes in 25.141 ............................................................................................................................................23
8 Impacts to other WGs.............................................................................................................................24

ETSI
ETSI TR 125 951 V6.3.0 (2006-10) 4 3GPP TR 25.951 version 6.3.0 Release 6
9 Backward Compatibility.........................................................................................................................24
Annex A (informative): Simulation results ..........................................................................................25
A.1 Micro base stations in FDD mode..........................................................................................................25 A.1.1 Receiver sensitivity ..........................................................................................................................................25 A.1.1.1 Macro to micro multi-operator case............................................................................................................25 A.1.1.2 Simulation results .......................................................................................................................................26 A.1.1.3 Simulation parameters ................................................................................................................................27 A.1.1.4 Macro-Micro on adjacent frequencies ........................................................................................................28 A.1.1.4.1 Speech 8 kbps........................................................................................................................................28 A.1.1.4.2 Data 144 kbps........................................................................................................................................28 A.1.1.5 Micro-Micro scenario on adjacent frequencies...........................................................................................29 A.1.2 Blocking, ACS, and Intermodulation ...............................................................................................................29 A.1.2.1 Macro to micro multi-operator case............................................................................................................29 A.1.2.2 Simulation results .......................................................................................................................................31 A.1.2.2.1 Blocking performance ...........................................................................................................................33 A.1.2.2.2 Adjacent Channel Selectivity ................................................................................................................33 A.1.2.2.3 Intermodulation Characteristics ............................................................................................................34 A.1.2.3 Simulation parameters ................................................................................................................................35 A.2 Pico base stations in FDD mode.......................................................................................................................35 A.2.1 Mixed microcell-picocell scenario ...................................................................................................................35 A.2.2 Receiver sensitivity ..........................................................................................................................................36 A.2.2.1 Simulation parameters ................................................................................................................................36 A.2.2.2 Simulation results .......................................................................................................................................38 A.2.2.3 Noise rise for UL in Picocell environment .................................................................................................39 A.2.2.4 UL noise rise calculation for the picocell BS..............................................................................................39 A.2.2.5 Reference sensitivity level ..........................................................................................................................41 A.2.3 Dynamic range, ACS, Blocking and Intermodulation......................................................................................42 A.2.3.1 Simulation parameters ................................................................................................................................42 A.2.3.2 Dynamic range............................................................................................................................................42 A.2.3.3 ACS ............................................................................................................................................................43 A.2.3.4 Blocking characteristics ..............................................................................................................................43 A.2.3.5 Intermodulation characteristics...................................................................................................................47
A.3 Maximum output power for Medium range BS class ............................................................................48 A.3.1 Simulation results #1 ........................................................................................................................................48 A.3.1.1 Simulation scenario.....................................................................................................................................48 A.3.1.2 Simulation results .......................................................................................................................................48 A.3.1.3 Proposal ......................................................................................................................................................49 A.3.2 Simulation results #2 ........................................................................................................................................50 A.3.2.1 Simulation scenario.....................................................................................................................................50 A.3.2.2 Simulation results .......................................................................................................................................50 A.3.2.3 Proposal ......................................................................................................................................................52
A.4 Maximum output power for Local area BS class ...................................................................................52 A.4.1 Simulation results #1 ........................................................................................................................................52 A.4.1.1 Simulation scenario.....................................................................................................................................52 A.4.1.2 Simulation results .......................................................................................................................................52 A.4.1.3 Proposal.................................................................................................................................................54 A.4.2 Simulation results #2 ........................................................................................................................................54 A.4.2.1 Simulation scenario.....................................................................................................................................54 A.4.2.2 Simulation results .......................................................................................................................................55 A.4.2.3 Proposal ......................................................................................................................................................56
Annex B (informative): Radio Network Planning Considerations ....................................................57
B.1 Adjacent frequency Interference ............................................................................................................57 B.1.1 General .............................................................................................................................................................57 B.1.2 Example analysis for localized interference .....................................................................................................57 B.1.3 Deployment guidelines to reduce interference .................................................................................................58
B.2 Intra-frequency interference ...................................................................................................................59 B.2.1 General .............................................................................................................................................................59

ETSI
ETSI TR 125 951 V6.3.0 (2006-10) 5 3GPP TR 25.951 version 6.3.0 Release 6
B.2.2 Example analysis for localized interference .....................................................................................................59 B.2.2.1 UL issue ......................................................................................................................................................59 B.2.2.2 DL issue ......................................................................................................................................................60 B.2.3 Deployment guidelines to reduce interference .................................................................................................61
Annex C (informative): Change History ..............................................................................................62
History ..............................................................................................................................................................63
ETSI
ETSI TR 125 951 V6.3.0 (2006-10) 6 3GPP TR 25.951 version 6.3.0 Release 6
Foreword This Technical Specification has been produced by the 3rd Generation Partnership Project (3GPP).
The contents of the present document are subject to continuing work within the TSG and may change following formal TSG approval. Should the TSG modify the contents of the present document, it will be re-released by the TSG with an identifying change of release date and an increase in version number as follows:
Version x.y.z
where:
x the first digit:
1 presented to TSG for information;
2 presented to TSG for approval;
3 or greater indicates TSG approved document under change control.
y the second digit is incremented for all changes of substance, i.e. technical enhancements, corrections, updates, etc.
z the third digit is incremented when editorial only changes have been incorporated in the document.
ETSI
ETSI TR 125 951 V6.3.0 (2006-10) 7 3GPP TR 25.951 version 6.3.0 Release 6
1 Scope This document is a Technical Report on Release 6 work item 'FDD Base Station Classification'.
2 References The following documents contain provisions which, through reference in this text, constitute provisions of the present document.
• References are either specific (identified by date of publication, edition number, version number, etc.) or non-specific.
• For a specific reference, subsequent revisions do not apply.
• For a non-specific reference, the latest version applies.
[1] 3GPP TS 25.104 'BS Radio transmission and Reception (FDD)'
[2] 3GPP TS 25.133 'Requirements for Support of Radio Resource Management (FDD)'
[3] 3GPP TS 25.141 'Base Station (BS) conformance testing (FDD)'
[4] 3GPP TR 25.942 'RF System Scenarios'
[5] UMTS 30.03
[6] 3GPP TR 25.905 'Vocabulary for 3GPP Specifications'
3 Definitions, symbols and abbreviations For the purposes of the present document, the definitions, symbols and abbreviations given in TR 21.905 [6] apply.
4 General Current TSG RAN WG4 specifications have been done according to the requirements for the general purpose base stations (NodeBs) applications. For the UTRA evolution requirement specifications for other types of base stations are needed as well to take into account different use scenarios and radio environments. In this technical report, base station classification is described and requirements for each base station class are derived.
5 System scenarios This section describes the system scenarios for UTRA operation that are considered when defining base station classes. It also includes typical radio parameters that are used to derive requirements.
5.1 Indoor Environment
5.1.1 Path Loss Model
The indoor path loss model expressed in dB is in the following form, which is derived from the COST 231 indoor model:
L = 37 + 20 Log10(R) + Σ kwi Lwi + 18.3 n ((n+2)/(n+1)-0.46)
ETSI
ETSI TR 125 951 V6.3.0 (2006-10) 8 3GPP TR 25.951 version 6.3.0 Release 6
where:
R transmitter-receiver separation given in metres
kwi number of penetrated walls of type i
Lwi loss of wall type i
n number of penetrated floors
Two types of internal walls are considered. Light internal walls with a loss factor of 3.4 dB and regular internal walls with a loss factor of 6.9 dB.
If internal walls are not modelled individually, the indoor path loss model is represented by the following formula:
L = 37 + 30 Log10(R) + 18.3 n ((n+2)/(n+1)-0.46)
where:
R transmitter-receiver separation given in metres;
n number of penetrated floors
Slow fading deviation in pico environment is assumed to be 6 dB.
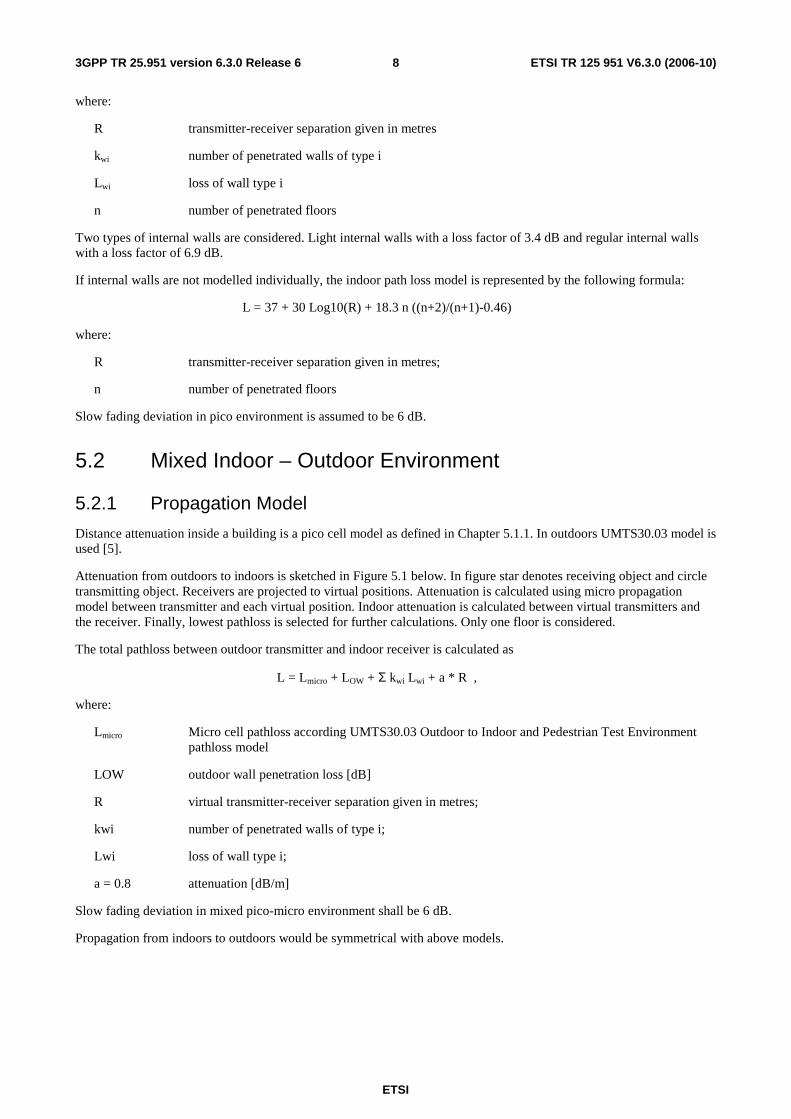
5.2 Mixed Indoor – Outdoor Environment
5.2.1 Propagation Model
Distance attenuation inside a building is a pico cell model as defined in Chapter 5.1.1. In outdoors UMTS30.03 model is used [5].
Attenuation from outdoors to indoors is sketched in Figure 5.1 below. In figure star denotes receiving object and circle transmitting object. Receivers are projected to virtual positions. Attenuation is calculated using micro propagation model between transmitter and each virtual position. Indoor attenuation is calculated between virtual transmitters and the receiver. Finally, lowest pathloss is selected for further calculations. Only one floor is considered.
The total pathloss between outdoor transmitter and indoor receiver is calculated as
L = Lmicro + LOW + Σ kwi Lwi + a * R ,
where:
Lmicro Micro cell pathloss according UMTS30.03 Outdoor to Indoor and Pedestrian Test Environment pathloss model
LOW outdoor wall penetration loss [dB]
R virtual transmitter-receiver separation given in metres;
kwi number of penetrated walls of type i;
Lwi loss of wall type i;
a = 0.8 attenuation [dB/m]
Slow fading deviation in mixed pico-micro environment shall be 6 dB.
Propagation from indoors to outdoors would be symmetrical with above models.

ETSI
ETSI TR 125 951 V6.3.0 (2006-10) 9 3GPP TR 25.951 version 6.3.0 Release 6
BS
MS
Virtual positions
Figure 5.1: Simulation scenario and propagation model.
Parameters related to propagation models are summarised in Table 5.1.
Table 5.1: Parameters related to mixed indoor - outdoor propagation model
Parameter value Inside wall loss 6.9 dB Outside wall loss 10 dB Slow fading deviation in indoors 6 dB Slow fading deviation in outdoors 6 dB Building size 110 x 110 meters Street size 110 x 15 meters Room size 22 x 25 meters Number of rooms 5 rooms in 4 rows Corridor size 110 x 5 meters Number of corridors 2 Size of entrance point 5 meters Number of base stations 4 .. 6 BS coordinates tba
5.3 Minimum coupling loss (MCL) Minimum Coupling Loss (MCL) is defined as the minimum distance loss including antenna gain measured between antenna connectors.
5.3.1 MCL for Local Area scenario
The minimum coupling loss between UEs is independent of the scenario, therefore the same minimum coupling loss is assumed for all environments. Local area BSs are usually mounted under the ceiling, on wall or some other exposed position. In [4] chapter 4.1.1.2 a minimal separation of 2 metres between UE and indoor BS is assumed. Free space path loss is defined in [4] as:
Path loss [dB] = 38.25 + 20 log10(d [m])
Taking into account 0 dBi antenna gain for Local area BS and UE and a body loss of 1 dB at the terminal, a MCL of 45.27 dB is obtained. The additional 2 dB cable loss at the BS as proposed in TR 25.942 is not considered.

ETSI
ETSI TR 125 951 V6.3.0 (2006-10) 103GPP TR 25.951 version 6.3.0 Release 6
The assumed MCL values are summarised in table 5.2.
Table 5.2: Minimum Coupling Losses
MCL MS ↔ MS 40 dB Local area BS ↔ MS 45 dB Local area BS ↔ Local area BS 45 dB
5.4 FDD Base Station Classification for Medium range BS class
5.4.1 Proposal for Medium range (micro) BS class output power
5.4.1.1 Discussion
2 contributions were presented during the TSG-RAN WG4 meeting #26 proposing a maximum output power requirement for the Medium range BS class.
Contributions were proposing a value of 37 dBm and 39 dBm for the maximum output power requirement for the Medium range BS class. It was concluded that results from both simulations were in good agreement which each other. It could be concluded that the capacity loss for the macro layer will be at most 5.8 % for a 37 dBm MR network layer and an upper bound of 6.3 % for a 39 dBm MR network layer was established.
Taking into account that capacity losses of approximately the same order may also occur for uncoordinated macro-macro networks and furthermore, that the TX powers of the studied MR BSs were in excess of the required TX power for coverage, it was concluded that also a 38 dBm micro layer should lead to acceptable capacity losses.
As both proposals differed by only 2 dB the value of 38 dBm was suggested and approved as a consensus requirement
The detailed simulation assumptions and results can be found in the informative Annex A.3.
5.4.1.2 Proposal
Based on the above investigation, the proposed maximum output power, which is recommended for the Medium range BS, is +38 dBm as shown in the table below:
Table 5.3: Base Station maximum output power
BS Class Maximum output power Medium range BS < +38 dBm
5.5 FDD Base Station Classification for Local area BS class
5.5.1 Proposal for Local area (pico) BS class output power
5.5.1.1 Discussion
2 contributions were presented during the TSG-RAN WG4 meeting #26 proposing a maximum output power requirement for the Local area BS class. It was concluded that the output power of Local area BS should be less than +20dBm in order to maintain the capacity deterioration less than 5% when 10% of micro network UEs are in the building. Another conclusion was that even for a 30 dBm LA network layer, interference caused capacity losses in the micro layer could only occur for loads which are unrealistic from the code capacity limit point of view.
During the discussions the following 2 aspects were identified:

ETSI
ETSI TR 125 951 V6.3.0 (2006-10) 113GPP TR 25.951 version 6.3.0 Release 6
1) propagation losses in the the agred micro-pico scenario are relatively low compared to those occurring frequently in practice.
2) indoor scenarios tend to be more case specific and some variation of the interference impact across real life deployment scenarios should therefore be taken into account.
Aspect 1) leads to an overestimation of the interference impact, as the LA BSs use more TX power than would have been necessary from the coverage point of view. Hence, it was felt, that also larger than 20 dBm LA BS TX powers will lead to acceptable outage in the micro-layer in practice, due to the more favourable statistics of the pathloss differences.
Aspect 2) leads to the recommendation to use some extra protection for the micro layer and hence an additional 6 dB safety margin relative to the 30 dBm value is proposed.
The value 24 dBm was agreed and approved by RAN WG4 as a consensus requirement.
In order to capture the reasoning behind this requirement, the related simulation results will be added into an informative Annex A.4.
5.5.1.2 Proposal
Based on the above investigation, the proposed maximum output power, which is allowed for the Local area BS, is +24 dBm as shown in the table below.
Table 5.4: Base Station maximum output power
BS Class Maximum output power Local area BS +24 dBm
6 Base station classes This section describes how the base station classes are defined.
6.1 Base station class criteria Different sets of requirements are derived from calculations based on Minimum Coupling Loss between BS and UE. Each set of requirements corresponds to a base station class is used as criteria for classification. Three classes are defined: Wide Area BS class, Medium Range BS class and Local Area BS class.
Wide Area BS class assumes relatively high MCL, as is typically found in outdoor macro environments, where the BS antennas are located in masts, roof tops or high above street level. Existing requirements are used, as they are in [1], for the base station intended for general-purpose applications.
Medium Range BS class assumes medium MCL, as typically found in outdoor micro environments, where the BS antennas are located below roof tops.
Local Area BS class assumes relatively low MCL, as is typically found indoors (offices, subway stations etc) where antennas are located on the ceilings or walls or possibly built-in in the BS on the wall. Low-CL can also be found outdoors on hot spot areas like market place, high street or railway station. New requirements, as defined in this TR, are set for the Local Area BS class.
6.1.1 Text proposal for 4.2 Base station classes
The requirements in this specification apply to both Wide Area Base Stations and Local Area Base Stations, unless otherwise stated.
Wide Area Base Stations are characterised by requirements derived from Macro Cell scenarios with a BS to UE minimum coupling losses equal to70 dB. The Wide Area Base Station class has the same requirements as the base station for General Purpose application in Release 99, Rel-4 and Rel-5.

ETSI
ETSI TR 125 951 V6.3.0 (2006-10) 123GPP TR 25.951 version 6.3.0 Release 6
Medium Range Base Stations are characterised by requirements derived from Micro Cell scenarios with a BS to UE minimum coupling loss equal to 53dB..
Local Area Base Stations are characterised by requirements derived from Pico Cell scenarios with a BS to UE minimum coupling losses equal to 45dB.
7 Changes for the Release 6 in addition to Release 5
7.1 Changes in 25.104 This section describes the considered changes to requirements on BS minimum RF characteristics, with respect to Release 5 requirements in TS25.104.
7.1.1 Frequency error
7.1.1.1 New requirement
In the present system the mobile has to be designed to work with a Doppler shift caused by speeds up to 250 km/h at 2100 MHz. This corresponds to a frequency offset of
[Doppler shift, Hz] = [UE velocity, m/s] * [Carrier frequency, Hz] / [speed of light, m/s]
= (250 * 1000/3600) * 2.1 * 10^9 / (3 *10^8) Hz
≈ 486 Hz
At present, the BS requirement is 0.05 ppm, corresponding to 105 Hz at 2100 MHz.
In this case, the mobile must be able to successfully decode signals with offset of
[present UE decode offset, Hz] = [frequency error, Hz] + [max. Doppler shift, Hz]
= 486 Hz + 105 Hz
= 591 Hz
The frequency error requirement for local area BS class is proposed to be relaxed to 0.1ppm.
[frequency error, ppm] = 0.1 ppm
This corresponds to a maximum UE speed of 196km/h.
[max. new Doppler shift] = [present UE decode offset] - [frequency error, Hz]
= 591 Hz – 210 Hz
= 381 Hz
[UE velocity, km/h] = [speed of light, km/h] * [Doppler shift, Hz] / [Carrier frequency, Hz]
= (3 *10^8 * 381 * 3600) / (2.1 * 10^9 * 1000)
= 196 km/h
7.1.1.2 Text proposal for 6.3.1 Minimum requirement
6.3.1 Minimum Requirement

ETSI
ETSI TR 125 951 V6.3.0 (2006-10) 133GPP TR 25.951 version 6.3.0 Release 6
The modulated carrier frequency of the Wide area BS shall be accurate to within ± 0.05 ppm observed over a period of one power control group (timeslot).
The modulated carrier frequency of the Medium range BS shall be accurate to within ± 0.1 ppm observed over a period of one power control group (timeslot).
The modulated carrier frequency of the Local Area BS shall be accurate to within ± 0.1 ppm observed over a period of one power control group (timeslot).
Table 6.0: Frequency error minimum requirement
BS class accuracy wide area BS ±0.05 ppm
medium range BS ±0.1 ppm local area BS ±0.1 ppm
7.1.2 Adjacent Channel Leakage power Ratio (ACLR)
No changes based on the new Medium Range and Local area BS classes.
The capacity losses due to ACLR localized around the Local Area BS should be studied further and minuted in this section.
For Japan, specific considerations of Out-of-band emission requirements for WA, MR and LA-BS were made. The change of the ACLR requirement is limited to Japan and does not apply to other regions. The background is that only Category A spurious emissions requirements apply in Japan. In other regions, the tighter BS spectrum mask and Category B spurious emissions requirements are also applied, which gives a very different situation. In this case the BS spectrum mask overrides the spurious emission limit for lower power BS and there will be no 'unbalanced situation' for most power levels. The change is based on the considerable relaxation of the ACLR requirement for low power base stations being agreed in Japan as explained in Tdoc. R4-060414 and it will also become a part of the regulatory requirements of Japan. Based on this, it was agreed in RAN4 to introduce a new note for a certain region as seen below. It is also agreed that the note is only applicable in Japan which is captured in section 4.3 in [1] as a regional requirement.
In the note introduced for BS ACLR, the minimum requirement of –8.0 dBm/3.84 MHz (for Band I and Band IX) and +2.0 dBm/3.84 MHz (for Band VI) are derived from -13dBm/1MHz and -13dBm/100kHz respectively with test tolerance of 0.8dB taking into account. The values -13dBm/1MHz and -13dBm/100kHz corrsponds to Category A spurious emission requirement specified in Table 6.8 in [1].
The additional changes on a regional note for ACLR requirement in TS25.104 [1] can be found in documents R4-060684(for Release 6) and R4-060683(for Release 7).
Text proposal for 6.6.2.2.1 Minimum requirement
The ACLR shall be higher than the value specified in Table 6.7.
Table 6.7: BS ACLR
BS adjacent channel offset below the first or above the last carrier frequency used
ACLR limit
5 MHz 45 dB 10 MHz 50 dB
NOTE: In certain regions, the adjacent channel power (the RRC filtered mean power centered on an adjacent channel frequency) shall be less than or equal to –8.0 dBm/3.84 MHz
(for Band I, Band IX) or �2.0dBm/3.84MHz (for Band VI) or as specified by the ACLR limit, whichever is the higher.the ACLR shall be higher than the value specified in this table, if the adjacent channel power is greater than the spurious emissions specified in Table 6.8.

ETSI
ETSI TR 125 951 V6.3.0 (2006-10) 143GPP TR 25.951 version 6.3.0 Release 6
7.1.3 Reference sensitivity level
The chapter 7.2.1 in TS 25.104 REL-6 should be changed as following:
7.2 Reference sensitivity level The reference sensitivity level is the minimum mean power received at the antenna connector at which the Bit Error Ratio (BER) shall not exceed the specific value indicated in section 7.2.1.
7.2.1 Minimum requirement
Using the reference measurement channel specification in Annex A, the reference sensitivity level and performance of the BS shall be as specified in Table 7.1.
Table 7.1: BS reference sensitivity levels
BS Class Reference measurement channel
data rate
BS reference sensitivity level (dBm)
BER
Wide Area BS 12.2 kbps -121 BER shall not exceed 0.001 Medium Range BS 12.2 kbps -111 BER shall not exceed 0.001
Local area BS 12.2 kbps -107 BER shall not exceed 0.001
7.1.4 Spectrum emission mask
No changes based on the new Medium Range and Local area BS classes.
7.1.5 Adjacent Channel Selectivity (ACS)
The chapter 7.4.1 TS 25.104 REL-6 should be changed as following:
7.4 Adjacent Channel Selectivity (ACS) Adjacent channel selectivity (ACS) is a measure of the receiver ability to receive a wanted signal at is assigned channel frequency in the presence of a single code W-CDMA modulated adjacent channel signal at a given frequency offset from the center frequency of the assigned channel. ACS is the ratio of the receiver filter attenuation on the assigned channel frequency to the receiver filter attenuation on the adjacent channel(s).
7.4.1 Minimum requirement
The BER shall not exceed 0.001 for the parameters specified in Table 7.3.
Table 7.3: Adjacent channel selectivity
Parameter Level Wide Area BS
Level Medium Range BS
Level Local area BS
Unit
Data rate 12.2 12.2 12.2 kbps Wanted signal mean power
-115 -105 -101 dBm
Interfering signal mean power
-52 -42 -38 dBm
Fuw offset (Modulated) 5 5 5 MHz
7.1.6 Blocking characteristics
The chapter 7.5.1 in TS 25.104 REL-6 should be changed as following:
7.5.1 Minimum requirement

ETSI
ETSI TR 125 951 V6.3.0 (2006-10) 153GPP TR 25.951 version 6.3.0 Release 6
The static reference performance as specified in clause 7.2.1 shall be met with a wanted and an interfering signal coupled to BS antenna input using the following parameters.
Table 7.4: Blocking performance requirement for Wide Area BS
Operating Band
Center Frequency of Interfering Signal
Interfering Signal mean power
Wanted Signal mean power
Minimum Offset of Interfering
Signal
Type of Interfering Signal
1920 - 1980 MHz -40 dBm -115 dBm 10 MHz WCDMA signal with one code
1900 - 1920 MHz 1980 - 2000 MHz
-40 dBm -115 dBm 10 MHz WCDMA signal with one code
I
1 MHz -1900 MHz 2000 MHz - 12750 MHz
-15 dBm -115 dBm CW carrier
1850 - 1910 MHz -40 dBm -115 dBm 10 MHz WCDMA signal with one code
1830 - 1850 MHz 1910 - 1930 MHz
-40 dBm -115 dBm 10 MHz WCDMA signal with one code
II
1 MHz - 1830 MHz 1930 MHz - 12750 MHz
-15 dBm -115 dBm CW carrier
1710 – 1785 MHz -40 dBm -115 dBm 10 MHz WCDMA signal with one code
1690 - 1710 MHz 1785 – 1805 MHz
-40 dBm -115 dBm 10 MHz WCDMA signal with one code
III
1 MHz - 1690 MHz 1805 MHz - 12750 MHz
-15 dBm -115 dBm CW carrier
Table 7.4A: Blocking performance requirement for Medium Range BS
Operating Band
Center Frequency of Interfering Signal
Interfering Signal mean power
Wanted Signal mean power
Minimum Offset of Interfering
Signal
Type of Interfering Signal
1920 - 1980 MHz -35 dBm -105 dBm 10 MHz WCDMA signal with one code
1900 - 1920 MHz 1980 - 2000 MHz
-35 dBm -105 dBm 10 MHz WCDMA signal with one code
I
1 MHz -1900 MHz 2000 MHz - 12750 MHz
-15 dBm -105 dBm CW carrier
1850 - 1910 MHz -35 dBm -105 dBm 10 MHz WCDMA signal with one code
1830 - 1850 MHz 1910 - 1930 MHz
-35 dBm -105 dBm 10 MHz WCDMA signal with one code
II
1 MHz - 1830 MHz 1930 MHz - 12750 MHz
-15 dBm -105 dBm CW carrier
1710 – 1785 MHz -35 dBm -105 dBm 10 MHz WCDMA signal with one code
1690 - 1710 MHz 1785 – 1805 MHz
-35 dBm -105 dBm 10 MHz WCDMA signal with one code
III
1 MHz - 1690 MHz 1805 MHz - 12750 MHz
-15 dBm -105 dBm CW carrier
ETSI
ETSI TR 125 951 V6.3.0 (2006-10) 163GPP TR 25.951 version 6.3.0 Release 6
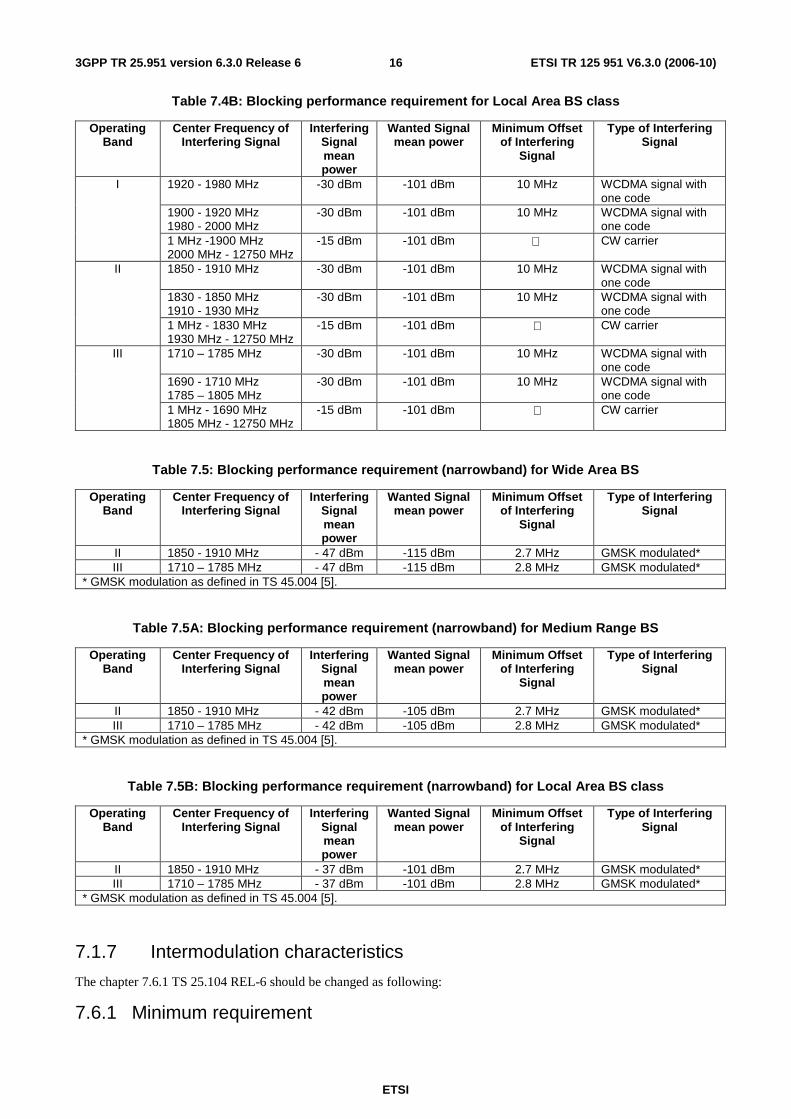
Table 7.4B: Blocking performance requirement for Local Area BS class
Operating Band
Center Frequency of Interfering Signal
Interfering Signal mean power
Wanted Signal mean power
Minimum Offset of Interfering
Signal
Type of Interfering Signal
1920 - 1980 MHz -30 dBm -101 dBm 10 MHz WCDMA signal with one code
1900 - 1920 MHz 1980 - 2000 MHz
-30 dBm -101 dBm 10 MHz WCDMA signal with one code
I
1 MHz -1900 MHz 2000 MHz - 12750 MHz
-15 dBm -101 dBm CW carrier
1850 - 1910 MHz -30 dBm -101 dBm 10 MHz WCDMA signal with one code
1830 - 1850 MHz 1910 - 1930 MHz
-30 dBm -101 dBm 10 MHz WCDMA signal with one code
II
1 MHz - 1830 MHz 1930 MHz - 12750 MHz
-15 dBm -101 dBm CW carrier
1710 – 1785 MHz -30 dBm -101 dBm 10 MHz WCDMA signal with one code
1690 - 1710 MHz 1785 – 1805 MHz
-30 dBm -101 dBm 10 MHz WCDMA signal with one code
III
1 MHz - 1690 MHz 1805 MHz - 12750 MHz
-15 dBm -101 dBm CW carrier
Table 7.5: Blocking performance requirement (narrowband) for Wide Area BS
Operating Band
Center Frequency of Interfering Signal
Interfering Signal mean power
Wanted Signal mean power
Minimum Offset of Interfering
Signal
Type of Interfering Signal
II 1850 - 1910 MHz - 47 dBm -115 dBm 2.7 MHz GMSK modulated* III 1710 – 1785 MHz - 47 dBm -115 dBm 2.8 MHz GMSK modulated*
* GMSK modulation as defined in TS 45.004 [5].
Table 7.5A: Blocking performance requirement (narrowband) for Medium Range BS
Operating Band
Center Frequency of Interfering Signal
Interfering Signal mean power
Wanted Signal mean power
Minimum Offset of Interfering
Signal
Type of Interfering Signal
II 1850 - 1910 MHz - 42 dBm -105 dBm 2.7 MHz GMSK modulated* III 1710 – 1785 MHz - 42 dBm -105 dBm 2.8 MHz GMSK modulated*
* GMSK modulation as defined in TS 45.004 [5].
Table 7.5B: Blocking performance requirement (narrowband) for Local Area BS class
Operating Band
Center Frequency of Interfering Signal
Interfering Signal mean power
Wanted Signal mean power
Minimum Offset of Interfering
Signal
Type of Interfering Signal
II 1850 - 1910 MHz - 37 dBm -101 dBm 2.7 MHz GMSK modulated* III 1710 – 1785 MHz - 37 dBm -101 dBm 2.8 MHz GMSK modulated*
* GMSK modulation as defined in TS 45.004 [5].
7.1.7 Intermodulation characteristics
The chapter 7.6.1 TS 25.104 REL-6 should be changed as following:
7.6.1 Minimum requirement
ETSI
ETSI TR 125 951 V6.3.0 (2006-10) 173GPP TR 25.951 version 6.3.0 Release 6
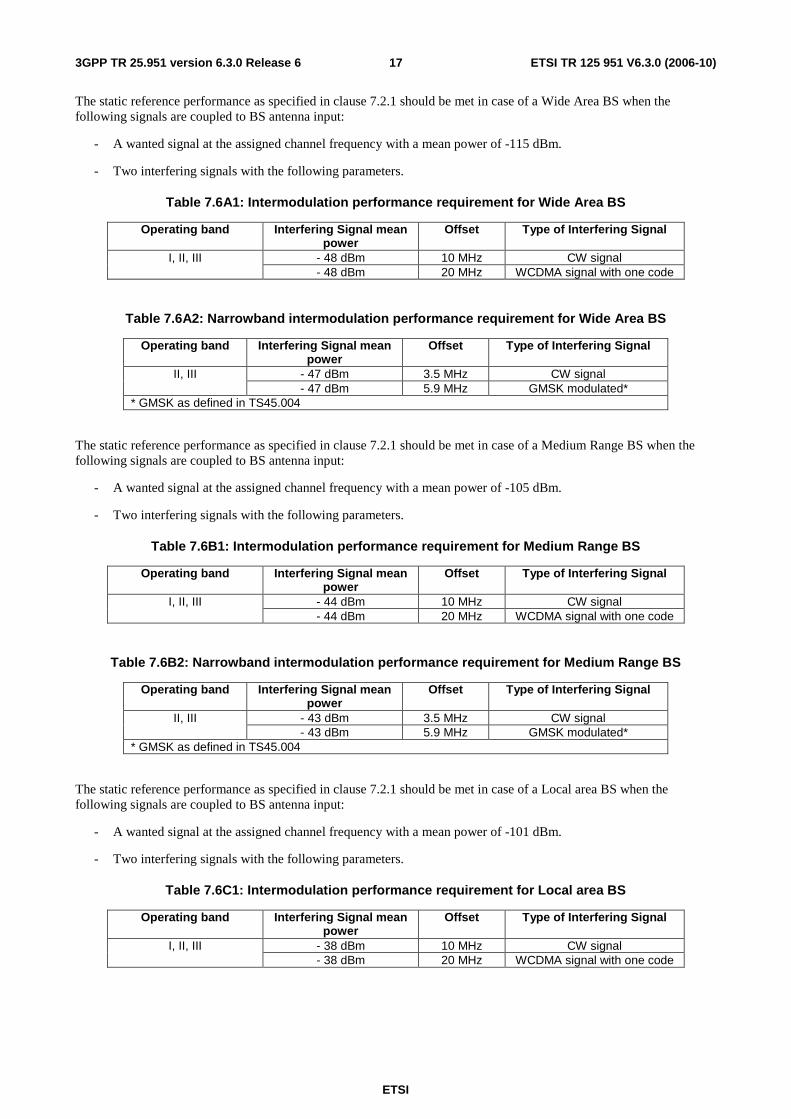
The static reference performance as specified in clause 7.2.1 should be met in case of a Wide Area BS when the following signals are coupled to BS antenna input:
- A wanted signal at the assigned channel frequency with a mean power of -115 dBm.
- Two interfering signals with the following parameters.
Table 7.6A1: Intermodulation performance requirement for Wide Area BS
Operating band Interfering Signal mean power
Offset Type of Interfering Signal
- 48 dBm 10 MHz CW signal I, II, III - 48 dBm 20 MHz WCDMA signal with one code
Table 7.6A2: Narrowband intermodulation performance requirement for Wide Area BS
Operating band Interfering Signal mean power
Offset Type of Interfering Signal
- 47 dBm 3.5 MHz CW signal II, III - 47 dBm 5.9 MHz GMSK modulated*
* GMSK as defined in TS45.004
The static reference performance as specified in clause 7.2.1 should be met in case of a Medium Range BS when the following signals are coupled to BS antenna input:
- A wanted signal at the assigned channel frequency with a mean power of -105 dBm.
- Two interfering signals with the following parameters.
Table 7.6B1: Intermodulation performance requirement for Medium Range BS
Operating band Interfering Signal mean power
Offset Type of Interfering Signal
- 44 dBm 10 MHz CW signal I, II, III - 44 dBm 20 MHz WCDMA signal with one code
Table 7.6B2: Narrowband intermodulation performance requirement for Medium Range BS
Operating band Interfering Signal mean power
Offset Type of Interfering Signal
- 43 dBm 3.5 MHz CW signal II, III - 43 dBm 5.9 MHz GMSK modulated*
* GMSK as defined in TS45.004
The static reference performance as specified in clause 7.2.1 should be met in case of a Local area BS when the following signals are coupled to BS antenna input:
- A wanted signal at the assigned channel frequency with a mean power of -101 dBm.
- Two interfering signals with the following parameters.
Table 7.6C1: Intermodulation performance requirement for Local area BS
Operating band Interfering Signal mean power
Offset Type of Interfering Signal
- 38 dBm 10 MHz CW signal I, II, III - 38 dBm 20 MHz WCDMA signal with one code

ETSI
ETSI TR 125 951 V6.3.0 (2006-10) 183GPP TR 25.951 version 6.3.0 Release 6
Table 7.6C2: Narrowband intermodulation performance requirement for Local area BS
Operating band Interfering Signal mean power
Offset Type of Interfering Signal
- 37 dBm 3.5 MHz CW signal II, III - 37 dBm 5.9 MHz GMSK modulated*
* GMSK as defined in TS45.004
7.1.8 Demodulation in static propagation conditions
No changes based on the new Medium Range BS class.
7.1.9 Demodulation of DCH in multipath fading conditions
The chapter 8.3.4 TS 25.104 REL-6 should be changed as following:
8.3.4 Multipath fading Case 4
The performance requirement of DCH in multipath fading Case 4 in case of a Wide Area BS is determined by the maximum Block Error Ratio (BLER ) allowed when the receiver input signal is at a specified Eb/N0 limit. The BLER is calculated for each of the measurement channels supported by the base station.
8.3.4.1 Minimum requirement
The BLER should not exceed the limit for the Eb/N0 specified in Table 8.5A.
Table 8.5A: Performance requirements in multipath Case 4 channel for Wide Area BS
Measurement channel
Received Eb/N0
Required BLER
n.a. < 10-1 10.2 dB < 10-2
12.2 kbps
11.0 dB < 10-3 6.4 dB < 10-1 6.8 dB < 10-2
64 kbps
7.1 dB < 10-3 5.8 dB < 10-1 6.2 dB < 10-2
144 kbps
6.6 dB < 10-3 6.2 dB < 10-1 6.6 dB < 10-2
384 kbps
7.2 dB < 10-3
7.1.10 Demodulation of DCH in moving propagation conditions
No changes based on the new Medium Range BS class.
7.1.11 Demodulation of DCH in birth/death propagation conditions
No changes based on the new Medium Range BS class.
7.1.12 Output power dynamics
No changes based on the new Medium Range and Local area BS classes.

ETSI
ETSI TR 125 951 V6.3.0 (2006-10) 193GPP TR 25.951 version 6.3.0 Release 6
7.1.13 Spurious emissions
No changes for spurious emission Mandatory Requirements and for Operation in the same geographic area based on the new Medium Range and Local area BS classes. However new optional requirements on spurious emission for Co-located base stations are recommended as following:
6.6.3.3 Co-existence with GSM 900
6.6.3.3.1 Operation in the same geographic area
This requirement may be applied for the protection of GSM 900 MS in geographic areas in which both GSM 900 and UTRA are deployed.
6.6.3.3.1.1 Minimum Requirement
The power of any spurious emission shall not exceed:
Table 6.11: BS Spurious emissions limits for BS in geographic coverage area of GSM 900 MS receiver
Band Maximum Level
Measurement Bandwidth
Note
921 - 960 MHz -57 dBm 100 kHz
6.6.3.3.2 Co-located base stations
This requirement may be applied for the protection of GSM 900 BTS receivers when GSM 900 BTS and UTRA BS are co-located.
6.6.3.3.2.1 Minimum Requirement
The power of any spurious emission shall not exceed:
Table 6.12: BS Spurious emissions limits for protection of the GSM 900 BTS receiver
BS class Band Maximum Level
Measurement Bandwidth
Note
Wide Area BS 876-915 MHz -98 dBm 100 kHz Medium Range BS 876-915 MHz -91 dBm 100 kHz
Local Area BS 876-915 MHz -70 dBm 100 kHz
These values assume a 30 dB coupling loss between transmitter and receiver. If BSs of different classes are co-sited, the coupling loss must be increased by the difference between the corresponding values from the table above.
6.6.3.4 Co-existence with DCS 1800
6.6.3.4.1 Operation in the same geographic area
This requirement may be applied for the protection of DCS 1800 MS in geographic areas in which both DCS 1800 and UTRA are deployed.
6.6.3.4.1.1 Minimum Requirement
The power of any spurious emission shall not exceed:
Table 6.13: BS Spurious emissions limits for BS in geographic coverage area of DCS 1800 MS receiver
Operating Band
Band Maximum Level
Measurement Bandwidth
Note
I 1805 - 1880 MHz -47 dBm 100 kHz
6.6.3.4.2 Co-located base stations
ETSI
ETSI TR 125 951 V6.3.0 (2006-10) 203GPP TR 25.951 version 6.3.0 Release 6
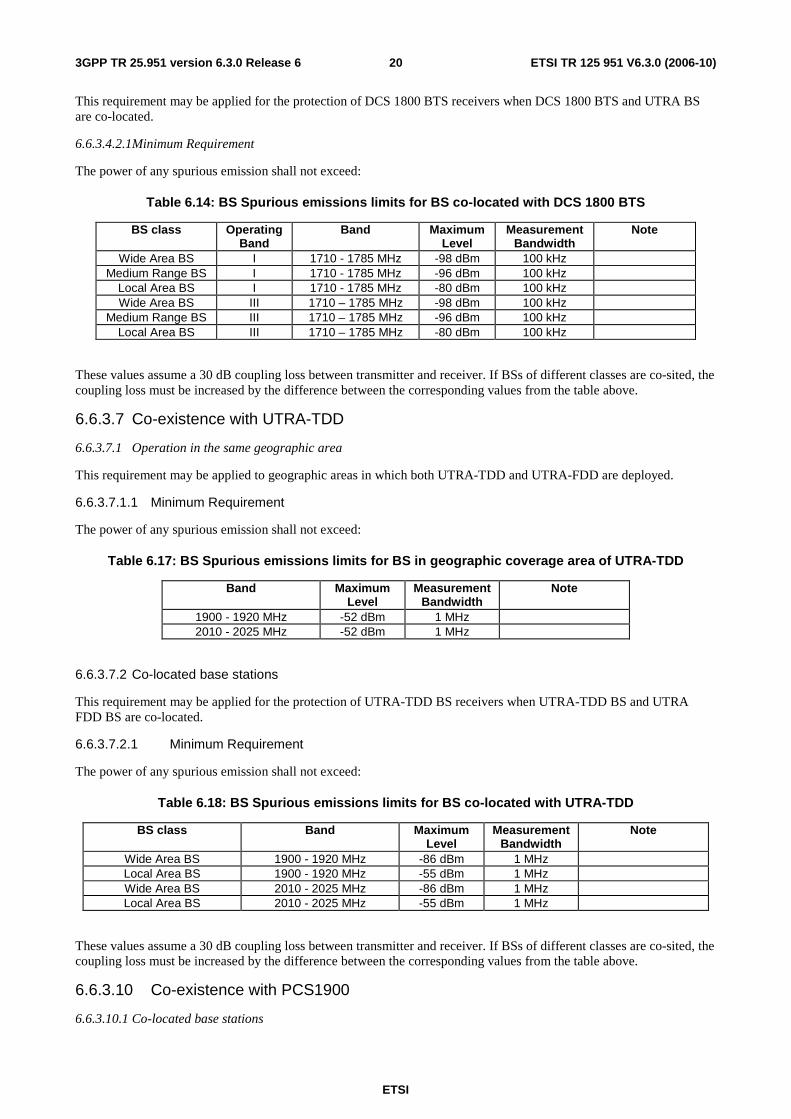
This requirement may be applied for the protection of DCS 1800 BTS receivers when DCS 1800 BTS and UTRA BS are co-located.
6.6.3.4.2.1 Minimum Requirement
The power of any spurious emission shall not exceed:
Table 6.14: BS Spurious emissions limits for BS co-located with DCS 1800 BTS
BS class Operating Band
Band Maximum Level
Measurement Bandwidth
Note
Wide Area BS I 1710 - 1785 MHz -98 dBm 100 kHz Medium Range BS I 1710 - 1785 MHz -96 dBm 100 kHz
Local Area BS I 1710 - 1785 MHz -80 dBm 100 kHz Wide Area BS III 1710 – 1785 MHz -98 dBm 100 kHz
Medium Range BS III 1710 – 1785 MHz -96 dBm 100 kHz Local Area BS III 1710 – 1785 MHz -80 dBm 100 kHz
These values assume a 30 dB coupling loss between transmitter and receiver. If BSs of different classes are co-sited, the coupling loss must be increased by the difference between the corresponding values from the table above.
6.6.3.7 Co-existence with UTRA-TDD
6.6.3.7.1 Operation in the same geographic area
This requirement may be applied to geographic areas in which both UTRA-TDD and UTRA-FDD are deployed.
6.6.3.7.1.1 Minimum Requirement
The power of any spurious emission shall not exceed:
Table 6.17: BS Spurious emissions limits for BS in geographic coverage area of UTRA-TDD
Band Maximum Level
Measurement Bandwidth
Note
1900 - 1920 MHz -52 dBm 1 MHz 2010 - 2025 MHz -52 dBm 1 MHz
6.6.3.7.2 Co-located base stations
This requirement may be applied for the protection of UTRA-TDD BS receivers when UTRA-TDD BS and UTRA FDD BS are co-located.
6.6.3.7.2.1 Minimum Requirement
The power of any spurious emission shall not exceed:
Table 6.18: BS Spurious emissions limits for BS co-located with UTRA-TDD
BS class Band Maximum Level
Measurement Bandwidth
Note
Wide Area BS 1900 - 1920 MHz -86 dBm 1 MHz Local Area BS 1900 - 1920 MHz -55 dBm 1 MHz Wide Area BS 2010 - 2025 MHz -86 dBm 1 MHz Local Area BS 2010 - 2025 MHz -55 dBm 1 MHz
These values assume a 30 dB coupling loss between transmitter and receiver. If BSs of different classes are co-sited, the coupling loss must be increased by the difference between the corresponding values from the table above.
6.6.3.10 Co-existence with PCS1900
6.6.3.10.1 Co-located base stations

ETSI
ETSI TR 125 951 V6.3.0 (2006-10) 213GPP TR 25.951 version 6.3.0 Release 6
This requirement may be applied for the protection of PCS1900 BS receivers when UTRA BS operating in frequency band II and PCS1900 BS are co-located.
6.6.3.10.1.1 Minimum Requirement
The power of any spurious emission shall not exceed:
Table 6.23: BS Spurious emissions limits for BS co-located with PCS1900 BS
BS class Operating Band
Band Maximum Level
Measurement Bandwidth
Note
Wide Area BS II 1850 – 1910 MHz -98 dBm 100 kHz Medium Range BS II 1850 – 1910 MHz -96 dBm 100 kHz
Local Area BS II 1850 – 1910 MHz -80 dBm 100 kHz
These values assume a 30 dB coupling loss between transmitter and receiver. If BSs of different classes are co-sited, the coupling loss must be increased by the difference between the corresponding values from the table above.
6.6.3.11 Co-existence with GSM850
6.6.3.11.1 Co-located base stations
This requirement may be applied for the protection of GSM850 BS receivers when UTRA BS operating in frequency band II and GSM850 BS are co-located.
6.6.3.11.1.1 Minimum Requirement
The power of any spurious emission shall not exceed:
Table 6.24: BS Spurious emissions limits for BS co-located with GSM850 BS
BS class Operating Band
Band Maximum Level
Measurement Bandwidth
Note
Wide Area BS II 824 - 849 MHz -98 dBm 100 kHz Medium Range BS II 824 - 849 MHz -91 dBm 100 kHz
Local Area BS II 824 - 849 MHz -70 dBm 100 kHz
These values assume a 30 dB coupling loss between transmitter and receiver. If BSs of different classes are co-sited, the coupling loss must be increased by the difference between the corresponding values from the table above.
7.1.14 Transmit intermodulation
No changes based on the new Medium Range and Local area BS classes.
7.1.15 Transmit modulation
No changes based on the new Medium Range and Local area BS classes.
7.1.16 Receiver dynamic range
The chapter 7.3.1 in TS 25.104 REL-6 should be changed as following:
7.3 Dynamic range Receiver dynamic range is the receiver ability to handle a rise of interference in the reception frequency channel. The receiver shall fulfil a specified BER requirement for a specified sensitivity degradation of the wanted signal in the presence of an interfering AWGN signal in the same reception frequency channel.
7.3.1 Minimum requirement

ETSI
ETSI TR 125 951 V6.3.0 (2006-10) 223GPP TR 25.951 version 6.3.0 Release 6
The BER shall not exceed 0.001 for the parameters specified in Table 7.2.
Table 7.2: Dynamic range
Parameter Level Wide Area BS
Level Medium Range BS
Level Local area BS
Unit
Reference measurement channel data rate
12.2 12.2 12.2 kbps
Wanted signal mean power
-91 -81 -77 dBm
Interfering AWGN signal -73 -63 -59 dBm/3.84 MHz
7.1.17 Receiver spurious emissions
No changes based on the new Medium range and Local area BS classes.
7.1.18 Base station maximum output power
The chapter 6.2.1 in TS 25.104 REL-6 should be changed as following:
6.2.1 Base station maximum output power
Maximum output power, Pmax, of the base station is the mean power level per carrier measured at the antenna connector in specified reference condition.
6.2.1.1 Minimum requirement
The rated output power, PRAT, of the BS shall be as specified in Table 6.0A.
Table 6.0A: Base Station rated output power
BS class PRAT Wide Area BS (note)
Medium Range BS < +38dBm Local Area BS < +24dBm
NOTE: There is no upper limit required for the rated output power of the Wide Area Base Station like for the base station for General Purpose application in Release 99, 4, and 5.
In normal conditions, the Base station maximum output power shall remain within +2 dB and -2dB of the manufacturer's rated output power.
In extreme conditions, the Base station maximum output power shall remain within +2.5 dB and -2.5 dB of the manufacturer's rated output power.
In certain regions, the minimum requirement for normal conditions may apply also for some conditions outside the range of conditions defined as normal.
7.2 Changes in 25.133 This section describes the considered changes to requirements on UTRAN measurements, with respect to Release 5 requirements in TS25.133.
7.2.1 Received total wideband power
9.2.1 Received total wideband power
The measurement period shall be 100 ms.

ETSI
ETSI TR 125 951 V6.3.0 (2006-10) 233GPP TR 25.951 version 6.3.0 Release 6
9.2.1.1 Absolute accuracy requirement
Table 9.35
Conditions Parameter Unit Accuracy [dB] Io [dBm/3.84 MHz]
BS Class
Received Total Wideband Power Io
dBm/3.84 MHz
± 4 -103... -74 Wide Area BS
Received Total Wideband Power Io
dBm/3.84 MHz
± 4 -93... -64 Medium Range BS
Received Total Wideband Power Io
dBm/3.84 MHz
± 4 -89... -60 Local area BS
9.2.1.2 Relative accuracy requirement
The relative accuracy is defined as the Received total wideband power measured at one frequency compared to the Received total wideband power measured from the same frequency at a different time.
Table 9.36
Conditions Parameter Unit Accuracy [dB] Io [dBm/3.84 MHz]
BS Class
Received Total Wideband Power Io
dBm/3.84 MHz
± 0.5 -103... -74 AND for changes ≤ ±5.0dB
Wide Area BS
Received Total Wideband Power Io
dBm/3.84 MHz
± 0.5 -93... -64 AND for changes ≤ ±5.0dB
Medium Range BS
Received Total Wideband Power Io
dBm/3.84 MHz
± 0.5 -89... -60 AND for changes ≤ ±5.0dB
Local area BS
9.2.1.3 Received total wideband power measurement report mapping
The reporting range for Received total wideband power (RTWP) is from -112 ... -50 dBm.
In table 9.37 the mapping of measured quantity is defined. The range in the signalling may be larger than the guaranteed accuracy range.
Table 9.37
Reported value Measured quantity value Unit RTWP_LEV _000 RTWP < -112.0 dBm RTWP_LEV _001 -112.0 ≤ RTWP < -111.9 dBm RTWP_LEV _002 -111.9 ≤ RTWP < -111.8 dBm … … … RTWP_LEV _619 -50.2 ≤ RTWP < -50.1 dBm RTWP_LEV _620 -50.1 ≤ RTWP < -50.0 dBm RTWP_LEV _621 -50.0 ≤ RTWP dBm
7.3 Changes in 25.141 This section describes the considered changes to base station conformance testing, with respect to Release 5 requirements in TS25.141.
Approved changes for 25.141 can be found from documents R4-021695 and R4-030350. Changes are not repeated here.
Additional changes on ALCR were made as a regional requirement in Japan, which capturing the changes in the core requirement in section 7.1.2 in this TR. The change is to introduce a new note for a certain region as seen below. It is also agreed that the note is only applicable in Japan which is captured in section 4.7 in [3] as a regional requirement.
ETSI
ETSI TR 125 951 V6.3.0 (2006-10) 243GPP TR 25.951 version 6.3.0 Release 6
In the note introduced for BS ACLR, the test requirement of –7.2 dBm/3.84 MHz(for Band I and Band IX) and +2.8 dBm/3.84 MHz (for Band VI) are derived from -13dBm/1MHz and -13dBm/100kHz respectively. The values -13dBm/1MHz and -13dBm/100kHz corrsponds to Category A spurious emission requirement specified in Table 6.8 in [1].
The additional changes on a regional note for ACLR requirement in TS25.141 [4] can be found in documents R4-060685(for Release 6) and R4-060686(for Release 7).
Text proposal for 6.6.2.2.5 Test Requirement
The measurement result in step 1 of 6.5.2.2.4.2 shall not be less than the ACLR limit specified in tables 6.23
Table 6.23: BS ACLR
BS channel offset below the first or above the last carrier frequency used
ACLR limit
5 MHz 44.2 dB 10 MHz 49.2 dB
Note: In certain regions, the adjacent channel power (the RRC filtered mean power centered on an adjacent channel frequency) shall be less than or equal to –7.2 dBm/3.84 MHz (for Band I, Band IX) or 2.8dBm/3.84MHz (for Band VI) or as specified by the ACLR limit, whichever is the higher.
NOTE: If the above Test Requirement differs from the Minimum Requirement then the Test Tolerance applied for this test is non-zero. The Test Tolerance for this test is defined in subclause 4.2 and the explanation of how the Minimum Requirement has been relaxed by the Test Tolerance is given in Annex F.
8 Impacts to other WGs void
9 Backward Compatibility void
ETSI
ETSI TR 125 951 V6.3.0 (2006-10) 253GPP TR 25.951 version 6.3.0 Release 6
Annex A (informative): Simulation results
A.1 Micro base stations in FDD mode
A.1.1 Receiver sensitivity
A.1.1.1 Macro to micro multi-operator case
A multi-operator Macro-Micro scenario (as in TR 25.942 chapter 5.1.3.2) was investigated whereas the UL capacity of the system is calculated as a function of the Micro BS noise floor. The outcome is a relative UL capacity (either for the Micro or Macro system) as a function of the Micro noise floor.
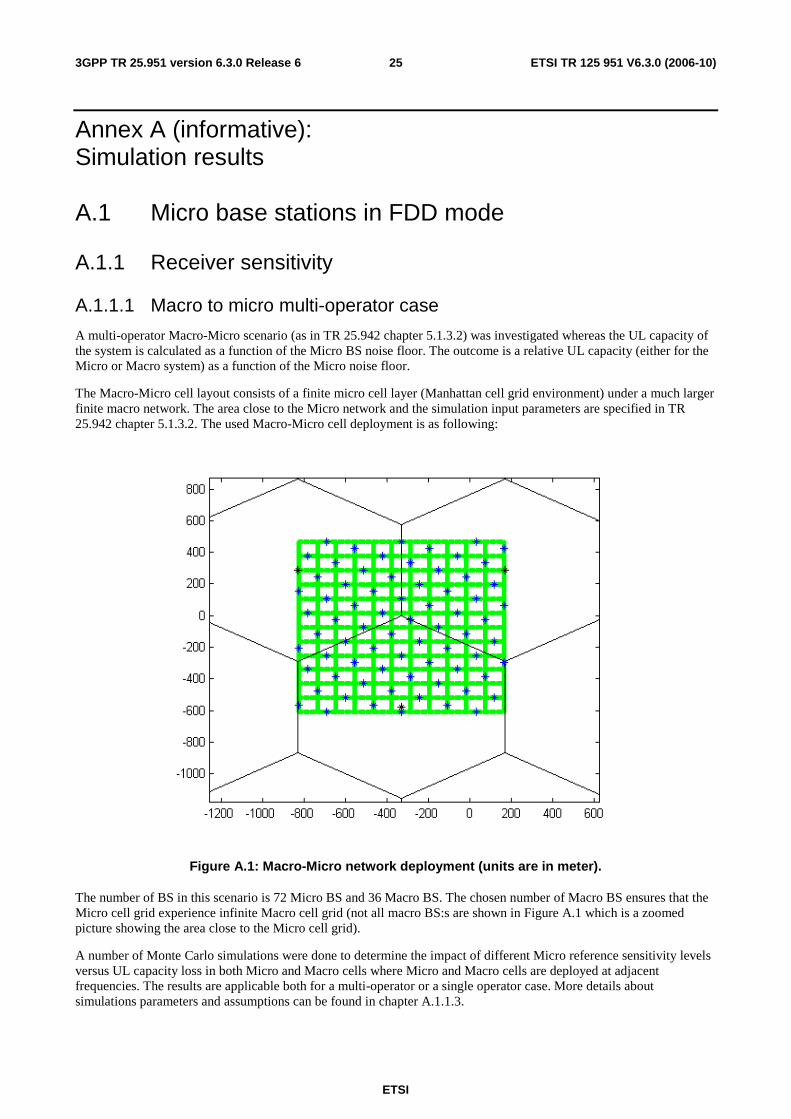
The Macro-Micro cell layout consists of a finite micro cell layer (Manhattan cell grid environment) under a much larger finite macro network. The area close to the Micro network and the simulation input parameters are specified in TR 25.942 chapter 5.1.3.2. The used Macro-Micro cell deployment is as following:
Figure A.1: Macro-Micro network deployment (units are in meter).
The number of BS in this scenario is 72 Micro BS and 36 Macro BS. The chosen number of Macro BS ensures that the Micro cell grid experience infinite Macro cell grid (not all macro BS:s are shown in Figure A.1 which is a zoomed picture showing the area close to the Micro cell grid).
A number of Monte Carlo simulations were done to determine the impact of different Micro reference sensitivity levels versus UL capacity loss in both Micro and Macro cells where Micro and Macro cells are deployed at adjacent frequencies. The results are applicable both for a multi-operator or a single operator case. More details about simulations parameters and assumptions can be found in chapter A.1.1.3.
ETSI
ETSI TR 125 951 V6.3.0 (2006-10) 263GPP TR 25.951 version 6.3.0 Release 6
A.1.1.2 Simulation results
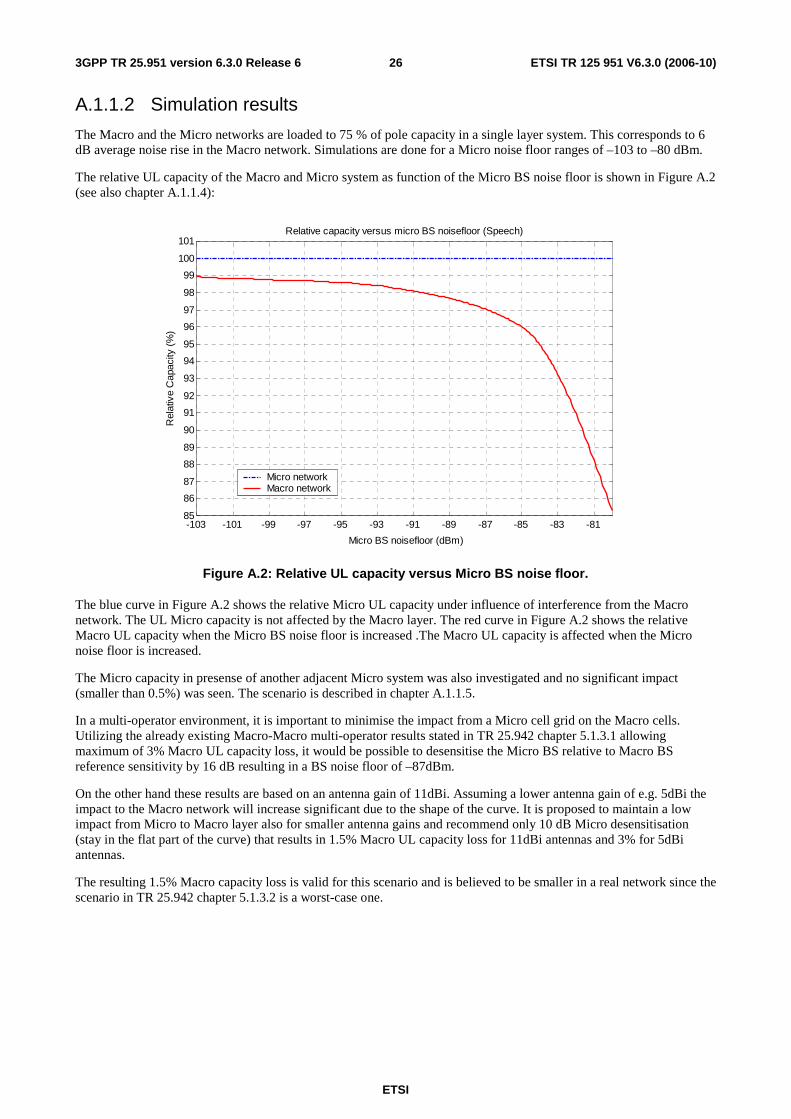
The Macro and the Micro networks are loaded to 75 % of pole capacity in a single layer system. This corresponds to 6 dB average noise rise in the Macro network. Simulations are done for a Micro noise floor ranges of –103 to –80 dBm.
The relative UL capacity of the Macro and Micro system as function of the Micro BS noise floor is shown in Figure A.2 (see also chapter A.1.1.4):
-103 -101 -99 -97 -95 -93 -91 -89 -87 -85 -83 -8185
86
87
88
89
90
91
92
93
94
95
96
97
98
99
100
101
Micro BS noisefloor (dBm)
Rel
ativ
e C
apac
ity (
%)
Relative capacity versus micro BS noisefloor (Speech)
Micro networkMacro network
Figure A.2: Relative UL capacity versus Micro BS noise floor.
The blue curve in Figure A.2 shows the relative Micro UL capacity under influence of interference from the Macro network. The UL Micro capacity is not affected by the Macro layer. The red curve in Figure A.2 shows the relative Macro UL capacity when the Micro BS noise floor is increased .The Macro UL capacity is affected when the Micro noise floor is increased.
The Micro capacity in presense of another adjacent Micro system was also investigated and no significant impact (smaller than 0.5%) was seen. The scenario is described in chapter A.1.1.5.
In a multi-operator environment, it is important to minimise the impact from a Micro cell grid on the Macro cells. Utilizing the already existing Macro-Macro multi-operator results stated in TR 25.942 chapter 5.1.3.1 allowing maximum of 3% Macro UL capacity loss, it would be possible to desensitise the Micro BS relative to Macro BS reference sensitivity by 16 dB resulting in a BS noise floor of –87dBm.
On the other hand these results are based on an antenna gain of 11dBi. Assuming a lower antenna gain of e.g. 5dBi the impact to the Macro network will increase significant due to the shape of the curve. It is proposed to maintain a low impact from Micro to Macro layer also for smaller antenna gains and recommend only 10 dB Micro desensitisation (stay in the flat part of the curve) that results in 1.5% Macro UL capacity loss for 11dBi antennas and 3% for 5dBi antennas.
The resulting 1.5% Macro capacity loss is valid for this scenario and is believed to be smaller in a real network since the scenario in TR 25.942 chapter 5.1.3.2 is a worst-case one.

ETSI
ETSI TR 125 951 V6.3.0 (2006-10) 273GPP TR 25.951 version 6.3.0 Release 6
A.1.1.3 Simulation parameters
Table A.1: Simulation parameters
Simulation parameter Uplink
MCL macro / micro 70 / 53 dB Antenna gain (including losses Base station Mobile
11 dBi 0 dBi
Log-normal shadow fading standard deviation
10 dB
Noise floor RBS receiver Macro / micro
-103 / -103 .. –73 dBm
Maximum TX power speech 21 dBm Maximum TX power data 21 dBm Minimum TX power speech -50 dBm ACIR 33 dB Power control Perfect PC Power control error 0.01 dB Outage condition C/I target not reached due to lack of TX power Admission control Not included Macro User distribution in macro network Random and uniform over the network Micro User distribution in micro network Random and uniform over the streets Macro User distribution in micro network Random and uniform over the streets Bit rate speech 8 kbps Activity factor speech 100 % Eb/No target speech macro / micro
6.1 / 3.3 dB
Bit rate data 144 kbps Activity factor data 100 % Eb/No target data macro / micro
3.1 / 2.4 dB
Micro deployment Manhattan scenario Block size 75 m Road width 15 m Intersite distance between line-of-sight 180 Number of micro cells 72 Number of macro cells 3 affected macros
36 in total Macro Site-to-Site distance 1 km
ETSI
ETSI TR 125 951 V6.3.0 (2006-10) 283GPP TR 25.951 version 6.3.0 Release 6
A.1.1.4 Macro-Micro on adjacent frequencies
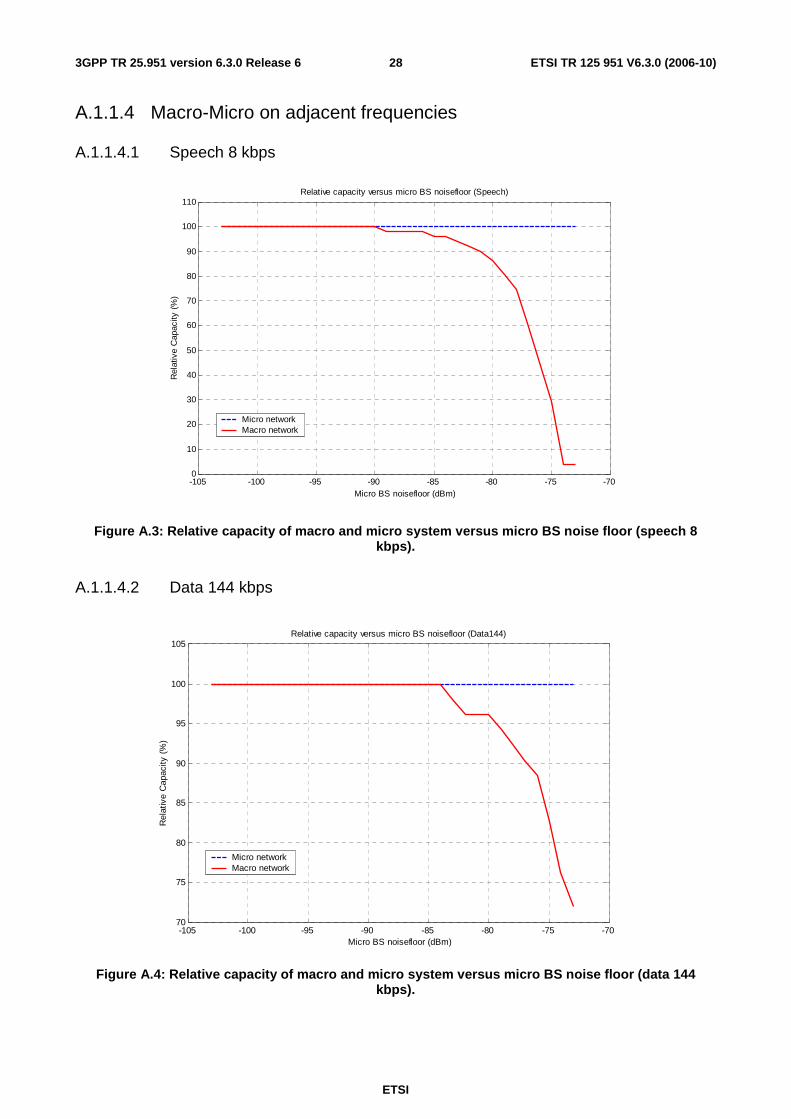
A.1.1.4.1 Speech 8 kbps
-105 -100 -95 -90 -85 -80 -75 -700
10
20
30
40
50
60
70
80
90
100
110
Micro BS noisefloor (dBm)
Rel
ativ
e C
apac
ity (
%)
Relative capacity versus micro BS noisefloor (Speech)
Micro networkMacro network
Figure A.3: Relative capacity of macro and micro system versus micro BS noise floor (speech 8 kbps).
A.1.1.4.2 Data 144 kbps
-105 -100 -95 -90 -85 -80 -75 -7070
75
80
85
90
95
100
105
Micro BS noisefloor (dBm)
Rel
ativ
e C
apac
ity (
%)
Relative capacity versus micro BS noisefloor (Data144)
Micro networkMacro network
Figure A.4: Relative capacity of macro and micro system versus micro BS noise floor (data 144 kbps).
ETSI
ETSI TR 125 951 V6.3.0 (2006-10) 293GPP TR 25.951 version 6.3.0 Release 6
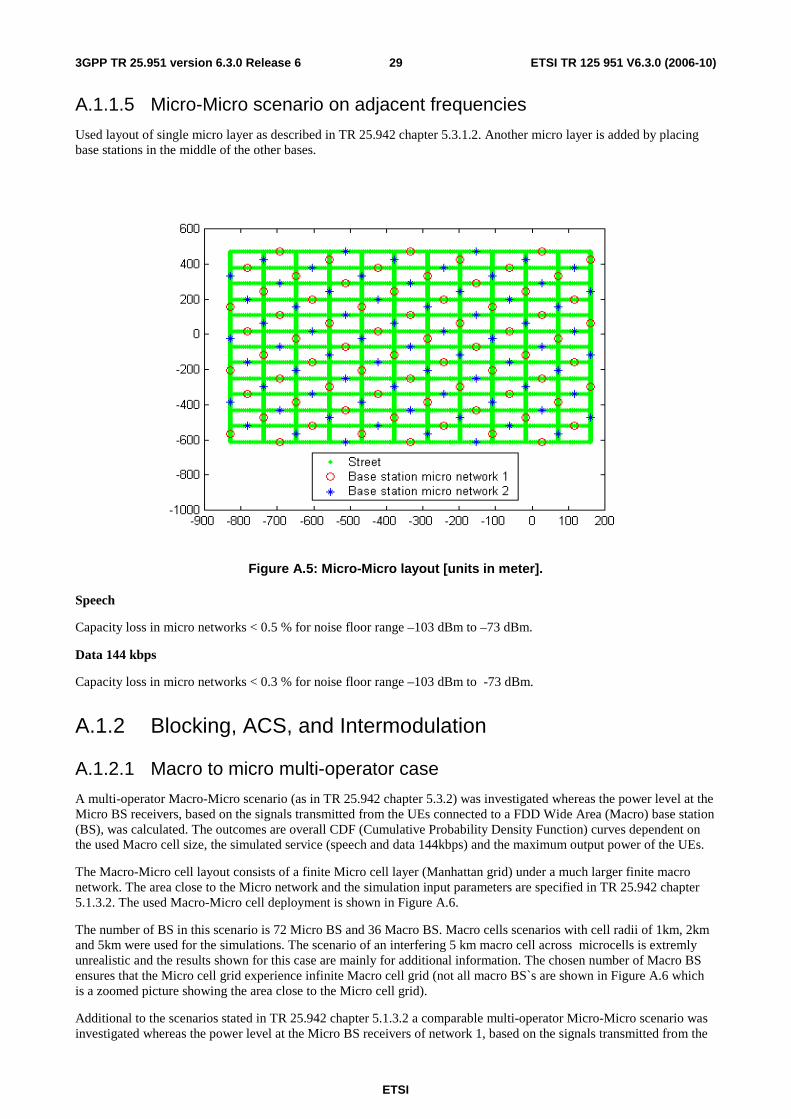
A.1.1.5 Micro-Micro scenario on adjacent frequencies
Used layout of single micro layer as described in TR 25.942 chapter 5.3.1.2. Another micro layer is added by placing base stations in the middle of the other bases.
Figure A.5: Micro-Micro layout [units in meter].
Speech
Capacity loss in micro networks < 0.5 % for noise floor range –103 dBm to –73 dBm.
Data 144 kbps
Capacity loss in micro networks < 0.3 % for noise floor range –103 dBm to -73 dBm.
A.1.2 Blocking, ACS, and Intermodulation
A.1.2.1 Macro to micro multi-operator case
A multi-operator Macro-Micro scenario (as in TR 25.942 chapter 5.3.2) was investigated whereas the power level at the Micro BS receivers, based on the signals transmitted from the UEs connected to a FDD Wide Area (Macro) base station (BS), was calculated. The outcomes are overall CDF (Cumulative Probability Density Function) curves dependent on the used Macro cell size, the simulated service (speech and data 144kbps) and the maximum output power of the UEs.
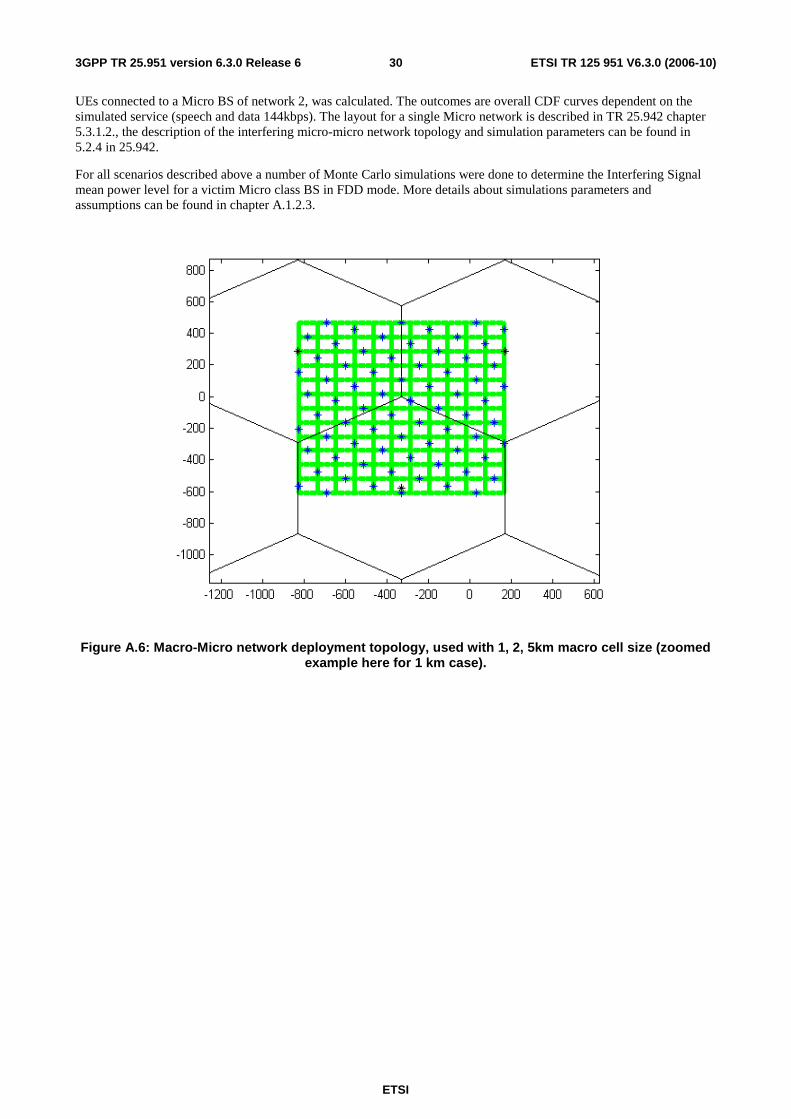
The Macro-Micro cell layout consists of a finite Micro cell layer (Manhattan grid) under a much larger finite macro network. The area close to the Micro network and the simulation input parameters are specified in TR 25.942 chapter 5.1.3.2. The used Macro-Micro cell deployment is shown in Figure A.6.
The number of BS in this scenario is 72 Micro BS and 36 Macro BS. Macro cells scenarios with cell radii of 1km, 2km and 5km were used for the simulations. The scenario of an interfering 5 km macro cell across microcells is extremly unrealistic and the results shown for this case are mainly for additional information. The chosen number of Macro BS ensures that the Micro cell grid experience infinite Macro cell grid (not all macro BS`s are shown in Figure A.6 which is a zoomed picture showing the area close to the Micro cell grid).
Additional to the scenarios stated in TR 25.942 chapter 5.1.3.2 a comparable multi-operator Micro-Micro scenario was investigated whereas the power level at the Micro BS receivers of network 1, based on the signals transmitted from the
ETSI
ETSI TR 125 951 V6.3.0 (2006-10) 303GPP TR 25.951 version 6.3.0 Release 6
UEs connected to a Micro BS of network 2, was calculated. The outcomes are overall CDF curves dependent on the simulated service (speech and data 144kbps). The layout for a single Micro network is described in TR 25.942 chapter 5.3.1.2., the description of the interfering micro-micro network topology and simulation parameters can be found in 5.2.4 in 25.942.
For all scenarios described above a number of Monte Carlo simulations were done to determine the Interfering Signal mean power level for a victim Micro class BS in FDD mode. More details about simulations parameters and assumptions can be found in chapter A.1.2.3.
Figure A.6: Macro-Micro network deployment topology, used with 1, 2, 5km macro cell size (zoomed example here for 1 km case).

ETSI
ETSI TR 125 951 V6.3.0 (2006-10) 313GPP TR 25.951 version 6.3.0 Release 6
FigureA.7: Micro-Micro layout [units in meter].
A.1.2.2 Simulation results
-130 -120 -110 -100 -90 -80 -70 -60 -50 -40 -30 -20 0
0.1
0.2
0.3
0.4
0.5
0.6
0.7
0.8
0.9
1
Received interference power (dBm)
Cum
ulat
ive
Pro
babi
lity
Den
sity
Fun
ctio
n
Macro-micro, 5 km, data UE 33 dBm Macro-micro, 1 km, data, UE 21 dBm Macro-micro, 5 km, speech UE 33 dBm Macro-micro, 1 km, speech, UE 21 dBm Micro-micro, data, UE 21 dBm Micro-micro, Speech, UE 21 dBm
Figure A.8: CDF curves for the received interferer power at the BS input.
ETSI
ETSI TR 125 951 V6.3.0 (2006-10) 323GPP TR 25.951 version 6.3.0 Release 6
Cum
ulat
ive
Pro
babi
lity
Den
sity
Fun
ctio
n
Received interference power (dBm)
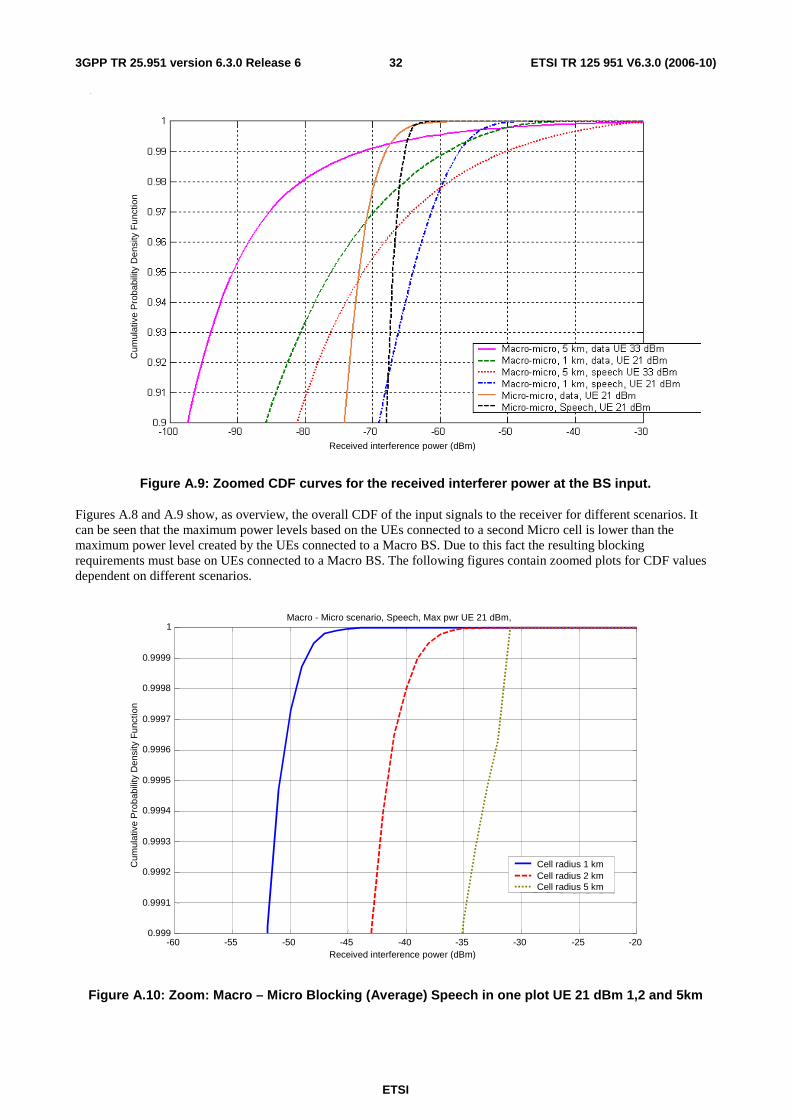
Figure A.9: Zoomed CDF curves for the received interferer power at the BS input.
Figures A.8 and A.9 show, as overview, the overall CDF of the input signals to the receiver for different scenarios. It can be seen that the maximum power levels based on the UEs connected to a second Micro cell is lower than the maximum power level created by the UEs connected to a Macro BS. Due to this fact the resulting blocking requirements must base on UEs connected to a Macro BS. The following figures contain zoomed plots for CDF values dependent on different scenarios.
-60 -55 -50 -45 -40 -35 -30 -25 -20 0.999
0.9991
0.9992
0.9993
0.9994
0.9995
0.9996
0.9997
0.9998
0.9999
1
Received interference power (dBm)
Cum
ulat
ive
Pro
babi
lity
Den
sity
Fun
ctio
n
Macro - Micro scenario, Speech, Max pwr UE 21 dBm,
Cell radius 1 km Cell radius 2 km Cell radius 5 km
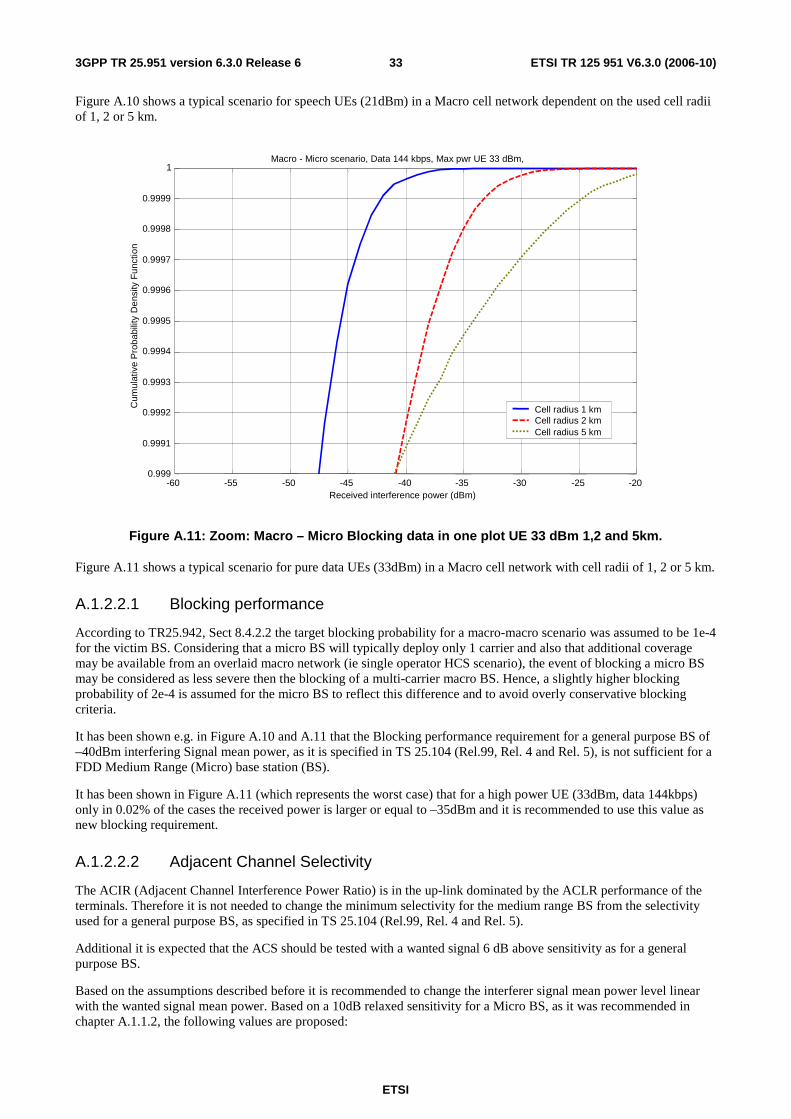
Figure A.10: Zoom: Macro – Micro Blocking (Average) Speech in one plot UE 21 dBm 1,2 and 5km
ETSI
ETSI TR 125 951 V6.3.0 (2006-10) 333GPP TR 25.951 version 6.3.0 Release 6
Figure A.10 shows a typical scenario for speech UEs (21dBm) in a Macro cell network dependent on the used cell radii of 1, 2 or 5 km.
-60 -55 -50 -45 -40 -35 -30 -25 -20 0.999
0.9991
0.9992
0.9993
0.9994
0.9995
0.9996
0.9997
0.9998
0.9999
1
Received interference power (dBm)
Cum
ulat
ive
Pro
babi
lity
Den
sity
Fun
ctio
n
Macro - Micro scenario, Data 144 kbps, Max pwr UE 33 dBm,
Cell radius 1 km Cell radius 2 km Cell radius 5 km
Figure A.11: Zoom: Macro – Micro Blocking data in one plot UE 33 dBm 1,2 and 5km.
Figure A.11 shows a typical scenario for pure data UEs (33dBm) in a Macro cell network with cell radii of 1, 2 or 5 km.
A.1.2.2.1 Blocking performance
According to TR25.942, Sect 8.4.2.2 the target blocking probability for a macro-macro scenario was assumed to be 1e-4 for the victim BS. Considering that a micro BS will typically deploy only 1 carrier and also that additional coverage may be available from an overlaid macro network (ie single operator HCS scenario), the event of blocking a micro BS may be considered as less severe then the blocking of a multi-carrier macro BS. Hence, a slightly higher blocking probability of 2e-4 is assumed for the micro BS to reflect this difference and to avoid overly conservative blocking criteria.
It has been shown e.g. in Figure A.10 and A.11 that the Blocking performance requirement for a general purpose BS of –40dBm interfering Signal mean power, as it is specified in TS 25.104 (Rel.99, Rel. 4 and Rel. 5), is not sufficient for a FDD Medium Range (Micro) base station (BS).
It has been shown in Figure A.11 (which represents the worst case) that for a high power UE (33dBm, data 144kbps) only in 0.02% of the cases the received power is larger or equal to –35dBm and it is recommended to use this value as new blocking requirement.
A.1.2.2.2 Adjacent Channel Selectivity
The ACIR (Adjacent Channel Interference Power Ratio) is in the up-link dominated by the ACLR performance of the terminals. Therefore it is not needed to change the minimum selectivity for the medium range BS from the selectivity used for a general purpose BS, as specified in TS 25.104 (Rel.99, Rel. 4 and Rel. 5).
Additional it is expected that the ACS should be tested with a wanted signal 6 dB above sensitivity as for a general purpose BS.
Based on the assumptions described before it is recommended to change the interferer signal mean power level linear with the wanted signal mean power. Based on a 10dB relaxed sensitivity for a Micro BS, as it was recommended in chapter A.1.1.2, the following values are proposed:
ETSI
ETSI TR 125 951 V6.3.0 (2006-10) 343GPP TR 25.951 version 6.3.0 Release 6
Wanted signal mean power: -105dBm (-115dBm general purpose BS)
Interfering signal mean power: -42dBm (-52dBm general purpose BS)
A.1.2.2.3 Intermodulation Characteristics
Receiver intermodulation can occur when two interfering signals with a particular relationship are applied to a BS receiver. The probability of two signals interfering the same BS simultaneously should be in the same order than probability for blocking interferer level. We assume a reasonable value of 0.01% . Assuming two independent networks the probability is the multiplication of the probability of an interferer power level based on network 1 and the corresponding probability based on network 2.
Starting with the likely scenario with two networks, one Macro and one Micro, serving UEs which interferes a victim Micro BS. In this case the interferer levels are normally not equal resulting in one Interferer with higher power (Inthigh) and one Interferer with low power (Intlow). On the other hand it is beneficial to recalculate a requirement based on equal interferers. This approach allows one requirement covering different scenarios. Based on a simple IM3 scenario the following formula can be used:
Equivalent Interfering Signal mean power [dBm] = (2* Inthigh [dBm] + Intlow [dBm])/ 3
The CDF curve of a Micro – Micro scenario is very sharp (see Figure X10). The probability of an interference signal of > -66dBm is smaller than 1% but the probability of an interference signal of > -68dBm is in the order of 10%. Keeping the overall required probability of 0.01% and using a 10% probability for the interference of the Micro network a target value of 0.999 for the CDF of a Macro network is remaining. This results in an interferer level of –33dBm for the Inthigh. (Figure X11a) The calculated interferer levels are:
Interferer Requirement [dBm] = (2* (-33) [dBm] +(-68) [dBm])/ 3 = -44.7dBm
Based on the calculation above an interfering signal mean power level of –44dBm is proposed. This value is 9dB smaller than the proposed interferer level of –35dBm for blocking. This difference is in the same order of magnitude like the difference between the interferers for blocking and intermodulation in case of a wide area BS.
Assuming now two equal but independent Macro or Micro networks serving UEs which interferers a victim Micro BS. In this case the probability for one interfering signal increasing the required power level at the Micro BS receiver should be smaller than 1.41 %. It is shown in Figure A.9 that the proposed requirement of –44dBm interferer level for a medium range BS is sufficient also for these scenarios.

ETSI
ETSI TR 125 951 V6.3.0 (2006-10) 353GPP TR 25.951 version 6.3.0 Release 6
A.1.2.3 Simulation parameters
Table A.2: Simulation Parameters
Simulation parameter Uplink
MCL macro / micro 70 / 53 dB Antenna gain (including losses Base station Mobile
11 dBi 0 dBi
Log-normal shadow fading standard deviation
10 dB
Noise floor RBS receiver Macro / micro
-103 / -93 dBm
Maximum TX power speech 21, 24, 27, 33 dBm Maximum TX power data 21, 33 dBm Minimum TX power speech -50 dBm ACIR 33 dB Power control Perfect PC Power control error 0.01 dB Outage condition C/I target not reached due to lack of TX power Admission control Not included Macro User distribution in macro network Random and uniform over the network Micro User distribution in micro network Random and uniform over the streets Macro User distribution in micro network Random and uniform over the streets Bit rate speech 8 kbps Activity factor speech 100 % Eb/No target speech macro / micro
6.1 / 3.3 dB
Bit rate data 144 kbps Activity factor data 100 % Eb/No target data macro / micro
3.1 / 2.4 dB
Micro deployment Manhattan scenario Block size 75 m Road width 15 m Intersite distance between line-of-sight 180 Number of micro cells 72 Number of macro cells 3 affected macros
36 in total Macro cell radius 1 km / 2km / 5km (5 km case for information only)
A.2 Pico base stations in FDD mode
A.2.1 Mixed microcell-picocell scenario Studies and simulations have been performed in order to define requirements for the Local area BS class. The simulations were done using a mixed microcell-picocell environment, where the pico environment is embedded in the micro environment. The size of the pico environment is one building with 20 rooms, and the micro environment consists of 9 buildings in a 3x3 array. Figure A.12 shows a diagram of the environment.

ETSI
ETSI TR 125 951 V6.3.0 (2006-10) 363GPP TR 25.951 version 6.3.0 Release 6
Figure A.12: Mixed micro-pico environment with 12 micro and 10 pico base stations
Appropriate requirements for LA BS blocking are derived from the results of these additional simulations.
Proposals for this and other relevant receiver requirements for the Local area BS class will be presented in following sections.
A.2.2 Receiver sensitivity A number of simulations were performed to study the impact of the noise rise in both micro- and picocell scenarios. The results are applicable for both multi-operator or a single operator case.
A.2.2.1 Simulation parameters
Used simulation parameters can be found in Table A.3.

ETSI
ETSI TR 125 951 V6.3.0 (2006-10) 373GPP TR 25.951 version 6.3.0 Release 6
Table A.3: Simulation parameters
Parameter Value Comments Active set size 1 or 3 1 is HHO, 3 is SHO Number of BSs 12 Micro BSs,
10 Pico BSs
ACS/ACLR/ACIR UE: 33/33, BS:45/45 UL: 32.73, DL: 32.73 or UE: 43/43 , BS: 45/45, UL: 40.88, DL: 40.88 or UE: 33/33, BS: 50/50 UL: 32.91, DL: 32.91
Base station transmission powers: Min/Max/MinPerUser/MaxPerUser
Micro: Min: 23 dBm, Max 33 dBm, Min per User: 5 dBm Max per User: 30 dBm Pico: Min: 14 dBm, Max 24 dBm, Min per User: 21 dBm Max per User: -4 dBm
The minimum BS tx powers are derived from pilot powers: Pilot power = BS max power – 10 dB.
Simulated services 12 kbps speech (Processing gain=315) , 142 kbps data (processing gain = 27)
One simulation is always either purely data or purely speech, there are no mixed data-speech cases.
Speech EbNo-targets Micro: UL 3.3 dB, DL 7.9 dB Pico: UL 3.3 dB, DL 6.1 dB
Data EbNo-targets Micro: UL 2.4 dB, DL 1.9 dB Pico: UL 2.4 dB, DL 1.9 dB
DL Outage target 5 % Same for both pico and micro. NOTE: This was basically irrelevant since it was not reached in any of the simulations.
UL Noise rise target 6 dB Same for both pico and micro Minimum Coupling loss Micro: 53 dB
Pico: 45 dB
Propagation Model According to 25.951 UE Tx power limits Min: -50 dBm
Max: 21 dBm
Slow fading deviation (Mean: 0 dB) Micro: 6 dB Pico: 6 dB
DL System noise -99 dBm (both micro and pico) UL system noise -103 dBm (both micro and
pico)
Number of Pico cell users Speech, AS1: 60 Speech, AS3: 62 Data, AS1: 35 Data, AS3: 40
The numbers of users were selected such that 6 dB noise rise was reached in reference cases
Number of Micro cell users Speech, AS1: 185(0% indoors) or 200(10% indoors) Speech, AS3: 185 (0% indoors) or 205 (10% indoors) Data, AS1: 65 (0% indoors) or 67 (10% indoors) Data,AS3: 75 (0% indoors) or 77 (10% indoors)
The numbers of users were selected such that 6 dB noise rise was reached in reference cases

ETSI
ETSI TR 125 951 V6.3.0 (2006-10) 383GPP TR 25.951 version 6.3.0 Release 6
A.2.2.2 Simulation results
Additional noise rise was studied for the both micro- and picocell BSs. In cases where all micro users are outdoors different operators doesn"t disturb each others. There is no influence in UL.
Figure A.13 covers the situation where all micro users are located outdoors and are using speech service. Also situation when 10 % of microcell users are inside is presented in Figure A.13. UL noise rise in pico is growing and this represent the worst case.
Figure A.14 covers the situation when 10 % of microcell users are indoors. UL noise rise is presented as a function of ACIR value.
Results with data service are almost identical to speech service. Because user bit rates are bigger, disturbance from single user is bigger and random factors may affect the results. Micro suffers relatively less than pico.
The worst case noise rise for picocell BSs is 15.8 dB which means 9.8 dB noise rise compared to macro. A macro value comparable to high load with 75% pole capacity is 6 dB.
Noise rise, AS1
0
2
4
6
8
10
12
14
16
18
Ref Mixed, ACIR1 Mixed, ACIR2 Mixed, ACIR3
Cases
No
ise
rise
[d
B]
Micro, 0% micro users indoors
Pico, 0% micro users indoors
Micro, 10 % micro users indoors
Pico, 10% micro users indoors
Figure A.13: UL noise rise versus ACIR value
Pico, Noise rise, 10% Micro users indoors
0
2
4
6
8
10
12
14
16
18
Ref Mixed, ACIR1 Mixed, ACIR2 Mixed, ACIR3
Cases
No
ise
rise
[d
B]
AS1
AS3
Figure A.14: UL noise rise versus ACIR value with AS1 and AS3

ETSI
ETSI TR 125 951 V6.3.0 (2006-10) 393GPP TR 25.951 version 6.3.0 Release 6
As a conclusion the simulations results show that there is no noise rise if all micro users are located outdoors. If some users are located indoors noise rise will rise in pico UL.
A.2.2.3 Noise rise for UL in Picocell environment
In this chapter we analyse more detail the noise rise for UL in Picocell environment. The most important and a typical scenario for adjacent channel interference could be a UE at the edge of a microcell transmitting high power in UL close to a picocell BS. However, at the same time, the UE is receiving interference from the picocell BS on the adjacent carrier in DL. This can lead to DL blocking of an interfering UE thus reducing the overall level of adjacent channel interference to picocell BS. A detailed analysis is presented in section A.2.2.4. As a result a noise rise is 4 dB…11.7 dB depending on the bit rate in the UL (12.2 kbps…144 kbps).
The analytical study indicates that the additional noise rise in picocell due to other operator microcell is in the range of 4 dB…11.7 dB above the microcell interference levels. Microcell noise rise compared to macrocell was <2 dB as presented in [5]. Additional picocell noise rise compared to current specification will be though 13.7 dB in the worst case.
A.2.2.4 UL noise rise calculation for the picocell BS
The additional UL noise rise in WCDMA FDD picocell BS due the adjacent channel operation has been computed here. The basic scenario has been shown in Figure A.15.
Lp
PUE
Lm Pm
pp
Figure A.15. Micro- and picocell operation at adjacent frequency bands.
The required power for the microcell user can be computed by the equation:
ρα
≥++−+
⋅NII
DLACIRL
PL
p
R
W
othownp
p
m
m
)1(_
,
where Pm is the power allocated to the microcell user, Lm is the pathloss from the microcell antenna to the mobile, Pp is the power of the pico BS, Lp is the pathloss from pico base station to the mobile and ACIR_DL is the adjacent channel interferenece in the downlink. Assuming that most of the interference comes from an other operator's pico cell the minimum required pathloss:
m
pmp p
P
DLACIRW
LRL
_⋅⋅⋅≥ ρ
The uplink interference at the pico BS can therefore computed as:

ETSI
ETSI TR 125 951 V6.3.0 (2006-10) 403GPP TR 25.951 version 6.3.0 Release 6
m
UE
p
m
LRULACIR
DLACIRWP
P
pI
⋅⋅⋅⋅⋅⋅=
ρ_
_
W
RILP
IL
P
R
W ULULmULUEUL
ULm
UE
UL
ρρ =⇒=
W
RIL
LRULACIR
DLACIRW
P
pI ULULmUL
mp
m ρρ ⋅⋅⋅
⋅⋅=_
_
RULACIR
DLACIRRI
P
pI ULULUL
p
m
⋅⋅⋅⋅=
ρρ
_
_
The DL dedicated channel power in micro can be written as:
refref
pilotm R
RPp
ρχρ
⋅= ,
where χ is the power adjustment paramter; when χ=1 (0 dB), the reference service is given the same power as for the pilot channel, when χ=2 (3 db), for instance, the reference service is given 3 dB less power than for the pilot.
The interference can be then written as:
ULACIR
DLACIRRI
PR
P
RULACIR
DLACIRRI
PR
RPI ULULUL
prefref
pilotULULUL
prefref
pilot
_
_1
_
_1 ⋅⋅⋅
=⋅⋅
⋅⋅⋅
= ρρχρ
ρρχρ
RUL, ρUL are UL parameters for the microcell RAB
Rref, ρref are DL parameters of the microcell ref RAB
So what we can notice is that the interference in UL in pico is independent on the pathloss between micro and pico.
Then, if
Ppilot=30 dBm
χ=1
Rref=12.2 kbps
ρUL=5dB
ρref=8dB
RUL=12.2kbps
ACIR_DL/ACIR_UL=-3 dB;
Pp=20 dBm
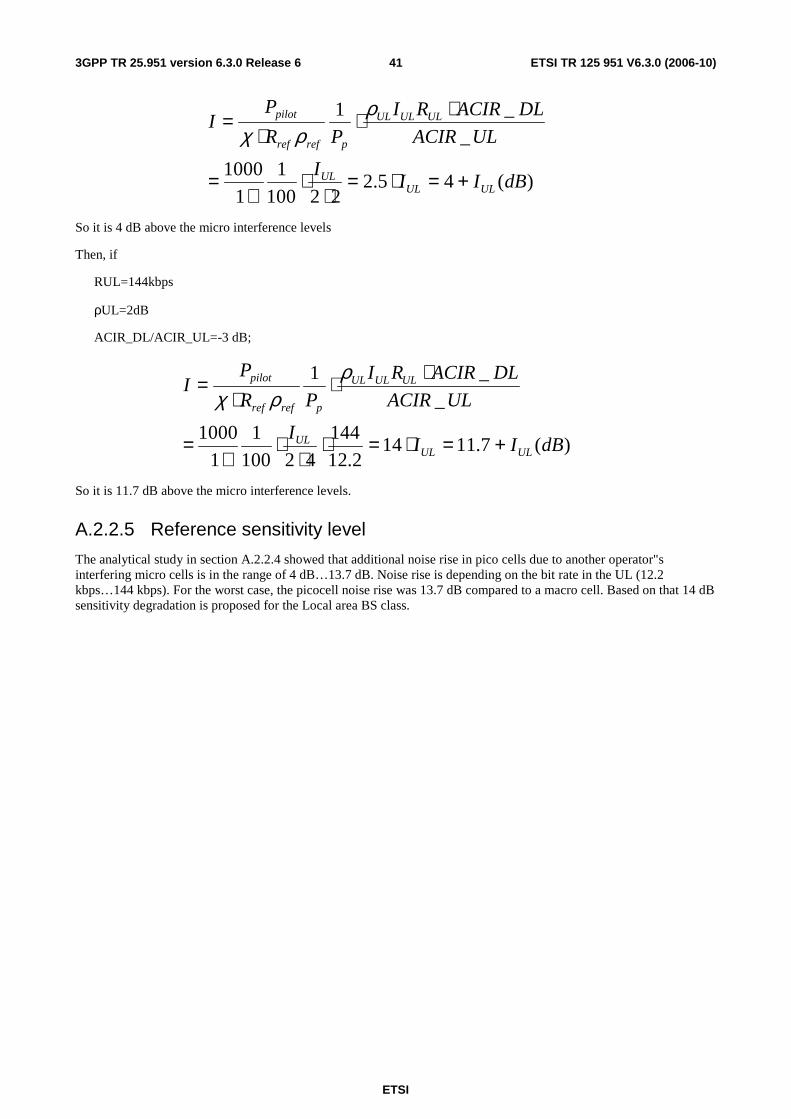
ETSI
ETSI TR 125 951 V6.3.0 (2006-10) 413GPP TR 25.951 version 6.3.0 Release 6
)(45.222100
1
1
1000
_
_1
dBIII
ULACIR
DLACIRRI
PR
PI
ULULUL
ULULUL
prefref
pilot
+=⋅=⋅
⋅⋅
=
⋅⋅⋅
= ρρχ
So it is 4 dB above the micro interference levels
Then, if
RUL=144kbps
ρUL=2dB
ACIR_DL/ACIR_UL=-3 dB;
)(7.11142.12
144
42100
1
1
1000
_
_1
dBIII
ULACIR
DLACIRRI
PR
PI
ULULUL
ULULUL
prefref
pilot
+=⋅=⋅⋅
⋅⋅
=
⋅⋅⋅
= ρρχ
So it is 11.7 dB above the micro interference levels.
A.2.2.5 Reference sensitivity level
The analytical study in section A.2.2.4 showed that additional noise rise in pico cells due to another operator"s interfering micro cells is in the range of 4 dB…13.7 dB. Noise rise is depending on the bit rate in the UL (12.2 kbps…144 kbps). For the worst case, the picocell noise rise was 13.7 dB compared to a macro cell. Based on that 14 dB sensitivity degradation is proposed for the Local area BS class.
ETSI
ETSI TR 125 951 V6.3.0 (2006-10) 423GPP TR 25.951 version 6.3.0 Release 6
A.2.3 Dynamic range, ACS, Blocking and Intermodulation
A.2.3.1 Simulation parameters
Table A.4: Simulation Parameters
Parameter Value Comments Active set size 3 For SHO Number of BSs 12 Micro BSs,
10 Pico BSs
ACS/ACLR/ACIR Not used here for blocking simulations
Base station transmission powers: Min/Max/MinPerUser/MaxPerUser
Micro: Min: 23 dBm, Max 33 dBm, Min per User: 5 dBm Max per User: 30 dBm Pico: Min: 14 dBm, Max 24 dBm, Min per User: 21 dBm Max per User: -4 dBm
The minimum BS tx powers are derived from pilot powers: Pilot power = BS max power – 10 dB.
Simulated services 144 kbps data Speech EbNo-targets - Data EbNo-targets Micro:
UL 2.4 dB, DL 1.9 dB Pico: UL 2.4 dB, DL 1.9 dB
DL Outage target 5 % Same for both pico and micro. NOTE: This was basically irrelevant since it was not reached in any of the simulations.
UL Noise rise target 6 dB Same for both pico and micro Minimum Coupling loss Micro: 53 dB
Pico: 45 dB
Propagation Model According to 25.951 UE Tx power limits Min: -50 dBm
Max: 21 dBm
Slow fading deviation (Mean: 0 dB) Micro: 6 dB Pico: 6 dB
DL System noise -99 dBm (both micro and pico) UL system noise -103 dBm (both micro and
pico)
Number of Pico cell users Data, AS3: 40 The numbers of users were selected such that 6 dB noise rise was reached in reference cases
Number of Micro cell users 77 (10% indoors) The numbers of users were selected such that 6 dB noise rise was reached in reference cases
A.2.3.2 Dynamic range
It is proposed not to tighten the requirement for the Receiver dynamic range for the LA BS class. It should be tested with a wanted signal 30 dB above sensitivity. Correspondingly, the difference between wanted and interfering signals remains the same as for Wide area BS.
Following signals are proposed for Dynamic range:
- wanted signal: –77dBm
- interfering AWGN signal: –59 dBm.

ETSI
ETSI TR 125 951 V6.3.0 (2006-10) 433GPP TR 25.951 version 6.3.0 Release 6
A.2.3.3 ACS
The ACIR (Adjacent Channel Interference Power Ratio) is in the up-link dominated by the ACLR performance of the terminals. Therefore it is not needed to change the minimum selectivity for the LA BS from the selectivity used for a general purpose BS, as specified in TS 25.104.
Based on these assumptions, it is recommended to change the interferer signal mean power level linear with the wanted signal mean power. Additionally, it is expected that the ACS should be tested with a wanted signal 6 dB above sensitivity as for a general purpose BS.
Following signals are proposed for ACS:
- wanted signal –101 dBm
- interfering signal –38 dBm.
A.2.3.4 Blocking characteristics
In order to derive a blocking requirement, we may want to relate it to the ACS requirement. For a single carrier LA BS, the impact of adjacent channel interference reaching a given interference level (ie -38 dBm as proposed in the previous section) is essentially the same as if a blocking level would be reached; in either case the LA BS receiver will be desensitized by 6 dB effecting the same amount of connections (due to the single carrier assumption).
Hence, given identical consequences of these 2 events, we may then require the same (low) probability of occurrence for them.
There are at most 2 adjacent carriers where adjacent channel interference can occur for a given LA BS RX carrier. However, within the Band I allocation of 12 carriers, there may be at most 12 – 2 – 1 = 9 carriers where blocking (but not adjacent channel interference) may originate from; thus having an approximately 4.5 times larger chance of occurring (assuming the same event probabilities for ACS, respectively blocking). The exact combinatorics should also take carriers at the band edge into account
Hence, one may now wish to ensure that blocking does occur at least 4.5 times less than adjacent channel interference. In order to do this, we will consider the resulting UL interference at the LA BS due to the micro cell UE"s for the following two cases:
- blocking of micro cell UE"s due to the LA BS is not considered
- blocking of micro cell UE"s due to the LA BS is considered with a blocking threshold of –39 dBm, ie 5 dB higher than the corresponding value from TS 25.101 (= -44 dBm).
Figure A.16 shows a simulation results for 144 kbps data service with 10 % of the micro UEs indoors (worst case) for case a) with no UE blocking considered. As can be seen in zoomed version in Figure A.17, the proposed interfering signal of –38 dBm for ACS corresponds to value where 97.325% of occurences of the input signals to the receivers are less this level. Hence, probability to get blocked by ACS will be 1-0.97325 = 0.02675.
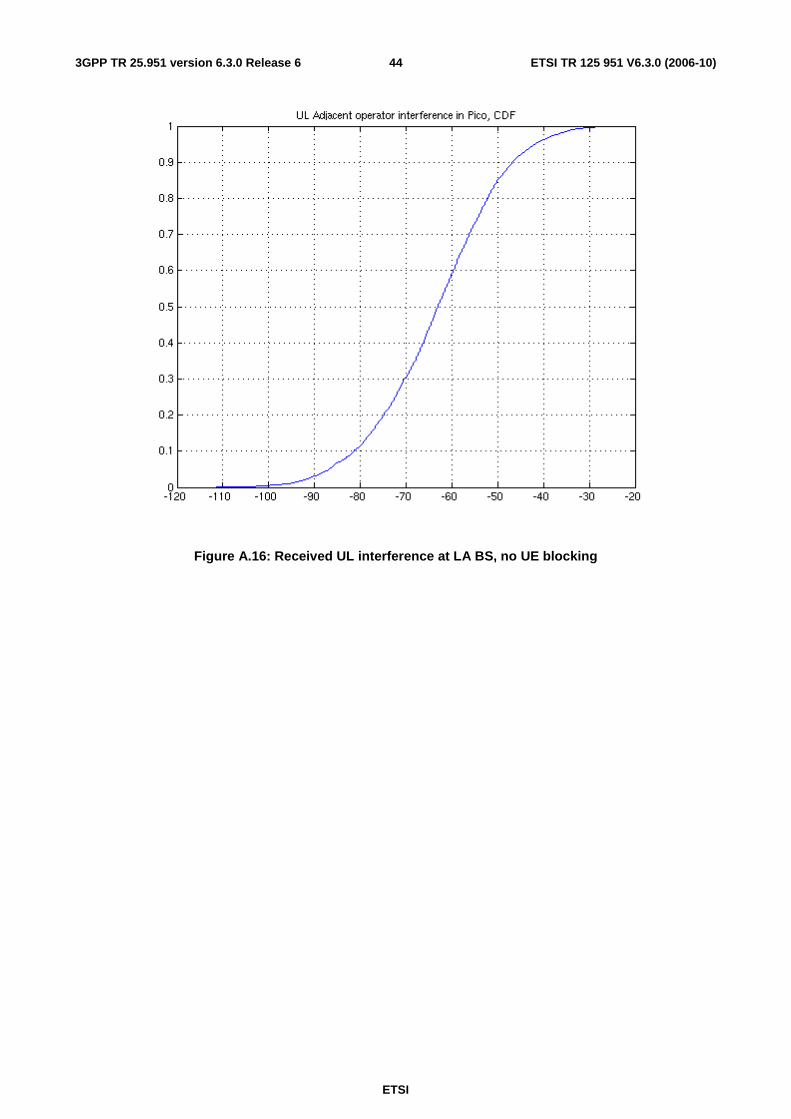
ETSI
ETSI TR 125 951 V6.3.0 (2006-10) 443GPP TR 25.951 version 6.3.0 Release 6
Figure A.16: Received UL interference at LA BS, no UE blocking

ETSI
ETSI TR 125 951 V6.3.0 (2006-10) 453GPP TR 25.951 version 6.3.0 Release 6
Figure A.17: Received UL interference at LA BS, no UE blocking
According to above methodology, one may now wish to ensure that blocking does occur at least 4.5 times less than adjacent channel interference. Hence, we obtain for the probability for blocking 0.02675/ 4.5 = 0.00594. We will have CDF value 1-0.00594 = 0.9945. From the Figure A.17, we derive the required value for interfering (blocking) signal to be around –30 dBm.
In reality, micro cell UE"s will become blocked due to the strong signal from the LA BS, before they can cause significant interference (blocking) to the LA BS on UL. Thus the received UL interference CDFs in Figures A.16 and A.17 are very pessimistic and do not reflect the real situation adequately.
Figures A.18 and A.19 show CDFs with DL UE blocking included. UEs receiving higher interfering signal than a blocking threshold of –39 dBm will be removed from the UL interference statistics. As can be seen, UL interference levels at LA BS are significantly reduced.
The event probabilities for 'ACS blocking' are now 0.00525. Probabilities for 'blocking' are respectively 0 (i.e. LA BS blocking did not occur at all).
Two remarks are appropriate:
- blocker level of –44 dBm in TS 25.101 is only a minimum performance requirement and may be exceeded by actual UE implementation. Here it is assumed that for a 5 dB higher level (-39 dBm) blocking has indeed occurred.
- Micro cell UE"s may also loose connection due to ACLR/spurious emissions from LA BS under low CL conditions. This effect is, however, not included in the CDFs and the shown results including UE blocking are thus conservative

ETSI
ETSI TR 125 951 V6.3.0 (2006-10) 463GPP TR 25.951 version 6.3.0 Release 6
Figure A.18: Received UL interference at LA BS, with UE blocking at –39 dBm

ETSI
ETSI TR 125 951 V6.3.0 (2006-10) 473GPP TR 25.951 version 6.3.0 Release 6
Figure A.19: Received UL interference at LA BS, with UE blocking at –39 dBm
Based on these findings it is proposed that a blocker level of –30 dBm is sufficient for a LA BS.
Blocking characteristics of the Local area BS can be tested with the wanted signal level 6 dB above Reference sensitivity level as for Wide area BS. For Local area BS that means the level –121 dBm + 14 dB + 6 dB = -101 dBm.
Based on this following signals are proposed for In band blocking:
- wanted signal –101 dBm
- interfering signal –30 dBm.
Out of band blocking requirements can be kept unchanged except the wanted signal which will be 6 dB above reference sensitivity level.
A.2.3.5 Intermodulation characteristics
Receiver intermodulation can occur when two interfering signals with a particular relationship are applied to a BS receiver. Two large interfering signals at the same time occurs less frequently than a single interfering signal. Due to lower probability of two large interfering signals, the power level of the interfering signals for the Intermodulation requirement should be lower compared to Blocking requirement. For the Wide area BS, the level of interfering signals are 8 dB lower compared to Blocking requirement. It is proposed same relative values also for the Local area BS.

ETSI
ETSI TR 125 951 V6.3.0 (2006-10) 483GPP TR 25.951 version 6.3.0 Release 6
Following signals for Intermodulation is proposed:
- wanted signal –101 dBm
- interfering signals –38 dBm.
A.3 Maximum output power for Medium range BS class
A.3.1 Simulation results #1
A.3.1.1 Simulation scenario
Earlier simulations were performed based on an statistical approach where the criteria for micro BS output power is defined as the outage probability for uncoordinated macro network UE:s.
In order to compare the outage due to micro layer with reference cases, simulations for single macro layer and macro-macro cell layout with maximum offset between the two uncoordinated macro layers (worst case) were also performed. The maximum output power of the interfering Wide area BSs in the macro-macro cell layout was limited to the typical value of 43dBm.
The approach is conservative because the comparison with the macro-macro cell layout is based on interfering Wide area BS with a maximum output power of 43dBm. In real life this value could be much higher as up to 50dBm.
A.3.1.2 Simulation results
The new simulations were again based on the macro-micro cell layout in where the micro cell layer were assumed to be fully loaded for different values for micro output power. In order to compare the outage due to micro layer with reference cases, simulations for single macro layer and macro-macro cell layout with maximum offset between the two uncoordinated macro layers (worst case) were performed.
The maximum output power for the interfering Wide area BSs was set to 47dBm (50W). The value of 47dBm is assumed as a realistic worst-case scenario for the given cell layout. The maximum output power of the Wide Area BSs of the disturbed macro layer network was kept to 43dBm and the maximum code power was limited to 30dBm.
The outage probability on macro layer for site-to-site distances of 1 km (cell radius of 577m) in the presence of a micro cell grid for a fixed micro output power of 27, 30, 33, 34, 35, 36, and 37dBm for each BS are as following:
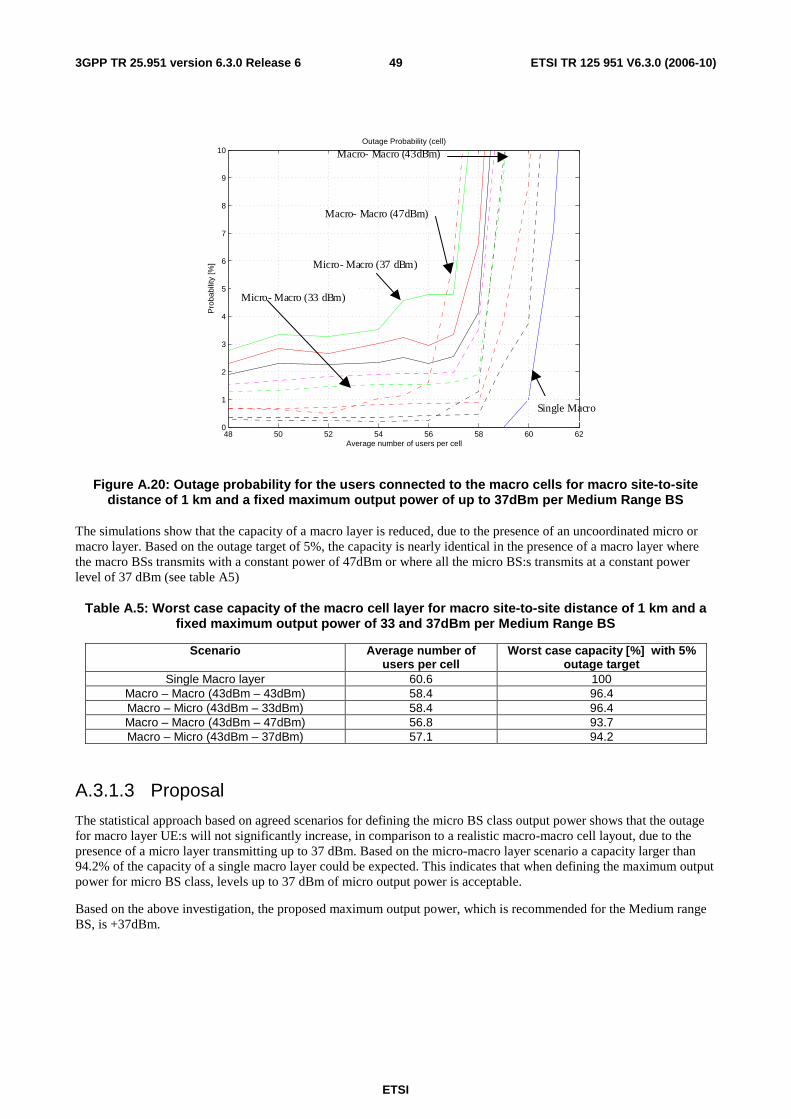
ETSI
ETSI TR 125 951 V6.3.0 (2006-10) 493GPP TR 25.951 version 6.3.0 Release 6
48 50 52 54 56 58 60 620
1
2
3
4
5
6
7
8
9
10Outage Probability (cell)
Average number of users per cell
Pro
babi
lity
[%]
Macro- Macro (43dBm)
Macro- Macro (47dBm)
Single Macro
Micro- Macro (37 dBm)
Micro- Macro (33 dBm)
Figure A.20: Outage probability for the users connected to the macro cells for macro site-to-site distance of 1 km and a fixed maximum output power of up to 37dBm per Medium Range BS
The simulations show that the capacity of a macro layer is reduced, due to the presence of an uncoordinated micro or macro layer. Based on the outage target of 5%, the capacity is nearly identical in the presence of a macro layer where the macro BSs transmits with a constant power of 47dBm or where all the micro BS:s transmits at a constant power level of 37 dBm (see table A5)
Table A.5: Worst case capacity of the macro cell layer for macro site-to-site distance of 1 km and a fixed maximum output power of 33 and 37dBm per Medium Range BS
Scenario Average number of users per cell
Worst case capacity [%] with 5% outage target
Single Macro layer 60.6 100 Macro – Macro (43dBm – 43dBm) 58.4 96.4 Macro – Micro (43dBm – 33dBm) 58.4 96.4 Macro – Macro (43dBm – 47dBm) 56.8 93.7 Macro – Micro (43dBm – 37dBm) 57.1 94.2
A.3.1.3 Proposal
The statistical approach based on agreed scenarios for defining the micro BS class output power shows that the outage for macro layer UE:s will not significantly increase, in comparison to a realistic macro-macro cell layout, due to the presence of a micro layer transmitting up to 37 dBm. Based on the micro-macro layer scenario a capacity larger than 94.2% of the capacity of a single macro layer could be expected. This indicates that when defining the maximum output power for micro BS class, levels up to 37 dBm of micro output power is acceptable.
Based on the above investigation, the proposed maximum output power, which is recommended for the Medium range BS, is +37dBm.

ETSI
ETSI TR 125 951 V6.3.0 (2006-10) 503GPP TR 25.951 version 6.3.0 Release 6
A.3.2 Simulation results #2
A.3.2.1 Simulation scenario
This contribution provides simulation results based on the agreed scenario in TR25.942 in order to define a suitable maximum output power for the MR BS class.
The criteria for MR BS output power is defined so as not to cause undue outage for an uncoordinated macro network UE:s.
A.3.2.2 Simulation results
In here the philosophy for establishing a maximum output power requirement for the MR BS class is to set this value as high as possible in order to maximise the coverage per MR BS site (economic reasons), but yet low enough, as not to cause noticeable outage on the DL of any surrounding uncoordinated macro network.
Before studying the DL interference impact from the MR network onto the macro network, it is appropriate to investigate the DL operating point of the MR layer. This includes the following items:
- DL capacity as function of MR Tx power
- relationship between UL and DL outage
- issue of possible code-blocking
Figure A21 shows the 12.2 kbps speech service outage on UL and DL for a MR layer with 33 dBm TX power. It can be clearly seen that 33 dBm TX power is in this scenario excessive in order to match the UL capacity of approximately 95 users @ 5 % outage. This is primarily due to the assumed high orthogonality of 94 % which effectively reduces interference on the DL.
Micro layer UL and DL outage
0
10
20
30
40
50
60
97 111 125 139 153 167
Number of UEs / site
Ou
tag
e %
DL Outage %
UL Outage %
Figure A.21 Outage for MR layer with 33 dBm TX power
It should be also noted that the theoretical capacity of approximately 140 speech users (Assuming VA factor = 1 according to TR 25.942) @ 5 % DL outage cannot be realized as this is in excess of the code capacity limit, in particular, when considering realistic voice activity factors. A similar investigation for the 144 kbps data service exhibits an even larger (primarily because of the DL Eb/No assumptions in TR 25.942 of voice vs data) DL/UL capacity asymmetry with DL throughput of approximately 4.4 Mbps / site and leads hence to the same conclusion. Therefore a naïve application of the DL load criteria (Specified for macro/macro multi-operator DL simulations. Both networks should be loaded up to 5 % outage ) according to TR25.942 leads obviously to a nonsensical scenario and hence, we assume the DL load is matched to the carried UL traffic.
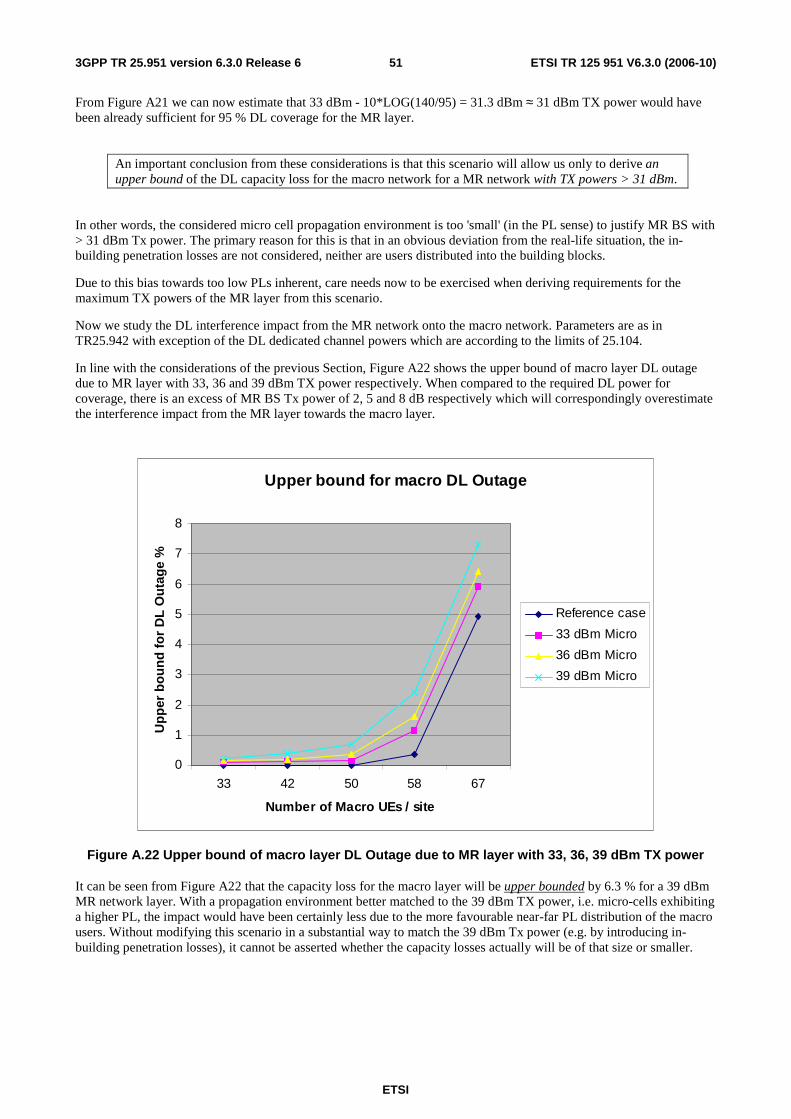
ETSI
ETSI TR 125 951 V6.3.0 (2006-10) 513GPP TR 25.951 version 6.3.0 Release 6
From Figure A21 we can now estimate that 33 dBm - 10*LOG(140/95) = 31.3 dBm ≈ 31 dBm TX power would have been already sufficient for 95 % DL coverage for the MR layer.
An important conclusion from these considerations is that this scenario will allow us only to derive an upper bound of the DL capacity loss for the macro network for a MR network with TX powers > 31 dBm.
In other words, the considered micro cell propagation environment is too 'small' (in the PL sense) to justify MR BS with > 31 dBm Tx power. The primary reason for this is that in an obvious deviation from the real-life situation, the in-building penetration losses are not considered, neither are users distributed into the building blocks.
Due to this bias towards too low PLs inherent, care needs now to be exercised when deriving requirements for the maximum TX powers of the MR layer from this scenario.
Now we study the DL interference impact from the MR network onto the macro network. Parameters are as in TR25.942 with exception of the DL dedicated channel powers which are according to the limits of 25.104.
In line with the considerations of the previous Section, Figure A22 shows the upper bound of macro layer DL outage due to MR layer with 33, 36 and 39 dBm TX power respectively. When compared to the required DL power for coverage, there is an excess of MR BS Tx power of 2, 5 and 8 dB respectively which will correspondingly overestimate the interference impact from the MR layer towards the macro layer.
Upper bound for macro DL Outage
0
1
2
3
4
5
6
7
8
33 42 50 58 67
Number of Macro UEs / site
Up
per
bo
un
d f
or
DL
Ou
tag
e %
Reference case
33 dBm Micro
36 dBm Micro
39 dBm Micro
Figure A.22 Upper bound of macro layer DL Outage due to MR layer with 33, 36, 39 dBm TX power
It can be seen from Figure A22 that the capacity loss for the macro layer will be upper bounded by 6.3 % for a 39 dBm MR network layer. With a propagation environment better matched to the 39 dBm TX power, i.e. micro-cells exhibiting a higher PL, the impact would have been certainly less due to the more favourable near-far PL distribution of the macro users. Without modifying this scenario in a substantial way to match the 39 dBm Tx power (e.g. by introducing in-building penetration losses), it cannot be asserted whether the capacity losses actually will be of that size or smaller.

ETSI
ETSI TR 125 951 V6.3.0 (2006-10) 523GPP TR 25.951 version 6.3.0 Release 6
A.3.2.3 Proposal
Based on the current micro-macro scenario of TR25.942 it can be concluded that the capacity loss for the macro layer will be at most 6.3 % for a 39 dBm MR network layer, however, that assumes that the MR layer has been operated with 8 dB more TX power than required, i.e. overestimating the interference impact.
With these considerations in mind, the proposed maximum output power, which is recommended for the Medium range BS, is +39 dBm.
A.4 Maximum output power for Local area BS class
A.4.1 Simulation results #1
A.4.1.1 Simulation scenario
This contribution provides simulation results based on the agreed baseline scenario in TR 25.951 in order to define a suitable maximum output power for the LA BS class. Necessary simulation parameters not already specified in TR 25.951 or TR 25.942 have been defined and are listed in Annex X.
The criteria for LA BS output power is defined so as not to cause undue outage for an uncoordinated micro network UE:s.
A.4.1.2 Simulation results
In here the philosophy for establishing a maximum output power requirement for the LA BS class is to set this value as high as possible in order to maximise the coverage per LA BS site (economic reasons), but yet low enough not to cause noticeable outage on the DL of any surrounding uncoordinated micro network.
All following simulation results are based on the agreed baseline scenario of TR 25.951 see Figure A12.
The simulations were performed with all micro users located outdoors and 10 % of the micro users located indoors.
As the BS coordinates for the locations of the LA BSs have not been fully specified in TR 25.951, these have been taken from earlier simulations instead and are marked by the "+" in Figure A12.
There certainly exists a strong relationship between the number of LA BSs required for providing indoor coverage and their respective TX powers, hence this trade-off is investigated first.
The indoor propagation loss (PL) according to L = 37 + 20 Log10(R) + Σ kwi Lwi as defined in TR 25.951 will lead to values < 100 dB. This is relatively low PL when comparing to e.g. propagation in multi-floor buildings. It will make e.g. no sense at all for the LA operator to deploy 10 LA BSs à 20 dBm as can be seen immediately from the resulting excessively high DL signal levels within the building.
Figure A23 shows the 12.2 kbps speech service outage on UL and DL for one LA BS situated at one of the center "+" in Figure A12 with 20 dBm TX power. It can be clearly be seen that even for a single LA BS, 20 dBm is in this scenario an excessive Tx power to match the UL capacity of approximately 110 users @ 5 % outage. This is primarily due to the assumed orthogonality of 94 % (according to TR 25.942).

ETSI
ETSI TR 125 951 V6.3.0 (2006-10) 533GPP TR 25.951 version 6.3.0 Release 6
Outage for LA BS
0102030405060708090
50 100 200 300 400 500 700
speech users
%
UL outageDL outage
Figure A.23 Outage for 1 LA BS with 20 dBm TX power
It should be also noted that the theoretical capacity of approximately 500 speech users @ 5 % DL outage cannot be realized as this is far in excess of the code capacity limit. A similar investigation for the 144 kbps data service leads to the very same conclusion. Therefore a naïve application of the DL load criteria according to TR 25.942 (Specified for macro/micro multi-operator DL simulations. Both networks should be loaded up to 5 % outage) leads obviously to a nonsensical scenario and hence in here, we assume the DL load is matched to the carried UL traffic.
From Figure A23 we can now estimate that 20 dBm - 10*LOG(500/110) = 13.4 dBm ≈ 14 dBm TX power would have been already sufficient for 95 % DL coverage by a single BS. Using more than 1 LA BS will lead to even lower required TX powers and is therefore not considered further in the following results.
An important conclusion from these considerations is that this scenario will allow us only to derive an upper bound of the DL capacity loss for the micro network for LA BS with TX powers > 14 dBm.
In line with the considerations of the previous section, Figure A24 shows the upper bound of micro layer DL outage due to 1 LA BS with 20, 24 and 30 dBm TX power respectively. Hence, when compared to the required DL power for coverage, there is an excess of LA BS Tx power of 6, 10 and 16 dB respectively, which correspondingly overestimates the interference impact from the LA layer towards the micro layer.

ETSI
ETSI TR 125 951 V6.3.0 (2006-10) 543GPP TR 25.951 version 6.3.0 Release 6
1 Pico BS, Micro DL Outages (upper bound)
0
5
10
15
20
25
2100
1900
1700
1500
1300
1100
Number of speech Micro UEs
up
per
bo
un
d o
f D
L O
uta
ge
%
20 dBm Pico
24 dBm Pico
30 dBm Pico
Reference (NoPico)
Figure A.24 Upper bound of micro layer DL Outage due to 1 LA BS with 20, 24, 30 dBm TX power
Figure A24 would at a first glance suggest that there would be a significant (> 5 %) impact from a LA network layer with > 20 dBm Tx power onto the surrounding micro network. However, also for the micro network we have to consider a reasonable DL operating point. E.g., the 5 % DL outage point for the '30 dBm pico' curve at 1300 users total or, equivalently, 108 speech users (with VA =1) /site cannot be realized for realistic VA factors as this is far in excess of the code capacity limit. The same conclusion holds for data services, here the code capacity limit will be exceeded even sooner due to the much lower Eb/No requirement according to TR 25.942.
A.4.1.3 Proposal
The conclusion is that even for a 30 dBm LA network layer, interference caused capacity losses in the micro layer could only occur for loads which are unrealisable from the code capacity limit point of view.
In other words, for the given scenario here, the interference impact is purely hypothetical if realistic DL operating points are considered.
On the other hand, as these results have been established for a specific scenario only, some extra protection for the micro layer is desirable; we propose an additional 3 dB safety margin. Hence, the proposed maximum output power, which is recommended for the Local area BS, is +27 dBm.
A value of +27 dBm appears also appropriate from the perspective of balancing the UL with the DL: relative to a general purpose BS, the LA BS will be desensitised by 14 dB. On the other hand, 27 dBm Tx power is 16 dB below the typical value of 43 dBm for a WA BS, hence UL and DL will remain balanced.
A.4.2 Simulation results #2
A.4.2.1 Simulation scenario
In this section, a statistical approach on the maximum output power is shown, which is based on TR 25.942 and TR 25.951, and the maximum output power for the Local area BS is proposed. In the simulation, the deployment of Micro BS and Pico BS shown in Figure A12 is used. Parameters related to propagation models are summarized in Table A6. The criteria for Local area BS output power is defined as the capacity deterioration for an uncoordinated Micro network UEs.

ETSI
ETSI TR 125 951 V6.3.0 (2006-10) 553GPP TR 25.951 version 6.3.0 Release 6
Table A.6: Parameters related to propagation models
Medium range BS Parameter Local area BS Indoor Outdoor
Propagation Model Indoor model of UMTS30.03
Indoor model of UMTS30.03
Microcell propagation model [25.942]
Outside wall loss 10dB 10 dB N/A Slow fading deviation 6dB [25.942] MCL 45 dB [25.951] 53 dB [25.951] ACS 33 dB ACLR 45 dB (5MHz offset) Output power 0 … 31dBm 33 dBm Deployment of BS Max.10 / floor 12 BS (wrap around)
Manhattan model Building size 110 x 110 meters Number of floors 1 / building Number of rooms 20 / floor In building users ratio 0.02 … 0.1
The number of Local area BSs can be decreased as the maximum output power of Local area BSs increases. The minimum number of the Local area BSs that supports the received power at UE higher than –90dBm in more than 95% area out of the entire floor is shown in Table A7.
Table A.7: Number of Local area BS
Maximum output power of Local area BS 0 dBm 5 dBm 10 dBm 20 dBm 31 dBm Number of Local area BS 10 4 3 2 2
A.4.2.2 Simulation results
The simulation results on capacity deterioration for uncoordinated Micro and Pico networks are shown in Figure A25.
In the simulations, the number of Local area BSs shown in Table A7 was used. As the reference, capacity deterioration in the case of Macro-Macro and Micro-Macro, calculated for Medium range BS class are also shown in Figure A25.
From Figure A25, the capacity deterioration for the Micro area network increases as Local area BS output power increases. As is shown in the figure, the output power of Local area BS should be less than +20dBm in order to maintain the capacity deterioration less than 5% when 10% of micro network UEs are in the building.

ETSI
ETSI TR 125 951 V6.3.0 (2006-10) 563GPP TR 25.951 version 6.3.0 Release 6
CAPACITY DETERIORATION
0
0.010.02
0.030.04
0.05
0.060.07
0.080.09
0.1
0 5 10 15 20 25 30 35
Maximum output power of Local Area BS [dBm]
Cap
acity
det
erio
ratio
n
Macro- Macro [6]
Micro- Macro [6]
users ratio= 0.02Pico- Micro In_building
Pico- Micro In_buildingusers ratio= 0.05
Pico- Micro In_buildingusers ratio= 0.10
Pico- Micro In_buildingusers ratio= 0.15
Figure A.25: Capacity deterioration
A.4.2.3 Proposal
Based on the above simulations, the proposed maximum output power for Local area BSs is +20dBm. The proposed value is identical to the earlier results presented in document R4-021635 where the interference between macro and pico cells were considered.

ETSI
ETSI TR 125 951 V6.3.0 (2006-10) 573GPP TR 25.951 version 6.3.0 Release 6
Annex B (informative): Radio Network Planning Considerations
B.1 Adjacent frequency Interference
B.1.1 General The RF specification for Base Stations is to a large extent based on statistical averaging of interference effects. This should normally be sufficient to eliminate significant interference effects on adjacent frequency networks, if some simple rules (e.g. 30 dB MCL between Wide Area BS) are followed.
Especially in the case of Local Area and Medium Range BS, also considering some of their likely deployment environments (indoor, street canyons) there is however a higher probability that the interference on adjacent frequencies is localised. In these cases some co-ordination between operators may be required.
This informative Annex considers Radio Network Planning (RNP) measures, which can be applied in case there is significant interference between adjacent radio networks of different hierarchy level, e.g. between a MR and a WA network. In the following mainly aspects related to DL adjacent channel interference will be considered.
B.1.2 Example analysis for localized interference Based on a number of assumptions on deployment of networks, the relevant parameter for the impact of DL adjacent channel interference caused by a MR or LA Node B is the maximum output power. From the Monte-Carlo simulation results contained in Annex A it can be seen that the DL capacity loss for an adjacent macro layer is upper-bounded by approximately no more than 6 % for a 38 dBm MR network layer. Similarly, it was shown that the DL capacity impact from a 24 dBm LA network on an adjacent MR network is of similar order.
While the average impact is thus small, there is nevertheless a chance that a macro layer UE gets localised interference by a MR or LA Node B under low coupling loss (CL) and weak serving signal conditions. This will be illustrated by the following example analysis for the case of a LA (indoor) cell interfering to an adjacent macro cell.
The following parameters will be assumed:
Table B.1: Assumed parameters for the localized interference analysis
Parameter Value Unit Notes UE ACS 33 dB from 25.101 interfering LA BS maximum Tx power 24 dBm from this TR interfering LA BS antenna gain 0 dBi from this TR serving cell received DTCH level -90 dBm bit rate 12.2 kbps Eb/Io 7 dB
With these service parameters we obtain for the required Ec/Io:
Required Ec/Io = -25 dB [processing gain] + 7 dB [Eb/Io] = -18 dB
The area of the localized interference around the LA BS can be estimated as follows (In this calculation the own system (cell) interference is not taken into account, i.e. it is assumed that ACI dominates):
1) Maximum tolerated interference level on the own channel: -90 dBm + 18 dB [Required Ec/Io] = -72 dBm
2) Maximum tolerated interference level on the adjacent channel: -72 dBm + 33 dB [UE ACS] = -39 dBm
3) Required coupling loss CL towards interfering LA BS: +24 dBm – (-39 dBm) = 63 dB

ETSI
ETSI TR 125 951 V6.3.0 (2006-10) 583GPP TR 25.951 version 6.3.0 Release 6
4) Assuming the indoor path loss model from this TR for the case that internal walls are not modelled individually and a single floor, the indoor path loss model is represented by the following formula:
PL = 37 + 30 Log10(R),
with R the UE – LA BS separation given in metres. From this, the required minimum distance towards the interfering LA BS is given by:
R = 10^( (63 dB [CL] + 0 dBi [LA BS antenna gain] – 37) / 30 ) = 7.36 m
As can be seen, the required minimum distance towards the interfering LA BS depends not only on the parameters of the interfering system (i.e. TX power, antenna gain), but also on the available DTCH signal level of the serving macro cell.
The following figure shows the size of the localized interference around the LA BS for serving cell received DTCH levels in the range of –70 … -110 dBm:
0,00
5,00
10,00
15,00
20,00
25,00
30,00
35,00
40,00
-70 -75 -80 -85 -90 -95 -100 -105 -110
Serving cell received DTCH level [dBm]
m
required minimum distance R towards interfering LA BS
Figure B.1: Localized interference around the LA BS as function of serving cell received DTCH levels
In order to further reduce the likelihood of such localized interference events, the measures presented in the following clause may be applied.
B.1.3 Deployment guidelines to reduce interference The following measures are applicable by the operator of the interfering radio network (i.e. LA or MR network) in order to reduce the likelihood of interference towards an adjacent band operator:
- Avoid allocating LA, MR Node B carriers at the assigned band edge(s) to another operator whenever possible. This may be possible e.g. at an early UMTS deployment phase, where only part of the assigned band may be required.
- During a later UMTS deployment phase, for the case that an operator wishes to deploy 2 WA carriers and one MR or LA carrier, the latter carrier could be 'sandwiched' by the WA carriers.
- Ensure sufficiently large MCL conditions across the planned micro cell (or in-building) coverage area. This can be facilitated by choosing suitable antenna types, heights and locations. Note that obtaining a sufficiently high MCL (including antenna gains) is also desirable for the MR or LA network operator due to the –25 dBm/3.84 MHz maximum input level requirement of the UE [25.101]; hence, the MCL will also depend on the intended maximum Node B TX power setting.
- Match the setting of the maximum Node B TX power for MR or LA operation to the requirements (i.e. CL) of propagation environment at hand, i.e. avoid using substantially more TX power than is required for the micro cell or in-building coverage. DL power planning can be facilitated by adjusting the CPICH TX power in such a

ETSI
ETSI TR 125 951 V6.3.0 (2006-10) 593GPP TR 25.951 version 6.3.0 Release 6
way that the received CPICH RSCP (or Ec/Io) across the desired coverage area meets the outage target, but on the other hand, is not unnecessarily high. Scaling the windows of the DTCH DL power allocations accordingly, will then also lead to appropriate DTCH power levels.
- Co-ordination between adjacent frequency operators of output powers, antenna sites, heights, gains and patterns, or even co-location of interfering sites. This would reduce worst case situations where a strong interfering signal is received by an adjacent frequency UE connected to a BS at large coupling loss, and thus under relatively poor radio conditions.
For temporary effects, and remaining problems a number of additional system functionalities can be used:
- In case that multiple WA carriers may have become available, the use of IFHO for DL interference avoidance may be used. Hence, the UE may be handed over to the 2nd or 3rd adjacent channel, which will reduce or eliminate the interference.
- In case that adjacent channel interference is encountered within a WA cell, proper setting of the DTCH TX power window can provide the UE with additional power to combat interference. Hence, there is possibility for trading off some capacity / throughput for reducing possible DL coverage holes.
- In case that adjacent channel interference is encountered within a WA cell, reduction of the allocated peak data rate (or AMR codec rate) can provide the UE with additional power to combat interference. Hence, there is possibility for trading off peak data rates for reducing possible DL coverage holes.
- For areas where the received Node B DL signals (or representatively the CPICH RSCP"s) from the own and adjacent interfering system differ by much more than 40 dB, own system signal strength may be increased by RNP methods. This can be done by means of directing / tilting antennas beams towards the building in question (e.g. in case of interfering LA network) or by building additional sites.
B.2 Intra-frequency interference
B.2.1 General The RF specification for Base Stations is to a large extent based on statistical averaging of interference effects and on specific MCL requirement. This should normally be sufficient to eliminate significant interference.
In the case of Local Area and Medium Range BS, also considering some of their likely deployment environments (indoor, street canyons) there is however a high probability that the current UE and BS specifications lead to localised significant intra-frequency interference and then to localised coverage and capacity holes.
This informative Annex highlights through an example the impacts of UE performance requirements on the range of coupling loss that can be operated without degraded the network performance.
B.2.2 Example analysis for localized interference In this paragraph, the impact of the MCL requirement on UE and BS (either LA or MR) sensitivity is analysed.
B.2.2.1 UL issue
Regarding the UL, a LA or MR BS can be desensitised and suffer from UL capacity/coverage loss if the CL at which the power control causes the UE output power to reduce to the minimum output power is significantly higher than the MCL. In such conditions, if the UE were to move closer to the serving BS, the power control would be unable to reduce the UE output power further, and desensitization would occur.
Then assuming the following parameters (Table B.2) the MCL requirement is compared to the CL value from where a UE reaches its minimum output power.

ETSI
ETSI TR 125 951 V6.3.0 (2006-10) 603GPP TR 25.951 version 6.3.0 Release 6
Table B.2: Assumed parameters for the UL analysis
Parameter UE Value LA BS Value
MR BS value Unit Notes
UE minimum output power -50 dBm from 25.101 BS reference sensitivity level (12.2kbps, BER<0.001)
-107 -111 dBm from this TR
MCL 45 53 dB from this TR
The parameters listed in Table B.2 shows that a UE using speech service and served by a LA BS reaches its minimum output power when the coupling loss is such as:
-50 [UE min output power]-CL [coupling loss between UE and serving BS]=
-107 [LA BS reference sensitivity level] + NR [noise rise of the cell corresponding to its load]
That is to say: CL=57dB for an unloaded cell and 51dB for a 75% loaded cell (NR=6dB) while the minimum coupling loss of a LA BS is 45dB.
The parameters listed in Table B.2 shows that a UE using speech service and served by a MR BS reaches its minimum output power when the coupling loss is such as:
-50 [UE min output power]-CL [coupling loss between UE and serving BS]=
-111 [LA BS reference sensitivity level] + NR [noise rise of the cell corresponding to its load]
That is to say: CL=61dB for an unloaded cell and 55dB for a 75% loaded cell (NR=6dB) while the minimum coupling loss of a MR BS is 53dB.
All these evaluated coupling losses are significantly higher than the MCL requirement of the corresponding BS classes. As a result a severe BS desensitisation is expected if a UE is very close to its serving BS.
B.2.2.2 DL issue
Regarding the DL, a LA or MR BS may degrade its own UE's performances and face then DL capacity/coverage loss if the UE received input power level is higher than the maximum requirement.
Then assuming the following parameters (Table B.3) the MCL requirement is compared to the CL value from where a UE received its maximum input power.
Table B.3: Assumed parameters for the DL analysis
Parameter UE Value LA BS Value
MR BS value Unit Notes
UE maximum input level -25 dBm from 25.101 BS maximum output power 24 38 dBm from this TR MCL 45 53 dB from this TR
The parameters listed in Table B.3 show that the maximum received input level of a UE is reached by a serving LA BS transmitting its maximum output power when the coupling loss is such as:
24 [BS maximum output power]-CL [coupling loss between UE and serving BS]=-25 [UE maximum input level]
That is to say: CL=49dB while the minimum coupling loss is 45dB.
The parameters listed in Table B.3 show that the maximum received input level of a UE is reached by a serving MR BS transmitting its maximum output power when the coupling loss is such as:
38 [BS maximum output power]-CL [coupling loss between UE and serving BS]=-25 [UE maximum input level]
That is to say: CL=63dB while the minimum coupling loss is 53dB.
Both these evaluated coupling losses are significantly higher than the MCL requirement of the corresponding BS classes. As a result a UE performances may be degraded by its serving BS.

ETSI
ETSI TR 125 951 V6.3.0 (2006-10) 613GPP TR 25.951 version 6.3.0 Release 6
B.2.3 Deployment guidelines to reduce interference The following measures may be applied by an operator deploying a LA or a MR network in order to reduce the likelihood of localized interference inside its own network:
- Ensure sufficiently large MCL conditions across the planned micro cell or in-building coverage area. This can be facilitated by choosing suitable antenna types, heights and locations.
- Match the setting of the maximum Node B TX power for MR or LA operation to the requirements (i.e. CL) of propagation environment at hand, i.e. avoid using substantially more TX power than is required for the micro cell or in-building coverage. DL power planning can be facilitated by adjusting the CPICH TX power in such a way that the received CPICH RSCP (or Ec/Io) across the desired coverage area meets the outage target, but on the other hand, is not unnecessarily high. Scaling the windows of the DTCH DL power allocations accordingly, will then also lead to appropriate DTCH power levels.
- Implement efficient handover algorithms to escape low coupling loss situation.

ETSI
ETSI TR 125 951 V6.3.0 (2006-10) 623GPP TR 25.951 version 6.3.0 Release 6
Annex C (informative): Change History
Table C.1: Change History
TSG Doc CR R Title Cat Curr New Work Item RP-19 Rel-6 version created. 6.0.0 RP-20 RP-030221 001 1 Radio network planning considerations F 6.0.0 6.1.0 RInImp-
BSClass-FDD
RP-21 RP-030424 002 1 Localised interference in an operator's own network B 6.1.0 6.2.0 RInImp-BSClass-FDD
RP-33 RP-060523 003 Out-of-band emission requirements considerations in Japan for WA, MR and LA-BS
F 6.2.0 6.3.0 TEI6

ETSI
ETSI TR 125 951 V6.3.0 (2006-10) 633GPP TR 25.951 version 6.3.0 Release 6
History
Document history
V6.2.0 September 2003 Publication
V6.3.0 October 2006 Publication