tr93-05a december 1993 journal of the american voice · pdf filetr93-05a december 1993...
TRANSCRIPT

MITSUBISHI ELECTRIC RESEARCH LABORATORIEShttp://www.merl.com
A Comparison of Anapron with Seven OtherName-Pronunciation Systems
Andrew R. Golding, Paul S. Rosenbloom
TR93-05a December 1993
Abstract
This paper presents an experiment comparing a new name-pronunciation system, Anapron, withseven existing systems: three state-of-the-art commercial systems (from Bellcore, Bell Labs, andDEC), two variants of a machine-learning system (NETtalk), and two humans. Anapron worksby combining rule-based and case-based reasoning. It is based on the idea that it is much easierto improve a rule-based system by adding case-based reasoning to it than by tuning the rules todeal with every exception. In the experiment described here, Anapron used a set of rules adaptedfrom MITalk and elementary foreign-language textbooks, and a case library of 5000 names. Withthese components – which required relatively little knowledge engineering – Anapron was foundto perform almost at the level of the commercial systems, and significantly better than the twoversions of NETtalk.
Journal of the American Voice Input/Output Society, 14 (August, 1993), 1-21
This work may not be copied or reproduced in whole or in part for any commercial purpose. Permission to copy in whole or in partwithout payment of fee is granted for nonprofit educational and research purposes provided that all such whole or partial copies includethe following: a notice that such copying is by permission of Mitsubishi Electric Research Laboratories, Inc.; an acknowledgment ofthe authors and individual contributions to the work; and all applicable portions of the copyright notice. Copying, reproduction, orrepublishing for any other purpose shall require a license with payment of fee to Mitsubishi Electric Research Laboratories, Inc. Allrights reserved.
Copyright c©Mitsubishi Electric Research Laboratories, Inc., 1993201 Broadway, Cambridge, Massachusetts 02139

MERLCoverPageSide2

1. First printing, TR93-05, May 19932. Revised, TR93-05a, July 1993
A comparison of Anapron with
seven other name-pronunciation systems1
Andrew R. Golding
Mitsubishi Electric Research Labs201 Broadway, 8th FloorCambridge, MA 02139
Paul S. Rosenbloom
Information Sciences Institute andComputer Science DepartmentUniversity of Southern California
4676 Admiralty WayMarina del Rey, CA 90292
Abstract
This paper presents an experiment comparing a new name-pronunciation system,Anapron, with seven existing systems: three state-of-the-art commercial systems(from Bellcore, Bell Labs, and DEC), two variants of a machine-learning system(NETtalk), and two humans. Anapron works by combining rule-based and case-based reasoning. It is based on the idea that it is much easier to improve a rule-based system by adding case-based reasoning to it than by tuning the rules to dealwith every exception. In the experiment described here, Anapron used a set of rulesadapted from MITalk and elementary foreign-language textbooks, and a case libraryof 5000 names. With these components | which required relatively little knowledgeengineering | Anapron was found to perform almost at the level of the commercialsystems, and signi�cantly better than the two versions of NETtalk.
1This research was sponsored by NASA under cooperative agreement number NCC 2{538, and by a BellLaboratories PhD fellowship to the �rst author. Computer facilities were partially provided by NIH grantLM05208. The views and conclusions contained in this document are those of the authors and should not beinterpreted as representing the o�cial policies, either expressed or implied, of NASA, the US Government,Bell Laboratories, or the National Institute of Health.We gratefully acknowledge the assistance on this experiment of the following people: Mark Liberman, for
making the test set of names available; Cecil Coker at Bell Labs, Murray Spiegel at Bellcore, and Tony Vitaleat DEC, for supplying data from their systems, and for helpful discussions on the design and analysis of theexperiment; TomDietterich, for providing the non-copyrighted portion of NETtalk; John Laird, for providinga fast machine for training NETtalk; Connie Burton, for providing access to DECtalk; and David Shapiro,for his excellent guidance on the statistical analysis. We are indebted to Murray Spiegel for arranging for usto borrow a pronouncing dictionary of names from Bellcore. We would also like to thank Bill Freeman andthe AVIOS reviewers for comments on this paper.

1 Introduction
This paper presents an experiment comparing a new name-pronunciation system, Anapron,with seven existing systems: three state-of-the-art commercial systems (from Bellcore, BellLabs, and DEC), two variants of a machine-learning system (NETtalk), and two humans.Anapron is based on a general method for improving rule-based systems through case-basedreasoning [Golding and Rosenbloom, 1991]. It applies its rules to generate a �rst approxi-mation to the pronunciation of a name, and it draws analogies from names in its case libraryto cover exceptions to the rules. This provides a way of enhancing an imperfect rule setwith relatively little e�ort: obtaining cases | in the form of a pronouncing dictionary ofnames | is often much easier than the alternative of �ne-tuning the rules to anticipate everycontingency. For the implementation discussed here, Anapron used a set of rules adaptedfrom MITalk [Hunnicutt, 1976] and elementary grammar texts for French, German, Italian,and Spanish, and it used a case library of 5000 names. With these components | whichrequired relatively little knowledge engineering | Anapron was found to perform almost atthe level of the commercial systems in the experiment.
The experiment involved running Anapron and each of the seven other systems on thesame 400-name test set. The resulting pronunciations were piped through a DECtalkTM
2
speech synthesizer, in random order. A panel of 14 test subjects judged the acceptability ofthe pronunciations. Two caveats about the results: �rst, the scores for the various systemsrepresent text-to-phonetics performance only, not full text-to-speech performance. We es-sentially factored out the phonetics-to-speech component of each system by using DECtalk,since our goal was to compare systems to Anapron, and Anapron has no phonetics-to-speechcomponent. Second, the way we factored out phonetics-to-speech did not preserve the rel-ative strengths of all systems; in particular, it favored the commercial system from DEC,which was designed to have its pronunciations fed through DECtalk, relative to the systemsfrom Bellcore and Bell Labs. For purposes of evaluating Anapron, this is tolerable, since weare more interested in getting an idea of how Anapron compares to other systems than ingetting exact performance �gures. But it is important to note that therefore this experimentdoes not support comparisons between one commercial system and another.
The next section gives an overview of the systems involved in the experiment. Sections 3and 4 present the experimental design and analysis. Section 5 is a conclusion. The pronun-ciation notation used throughout the paper, from DECtalk, is de�ned in the appendix.
2DECtalk is a trademark of Digital Equipment Corporation.
MERL-TR-93-05a 2 May 1996

2 System Overview
Each of the systems in the experiment is described brie y below, followed by a discussion ofhow Anapron relates to the other systems.
2.1 The Systems
Anapron3: Divides pronunciation into �ve main subtasks: language identi�cation, mor-phological decomposition, transcription (mapping letters to phonemes), syllabi�cation, andstress assignment. Transcription and stress assignment are each done by a combination ofrule-based and case-based reasoning, as follows: the system starts by applying its rules.After each rule application, it uses the rule just applied to index into its dictionary andretrieve names that illustrate exceptions to that rule. If the system �nds a compelling anal-ogy between the name it is pronouncing and one of these exceptions, then it modi�es itsanswer to follow the exception rather than the rule. The system decides whether an analogyis compelling based on two factors: the degree of similarity between the two names, as de-termined by a similarity metric; and the results of an empirical veri�cation, which tests outthe generalization behind the analogy on other names in the dictionary.
As an example from transcription, suppose the system is pronouncing the name Don-ahower. One rule that �res for this name says to pronounce the OW as ow4 (as in boat).Associated with this rule is a list of dictionary names that illustrate exceptions to it. Onesuch exception is Bower | the rule predicts ow, but the dictionary pronunciation gives aw(as in bout). The system tries drawing an analogy from Bower to Donahower, to see if Dona-hower is a similar exception. This entails applying a similarity metric to the two names. Themetric compares the two names around the OW, matching letters that are identical or inthe same abstract class (e.g., \orthographic vowel"). It �nds a shared right-hand context ofER# (where # marks a word boundary) and no shared left-hand context. It assigns a degreeof similarity commensurate with this amount of shared context. The generalization behindthis analogy is that \OW is pronounced aw when followed by ER#". The system tests thisgeneralization on other names in its dictionary, and �nds that it is correct for all applicablenames: Bower, Brower, Flower, Hightower, Hower, and Power. Based on this empirical evi-dence, together with the score from the similarity metric, the system ends up accepting thisparticular analogy. Thus it pronounces the OW in Donahower as aw by analogy with Bower.
Anapron's rule set includes 619 transcription rules and 29 stress-assignment rules, drawnfrom MITalk [Hunnicutt, 1976] and introductory textbooks on French, German, Italian, andSpanish. The dictionary contains 5000 surnames, including the 2500 most frequent ones inthe US, 1250 sampled randomly from ranks 2500 through 10,000, and 1250 from ranks 10,000to 60,000. [Golding, 1991]
3Anapron stands for Analogical pronunciation system.4Pronunciations are given in DECtalk notation, which is de�ned in Appendix A.
MERL-TR-93-05a 3 May 1996
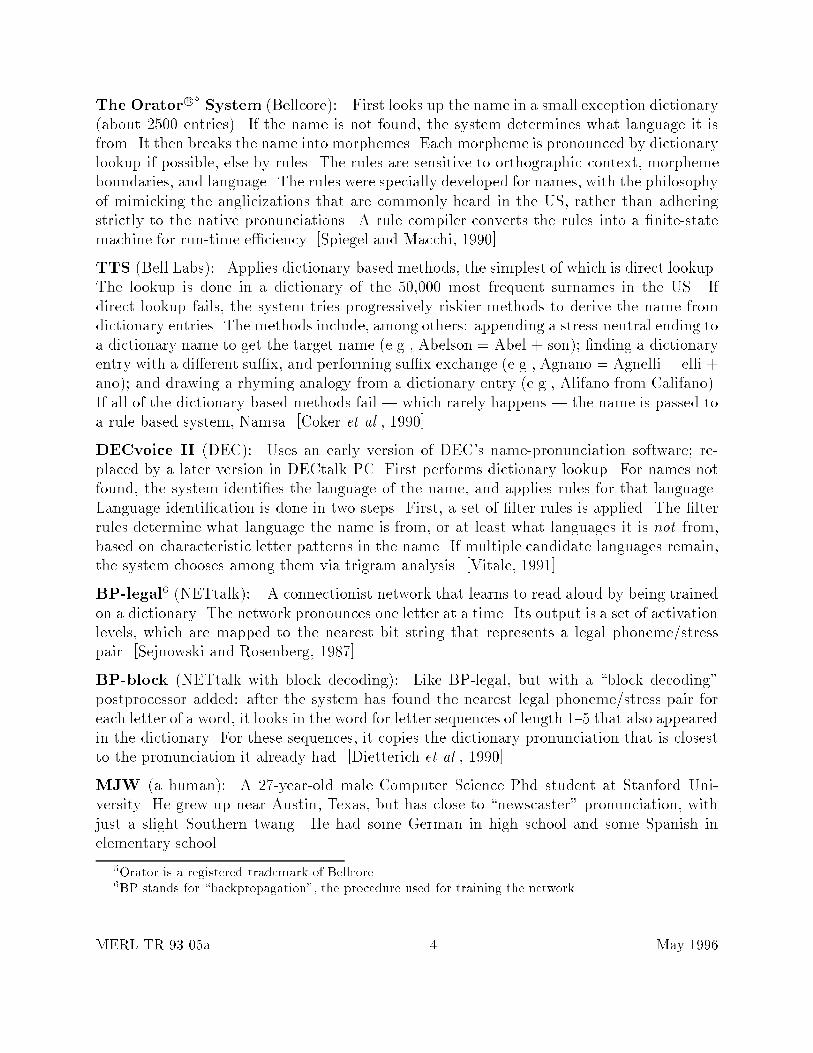
The Orator R 5
System (Bellcore): First looks up the name in a small exception dictionary(about 2500 entries). If the name is not found, the system determines what language it isfrom. It then breaks the name into morphemes. Each morpheme is pronounced by dictionarylookup if possible, else by rules. The rules are sensitive to orthographic context, morphemeboundaries, and language. The rules were specially developed for names, with the philosophyof mimicking the anglicizations that are commonly heard in the US, rather than adheringstrictly to the native pronunciations. A rule compiler converts the rules into a �nite-statemachine for run-time e�ciency. [Spiegel and Macchi, 1990]
TTS (Bell Labs): Applies dictionary-based methods, the simplest of which is direct lookup.The lookup is done in a dictionary of the 50,000 most frequent surnames in the US. Ifdirect lookup fails, the system tries progressively riskier methods to derive the name fromdictionary entries. The methods include, among others: appending a stress-neutral ending toa dictionary name to get the target name (e.g., Abelson = Abel + son); �nding a dictionaryentry with a di�erent su�x, and performing su�x exchange (e.g., Agnano = Agnelli � elli +ano); and drawing a rhyming analogy from a dictionary entry (e.g., Alifano from Califano).If all of the dictionary-based methods fail | which rarely happens | the name is passed toa rule-based system, Namsa. [Coker et al., 1990]
DECvoice II (DEC): Uses an early version of DEC's name-pronunciation software; re-placed by a later version in DECtalk PC. First performs dictionary lookup. For names notfound, the system identi�es the language of the name, and applies rules for that language.Language identi�cation is done in two steps. First, a set of �lter rules is applied. The �lterrules determine what language the name is from, or at least what languages it is not from,based on characteristic letter patterns in the name. If multiple candidate languages remain,the system chooses among them via trigram analysis. [Vitale, 1991]
BP-legal6 (NETtalk): A connectionist network that learns to read aloud by being trainedon a dictionary. The network pronounces one letter at a time. Its output is a set of activationlevels, which are mapped to the nearest bit string that represents a legal phoneme/stresspair. [Sejnowski and Rosenberg, 1987]
BP-block (NETtalk with block decoding): Like BP-legal, but with a \block decoding"postprocessor added: after the system has found the nearest legal phoneme/stress pair foreach letter of a word, it looks in the word for letter sequences of length 1{5 that also appearedin the dictionary. For these sequences, it copies the dictionary pronunciation that is closestto the pronunciation it already had. [Dietterich et al., 1990]
MJW (a human): A 27-year-old male Computer Science Phd student at Stanford Uni-versity. He grew up near Austin, Texas, but has close to \newscaster" pronunciation, withjust a slight Southern twang. He had some German in high school and some Spanish inelementary school.
5Orator is a registered trademark of Bellcore.6BP stands for \backpropagation", the procedure used for training the network.
MERL-TR-93-05a 4 May 1996

TJG (a human): A 32-year-old male Psychology postdoc at Stanford University. He grewup in New Jersey, and has a mild accent of that region. He studied French and some Germanand Hebrew, and has travelled abroad extensively.
2.2 Relation to Anapron
The method each system uses to incorporate rules and cases serves as a useful basis forrelating Anapron to the other computer systems. Anapron starts with rule-based reason-ing, and draws analogies from cases in its dictionary to cover rule exceptions. Two of thecommercial systems | the Orator system and DECvoice | do rule-based reasoning plusdictionary lookup of names or name morphemes. The di�erence between these systems andAnapron is in how they use cases: these systems map a case to other occurrences of thesame case, whereas Anapron maps a case more generally to any new name that is deemedcompellingly similar. The cost of Anapron's increased generality, however, is that it needs asimilarity metric to help it judge the similarity between cases.
The two NETtalk-based systems, BP-legal and BP-block, work purely from cases. Thedi�erence between these systems and Anapron is that these systems do not use rules at all.This puts these systems at something of a disadvantage when being compared to Anapron,in that Anapron works from a superset of their knowledge. However, this disadvantage isdue to the systems' own limitation in accepting only one form of knowledge.
The remaining computer system, TTS, is the most similar to Anapron, in that it doesboth rule-based reasoning and a non-degenerate form of case-based reasoning. There arethree principal di�erences between the two systems, however. First, TTS applies cases beforerules, the opposite of Anapron. This re ects an underlying dichotomy of approaches: TTS isbased on having a large dictionary that will allow it to look up or derive most names it willencounter. Anapron, on the other hand, is based on having a decent set of rules that willcover broad, regular aspects of pronunciation, leaving a relatively small set of idiosyncraticbehaviors to be handled by analogy. The second di�erence between TTS and Anapron isthat in TTS, the case-based and rule-based components are essentially independent; theyare just called sequentially. In Anapron, they are more tightly coupled: the system retrievescases speci�cally to contradict whichever rule was applied. The third di�erence betweenTTS and Anapron is in how each system does case-based reasoning. TTS runs through a�xed sequence of methods (su�x exhange, etc.) to derive whole names from large parts ofother names, while Anapron transfers one letter cluster or aspect of stress at a time via ageneral analogical mechanism. The trade-o� between the two approaches is basically one ofgenerality versus e�ciency: Anapron can �nd a wider class of analogies, but TTS can beoptimized to �nd the types it knows about very quickly. Anapron requires correspondinglygeneral knowledge (a similarity metric), compared to TTS's more specialized knowledge (asequence of analogy types to try).
MERL-TR-93-05a 5 May 1996

3 Design
Two main issues shaped the design of the experiment. The �rst was selecting a performancetask. We chose the general-purpose task of simply reading a list of names, since the goal ofthe experiment was similarly general-purpose | to get an idea of how Anapron compareswith other systems. For a more speci�c goal, such as evaluating systems for telephone-basedreverse directory assistance, a correspondingly speci�c performance task is more appropriate(see Basson et al. [1991]).
The second main issue was choosing the form of output of the systems. We took thephonetic transcriptions produced by each system, and piped these through DECtalk. Thisessentially factored out the phonetics-to-speech component of each system, making the ex-periment a comparison of text-to-phonetics methods. This is suitable for comparison withAnapron, since Anapron just does text-to-phonetics. Piping the pronunciations throughDECtalk had a side-bene�t, in that it hid the identities of the systems from the judges.Judges might otherwise have developed a bias against a particular system, e.g., because itmispronounced a name they knew, or simply because it had a mechanical voice (as opposedto the human systems in our experiment). Using DECtalk also had a drawback, though, inthat it did not represent the full text-to-speech capability of each system.
Given the preceding design decisions, we carried out the experiment in four steps: (1) com-pile a list of names to test the systems on; (2) run the names through each system; (3) makea cassette tape of the systems' pronunciations; and (4) have a group of test subjects judgethe pronunciations on the tape. Each step is described below.
3.1 Test set
The test set was drawn from the Donnelley corpus, a database of over 1.5 million distinctsurnames covering 72 million households in the US. Some names are more common thanothers | we will refer to the number of households that have a particular name as thefrequency (of occurrence) of that name. To a rough approximation, the distribution ofnames in Donnelley follows Zipf's Law [Spiegel, 1985]. Zipf's Law states that if items arerank-ordered by frequency of occurrence, the frequencies are inversely proportional to theranks. Thus the top-ranking names occur in huge numbers of households (e.g., Smith, ranked#1, occurs in over 670,000 households), but frequency drops o� rapidly, ending with a long at tail of names that occur in just one household (Chavriacouty and about 650,000 others).
It is di�cult to construct a test set that is representative of all of Donnelley and still oftractable size. One strategy would be to select names at random according to the naturally-occurring distribution. But the quality of the resulting measurements would depend on thedistribution | we would get poor representation of the rare names. Instead, we constructeda test set consisting of equal numbers of names from various points along the frequency
MERL-TR-93-05a 6 May 1996
25 50 100 200 4000.4
0.6
0.8
1.0
Category size
Acc
epta
bilit
y
800 1600
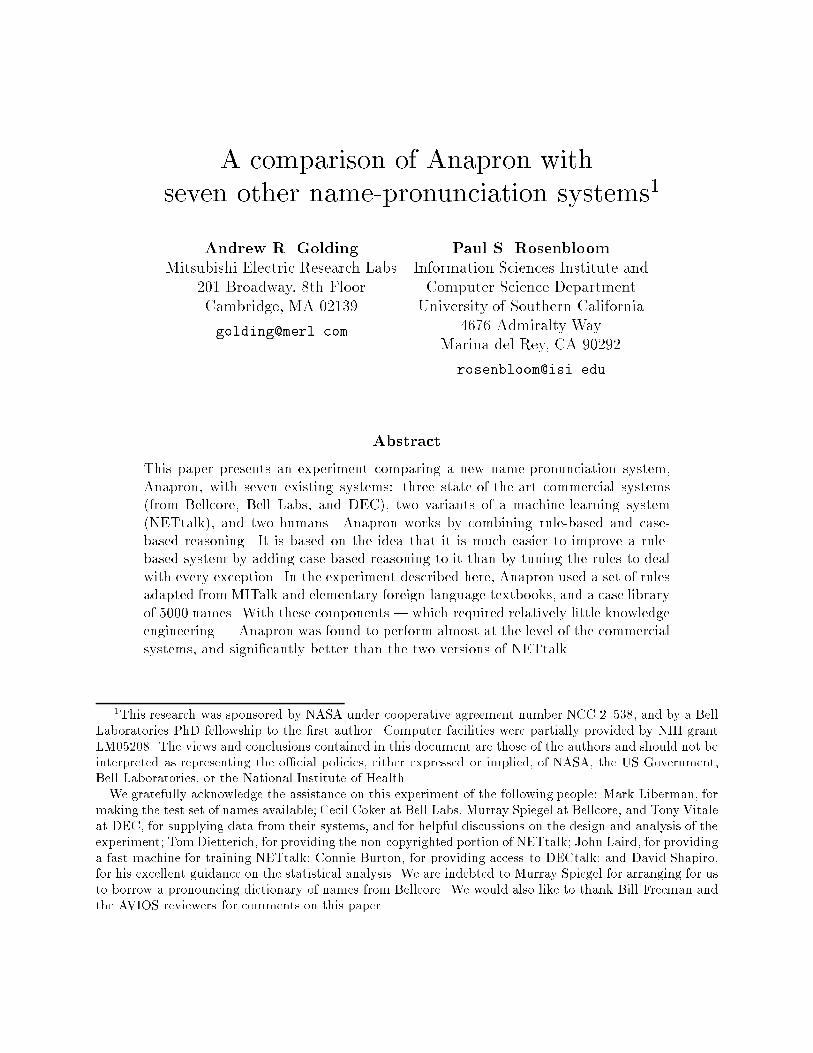
Figure 1: The 95% con�dence interval for measuring an acceptability rating of 0.70, shownfor various choices of category size. The category-size axis is scaled logarithmically.
spectrum. This allowed us to get reliable readings on how system performance varied as afunction of name frequency. The question then arose of which frequencies to sample. Sinceour goal was to evaluate Anapron's performance, we picked points that were most informativefor that purpose. This meant that at places in the frequency spectrum where Anapron'sperformance function changed quickly, we took more closely-spaced measurements; at placeswhere the function was more constant, we sampled less often. It turns out that Anapron'sperformance function drops about linearly as frequency is decreased exponentially | thiswas determined in a pilot study. Thus we sampled frequencies that were distributed roughlyexponentially: frequency 1 (ultralow), 32 (low), 256 (mid), and 2048 (high). This left outnames above frequency 2048, but there are fewer than 4500 such names | thus they couldall be covered with a moderate-sized dictionary; they are not the ones that Anapron istargetted for. As for choosing the names at each of the four frequencies, we chose the namesfor a frequency F randomly from the names of frequency F in Donnelley. If Donnelley hadfewer names at frequency F than we wanted to sample, we chose names from the narrowestsymmetric frequency band around F that would su�ce.
Finally, there was the question of how many names to pick in each frequency category.We again based our answer on the pilot study of Anapron's performance. This showedthat the acceptability rate was in the ballpark of 0.70. We then asked what size con�denceinterval in this measurement was satisfactory, and chose the size of the categories accordingly.Figure 1 shows the con�dence intervals for several choices of category size, calculated usingthe standard error of a proportion [Fleiss, 1981, p.14]. It shows that it takes a fair numberof names to get a reliable reading for a frequency category. We chose a category size of 100.This gives a somewhat broad con�dence interval, but was the largest size that was consideredpractical. It resulted in a test set of 400 names, which took 1 1/2 hours to read (given thateach name had up to 8 di�erent pronunciations, one per system).
MERL-TR-93-05a 7 May 1996

3.2 Data collection
Pronunciations for the names in the test set were gathered as follows: for the computersystems, the system was run on the test set, and its phonetic transcriptions were collected.For the humans, we asked them to read the list of names aloud, as if they were a teachertaking roll call, and we tape-recorded their pronunciations.
The NETtalk system also needed to be trained. We trained it on the same 5000-namedictionary used by Anapron. This involved �rst converting the dictionary into NETtalknotation, in which each spelling is aligned with its transcription and stress pattern. Wecon�gured NETtalk as Sejnowski and Rosenberg did: with 120 hidden units, learning rate0.25, momentum coe�cient 0.9, and random starting weights in the range [�0:3, 0.3]. Train-ing proceeds in a series of epochs, where each epoch consists of running the full dictionarythrough the network, and adjusting the weights via a backpropagation procedure so as toreduce error. The code, written in C, for the backpropagation procedure was taken fromExplorations in PDP [McClelland and Rumelhart, 1988]. Training is complete when thetotal error of the network drops to a speci�ed target level. We set the target level to 2450,obtained by scaling Dietterich's value of 445 [Dietterich et al., 1990] for the size of our dic-tionary | his dictionary had 5807 total letters, ours had 31975. For Dietterich, trainingtook 30 epochs. For us, after 30 epochs the error was 7471, more than triple the target level.We continued training for a total of 150 epochs. It took about 2 1/3 hours of CPU time perepoch on an IBM RS/6000, for a total of over 2 CPU weeks. At this point we contentedourselves with the resulting error level of 4102 (still 67% larger than desired). How longwould it have taken to reach the target level? The total sum-of-squares error, TSS, in thenetwork decreases as a power law of the number of epochs, N . Using regression analysis, weobtained a close �t (R2=99.1%) of a power law to the data for the 150 epochs:
TSS = 27320N�0:385
From this formula, we project that it would have taken 525 epochs (almost 2 CPU months)to reach the target error level.
3.3 The cassette tape
Once pronunciations were obtained for all systems, we made a cassette tape of DECtalk(version 2.0) reading the pronunciations aloud. For the computer systems, this required �rstconverting the phonetic transcriptions from their original notation into DECtalk notation.For the humans, it required transcribing the pronunciations directly into DECtalk notation.At this point, we had 8 transcriptions | one per system | in DECtalk notation for eachname in the test set. For each name, we deleted duplicate transcriptions, and permuted therest randomly. We randomized the order of names as well. We then fed the transcriptionsthrough DECtalk, to obtain a tape with between 1 and 8 pronunciations of each of 400names. The tape was 1 1/2 hours long, with a total of 1650 pronunciations.
MERL-TR-93-05a 8 May 1996
The main shortcoming of this procedure is that it involved running pronunciationsthrough a di�erent synthesizer than the one they were designed for. To adapt the pro-nunciations to the new synthesizer, we had to: (1) undo any optimizations for the originalsynthesizer | most systems have been tailored to produce whatever output sounds best onthe synthesizer they are using; (2) switch to the new synthesizer's phonetic notation; and(3) reoptimize the pronunciations for the new synthesizer. This conversion a�ected di�erentsystems di�erent amounts. In particular, it favored the commercial system from DEC, whichwas intended to be used with a DECtalk synthesizer, relative to the systems from Bellcoreand Bell Labs. This is tolerable for purposes of getting an idea of how Anapron compareswith the other systems. However, to reduce the impact of the degradation, we only countedeach system's egregious errors when analyzing the results, where an egregious error is a pro-nunciation that, according to the judges, \no one would say" (see Section 4.1). This measureshould be largely una�ected by the above conversion di�culties. Other factors | such asDECtalk's intelligibility for words spoken in isolation | a�ect all systems equally.
Following is a description of the non-trivial parts of the conversion into DECtalk notation.For the DEC system and the humans, only item (1) was applied.
(1) Normalize choice of phonemes
In some cases, DECtalk notation provides multiple ways of representing highly similaror identical sounds. For instance, \bore" can be transcribed as b�aor, b�owr, or b�or.In our test set, this can lead to names with several pronunciations that sound alike.To avoid torturing the judges with such redundant pronunciations, we did two things:(i) we expressed r-colored vowels using DECtalk's ar, er, ir, or, ur, and rr; and(ii) we collapsed both types of schwa, ax and ix, to ax.
(2) Incorporate stress level into choice of vowel phoneme
DECtalk has no stress marker for 0-stress; so instead we indicated 0-stress through thechoice of vowel. Speci�cally, we used a schwa or syllabic consonant if and only if thesyllable was 0-stress. To enforce this, we reduced all short vowels in 0-stress syllables toschwa. (We left long vowels as is, since we never regard them as 0-stress.) Conversely,we promoted all schwas in non-0-stress syllables to ah. Examples:
Sherrod sh1ehr
0aad �! sh�ehraxd ; Reduce (short) aa to ax
Turney t1rrn
0iy �! t�rrniy ; Leave (long) iy as is
Chun ch1axn �! ch�ahn ; Promote ax to ah
(3) Delete 2-stresses
Once the preceding step was done, we could distinguish 0-stress from 2-stress syllablesby the choice of vowel phoneme. This made 2-stresses largely redundant. In fact, mostpronunciations sound better in DECtalk without the 2-stresses, in the opinion of theauthors. Compounds (e.g., Newhouse) are occasionally an exception; but lacking aprincipled way of detecting such cases, we deleted all 2-stresses.
MERL-TR-93-05a 9 May 1996
A few technical details about making the cassette tape: DECtalk was set to its defaultvoice (Perfect Paul), pitch, and volume. For increased clarity, the speaking rate was reducedto 140 words/minute from the default of 180. Each name on the tape was read as follows:the number of the name (from 0 to 399), a pause (for the judges to consider how they wouldpronounce the given spelling), the di�erent pronunciations of the name separated by pauses,and a �nal pause. The length of the pauses varied with the di�culty of the name, wheredi�culty was gauged by the number of di�erent pronunciations the 8 systems generated. Forinstance, Chun was easy because all 8 systems agreed on its pronunciation. Loizakes washard because all 8 disagreed. The exact ranges of pause lengths were 1/2 to 2 1/2 secondsfor the post-number pause, 1 to 1 1/2 seconds for the inter-pronunciation pause, and 2 to2 1/2 seconds for the �nal pause. These values were arrived at by informal trial and error.The whole tape had 37 minutes of speaking and 52 minutes of pauses.
3.4 Experimental procedure
The judges in the experiment were 13 Stanford undergraduates from the Psych 001 subjectpool, plus one subject not from the pool. All subjects were required to be native speakersof American English, and not Linguistics majors. The intent was to get native speakerintuitions. The 13 pool subjects ranged in age from 17{21, and in geographical backgroundfrom the West Coast of the US to the Northeast. There were 10 female and 3 male poolsubjects. The non-pool subject was a 46-year-old male business analyst from the West Coast,with a JD degree. Roughly 2/3 of the subjects had training in at least one foreign language,French and Spanish being the most common. The group was intended to be a representativecross-section of the US population, but clearly the level of education was above normal.
The experiment was run in one group session on all subjects, except that the non-poolsubject was run separately. The �rst author conducted the experiment. The S's wereprovided with a score sheet of the 400 names. For each name, the sheet gives the number ofthe name (from 0 to 399), the spelling, and one box for each of its pronunciations. The S'swere asked to listen to the tape and score each pronunciation on a scale of 1 to 3:
1 = Clearly acceptable; e.g., as they would say it2 = Somewhere in between; they could imagine that someone might say it that way3 = Clearly bad; no one would say it that way.
The rating scheme is taken from Coker et al. [1990]. If a pronunciation goes by too quicklyfor them to score it, the S's were instructed to leave a blank and raise their hand. Timepermitting, the experimenter would then rewind the tape and give them another chance.In practice, this happened two or three times; in the end, no subject left any blanks. Tohelp them get the hang of the procedure, the experimenter started with a practice tape of4 names. During the playing of the actual tape, the experimenter paused the tape brie yevery page of the score sheet (once every 40 names) and took a short break every 100 names.Some subject fatigue was apparent by the end of the session.
MERL-TR-93-05a 10 May 1996
4 Analysis
The sections below analyze the experimental data in various ways, starting with a summaryof each system's performance on the test set, and a brief look at the actual pronuncia-tions generated; continuing with an analysis of the signi�cant di�erences between Anapronand the other systems, and how this relates to system performance in practice; and �nallyinvestigating the reliability of our test subjects' judgements.
4.1 Performance on the test set
As mentioned in Section 3.3, the methodology of this experiment precludes making �ne dis-tinctions in pronunciation quality among systems; instead, we focus on the gross di�erences.We do this by lumping scores of 1 and 2 together into acceptable scores, and counting a scoreof 3 as unacceptable. Tables 1 and 2 summarize the results. Each table gives the percentageof acceptable scores, out of a total of 5600, awarded to each system (5600 = 14 judges times400 pronunciations). The scores are broken down by name frequency in Table 1, and byjudge in Table 2. The tables include an imaginary ninth system, labelled Ubound. Thissystem generates for each name the pronunciation that received the greatest number of ac-ceptable votes from the judges. It measures the degree to which all judges can be pleasedsimultaneously, using just the pronunciations available from the eight systems tested. Thisrepresents an upper bound on the scores achievable in this experiment. Two points aboutthe interpretation of the scores in these tables: �rst, as pointed out in Section 1, althoughthey are valid for comparing Anapron with the other systems, they do not represent full,unbiased text-to-speech performance, and thus should not be used for comparing one com-mercial system with another. Second, the \overall" scores in these tables rate the systems onour 400-name test set, not on the full distribution of names in Donnelley. The extrapolationto all of Donnelley will be discussed in Section 4.4.
Table 1 shows that for all systems, performance degrades as the names get rarer. Also,although the eight systems seem to hit a performance asymptote at 93%, it is likely thathumans with more exposure to names than MJW and TJG (e.g., telephone operators) wouldscore higher; the Ubound system demonstrates that it is possible to score at least 97%. Thissuggests that there is room for improvement in all systems.
Table 2 shows that there is considerable variability among judges. For instance, thescores for BP-legal range from 51% to 78%. This variability was con�rmed by calculatinginterrater agreement, kappa [Fleiss, 1981, p.218]. Kappa was found to be 0.357, indicatingpoor agreement beyond chance among judges on their scores. On the other hand, the judgesagreed closely in their rankings of the eight systems. For example, despite the discrepanciesin the scores assigned by the judges to BP-legal, they all ranked it in last place. We measuredthe agreement among judges on rankings by calculating Kendall's coe�cient of concordance,W [Kendall and Gibbons, 1990]. We found W=0.934, indicating almost perfect agreement.
MERL-TR-93-05a 11 May 1996
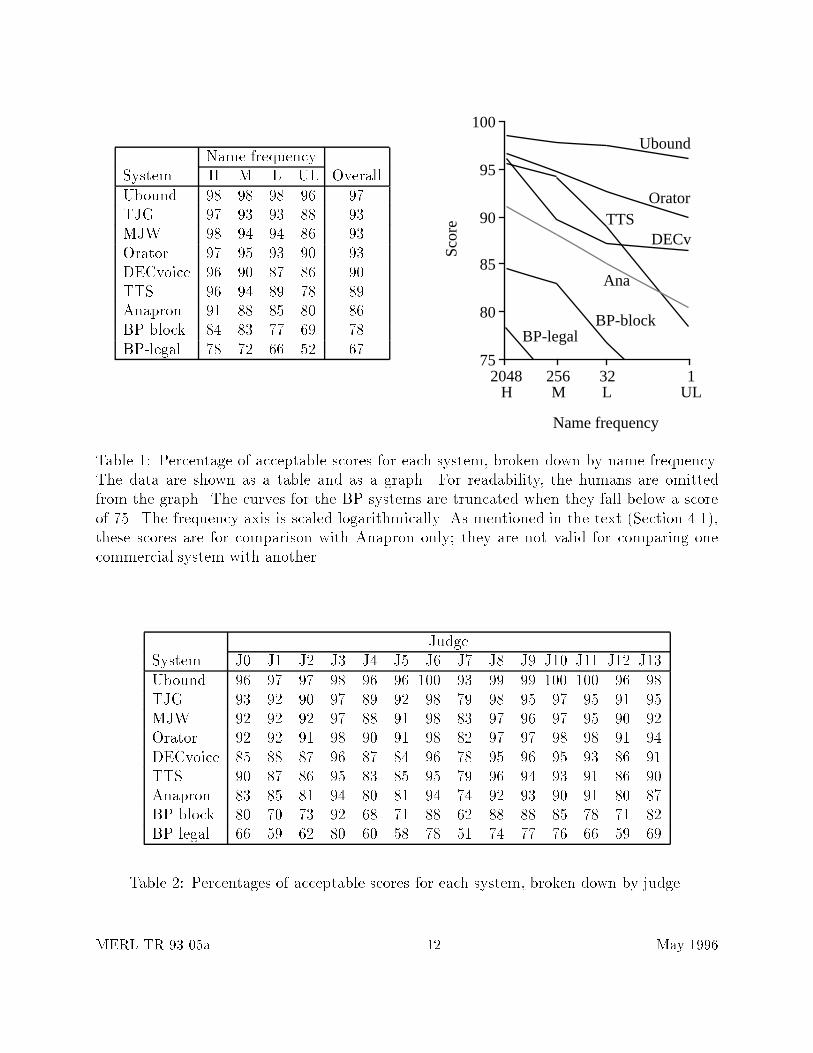
Name frequencySystem H M L UL OverallUbound 98 98 98 96 97TJG 97 93 93 88 93MJW 98 94 94 86 93Orator 97 95 93 90 93DECvoice 96 90 87 86 90TTS 96 94 89 78 89Anapron 91 88 85 80 86BP-block 84 83 77 69 78BP-legal 78 72 66 52 67
75
85
95
100
90
80
Name frequency
Scor
e
2048H
256M
32L
1UL
Ubound
Orator
Ana
DECvTTS
BP-legalBP-block
Table 1: Percentage of acceptable scores for each system, broken down by name frequency.The data are shown as a table and as a graph. For readability, the humans are omittedfrom the graph. The curves for the BP systems are truncated when they fall below a scoreof 75. The frequency axis is scaled logarithmically. As mentioned in the text (Section 4.1),these scores are for comparison with Anapron only; they are not valid for comparing onecommercial system with another.
JudgeSystem J0 J1 J2 J3 J4 J5 J6 J7 J8 J9 J10 J11 J12 J13Ubound 96 97 97 98 96 96 100 93 99 99 100 100 96 98TJG 93 92 90 97 89 92 98 79 98 95 97 95 91 95MJW 92 92 92 97 88 91 98 83 97 96 97 95 90 92Orator 92 92 91 98 90 91 98 82 97 97 98 98 91 94DECvoice 85 88 87 96 87 84 96 78 95 96 95 93 86 91TTS 90 87 86 95 83 85 95 79 96 94 93 91 86 90Anapron 83 85 81 94 80 81 94 74 92 93 90 91 80 87BP-block 80 70 73 92 68 71 88 62 88 88 85 78 71 82BP-legal 66 59 62 80 60 58 78 51 74 77 76 66 59 69
Table 2: Percentages of acceptable scores for each system, broken down by judge.
MERL-TR-93-05a 12 May 1996
This value was highly signi�cant (�2=91.5, df=7, p<0.001). Given this consensus on relative
strengths, we are on �rm ground when drawing conclusions about Anapron's performancerelative to the other systems. We should not, however, put too much stock in the absoluteacceptability scores, as these vary depending on whom you ask.
4.2 The pronunciations behind the numbers
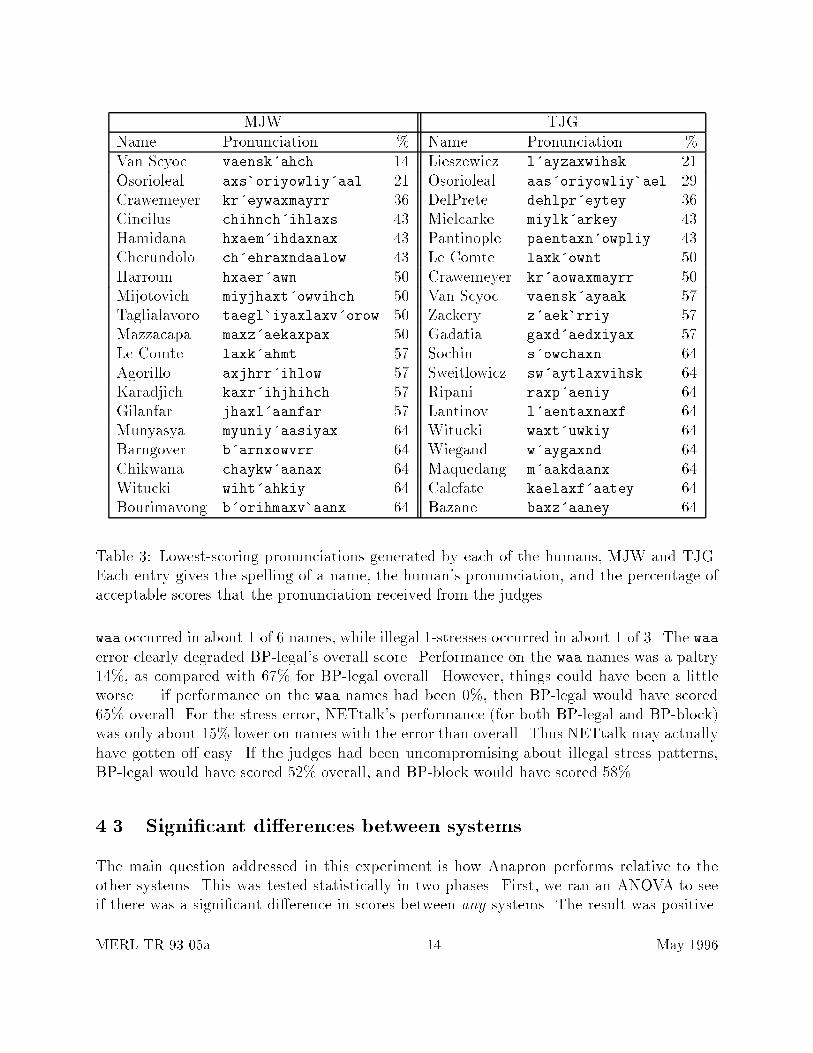
To get an idea of where the acceptability scores come from, we now take a brief look at theactual pronunciations generated by the systems. We do this for the best and worst systems.We start with the best ones, namely the humans. It is perhaps surprising that each humanscored only 93%. In other words, they were judged by their peers to generate pronunciations\that no one would say" for 7% of the names in the test set. Table 3 lists the lowest-scoringpronunciations for each human. All pronunciations receiving acceptability scores of under70% (i.e., fewer than 10/14 judges said they were acceptable) are included. In a few cases,it seems unclear why the judges were so harsh. For example, on Witucki, only 9 out of 14judges accepted MJW's pronunciation, wiht�ahkiy, or TJG's pronunciation, waxt�uwkiy,both of which seem plausible to the authors. In fact, no system got more than 10/14 forWitucki. Names like this are the reason that even the Ubound system did not score 100%.The fault could have been in DECtalk's synthesis of the pronunciations, but again it seemedunobjectionable to the authors. On the whole, though, the judges seemed to be justi�edin their scoring. For instance, although they gave low marks to TJG for his pronunciationsof Lieszewicz and Sweitlowicz, TJG admitted during debrie�ng that he did not rememberhow to pronounce the -wicz ending. Thus it would appear that the humans scored only 93%simply because they are fallible name pronouncers. This is especially true for rare names; inTable 3, 14 out of 19 of MJW's names are ultralow, as are 11 out of 19 of TJG's names.
At the opposite end of the performance spectrum from the humans are the two incarna-tions of NETtalk, BP-legal and BP-block. These systems su�er from two special pronun-ciation problems. The �rst one, which a�icts BP-legal only, is a predilection to insert thesound waa into its pronunciations. This happens because the compound phoneme waa (as inbourgeois), acts as a sort of default phoneme in BP-legal | BP-legal generates it wheneverit encounters an unusual pattern of input letters for which it has not learned any strongresponse. This results in such quaint pronunciations as sw�aytlwaawihwaa for Sweitlowicz.The second problem, which a�ects both BP-legal and BP-block, is a tendency to assign ille-gal stress patterns | patterns containing zero or multiple 1-stresses. This happens becauseNETtalk assigns stress to a vowel based on the vowel's local environment (a 7-letter window),making it hard to enforce the global constraint of a unique 1-stress. The incidence of thesetwo errors is summarized in Table 4. The rows of the table give: (i) the overall acceptablityscore for the system (for comparison), (ii) the percentage of names in the test set a�ected byeach error, (iii) the acceptability score for the system for just the names that were a�ectedby the error, and (iv) a hypothetical overall acceptability score for the system, had all nameswith the error been rated as 0% acceptable. The table shows that both errors are widespread:
MERL-TR-93-05a 13 May 1996
MJW TJGName Pronunciation % Name Pronunciation %Van Scyoc vaensk�ahch 14 Lieszewicz l�ayzaxwihsk 21Osorioleal axs�oriyowliy�aal 21 Osorioleal aas�oriyowliy�ael 29Crawemeyer kr�eywaxmayrr 36 DelPrete dehlpr�eytey 36Cincilus chihnch�ihlaxs 43 Mielcarke miylk�arkey 43Hamidana hxaem�ihdaxnax 43 Pantinople paentaxn�owpliy 43Cherundolo ch�ehraxndaalow 43 Le Comte laxk�ownt 50Harroun hxaer�awn 50 Crawemeyer kr�aowaxmayrr 50Mijotovich miyjhaxt�owvihch 50 Van Scyoc vaensk�ayaak 57Taglialavoro taegl�iyaxlaxv�orow 50 Zackery z�aek�rriy 57Mazzacapa maxz�aekaxpax 50 Gadatia gaxd�aedxiyax 57Le Comte laxk�ahmt 57 Sochin s�owchaxn 64Agorillo axjhrr�ihlow 57 Sweitlowicz sw�aytlaxvihsk 64Karadjich kaxr�ihjhihch 57 Ripani raxp�aeniy 64Gilanfar jhaxl�aanfar 57 Lantinov l�aentaxnaxf 64Munyasya myuniy�aasiyax 64 Witucki waxt�uwkiy 64Barngover b�arnxowvrr 64 Wiegand w�aygaxnd 64Chikwana chaykw�aanax 64 Maquedang m�aakdaanx 64Witucki wiht�ahkiy 64 Calefate kaelaxf�aatey 64Bourimavong b�orihmaxv�aanx 64 Bazane baxz�aaney 64
Table 3: Lowest-scoring pronunciations generated by each of the humans, MJW and TJG.Each entry gives the spelling of a name, the human's pronunciation, and the percentage ofacceptable scores that the pronunciation received from the judges.
waa occurred in about 1 of 6 names, while illegal 1-stresses occurred in about 1 of 3. The waaerror clearly degraded BP-legal's overall score. Performance on the waa names was a paltry14%, as compared with 67% for BP-legal overall. However, things could have been a littleworse | if performance on the waa names had been 0%, then BP-legal would have scored65% overall. For the stress error, NETtalk's performance (for both BP-legal and BP-block)was only about 15% lower on names with the error than overall. Thus NETtalk may actuallyhave gotten o� easy. If the judges had been uncompromising about illegal stress patterns,BP-legal would have scored 52% overall, and BP-block would have scored 58%.
4.3 Signi�cant di�erences between systems
The main question addressed in this experiment is how Anapron performs relative to theother systems. This was tested statistically in two phases. First, we ran an ANOVA to seeif there was a signi�cant di�erence in scores between any systems. The result was positive.
MERL-TR-93-05a 14 May 1996

waa-insertion Illegal 1-stressBP-legal BP-legal BP-block
Overall score 67 67 78Percent of names a�ected 16 30 31Score on a�ected names 14 50 65Hypothetical overall score 65 52 58
Table 4: Incidence of the waa-insertion and illegal 1-stress errors for BP-legal and BP-block.
We then ran a planned comparison to localize the signi�cant di�erences | in particular, tosee if there was a signi�cant di�erence between Anapron and any of the other seven systems.
The data for the ANOVA consist of an 8 � 14 � 4 array of cells. The three dimensionsare system, judge, and name frequency. Each cell contains 100 observations, for the scoresawarded to a particular system by a particular judge for the 100 names in a particularfrequency category. Each observation is an integer from 1 to 3. As is, these categoricalobservations do not satisfy the ANOVA assumptions, because they do not follow a normaldistribution. We therefore normalized each cell in the 3D array by �rst collapsing its 100observations into a single value, the proportion of acceptable scores; and then applying thedouble-arcsine transformation to assure equal variances across cells [Freeman and Tukey,1950, p.607]. We then performed a 3-way, �xed-e�ects ANOVA. The ANOVA says whetherdi�erences between systems, between judges, or between name frequencies account for asigni�cant portion of the variance between cell values. It also says whether interactionsamong these three dimensions are signi�cant.
The results were that there were in fact signi�cant di�erences between systems (F=649,p<0.001), between judges (F=183, p<0.001), and between frequency categories (F=575,p<0.001). All pairwise interactions were signi�cant at the 0.001 level as well, although thesee�ects were quite minor compared to the main e�ects. The interaction between systemand name frequency indicates that some systems are a�ected more than others by changesin name frequency. This shows up in the graph of system score versus name frequency(Table 1), where the curve of the TTS system slopes steeply enough to cross the curves ofDECvoice and Anapron.
Having established that signi�cant di�erences exist, we then tested which particularpairs of systems were signi�cantly di�erent. We used the Bonferroni multiple comparisonprocedure [Miller, 1981, p.68]. We made seven comparisons, for Anapron versus each of theother systems. This design was preferred over the blanket approach of comparing all pairsof systems, because (1) the fewer comparisons we make, the more powerful each comparisoncan be, without increasing the risk of detecting spurious di�erences; and (2) given that ourgoal is to evaluate Anapron, comparisons that do not involve Anapron are super uous. Theresults of the Bonferroni procedure appear in the last column of Table 5. The table shows
MERL-TR-93-05a 15 May 1996
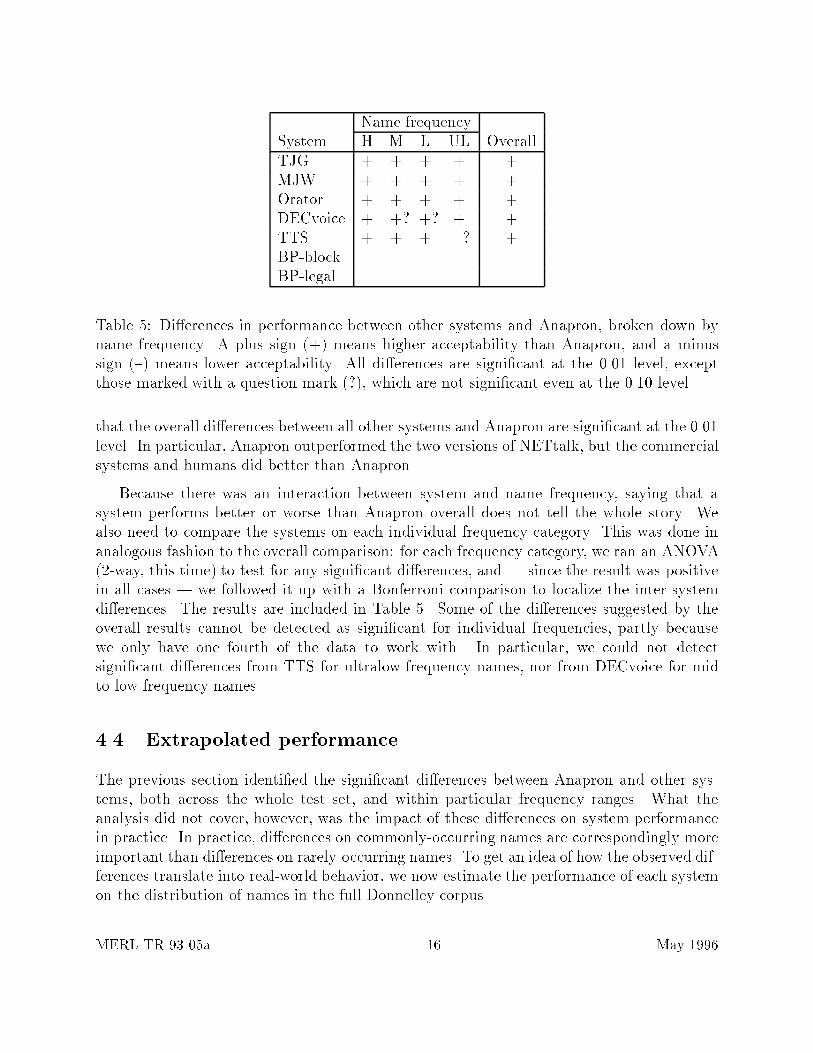
Name frequencySystem H M L UL OverallTJG + + + + +MJW + + + + +Orator + + + + +DECvoice + +? +? + +TTS + + + {? +BP-block { { { { {BP-legal { { { { {
Table 5: Di�erences in performance between other systems and Anapron, broken down byname frequency. A plus sign (+) means higher acceptability than Anapron, and a minussign ({) means lower acceptability. All di�erences are signi�cant at the 0.01 level, exceptthose marked with a question mark (?), which are not signi�cant even at the 0.10 level.
that the overall di�erences between all other systems and Anapron are signi�cant at the 0.01level. In particular, Anapron outperformed the two versions of NETtalk, but the commercialsystems and humans did better than Anapron.
Because there was an interaction between system and name frequency, saying that asystem performs better or worse than Anapron overall does not tell the whole story. Wealso need to compare the systems on each individual frequency category. This was done inanalogous fashion to the overall comparison: for each frequency category, we ran an ANOVA(2-way, this time) to test for any signi�cant di�erences, and | since the result was positivein all cases | we followed it up with a Bonferroni comparison to localize the inter-systemdi�erences. The results are included in Table 5. Some of the di�erences suggested by theoverall results cannot be detected as signi�cant for individual frequencies, partly becausewe only have one fourth of the data to work with. In particular, we could not detectsigni�cant di�erences from TTS for ultralow-frequency names, nor from DECvoice for midto low-frequency names.
4.4 Extrapolated performance
The previous section identi�ed the signi�cant di�erences between Anapron and other sys-tems, both across the whole test set, and within particular frequency ranges. What theanalysis did not cover, however, was the impact of these di�erences on system performancein practice. In practice, di�erences on commonly-occurring names are correspondingly moreimportant than di�erences on rarely-occurring names. To get an idea of how the observed dif-ferences translate into real-world behavior, we now estimate the performance of each systemon the distribution of names in the full Donnelley corpus.
MERL-TR-93-05a 16 May 1996

Name rank
80
858891
100
1 913471 1560915
Scor
e
Figure 2: Estimate of Anapron's performance as a function of name rank in Donnelley. Theblack segments correspond to measured (or assumed) performance. The gray segments arelinear interpolations between the black segments.
The estimates were obtained as follows: for each system, we start with four (F ,S) datapoints. The value F is a name frequency, and S is the system's score on names of thatfrequency. The four points correspond to the four frequency categories tested. To coverthe very high frequencies, we add a �fth point, (676080, 100%), which assumes that everysystem's performance approaches 100% for the top-ranking names. This is realistic to theextent that system designers will have done whatever is necessary to make their systemsproduce acceptable pronunciations for these often-encountered names. Given these �ve datapoints, we can construct a partial function from name rank to system performance. Each(F ,S) point gives rise to a horizontal segment in this function, connecting (R1,S) and(Rn,S), where R1 and Rn are the ranks of the �rst and last names in Donnelley of frequencyF . To �ll in the gaps between these segments, we do simple linear interpolation. Figure 2shows the complete function for Anapron.
We will denote this function from name rank to score as score(R) for a system. Wethen estimate the performance of the system for all of Donnelley as a weighted average ofscore(R), where the weights follow the distribution of names in Donnelley. The formula isas follows:
Performance =X
1�R�1560915
score(R) freq(R)
where freq(R) gives the frequency distribution for Donnelley. The value of freq(R) was notavailable for each individual rank, but it was known for 48 rank intervals.7 This gave a wayof approximating the formula above. The approximation was applied to the systems in theexperiment; Table 6 gives the results. The scores on the 400-name test set are included forcomparison. The performance scores for Donnelley are markedly higher than the scores on
7Cecil Coker, personal communication, 3/18/91, kindly supplied this information.
MERL-TR-93-05a 17 May 1996
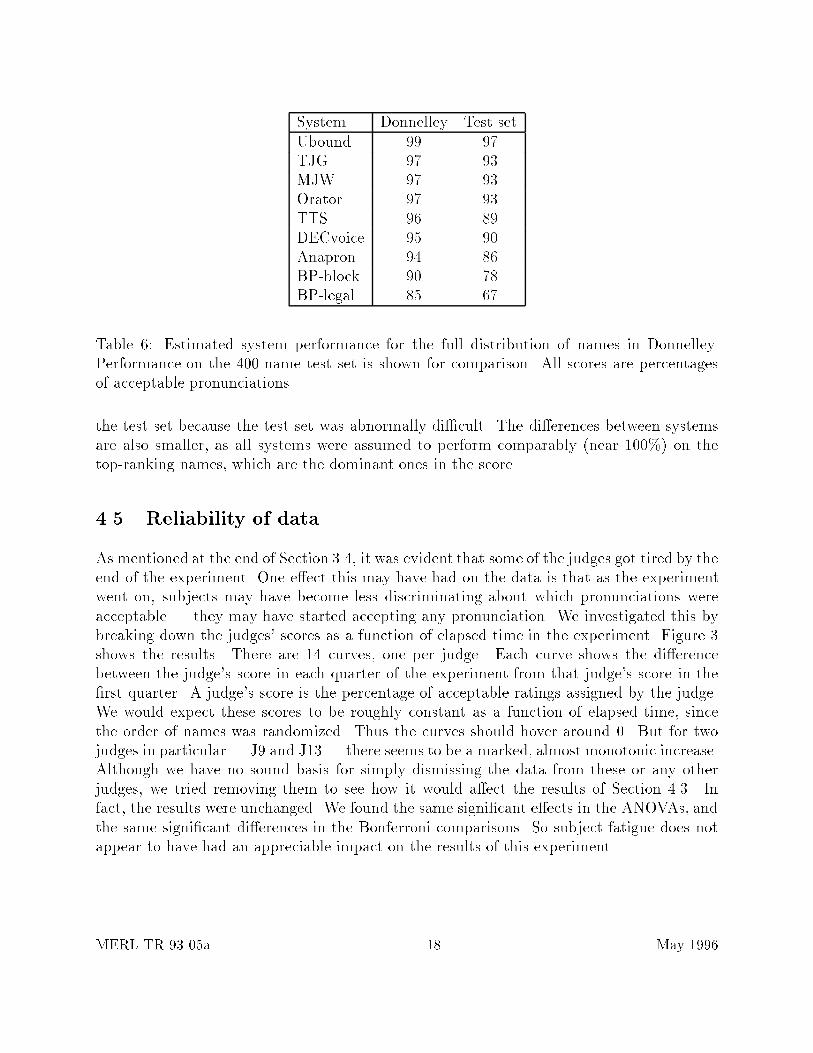
System Donnelley Test setUbound 99 97TJG 97 93MJW 97 93Orator 97 93TTS 96 89DECvoice 95 90Anapron 94 86BP-block 90 78BP-legal 85 67
Table 6: Estimated system performance for the full distribution of names in Donnelley.Performance on the 400-name test set is shown for comparison. All scores are percentagesof acceptable pronunciations.
the test set because the test set was abnormally di�cult. The di�erences between systemsare also smaller, as all systems were assumed to perform comparably (near 100%) on thetop-ranking names, which are the dominant ones in the score.
4.5 Reliability of data
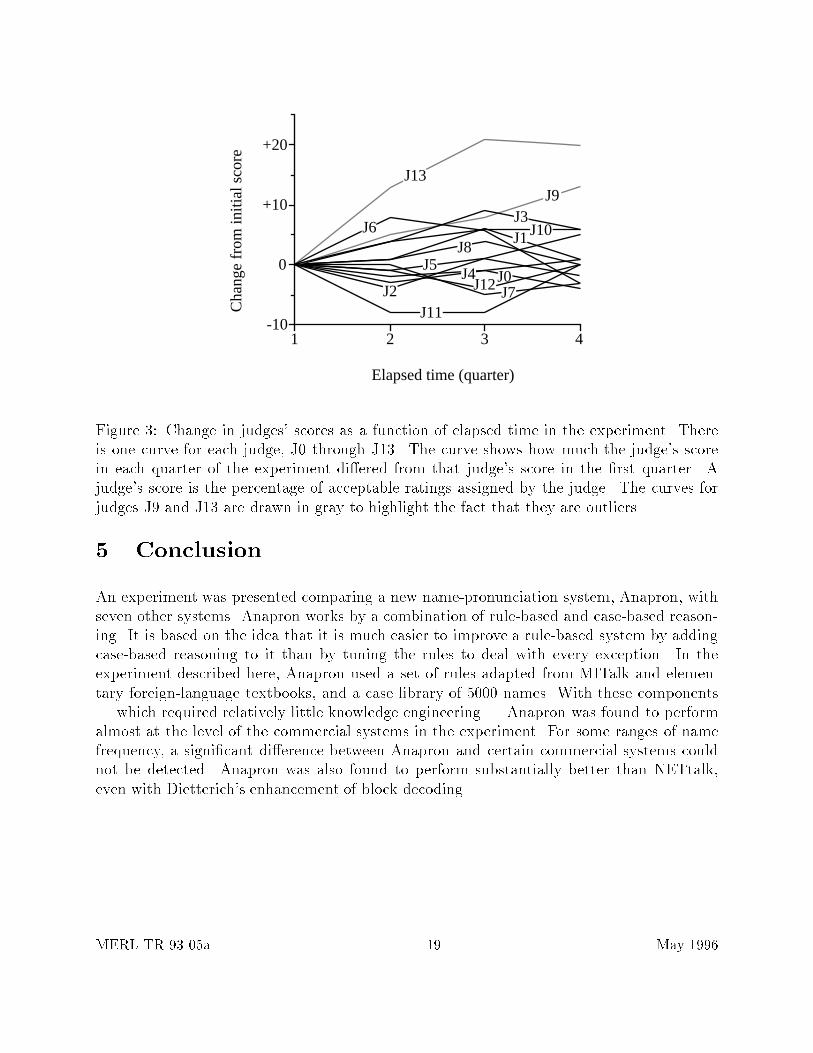
As mentioned at the end of Section 3.4, it was evident that some of the judges got tired by theend of the experiment. One e�ect this may have had on the data is that as the experimentwent on, subjects may have become less discriminating about which pronunciations wereacceptable | they may have started accepting any pronunciation. We investigated this bybreaking down the judges' scores as a function of elapsed time in the experiment. Figure 3shows the results. There are 14 curves, one per judge. Each curve shows the di�erencebetween the judge's score in each quarter of the experiment from that judge's score in the�rst quarter. A judge's score is the percentage of acceptable ratings assigned by the judge.We would expect these scores to be roughly constant as a function of elapsed time, sincethe order of names was randomized. Thus the curves should hover around 0. But for twojudges in particular | J9 and J13 | there seems to be a marked, almost monotonic increase.Although we have no sound basis for simply dismissing the data from these or any otherjudges, we tried removing them to see how it would a�ect the results of Section 4.3. Infact, the results were unchanged. We found the same signi�cant e�ects in the ANOVAs, andthe same signi�cant di�erences in the Bonferroni comparisons. So subject fatigue does notappear to have had an appreciable impact on the results of this experiment.
MERL-TR-93-05a 18 May 1996
4321
J12 J7
J10
J11
J8J1
J5
J13J9
J2
J3J6
J0J4
+10
+20
-10
0
Elapsed time (quarter)
Cha
nge
from
initi
al s
core
Figure 3: Change in judges' scores as a function of elapsed time in the experiment. Thereis one curve for each judge, J0 through J13. The curve shows how much the judge's scorein each quarter of the experiment di�ered from that judge's score in the �rst quarter. Ajudge's score is the percentage of acceptable ratings assigned by the judge. The curves forjudges J9 and J13 are drawn in gray to highlight the fact that they are outliers.
5 Conclusion
An experiment was presented comparing a new name-pronunciation system, Anapron, withseven other systems. Anapron works by a combination of rule-based and case-based reason-ing. It is based on the idea that it is much easier to improve a rule-based system by addingcase-based reasoning to it than by tuning the rules to deal with every exception. In theexperiment described here, Anapron used a set of rules adapted from MITalk and elemen-tary foreign-language textbooks, and a case library of 5000 names. With these components| which required relatively little knowledge engineering | Anapron was found to performalmost at the level of the commercial systems in the experiment. For some ranges of namefrequency, a signi�cant di�erence between Anapron and certain commercial systems couldnot be detected. Anapron was also found to perform substantially better than NETtalk,even with Dietterich's enhancement of block decoding.
MERL-TR-93-05a 19 May 1996
References
Basson, S., D. Yashchin, K. Silverman, and A. Kalyanswamy, 1991. Assessing the accept-ability of automated customer name and address: A rigorous comparison of text-to-speechsynthesizers. In Proceedings of AVIOS.
Coker, C. H., K. W. Church, and M. Y. Liberman, 1990. Morphology and rhyming: Twopowerful alternatives to letter-to-sound rules for speech synthesis. In Conference on Speech
Synthesis, European Speech Communication Association.
Conroy, D., T. Vitale, and D. H. Klatt, 1986. DECtalk DTC03 Text-to-Speech System
Owner's Manual. Educational Services of Digital Equipment Corporation, P.O. BoxCS2008, Nashua, NH 03061. Document number EK-DTC03-OM-001.
Dietterich, T. G., H. Hild, and G. Bakiri, 1990. A comparative study of ID3 and back-propagation for English text-to-speech mapping. In Proceedings of the 7th IMLW, Austin,Morgan Kaufmann.
Fleiss, J. L., 1981. Statistical Methods for Rates and Proportions. John Wiley and Sons.
Freeman, M. F., and J. W. Tukey, 1950. Transformations related to the angular and thesquare root. Annals of Mathematical Statistics, 21.
Golding, A. R., 1991. Pronouncing Names by a Combination of Rule-Based and Case-Based
Reasoning. PhD thesis, Stanford University.
Golding, A. R. and P. S. Rosenbloom, 1991. Improving rule-based systems through case-based reasoning. In Proceedings of AAAI-91, Anaheim.
Hunnicutt, S., 1976. Phonological rules for a text-to-speech system. American Journal of
Computational Linguistics. Micro�che 57.
Kendall, M. and J. D. Gibbons, 1990. Rank Correlation Methods. Edward Arnold, London.Fifth edition.
McClelland, J. L. and D. E. Rumelhart, 1988. Explorations in Parallel Distributed Processing.The MIT Press, Cambridge, MA. Includes software for IBM PC.
Miller, R. G. Jr., 1981. Simultaneous Statistical Inference. Springer Verlag, New York.
Sejnowski, T. J. and C. R. Rosenberg, 1987. Parallel networks that learn to pronounceEnglish text. Complex Systems, 1.
Spiegel, M. F., 1985. Pronouncing surnames automatically. In Proceedings of AVIOS.
Spiegel, M. F. and M. J. Macchi, 1990. Synthesis of names by a demisyllable-based speechsynthesizer (Orator). AVIOS Journal, 7. Special RHC/RBOC issue.
Vitale, A. J., 1991. An algorithm for high accuracy name pronunciation by parametric speechsynthesizer. Journal of Computational Linguistics, 17(3).
MERL-TR-93-05a 20 May 1996
A DECtalk notation
Following is a description of the relevant portions of the pronunciation notation used byDECtalk [Conroy et al., 1986].
Vowels
aa fatherae batah butao boughtaw boutax aboutay biteeh betey bakeih bitiy beatow boatoy boyrr bird (stressed)uh bookuw bootyu cute
R-Colored Diphthongs
ar barer bearir beeror boreur poor
Syllabic Consonants
el bottleen buttonrr butter
Stress8
� primary stress� secondary stress
Consonants
b binch chind debtdh thisf fing giveh headjh gink catl letm metn netnx singp pinr reds sitsh shint testth thinv vestw westyx yetz zoozh measure
Allophones
ix kisses (reduced ih)dx rider, writer (alveolar ap)lx bellq we eat (glottal stop)rx orationtx Latin
8Stress values will sometimes be written as numbers above the vowels. A 1 means the vowel has primarystress, 2 means it has secondary stress, and 0 means it is unstressed.
MERL-TR-93-05a 21 May 1996