trace analysis of acrylamide by high-performance thin ... · 4.alpmann, a.; morlock, g. ultra-trace...
TRANSCRIPT

Trace analysis of acrylamide byhigh-performance thin-layer chromatography
coupled to mass spectrometry
Dissertation zur Erlangung des Doktorgradesder Naturwissenschaften (Dr. rer. nat.)
Fakultät NaturwissenschaftenUniversität Hohenheim
Institut für Lebensmittelchemie
vorgelegt vonAlexander Alpmann
aus Balve
2010

Dekan: Prof. Dr. Heinz Breer1. berichtende Person: Prof. Dr. Wolfgang Schwack2. berichtende Person: Dr. Gertrud MorlockEingereicht am: 04.06.2010Mündliche Prüfung am: 21.06.2011
Die vorliegende Arbeit wurde am 05.08.2010 von der Fakultät Naturwissenschaften der UniversitätHohenheim als "‘Dissertation zur Erlangung des Doktorgrades der Naturwissenschaften"’ angenom-men.

Für Oma und Opa.


Danksagung
Ich danke Herrn Prof. Dr. Wolfgang Schwack für die hervorragenden Arbeitsbedingungen am Institutfür Lebensmittelchemie der Universität Hohenheim.
Frau Dr. Gertrud Morlock möchte ich herzlich danken für die interessante Aufgabenstellung, ihreGeduld und die hilfreichen Diskussionen.
Bei allen Kolleginnen und Kollegen des Instituts möchte ich mich für das freundschaftliche Arbeits-klima und die stete Hilfsbereitschaft bedanken.
Und besonders möchte ich meiner Frau Stephanie Alpmann für ihre Unterstützung und Geduld währendder Entstehung dieser Arbeit von Herzen danken.
Preliminary Remarks
The work presented in this thesis was carried out under the supervision of PD Dr. G. Morlock at theInstitute of Food Chemistry, University of Hohenheim, Stuttgart, Germany, from November 2004 toOctober 2007. It was supported by grant of the Landesstiftung Baden-Württemberg, Germany.
Parts of this work have already been published in international peer-reviewed journals or were pre-sented at scientific conferences as oral or poster presentations.
Full Papers
1. Alpmann, A.; Morlock, G. Improved online coupling of planar chromatography with electro-spray mass spectrometry: extraction of zones from glass plates. Anal. Bioanal Chem. 2006,386, 1543-1551.
2. Alpmann, A.; Morlock, G. Rapid and sensitive determination of acrylamide in drinking waterby planar chromatography and fluorescence detection. J. Sep. Sci. 2008, 31, 71-77.
3. Alpmann, A.; Morlock, G. Rapid and cost effective determination of acrylamide in coffee byplanar chromatography and fluorescence detection after derivatization with dansulfinic acid. J.
AOAC Int. 2009, 92, 725-729.
Oral Presentations
1. Alpmann, A.; Morlock, G. Kopplungsmöglichkeiten der Planar-Chromatographie mit der Massen-spektrometrie. Jahrestagung des Regionalverbandes Süd-West der LebensmittelchemischenGesellschaft, Karlsruhe, Germany, March 7, 2006.
2. Alpmann, A.; Jeszberger, J.; Morlock, G.; Schwack, W. Kosteneffektive HPTLC/FLD-Methodezur Quantifizierung von Acrylamid in Kaffee und Kartoffelchips. Jahrestagung des Region-alverbandes Süd-West der Lebensmittelchemischen Gesellschaft, Stuttgart, Germany, March 4,2008.

Poster Presentations
1. Alpmann, A.; Jautz, U.; Morlock, G. HPTLC/ESI-MS, HPTLC/ESI-MS/MS and HPTLC/DART-TOF - suitable for mass confirmation of positive findings in trace analysis? XXXth JubileeSymposium for Chromatographic methods of investigating the organic compounds, Katowice-Szczyrk, Poland, June 1, 2006.
2. Alpmann, A.; Morlock, G. Verbesserung der Online-Kopplung der Planar-Chromatographie mitder Massenspektrometrie: Extraktion von Zonen auf HPTLC/DC-Glasplatten. 35. DeutscherLebensmittelchemikertag, Dresden, September 18 - 20, 2006.
3. Alpmann, A.; Morlock, G. Improvement of online coupling of planar chromatography withelectrospray mass spectrometry: extraction of zones from glass plates. International Sympo-sium for HPTLC, Berlin, October 9 - 11, 2006.
4. Alpmann, A.; Morlock, G. Ultra-trace and trace level quantification of acrylamide in concernedfood by planar chromatography and fluorescence detection. 31st International Symposium onHigh Performance Liquid Phase Separations and Related Techniques, Ghent, June 17 - 21,2007.
5. Alpmann, A.; Morlock, G.; Müller, D.; Schwack, W. Neue HPTLC/FLD-Methode zur Bestim-mung von Acrylamid in Kartoffelchips. 36. Deutscher Lebensmittelchemikertag, Nürnberg-Erlangen, 2007, September 10 - 12, 2007.
6. Alpmann, A.; Morlock, G.; Schwack, W. Ultra-Spurenanalytik von Acrylamid in Trinkwassermittels HPTLC/FLD. 36. Deutscher Lebensmittelchemikertag, Nürnberg-Erlangen, 2007, Septem-ber 10 - 12, 2007.
7. Alpmann, A.; Morlock, G.; Schwack, W. Ultra-Spurenanalytik von Acrylamid in Trinkwassermittels Planar-Chromatographie. Langenauer Wasserforum, Langenau (Ulm), Germany, Novem-ber 5 - 6, 2007.
II
Chapters 2 - 4 of this doctoral thesis are in form identical with the full publications 1 - 3. Tables andfigures have been numbered consecutively and a combined directory of references was created.
To clarify the participation and contribution of each author named in the publications it is explainedin the following:
Dr. G. Morlock was the supervisor of this work. Durig the entire work she was the adviser regardingall practical and theoretical analytical issues. Proof-reading of the manuscripts and corrections interms of formal and textural aspects were done by her. Dr. G. Morlock also functioned as an advisorthroughout the publications processes and was responsible for all formal aspects of the publications.
Mr. A. Alpmann planned all theoretical and experimental steps. He performed all analytical workincluding HPTLC and HPTLC-MS measurements, extractions of samples and synthesis of fluores-cence marker. Futhermore he interpreted and analyzed the data as well as prepared the manuscriptsaccording to author guidelines including text, tables and figures.
III


Contents
1 General Introduction 1
1.1 Formation . . . . . . . . . . . . . . . . . . . . . . . . . . . . . . . . . . . . . . . . 1
1.2 Factors & minimization . . . . . . . . . . . . . . . . . . . . . . . . . . . . . . . . . 5
1.2.1 Sugar . . . . . . . . . . . . . . . . . . . . . . . . . . . . . . . . . . . . . . 5
1.2.2 Fats . . . . . . . . . . . . . . . . . . . . . . . . . . . . . . . . . . . . . . . 6
1.2.3 Proteins . . . . . . . . . . . . . . . . . . . . . . . . . . . . . . . . . . . . . 6
1.2.4 Water . . . . . . . . . . . . . . . . . . . . . . . . . . . . . . . . . . . . . . 7
1.2.5 Drinking water . . . . . . . . . . . . . . . . . . . . . . . . . . . . . . . . . 7
1.2.6 Coffee . . . . . . . . . . . . . . . . . . . . . . . . . . . . . . . . . . . . . . 7
1.3 Toxicology . . . . . . . . . . . . . . . . . . . . . . . . . . . . . . . . . . . . . . . 8
1.3.1 Metabolism . . . . . . . . . . . . . . . . . . . . . . . . . . . . . . . . . . . 8
1.3.2 Neurotoxicity . . . . . . . . . . . . . . . . . . . . . . . . . . . . . . . . . . 8
1.3.3 Reproductive toxicity . . . . . . . . . . . . . . . . . . . . . . . . . . . . . . 9
1.3.4 Carcenogenicity . . . . . . . . . . . . . . . . . . . . . . . . . . . . . . . . 9
1.3.5 Risk . . . . . . . . . . . . . . . . . . . . . . . . . . . . . . . . . . . . . . . 9
1.3.6 Epidemologic studies . . . . . . . . . . . . . . . . . . . . . . . . . . . . . . 10
1.4 Analysis . . . . . . . . . . . . . . . . . . . . . . . . . . . . . . . . . . . . . . . . . 10
1.4.1 Extraction . . . . . . . . . . . . . . . . . . . . . . . . . . . . . . . . . . . . 11
1.4.2 Clean-up . . . . . . . . . . . . . . . . . . . . . . . . . . . . . . . . . . . . 11
1.4.3 GC-MS . . . . . . . . . . . . . . . . . . . . . . . . . . . . . . . . . . . . . 12
1.4.4 LC-MS/MS . . . . . . . . . . . . . . . . . . . . . . . . . . . . . . . . . . . 13
1.5 Coupling of planarchromatography and mass spectrometry . . . . . . . . . . . . . . 13
1.6 Aims of the study . . . . . . . . . . . . . . . . . . . . . . . . . . . . . . . . . . . . 15
2 Improvement of online coupling of planar chromatography with electrospray mass
spectrometry: extraction of spots from glass plates 17
2.1 Abstract . . . . . . . . . . . . . . . . . . . . . . . . . . . . . . . . . . . . . . . . . 17
2.2 Introduction . . . . . . . . . . . . . . . . . . . . . . . . . . . . . . . . . . . . . . . 18
2.3 Experimental Section . . . . . . . . . . . . . . . . . . . . . . . . . . . . . . . . . . 18
2.4 Results and Discussion . . . . . . . . . . . . . . . . . . . . . . . . . . . . . . . . . 20
Contents
2.5 Conclusion . . . . . . . . . . . . . . . . . . . . . . . . . . . . . . . . . . . . . . . 272.6 Acknowledgements . . . . . . . . . . . . . . . . . . . . . . . . . . . . . . . . . . . 29
3 Rapid and sensitive determination of acrylamide in drinking water by planar chro-
matography and fluorescence detection after derivatization with dansulfinic acid 31
3.1 Abstract . . . . . . . . . . . . . . . . . . . . . . . . . . . . . . . . . . . . . . . . . 313.2 Introduction . . . . . . . . . . . . . . . . . . . . . . . . . . . . . . . . . . . . . . . 323.3 Experimental . . . . . . . . . . . . . . . . . . . . . . . . . . . . . . . . . . . . . . 333.4 Results and discussion . . . . . . . . . . . . . . . . . . . . . . . . . . . . . . . . . 353.5 Concluding remarks . . . . . . . . . . . . . . . . . . . . . . . . . . . . . . . . . . . 423.6 Acknowledgements . . . . . . . . . . . . . . . . . . . . . . . . . . . . . . . . . . . 42
4 Rapid and cost effective determination of acrylamide in coffee by planar chromatog-
raphy and fluorescence detection after derivatization with dansulfinic acid 43
4.1 Abstract . . . . . . . . . . . . . . . . . . . . . . . . . . . . . . . . . . . . . . . . . 434.2 Introduction . . . . . . . . . . . . . . . . . . . . . . . . . . . . . . . . . . . . . . . 444.3 Experimental . . . . . . . . . . . . . . . . . . . . . . . . . . . . . . . . . . . . . . 454.4 Results and Discussion . . . . . . . . . . . . . . . . . . . . . . . . . . . . . . . . . 474.5 Conclusions . . . . . . . . . . . . . . . . . . . . . . . . . . . . . . . . . . . . . . . 504.6 Acknowledgements . . . . . . . . . . . . . . . . . . . . . . . . . . . . . . . . . . . 52
5 References 61
VI

Chapter 1
General Introduction
1.1 Formation
Studies dealing with formation of acrylamide identified very early the amino acid asparagine as animportant educt. Several formation paths have been shown:
• The condensation product of asparagine and glucose, N-glycosylasparagine, that is created atthe beginning of the Maillard reaction, was suggested as a precursor.
• The Strecker-reaction of asparagine and the formation of its Strecker aldehyde were consideredas other possibilities.
• Additionally, it was shown that decarboxylated asparagine, 3-aminopropionamide, is able torelease acrylamide during heating.
• A reaction mechanism involving acrolein and acrylic acid has been considered as well.
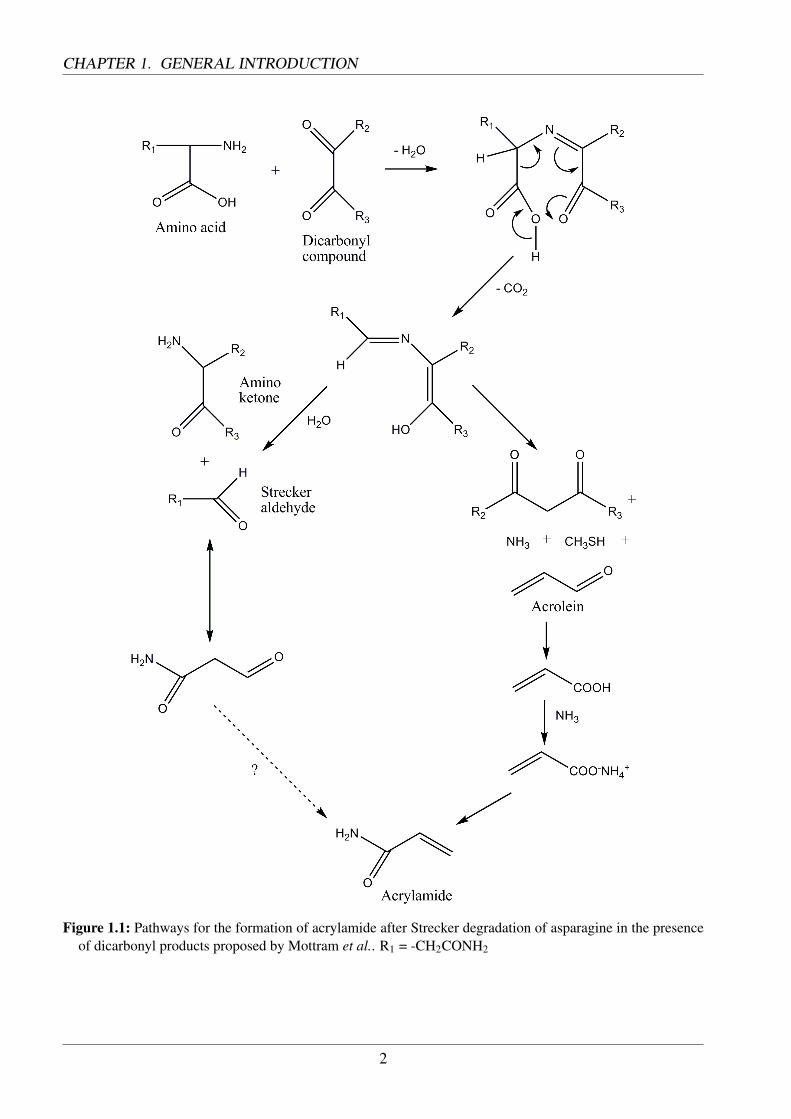
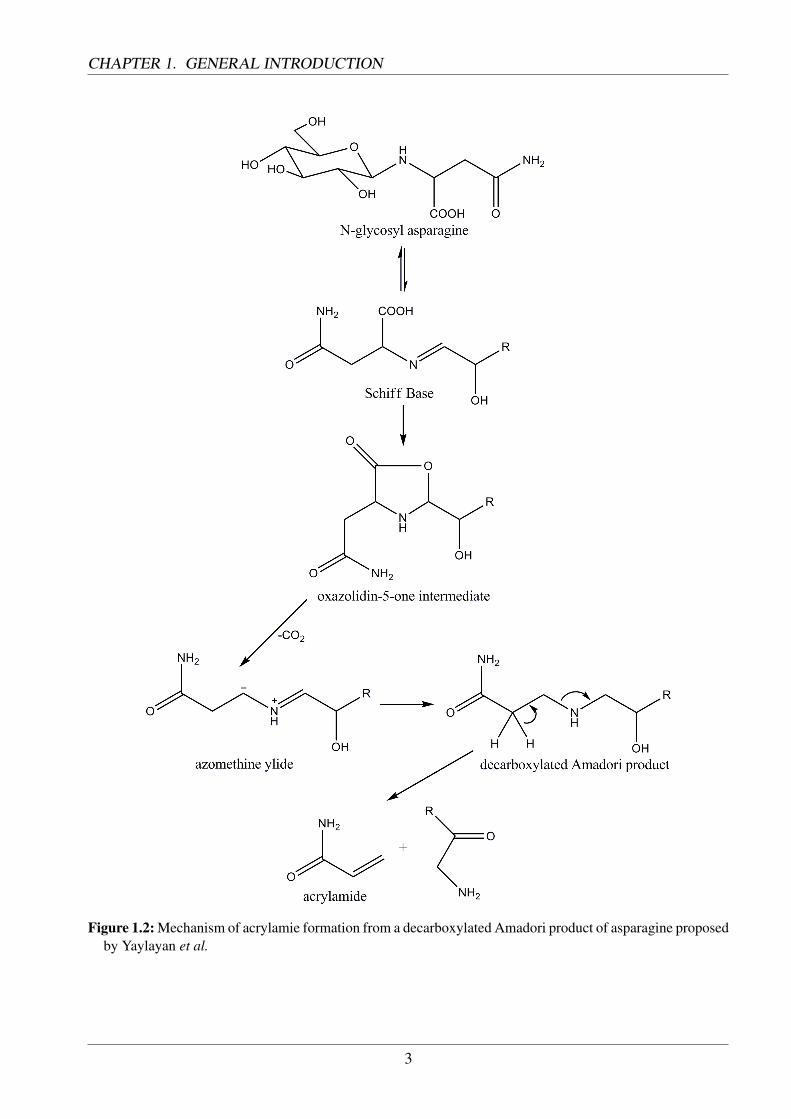
The formation of acrylamide in food was traced back to the Maillard-reaction by Stadler et al. [1] andMottram et al. [2] in 2002. These results were verified by findings from Becalski et al. in 2003 [3].Mottram et al. discovered that acrylamide is generated especially at temperatures above 100 C and inpresence of asparagine. It was also proven that reducing sugars or similar dicarbonyles from Amadoriproducts were necessary for an increased yield. The formation path proposed by Mottram involvedthe Strecker degradation and the resulting aldehyde. Furthermore, he pointed out pathways involvingacrolein and acrylic acid (Fig. 1.1). The reaction between sugars and asparagine at the beginning ofthe Maillard reaction was also held responsible for the formation of acrylamide by Stadler. By theuse of isotope-labelled asparagine he was able to trace the carbon backbone of acrylamide back tothis amino acid. Yaylayan et al. proposed a formation path based on N-glycosylasparagine, whichis generated at the beginning of the Maillard reaction [4]. Intramolecular cyclisation and subsequentdecarboxylation leads to an Amadori product, which releases acrylamide at elevated temperatures(Fig. 1.2).
CHAPTER 1. GENERAL INTRODUCTION
Figure 1.1: Pathways for the formation of acrylamide after Strecker degradation of asparagine in the presenceof dicarbonyl products proposed by Mottram et al.. R1 = -CH2CONH2
2
CHAPTER 1. GENERAL INTRODUCTION
Figure 1.2: Mechanism of acrylamie formation from a decarboxylated Amadori product of asparagine proposedby Yaylayan et al.
3

CHAPTER 1. GENERAL INTRODUCTION
Figure 1.3: Pathways for the formation of acrylamide after reaction of asparagine with a carbonyl group to aSchiff base proposed by Zyzak et al.
4

CHAPTER 1. GENERAL INTRODUCTION
Zyzak et al. found that dicarbonyles are not absolutely necessary for formation of acrylamide [5].Other reactive carbonyl groups were tested as potential reactants, too. Isotope-labelled asparaginehelped in finding another pathway: Asparagine reacts with a carbonyl group to a Schiff base, whichdecarboxylates at higher temperatures. The product can dissociate to acrylamide and an imine orhydrolyse to 3-aminopropionamide, which dissociates to NH3 and acrylamide (Fig. 1.3). Thus, thismolecule was proposed as a possible precursor by Zyzak et al. Granvogl et al. deepened this ideaand identified the in-vivo decarboxylation and subsequent deamination of asparagine as a possiblesource of 3-aminopropionamide [6]. However, the study showed that only small quantities of thissubstance are present in food. Hence, this pathway was regarded as being of minor importance.In a second study, Granvogl et al. examined the possibility of heat-induced decarboxylation anddeamination of asparagine [7]. Using Gouda cheese as an example for a food with low concentrationof 3-aminopropionamide and high concentration of asparagine, the generation of acrylamide withoutthe presence of reducing sugars was demonstrated. An effective transformation of the precursor wasobserved.
The formation path involving acrolein and acrylic acid was investigated by Yashura et al. [8].Acrolein is generated during the degradation of lipids amongst others and has been associated withacrylamide formation during deep-frying. The heating of asparagine, acrolein, acrylic acid, NH3 andvarious carbonyl compounds in different model systems presented several potent mixtures: Amongthe known combination asparagin/glucose (yield of 1.200 µg acrylamide/g amine) and asparagine/acrolein(114 µg acrylamide/g amine), NH3/acrylic acid (190.000 µg acrylamide/g amine) was the most ef-fective mixture. As possible sources of NH3 in food the deamination of α-amino acids or the Streckerdegradation were suggested. The authors proposed that acrolein oxidizes to acrylic acid and furtherreacts with NH3 generating acrylamide.
1.2 Factors & minimization
In addition to the mechanistic formation path of acrylamide, studies about factors promoting theformation were conducted using model food systems. These studies used conditions that were similarto industrial and household food preparation. With the aid of model food-systems the influence ofdifferent components on acrylamide yield were examined.
1.2.1 Sugar
With the aid of a potato-model, Biedermann et al. demonstrated that fructose increased the yieldof acrylamide compared to glucose [9]. It became apparent that glucose increased the amount ofacrylamide only half as much as fructose. These results were verified by Pollien et al. [10]. Sucrose
5
CHAPTER 1. GENERAL INTRODUCTION
as a potential reactant was already determined by Stadler et al. [1]. However, the heat-inducedhydrolysis of this non-reducing sugar was a prerequisite for subsequent reaction of its componentsglucose and fructose [4].
1.2.2 Fats
The possible role of lipids was examined intensively. Firstly, the highest concentration of acrylamideis generally produced during frying and deep-frying of foods, whereas no acrylamide is detectedafter boiling of foods in water. Secondly, a possible reaction-path involves a typical lipid-oxidationproduct: acrolein. Thus, subsequent studies addressed the question whether the addition of oil to dryfood-models led to an increased formation of acrylamide. Another aspect was the respective abilityof different oils to generate acrylamide. These studies led to contradictive results. The addition ofdifferent oils to potato-models resulted in increased yields (Becalski et al. [3] and Tareke et al. [11])whereas studies conducted by Biedermann et al. [9] did not show an effect on the yield after additionof oils to a potato-model. Even abused, i.e. overheated, oil had no impact on the formation yield.Consequently, Biedermann ruled out a significant contribution of acrolein to the formation. Becalskiet al. [3] and Tareke et al. [11] observed different impacts of each oil examined. A comparative studyof various plant oils by Mestdagh et al. [12] showed that the type of oil had no significant impact.It is assumed that the possible impact of oil can be traced back to an improved heat transfer into thefood.
1.2.3 Proteins
Generally, only small amounts of acrylamide are detected in meat [3, 13] and only small amounts offree asparagine are present. However, the reaction between acrylamide and typical meat componentsis possible. This assumption is corroborated by various studies: Biedermann et al. reported that thedegradation of spiked acrylamide is more distinct in a meat matrix than in a starch-based matrix [9].Rydberg et al. showed that the addition of fish to a potato-system resulted in a lower yield [14].Becalski et al. reported that the addition of asparagine and cysteine to a potato starch matrix led toa decreased formation of acrylamide compared to the exclusive addition of asparagine [3]. The bondformed between acrylamide and SH-groups can be considered as a possible reason for this effect.
The ability of amino acids to form acrylamide was already addressed in studies concerning the mech-anistic formation path. It was reported by Stadler et al. that asparagine contributes by far the most tothe formation [1]. Only methionine showed a low yield after heating with reducing sugars, too.
6
CHAPTER 1. GENERAL INTRODUCTION
1.2.4 Water
Since acrylamide is mainly formed via the Maillard-reaction, the moisture content of the matrix is acritical factor. However, several studies led to contradictory results. The influence of water was anal-ysed by Elmore et al. by means of doughs possessing various moisture contents [15]. The doughswere deep-fried for different times. The humidity decreased while the content of acrylamide in-creased. It was concluded that low moisture led to an increased yield of acrylamide. In contrast,Mestdagh et al. used a closed system, where the water could not evaporate, and found the oppositeconclusion, namly an increasing effect of water on acrylamide formation. The results of Elmore et al.
were explained by the thermic energy that acts upon the matrix: At first, the inside temperature of thefood does not exceed 100 C, because water has to evaporate and no significant amount of acrylamidewas generated. Only intensive heating and evaporation of water leads to an increased acrylamideyield.
The factors affecting the acrylamide content in coffee and drinking water investigated in the presentedwork are mentioned in the following.
1.2.5 Drinking water
In contrast to other food, acrylamide is not generated in drinking water. In fact it is transported byexternal effects into the water. Polyacrylamide is used as a grouting agent in tunnels, dams and wa-ter pipes. The formulation always contains the monomer in variable percentages. Due to its highsolubility in water it easily reaches the ground water. A study by Smith et al. demonstrated thatheat, light and special weather conditions accelerate the depolymerisation process [17]. Thus, theresulting level of contamination exceeds the initial monomer content. Additionally, broad applica-tion of polyacrylamide in the paper-, textile- and plastic-industry leads to transfer of acrylamide intowaste-water. Since polyacrylamide is used for flocculation in waste-water treatment, even a directintroduction of the monomer into drinking water is possible. Producers of polyacrylamide certifythe maximum monomer concentration of 250 mg/kg. The WHO set the maximum concentration at0.5 µg/L [18] and the US Environment Protection Agency (EPA) demands water suppliers to certifythat the monomer level does not exceed 0.05 % at a maximum dosage of 1 mg/L [19]. Within the EUthe limit set in the directive EU 98/83/EC allows a maximum concentration of 0.1 µg acrylamide /Ldrinking water [20].
1.2.6 Coffee
Even though relatively small amounts of acrylamide were found in roasted coffee, this product con-tributes considerably to the daily intake due to its high consumption. Its contribution was estimated
7

CHAPTER 1. GENERAL INTRODUCTION
to be 36 % of the daily acrylamide intake in Norway, Sweden and Switzerland [21, 22] and around20 % in Denmark [23]. The relatively low concentration (170 - 351 µg/kg) can be ascribed to hightemperatures during roasting [24]. Experiments using coffee spiked with 14C-labelled acrylamidedemonstrated that more than 95 % were degraded during roasting [25, 26]. Because of the importantimpact of the roasting procedure on the organoleptic properties there is only a small working rangefor minimisation. The influence of roasting time and temperature on the acrylamide concentrationwas examined in a study by Lantz et al. [27]. It became apparent that the extension of the roastingtime within the common industrial range made no significant improvement. The mean amount of as-paragine in coffee varieties Robusta and Arabica was 797 µg/g and 486 µg/g, respectively. The mostavailable sugar was sucrose (49 mg/g (Robusta) and 79 mg/g (Arabica), respectively). The correlationbetween the content of both precursors and the formation of acrylamide during roasting showed that ahigh amount of sucrose led to lower concentrations of acrylamide [28]. Asparagine can be regarded asa limiting factor. Thus, selection of adequate coffee varieties is the only approach for minimisation.
1.3 Toxicology
1.3.1 Metabolism
The main mechanism of detoxification is conjugation of acrylamide with glutathione and subsequentsecretion of the mercapturic acid. The product, N-acetyl-S-(2-carbamoylethyl)-cysteine is secretedwith the urine [29, 30]. The conversion of acrylamide by means of cytochrome P-450 representsanother important type of reaction, resulting in formation of the more toxic glycidamide [31, 32].On the one hand, glycidamide can be hydrolysed to 2,3-dihydroxy-propionamide by an epoxide-hydrolase [33], on the other hand it can be converted to its corresponding mercapturic acid with theaid of glutathion-transferase [34]. Alkylation of the SH-group of cysteine is assumed to be anothermechanism of detoxification [35].
1.3.2 Neurotoxicity
Workers that accidentally had been exposed to higher amounts of acrylamide showed symptoms ofa peripheral neuropathy [36]. The concentration of haemoglobin-adducts correlated well with theintensity of the observed symptoms. The consequences of short-term occupational exposition wereweak legs, loss of toe reflexes and sensations, numb hands and feet, followed by skin peeling from thehands. Longer exposure led to cerebellar dysfunction, i.e. exaggerated movement and motor function,followed by neuropathy [37]. There are two mechanistic hypothesis of acrylamide neurotoxicity: Theinhibition of either the neurotransmission or of the intracellular axonal transport [38, 39].
8
CHAPTER 1. GENERAL INTRODUCTION
1.3.3 Reproductive toxicity
In spermatides of rats and mice lethal mutations induced by acrylamide were reported. Thus, acry-lamide is classified as mutagenic [40]. Furthermore, the feeding of water solutions of acrylamide torats during breeding, gestation and lactation, led to disruptions in mating, interference with ejacu-lation, decreased food intake and body weight gain, decreased pup body weight at birth and weightgain during lactation [41]. Feeding of neurotoxic doses to rats results in reproductive toxic effects:formation of abnormal sperm, decreased sperm count, reduced fertility rates and increased resorp-tion of fetuses [42, 43]. The mechanisms of reproductive toxicity are assumed to be the alkylationof SH-groups in the sperm nucleus and tail, depletion of glutathione and DNA-damage in the testis[35].
1.3.4 Carcenogenicity
Acrylamide is classified by the International Agency for Research on Cancer (IARC) as category2A "probably carcinogenic to humans "[44]. Animal studies showed that acrylamide can induce anincreased incidence of cancer of the brain, the central nervous system, the thyroid and other en-docrine glands as well as reproductive organs of mice [45]. A lifelong feeding of upto 3 mg/kg bodyweight/day to rats increased the incidence of tumors in several organs. The metabolite glycidamidewas identified as the major carcinogen in rodents. Friedmann pointed out that it has to be elucidatedif these carcinogenic manifestations can be transferred to humans [24]. The research on the mech-anisms of carcinogenesis showed that acrylamide and glycidamide are able to modify DNA both invitro and in vivo [35, 47]. Acrylamide reacts with DNA, forming adenosine- and cytosine-adducts. Inexaminations of acrylamide-treated rats and mice only the glycidamide derivate, N-7-(2-carbamoyl-2-hydroxyethyl)guanine was found [48]. Concerning the reactivity with DNA, it was shown thatglycidamide was 100 - 1000 times more reactive than acrylamide.
1.3.5 Risk
Numerous studies in several countries were conducted concerning the acrylamide intake of the pop-ulation. The average intake by adults was estimated to be 0.3 - 0.6 µg/kg body weight/day [49].Children and adolescents tend towards a higher intake relative to the bodyweight. This was explainedby their higher caloric intake and the preferred consumption of acrylamide-rich food like potato chipsand crisps [22]. The contribution of each food to the intake varies across countries according to theirdietary pattern. Taking all together, the major sources are potato products, bread and coffee [50-52].An exact estimation of the acrylamide intake is difficult for several reasons: The concentration variesbetween foods of different brands and even batches. Furthermore, there is no reliable estimation of
9

CHAPTER 1. GENERAL INTRODUCTION
the acrylamide content of homemade food due to its dependence on the cooking parameters. Ad-ditional sources that have to be considered are cigaretts, cosmetics and water. Existing estimationsof cancer risk to humans due to low acrylamide-doses are all based upon a study by Johnson et al.
with high doses of acrylamide in animals [53]. The US EPA estimated cancer risk at 4,5 x 10⁻³ perµg/kg body weight/day, i.e. 45 additional cases per 10.000 people with a mean acrylamide intake of1 µg/kg body weight [54]. However the WHO/FAO estimated the cancer risk at 3.3 x 10⁻⁴, i.e. 33additional cases per 100.000 people [55]. Significant uncertainty surrounds these estimates. The un-derlying study used doses at 3 - 5 orders of magnitude greater than the estimated intake. It is possiblethat the metabolism from acrylamide to glycidamide at lower doses may be decreased and protectivemechanisms like DNA repair and apoptosis may be more effective [49].
1.3.6 Epidemologic studies
For examination of the connection between acrylamide intake and cancer risk several epidemiologicalstudies were conducted or evaluated. Mucci et al. examined the relation between dietary intake ofacrylamide and cancer of bladder, kidney and large bowel [56]. For this evaluation, data from a formerSwedish case-control study were used. Information on dietary habits was assessed through a semi-quantitative food frequent questionnaire. The acrylamide content of each food item was estimated bythe ranking given by the Swedish National Food Administration. Their intake was summed-up, dis-tinguishing smokers and non-smokers. No evidence was found that an elevated intake of acrylamidefrom food or smoke led to an increased risk of the examined types of cancers. The same conclusionwas drawn by Mucci et al. in a similar study [57]. The data of a case-control study dealing with renalcell cancer was reanalysed accordingly. No positive association became evident. Case-control studiesare susceptible to recall and selection biases. Prospective studies that follow the proband over a longerperiod are considered higher evidence. Two prospective studies on acrylamide intake and cancer wereassessed by Mucci et al. [58, 59]. The first study analysed data from the Swedish Women‘s Healthand Lifestyle Cohort concerning breast cancer risk. Over 43.000 women were followed from 1991until end of 2002. The data of the second study was obtained by over 61.000 women in the SwedishMammography cohort. Based on colon cancer cases the association between acrylamide intake andcancer risk was examined. In both studies the authors found no evidence for a positive associationbetween acrylamide and cancer risk.
1.4 Analysis
Since the discovery of acrylamide in food in 2002 several studies about analyses were published.Numerous reviews summarized the analytical methods [26, 60-62]. It became apparent that sample
10
CHAPTER 1. GENERAL INTRODUCTION
preparation and extraction had a great influence on the results. Due to the diversity of sample matri-ces, various measurement methods and sample preparation procedures were applied. Even using thesame measurement method and identical sample matrices, diverse protocols were used, proving thatcoffee and cocoa were the most problematic samples. Actually, liquid or gas chromatographic sep-aration combined with mass spectrometric detection and the use of isotope-labelled standards werecommonly applied.
1.4.1 Extraction
Because of its high solubility in water, the most widespread method is the aqueous extraction at roomtemperature [23, 50, 63-97]. However, the use of mixtures of water and organic solvents [3, 5, 68,98-100] or the use of organic solvents without addition of water were reported, too [74, 101-106].Sometimes elevated temperature is used for swelling of the matrix and to achieve better penetrationof the extraction solvent into the food matrix [68, 83]. Application of digestive enzymes like amy-lases was tested, resulting in no positive effect on the extraction yield [68, 78, 107]. Parameters liketemperature, duration of extraction, amount of solvent, degreasing steps, the particle size of the ho-mogenized sample itself and the use of mechanic force (stirrer, shaker) varied clearly. Acceleratedsolvent extraction (ASE) was applied as alternative extraction method [108-110]. The most suitableorganic solvent for ASE with highest sensitivity and lowest impact on the food matrix was acetoni-trile. The apparent advantage compared to aqueous extraction was the possibility to evaporate thesolvent and hence to concentrate the analyte.
1.4.2 Clean-up
Because of high concentrations of matrix compounds like sugars, proteins, salt, and lipids, sampleclean-up is important especially if sensitive mass spectrometers were applied for detection. Mostclean-up procedures consisted of multiple solid-phase extraction steps. To cover a wide range of co-extracted compounds possessing different polarities, different solid phases were applied. Dependingon the food sample, activated carbon-, ion exchange-, reversed- and mixed-mode-phases were usedindividually or combined to achieve effective purification. The Oasis HLB (hydrophilic-lipophilic-balance) phase, a wettable reversed phase material, was applied for several sample matrices, too [2,8, 12, 16, 78, 88, 105].
11

CHAPTER 1. GENERAL INTRODUCTION
1.4.3 GC-MS
For determination of acrylamide by gas chromatography, two strategies can be followed: Firstly, itis possible to detect acrylamide directly using GC-MS. Secondly, acrylamide can be derivatized withbromine prior detection. Currently, quantification after derivatization with bromine is much morecommon.
The direct determination with GC-MS offers the advantage to omit the laborious and time-consumingbromination step. Furthermore, there is no need to handle dangerous chemicals. Because of thehigh polarity and low volatility of acrylamide, the choice of the best GC phase is crucial. Especiallywhen taking into account that water, which is ill-suited for injection into GC-systems, is the preferredextraction solvent, selection of the best phase is a prerequisite for valid analysis. Mostly a more orless extensive sample preparation is necessary since co-extracted precursors may result in acrylamideformation after injection into the hot injector system, falsifying quantitative results. Unfortunatelythe low molecular weight of acrylamide (71 Da) results in a very unspecific mass signal, not allowingfor unequivocal identification of acrylamide [61]. Consequently, the addition of an isotope-labelledstandard is essential.
The determination of acrylamide by GC-MS after bromination was already applied to analyses ofdrinking water, waste water and crop [65, 66, 111, 112] prior to the application to complex foodmatrices. Due to its higher volatility and elevated molecular weight (229 Da), the resulting deriva-tive 2,3-dibromopropionamide showed improved properties for GC-MS analysis. Its fragments andbromine isotopes can be detected by MS with sufficient specificity. However, the bromination is anadditional laborious and time-consuming step: To achieve bromination, a mixture of KBr, HBr andsaturated bromine water is used. For the reaction (1) an excess of H+ and Br- is needed to inhibitdissociation (2).
Br2 + H2C=CH-CONH2 −→ H2CBr-CHBr-CONH2 (1)Br2 + H2O⇐⇒ HOBr + H+ + Br- (2)
In former protocols the reaction took place near freezing temperatures overnight. Otherwise theinternal standard (methacrylamide) reacted at a different rate with bromine compared to acrylamide.Nemoto et al. and Ono et al. showed that the addition of isotope-labelled standards shortened thereaction time to roughly 1 h [70, 72]. Excessive elemental bromine was removed by addition ofthiosulfate and the derivative was extracted from the aqueous phase using apolar solvents. Afterwardsthe extract was evaporated, made-up to a defined volume and an aliquot was analyzed by GC-MS. Foridentification the ions [C3H4NO]+=70, [C3H4
79BrNO]+=149 and [C3H481BrNO]+=151; the signal
intensity at m/z 149 is used for quantification [62].
12

CHAPTER 1. GENERAL INTRODUCTION
1.4.4 LC-MS/MS
For chromatographic separation of acrylamide, reversed phase columns are the preferred stationaryphases. Depending on the mobile phase, the polar analyte is retained only weakly and consequentlyelutes very early. To achieve sufficient separation from other polar substances, mostly hydrophilicend-capped C18-columns were used [62]. Furthermore, graphitic carbon, polymethacrylate gel andCN-substituted silica gel were applied as stationary phases. A mixture of methanol and water ispreferred as mobile phase [60-62]. Detection of acrylamide can be carried out with MS or MS/MS.Mostly, single-quadrupole MS are not sensitive enough to detect acrylamide in aqueous extracts priorto enrichment. To achieve limits of detection similar to MS/MS, various methods were applied: switchto an organic solvent with subsequent enrichment, column switching to the electrospray SIM mode[113] or derivatization with 2-mercaptobenzoic acid [76]. This type of derivatization has a couple ofbenefits: due to the conversion of acrylamide into a stable thioether, a less polar molecule is obtained,possessing sufficient retention on a reversed-phase column. Additionally, its higher molecular weight(225 Da) allows a more specific detection of the molecule itself and of its fragments. LC-MS/MSwith electrospray-ionization in the positive mode is the most widespread method for analysis of acry-lamide [60, 61]. The tandem mass spectrometer works in multiple reaction monitoring mode, wherethe transition from precursor ion to product ion is detected: the precursor ion separated in the firstquadrupole, is fragmented by collision with argon in the second quadrupole. The resulting productions are separated in the third quadrupole and finally detected. The most intensive signal which is alsoused for quantification is the transition m/z 72 - 55. For identification the transitions m/z 72 - 54, 72 -44, 72 - 27, or 72 - 72 are used. For the internal standards [13C3]- acrylamide and [13C1]-acrylamidethe transitions m/z 75 - 58 and 73 - 56 are observed, respectively. LC-MS/MS methods reach a limitof detection of 3 - 20 µg/kg and a limit of quantification of 10 - 50 µg/kg. The analysis is linear overthe range of 10 - 10.000 µg/kg [60-62].
1.5 Coupling of planarchromatography and mass spectrometry
Coupling of planar chromatography and MS offers many advantages, which can be used for differentapproaches. Firstly, there are low costs for chromatographic separation. At the same time planar chro-matography is very effective, since several samples can be analysed within one run. This makes thishyphenated method suited well for screening purposes. Another benefit is the fact that after separationno substance is lost, i.e. analytical information is stored on the plate and can be further analysed at adifferent time and in a different place. That means that additional spectrometry can be applied onlyin case of need, thus avoiding needless analytical work. Numerous approaches for coupling planarchromatography and MS were published. The spectrum ranges from fast atom bombardment (FAB)[115], liquid secondary ion (LSI) [116], matrix assisted laser desorption/ionisation (MALDI) [117,
13
CHAPTER 1. GENERAL INTRODUCTION
118], surface assisted laser desorption/ionisation (SALDI) [119] and laser desorption (LD) [120] tocoupling with electrospray ionisation (ESI) [121], desorption electrospray ionisation (DESI) [122]and novel ionization techniques like direct analysis in real-time (DART) [123].
The coupling method used in this work was developed by Luftmann [124]. It consists of a novelplunger-based extractor called ChromeXtractor. This manual interface was connected to a HPLCpump that fed the extraction solvent and the ESI source of the mass spectrometer. Additionally, it waspossible to connect other detectors, e.g. UV/VIS, or to employ the interface for preparation purposes.An exact description can be found in Chapter 2. Briefly, the plunger was manually positioned overand pressed onto the analyte zone. After this the extraction solvent led through the inlet capillary,dissolved the analyte and was driven to the ESI source. Luftmann demonstrated the applicability byquantification of a yohimbin/ajmalicin mixture in the range of 0.1 to 100 ng per spot and identifica-tion of oligosaccharides and gangliosides. These measurements were carried out on aluminium- andpolyester-backed plates, since glass-plates broke under the plunger’s contact pressure. This was adrawback because the majority of stationary phases on HPTLC-plates are applied on glass. In Chap-ter 2 the modifications that have overcome this disadvantage are presented. The interface was laterimproved by Luftmann through automating the positioning of the plunger and the whole extractionprocedure. Aranda et al. validated this "hands-free"approach by quantification of caffeine withoutthe use of internal standards [125].
14

CHAPTER 1. GENERAL INTRODUCTION
1.6 Aims of the study
Since the discovery of acrylamide in food in 2002, approaches to determine this small molecule inheterogeneous matrices in the µg/kg-range were sought. GC-MS methods applied to waste waterand crop in the past were adapted to this matrix. Additionally, LC-MS/MS methods were developed,reaching low limits of detection. These methods required intensive sample preparation that suitedthe specific matrix. Problematic samples like coffee could not be analysed by common preparationsand required special preparation procedures. Altogether intensive sample preparation and the useof expensive equipment became necessary for the determination of acrylamide. Thus, simplifiedbut reliable determination methods were demanded. Due to its tolerance towards sample matrix,cost-effectiveness and possible coupling with different detectors, planar chromatography is a modernalternative to classical methods of determination. Hence, the aims of this study were as follows:
• Modification of Luftmann’s interface for the use on glass-backed HPTLC-plates to broaden theapplicability of this hyphenation;
• Development of a derivatisation method to transform acrylamide into a fluorescent moleculefor the determination by means of HPTLC-FLD;
• Application of HPTLC-MS for identification of the reaction products for the optimization ofthe derivatisation process;
• Development of a method to determine acrylamide in water in order to demonstrate the appli-cability of HPTLC ;
• Development of a method to determine acrylamide in coffee in order to demonstrate the appli-cability of HPTLC on problematic sample matrix;
15

Chapter 2
Improvement of online coupling of planar
chromatography with electrospray mass
spectrometry: extraction of spots from
glass plates
Reproduced with permission from Analytical and Bioanalytical Chemistry, 2006, 386, Alpmann, A.;Morlock, G. Improved online coupling of planar chromatography with electrospray mass spectrome-try: extraction of zones from glass plates., 1543-1551, ©2006 Springer-Verlag GmbH.
2.1 Abstract
A plunger-based extraction device for HPTLC/MS coupling which was originally designed for ex-traction on TLC aluminum foils was enhanced. The modifications enabled extraction of analytesfrom glass-backed HPTLC/TLC plates after separation. The device was improved 3-fold: A buffer-ing of the plunger reduced the occurrence of leakage. The involvement of a torque screwdriver for thefixation resulted in a reproducible contact pressure and eliminated breaking of the glass plates. Theemployment of this device was also extended to plates with a layer thickness of 100 µm by reducingthe height of the plungers cutting edge. Repeatabilities of the extraction from glass-backed plates was8.7 % and 18.6 % for the substances used. The influence of the elution solvent on the intensity of theMS-signal was demonstrated.

CHAPTER 2. IMPROVEMENT OF ONLINE COUPLING OF PLANAR CHROMATOGRAPHYWITH ELECTROSPRAY MASS SPECTROMETRY: EXTRACTION OF SPOTS FROM GLASSPLATES
2.2 Introduction
Planar chromatography (HPTLC, TLC) is a simple and cost-effective method for chromatographicseparation of a wide spectrum of substances and is especially used in modern laboratories for rapidscreening. But due to the advances of high performance liquid chromatography (HPLC) this methodhas taken a back seat, in spite of its multiple advantages e.g. possibility of performing parallel analy-sis, high flexibility towards chromatography and detection, tolerance regarding samples highly loadedwith matrix. A disadvantage of HPTLC compared to HPLC is the lack of coupling possibilities withmass spectrometric methods that made it necessary to scrape the sorbent off the plate and extractthe analyte. This is timeconsuming, solvent-squandering and prone to recontamination. Differentapproaches to overcome this inconvenience have been made and can be categorized into two groups:On the one hand there are methods that use a laser (IR [126], MALDI [127-131]), ion beam (SIMS[132]), particle beam (FAB [133]), electrospray (DESI [122] ) or excited gas stream with chargedwater molecule clusters (DART [134, 135]) to desorb substances from a HPTLC plate. On the otherhand there are online approaches which use solvents to extract substances from the adsorbent of theplate [124, 136-138]. A special device for direct extraction from TLC aluminum foils was developedby Luftmann [124]. With the aid of the ChromeXtractor the substance can be extracted directly fromthe TLC foil and led into a mass spectrometer. Further ways for hyphenation by ChromeXtractorexist in the coupling with any detector that allows the intake of liquids (DAD, CAD, ECD, etc.). Upto now the latter coupling has not been applicable on glass-backed plates, because it was not possi-ble to reach enough contact pressure to seal the extraction area tightly enough without breaking theglass. In this paper we describe the possibility of extraction from glass plates by three modificationsof the ChromeXtraktor. The reproducibility of the extraction and the influence of the extraction sol-vent on the intensity of the mass spectrometric signal were investigated. The extraction was alreadydemonstrated for various substances in the field of food analysis [135, 139, 140]. In this study itis demonstrated for two products of synthesis, that are xanthyl ethyl carbamate (XEC) and dansylethylamide (DEA).
2.3 Experimental Section
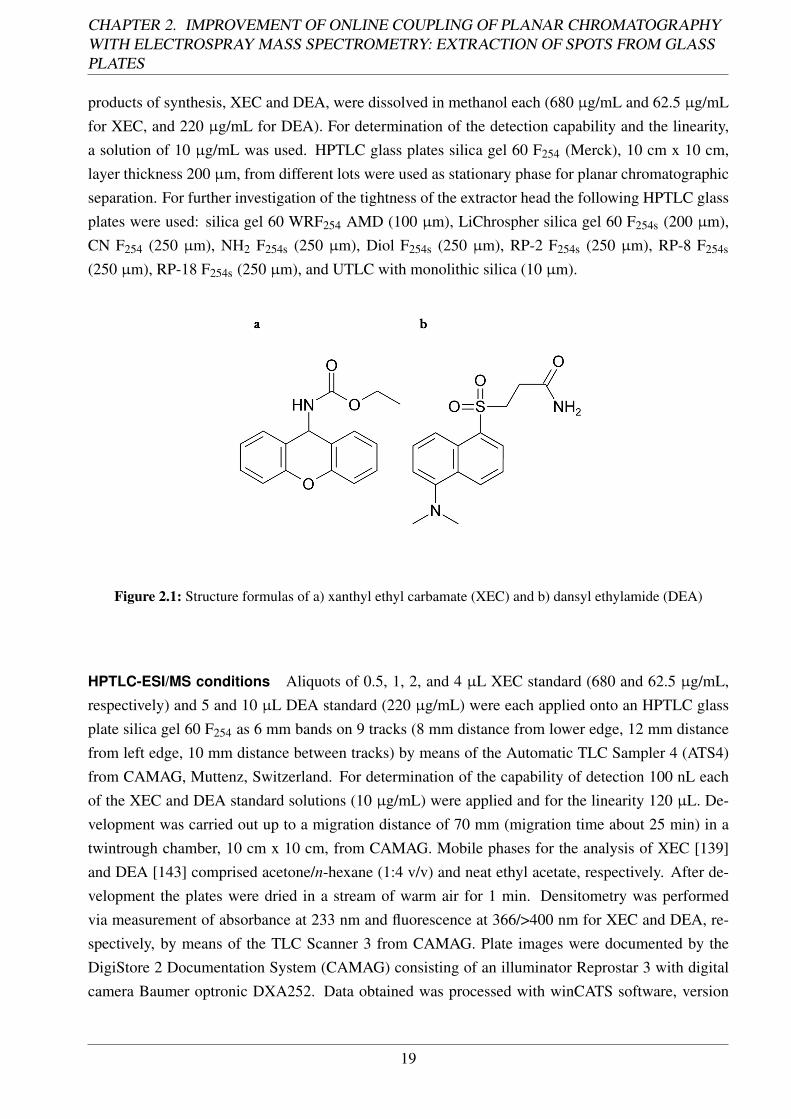
Chemicals Ethyl carbamate (99 %) was obtained from Sigma-Aldrich, Steinheim, Germany andacrylamide (99 %) from Merck, Darmstadt, Germany. Xanthydrol (99 %) and dansyl hydrazine(95 %) were purchased from Fluka, Buchs, Switzerland. XEC (Fig. 2.1a) was synthesized [141,142] and isolated by recrystallization from n-hexane. DEA (Fig. 2.1b) was synthesized and purifiedby means of preparative TLC [143]. All solvents used for planar chromatographic separation andextraction were of p.a. quality or distilled prior to use. Ultrapure water (18 MΩ/cm2) was produced bySynergy System (Millipore GmbH, Schwalbach, Germany). For application on the HPTLC plate two
18
CHAPTER 2. IMPROVEMENT OF ONLINE COUPLING OF PLANAR CHROMATOGRAPHYWITH ELECTROSPRAY MASS SPECTROMETRY: EXTRACTION OF SPOTS FROM GLASSPLATES
products of synthesis, XEC and DEA, were dissolved in methanol each (680 µg/mL and 62.5 µg/mLfor XEC, and 220 µg/mL for DEA). For determination of the detection capability and the linearity,a solution of 10 µg/mL was used. HPTLC glass plates silica gel 60 F254 (Merck), 10 cm x 10 cm,layer thickness 200 µm, from different lots were used as stationary phase for planar chromatographicseparation. For further investigation of the tightness of the extractor head the following HPTLC glassplates were used: silica gel 60 WRF254 AMD (100 µm), LiChrospher silica gel 60 F254s (200 µm),CN F254 (250 µm), NH2 F254s (250 µm), Diol F254s (250 µm), RP-2 F254s (250 µm), RP-8 F254s
(250 µm), RP-18 F254s (250 µm), and UTLC with monolithic silica (10 µm).
Figure 2.1: Structure formulas of a) xanthyl ethyl carbamate (XEC) and b) dansyl ethylamide (DEA)
HPTLC-ESI/MS conditions Aliquots of 0.5, 1, 2, and 4 µL XEC standard (680 and 62.5 µg/mL,respectively) and 5 and 10 µL DEA standard (220 µg/mL) were each applied onto an HPTLC glassplate silica gel 60 F254 as 6 mm bands on 9 tracks (8 mm distance from lower edge, 12 mm distancefrom left edge, 10 mm distance between tracks) by means of the Automatic TLC Sampler 4 (ATS4)from CAMAG, Muttenz, Switzerland. For determination of the capability of detection 100 nL eachof the XEC and DEA standard solutions (10 µg/mL) were applied and for the linearity 120 µL. De-velopment was carried out up to a migration distance of 70 mm (migration time about 25 min) in atwintrough chamber, 10 cm x 10 cm, from CAMAG. Mobile phases for the analysis of XEC [139]and DEA [143] comprised acetone/n-hexane (1:4 v/v) and neat ethyl acetate, respectively. After de-velopment the plates were dried in a stream of warm air for 1 min. Densitometry was performedvia measurement of absorbance at 233 nm and fluorescence at 366/>400 nm for XEC and DEA, re-spectively, by means of the TLC Scanner 3 from CAMAG. Plate images were documented by theDigiStore 2 Documentation System (CAMAG) consisting of an illuminator Reprostar 3 with digitalcamera Baumer optronic DXA252. Data obtained was processed with winCATS software, version
19

CHAPTER 2. IMPROVEMENT OF ONLINE COUPLING OF PLANAR CHROMATOGRAPHYWITH ELECTROSPRAY MASS SPECTROMETRY: EXTRACTION OF SPOTS FROM GLASSPLATES
1.4.1 (CAMAG). As extraction solvent a mixture of 95 % MeOH and 5 % ammoniumformiate buffer(10 mM, pH 4) was used. A flow of 0.1 mL/min was provided by an HPLC pump HP 1100 from Ag-ilent Technologies, Palo Alto, USA. The glass plates were extracted by means of the ChromeXtractorfrom ChromAn, Holzhausen, Germany. Mass spectrometric measurement was performed with VGPlatform II quadrupole electrospray mass spectrometer from Micromass, Manchester, UK. The capil-lary voltage was set to 3.5 kV and the cone voltage to 35 V and 30 V for XEC and DEA, respectively.The pressure of the drying gas was adjusted to 250 bar and the nebulizing gas to 8 bar. Single ionmonitoring (SIM) and full scan measurements were carried out in ESI+-mode.
2.4 Results and Discussion
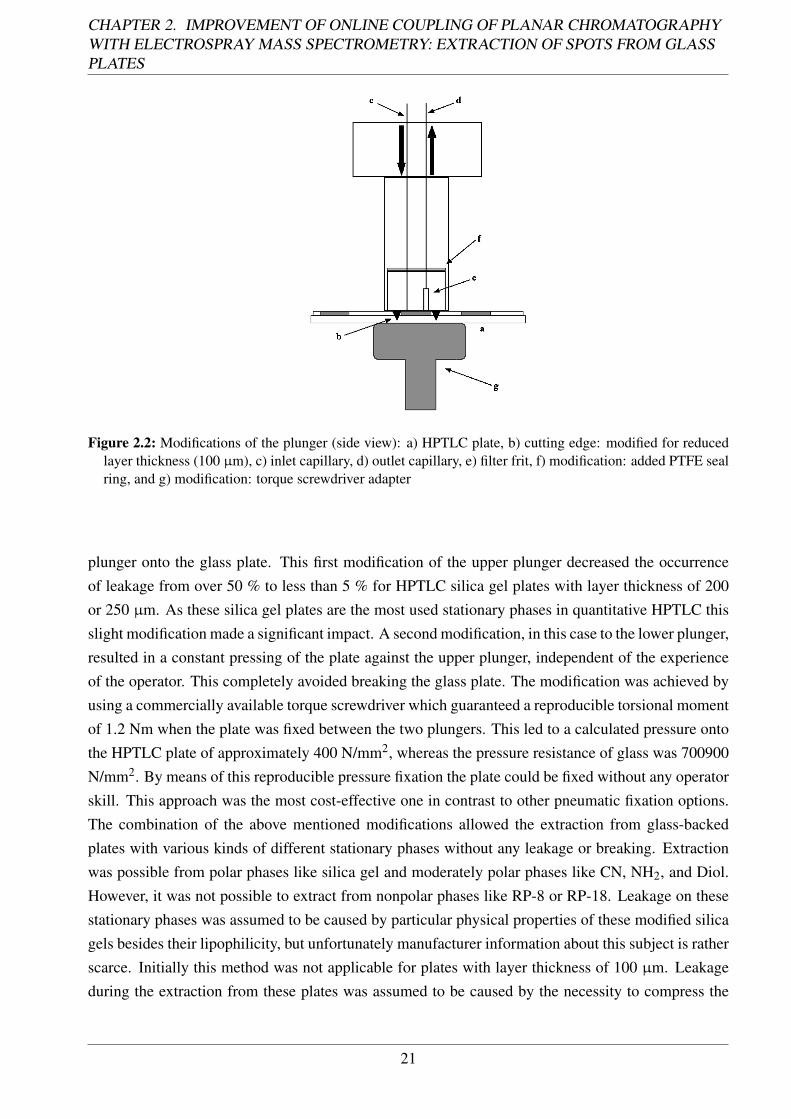
Normally for HPTLC/ESI-MS the zone on the HPTLC foil was placed and focused under the fixedupper plunger and pressed against it by screwing the lower plunger towards it. The cutting edge pen-etrated through the adsorbent layer and laid flat on the foil compressing the adsorbent. The extractionsolvent entered the plunger via the inlet capillary, dissolved the analyte from the adsorbent, and leftthe plunger via the outlet capillary as shown in Fig. 2.2. To prevent the outlet capillary from cloggingit was protected by a 5 µm PTFA frit. The solvent flow was switched by a 6-port valve betweenbypass through a loop and extraction from the plate. After complete extraction of a zone the valvewas switched back to bypass, the lower plunger was loosened, and the plate was positioned for extrac-tion of a new zone. Residual adsorbent compressed within the cutting edge of the plunger was firstblown out with pressurized air. Depending on the plunger head geometry used, the spatial resolutionof the extraction was 2 or 4 mm. During extraction the pressure rose from 5 bar in bypass mode to9 bar while eluting the analyte from the HPTLC plate. Tightness of the plunger was maintained upto pressures over 30 bar at an flow rate of 0.4 mL/min. A tight fit to the stainless steel top of theplunger was guaranteed by the flexible aluminum-backed foils. It was obvious that by its design theextractor was not suited for glass-backed plates: the contact pressure was crucial and could result ineither leakage if the pressure was too low or in breaking the glass if it was too high. In many data setsperformed, glass breakage or solvent leakage were therefore the two given options. Taking into ac-count that for quantitative planar chromatography glass-backed plates are superior to aluminum foilsin many respects, the limitation to foils turned out to be a significant restriction in the applicability ofthis method for hyphenation.
Enabling extraction from glass-backed plates A modification of the stainless steel top of theplunger was not possible because a very hard stainless steel material was conditio sine qua non tomaintain abrasion resistance. Thus for modification a PTFE seal ring was placed between the twoparts of the upper plunger (Fig. 2.2). This guaranteed a slight kind of attenuation when pressing the
20
CHAPTER 2. IMPROVEMENT OF ONLINE COUPLING OF PLANAR CHROMATOGRAPHYWITH ELECTROSPRAY MASS SPECTROMETRY: EXTRACTION OF SPOTS FROM GLASSPLATES
Figure 2.2: Modifications of the plunger (side view): a) HPTLC plate, b) cutting edge: modified for reducedlayer thickness (100 µm), c) inlet capillary, d) outlet capillary, e) filter frit, f) modification: added PTFE sealring, and g) modification: torque screwdriver adapter
plunger onto the glass plate. This first modification of the upper plunger decreased the occurrenceof leakage from over 50 % to less than 5 % for HPTLC silica gel plates with layer thickness of 200or 250 µm. As these silica gel plates are the most used stationary phases in quantitative HPTLC thisslight modification made a significant impact. A second modification, in this case to the lower plunger,resulted in a constant pressing of the plate against the upper plunger, independent of the experienceof the operator. This completely avoided breaking the glass plate. The modification was achieved byusing a commercially available torque screwdriver which guaranteed a reproducible torsional momentof 1.2 Nm when the plate was fixed between the two plungers. This led to a calculated pressure ontothe HPTLC plate of approximately 400 N/mm2, whereas the pressure resistance of glass was 700900N/mm2. By means of this reproducible pressure fixation the plate could be fixed without any operatorskill. This approach was the most cost-effective one in contrast to other pneumatic fixation options.The combination of the above mentioned modifications allowed the extraction from glass-backedplates with various kinds of different stationary phases without any leakage or breaking. Extractionwas possible from polar phases like silica gel and moderately polar phases like CN, NH2, and Diol.However, it was not possible to extract from nonpolar phases like RP-8 or RP-18. Leakage on thesestationary phases was assumed to be caused by particular physical properties of these modified silicagels besides their lipophilicity, but unfortunately manufacturer information about this subject is ratherscarce. Initially this method was not applicable for plates with layer thickness of 100 µm. Leakageduring the extraction from these plates was assumed to be caused by the necessity to compress the
21
CHAPTER 2. IMPROVEMENT OF ONLINE COUPLING OF PLANAR CHROMATOGRAPHYWITH ELECTROSPRAY MASS SPECTROMETRY: EXTRACTION OF SPOTS FROM GLASSPLATES
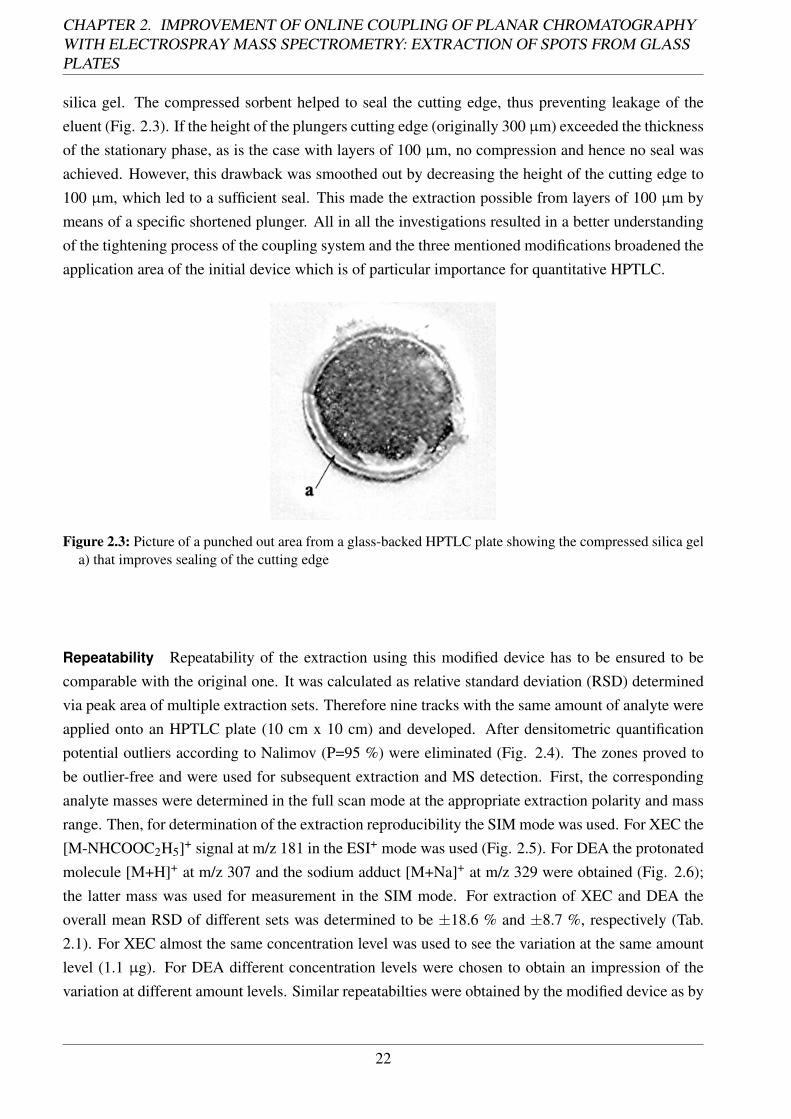
silica gel. The compressed sorbent helped to seal the cutting edge, thus preventing leakage of theeluent (Fig. 2.3). If the height of the plungers cutting edge (originally 300 µm) exceeded the thicknessof the stationary phase, as is the case with layers of 100 µm, no compression and hence no seal wasachieved. However, this drawback was smoothed out by decreasing the height of the cutting edge to100 µm, which led to a sufficient seal. This made the extraction possible from layers of 100 µm bymeans of a specific shortened plunger. All in all the investigations resulted in a better understandingof the tightening process of the coupling system and the three mentioned modifications broadened theapplication area of the initial device which is of particular importance for quantitative HPTLC.
Figure 2.3: Picture of a punched out area from a glass-backed HPTLC plate showing the compressed silica gela) that improves sealing of the cutting edge
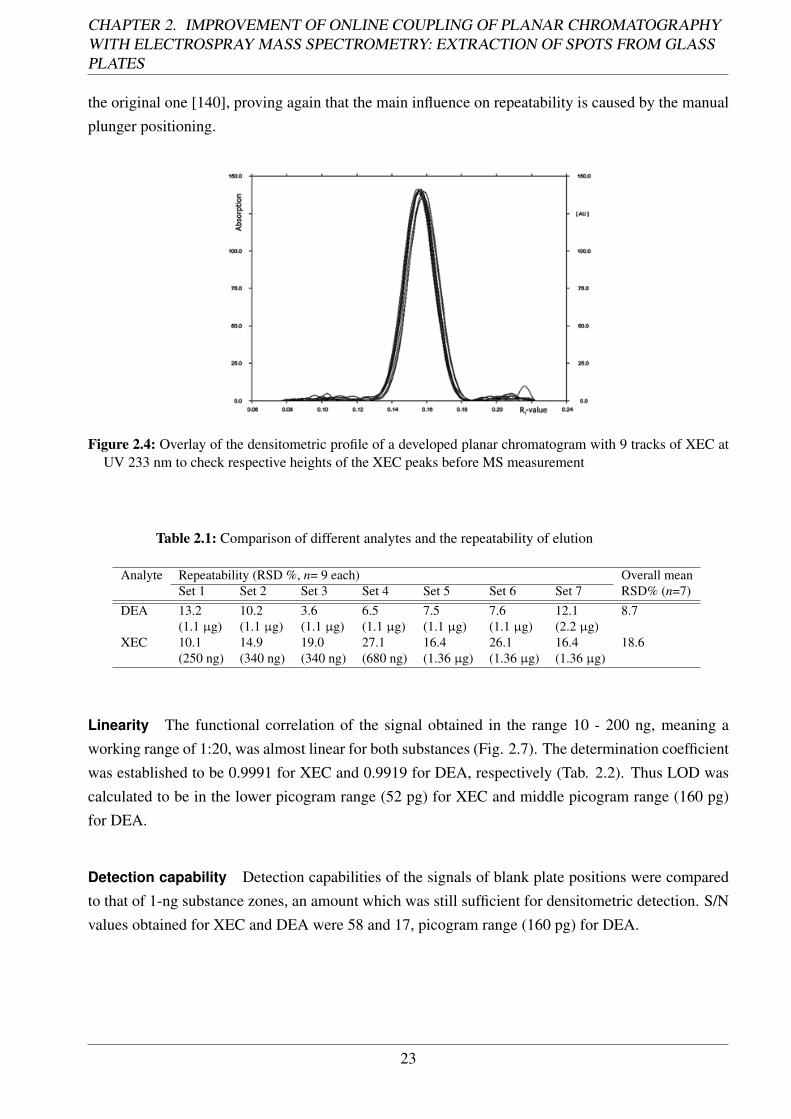
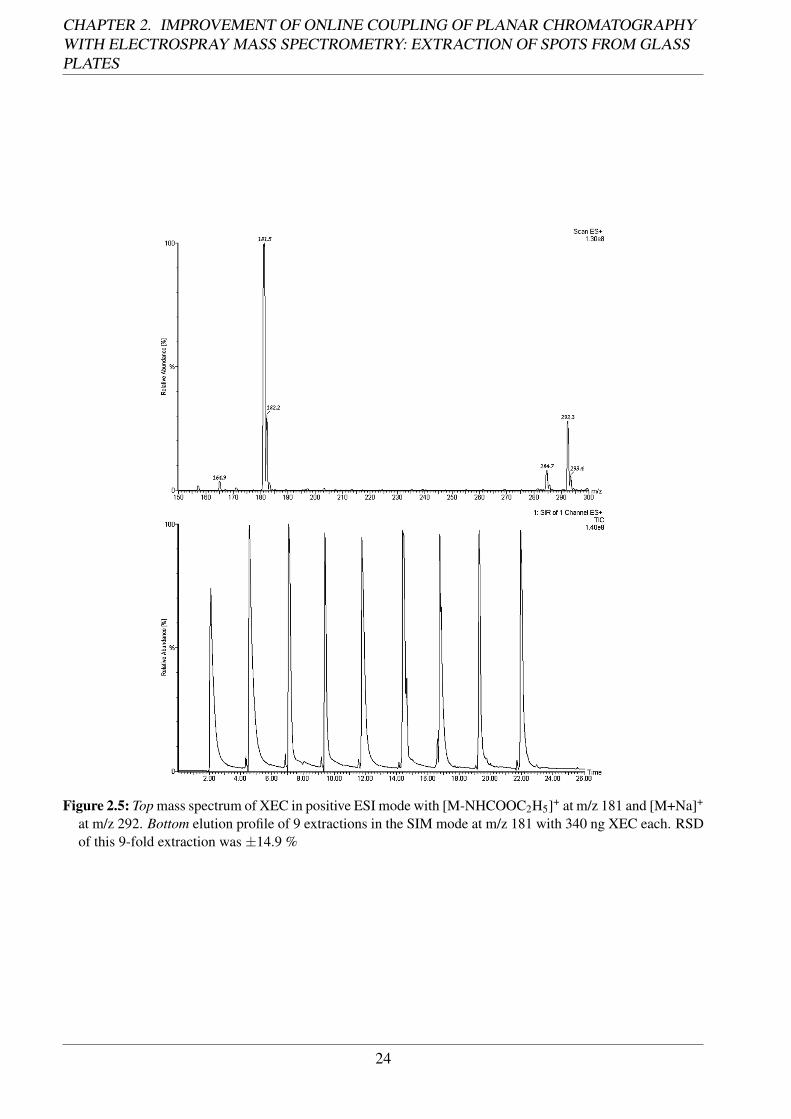
Repeatability Repeatability of the extraction using this modified device has to be ensured to becomparable with the original one. It was calculated as relative standard deviation (RSD) determinedvia peak area of multiple extraction sets. Therefore nine tracks with the same amount of analyte wereapplied onto an HPTLC plate (10 cm x 10 cm) and developed. After densitometric quantificationpotential outliers according to Nalimov (P=95 %) were eliminated (Fig. 2.4). The zones proved tobe outlier-free and were used for subsequent extraction and MS detection. First, the correspondinganalyte masses were determined in the full scan mode at the appropriate extraction polarity and massrange. Then, for determination of the extraction reproducibility the SIM mode was used. For XEC the[M-NHCOOC2H5]+ signal at m/z 181 in the ESI+ mode was used (Fig. 2.5). For DEA the protonatedmolecule [M+H]+ at m/z 307 and the sodium adduct [M+Na]+ at m/z 329 were obtained (Fig. 2.6);the latter mass was used for measurement in the SIM mode. For extraction of XEC and DEA theoverall mean RSD of different sets was determined to be ±18.6 % and ±8.7 %, respectively (Tab.2.1). For XEC almost the same concentration level was used to see the variation at the same amountlevel (1.1 µg). For DEA different concentration levels were chosen to obtain an impression of thevariation at different amount levels. Similar repeatabilties were obtained by the modified device as by
22
CHAPTER 2. IMPROVEMENT OF ONLINE COUPLING OF PLANAR CHROMATOGRAPHYWITH ELECTROSPRAY MASS SPECTROMETRY: EXTRACTION OF SPOTS FROM GLASSPLATES
the original one [140], proving again that the main influence on repeatability is caused by the manualplunger positioning.
Figure 2.4: Overlay of the densitometric profile of a developed planar chromatogram with 9 tracks of XEC atUV 233 nm to check respective heights of the XEC peaks before MS measurement
Table 2.1: Comparison of different analytes and the repeatability of elution
Analyte Repeatability (RSD %, n= 9 each) Overall meanSet 1 Set 2 Set 3 Set 4 Set 5 Set 6 Set 7 RSD% (n=7)
DEA 13.2 10.2 3.6 6.5 7.5 7.6 12.1 8.7(1.1 µg) (1.1 µg) (1.1 µg) (1.1 µg) (1.1 µg) (1.1 µg) (2.2 µg)
XEC 10.1 14.9 19.0 27.1 16.4 26.1 16.4 18.6(250 ng) (340 ng) (340 ng) (680 ng) (1.36 µg) (1.36 µg) (1.36 µg)
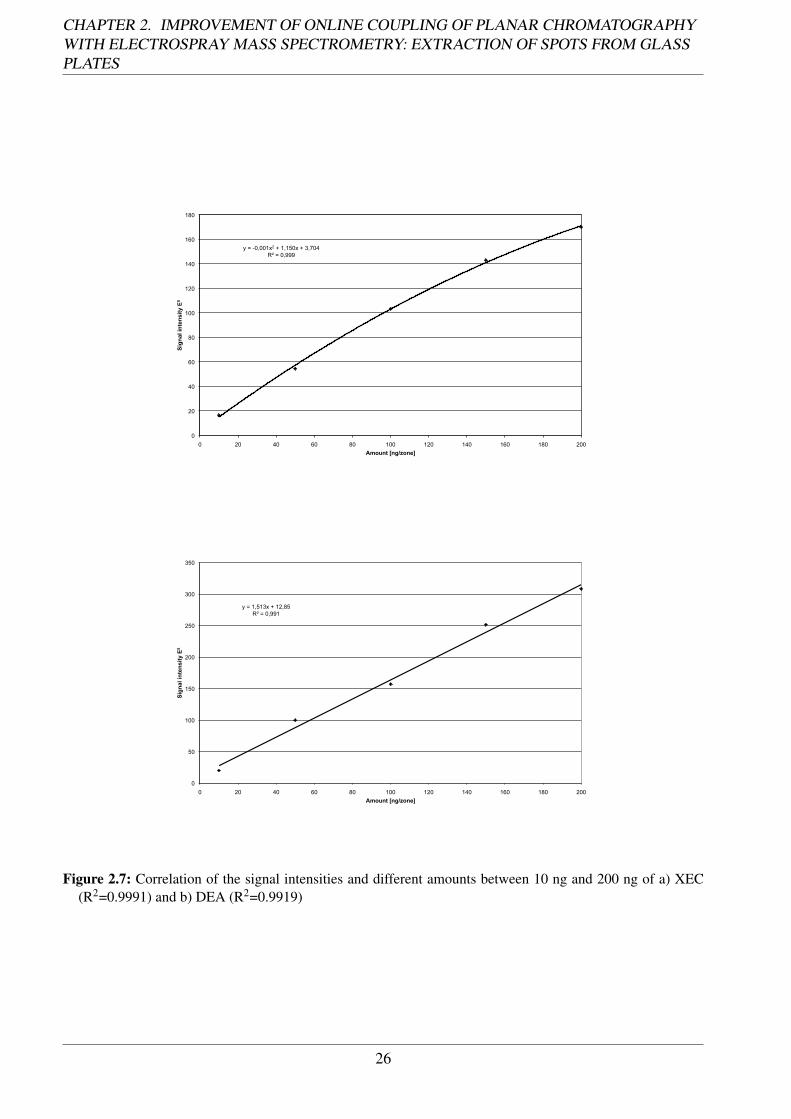
Linearity The functional correlation of the signal obtained in the range 10 - 200 ng, meaning aworking range of 1:20, was almost linear for both substances (Fig. 2.7). The determination coefficientwas established to be 0.9991 for XEC and 0.9919 for DEA, respectively (Tab. 2.2). Thus LOD wascalculated to be in the lower picogram range (52 pg) for XEC and middle picogram range (160 pg)for DEA.
Detection capability Detection capabilities of the signals of blank plate positions were comparedto that of 1-ng substance zones, an amount which was still sufficient for densitometric detection. S/Nvalues obtained for XEC and DEA were 58 and 17, picogram range (160 pg) for DEA.
23
CHAPTER 2. IMPROVEMENT OF ONLINE COUPLING OF PLANAR CHROMATOGRAPHYWITH ELECTROSPRAY MASS SPECTROMETRY: EXTRACTION OF SPOTS FROM GLASSPLATES
Figure 2.5: Top mass spectrum of XEC in positive ESI mode with [M-NHCOOC2H5]+ at m/z 181 and [M+Na]+
at m/z 292. Bottom elution profile of 9 extractions in the SIM mode at m/z 181 with 340 ng XEC each. RSDof this 9-fold extraction was ±14.9 %
24

CHAPTER 2. IMPROVEMENT OF ONLINE COUPLING OF PLANAR CHROMATOGRAPHYWITH ELECTROSPRAY MASS SPECTROMETRY: EXTRACTION OF SPOTS FROM GLASSPLATES
Figure 2.6: Top mass spectrum of DEA in positive ESI mode with [M+H]+ at m/z 307 and [M+Na]+ at m/z329. Bottom elution profile of 9 extractions in the SIM mode at m/z 329 with 1.1 µg DEA each. RSD of this9-fold extraction was ±6.6 %
25
CHAPTER 2. IMPROVEMENT OF ONLINE COUPLING OF PLANAR CHROMATOGRAPHYWITH ELECTROSPRAY MASS SPECTROMETRY: EXTRACTION OF SPOTS FROM GLASSPLATES
y = -0,001x2 + 1,150x + 3,704 R² = 0,999
0
20
40
60
80
100
120
140
160
180
0 20 40 60 80 100 120 140 160 180 200
Sign
al in
tens
ity E
5
Amount [ng/zone]
y = 1,513x + 12,85 R² = 0,991
0
50
100
150
200
250
300
350
0 20 40 60 80 100 120 140 160 180 200
Sign
al in
tens
ity E
5
Amount [ng/zone]
Figure 2.7: Correlation of the signal intensities and different amounts between 10 ng and 200 ng of a) XEC(R2=0.9991) and b) DEA (R2=0.9919)
26
CHAPTER 2. IMPROVEMENT OF ONLINE COUPLING OF PLANAR CHROMATOGRAPHYWITH ELECTROSPRAY MASS SPECTROMETRY: EXTRACTION OF SPOTS FROM GLASSPLATES
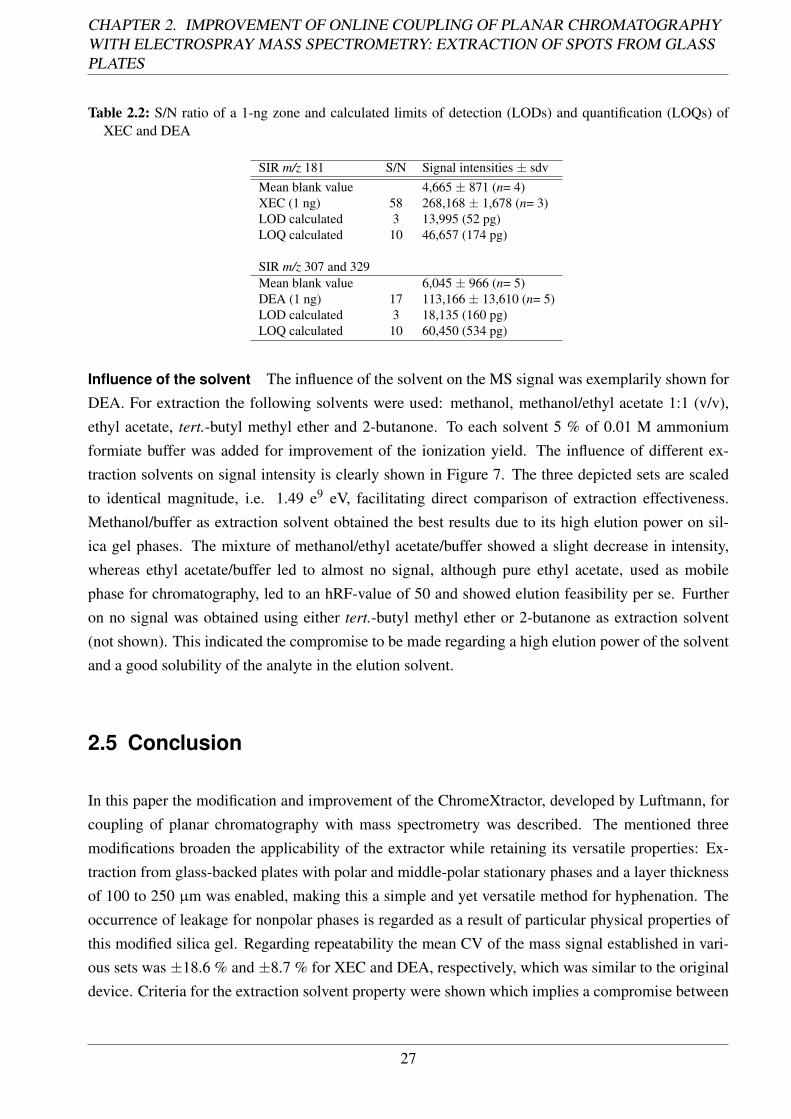
Table 2.2: S/N ratio of a 1-ng zone and calculated limits of detection (LODs) and quantification (LOQs) ofXEC and DEA
SIR m/z 181 S/N Signal intensities ± sdvMean blank value 4,665 ± 871 (n= 4)XEC (1 ng) 58 268,168 ± 1,678 (n= 3)LOD calculated 3 13,995 (52 pg)LOQ calculated 10 46,657 (174 pg)
SIR m/z 307 and 329Mean blank value 6,045 ± 966 (n= 5)DEA (1 ng) 17 113,166 ± 13,610 (n= 5)LOD calculated 3 18,135 (160 pg)LOQ calculated 10 60,450 (534 pg)
Influence of the solvent The influence of the solvent on the MS signal was exemplarily shown forDEA. For extraction the following solvents were used: methanol, methanol/ethyl acetate 1:1 (v/v),ethyl acetate, tert.-butyl methyl ether and 2-butanone. To each solvent 5 % of 0.01 M ammoniumformiate buffer was added for improvement of the ionization yield. The influence of different ex-traction solvents on signal intensity is clearly shown in Figure 7. The three depicted sets are scaledto identical magnitude, i.e. 1.49 e9 eV, facilitating direct comparison of extraction effectiveness.Methanol/buffer as extraction solvent obtained the best results due to its high elution power on sil-ica gel phases. The mixture of methanol/ethyl acetate/buffer showed a slight decrease in intensity,whereas ethyl acetate/buffer led to almost no signal, although pure ethyl acetate, used as mobilephase for chromatography, led to an hRF-value of 50 and showed elution feasibility per se. Furtheron no signal was obtained using either tert.-butyl methyl ether or 2-butanone as extraction solvent(not shown). This indicated the compromise to be made regarding a high elution power of the solventand a good solubility of the analyte in the elution solvent.
2.5 Conclusion
In this paper the modification and improvement of the ChromeXtractor, developed by Luftmann, forcoupling of planar chromatography with mass spectrometry was described. The mentioned threemodifications broaden the applicability of the extractor while retaining its versatile properties: Ex-traction from glass-backed plates with polar and middle-polar stationary phases and a layer thicknessof 100 to 250 µm was enabled, making this a simple and yet versatile method for hyphenation. Theoccurrence of leakage for nonpolar phases is regarded as a result of particular physical properties ofthis modified silica gel. Regarding repeatability the mean CV of the mass signal established in vari-ous sets was ±18.6 % and ±8.7 % for XEC and DEA, respectively, which was similar to the originaldevice. Criteria for the extraction solvent property were shown which implies a compromise between
27

CHAPTER 2. IMPROVEMENT OF ONLINE COUPLING OF PLANAR CHROMATOGRAPHYWITH ELECTROSPRAY MASS SPECTROMETRY: EXTRACTION OF SPOTS FROM GLASSPLATES
Figure2.8:Standardized
elutionprofile
of9extractions
of1.1µ
gD
EA
eachin
thescan
mode
m/z
100-400;intensity
1.49e
9eV.E
xtractionsolvents
usedw
erem
ethanol/buffer(top),methanol/ethylacetate/buffer(m
iddle),andethylacetate/buffer(bottom
)
28

CHAPTER 2. IMPROVEMENT OF ONLINE COUPLING OF PLANAR CHROMATOGRAPHYWITH ELECTROSPRAY MASS SPECTROMETRY: EXTRACTION OF SPOTS FROM GLASSPLATES
respective high elution power and analyte solubility. Proper manual positioning of the plunger ontothe zone seems to be a crucial aspect in consideration of ensuring good repeatability. Thus furtherfocus and progress has to be laid upon automation of this step.
2.6 Acknowledgements
The authors thank Professor Dr. Wolfgang Schwack, University of Hohenheim, for the excellentworking conditions at the Institute of Food Chemistry. Special thanks go to Dr. Heinz-Emil Hauck,Merck, Darmstadt, Germany, for supply of plate material, to Dr. Luftmann, University of Münster,Germany, for providing the Chromextract device and to Dr. Konstantinos Natsias, CAMAG, Berlin,Germany, for support regarding equipment. Great thank goes to Landesstiftung Baden-Württembergfor financial support (project no. P-LSE2/25).
29


Chapter 3
Rapid and sensitive determination of
acrylamide in drinking water by planar
chromatography and fluorescence detection
after derivatization with dansulfinic acid
Reproduced with permission from Journal of Separation Science, 2008, 31, Alpmann, A.; Morlock,G. Rapid and sensitive determination of acrylamide in drinking water by planar chromatography andfluorescence detection., 71-77, ©2008 Wiley-VCH Verlag GmbH |& Co. KGaA.
3.1 Abstract
On the basis of a novel derivatization a new planar chromatographic method has been developedfor the determination of acrylamide in drinking water at the ultra-trace level. After SPE, the waterextracts were oversprayed on a HPTLC silica gel plate with the derivatization agent dansulfinic acidand derivatized in situ. Chromatography was performed with ethyl acetate and the fluorescent productwas quantified at 366/>400 nm. Verification was based on HPTLC-ESI/MS, HPTLC-DART-TOF/MSand NMR. The routine HPTLC-FLD method was validated for spiked drinking water. The regressionanalysis was linear (r > 0.9918) in the range of 0.1 to 0.4 µg/L. LOD was calculated to be 0.025 µg/Land experimentally proved for spiked samples at levels down to 0.05 µg/L (S/N 6) which was suitedfor monitoring the EU limit value of 0.1 µg/L in drinking water (0.5 µg/L demanded by WHO/EPA).Within-run precision and the mean between-run precision (RSD, n = 3, 3 concentration levels each)were evaluated to be 4.8 % and 11.0 %, respectively. The mean recovery (0.1, 0.2 and 0.3 µg/L)was 96 % corrected by the internal standard. The method comparison with HPLC-MS/MS showedcomparable results and demonstrated the accuracy of the method.

CHAPTER 3. RAPID AND SENSITIVE DETERMINATION OF ACRYLAMIDE IN DRINKINGWATER BY PLANAR CHROMATOGRAPHY AND FLUORESCENCE DETECTION AFTERDERIVATIZATION WITH DANSULFINIC ACID
3.2 Introduction
Acrylamide (AA) and polyacrylamide are utilized in a multitude of ways: As a grouting agent fortunnels, water pipes and dams, in the paper, plastic, cosmetic and textile industries and for produc-ing organic chemicals. Polyacrylamide is also used for flocculation in waste water treatment whereproducers certify a maximal monomer content of 250 mg/kg in the polyacrylamide products. Dueto this and its high solubility in water, acrylamide residues could be found in ground and drinkingwater. It has been classified by the International Agency for Research on Cancer (IARC) as probablycarcinogenic to humans (group 2A) [44]. Thus in a guideline set by the World Health Organiza-tion (WHO), the maximum concentration of acrylamide in drinking water is 0.5 µg/L [18]. The USEnvironmental Protection Agency (EPA) set the non-enforceable maximum contaminant level goal(MCLG) to zero and demands the water suppliers who are using polyacrylamid for flocculation tocertify that the combination of dose and monomer level does not exceed 0.05 % dosed at 1 mg/L[19]. This also means that a maximum acrylamide level of 0.5 µg/L is tolerated in drinking water.Even more restrictive limits are held in the European Union and listed in the EU 98/83/EC DrinkingWater Directive which set the allowed maximum concentration at 0.1 µg/L [20]. Since the SwedishNational Food Administration indicated an increase in the content of acrylamide in heat-treated foods[13] a variety of methods have been developed for its determination in foodstuffs. Despite the ne-cessity of sensitive and rapid methods for acrylamide determination in water, due to the low limitsfixed by legislation, only few methods were developed especially for this purpose. Among the HPLC-and GC-based methods developed for water analysis, there are different modes of detection. HPLCchromatography with direct injection and UV detection of the underivatized acrylamide [144] showeda limit of detection (LOD) of 5 µg/L, which is, however, not suited for monitoring of drinking waterat the limit values of 0.1 (EU) and 0.5 µg/L (EPA, WHO). A strong decrease in detection limits downto a LOD of 0.2 µg/L can be achieved by ion-exclusion chromatography-mass spectrometry [145].Thus this method meets the requirements of WHO and EPA, yet it lacks the sensitivity demandedfor the EU Drinking Water Directive. GC-based methods using derivatization of acrylamide withpentafluorophenyl isothiocyanate or bromine and subsequent MS/MS or ECD detection reach verylow limits (LOD 0.03 µg/L), but are laborious and time-consuming [83, 146]. Furthermore it was notpossible to distinguish between acrylamide and N-methylolacrylamide in the case of derivatizationwith pentafluorophenyl isothiocyanate, which may cause incorrect findings of acrylamide. Kawata etal. established a sensitive determination without prior derivatization [147]. Solid phase extraction of0.5 L water through four cartridges in series followed by GC-MS detection allowed for the determi-nation of acrylamide down to concentrations of 0.02 µg/L. Recently Marin et al. compared differentinterfaces for LC-MS/MS determination of acrylamide [148]. By means of an new Ion Sabre APCI-interface and direct large-volume injection of water, sensitive measurements were possible. LOD wasestimated to be 0.03 µg/L, but the important confirmative mass transition m/z 72 - 27 was not de-tectable below 0.2 µg/L. All these methods require expensive equipment and/or are time-consuming
32

CHAPTER 3. RAPID AND SENSITIVE DETERMINATION OF ACRYLAMIDE IN DRINKINGWATER BY PLANAR CHROMATOGRAPHY AND FLUORESCENCE DETECTION AFTERDERIVATIZATION WITH DANSULFINIC ACID
and laborious. The goal of our work was the development of an affordable, selective and simple pla-nar chromatographic method for the monitoring of acrylamide in drinking water. For this, the mostpromising approach was to couple acrylamide with a fluorescence marker, since fluorescence detec-tions (FLD) show an increased sensitivity compared to absorption measurements and an improvedselectivity of detection. Hence, this method was based on the novel derivatization of acrylamide withthe fluorescence marker 5-dimethylaminonaphthalene-1-sulfinic acid (dansulfinic acid).
3.3 Experimental
Chemicals Acrylamide, N-methylolacrylamide and sodium sulfite were purchased from Merck(Darmstadt, Germany). Dansylhydrazine (≥95 %), dansylchloride (≥ 99 %), N,N-dimethylacrylamide(≥98 %) and sodium were purchased from Fluka (Buchs, Switzerland). Dansulfonic acid monohy-drate (≥99 %) was acquired from Acros Organics (Geel, Belgium). Ultra-pure water (18 MΩ/cm2)was obtained from Synergy System (Millipore GmbH, Schwalbach, Germany). All solvents usedfor planar chromatographic separation, elution and extraction were at least chromatography grade ordistilled prior to use. The solid-phase extraction (SPE) columns, Bakerbond Carbon, 1 g, 6 mL, werefrom J.T. Baker (Deventer, Holland). HPTLC glass plates silica gel 60 (Merck), 20 cm x 10 cm, witha layer thickness of 200 µm, were pre-washed with methanol, dried at 100 C for 15 min and storedin a desiccator until use.
Synthesis of 5-dimethylaminonaphthalene-1-sulfinic acid The compound was synthesized ac-cording to Scully et al. [149]. An aqueous solution of sodium sulfite (2.3 g in 10 mL water) wasstirred and heated at 70 C. Dansylchloride (1 g) was added and the temperature was kept at 70-80 C for 5 h. The solution was cooled down and dansulfinic acid was precipitated from the mixtureby acidifying to pH 4 with sulfuric acid. After filtration the precipitate was air dried and convertedto its sodium salt (sodium dansulfinate) by its addition to a sodium methoxide solution (0.62 M inmethanol), followed by solvent evaporation. The sodium dansulfinate obtained was used withoutfurther purification. Verification was performed by HPTLC-FLD and HPTLC-ESI/MS. The productcontained a minor amount of 5-dimethylaminonaphthalene-1-sulfonic acid (DANS) (data not shown),however, without adverse effect on derivatization.
Standard and derivatization solutions 25 mg of acrylamide was weighed into a 25 mL volumetricflask and filled up to 25 mL with methanol. 260 µL of N,N-dimethylacrylamide (DMAA, ρ = 0.962g/mL), which was used as internal standard, was transferred into a 250 mL volumetric flask and filledup to the mark with methanol. Both solutions have been further diluted 1:1000 to concentrations of1 µg/mL each. As for the derivatization solution, 16 mg of sodium dansulfinate was weighed into a
33

CHAPTER 3. RAPID AND SENSITIVE DETERMINATION OF ACRYLAMIDE IN DRINKINGWATER BY PLANAR CHROMATOGRAPHY AND FLUORESCENCE DETECTION AFTERDERIVATIZATION WITH DANSULFINIC ACID
10 mL volumetric flask and filled up to 10 mL with methanol (1.6 µg/µL). Stored at 5C ± 1C, allsolutions were stable for at least 2 months.
Sample preparation Blank tap water samples of 0.5 L each were spiked with 50 to 150 µL ofacrylamide standard solution (concentration levels 0.1 - 0.3 µg/L). The performance of the samplepreparation procedure was controlled by the addition of 250 µL of DMAA solution as internal stan-dard (0.5 µg/L) to each sample. Then the spiked samples were stirred for about 1 min and loadedonto Carbon SPE columns which were first preconditioned with 8 mL methanol and then with 8 mLultrapure water. The flow rate of the sample loading was adjusted to about 10 mL/min. After thesample was passed through, the sorbent was dried for 15 min. The analyte was eluted 5 times with2 mL methanol/acetonitrile solution (1:1, v/v) each. The combined eluate was reduced to 1 mL bymeans of rotary evaporation and a gentle stream of nitrogen. For calibration standards 0.5 L of ultra-pure water were each spiked with 50 to 200 µL acrylamide solution (0.1 - 0.4 µg/L) and 250 µL ofDMAA solution (as internal standard) and treated according to the procedure described above.
Derivatization and HPTLC conditions 100 µL aliquots of the sample and standard solutions wereapplied as areas (6 mm in width, 3 mm in height, 8 mm from the lower edge, 20 mm from the leftedge, 10 mm between tracks) by means of the Automatic TLC Sampler 4 (ATS4) from CAMAG,Muttenz, Switzerland. This was followed by overspraying 20 µL of the dansulfinic acid solution oneach area (32 µg/area) and heating the plate for 1 hour using the TLC plate heater III (CAMAG) set to120 C. After focussing the areas by development with methanol for 5 s, chromatography was carriedout with ethyl acetate up to a migration distance of 70 mm (migration time 15 min) in a twin troughchamber, 20 cm x 10 cm (CAMAG). Then, the plates were dried in a stream of warm air for 2 min. Forfluorescence enhancement the plate was dipped into a solution of 25 % polypropylene glycol (averagemass weight of 2000 Da) in n-hexane (dipping time 1 s, dipping speed 5 cm/s) and dried immediately.Densitometry was performed via fluorescence detection at 366/>400 nm by means of the TLC Scanner3 from CAMAG with a slit dimension of 4 mm x 0.3 mm. Plate images were documented by DigiStore2 Documentation System (CAMAG), consisting of the illuminator Reprostar 3 with the digital cameraBaumer optronic DXA252. The data obtained was processed with winCATS software, version 1.4.2(CAMAG).
HPTLC-ESI/MS conditions For mass spectrometric measurements the dansylpropanamide (DPA)zones have been extracted online from glass plates by using the ChromeXtraktor from ChromAn(Holzhausen, Germany). The extraction solvent, which consisted of 95 % methanol and 5 % ammo-nium formate buffer (10 mM, pH 4), was pumped with a flow of 0.1 mL/min by the HPLC pump ofthe HP 1100 system from Agilent Technologies (Palo Alto, USA). Mass spectrometric measurementwas performed with VG Platform II Quadrupole electrospray mass spectrometer from Micromass
34

CHAPTER 3. RAPID AND SENSITIVE DETERMINATION OF ACRYLAMIDE IN DRINKINGWATER BY PLANAR CHROMATOGRAPHY AND FLUORESCENCE DETECTION AFTERDERIVATIZATION WITH DANSULFINIC ACID
(Massachusetts, USA). The capillary voltage was set to 3.5 kV and the cone voltage to 30 V. Theflow rate of the drying gas was adjusted to 250 L/h and the nebulizing gas to 8 L/h. SIM and fullscan measurements have been carried out in ESI+-mode. Data were processed with Mass Lynx 3.2software. ESI/MS [ion]: 307 [M+H]+, 329 [M+Na]+.
HPTLC-DART-TOF/MS conditions For measurements with DART (IonSense, Danvers, MA, USA),the HPTLC glass plate was cut into a strip of maximal 20 x 3 cm by means of the smartCUT (CA-MAG). The dansylpropanamide zones were placed into the stream of excited gas from the ioniza-tion source which was mounted on an JMS-T100LC (AccuTOF-LC) from Jeol (Europe), Croissy surSeine, France. The helium used had a flow rate of 3 L/min and was heated to 250 C by the gas heater.The voltage of the DART needle was set to 2.5 kV, while the potentials of the second perforated elec-trode and the grid electrode were 100 V and 250 V, respectively. The voltage of the orifice lens wasadjusted to 30 V and the spectra recording interval was 0.5 s. A solution mixture of poly(ethyleneglycol) (PEG) 300 and 600 was used for calibration of the mass scale. For the data acquisition andprocessing MassCenter 1.3 software was used. DART-TOF/MS [ion]: 307 [M+H]+, 613 [2M+H]+.
NMR Dansylpropanamide was dissolved in CDCl3. The 1H and 13C NMR spectra were recordedat 25 C on a Varian Unity Inova 300 NMR spectrometer (Varian, Darmstadt, Germany) at 300 and125 MHz, respectively. The signal assignments were based on chemical shifts and H-H and C-Hcorrelation data. 1H NMR (300 MHz): δ = 8.39 (1H, d, J = 8.7 Hz), 8.31 (1H, d, J = 7.3 Hz), 7.65(1H, m, J = 7.9 Hz), 7.61 (1H, m, J = 8.2 Hz), 7.24 (1H, d, J = 7.5 Hz), 5.74 (1H, s), 5.46 (1H, s), 3.68(2H, t, J = 7.7 Hz), 2.93 (6H, s), 2.76 (2H, t, J = 7.7 Hz) ppm; 13C NMR (125 MHz): δ = 171.35,152.45, 134.07, 132.07, 130.74, 130.15 129.33, 128.02, 123.58, 118.59, 115.77, 52.4, 45.67, 28.58ppm.
3.4 Results and discussion
Derivatization Regarding liquid chromatography, derivatization of acrylamide was only reportedfor 2 mercaptobenzoic acid generating a UV absorbing product [76]. However fluorescent chro-mophores were considered to be superior in selectivity and sensitivity. Hence fluorescent substanceswith a thiol group, such as 7-mercapto-4-methyl-cumarine and 2-mercapto-benzimidazole, were com-pared to 2-mercaptobenzoic acid. Moreover dansylhydrazine, a chromophore with a hydrazine group,was used as marker. Solutions of these substances were added to methanolic solutions of acrylamideand heated in vitro for different periods of time. Additionally on the HPTLC plate, solutions of thederivatization reagents and acrylamide were oversprayed at the starting zone and converted in situ byheating the plate for different periods. Subsequently products of both approaches have been separated
35

CHAPTER 3. RAPID AND SENSITIVE DETERMINATION OF ACRYLAMIDE IN DRINKINGWATER BY PLANAR CHROMATOGRAPHY AND FLUORESCENCE DETECTION AFTERDERIVATIZATION WITH DANSULFINIC ACID
and quantified by HPTLC-FLD. It was evident that the derivatization with dansylhydrazine showedthe best repeatability and the resulting product the most intensive fluorescence signal. The underlyingreaction was assumed to be an addition of the hydrazine-group to the double bond of acrylamide,which is analogous to a Michael-Addition. A further parameter for optimization was, besides temper-ature and heating time, the pH-value since alkaline conditions are best suited for this kind of reactions.As optimal temperature and heating time 100 C and 1 h for in vitro derivatization and 120 C and 1h for in situ derivatization were determined. However increased yield was not observed for in vitroderivatization under basic conditions. LOD of the product was determined to be at 118 pg/zone, thusdetectability of the new product was extraordinary good. However, it was not satisfactory that bothderivatization procedures showed low yields: 2.7 % for in vitro derivatization in methanol and 10.7 %for in situ derivatization at the starting zone. Further optimization was focused on the in situ reactiondue to the higher yield. For the identification of the new product mass spectrometric measurementsby HPTLC-ESI/MS have been carried out. An improved extraction device, that was presented ina previously published paper [150], was used to elute the analyte directly from the HPTLC glassplate. Instead of the expected signal at m/z 337, only peaks at m/z 307 and 329 were detected in theESI+-mode (Fig. 3.1a). The difference of 22 Da indicated that these molecules can be consideredas [M+H]+ and [M+Na]+. Verification of the results by DART-TOF/MS and NMR showed that theloss of the hydrazine group (- 30 Da) caused the difference between the expected mass of 337 Da andthe detected mass of 307 Da (Fig. 3.1b). During heating the hydrazine group was oxidized, nitrogenwas eliminated and finally dansulfinic acid was formed (Fig. 3.2). The latter molecule reacted withthe double bond of acrylamide according to a nucleophilic addition (Fig. 3.3). To prove this the-ory dansulfinic acid was synthesized according to Scully et al. [149] and used for the derivatizationof acrylamide. Intensely fluorescent product zones were obtained. Its educt dansylchoride and thebyproduct DANS did not show any product zones with acrylamide when used as pure substances forderivatization. This proved that instead of dansylhydrazine, its degradation product dansulfinic acid,was reacting with acrylamide under these conditions. This led in a 25 % increased response and thusthis in situ derivatization was applied for future determinations.
Sample preparation Some methods for determination of acrylamide in water with LC-MS/MS donot require any extraction and preconcentration steps due to the employment of sensitive and costlyequipment [148]. Skipping sample preparation is a challenge and the whole instrumentation and ion-ization process have to be matrix tolerable. Because of this, our initial approach was to simplifysample preparation to a maximum extent since the HPTLC plate is highly matrix tolerable. First in-vestigations focussed on direct derivatization of acrylamide in water and eased extraction of the moreunpolar product. Here, 0.5 mL dansylhydrazine (16.6 mg/mL in methanol) was added into 50 mLof tap water in excess up to a molar ratio of 1:2200. However, the product was only detectable at aconcentration of 20 µg/L. Additionally the intensified background fluorescence impaired evaluation
36

CHAPTER 3. RAPID AND SENSITIVE DETERMINATION OF ACRYLAMIDE IN DRINKINGWATER BY PLANAR CHROMATOGRAPHY AND FLUORESCENCE DETECTION AFTERDERIVATIZATION WITH DANSULFINIC ACID
Figu
re3.
1:a)
HPT
LC
-ESI
/MS
spec
trum
ofda
nsyl
ethy
lam
ide
with
m/z
of30
7[M
+H]+
and
329
[M+N
a]+.b
)DA
RT-
TOF/
MS
spec
trum
ofda
nsyl
ethy
lam
ide
with
m/z
of30
7[M
+H]+
and
613
[2M
+H]+
37
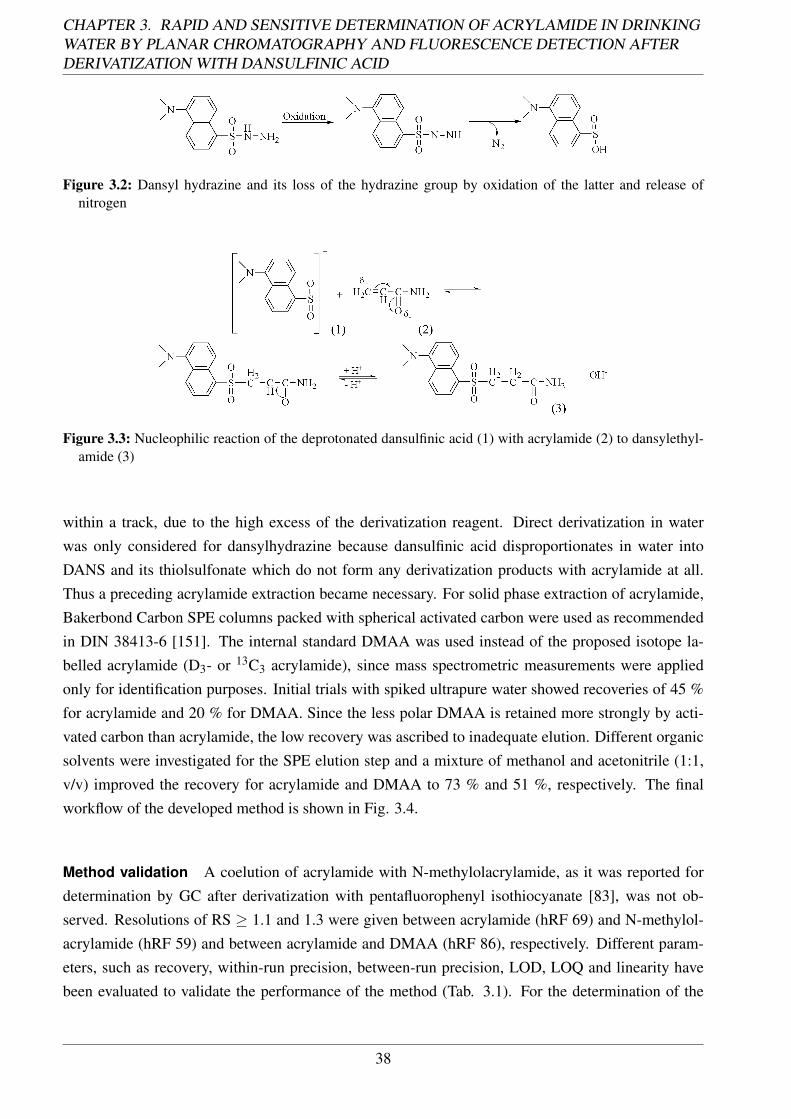
CHAPTER 3. RAPID AND SENSITIVE DETERMINATION OF ACRYLAMIDE IN DRINKINGWATER BY PLANAR CHROMATOGRAPHY AND FLUORESCENCE DETECTION AFTERDERIVATIZATION WITH DANSULFINIC ACID
Figure 3.2: Dansyl hydrazine and its loss of the hydrazine group by oxidation of the latter and release ofnitrogen
Figure 3.3: Nucleophilic reaction of the deprotonated dansulfinic acid (1) with acrylamide (2) to dansylethyl-amide (3)
within a track, due to the high excess of the derivatization reagent. Direct derivatization in waterwas only considered for dansylhydrazine because dansulfinic acid disproportionates in water intoDANS and its thiolsulfonate which do not form any derivatization products with acrylamide at all.Thus a preceding acrylamide extraction became necessary. For solid phase extraction of acrylamide,Bakerbond Carbon SPE columns packed with spherical activated carbon were used as recommendedin DIN 38413-6 [151]. The internal standard DMAA was used instead of the proposed isotope la-belled acrylamide (D3- or 13C3 acrylamide), since mass spectrometric measurements were appliedonly for identification purposes. Initial trials with spiked ultrapure water showed recoveries of 45 %for acrylamide and 20 % for DMAA. Since the less polar DMAA is retained more strongly by acti-vated carbon than acrylamide, the low recovery was ascribed to inadequate elution. Different organicsolvents were investigated for the SPE elution step and a mixture of methanol and acetonitrile (1:1,v/v) improved the recovery for acrylamide and DMAA to 73 % and 51 %, respectively. The finalworkflow of the developed method is shown in Fig. 3.4.
Method validation A coelution of acrylamide with N-methylolacrylamide, as it was reported fordetermination by GC after derivatization with pentafluorophenyl isothiocyanate [83], was not ob-served. Resolutions of RS ≥ 1.1 and 1.3 were given between acrylamide (hRF 69) and N-methylol-acrylamide (hRF 59) and between acrylamide and DMAA (hRF 86), respectively. Different param-eters, such as recovery, within-run precision, between-run precision, LOD, LOQ and linearity havebeen evaluated to validate the performance of the method (Tab. 3.1). For the determination of the
38

CHAPTER 3. RAPID AND SENSITIVE DETERMINATION OF ACRYLAMIDE IN DRINKINGWATER BY PLANAR CHROMATOGRAPHY AND FLUORESCENCE DETECTION AFTERDERIVATIZATION WITH DANSULFINIC ACID
Figure 3.4: Schematic workflow of the method
recovery, 3 sets of drinking water samples, each spiked with acrylamide at 3 different concentrations(0.1, 0.2 and 0.3 µg/L) and the internal standard, were analyzed according to the procedure developed(Fig. 3.5). The overall recovery was 96 % (corrected by the internal standard) and precise (RSD±15 %) regarding the ultra-trace level given.
The within-run precision of the derivatization step (RSD ±2.8 %) was evaluated by fourfold applica-tion of the same sample spiked at 0.3 µg/L onto the same HPTLC plate followed by in situ derivati-zation and quantification. For the within-run precision of the overall method (system repeatability), 3freshly prepared samples spiked at 0.2 µg/L were analyzed in parallel. The resulting system repeata-bility showed a RSD of ±4.6 %. For the determination of the between-run precision (intermediateprecision over the whole system), 3 sets of drinking water samples, each set spiked with acrylamideat 3 different concentrations (0.1, 0.2 and 0.3 µg/L) and with the internal standard, were prepared ondifferent days and all quantified within a week. The mean overall intermediate precision was eval-uated to be RSD ±11.0 %. At increased concentration levels an improved precision was observed.The LOD (S/N 3) and LOQ (S/N 10) were calculated been 0.025 and 0.083 µg/L, respectively. Thecalculated values were experimentally proved by investigation of spiked samples at levels down to0.05 µg/L, still showing a S/N of 6 (Fig. 3.6), which was considered to be well-suited for the moni-toring of acrylamide at the limit value of 0.1 µg/L in drinking water as stipulated by EU and 0.5 µg/Las demanded by WHO and EPA. For acrylamide determination in the sub-ppb level, the workingrange was chosen between 0.1 and 0.4 µg/L. The analytical response was linear and the regressionanalysis showed correlation coefficients (3-fold determination) better than r≥0.9918 (Fig. 3.7).
39

CHAPTER 3. RAPID AND SENSITIVE DETERMINATION OF ACRYLAMIDE IN DRINKINGWATER BY PLANAR CHROMATOGRAPHY AND FLUORESCENCE DETECTION AFTERDERIVATIZATION WITH DANSULFINIC ACID
Figure 3.5: a) Image of a developed HPTLC plate with calibration standards ranged from 0.1 to 0.4 µg/L(tracks 1, 3, 5, 7), water samples in the range of 0.1 to 0.3 µg/L (tracks 2, 4, 6) and a blank water sample(track 8). Fluorescent zones of dansylpropylamide (DPA) and dansyl-N,N-dimethylethylamide (I.S.) arevisible within the marked horizontal lines (b) Densitometric scan (366/>400 nm) of the tracks of the sameplate in the range marked
Figure 3.6: Densitometric scan (366/>400 nm) around the analytes migration distance of a blank (track 1) andsamples at concentrations down to 0.05 µg/L still showing a S/N of 6 (track 2, 0.15 µg/L for track 3)
40
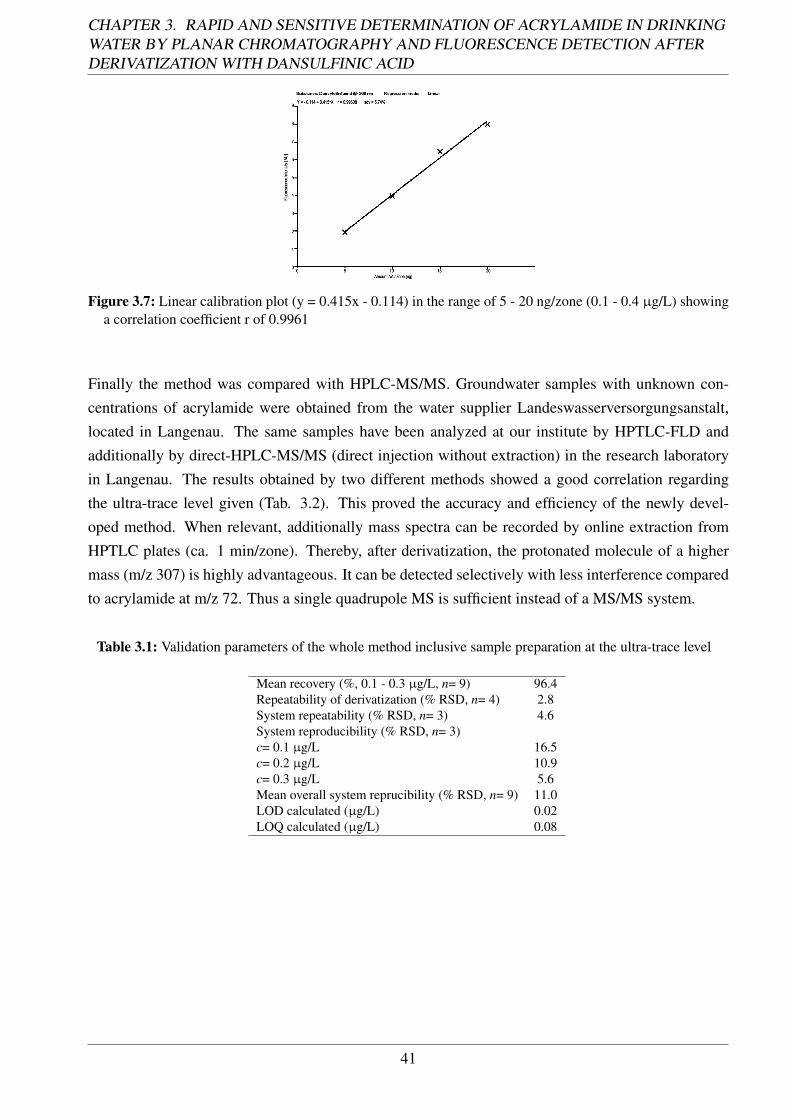
CHAPTER 3. RAPID AND SENSITIVE DETERMINATION OF ACRYLAMIDE IN DRINKINGWATER BY PLANAR CHROMATOGRAPHY AND FLUORESCENCE DETECTION AFTERDERIVATIZATION WITH DANSULFINIC ACID
Figure 3.7: Linear calibration plot (y = 0.415x - 0.114) in the range of 5 - 20 ng/zone (0.1 - 0.4 µg/L) showinga correlation coefficient r of 0.9961
Finally the method was compared with HPLC-MS/MS. Groundwater samples with unknown con-centrations of acrylamide were obtained from the water supplier Landeswasserversorgungsanstalt,located in Langenau. The same samples have been analyzed at our institute by HPTLC-FLD andadditionally by direct-HPLC-MS/MS (direct injection without extraction) in the research laboratoryin Langenau. The results obtained by two different methods showed a good correlation regardingthe ultra-trace level given (Tab. 3.2). This proved the accuracy and efficiency of the newly devel-oped method. When relevant, additionally mass spectra can be recorded by online extraction fromHPTLC plates (ca. 1 min/zone). Thereby, after derivatization, the protonated molecule of a highermass (m/z 307) is highly advantageous. It can be detected selectively with less interference comparedto acrylamide at m/z 72. Thus a single quadrupole MS is sufficient instead of a MS/MS system.
Table 3.1: Validation parameters of the whole method inclusive sample preparation at the ultra-trace level
Mean recovery (%, 0.1 - 0.3 µg/L, n= 9) 96.4Repeatability of derivatization (% RSD, n= 4) 2.8System repeatability (% RSD, n= 3) 4.6System reproducibility (% RSD, n= 3)c= 0.1 µg/L 16.5c= 0.2 µg/L 10.9c= 0.3 µg/L 5.6Mean overall system reprucibility (% RSD, n= 9) 11.0LOD calculated (µg/L) 0.02LOQ calculated (µg/L) 0.08
41
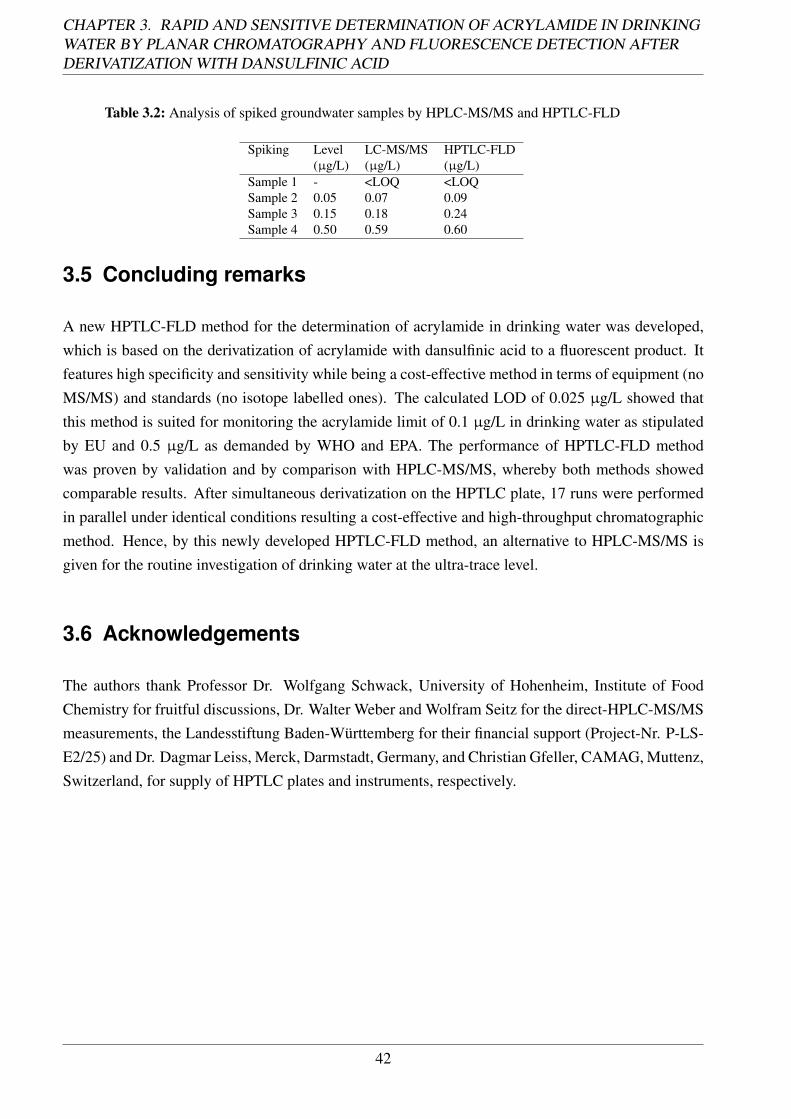
CHAPTER 3. RAPID AND SENSITIVE DETERMINATION OF ACRYLAMIDE IN DRINKINGWATER BY PLANAR CHROMATOGRAPHY AND FLUORESCENCE DETECTION AFTERDERIVATIZATION WITH DANSULFINIC ACID
Table 3.2: Analysis of spiked groundwater samples by HPLC-MS/MS and HPTLC-FLD
Spiking Level LC-MS/MS HPTLC-FLD(µg/L) (µg/L) (µg/L)
Sample 1 - <LOQ <LOQSample 2 0.05 0.07 0.09Sample 3 0.15 0.18 0.24Sample 4 0.50 0.59 0.60
3.5 Concluding remarks
A new HPTLC-FLD method for the determination of acrylamide in drinking water was developed,which is based on the derivatization of acrylamide with dansulfinic acid to a fluorescent product. Itfeatures high specificity and sensitivity while being a cost-effective method in terms of equipment (noMS/MS) and standards (no isotope labelled ones). The calculated LOD of 0.025 µg/L showed thatthis method is suited for monitoring the acrylamide limit of 0.1 µg/L in drinking water as stipulatedby EU and 0.5 µg/L as demanded by WHO and EPA. The performance of HPTLC-FLD methodwas proven by validation and by comparison with HPLC-MS/MS, whereby both methods showedcomparable results. After simultaneous derivatization on the HPTLC plate, 17 runs were performedin parallel under identical conditions resulting a cost-effective and high-throughput chromatographicmethod. Hence, by this newly developed HPTLC-FLD method, an alternative to HPLC-MS/MS isgiven for the routine investigation of drinking water at the ultra-trace level.
3.6 Acknowledgements
The authors thank Professor Dr. Wolfgang Schwack, University of Hohenheim, Institute of FoodChemistry for fruitful discussions, Dr. Walter Weber and Wolfram Seitz for the direct-HPLC-MS/MSmeasurements, the Landesstiftung Baden-Württemberg for their financial support (Project-Nr. P-LS-E2/25) and Dr. Dagmar Leiss, Merck, Darmstadt, Germany, and Christian Gfeller, CAMAG, Muttenz,Switzerland, for supply of HPTLC plates and instruments, respectively.
42

Chapter 4
Rapid and cost effective determination of
acrylamide in coffee by planar
chromatography and fluorescence detection
after derivatization with dansulfinic acid
Reproduced with permission from Journal of AOAC International, 2009, 92, Alpmann, A.; Morlock,G. Rapid and cost effective determination of acrylamide in coffee by planar chromatography and fluo-rescence detection after derivatization with dansulfinic acid., 725-729, ©2009 AOAC International.
4.1 Abstract
A new method has been developed for the determination of acrylamide in ground coffee by planarchromatography using pre-chromatographic in situ derivatization with dansulfinic acid. After pres-surized fluid extraction of acrylamide from the coffee samples, the extracts were passed throughactivated carbon and concentrated. These extracts were applied onto a HPTLC plate silica gel 60 andoversprayed with dansulfinic acid. By heating of the plate acrylamide was derivatized into the fluores-cent product dansylpropanamide. The chromatographic separation with ethyl acetate and tert.-butylmethyl ether was followed by densitometric quantification at 254/>400 nm using a 4 point-calibrationvia the standard addition method over the whole system for which acrylamide was added at differentconcentrations at the beginning of the extraction process. The method was validated for commer-cial coffee. The linearity over the whole procedure showed determination coefficients (R2) between0.9995 and 0.9825 (n = 6). LOQ at a signal-to-noise ratio of 10 was determined to be 48 µg/kg.The within-run precisions (RSD, n = 6) of the chromatographic method were established to be 3 %.
CHAPTER 4. RAPID AND COST EFFECTIVE DETERMINATION OF ACRYLAMIDE INCOFFEE BY PLANAR CHROMATOGRAPHY AND FLUORESCENCE DETECTION AFTERDERIVATIZATION WITH DANSULFINIC ACID
Commercial coffee samples analyzed showed acrylamide contents between 52 and 191 µg/kg whichwas in correlation with other literature findings.
4.2 Introduction
Acrylamide is a widely employed chemical. It is used in the chemical industry e. g. for the produc-tion of textiles and cosmetics and as grouting agent for dams and tunnels. acrylamide is classifiedby the International Agency for Research on Cancer (IARC) as probably carcinogenic to humans(group 2A) und is neurotoxic in higher doses [36, 44]. Furthermore its mutagenic, genotoxic andcarcinogenic effect to animals has been shown. In the year 2000 the possibility of its formation infood has been postulated [63]. This theory was verified by high analytical findings of acrylamidein several heat-treated foods two years later [64]. Subsequent worldwide research found out, that thesubstance is produced basically by a reaction between asparagine and reducing sugars at temperaturesabove 120 C, known as the Maillard reaction [2]. In model experiments additional ways of forma-tion with acrolein, acrylic acid and other carbohydrates were identified [24]. The methods for acry-lamide determination were mainly based on high performance liquid chromatography coupled withtandem-mass spectrometry (HPLC-MS/MS) or gas chromatography coupled with mass spectrometry(GC-MS) [60-62]. For sample preparation HPLC-MS/MS methods mainly used liquid extraction bywater, followed by a clean-up step with solid phase extraction (SPE) for which polymer-materialswere employed having ion-exchange as well as reversed phase properties. In addition the extracts offat-rich samples, like potato crisps and chips, were defatted. Final quantification by HPLC-MS/MSwas performed by selected reaction monitoring. In addition to the protonated molecule of acrylamideat m/z 72 the characteristic mass transitions (m/z 72 - 55 and 72 - 27) were important because ofits small molecule mass of 71 Da. Interferences by various matrices made necessary the applicationof isotopically labeled standards for identification and quantification [152-154]. For GC-MS, aque-ous extraction of acrylamide was followed by bromination after addition of potassium bromide orbromine-saturated water to the extract. This reaction took between one and several hours dependingon the internal standard applied. Often this was done overnight in a refrigerator. A subsequent liquid-liquid extraction transferred the resulting product (2,3-dibromopropanamide) into an organic solvent,which was directly injected [9, 79]. 2,3-Dibromopropanamide was more volatile and was detectedmore selectively because of its higher molecular mass. Disadvantages were the long reaction timeof the bromination step and the use of dangerous chemicals. Furthermore an uncontrollable dehy-drobromination of the product in the GC injector (liner) can lead to decreased findings. For GC-MSmethods without prior derivatization, the sample was extracted with an organic solvent, which wasdirectly injected [9]. For this approach one has to pay attention to the completeness of extraction,since certain food matrices like crisp bread may require a prior swelling [60]. In addition the for-mation of acrylamide in the GC injector, caused by co-extracted precursors, may lead to increased
44

CHAPTER 4. RAPID AND COST EFFECTIVE DETERMINATION OF ACRYLAMIDE INCOFFEE BY PLANAR CHROMATOGRAPHY AND FLUORESCENCE DETECTION AFTERDERIVATIZATION WITH DANSULFINIC ACID
findings [61]. Even though the chromatographic resolution of HPLC and GC methods is excellentand the selectivity of mass spectrometric detection, especially MS/MS, is very high, some interfer-ences may occur. Firstly peaks have been reported with identical retention times to acrylamide andisotopic marked standards. Secondly similar mass transitions to acrylamide and standards may occurin complex matrices [60]. All these methods require expensive equipment and are able to analyzejust one sample at a time. In contrast, high-performance thin-layer chromatography (TLC) is a rea-sonable choice for routine analysis because of its cost-effectiveness and its ability to analyze severalsamples in parallel in one run. It is highly tolerant towards matrix and selective derivatizations areeasily achievable. It must be noted that the latter advantage post-chromatically compensates the lowseparation power because the derivatization is able to selectively detect the analyte(s) despite poten-tial co-eluting matrix. In a recent paper [156] a method has been described to transform acrylamideinto a fluorescent product by derivatization with dansulfinic acid directly on the HPTLC plate. Afterchromatographic separation dansylpropanamide (DPA), the derivatization product, was quantified byfluorescence detection. By means of this method it was possible to examine drinking water for thepresence of acrylamide down to 0.1 µg/L, which is the maximum concentration allowed according tothe EU Drinking Water Directive 98/83/EC. The results showed good correlations to measurementsby LC-MS/MS. The aim of this study was the transfer of this simple and cost effective method to amore complex food matrix like coffee in order to present an alternative to established methods.
4.3 Experimental
Apparatus (a) Extraction system. - Accelerated Solvent Extraction (ASE) 200 was purchased fromDionex (Sunnyvale, CA, USA). (b) Clean up. - Empty 6 mL-SPE cartridges and polyethylene fritswere obtained from Supelco (Bellefonte, PA, USA). (c) HPTLC system. - The sample extracts wereapplied onto HPTLC plates silica gel 60 (Art. no. 105641, Merck, Darmstadt, Germany) by meansof the Automatic TLC Sampler 4 (ATS4, CAMAG, Muttenz, Switzerland). The plates were heatedusing the TLC Plate Heater III (CAMAG), followed by chromatography in the twin-trough chamber,20 cm x 10 cm, or Automatic Developing Chamber 2 (ADC 2, both CAMAG). Densitometry wasperformed by means of the TLC Scanner 3 (CAMAG). Plate images were documented by the doc-umentation system DigiStore 2 (CAMAG), consisting of the illuminator Reprostar 3 with the digitalcamera Baumer optronic DXA252. All instrumentation was controlled and all data were processedby winCATS software, version 1.4.2.
Reagents (a) Acrylamide, Florisil (150 - 250 µm magnesia silicate), activated carbon (p.a., particlesize ca. 1.5 mm), sulfuric acid (p.a., 95 - 97 %) and sodium sulfite (≥ 96 %) were purchasedfrom Merck. (b) Isolute HM-N was from International Sorbent Technology (Hengoed, UK). (c)
45

CHAPTER 4. RAPID AND COST EFFECTIVE DETERMINATION OF ACRYLAMIDE INCOFFEE BY PLANAR CHROMATOGRAPHY AND FLUORESCENCE DETECTION AFTERDERIVATIZATION WITH DANSULFINIC ACID
Dansylchloride (≥ 99 %) was obtained from Fluka (Buchs, Switzerland). (d) All solvents used forextraction and planar chromatographic separation were at least chromatography grade or distilledprior to use. (e) Bientionized water (18 MΩ/cm2) was obtained by a Synergy System (Millipore,Schwalbach, Germany). (f) Polypropylene glycol (average mass weight of 2000) was purchased fromMallinckrodt Baker (Deventer, Netherlands).
Synthesis of sodium dansulfinate The compound was synthesized according to Scully et al.[149]. Briefly, to 10 mL of water, which was warmed to 70 C, 2.3 g of sodium sulfite was added.Dansylchloride (1 g) was added to the stirred solution and for 5 h the temperature was kept at 70 -80 C. The solution was cooled down to room temperature. Acidifying to pH 4 with sulfuric acid pre-cipitated dansulfinic acid. The solution was filtered and the precipitate was air-dried. By its addition toa solution of sodium methoxide the product was converted to its sodium salt. After evaporation of themethanol, sodium dansulfinate (sodium 5-dimethylaminonaphthalene-1-sulfinate) was obtained.
Standard solutions A methanolic acrylamide standard solution was prepared (1 ng/ µL). Forpreparation of the dansulfinic acid solution used as derivatization reagent 16 mg of sodium dan-sulfinate were dissolved in 10 mL methanol (1.6 µg/ µL). These solutions stored at 5 C were stablefor at least 4 months.
Samples and their preparation Ground coffee of different brands was purchased from supermar-kets in Stuttgart and stored at room temperature. Firstly 2 g of ground coffee each were mixed with1 g of Isolute HM-N. These mixtures were transferred into ASE sample cells (22 mL volume) whichwere previously filled with 3 g Florisil. For every sample 3 standard additions were prepared in thesame manner and spiked with 250, 500 and 750 µL acrylamide standard solution to obtain spike con-centrations between 125 and 375 µg/kg. Then the sample cells were filled up with Isolute, closed tofinger tightness and placed in the carousel of the ASE. The samples were extracted with acetonitrileusing the following conditions: temperature of 40 C with 2 min heat-up period under a pressure of10 MPa and three static cycles with a static period of 4 min. The flush volume was 80 % of theextraction cell volume. The sample cells were purged using pressurized nitrogen (125 - 150 psi) for200 s. Secondly for clean-up, the extracts were passed by gravity through SPE columns filled with 1g activated carbon. The cleaned extracts flew directly into a 50 mL pear-shaped flask each and werereduced to about 1 mL on a rotary evaporator. The final solutions were transferred into sample vials,adjusted to a volume of 1 mL under a stream of nitrogen and applied to planar chromatography.
46
CHAPTER 4. RAPID AND COST EFFECTIVE DETERMINATION OF ACRYLAMIDE INCOFFEE BY PLANAR CHROMATOGRAPHY AND FLUORESCENCE DETECTION AFTERDERIVATIZATION WITH DANSULFINIC ACID
Derivatization and HPTLC conditions 40 µL aliquots of the sample and spiked sample solutionswere applied as areas (6 mm x 3 mm, width x height) and oversprayed with 40 µL of the dansulfinicacid solution on each area (64 µg/area). Additionally, once per plate, 40 µL acrylamide standardsolution (1 ng/ µL) were applied and analogously oversprayed (reference track). The dosage speedwas 500 nL/s and the spray nozzle was heated at 50 C. For application of 17 tracks the followingpattern was chosen: 8 mm from the lower edge, 20 mm from the left edge, 10 mm between tracks.The plate was heated at 120 C for 1 hour. After focusing of the areas by development with methanolfor 5 s and intermediate drying for 30 s in a stream of warm air, chromatography was carried out witha mixture of ethyl acetate and tert.-butyl methyl ether (8 + 2, v/v) up to a migration distance of 70mm (migration time 15 min). Then, the plates were dried in a stream of warm air for 2 min. Forfluorescence enhancement the plate was dipped into a solution of 25 % polypropylene glycol in n-hexane (dipping time 1 s, dipping speed 5 cm/s) and dried immediately. Densitometry was performedvia fluorescence measurement at 254/>400 nm with a slit dimension of 4 mm x 0.3 mm. HPTLC wasperformed in a darkened room at a relative humidity of the ambient air between 18 and 35 % andtemperatures between 18 and 25 C.
4.4 Results and Discussion
Method development Pre-chromatographic in situ derivatization of acrylamide into a yellowishgreen dansyl fluorophor (Fig. 4.1) was automatically performed by overspraying the coffee extractsapplied and subsequent heating of the plate. It allowed selective and cost-effective detection of acry-lamide in the complex coffee matrix without extensive sample preparation. HPTLC was robust re-garding the high matrix-load and the excess of the derivatization reagent using area application. acry-lamide extraction from ground coffee was automatically performed by ASE, followed by a simpleclean-up (just passing) through active carbon and subsequent concentration of the extract (Fig. 4.2).In contrast to other methods for determination of acrylamide in coffee [78, 155] any clean-up withCarrez solutions and any SPE with conditioning, washing and elution steps were not required.
The mobile phase was adjusted to the coffee matrix and finally a mixture of ethyl acetate and tert.-butyl methyl ether was chosen. On one HPTLC plate 4 samples were analyzed in parallel. Four trackswere required for each sample (original sample and sample spiked at three different concentrations).A typical chromatogram of the analysis of a coffee sample is shown in Fig. 4.3. Identification ofacrylamide was confirmed by the application and derivatization of the acrylamide standard solutionon each plate (reference track) and additionally by the standard addition method. The hRF-valuesof DPA were between 35 and 45, without use of the plate activity control offered by the ADC 2.Interfering peaks were absent.
47

CHAPTER 4. RAPID AND COST EFFECTIVE DETERMINATION OF ACRYLAMIDE INCOFFEE BY PLANAR CHROMATOGRAPHY AND FLUORESCENCE DETECTION AFTERDERIVATIZATION WITH DANSULFINIC ACID
Figure 4.1: Prechromatographic in situ derivatization of acrylamide (1) with dansulfinic acid (2) into the fluo-rescent product dansylpropanamide (3)
Method validation Quantification was performed by means of the standard addition method usingthree different concentration levels. The acrylamide content of the unspiked sample was calculatedfrom the resulting calibration curve for which the peak heights were plotted against the amount ofacrylamide spiked (Fig. 4.4). Linearity via the standard addition method was acceptable showingdetermination coefficients (R2) between 0.9995 and 0.9825 (n = 6). The calibration in matrix bythe standard addition method performed across the whole system was conditio sine qua non becauseit corrected potential systematic errors of sample preparation and derivatization via its calibrationcurve.
Other quantification techniques were not suitable for this task. For example the standard addition atthe sample application step (in situ applied on sample areas to perform the calibration in matrix) orthe external calibration with the acrylamide standard solution (without any matrix) showed differentslopes of the calibration function (Fig. 4.5). The slope difference indicated a proportional systematicerror. Moreover in comparison with the standard addition method performed across the whole system(Fig. 4.5) the fluorescence was more intensive. Thus polynomial calibrations were best over the en-larged signal range. All in all for coffee, the most reliable and accurate quantification was obtained viacalibration in matrix using the standard addition method performed across the whole system inclusivesample preparation. It had the great advantage to compensate any loss during sample preparation andderivatization as well as any potential interference by matrix. Hence the correction of the findings bya recovery rate was dispensable. Fluorescence enhancement was obtained by dipping the plate into apolypropylene glycol - n-hexane solution. The limit of quantification (LOQ) was determined via thesignal-to-noise ratio of 10 and showed a LOQ of 48 µg/kg. The within-run precision (RSD, n = 6) ofthe chromatographic method was determined to be 3 % by quantification of the same coffee sampleapplied sixfold on the same HPTLC plate.
48

CHAPTER 4. RAPID AND COST EFFECTIVE DETERMINATION OF ACRYLAMIDE INCOFFEE BY PLANAR CHROMATOGRAPHY AND FLUORESCENCE DETECTION AFTERDERIVATIZATION WITH DANSULFINIC ACID
Figure 4.2: Flowchart of the whole procedure for determination of acrylamide in coffee
Sample analysis Five coffee samples analyzed by the newly developed, validated method showedconcentrations of acrylamide between 52 and 191 µg/kg (Tab. 4.1). These values were in accordancewith literature findings [78, 100, 157], which demonstrates the methods‘ applicability. Unfortunatelyno certified reference material was available during the study. The whole HPTLC procedure was au-tomated in all its single steps when the ADC 2 was used. All in all the analysis time calculated for thesample load on one HPTLC plate took almost 2 h (30 min for application, 60 min for derivatization(heating), 15 min for chromatography, and 10 min for detection). On one HPTLC plate 16 sampletracks were applied (4 samples and 3 standard additions each) plus one reference track. This led toan analysis time of 7 min per sample. Thereby the personal work was minor, being reduced to plate
Table 4.1: Acrylamide concentrations of commercial ground coffee samples
Sample Acrylamide concentration, µg/kga
Coffee 1 89Coffee 2 52Coffee 3 62Coffee 4 152Coffee 5 191a Quantified by calibration in matrix via standard addition across thewhole procedure, which compensates for any systematic errors.
49

CHAPTER 4. RAPID AND COST EFFECTIVE DETERMINATION OF ACRYLAMIDE INCOFFEE BY PLANAR CHROMATOGRAPHY AND FLUORESCENCE DETECTION AFTERDERIVATIZATION WITH DANSULFINIC ACID
Figure 4.3: a) Image of a developed HPTLC plate (section) showing a coffee sample (track 1) and three standardadditions ranging from 125 to 375 µg/kg (tracks 2, 3, and 4). Fluorescent zones of dansylpropylamide arevisible within the marked horizontal lines. b) Fluorescence scan (254/>400 nm) of the four tracks in therange marked
transfer operations between the instruments. The rapid analysis and mostly automated, minimizedsample preparation allowed the application of the standard addition method across the whole proce-dure which was considered to be of high accuracy due to the compensation of any systematic error(robust calibration).
4.5 Conclusions
The new HPTLC method for determination of acrylamide in coffee showed sufficient selectivity byderivatization of acrylamide with dansulfinic acid to a fluorescent product. An excessive clean-upwas not necessary because of the high tolerance of planar chromatography towards matrix and excessof derivatization reagent. At the same time this method was demonstrated to be a cost-effectivealternative since no mass spectrometric detection and isotopically labelled standards were needed.The ability to automate sample extraction and all single HPTLC steps as well as to analyze severalsamples in parallel on one HPTLC plate made this a very efficient and rapid method. Its reliabilityand accuracy were assured by the standard addition method across the whole procedure.
50

CHAPTER 4. RAPID AND COST EFFECTIVE DETERMINATION OF ACRYLAMIDE INCOFFEE BY PLANAR CHROMATOGRAPHY AND FLUORESCENCE DETECTION AFTERDERIVATIZATION WITH DANSULFINIC ACID
Figure 4.4: Linear calibration curve of dansylpropylamide in a coffee sample via the standardaddition methodacross the whole procedure: unspiked coffee (A) and the coffee spiked with 125, 250, and 375 mg/kgacrylamide (B, C, and D, respectively) showing an original acrylamide content of 47 mg/kg in the unspikedcoffee (y = 0)
Figure 4.5: Calibration curve obtained by in situ standard addition onto the application area of the coffeesample () versus that obtained by standard solutions without any matrix influence (4). The curves showdifferent slopes
51

CHAPTER 4. RAPID AND COST EFFECTIVE DETERMINATION OF ACRYLAMIDE INCOFFEE BY PLANAR CHROMATOGRAPHY AND FLUORESCENCE DETECTION AFTERDERIVATIZATION WITH DANSULFINIC ACID
4.6 Acknowledgements
The authors would like to thank the Landesstiftung Baden-Württemberg for their financial support(Project-No. P-LS-E2/25) and Professor Dr. Wolfgang Schwack, University of Hohenheim, Instituteof Food Chemistry for the excellent working conditions in the institute. Further thanks to Merck,Darmstadt, Germany, and CAMAG, Muttenz, Switzerland, for supply of HPTLC plates and instru-ments, respectively.
52
Summary
Planar-chromatography (High-Performance Thin-Layer Chromatography, HPTLC) is a rapid andcost-effective offline separation method. Through advances in the automatization of each step thesystem reproducibility, from application and development to detection, has been improved. Thismakes planar-chromatography a highly reliable technique. HPTLC shows a couple of features thatmake it unique. There is great flexibility concerning application, development and detection that dis-tinguishes HPTLC from other techniques. Especially the parallel development of up to 36 tracks perplate, the possibility of pre-chromatographic derivatization on the stationary phase, application vol-umes from nL up to mL, two-dimensional development, automated single or multiple development,and the multiple detection with different methods (UV, fluorescence, bioluminescence, etc.) have tobe emphasized. A further advantage over column- (LC) and gas-chromatography (GC) is the singleuse of the stationary phase. This leads to a high tolerance towards sample matrix and allows for re-ducing sample preparation. Because of these aspects, planar-chromatography is an interesting toolfor each analyst.
However, in the last years hyphenation with mass spectrometry (MS) did not make great advance-ments in comparison to HPLC and GC: thus, planar-chromatography became less attractive. There-fore an existing universal hyphenation (ChromeXtract by Dr. Luftmann), that was based upon aplunger for elution, was improved (publication 1). The original version of the plunger did not allowany elution from glass backed plates, since they broke easily under the pressure applied during clamp-ing. It was difficult to adjust the pressure depending on the experience of the operator. Furthermore,solvent leakage was possible because of insufficient sealing of the cup-point. For a reproducible con-tact pressure that was independent from the experience of the operator, a commercial torque wrenchwas used for clamping of the plates. This guaranteed reproducible contact pressure. The installationof a small plastic buffer into the plunger ensured a slight kind of attenuation. This decreased thefrequency of leakage from over 50 % to below 5 %.
An important criterion of applicability of this hyphenation is the repeatability of the extractions andthus the measurements. Thus, zones of xanthylethylcarbamat (XEC) and dansylpropanamid (DPA)were extracted after chromatographic development. Their specific masses were detected in positiveESI-mode. The relative standard deviation of the signal in single-ion-monitoring (SIM) mode was18.6 % for XEC and 8.7 % for DPA. Linearity was given in the range of 10 to 200 ng/zone with
CHAPTER 4. RAPID AND COST EFFECTIVE DETERMINATION OF ACRYLAMIDE INCOFFEE BY PLANAR CHROMATOGRAPHY AND FLUORESCENCE DETECTION AFTERDERIVATIZATION WITH DANSULFINIC ACID
a very good correlation coefficient (r ≥ 0.9919). The limit of quantification at an S/N-ratio of 10was calculated by means of the blank signal and amounted 52 and 160 pg/zone for XEC and DPA,respectively. Additionally, the influence of the elution solvent on the extraction of the HPTLC-plateand signal intensity was demonstrated with tests using different solvents.
The second publication addressed the application of planar-chromatography hyphenated with MS bymeans of the modified ChromeXtractor on the determination of acrylamide in drinking water. Thestrict limit within the EU of 0.1 µg/L until then was only controlled through costly methods that werealmost exclusively based on GC-MS or LC-MS/MS after applying intensive clean-up procedures.Thus it was aimed to develop a low priced and rapid alternative method for routine analysis basedon HPTLC. Therefore a pre-chromatographic in-situ derivatization of acrylamide with a fluorescencemarker was used. The product was detected densitometrically after chromatographic separation. Dur-ing development of the method, the mass of the reaction product was determined for analysis of thederivatization step. With the aid of the modified ChromeXtract the product could be directly ex-tracted from the plate and transferred to MS. The exact mass proved that instead of the originallyused fluorescence marker dansylhydrazine the dimethylaminonaphthaline(Dan)-sulfinic acid reactswith acrylamide. Consequently, dansulfinic acid was synthesized and used for derivatization.
To take advantage of the high tolerance of planar-chromatography towards various sample matrices,an approach was searched in order to skip sample preparation. However the necessity to use excessof reagent led to high background fluorescence. This allowed only a limit of detection of 20 µg/L.Thus, sample preparation and analyt enrichment was necessary to obtain a method able to control themaximum concentration. In accordance with DIN 38413-6 concerning determination of acrylamide indrinking water, activated carbon was used for analyte enrichment by means of solid phase extraction(SPE). An internal standard (dimethylacrylamide) was added prior sample preparation. The finalextract was analysed as described. In spiked samples of drinking water, a 1000-fold lower limit ofdetection of 0.02 µg/L and a very good mean reproducibility across the whole system was shown,which suffices to control the maximum amount. A comparative study with measurements by LC-MS/MS revealed satisfactory correlation. Thus, for the first time a planar-chromatographic methodfor the determination of acrylamide at ultra-trace levels were presented.
The third publication addresses the application of the developed method on a very complex foodmatrix like coffee. Several publications reported problems during determination of acrylamide in cof-fee. Therefore the extremely high tolerance of planar-chromatography towards sample matrix effectswas used, allowing for a shortened sample preparation. The idea of a rapid method was followedby the extraction of commercial coffee samples by means of accelerated solvent extraction (ASE).This allowed for higher throughput during sample preparation. To remove a part of the co extractedmatrix, the whole ASE-extract was cleaned by SPE with activated carbon and evaporated to a definedvolume. This represented a simplification of common multistage extraction methods and clean-upsteps, that aim for complete removal of co extracted matrix prior injection into LC- or GC-systems.
54
CHAPTER 4. RAPID AND COST EFFECTIVE DETERMINATION OF ACRYLAMIDE INCOFFEE BY PLANAR CHROMATOGRAPHY AND FLUORESCENCE DETECTION AFTERDERIVATIZATION WITH DANSULFINIC ACID
In accordance with determination of acrylamide in drinking water, the extract was derivatized in-situ
with the fluorescence marker Dansulfinic acid and detected densitometrically after chromatographicseparation. The concentration of acrylamide was quantified by means of parallel preparation of threestandard additions. Systematic errors and the influence of the sample were corrected by the cali-bration within the matrix. The linearity of the calibration (between r = 0.9825 and 0.9995) wereacceptable. Good values were reached for the limit of quantification (48 µg/kg) and repeatability (rsd3 %). After method development the acrylamide concentration of commercial coffee samples wasdetermined, showing results being consistent with literature findings. Thus the applicability of thenewly developed method to complex food samples was demonstrated.
In summary, the present work shows the applicability of planar-chromatography hyphenated withmass spectrometry for sensitive determination of acrylamide. It was possible to quantify the analyteat ultra-trace levels using less instrumental effort and time than usual. Quantification in complexsample matrices was feasible in spite of a simplified sample preparation. These applications provethe relevance of planar-chromatography to solve current analytical problems.
55


Zusammenfassung
Bei der Planar-Chromatographie (High-Performance Thin-Layer Chromatography, HPTLC) handeltes sich um eine schnelle und kosteneffektive offline Trenntechnik. Die Entwicklungen in der Automa-tisierung der einzelnen Schritte führten zu einer stetigen Verbesserung der Reproduzierbarkeit von derAuftragung über die Entwicklung bis hin zur Detektion. Dies macht die Planar-Chromatographie zueiner zuverlässigen Analysetechnik. Unter mehreren Gesichtspunkten ist die HPTLC eine besondereTechnik. Ihre extreme Flexibilität in der Auftragung, Entwicklung und Detektion heben sie von an-deren Techniken hervor. Die parallele Entwicklung von bis zu 36 Banden pro Platte, die Möglichkeitzur prächromatographischen Derivatisierung auf der stationären Phase, mögliche Auftragsvoluminavon nL bis mL, zweidimensionale Entwicklung, automatisierte Einfach- und Mehrfachentwicklungund die mehrfache Detektion einer Platte mit verschiedenen Techniken (UV, Fluoreszenz, Biolumi-neszenz, etc.) sind dabei hervorzuheben. Ein weiterer Vorteil gegenüber der Säulen- (LC) oderGas-Chromatographie (GC) ist die einmalige Benutzung der stationären Phase. Dies hat eine sehrhohe Toleranz gegenüber Probenmatrix und damit verbunden eine verringerte Probenaufarbeitungzur Folge. Dies alles macht die Planar-Chromatographie für den Analytiker zu einer interessantenAnalysetechnik.
Jedoch machte in den letzten Jahren die Kopplung mit der Massenspektrometrie (MS) nicht den glei-chen Fortschritt, wie bei der HPLC und GC, wodurch die Planar-Chromatographie an Attraktivitätverlor. Es wurde daher eine vorhandene universelle Kopplungsmöglichkeit (ChromeXtract von Dr.Luftmann), die auf einem Elutionsstempel basierte, verbessert (Publikation 1). Die ursprünglicheVersion des Elutionsstempel liess keine Anwendung auf Glasplatten zu, da diese beim Einspannenschnell unter dem Anpressdruck des Stempels zerbrachen. Der Anpressdruck des Stempels liesssich nur schwer regulieren und war von der Erfahrung des Anwenders abhängig. Des Weiterenkonnte ein Auslaufen des verwendeten Lösungsmittels durch unzureichende Abdichtung der Zonedurch die Ringschneide auftreten. Um den Anpressdruck reproduzierbar und unabhängig vom Be-nutzer zu machen, wurde ein handelsüblicher Drehmomentschlüssel zum Einspannen der Platte ver-wendet. Dies garantierte einen reproduzierbaren Anpressdruck beim fixieren. Durch den Einbaueines Kunststoff-Puffers in den Stempel wurde ein leichter Ausgleich beim Anpressen gewährleistet.Dadurch konnte die Häufigkeit des Auslaufens von über 50 % auf unter 5 % gesenkt werden.
Ein wichtiges Kriterium für die Anwendbarkeit der Kopplungsmethode ist die Wiederholbarkeit der
CHAPTER 4. RAPID AND COST EFFECTIVE DETERMINATION OF ACRYLAMIDE INCOFFEE BY PLANAR CHROMATOGRAPHY AND FLUORESCENCE DETECTION AFTERDERIVATIZATION WITH DANSULFINIC ACID
Extraktionen und damit auch der Messungen. Hierfür wurden mehrere Zonen der Substanzen Xan-thylethylcarbamat (XEC) und Dansylpropanamid (DPA) nach ihrer chromatographischen Entwick-lung extrahiert und deren spezifische Massen im positiven ESI-Modus detektiert. Die relative Stan-dardabweichung des Single-Ion-Monitoring (SIM) Signals lag bei 18,6 % für XEC und 8,7 % fürDPA. Die Linearität war über einen Bereich von 10 bis 200 ng/Zone bei sehr guten Korrelationskoef-fizienten (r ≥ 0.9919) gewährleistet. Anhand des Blindwertsignals konnten die Bestimmungsgrenzenbei einem Signal/Rausch-Verhältnis von 10 zu 52 und 160 pg/Zone für XEC und DPA berechnet wer-den. Zudem wurde der Einfluss des Elutionsmittels auf die Extraktion der HPTLC-Platte und dieSignalintensität anhand von Versuchen mit verschiedenen Lösungsmitteln gezeigt.
Die zweite Publikation befasste sich mit der Anwendung der Planar-Chromatographie gekoppelt mitder MS mittels des modifizierten ChromeXtractors auf die Analyse von Acrylamid in Trinkwasser.Der in der EU geltende strenge Grenzwert von 0,1 µg/L konnte bisher nur von wenigen aufwändigenBestimmungsmethoden, meist mittels GC-MS oder LC-MS/MS nach intensiver Probenaufbereitung,überprüft werden. Es sollte daher mit der HPTLC eine günstige und schnelle Alternativmethodefür die Routine entwickelt werden. Hierfür wurde Acrylamid mit einem Fluoreszenzmarker prä-chromatographisch in-situ derivatisiert und nach chromatographischer Trennung densitometrisch de-tektiert. Bei der Entwicklung der Methode wurde zur Untersuchung des Derivatisierungsschrittesdie Masse des Reaktionsproduktes bestimmt. Mittels modifiziertem ChromeXtract konnte dabeidas Produkt direkt von der Platte extrahiert und ins MS geleitet werden. Die exakte Masse halfdabei zu erkennen, dass statt des ursprünglich eingesetzten Fluoreszenzmarker Dansylhydrazin dessenDimethylaminonaphthalin(Dan)-Sulfinsäure mit Acrylamid reagiert. Dies hatte zur Folge, dass Dan-sulfinsäure gezielt synthetisiert und eingesetzt wurde.
Um die hohe Matrixtoleranz der Planar-Chromatographie zu nutzen, wurde zunächst nach einemAnsatz gesucht, die Probenaufarbeitung zu überspringen. Die Notwendigkeit einen Überschuss desReagenz für die direkte Umsetzung in der Wasserprobe zu verwenden, führte jedoch im Chromato-gramm zu einer starken Hinergrundfluoreszenz. Dies ermöglichte nur eine Nachweisgrenze von20 µg/L. Um eine Methode zur Überprüfung des Grenzwertes zu erhalten, war daher eine vorherigeProbenaufbereitung und Analytanreicherung nötig. Gemäss der DIN 38413-6 über die Untersuchungvon Trinkwasser auf Acrylamid wurde der Analyt unter Verwendung eines internen Standards (Di-methylacrylamid) mittels Festphasenextraktion (Solid Phase Extraction, SPE) an Aktivkohle angere-ichert und der Extrakt wie beschrieben untersucht. Anhand von dotierten Trinkwasserproben konnteeine um den Faktor 1000 niedrigere Nachweisgrenze von 0,02 µg/L und eine sehr gute durchschnit-tliche Reproduzierbarkeit über das gesamte System gezeigt werden, was ausreicht den geltendenGrenzwert zu überprüfen. Vergleichsuntersuchungen mit HPLC-MS/MS-Messungen zeigten eineäusserst zufriedenstellende Korrelation. Insgesamt konnte zum ersten Mal eine planar-chromatograph-ische Methode vorgestellt werden, die es ermöglicht, Acrylamid im Ultra-Spurenbereich zu bestim-men.
58

CHAPTER 4. RAPID AND COST EFFECTIVE DETERMINATION OF ACRYLAMIDE INCOFFEE BY PLANAR CHROMATOGRAPHY AND FLUORESCENCE DETECTION AFTERDERIVATIZATION WITH DANSULFINIC ACID
In der dritten Publikation wurde die entwickelte Bestimmungsmethode auf die sehr komplexe Lebens-mittelmatrix Kaffee übertragen, denn es wurde in mehreren Publikationen hierbei von Problemen beider Acrylamid-Bestimmung berichtet. Hierfür konnte die Matrixtoleranz der Planar-Chromatographiegenutzt werden, die eine verkürzte Probenaufarbeitung ermöglichte. Der Ansatz einer schnellenUntersuchungsmethode wurde durch die Extraktion von kommerziell erhältlichen Kaffees mit Hilfeder beschleunigten Lösungsmittelextraktion (Accelerated Solvent Extraction, ASE) weiter verfolgt.Dadurch wurde ein grösserer Probendurchsatz bei der Aufbereitung möglich. Um einen Teil der mit-extrahierten Matrix zu entfernen, wurde der gesamte ASE-Probenextrakt einer SPE mit Aktivkohleunterzogen und anschliessend auf ein definiertes Volumen eingeengt. Dies stellte eine Vereinfachungzu den üblichen mehrstufigen Extraktions- und Aufreinigungsschritten dar, die eine weitestgehendeEntfernung der coextrahierten Matrix vor der Injektion in ein HPLC- oder GC-System zum Ziel hat-ten. Der so vorbereitete Extrakt wurde analog der Bestimmungsmethode für Wasser in-situ mit demFluoreszenzmarker Dansulfinsäure umgesetzt und nach chromatographischer Auftrennung densito-metrisch erfasst. Durch die parallele Aufarbeitung von drei Standardadditionen konnte der Acry-lamidgehalt bestimmt werden. Die Kalibration in der Matrix korrigierte systematische Fehler undEinflüsse der Probe über die gesamte Methode. Die Linearität der Kalibrationen (zwischen r = 0.9825und 0.9995) war akzeptabel. Die Bestimmungsgrenze und Wiederholbarkeit zeigten mit 48 µg/kgund 3 % relativer Standardabweichung gute Werte. Nach der Methodenentwicklung wurde von kom-merziell erhältlichem Kaffee der Acrylamidgehalt bestimmt, wobei die erhaltenen Werte mit Angabenaus der Literatur übereinstimmten. Es wurde damit die Anwendbarkeit der neu entwickelten Methodeauf schwierige Lebensmittel demonstriert.
Zusammengefasst zeigt die vorliegende Arbeit die Anwendbarkeit der Planar-Chromatographie inVerbindung mit der Massenspektrometrie für die empfindliche Bestimmung von Acrylamid. Es istgelungen, mit einem Bruchteil des üblichen apparativen und zeitlichen Aufwands den Analyten zumeinen bis hin zum Ultra-Spurenbereich zu quantifizieren. Des weiteren wurde trotz einer verkürztenProbenaufarbeitung die Quantifizierung in einer problematischen Matrix möglich. Diese Anwendung-en stellen die Relevanz der Planar-Chromatographie für moderne analytische Fragestellungen unterBeweis.
59


Chapter 5
References
1. Stadler, R. H.; Blank, I.; Varga, N.; Robert, F.; Hau, J.; Guy, J. A.; Robert; M.-C.; Riediker, S.Acrylamide from Maillard reaction products. Nature 2002, 419, 449.
2. Mottram, D. S.; Wedzicha, B. L., Dodson, A. T. Acrylamide is formed in the Maillard reaction.Nature 2002, 419, 448.
3. Becalski, A.; Lau, B. P.-Y.; Lewis, D.; Seaman, S. W. Acrylamide in Foods: Occurence,Sources, and Modeling. J. Agric. Food Chem. 2003, 51, 802-808.
4. Yaylayan, V. A.; Wnorowski, A.; Locas, C. P. Why asparagine needs carbohydrates to generateacrylamide. J. Agric. Food Chem. 2003, 51, 1753-1757.
5. Zyzak, D. A.; Sanders, R. A.; Stojanovic, M.; Tallmadge, D. H.; Eberhart, B. L.; Ewald, D.K.; Gruber, D. C.; Morsch, T. R.; Strothers, M. A.; Rizzi, G. P.; Villagran; M. D. Acrylamideformation mechanism in heated foods.J. Agric. Food Chem. 2003, 51, 4782-4787.
6. Granvogl, M.; Jezussek, M.; Koehler, P.; Schieberle, P. Quantitation of 3-aminopropionamidein potatoes - A minor but potent precursor in acrylamide formation. J. Agric. Food Chem. 2004,52, 4751-4757.
7. Granvogl, M.; Schieberle, P. Thermally Generated 3-aminopropionamide as a transient inter-mediate in the formation of acrylamide. J. Agric. Food Chem. 2006, 54, 5933-5938.
8. Yashura, A.; Tanaka, Y.; Hengel, M.; Shibamoto, T. Gas chromatographic investigation ofacrylamide formation in browning model systems. J. Agric. Food Chem. 2003, 51, 3999-4003.
9. Biedermann, M.; Noti, A.; Biedermann-Brem, S.; Mozzetti, V.; Grob, K. Experiments on acry-lamide formation and possibilities to decrease the potential of acrylamide formation in potatoes.Mitt. Lebensm. Hyg. 2002, 93, 668-687.

CHAPTER 5. REFERENCES
10. Pollien, P.; Lindinger, C.; Yeretzian, C.; Blank, I. Proton transfer reaction mass spectrometry,a tool for on-line monitoring of acrylamide formation in the headspace of Maillard reactionsystems and processed foods. Anal. Chem. 2003, 75, 5488-5494.
11. Tareke, E. 2003. Identification and origin of potential background carcinogens: Endogenousisoprene and oxiranes, dietary acrylamide. PhD Thesis. Department of Environmental Chem-istry. Stockholm University.
12. Mestdagh, F. J.; de Meulenaer, B.; van Poucke, C.; Detavernier, C.; Cromphout, C.; van Pe-teghem, C. Influence of oil type on the amounts of acrylamide generated in a model system andin french fries. J. Agric. Food Chem. 2005, 53, 6170-6174.
13. Tareke, E.; Rydberg, P.; Karlsson, P., Eriksson, S.; Törnqvist, M. Analysis of acrylamide, acarcinogen formed in heated foodstuffs. J. Agric. Food Chem. 2002, 50, 4998-5006.
14. Rydberg, P.; Eriksson, S.; Tareke, E.; Karlsson, P.; Ehrenberg, L.; Törnqvist, M. Investigationsof factors that influence the acrylamide content of heated foodstuffs. J. Agric. Food Chem.
2003, 51, 7012-7018.
15. Elmore, J. S.; Koutsidis, G.; Dodson, A. T.; Mottram, D. S.; Wedzicha, B. L. Measurement ofacrylamide and its precursors in potato, wheat, and rye model systems. J. Agric. Food Chem.
2005, 53, 1286-1293.
16. Mestdagh, F.; de Meulenaer, B.; Cucu, T.; van Peteghem, C. Role of water upon the formationof acrylamide in a potato model system. J. Agric. Food Chem. 2006, 54, 9092-9098.
17. Smith, E. A.; Pruen, S. L.; Oehme, F. W. Environmental degradation of polyacrylamides II.Effects of artificial environmental conditions: temperature, light and pH. Ecotoxicol. Environ.
Saf. 1996, 37, 240-244.
18. World Health Organization (WHO) Guidelines for Drinking Water Quality, Vol. 1: Recommen-dations, 2nd ed., World Health Organization, Geneva, 2003.
19. National Primary Drinking Water Regulations, US Environmental Protection Agency, Wash-ington, DC, 2002.
20. European Council Drinking Water Directive EU 98/83/EC, European Council, Brussels, 1998.
21. Svensson, K.; Abramsson, L.; Becker, W.; Glynn, A.; Hellenäs, K.-E., Lind, Y.; Rosén Dietaryintake of acrylamide in Sweden. J. Food Chem. Toxicol. 2003, 41, 1581-1586.
22. Dybing, E.; Farmer, P. B.; Andersen, M.; Fennel, T. R.; Lalljie, S. P. D.; Müller, D. J. G.;Olin, S.; Petersen, B. J.; Schlatter, J.; Scholz, G.; Scimeca, J. A.; Slimani, N.; Törnqvist, M.;Tuijtelaars, S.; Verger, P. Human exposure and internal dose assessments of acrylamide in food.Food Chem. Technol. 2005, 43, 365-410.
62
CHAPTER 5. REFERENCES
23. Granby, K.; Fagt, S. Analysis of acrylamide in coffee and dietary exposure to acrylamide fromcoffee. Anal. Chim. Acta 2004, 520, 177-182.
24. Friedman, M. Chemistry, biochemistry, and safety of acrylamide. A review. J. Agric. Food
Chem. 2003, 51, 4504-4526.
25. Skog, K.; Alexander, J. The formation of acrylamide in cereal products and coffee. In Acry-lamide and Other Hazardous Compounds in Heat-Treated Foods; Woodhead Publishing: Cam-bridge, U.K., 2006; pp 36.
26. Taeymans, D.; Wood, J.; Ashby, P.; Blank, I.; Studer, A.; Stadler, R. H.; Gondé , P.; van Eijck,P.; Lalljie, S.; Lingnert, H.; Lindblom, M.; Matissek, R.; Müller, D.; Tallmadge, D.; O’Brien,J.; Thomson, S.; Silvani, D.; Whithmore, T. A review of acrylamide: an industry perspectiveon research, analysis, formations, and control. Crit. Rev. Food Sci. Nutr. 2004, 44, 323-347.
27. Lantz, I.; Ternit, R.; Wilkens, J.; Hoenicke, K.; Guenther, H.; van der Stegen, G. Studies onacrylamide levels in roastings, storage and brewing of coffee. Molecular Nutrition and Food
Research 2006, 50, 1039-1046.
28. Bagdonaite, K.; Derler, K.; Murkovic, M. Determination of acrylamide during roasting of cof-fee. J. Agric. Food Chem. 2008, 56, 6081-6086.
29. Odland, I.; Romert, L.; Clemedson, C.; Walum, E. Glutathione content, glutathione transferaseactivity and lipid peroxidation in acrylamide-treated neuroblastoma NIE 115 cells. Toxicol. in
Vitro 1994, 8, 263-267.
30. Sumner, S. C.; Fennell, T. R.; Moore, T. A.; Chanas, B.; Gonzalez, F.; Ghanayem, B. Role ofcytochrome P450 2E1 in the metabolism of acrylamide and acrylonitrile in mice. Chem. Res.
Toxicol. 1999, 12, 1110-1116.
31. Sumner, S. C. J.; MacNeela, J. P.; Fennell, T. R. Characterization and quantitation of urinarymetabolites of [1,2,3-13C]acrylamide in rats and mice using carbon-13 nuclear magnetic reso-nance spectroscopy. Chem. Res. Toxicol. 1992, 5, 81-89.
32. Sumner, S. C. J.; Selvaraj, L.; Nauhaus, S. K.; Fennell, T. R. Urinary metabolites from F344rats and B6C3F1 mice coad-ministered acrylamide and acrylonitrile for 1 or 5 days. Chem.
Res. Toxicol. 1997, 10, 1152-1160.
33. Kirman, C.; Gargas, M.; Deskin, R.; Tonner-Navarro, L.; Andersen, M. A physiologically basedpharmacokinetic model for acrylamide and its metabolite, glycidamide, in the rat. J. Toxicol.
EnViron. Health, Part A 2003, 66, 253-274.
63
CHAPTER 5. REFERENCES
34. Barber, D. S.; Hunt, J. R.; Ehrich, M. F.; Lehning, E. J.; LoPachin, R. M. Metabolism, toxicoki-netics and hemoglobin adduct formation in rats following subacute and subchronic acrylamidedosing. Neurotoxicology 2001, 22, 341-353.
35. Dearfield, K. L.; Douglas, G. R.; Ehling, U. H.; Moore, M. M.; Sega, G. A.; Brusick, D. J.Acrylamide: a review of its genotoxicity and an assessment of heritable genetic risk. Mutat.
Res. 1995, 330, 71-99.
36. Calleman, C. J.; Bergmark, E.; Stern, L. G.; Costa, L. G. A nonlinear dosimetric model forhemoglobin adduct formation by the neurotoxic agent acrylamide and its genotoxic metaboliteglycidamide. EnViron. Health Perspect. 1993, 99, 221-223.
37. He, F. S.; Zhang, S. L.; Wang, H. L.; Li, G.; Zhang, Z. M.; Li, F. L.; Dong, X. M.; Hu, F.Neurological and electroneuromyographic assessment of the adverse effects of acrylamide onoccupationally exposed workers. Scand. J. Work EnViron. Health 1989, 15, 125-129.
38. LoPachin, R. M. The role of fast axonal transport in acrylamide pathophysiology: Mechanismor epiphenomenon? Neurotoxicology 2002, 23, 253-257.
39. Sickles, D. W.; Stone, J. D.; Friedman, M. A. Fast axonal transport: A site of acrylamideneurotoxicity? Neurotoxicology 2002, 23, 223-251.
40. Shelby, M. D.; Cain, K. T.; Cornett, C. V.; Generoso, W. M. Acrylamide: induction of heritabletranslocations in male mice. EnViron. Mutagen. 1987, 9, 363-368.
41. Zenick, H.; Hope, E.; Smith, M. K. Reproductive toxicity associated with acrylamide treatmentin male and female mice. J. Toxicol. EnViron. Health 1986, 17, 457-472.
42. Chapin, R. E.; Fail, P. A.; George, J. D.; Grizzle, T. B.; Heindel, J. J.; Harry, G. J.; Collins,B. J.; Teague, J. The reproductive and neural toxicities of acrylamide and three analogues inSwiss mice, evaluated using the continuous breeding protocol. Fundam. Appl. Toxicol. 1995,27, 9-24.
43. Sakamoto, J.; Hashimoto, K. Reproductive toxicity of acrylamide and related compounds inmiceseffects on fertility and sperm morphology. Arch. Toxicol. 1986, 59, 201-205.
44. IARC Monographs on the Evaluation of Carcinogenic Risks to Humans, Vol. 60, InternationalAgency for Research on Cancer, Lyon, 1994, p. 389.
45. Bull, R. J.; Robinson, M.; Laurie, R. D.; Stoner, G. D.; Greisiger, E.; Meier, J. R. J.; Stober, J.Carcinogeneic effects of acrylamide in Sencar and A/J mice. Cancer Res. 1984, 44, 107-111.
46. Friedman, M. A.; Duak, L. H.; Stedham, M. A. A lifetime oncogeniciy study in rats withacrylamide. Fundam. Appl. Toxicol. 1995, 27, 95-105.
64

CHAPTER 5. REFERENCES
47. Solomon, J. J.; Fedyk, J.; Mukai, F.; Segal, A. Direct alkylation of 2’-deoxynucleosides andDNA following in vitro reaction with acrylamide. Cancer Res. 1985, 45, 3465-3470.
48. Segerback, D.; Calleman, C. J.; Schroeder, J. L.; Costa, L. G.; Faustman, E. M. Formationof N-7-(2-carbamoyl-2-hydroxy ethyl)guanine in DNA of the mouse and the rat following in-traperitoneal administration of [14C]acrylamide. Carcinogenesis 1995, 16, 1161-1165.
49. Wilson, K. M.; Rimm, E. B.; Thompson, K. M.; Mucci, L. A. Dietary acrylamide and cancerrisk in humans: A review. J. Verbr. Lebensm. 2006, 1, 19-27.
50. Svensson, K.; Abramsson, L.; Becker, W.; Glynn, A.; Hellenäs, K. E.; Lind, Y. Rosen, J.Dietary intake of acrylamide in Sweden. Food Chem.. Toxicol. 2003, 41, 1581-1586.
51. Boon, P. E.; de Mul, A., van der Voet, H.; van Donkersgoed, G.; Brette, M.; van Klaveren, J. D.Calculations of dietary exposure to acrylamide. Mutat. Res. 2005, 580, 143-155.
52. US Food and Drug Administration (US FDA) The updated exposure assessment for acrylamide.JIFSAN 2004 Acrylamide in food workshop 2004 http://www.cfsan.fda.gov/ dms/acrydino/sld001.htm.
53. Johnson, K. A.; Gorzinski, S. J.; Bodner, K. M.; Campbell, R. A.; Wolf, C. H.; Friedman, M.A.; Mast, R. W. Chronic toxicity and oncogenicity study on acrylamide incorporated in thedrinking water of Fisher 344 rats. Toxicol. Appl. Pharmacol. 1986, 85, 154-168.
54. US Environmental Protection Agency (US EPA) Integrated risk information system (IRIS):Acrylamide (CASRN 79-06-1) 2004 http://www.epa.gov/iris/subst/0286.htm.
55. WHO/FAO JECFA Summary and conclusions from the 64th meeting of the JointFAO/WHOExpert Committee on Food Additives 2005http://www.who.int/entity/ipcs/food/jecfa/summaries/summary_report_64_final.pdf.
56. Mucci, L. A.; Dickman, P. W.; Steineck, G.; Adami, H. O.; Augustsson, K. Dietary acrylamideand cancer of the large bowel, kidney, and bladder: absence of an association in a population-based study in Sweden. Br. J. Cancer 2003, 89, 84-89.
57. Mucci, L. A.; Lindblad, P.; Steineck, G.; Adami, H. O. Dietary acrylamide and risk of renal cellcancer. Int. J. Cancer 2004, 109, 774-776.
58. Mucci, L. A.; Sandin, S.; Balter, K.; Adami, H. O.; Magnusson, C., W.; Weiderpass, E. Acry-lamide intake and breast cancer risk in Swedish women. JAMA 2005, 293, 1326-1327.
59. Mucci, L. A.; Adami, H. O.; Wolk, A. Prospective study of dietary acrylamide and risk ofcolorectal cancer among women. Int. J. Cancer 2006, 118, 169-173.
60. Wenzl, T. Beatriz de la Calle, M; Anklam, E. Analytical methods for the determination ofacrylamide in food products: a review. Food Addit. Contam. 2003, 20, 885-902.
65

CHAPTER 5. REFERENCES
61. Castle, L.; Eriksson, S. Analytical methods used to measure acrylamide concentrations in foods.J. AOAC Int. 2005, 88, 274-284.
62. Zhang, Y.; Zhang, G.; Zhang, Y. Occurence and analytical methods of acrylamide in heat-treated foods: Review and recent developments. J. Chrom. A 2005, 1075, 1-21.
63. Tareke, E.; Rydberg, P.; Karlsson, P.; Eriksson, S.; Törnqvist, M. Acrylamide: a cooking car-cinogen? Chem. Res. Toxicol. 2000, 13, 517-522.
64. Tareke, E.; Rydberg, P.; Karlsson, P.; Eriksson, S.; Törnqvist, M. Analysis of acrylamide, acarcinogen formed in heated foodstuffs. J. Agri. Food Chem. 2002, 50, 4998-5006.
65. Castle, L.; Campos, M.-J.; Gilbert, J.; Determination of acrylamide monomer in hydroponicallygrown tomato fruits by capillary gas chromatography-mass spectrometry. J. Sci. Food Agri.
1991, 54, 549-555.
66. Castle, L. Determination of acrylamide monomer in mush rooms grown on polyacrylamide gel.J. Agri. Food Chem. 1993, 41, 1261-1263.
67. Ahn, J. S.; Castle, L.; Clarke, D. B.; Lloyd, A. S.; Philo, M. R.; Speck, D. R. Verification offindings of acrylamide in heated foods. Food Addit. Contam. 2002, 19, 1116-1124.
68. Biedermann, M.; Biedermann-Brem, S.; Noti , A.; Grob, K.; Egli , P.; Mändli, H. Two GC-MSmethods for the analysis of acrylamide in foods. Mitt. Lebensm. Hyg. 2002, 93, 638-652.
69. Ono, H.; Chuda, Y.; Ohnishi -Kameyama, M.; Yada, H.; Ishizaka, M.; Kobayashi , H.; Yoshida,M.; Analysis of acrylamide by LC-MS/MS and GC-MS in processed Japanese foods. Food
Addit. Contam. 2003, 20, 215-220.
70. Wiertz-Eggert-Jörissen (WEJ) GmbH, 2003, Standard operation procedure for the determina-tion of acrylamide in baby food. Standard Operation Procedure (SOP) WEJ GmbH (Hamburg:Germany).
71. Nemoto, S.; Takatsuki, S.; Sasaki, K.; Maitani, T. Determination of acrylamide in foods byGC/MS using 13C-labeled acrylamide as an internal standard. J. Food Hyg. Soc. Japan 2002,43, 371-376.
72. Rosen, J.; Hellenäs, K. E. Analysis of acrylamide in cooked foods by liquid chromatographytandem mass spectrometry. Analyst 2002, 127, 880-882.
73. Gutsche, B.; Weisshaar, R.; Buhlert, J. Acrylamid in Lebensmittel - Ergebnisse der amtlichenLebensmittelüberwachung Baden-Württembergs. Dtsch. Lebensm. Rundsch. 2002, 98, 437-443.
74. Vattem, D. A.; Shetty, K. Acrylamide in food: a model for mechanism of formation and itsreduction. Inn. Food Sci. Emer. Tech. 2003, 4, 331-338.
66

CHAPTER 5. REFERENCES
75. Roach, J. A. G.; Andrzejewski, D.; Gay, M. L.; Nortrup, D.; Musser, S. M. Rugged LC-MS/MSsurvey analysis for acrylamide in foods. J. Agric. Food Chem. 2003, 51, 7547-7554.
76. Jezussek, M.; Schieberle, P. A new LC/MS-method for the quantitation of acrylamide basedon a stable isotope dilution assay and derivatization with 2-mercaptobenzoc acid. Comparisonwith two GC/MS-methods. J. Agric. Food Chem. 2003, 51, 7866-7871.
77. Riediker, S.; Stadler, R. H. Analysis of acrylamide in food by isotope-dilution liquid chro-matography coupled with electrospray ionization tandem mass spectrometry. J. Chromatogr. A
2003, 1020, 121-130.
78. Andrzejewski, D.; Roach, J. A. G.; Gay, M. L.; Musser, S. M. Analysis of coffee for thepresence of acrylamide by LC-MS/MS. J. Agric. Food Chem. 2004, 52, 1996-2002.
79. Pittet, A.; Périsset, A.; Oberson, J.-M. Trace level determination of acrylamide in cereal-basedfoods by gas chromatography-mass spectrometry. J. Chromatogr. A 2004, 1035, 123-130.
80. Wenzl, T.; de la Calle, B.; Gatermann, R.; Hoenicke, K.; Ulberth, F.; Anklam, E. Evaluationof the results from an inter-laboratory comparison study of the determination of acrylamide incrispbread and butter cookies. Anal. Bioanal. Chem. 2004, 379, 449-457.
81. Hoenicke, K.; Gatermann, R.; Harder, W.; Hartig, L. Analysis of acrylamide in differentfoodstuffs using liquid chromatography-tandem mass spectrometry and gas chromatography-tandem mass spectrometry. Anal. Chim. Acta 2004, 520, 207-215.
82. Peng, L.; Farkas, T.; Loo, L.; Teuscher. J.; Kallury, K. Rapid and reproducible extraction ofacrylamide in french fries using a single solid-phase sorbent. American Laboratory October
2003, 10-14.
83. Pérez, H. L.; Osterman-Golkar, S. A sensitive gas chromatographic-tandem mass spectrometricmethod for detection of alkylating agents in water: Application to acrylamide in drinking water,coffee and snuff. Analyst 2003, 128, 1033-1036.
84. Riediker, S.; Stadler, R. H. Analysis of acrylamide in food by isotope-dilution liquid chro-matography coupled with electrospray ionization tandem mass spectrometry. J. Chromatogr. A
2003, 121-130.
85. Wenzl, T.; Karasek, L.; Rosen, J.; Hellenäs, K.-E.; Crews, C.; Castle. L.; Anklam, E. Collabora-tive trial validation study of two methods, one based on high performance liquid chromatography-tandem mass spectrometry and on gas chromatography-mass spectrometry for the determina-tion of acrylamide in bakery and potato products. J. Chromatogr. A 2006, 1132, 211-218.
67

CHAPTER 5. REFERENCES
86. Lee, M.-R.; Chang, L.-Y.; Dou, J. Determination of acrylamide in food by solid-phase microex-traction coupled to gas chromatography-positive chemical ionization tandem mass spectrome-try. Anal. Chim. Acta 2007, 582, 19-23.
87. Paleologos, E. K.; Kontominas, M. G. Determination of acrylamide and methacrylamide bynormal phase high performance liquid chromatography and UV detection. J. Chromatogr. A
2005, 1077, 128-135.
88. Nielsen, N. J.; Granby, K.; Hedegaard, R. V.; Skibsted, L. H. A liquid chromatography - tan-dem mass spectrometry method for simultaneous analysis of acrylamide and the precursors,asparagine and reducing sugars in bread. Anal. Chim. Acta 2006, 557, 211-220.
89. Bermudo, E.; Nunez, O.; Puignou, L.; Galceran, M. T. Analysis of acrylamide in food productsby in-line preconcentration capillary zone electrophoresis. J. Chromatogr. A 2006, 1129, 129-134.
90. Bermudo, E.; Nunez, O.; Puignou, L.; Galceran, M. T. Analysis of acrylamide in food samplesby capillary zone electrophoresis. J. Chromatogr. A 2006, 1120, 199-204.
91. Petersson, E. V.; Rosén, J.; Turner, C.; Danielsson, R.; Hellenäs, K.-E. Critical factors andpitfalls affecting the extraction of acrylamide from foods: An optimization study. Anal. Chim.
Acta 2006, 557, 287-295.
92. Casella, I. G.; Pierri, M.; Contursi, M. Determination of acrylamide and acrylic acid by isocraticliquid chromatography with pulsed electrochemical detection. J. Chromatogr. A 2006, 1107,198-203.
93. Bermundo, E.; Moyano, E.; Puignou, L.; Galceran, M. T. Determination of acrylamide in food-stuffs by liquid chromatography ion-trap tandem mass-spectrometry using an improved clean-up procedure. Anal. Chim. Acta 2006, 559, 207-214.
94. Senyuva, H. Z.; Gökmen, V. Survey of acrylamide in Turkish foods by an in-house validatedLC-MS method. Food Addit. Contam. 2005, 22, 204-209.
95. Murkovic, M. Acrylamide in Austrian foods. J. Biochem. Biophys. Methods 2004, 61, 161-167.
96. Sagratini, G.; Fabbri, A.; Marucci, G.; Ricciutelli, M.; Vittori, S.; Ammendola, S. HPLC-MSvalidation of QualisaFoo®biosensor kit for cost-effective control of acrylamide levels in Italiancoffee. Food Contr. 2007, 18, 1267-1271
97. Stobiecka, A.; Radecka, H.; Radecki, J. Novel voltammetric biosensor for determining acry-lamide in food samples. Biosens. Bioelectr. 2007, 22, 2165-2170.
98. Takatsuki, S.; Nemoto, S.; Sasaki, K.; Maitani, T. Determination of acrylamide in processedfoods by LC/MS using column switching. J. Food Hyg. Soc. Japan 2003, 44, 89-95.
68
CHAPTER 5. REFERENCES
99. Konings, E. J. M.; Baars, A. J.; van Klaveren, J. D.; Spanjer, M. C.; Rensen, P. M.; Hiemstra,M.; van Kooij, J. A.; Peters, P. W. J. Acrylamide exposure from foods of the Dutch populationand an assessment of the consequent risks. Food Chem. Toxicol. 2003, 41, 1569-1579.
100. Mastovska, K.; Lehotay, S. J. Rapid sample preparation method for LC-MS/MS or GC-MSanalysis of acrylamide in various food matrices. J. Agric. Food Chem. 2006, 54, 7001-7008.
101. Gökmen, V.; Senyuva, H. Z. A generic method for the determination of acrylamide in thermallyprocessed foods. J. Chromatogr. A 2006, 1120, 194-198.
102. Gökmen, V.; Senyuva, H. Z.; Acar, J.; Sarioglu, K. Determination of acrylamide in potato chipsand crisps by high-performance liquid chromatography. J. Chromatogr. A 2005, 1088, 193-199.
103. Yusà, V.; Quintas, G.; Pardo, O.; Martí, P.; Pastor, A. Determination of acrylamide in foods bypressurized fluid extraction and liquid chromatography-tandem mass spectrometry used for asurvey of Spanish cereal-based foods. Food Addit. Contam. 2006, 23, 237-244.
104. Tateo, F.; Bononi, M. A GC/MS method for the routine determination of acrylamide in food.Ital. J. Food Sci. 2003, 15, 149-151.
105. Delatour, T.; Périsset, A.; Goldmann, T.; Riediker, S.; Stadler, R. H. Improved sample prepara-tion to determine acrylamide in difficult matrixes such as chocolate powder, cocoa, and coffeeby liquid chromatography tandem mass spectroscopy. J. Agric. Food Chem. 2004, 52, 4625-4631.
106. Owen, L. M.; Castle, L.; Kelly, J.; Wilson, L. A.; Lloyd, A. S. Acrylamide analysis: Assess-ment of results from six rounds of Food Analysis Performance Assessment Scheme (FAPAS®)proficiency testing. J. AOAC Int. 2005, 88, 285-291.
107. Eriksson, S.; Karlsson, P. Alternative extraction techniques for analysis of acrylamide in food:Influence of pH and digestive enzymes. Food Sci. Technol. 2006, 39, 392-398.
108. Höfler, F.; Maurer, R.; Cavalli, S. Schnelle Analyse von Acrylamid in Lebensmitteln mit ASEund LC/MS. GIT Labor-Fachzeitschrift 2002, Nr. 9, 968-970.
109. Cavalli, S.; Maurer, R.; Höfler, F. Fast determination of acrylamide in food samples using ac-celerated solvent extraction followed by ion chromatography with UV or MS-detection. LC/GC
Europe, The Applicationsbook 2003, April 2, 1-3.
110. Swiss Federal Office of Public Health, Determination of Acrylamide in Food [http://www.bag.admin.ch/verbrau/aktuell/d/AA_methode.pdf],2002.
111. Lande, S. S.; Bosch, S. J.; Howard, P. H. Degradation and leaching of acrylamide in soil. J.
Environ. Qual. 1979, 8, 133 - 137.
69
CHAPTER 5. REFERENCES
112. Bologna, L. S.; Andrawes, F. F.; Barvenik, F. W.; Lentz, R. D.; Sojka, R. E. Analysis of residualacrylamide in field crops. J. Chromatogr. Sci. 1999, 37, 240-244.
113. Inoue, K.; Yoshimura, Y.; Nakazawa, H. Development of high-performance liquid chromatography-electrospray mass spectrometry with size-exclusion chromatography for determination of acry-lamide in fried foods. Liq. Chromatogr. Rel. Tech. 2003, 26, 1877-1884.
114. Busch, K. L. in Sherma, J. and Fried, B. (Eds), Handbook of Thin Layer Chromatography,Marcel Dekker, New York, 1996.
115. Brown, S. M.; Busch, K. L. Direct identification and quantification of diuretic drugs by fastatom bombardement mass spectrometry following separation by thin layer chromatography. J.
Planar Chromatogr. 1991, 4, 189-193.
116. Banno, K.; Matsuoka, M.; Takahashi, R. Quantitative analysis by thin-layer chromatographywith secondary ion mass specrometry. Chromatographia 1991, 32, 179-181.
117. Gusev, A. I.; Vasseur, O. J.; Proctor, A.; Sharkey, A. G.; Hercules, D. M. Imaging thin-layerchromatograms using matrix-assisted laser desorption/ionization mass spectrometry. Anal.
Chem. 1995, 67, 4565-4570.
118. Mowthorpe, S.; Clench, M. R.; Cricelius, A.; Richards, D. S.; Parr, V.; Tetler, L. W. Matrix-assisted laser desorption/ionisation time-of-flight thin layer chromatography mass spectrometry- A rapid method for impurity testing. Rapid Commun. Mass Spectrom. 1999, 13, 264-270.
119. Chen, Y. C. In situ determination of organic reaction products by combining thin layer chro-matography with surface-assisted laser desorption/ionization time-of-flight mass spectrometry.Rapid Commun. Mass Spectrom. 1999, 13, 821-825.
120. Hercules, D. M. Organic mass spectrometry using the laser microprobe. Pure Appl. Chem.
1983, 55, 1869-1885.
121. van Bekel, G. J.; Sanchez, A. D.; Quirke, J. M. E. Thin-layer chromatography and electrosprymass specrometry coupled using a surface sampling probe. Anal. Chem. 2002, 74, 6216-6223.
122. van Berkel, G. J.; Ford, M. J.; Deibel, M. A. Thin-layer chromatography and mass spectrometrycoupled using desorption electrospray ionization. Anal. Chem. 2005, 77, 1207-1215.
123. Morlock, G.; Ueda, Y. New coupling of planar chromatography with direct analysis in real timemass spectrometry. J. Chromatogr. A 2007, 1143, 243-251.
124. Luftmann, H. A simple device for the extraction of TLC spots: direct cpouling with an electro-spray mass spectrometer. Anal. Bioanal. Chem 2004, 378, 964-968.
125. Luftmann, H.; Aranda, M.; Morlock G. Automated interface for hyphenation of planar chro-matography with mass spectrometry. Rapid Commun. Mass Spectrom. 2007, 21, 3772-3776.
70

CHAPTER 5. REFERENCES
126. Fanibanda, T.; Milnes, J.; Gormally, J. Thin layer chromatography - mass spectrometry usinginfrared laser desorption. Int. J. Mass Spectrom. Ion Processes 1994, 140, 127-130.
127. Gusev, A. I. Interfacing matrix-assisted laser desorption/ionization mass spectrometry with col-umn and planar separations. Fresenius J. Anal. Chem. 2000, 366, 691-700.
128. Crecelius, A.; Clench, M. R.; Richards, D. S. TLC-MALDI in pharmaceutical analysis. Phar-
maGenomics 2004, 4, 36-38, 40, 42.
129. Salo, P. K.; Salomies, H.; Harju, K.; Ketola, R. A.; Kotiaho, T.; Yli-Kauhaluoma, J.; Kostiainen,R. Analysis of small molecules by ultra thin-layer chromatography - atmospheric pressure ma-trix - assisted laser desorption/ionization mass spectrometry. J. Am. Soc. Mass Spectrom. 2005,16, 906-915.
130. Guittard, J. G.; Hronowski, X. L.; Costello, C. E. Direct matrix-assisted laser desorption/ionizationmass spectrometric analysis of glycosphingolipids on thin-layer chromatographic plates andtransfer membranes. Rapid. Commun. Mass Spectrom. 1999, 13, 1838-1849.
131. Dreisewerd, K.; Kölbl, S.; Peter-Katalinic, J.; Berkenkamp, J.; Pohlentz, G. Analysis of nativemilk oligosaccharides directly from thin-layer chromatography plates by matrix-assisted laserdesorption/ionization orthogonal-time-of-flight mass spectrometry with a glycerol matrix. J.
Am. Soc. Mass Spectrom. 2006, 17, 139-150.
132. Orinak, A.; Vering, G.; Arlinghaus, H. F.; Andersson, J. T.; Halas, L.; Orinakova, R. Newapproaches to coupling TLC wit TOF-SIMS. J. Planar Chromatogr. 2005, 18, 44-50.
133. Oka, H.; Ikai, Y.; Hayakawa, J.; Harada, K.; Masuda, K.; Suzuki, M.; Himei, R.; Horie, M.;Nakazawa, H. Identification of residual tetracyclines in honey by TLC/FABMS. J. Food Hy-
gienic Soc. Japan 1993, 34, 517-523.
134. Cody, R. B.; Laramee, J. A.; Durst, H. D. Versatile new ion source for the analysis of materialsin open air under ambient conditions. Anal. Chem. 2005, 77, 2202-2297.
135. Morlock, G.; Schwack, W. Determination of isopropylthioxanthone (ITX) in milk, yoghurt andfat by HPTLC-FLD, HPTLC-ESI/MS and HPTLC-DART/MS. Anal. Bioanal. Chem. 2006,385, 586-595.
136. Anderson, R. M.; Busch, K. L. Thin-layer chromatography coupled with mass spectrometry:Interfaces to electrospry ionization. J. Planar Chromatogr. 1998, 11, 336-341.
137. Kertesz, V.; Ford, M. J.; Van Berkel, G. J. Automation of a surface sampling probe/electrospraymass spectrometry system. Anal. Chem. 2005, 77, 7183-7189.
138. Prosek, M.; Milivojevic, L.; Krizman, M. On-Line TLC-MS. J. Planar Chromatogr. 2004, 6,420-423.
71

CHAPTER 5. REFERENCES
139. Morlock, G.; Nedele, A.; Schwack, W. New planar chromatographic method for the analysis ofethyl carbamate. Euro Food Chem XIII - Proceedings 2005, 2, 513-516.
140. Jautz, U.; Morlock, G. Efficacy of planar chromatography coupled to (tandem)mass spectrom-etry for employment in trace analysis. J. Chromatogr. A 2006, 1128, 244-250.
141. Giachetti, C.; Assandri, A.; Zanolo, G. Gas chromatographic-mass spectrometric determinationof ethyl carbamate as the xanthylamide derivative in Italian aqua vitae (grappa) samples. J.
Chromatogr. 1991, 585, 111-115.
142. Herbert, P.; Santos, L.; Bastos, M.; Barros, P.; Alves, A. New HPLC method to determine ethylcarbamate in alcoholic beverages using fluorescence detection. Food Chem. Toxicol. 2002, 67,1616-1620.
143. Alpmann, A.; Morlock, G. Rapid and sensitive determination of acrylamide in drinking waterby planar chromatography and fluorescence detection. J. Sep. Sci. 2008, 31, 71-77.
144. Weideborg, M,; Källqvist, T.; Odegard, K.; Sverdrup, L.; Vik, E. Environmental risk assessmentof acrylamide and methylolacrylamide from a grouting agent used in the tunnel construction ofRomeriksporten, Norway. Water Res. 2001, 35, 2645-2652.
145. Cavalli, S.; Polesello, S.; Saccani, G. Determination of acrylamide in drinking water by large-volume direct injection and ion-exclusion chromatography-mass spectrometry. J. Chromatogr.
A 2004, 1039, 155-159.
146. US Environmental Agency, US EPA, SW 846, Method 8032A, Washington, DC 1996.
147. Kawata, K.; Ibaraki, T.; Tanabe, A.; Yagoh, H.; Shinoda, A.; Suzuki, H.; Yashura, A. Gaschromatographic-mass spectrometric determination of hydrophilic compounds in environmen-tal water by solid-phase extraction with activated carbon fiber felt. J. Chromatogr. A 2001,911, 75-83.
148. Marin, J.; Pozo, Ó.; Sancho, J.; Pitarch, E. Study of different atmospheric-pressure interfacesfor LC-MS/MS determination of acrylamide in water at sub-ppb levels. J. Mass Spectrom.
2006, 41, 1044-1048.
149. Scully, F., Yang, J., Mazina, K., Daniel, F. Derivatization of organic and inorganic N-chloraminesfor high-performance liquid chromatographic analysis of chlorinated water. Environ. Sci. Tech-
nol. 1984, 18, 787-792.
150. Alpmann, A.; Morlock, G. Improved online coupling of planar chromatography with electro-spray mass spectrometry: extraction of zones from glass plates. Anal. Bioanal. Chem. 2006,386, 1543-1551.
151. Deutsches Institut für Normung, DIN 38413-6, Beuth-Verlag, Berlin 2007.
72

CHAPTER 5. REFERENCES
152. Bermudo, E.; Moyano, E.; Puignou, L.; Galceran, M. T. Determination of acrylamide in food-stuffs by liquid chromatography ion-trap tandem mass-spectrometry using an improved clean-up procedure. Anal. Chim. Acta 2006, 559, 207-214.
153. Govaert, Y.; Arisseto, A.; Van Loco, J.; Scheers, E.; Fraselle S.; Weverbergh, E.; Degroodt, J.M.; Goeyens, L. Optimisation of a liquid chromatography - tandem mass spectrometric methodfor the determination of acrylamide in foods. Anal. Chim. Acta 2006, 556, 275-280.
154. Cheong Tae, K.; Eun-Sun, H.; Hyong Joo, L. An improved LC-MS/MS method for the quanti-tation of acrylamide in processed foods. Food Chemistry 2007, 101, 401-409.
155. Soares, C.; Cunha, S.; Fernandes, J. Determination of acrylamide in coffee and coffee productsby GC-MS using an improved SPE clean-up. Food Addit. Contam. 2006, 23, 1276-1282.
156. Alpmann, A.; Morlock, G. Rapid and sensitive determination of acrylamide in drinking waterby planar chromatography and fluorescence detection after derivatization with dansulfinic acid.J. Sep. Sci. 2008, 31, 71-77.
157. Aguas, P. C.; Fitzhenry, M. J.; Giannikopoulos, G.; Varelis, P. Analysis of acrylamide in cof-fee and cocoa by isotope dilution liquid chromatography-tandem mass spectrometry. Anal.
Bioanal. Chem. 2006, 385, 1526-1531.
73