trace analysis of pharmaceuticals and organic contaminants
TRANSCRIPT

Trace analysis of pharmaceuticals and organic contaminants in water
emerging contaminants constitute a health risk at these low levels, their presence is a concern to consumers. Thus, the industry is trying to make new point-of-use drinking water treatment products that can effectively remove these contaminants from municipal water. Reliable analytical methods and instrumentation to provide qualitative and quantitative analyses of these emerging contaminants at low ppt levels are of the utmost importance. In this application note, the reporting limit (RL) of a compound is about one-sixth to one-fourth of the Maximum Effluent Concentration (MEC) of the compound in potable water.1
Key wordsEnvironmental analysis, water analysis, drinking water, estrone, ibuprofen, nonylphenol, naproxen, trimethoprim, phenytoin, linuron, atenolol, PPCP, environmental monitoring, EQuan MAX Plus, TSQ Endura
GoalTo demonstrate the reliable and accurate quantitative analysis of contaminants at the pg/mL level in drinking water using the Thermo Scientific™ EQuan MAX Plus™ LC-MS system coupled to the Thermo Scientific™ TSQ Endura™ triple quadrupole mass spectrometer.
IntroductionThe presence of endocrine disrupting compounds (EDCs) and pharmaceuticals and personal care products (PPCPs) in surface water and ground water sources has been known for many years. Some of these emerging contaminants are hard to remove from the source water by current drinking water treatment techniques. Municipal water could contain trace amounts, typically part per trillion (ppt) level to part per billion (ppb) level, of certain EDCs and PPCPs. While no research results yet show that these
No
. 663
APPLICATION NOTE
Ken Matuszak, Kevin McHale, David Kage, Thermo Fisher Scientific, San Jose, CA
Guoxin Lu, Analytical Laboratory Manager, Water Quality Association, Lisle, IL
1Maximum Effluent Concentration (MEC) from NSF/ANSI Standard 401. The NSF/ANSI Standard sets challenge concentrations (influent concentrations) for each compound based upon the occurrence level of the contaminant in drinking water (municipal water) across the United States. In order to meet the standard, a point-of- use drinking water treatment product must remove at least 85% of the contaminant in the challenge water to meet the MEC in effluent water.
The EQuan MAX Plus LC-MS system combines a highly sensitive, online pre-concentration liquid chromatography system with the TSQ Endura triple quadrupole mass spectrometer to achieve low pg/mL level limits of quantitation with excellent quantitative reproducibility. Online pre-concentration and solid phase extraction (online SPE) avoids the disadvantages of offline SPE, including large sample volumes and preparation time, by utilizing a smaller sample volume collected in the field and eliminating the manual offline SPE step. Using this approach for analyzing for contaminants in drinking water can reduce the sample preparation time from many hours to a few minutes and still achieve ppt sensitivity.
ExperimentalThe EQuan MAX Plus LC-MS system was coupled to the TSQ Endura mass spectrometer.
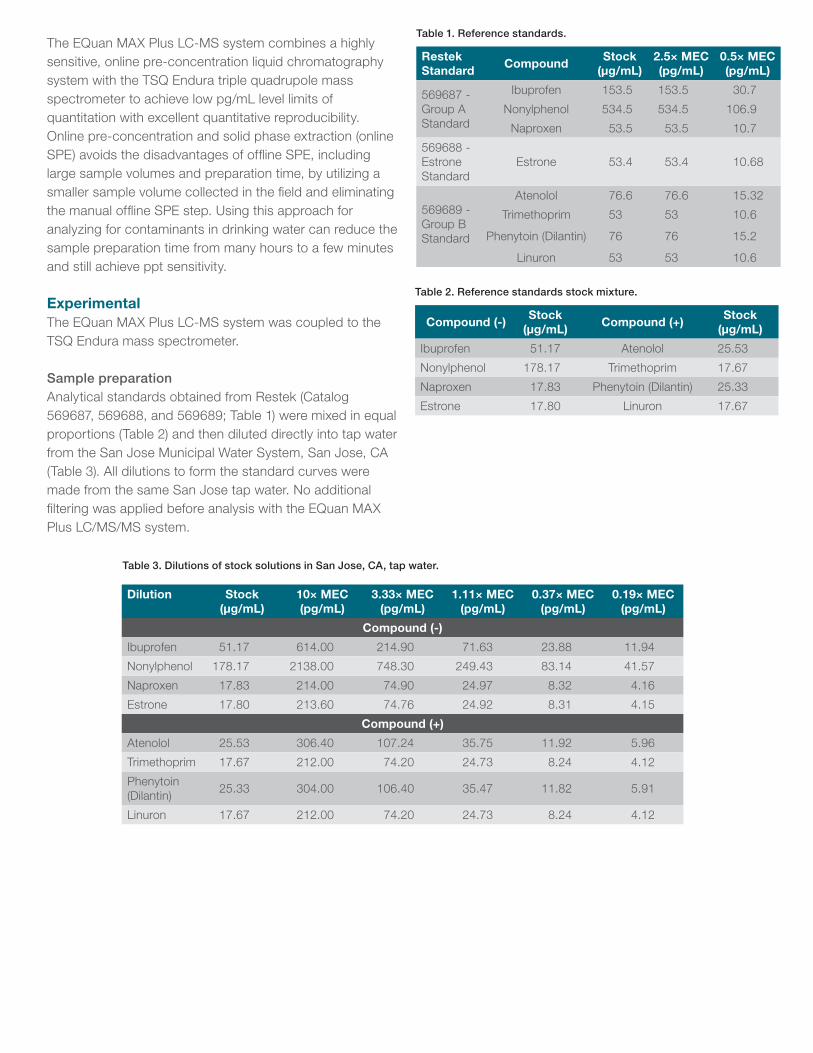
Sample preparationAnalytical standards obtained from Restek (Catalog 569687, 569688, and 569689; Table 1) were mixed in equal proportions (Table 2) and then diluted directly into tap water from the San Jose Municipal Water System, San Jose, CA (Table 3). All dilutions to form the standard curves were made from the same San Jose tap water. No additional filtering was applied before analysis with the EQuan MAX Plus LC/MS/MS system.
Table 1. Reference standards.
Restek Standard
CompoundStock
(µg/mL)2.5× MEC (pg/mL)
0.5× MEC (pg/mL)
569687 - Group A Standard
Ibuprofen 153.5 153.5 30.7
Nonylphenol 534.5 534.5 106.9
Naproxen 53.5 53.5 10.7
569688 - Estrone Standard
Estrone 53.4 53.4 10.68
569689 - Group B Standard
Atenolol 76.6 76.6 15.32
Trimethoprim 53 53 10.6
Phenytoin (Dilantin) 76 76 15.2
Linuron 53 53 10.6
Compound (-)Stock
(µg/mL)Compound (+)
Stock (µg/mL)
Ibuprofen 51.17 Atenolol 25.53
Nonylphenol 178.17 Trimethoprim 17.67
Naproxen 17.83 Phenytoin (Dilantin) 25.33
Estrone 17.80 Linuron 17.67
Table 2. Reference standards stock mixture.
Dilution Stock (µg/mL)
10× MEC (pg/mL)
3.33× MEC (pg/mL)
1.11× MEC (pg/mL)
0.37× MEC (pg/mL)
0.19× MEC (pg/mL)
Compound (-)
Ibuprofen 51.17 614.00 214.90 71.63 23.88 11.94
Nonylphenol 178.17 2138.00 748.30 249.43 83.14 41.57
Naproxen 17.83 214.00 74.90 24.97 8.32 4.16
Estrone 17.80 213.60 74.76 24.92 8.31 4.15
Compound (+)
Atenolol 25.53 306.40 107.24 35.75 11.92 5.96
Trimethoprim 17.67 212.00 74.20 24.73 8.24 4.12
Phenytoin (Dilantin)
25.33 304.00 106.40 35.47 11.82 5.91
Linuron 17.67 212.00 74.20 24.73 8.24 4.12
Table 3. Dilutions of stock solutions in San Jose, CA, tap water.

Eight target compounds were selected for the analysis (Figure 1). Of these, estrone, ibuprofen, nonylphenol and naproxen are suited to negative ion LC/MS/MS analyses, and trimethoprim, phenytoin, linuron, and atenolol are suited to positive ion LC/MS/MS analyses. Samples were prepared as described in Table 4 at several concentration levels based on the target MEC.
HPLC Water samples of 1 mL were directly injected onto a Thermo Scientific™ Hypersil GOLD™ aQ pre-concentration trapping column (2.1 × 20 mm, 12 µm, P/N 25302-022130)
at 1.5 mL/min with water + 0.1% formic acid for positive ion analysis and 1.5 mL/min with water for negative ion analysis. After sufficient washing on the pre-concentration column, the target compounds were transferred at 0.4 mL/min either to a Thermo Scientific™ Accucore™ aQ analytical column (2.1 × 100 mm, 2.6 µm, positive ion analysis, P/N 17326-102130) or a Thermo Scientific™ Hypersil GOLD™ aQ analytical column (2.1 × 100 mm, 3.0 µm, negative ion analysis, P/N 25302-102130) for chromatographic separation by gradient elution prior to introduction into the mass spectrometer (Table 5).
Figure 1. Target compounds.
Sample Concentration (pg/mL)
Compound Name
CAS # Sample #1 (Blank)
Sample #2 (0.5× MEC
Level)
Sample #3 (2.5× MEC
Level)
Sample #4 (5× MEC
Level)
Sample #5 (0.5× MEC
Level)
Sample #6 (2.5× MEC
Level)
Sample #7 (5× MEC
Level)
Group A
Estrone 53-16-7 0 11 53 106 0 0 0
Ibuprofen 15687-27-1 0 30 152 304 0 0 0
Nonylphenol 104-40-5 0 106 532 1064 0 0 0
Naproxen 22204-53-1 0 11 53 106 0 0 0
Trimethoprim 738-70-5 0 0 0 0 11 53 106
Group BPhenytoin (Dilantin)
57-41-0 0 0 0 0 15 76 152
Linuron 330-55-2 0 0 0 0 11 53 106
Atenolol 29122-68-7 0 0 0 0 15 76 152
Table 4. Sample composition.
EstroneC
18H
22O
2
MW = 270.1614269 → 145
IbuprofenC
13H
18O
2
MW = 206.1301205 → 161
NonylphenolC
15H
24O
MW = 220.1822219 → 106
NaproxenC
14H
14O
3
MW = 230.0937229 →170
TrimethoprimC
14H
18N
4O
3
MW = 290.1373291 → 123
PhenytoinC
15H
12N
2O
2
MW = 252.0893253 → 182, 225, 104
LinuronC
9H
10C
12N
2O
2
MW = 248.0114249 → 160, 182
AtenololC
14H
22N
2O
3
MW = 266.1625267 → 145, 190
(-)
(+)
HO
CH3
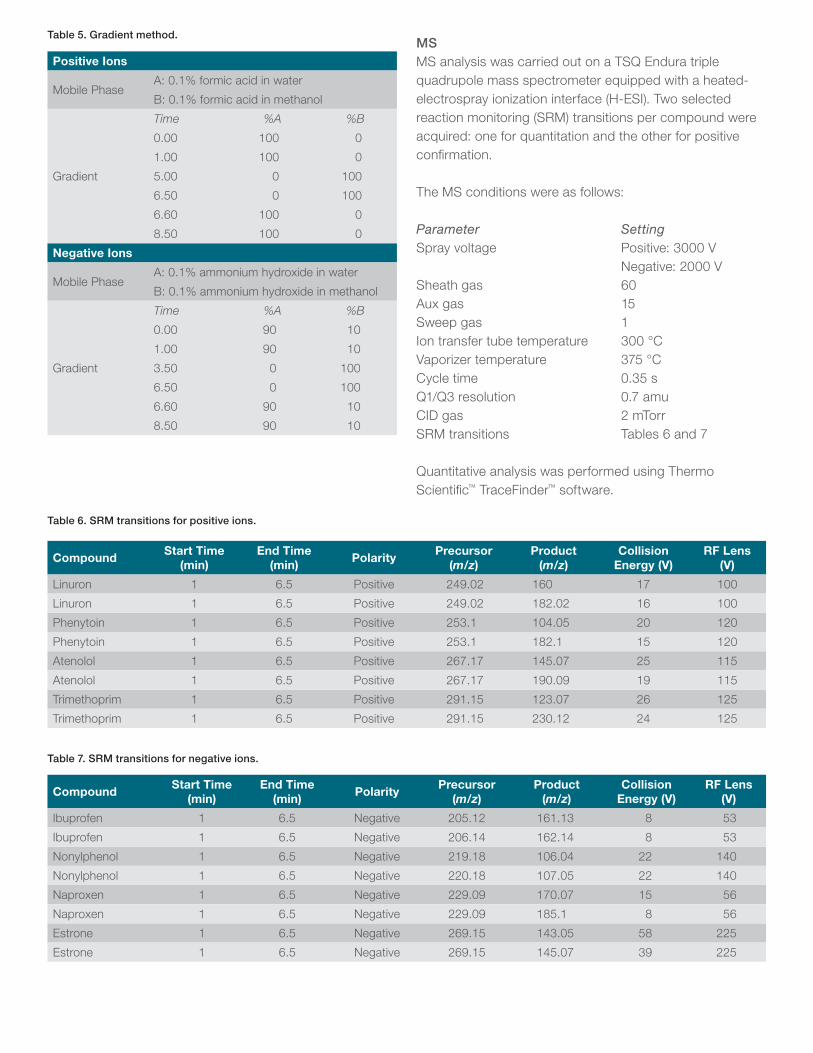
MS MS analysis was carried out on a TSQ Endura triple quadrupole mass spectrometer equipped with a heated-electrospray ionization interface (H-ESI). Two selected reaction monitoring (SRM) transitions per compound were acquired: one for quantitation and the other for positive confirmation.
The MS conditions were as follows:
Parameter SettingSpray voltage Positive: 3000 V Negative: 2000 VSheath gas 60Aux gas 15Sweep gas 1Ion transfer tube temperature 300 °CVaporizer temperature 375 °CCycle time 0.35 sQ1/Q3 resolution 0.7 amuCID gas 2 mTorrSRM transitions Tables 6 and 7
Quantitative analysis was performed using Thermo Scientific™ TraceFinder™ software.
Table 5. Gradient method.
Positive Ions
Mobile PhaseA: 0.1% formic acid in water
B: 0.1% formic acid in methanol
Time %A %B
0.00 100 0
1.00 100 0
Gradient 5.00 0 100
6.50 0 100
6.60 100 0
8.50 100 0
Negative Ions
Mobile PhaseA: 0.1% ammonium hydroxide in water
B: 0.1% ammonium hydroxide in methanol
Time %A %B
0.00 90 10
1.00 90 10
Gradient 3.50 0 100
6.50 0 100
6.60 90 10
8.50 90 10
CompoundStart Time
(min)End Time
(min)Polarity
Precursor (m/z)
Product (m/z)
Collision Energy (V)
RF Lens (V)
Linuron 1 6.5 Positive 249.02 160 17 100
Linuron 1 6.5 Positive 249.02 182.02 16 100
Phenytoin 1 6.5 Positive 253.1 104.05 20 120
Phenytoin 1 6.5 Positive 253.1 182.1 15 120
Atenolol 1 6.5 Positive 267.17 145.07 25 115
Atenolol 1 6.5 Positive 267.17 190.09 19 115
Trimethoprim 1 6.5 Positive 291.15 123.07 26 125
Trimethoprim 1 6.5 Positive 291.15 230.12 24 125
Table 6. SRM transitions for positive ions.
Table 7. SRM transitions for negative ions.
CompoundStart Time
(min)End Time
(min)Polarity
Precursor (m/z)
Product (m/z)
Collision Energy (V)
RF Lens (V)
Ibuprofen 1 6.5 Negative 205.12 161.13 8 53
Ibuprofen 1 6.5 Negative 206.14 162.14 8 53
Nonylphenol 1 6.5 Negative 219.18 106.04 22 140
Nonylphenol 1 6.5 Negative 220.18 107.05 22 140
Naproxen 1 6.5 Negative 229.09 170.07 15 56
Naproxen 1 6.5 Negative 229.09 185.1 8 56
Estrone 1 6.5 Negative 269.15 143.05 58 225
Estrone 1 6.5 Negative 269.15 145.07 39 225

Results and discussionExample SRM chromatograms for Group A (positive ion) and Group B (negative ion) compounds at 10× MEC are shown in Figure 2 and Figure 3, respectively. For ibuprofen
Figure 3. Negative ion SRM chromatograms (10× MEC).
Figure 2. Positive ion SRM chromatograms (10× MEC).
and nonylphenol, a second product ion was not observed. Instead for demonstration purposes, the A+1 isotope was fragmented and its product ion was used as the confirming ion.
Atenolol m/z 267 → 145
Atenolol m/z 267 → 190
Trimethoprim m/z 291 → 230
Trimethoprim m/z 291 → 123
Phenytoin m/z 253 → 182
Phenytoin m/z 253 → 104
Linuron m/z 249 → 182
Linuron m/z 249 → 160
Naproxen m/z 229 → 170
Estrone m/z 269 → 143
Estrone m/z 269 → 145
Nonylphenol m/z 219 → 106
Nonylphenol m/z 220 → 107
Naproxen m/z 229 → 185
Ibuprofen m/z 205 → 161
Ibuprofen m/z 206 → 162

Calibration curves for target organic contaminants in tap water are shown in Figures 4 and 5, which demonstrate performance to levels below MEC.
Atenolol
Phenytoin Linuron
Trimethoprim
Naproxen
Ibuprofen Nonylphenol
Estrone
Figure 4. Standard calibration curves for postive ion compounds.
Figure 5. Standard calibration curves for negative ion compounds.
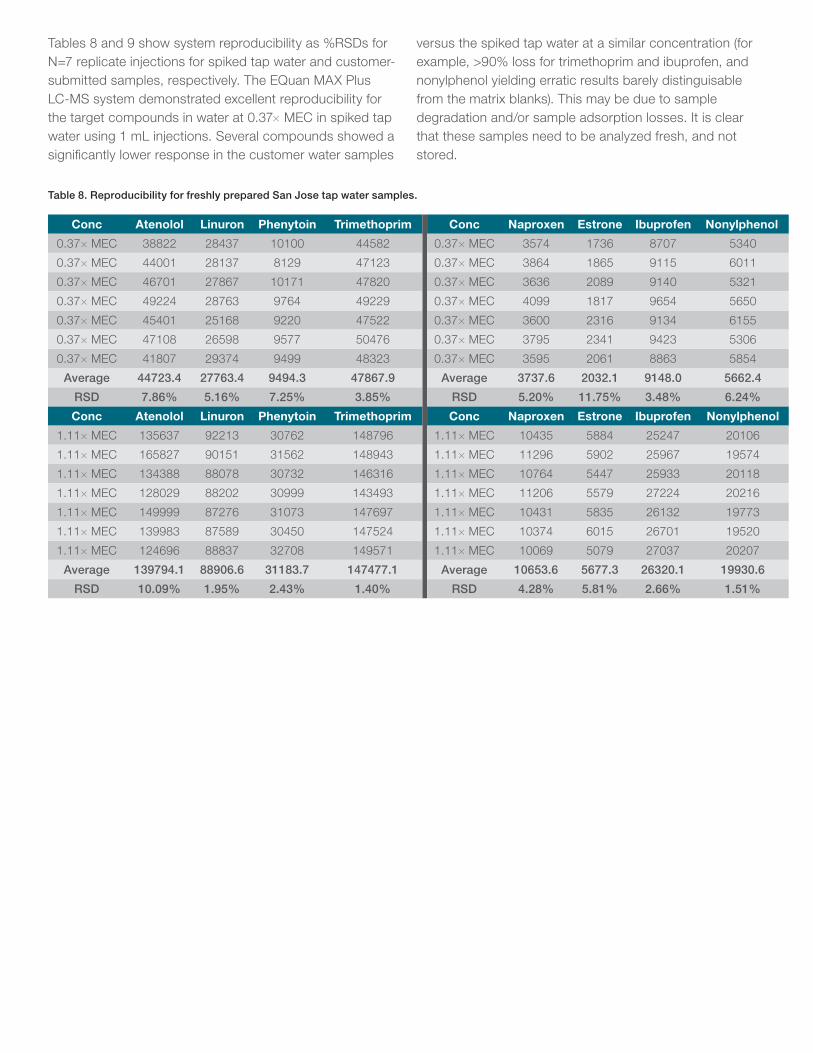
Table 8. Reproducibility for freshly prepared San Jose tap water samples.
Tables 8 and 9 show system reproducibility as %RSDs for N=7 replicate injections for spiked tap water and customer-submitted samples, respectively. The EQuan MAX Plus LC-MS system demonstrated excellent reproducibility for the target compounds in water at 0.37× MEC in spiked tap water using 1 mL injections. Several compounds showed a significantly lower response in the customer water samples
versus the spiked tap water at a similar concentration (for example, >90% loss for trimethoprim and ibuprofen, and nonylphenol yielding erratic results barely distinguisable from the matrix blanks). This may be due to sample degradation and/or sample adsorption losses. It is clear that these samples need to be analyzed fresh, and not stored.
Conc Atenolol Linuron Phenytoin Trimethoprim Conc Naproxen Estrone Ibuprofen Nonylphenoll
0.37× MEC 38822 28437 10100 44582 0.37× MEC 3574 1736 8707 5340
0.37× MEC 44001 28137 8129 47123 0.37× MEC 3864 1865 9115 6011
0.37× MEC 46701 27867 10171 47820 0.37× MEC 3636 2089 9140 5321
0.37× MEC 49224 28763 9764 49229 0.37× MEC 4099 1817 9654 5650
0.37× MEC 45401 25168 9220 47522 0.37× MEC 3600 2316 9134 6155
0.37× MEC 47108 26598 9577 50476 0.37× MEC 3795 2341 9423 5306
0.37× MEC 41807 29374 9499 48323 0.37× MEC 3595 2061 8863 5854
Average 44723.4 27763.4 9494.3 47867.9 Average 3737.6 2032.1 9148.0 5662.4
RSD 7.86% 5.16% 7.25% 3.85% RSD 5.20% 11.75% 3.48% 6.24%
Conc Atenolol Linuron Phenytoin Trimethoprim Conc Naproxen Estrone Ibuprofen Nonylphenol
1.11× MEC 135637 92213 30762 148796 1.11× MEC 10435 5884 25247 20106
1.11× MEC 165827 90151 31562 148943 1.11× MEC 11296 5902 25967 19574
1.11× MEC 134388 88078 30732 146316 1.11× MEC 10764 5447 25933 20118
1.11× MEC 128029 88202 30999 143493 1.11× MEC 11206 5579 27224 20216
1.11× MEC 149999 87276 31073 147697 1.11× MEC 10431 5835 26132 19773
1.11× MEC 139983 87589 30450 147524 1.11× MEC 10374 6015 26701 19520
1.11× MEC 124696 88837 32708 149571 1.11× MEC 10069 5079 27037 20207
Average 139794.1 88906.6 31183.7 147477.1 Average 10653.6 5677.3 26320.1 19930.6
RSD 10.09% 1.95% 2.43% 1.40% RSD 4.28% 5.81% 2.66% 1.51%
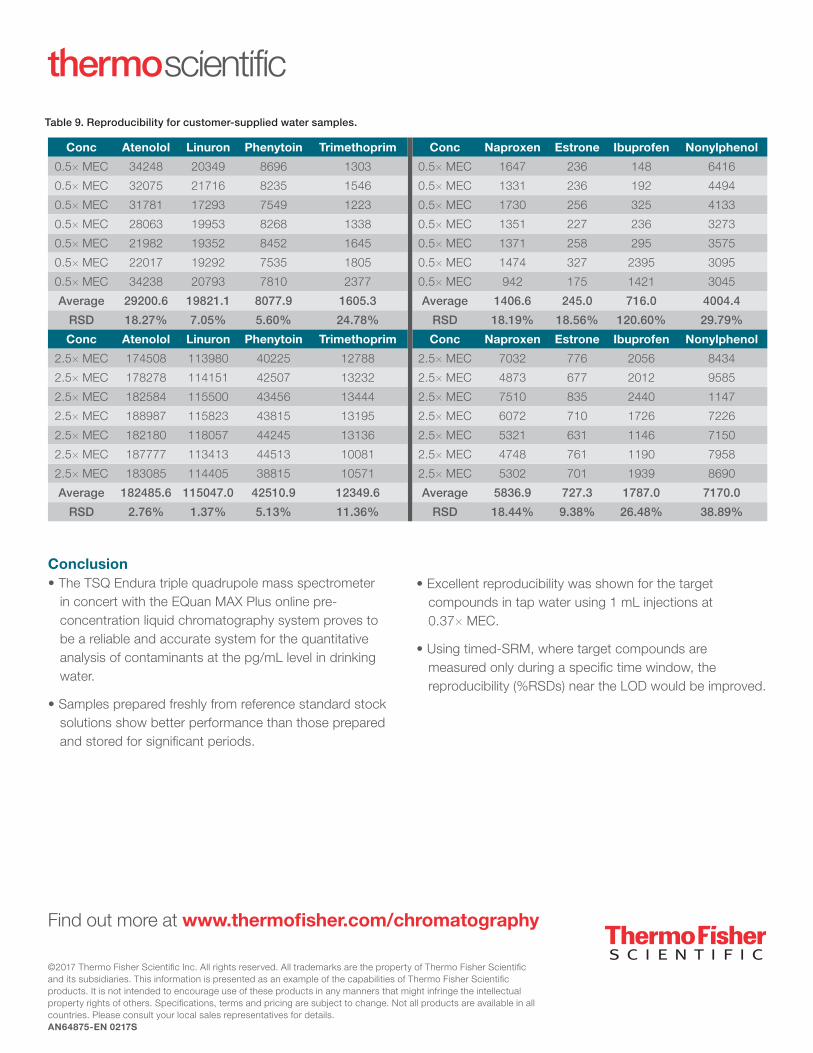
• Excellent reproducibility was shown for the target compounds in tap water using 1 mL injections at 0.37× MEC.
• Using timed-SRM, where target compounds are measured only during a specific time window, the reproducibility (%RSDs) near the LOD would be improved.
Find out more at www.thermofisher.com/chromatography
©2017 Thermo Fisher Scientific Inc. All rights reserved. All trademarks are the property of Thermo Fisher Scientific and its subsidiaries. This information is presented as an example of the capabilities of Thermo Fisher Scientific products. It is not intended to encourage use of these products in any manners that might infringe the intellectual property rights of others. Specifications, terms and pricing are subject to change. Not all products are available in all countries. Please consult your local sales representatives for details. AN64875-EN 0217S
Conclusion• The TSQ Endura triple quadrupole mass spectrometer
in concert with the EQuan MAX Plus online pre-concentration liquid chromatography system proves to be a reliable and accurate system for the quantitative analysis of contaminants at the pg/mL level in drinking water.
• Samples prepared freshly from reference standard stock solutions show better performance than those prepared and stored for significant periods.
Table 9. Reproducibility for customer-supplied water samples.
Conc Atenolol Linuron Phenytoin Trimethoprim Conc Naproxen Estrone Ibuprofen Nonylphenol
0.5× MEC 34248 20349 8696 1303 0.5× MEC 1647 236 148 6416
0.5× MEC 32075 21716 8235 1546 0.5× MEC 1331 236 192 4494
0.5× MEC 31781 17293 7549 1223 0.5× MEC 1730 256 325 4133
0.5× MEC 28063 19953 8268 1338 0.5× MEC 1351 227 236 3273
0.5× MEC 21982 19352 8452 1645 0.5× MEC 1371 258 295 3575
0.5× MEC 22017 19292 7535 1805 0.5× MEC 1474 327 2395 3095
0.5× MEC 34238 20793 7810 2377 0.5× MEC 942 175 1421 3045
Average 29200.6 19821.1 8077.9 1605.3 Average 1406.6 245.0 716.0 4004.4
RSD 18.27% 7.05% 5.60% 24.78% RSD 18.19% 18.56% 120.60% 29.79%
Conc Atenolol Linuron Phenytoin Trimethoprim Conc Naproxen Estrone Ibuprofen Nonylphenol
2.5× MEC 174508 113980 40225 12788 2.5× MEC 7032 776 2056 8434
2.5× MEC 178278 114151 42507 13232 2.5× MEC 4873 677 2012 9585
2.5× MEC 182584 115500 43456 13444 2.5× MEC 7510 835 2440 1147
2.5× MEC 188987 115823 43815 13195 2.5× MEC 6072 710 1726 7226
2.5× MEC 182180 118057 44245 13136 2.5× MEC 5321 631 1146 7150
2.5× MEC 187777 113413 44513 10081 2.5× MEC 4748 761 1190 7958
2.5× MEC 183085 114405 38815 10571 2.5× MEC 5302 701 1939 8690
Average 182485.6 115047.0 42510.9 12349.6 Average 5836.9 727.3 1787.0 7170.0
RSD 2.76% 1.37% 5.13% 11.36% RSD 18.44% 9.38% 26.48% 38.89%