trace the guns - mayors against illegal guns
TRANSCRIPT

TRACE THE GUNS
THE LINK BETWEEN GUN LAWS AND INTERSTATE GUN TRAFFICKING
SEPTEMBER 2010

TRACE THE GUNS
THE LINK BETWEEN GUN LAWS AND INTERSTATE GUN TRAFFICKING
A REPORT FROM MAYORS AGAINST ILLEGAL GUNSSEPTEMBER 2010
www.MayorsAgainstIllegalGuns.orgwww.TraceTheGuns.org

© 2010. Mayors Against Illegal Guns. All Rights Reserved.

Executive Summary .....................................................................................................
Part I: Trace Data and the Scope of Interstate Gun Trafficking .......................
Part II: Identifying the Rates at Which States “Export” Crime Guns .............
Part III: A Key Indicator of Trafficking: Short Time-To-Crime ..............................
Part IV: The Relationship Between Gun Laws and Gun Trafficking ...............A. State Criminal Penalties: Straw Purchasing, Falsifying Purchaser Information, and Failing to Conduct Dealer Background Checks ..............................B. Background Checks for All Handgun Sales at Gun Shows ........................................C. Purchase Permits for All Handgun Sales ....................................................................D. Local Law Enforcement Discretion to Approve or Deny Concealed Carry Permits .....E. Gun Possession by Violent Misdemeanants ................................................................F. Reporting Lost or Stolen Guns to Law Enforcement ..................................................G. Local Control of Firearms Regulations .......................................................................H. State Inspection of Gun Dealers ..................................................................................Chart of Laws Examined ...................................................................................................
Conclusion .....................................................................................................................
Appendix I: Methodological Considerations ........................................................Appendix II: Summary of State Gun Exports .......................................................Appendix III: Understanding How an ATF Crime Gun Trace Works ...............Appendix IV: TraceTheGuns.org ..............................................................................
Endnotes ........................................................................................................................
2
4
6
8
10 111416182022242628
29 31333435
36
TABLE OF CONTENTS

Every year, tens of thousands of guns make their way into the hands of criminals through illegal trafficking channels. These firearms contribute to the more than 12,000 gun murders in the United States each year.1 This report seeks to explain where crime guns originate, where they are recovered in crimes, and whether state gun laws help curb the flow of these illegal weapons.
Trace the Guns updates prior analyses2 and examines data on the following:
The number of crime guns sold in each state and recovered in out-of-state crimes;• The states that are the top sources of crime guns recovered from crime scenes shortly • after their initial purchase – a measure, called “Time-to-Crime,” considered by the Bureau of Alcohol, Tobacco, Firearms and Explosives (“ATF”) to be a key indicator of gun trafficking; andThe association between state laws designed to deter gun trafficking and the • movement of illegal guns across state lines.
Taken together, this report seeks to present a comprehensive analysis of gun trafficking patterns throughout the United States. The key to understanding gun trafficking lies in “crime gun trace data” gathered by ATF. Gun traces occur when law enforcement requests that ATF provide purchase history information about a gun that is recovered from a crime scene. Gun traces reveal how, where, and by whom each individual crime gun was originally purchased. This information is an important resource for law enforcement because individual traces aid ongoing criminal investigations, while aggregated trace data paints a national picture about which states are the most frequent sources of guns recovered in crimes. This report has four key findings:
I. In 2009, just ten states supplied nearly half – 49% – of the guns that crossed state lines before being recovered in crimes. Together, these states accounted for nearly 21,000 interstate crime guns recovered in 2009.
II. When controlling for population, Mississippi, West Virginia, Kentucky,
Alaska, Alabama, South Carolina, Virginia, Indiana, Nevada, and Georgia export crime guns at the highest rates. These states export crime guns at more than seven times the rate of the ten states with the lowest crime gun export rates.
EXECUTIVE SUMMARY
2 TRACE THE GUNS: THE LINK BETWEEN GUN LAWS AND INTERSTATE GUN TRAFFICKING

A REPORT FROM MAYORS AGAINST ILLEGAL GUNS 3
III. The ten states that export crime guns at the highest rates also supply a greater proportion of guns that are likely to have been trafficked. Time-to-Crime (“TTC”) measures the time between a gun’s initial retail sale and its recovery in a crime – and according to ATF, a crime gun with a TTC of less than two years (a “short TTC”) is more likely to have been illegally trafficked.3
IV. There is a strong association between a state’s gun laws and that state’s propensity to export crime guns. There is also a strong association between a state’s gun laws and that state’s propensity to be a source of short TTC crime guns. Ten gun laws are examined in this analysis. In each case, states that have enacted these gun laws are associated with lower crime gun export rates and a smaller proportion of crime guns with a short TTC. The ten states that supply guns at the highest rates have, on average, only 1.6 of these regulations in place, whereas in the ten states that supply interstate crime guns at the lowest rates, the average is 8.4.
These findings rely on an analysis of aggregate trace data, which documents: (1) the numbers of guns recovered in crimes, (2) the types of guns recovered in crimes, (3) the states where those crime guns were originally sold, (4) the states where those crime guns were recovered, and (5) the TTC of those recovered crime guns. The data come from two sources: trace data published by ATF in April 2010 and previously unreleased trace data provided by ATF to Mayors Against Illegal Guns.4
This report concludes that certain gun laws are an important component in reducing criminal access to firearms.

According to ATF, virtually all guns recovered in crimes were originally sold by licensed gun dealers (“Federal Firearm Licensees” or “FFLs”) within the U.S.5 These guns enter the illegal market through a number of channels, including theft and robbery, gun dealers who participate in illegal or negligent sales, straw purchasers who buy guns on behalf of criminals, and subsequent sales by unlicensed, private sellers at gun shows and elsewhere, who are not required by federal law to conduct background checks.
When a gun is recovered from a crime scene, law enforcement can ask ATF to initiate a trace to identify the gun dealer who first sold the gun and the person who bought it. In the process, ATF identifies the state where the gun was first sold at retail (“source state”) and the state where the crime gun was recovered at a crime scene (“recovery state”).6 ATF can also calculate the gun’s Time-to-Crime (“TTC”) – the time between its initial sale and crime gun recovery – to determine which guns are most likely to have been trafficked, and identify the exact makes and models of the guns recovered.
In 2009, of the 238,107 guns that were recovered at crime scenes in the U.S. and submitted for tracing, ATF successfully identified the source states for 145,321 traced guns – or 61% of the attempted traces. As the chart below shows, 43,254 of these guns, or 30%, crossed state lines before they were recovered in crimes.7
PART I: TRACE DATA AND THE SCOPE OF INTERSTATE GUN TRAFFICKING
Crime Guns Traced in 2009
Traced Guns Purchased and Recovered in the Same State 70% 102,067
Traced Guns Purchased in One State and Recovered in Another 30% 43,254
Total 145,321
4 TRACE THE GUNS: THE LINK BETWEEN GUN LAWS AND INTERSTATE GUN TRAFFICKING

A REPORT FROM MAYORS AGAINST ILLEGAL GUNS 5
In 2009, just ten states supplied nearly half – 49% – of the crime guns that crossed state lines. Year after year, many of the same states are the top sources for interstate crime guns. In fact, over the past four years, nine of the top ten source states – Georgia, Florida, Virginia, Texas, Indiana, Ohio, Pennsylvania, North Carolina, and California – have remained the same, as highlighted in red in the chart below.
The figures above report the raw numbers of crime guns that cross state lines and are recovered in the United States, but raw numbers do not tell the whole story. States with larger populations can be expected to be a source of more crime guns. Therefore, to more precisely identify the states that are disproportionately large suppliers of interstate crime guns, this report controls for state population. Controlling for population produces a crime gun “export rate,” or the number of crime guns recovered in states other than their purchase state, per 100,000 inhabitants.
Top Ten Interstate Crime Gun Suppliers
2009 2008 2007 2006Source State
Guns Exported
Source State
Guns Exported
Source State
Guns Exported
Source State
Guns Exported
1. Georgia 2,781 1. Georgia 2,984 1. Georgia 2,834 1. Georgia 2,9322. Florida 2,640 2. Virginia 2,766 2. Virginia 2,612 2. Virginia 2,5923. Virginia 2,557 3. Florida 2,734 3. Florida 2,482 3. Texas 2,4854. Texas 2,240 4. Texas 2,450 4. Texas 2,476 4. Florida 2,3645. Indiana 2,011 5. Indiana 2,062 5. California 2,111 5. Indiana 2,1446. Ohio 1,806 6. N. Carolina 1,964 6. N. Carolina 2,063 6. California 2,0837. Pennsylvania 1,777 7. Ohio 1,947 7. Ohio 2,002 7. Ohio 2,0578. N. Carolina 1,775 8. California 1,916 8. Indiana 1,998 8. N. Carolina 1,9509. California 1,772 9. Pennsylvania 1,826 9. Pennsylvania 1,845 9. Mississippi 1,90110. Arizona 1,637 10. Mississippi 1,811 10. Mississippi 1,832 10. Pennsylvania 1,896
Total Interstate Crime Guns From Top Ten Source States
20,996 Total Interstate Crime Guns From Top Ten Source States
22,460 Total Interstate Crime Guns From Top Ten Source States
22,255 Total Interstate Crime Guns From Top Ten Source States
22,404
Percent of Total Interstate Crime Guns From Top Ten Source States
48.5% Percent of Total Interstate Crime Guns From Top Ten Source States
48.3% Percent of Total Interstate Crime Guns From Top Ten Source States
48.9% Percent of Total Interstate Crime Guns From Top Ten Source States
48.0%

A handful of states supply guns recovered in out-of-state crimes at disproportionately high rates. Interstate crime gun export rates measure the number of traced guns initially purchased in one state but recovered from crime scenes in another, controlling for the population of the state where the gun was purchased. This measurement identifies which states are the highest per capita exporters of guns recovered in out-of-state crimes.
2009 Interstate Export Rate Rankings (Highest to Lowest)
Source State
Crime Guns Exported
per 100,000 inhabitants
Source State
Crime Guns Exported
per 100,000 inhabitants
1. Mississippi 50.3 27. Ohio 15.62. West Virginia 46.8 28. South Dakota 14.83. Kentucky 34.9 29. Florida 14.24. Alaska 33.4 National Average 14.15. Alabama 33.2 30. Pennsylvania 14.16. South Carolina 33.0 31. Utah 13.87. Virginia 32.4 32. Colorado 13.78. Indiana 31.3 33. Maryland 11.99. Nevada 30.6 34. Washington 11.910. Georgia 28.3 35. North Dakota 11.011. Arkansas 26.6 36. Wisconsin 10.012. Wyoming 25.9 37. Missouri 10.013. Arizona 24.8 38. Iowa 9.614. Montana 24.2 39. Texas 9.015. Louisiana 23.7 40. Nebraska 8.716. Vermont 22.8 41. Connecticut 6.917. New Mexico 21.7 42. Michigan 6.918. Idaho 19.3 43. Illinois 6.519. Oklahoma 19.0 44. Rhode Island 6.320. North Carolina 18.9 45. Minnesota 6.121. Kansas 18.8 46. California 4.822. Tennessee 18.6 47. Massachusetts 3.623. Delaware 18.5 48. New Jersey 2.824. New Hampshire 18.3 49. New York 2.625. Maine 16.9 50. Hawaii 2.326. Oregon 16.9 51. District of Columbia 2.2
States in red indicate the ten states with the highest rate of guns recovered in out-of-state crimes, using population as a control.
States in green indicate the ten states with the lowest rate of guns recovered in out-of-state crimes, using population as a control.
In 2009, the national average export rate was 14.1 crime gun exports per 100,000 inhabitants.8 The ten states with the highest export rates averaged 33.4 crime guns exported per 100,000 inhabitants, while the ten states with the lowest export rates averaged 4.6 crime guns per 100,000 inhabitants. The top ten per capita suppliers of crime guns have export rates more than double the national average and more than seven times the average rate of the ten states with the lowest export rates.
6 TRACE THE GUNS: THE LINK BETWEEN GUN LAWS AND INTERSTATE GUN TRAFFICKING
PART II: IDENTIFYING THE RATES AT WHICH STATES “EXPORT” CRIME GUNS

PART III: A KEY INDICATOR OF TRAFFICKING: ShoRT TIME-To-CRIME
A REPORT FROM MAYORS AGAINST ILLEGAL GUNS 7
The variable export rate suggests that gun traffickers favor certain states as sources of crime guns. In addition, states that export crime guns at higher rates tend to import fewer crime guns, possibly because those states have a robust, internal market for traffickers and criminals. In 2009, in the ten states with the highest export rates, only 22.9% of guns recovered in crimes in those states were imported, or originally purchased in other states. This figure is significantly below the national average of 30%. However, in the ten states with the lowest export rate, 44.1% of the crime guns recovered in those states were imported from other states.
As the table below indicates, this pattern also emerges when examining the ratio of each state’s crime gun exports to imports. The ten states with the highest export rates are net exporters of crime guns. In addition, eight of the ten states with the lowest export rates are among the ten states with the lowest ratio of exports to imports.
States in red indicate the ten states with the highest rate of guns recovered in out-of-state crimes, using population as a control.
States in green indicate the ten states with the lowest rate of guns recovered in out-of-state crimes, using population as a control.
State-by-State Ratios of Crime Gun Exports to Imports
StateCrime Gun
Exports
Crime Gun
Imports
Ratio of Crime Gun Exports to
Imports
StateCrime Gun
Exports
Crime Gun
Imports
Ratio of Crime Gun Exports to
Imports1. Arkansas 769 109 7.1:1 27. Ohio 1806 1391 1.3:12. Mississippi 1485 286 5.2:1 28. Oregon 645 525 1.2:13. Maine 223 58 3.8:1 29. Texas 2240 1854 1.2:14. West Virginia 852 224 3.8:1 30. Iowa 288 245 1.2:15. Wyoming 141 43 3.3:1 31. Washington 794 688 1.2:16. Utah 384 124 3.1:1 32. Wisconsin 568 514 1.1:17. South Dakota 120 39 3.1:1 33. Tennessee 1171 1063 1.1:18. Indiana 2011 660 3.0:1 34. Louisiana 1065 1019 1:19. New Hampshire 242 80 3.0:1 35. Nevada 808 781 1:110. South Carolina 1504 505 3.0:1 36. Florida 2640 2655 1:111. Alaska 233 81 2.9:1 37. North Carolina 1775 2103 1:1.212. Vermont 142 50 2.8:1 38. Connecticut 243 293 1:1.213. Kentucky 1504 566 2.7:1 39. Minnesota 319 392 1:1.214. Virginia 2557 984 2.6:1 40. Delaware 164 211 1:1.315. Alabama 1561 619 2.5:1 41. Nebraska 157 226 1:1.416. Montana 236 97 2.4:1 42. Missouri 598 938 1:1.617. Idaho 298 124 2.4:1 43. Rhode Island 66 104 1:1.618. Hawaii 30 13 2.3:1 44. Michigan 684 1173 1:1.7
19. Kansas 531 248 2.1:1 45. Maryland 681 1707 1:2.5
20. Oklahoma 699 351 2.0:1 46. California 1772 4462 1:2.5
21. Colorado 690 347 2.0:1 47. Massachusetts 239 689 1:2.9
22. New Mexico 437 237 1.8:1 48. Illinois 844 3643 1:4.3
23. Georgia 2781 1717 1.6:1 49. New York 517 3607 1:7.0
24. Pennsylvania 1777 1142 1.6:1 50. New Jersey 242 1792 1:7.4
25. Arizona 1637 1111 1.5:1 51. District of Columbia 13 978 1:75.2
26. North Dakota 71 52 1.4:1

8 TRACE THE GUNS: THE LINK BETWEEN GUN LAWS AND INTERSTATE GUN TRAFFICKING
The wide range in export rates suggests that criminals and gun traffickers may favor certain states as the sources of guns. This conclusion is supported by newly available data describing which states are the sources of guns most likely to have been trafficked. This data, called “Time-to-Crime” or “TTC,” measures the amount of time between a firearm’s initial sale by an FFL and the date it was recovered at a crime scene.9 Although only a criminal investigation and prosecution can reveal with certainty whether a crime gun was trafficked (as opposed to, for example, a lawful owner who moves to another state with a gun that is later stolen), a short TTC is one key indication that a gun was trafficked and is a tool used by law enforcement to target gun trafficking investigations. If a crime gun has a TTC of less than two years (a “short TTC”), ATF considers this to be a “strong indicator” that the crime gun was illegally trafficked.10
Two important measures analyzed by this report are: (1) the proportion of short TTC guns originating from a state, and (2) the average TTC for all traced guns originating from a state. If a state has a low average TTC or a large proportion of short TTC (less than two years) guns, these are indications that gun traffickers may favor that state as a source of guns. This additional analysis is possible because ATF has provided to Mayors Against Illegal Guns previously unpublished TTC data on guns originating from each state.11
The data show an association between export rates and TTC: the higher a state’s crime gun export rate, the lower the TTC of the guns it exports. As with export rates, certain states stand out as the top sources of short TTC guns. Nationally, 22.6% of all crime guns have a short TTC and the average TTC for all traced guns is 10.8 years. The ten states that supply interstate crime guns at the highest rates are a source of a greater proportion of crime guns with a short TTC and have a shorter average TTC than the states with the lowest export rates. For guns originating from the top ten export states, 24.3% have a short TTC. For guns from the bottom ten states, however, that portion is only 13.8%.
PART III: A KEY INDICATOR OF TRAFFICKING: ShoRT TIME-To-CRIME

15
12
9
6
3
0
The ten states with the lowest export rates are District of Colombia, Hawaii, New York, New Jersey, Massachusetts, California, Minnesota, Rhode Island, Illinois, and Michigan.
The ten states with the highest export rates are Mississippi, West Virginia, Kentucky, Alaska, Alabama, South Carolina, Virginia, Indiana, Nevada, and Georgia.
Ten States with Highest Export Rates
Ten States with Highest Export Rates
Ten States with Lowest Export Rates
Ten States with Lowest Export Rates
Average Time-to-Crime
(Years)
22.6%National Average
10.8National Average
13.8%
14.1
24.3%
9.9
25%
20%
15%
10%
5%
0%
Relationship Between Crime Gun Export Rates and Proportion of Crime Guns with a Short Time-to-Crime
Relationship Between Crime Gun Export Rates and Average Time-to-Crime
Moreover, the average TTC of the ten states that export crime guns at the lowest rates is 14.1 years, while the average TTC of the ten states that export crime guns at the highest rates is 9.9 years. This average TTC data provides an alternative method to assess which states are the top sources of crime guns most likely to have been trafficked. However, this report primarily relies on the proportion of short TTC crime guns originating from a state because ATF has specifically identified a short TTC as a key indicator of gun trafficking.
Proportion of Crime Guns with a Short
Time-to-Crime(Less Than Two Years
Between Origi-nal Purchase and Recovery
in a Crime)
A REPORT FROM MAYORS AGAINST ILLEGAL GUNS 9

10 TRACE THE GUNS: THE LINK BETWEEN GUN LAWS AND INTERSTATE GUN TRAFFICKING
Crime gun export rates and Time-to-Crime both suggest that certain states are consistently the top sources of interstate crime guns. To understand why those states attract gun traffickers, this report compares states that have enacted ten gun laws to states that have not enacted these laws by using two different measures: crime gun export rate and the proportion of short TTC guns originating from the state. The laws examined are:
A. State Criminal Penalties for: Straw Purchasing, • Falsifying Purchaser Information, and • Failing to Conduct Dealer Background Checks; •
B. Background Checks for All Handgun Sales at Gun Shows;C. Purchase Permits for All Handgun Sales;12
D. Local Law Enforcement Discretion to Approve or Deny Concealed Carry Permits; E. Gun Possession By Violent Misdemeanants;F. Reporting Lost or Stolen Guns to Law Enforcement;G. Local Control of Firearms Regulations; andH. State Inspection of Gun Dealers.
These laws were selected based on discussions with mayors, other policy-makers, and current and former law enforcement officials and represent a larger set than the five laws previously analyzed by Mayors Against Illegal Guns in its 2008 report, The Movement of Illegal Guns in America. In the discussions, law enforcement officials and policy leaders consistently cited these laws as critical to curbing illegal firearms trafficking in their towns, cities, and states. Each of the ten laws are strongly associated with lower crime gune export rates and a smaller proportion of short TTC guns.13
PART IV: THE RELATIONSHIP BETWEEN GUN LAWS AND GUN TRAFFICKING
A. State Criminal Penalties for: Straw Purchasing, Falsifying Purchaser Information, and Failing to Conduct Dealer Background Checks
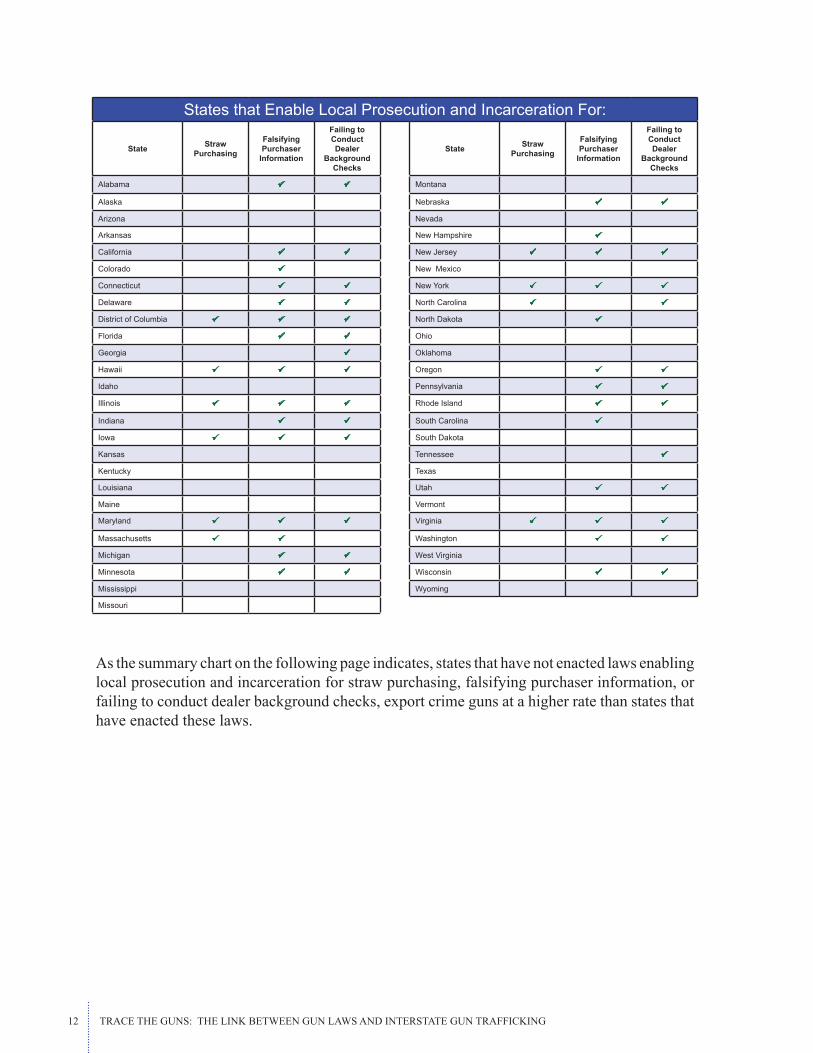
States that have not enacted laws enabling local prosecution and incarceration of straw purchasers, buyers who falsify purchaser information, and gun dealers who violate background check laws export crime guns at a higher rate than states that have enacted such laws, and are the source of a greater proportion of short TTC crime guns.
Under federal law, it is a felony for gun buyers to participate in a straw purchase (by falsely completing paperwork stating that he or she is the actual buyer of the gun) or to falsify purchaser information, and a misdemeanor for gun dealers to violate background check laws. While these federal laws criminalize transactions that are likely to provide guns to traffickers and criminals, certain states have also enacted laws that enable local prosecution and incarceration of these buyers and sellers in such transactions. These state laws provide additional opportunities for prosecution and enforcement and create opportunities for federal and state law enforcement to work together and leverage their resources. In fact, ATF has identified fostering this type of cooperation as an important priority.14 This report analyzes criminal penalties for three state laws that address the following illegal activities:
Straw Purchasing• : Under federal law, a straw purchaser commits a felony by falsely stating on the required paperwork that he or she is the actual buyer of the gun. Offenders can be incarcerated for up to 10 years and fined up to $250,000.15 Nine states and the District of Columbia16 have enacted parallel laws enabling local prosecution and incarceration of straw purchasers. These states have an average export rate of 9.5 crime guns per 100,000 inhabitants. In comparison, the 41 states that do not enable local prosecution and incarceration of straw purchasers have an export rate of 15.6 crime guns per 100,000 inhabitants, 64% greater than the rate of states that do.
Falsifying Purchaser Information• : Under federal law, an individual who provides false information while purchasing a firearm commits a felony and can be incarcerated for up to 10 years and fined up to $250,000.17 Twenty-seven states and the District of Columbia18 have enacted parallel laws enabling local prosecution and incarceration of buyers who provide false information during a firearm purchase.19 These states have an average export rate of 10.9 crime guns per 100,000 inhabitants. In comparison, the 23 states that do not enable local prosecution and incarceration of gun buyers who falsify purchaser information have an export rate of 19.9 crime guns per 100,000 inhabitants, 83% greater than the rate of states that do.
Failing to Conduct Dealer Background Checks• :20 Under federal law, a dealer who knowingly fails to conduct a background check on a gun buyer commits a misdemeanor and can be incarcerated for up to one year and fined up to $100,000.21 Twenty-five states and the District of Columbia22 have enacted parallel laws enabling local prosecution and incarceration of gun dealers who violate background check laws. These states have an average export rate of 12.0 crime guns per 100,000 inhabitants. In comparison, the 25 states that do not enable local prosecution and incarceration of gun dealers who violate background check laws have an export rate of 18.3 crime guns per 100,000 inhabitants, 53% greater than the rate of states that do.
A REPORT FROM MAYORS AGAINST ILLEGAL GUNS 11

12 TRACE THE GUNS: THE LINK BETWEEN GUN LAWS AND INTERSTATE GUN TRAFFICKING
States that Enable Local Prosecution and Incarceration For:
State Straw Purchasing
Falsifying Purchaser
Information
Failing to Conduct Dealer
Background Checks
State Straw Purchasing
Falsifying Purchaser
Information
Failing to Conduct Dealer
Background Checks
Alabama Montana
Alaska Nebraska
Arizona Nevada
Arkansas New Hampshire
California New Jersey
Colorado New Mexico
Connecticut New York
Delaware North Carolina
District of Columbia North Dakota
Florida Ohio
Georgia Oklahoma
Hawaii Oregon
Idaho Pennsylvania
Illinois Rhode Island
Indiana South Carolina
Iowa South Dakota
Kansas Tennessee
Kentucky Texas
Louisiana Utah
Maine Vermont
Maryland Virginia
Massachusetts Washington
Michigan West Virginia
Minnesota Wisconsin
Mississippi Wyoming
Missouri
As the summary chart on the following page indicates, states that have not enacted laws enabling local prosecution and incarceration for straw purchasing, falsifying purchaser information, or failing to conduct dealer background checks, export crime guns at a higher rate than states that have enacted these laws.

In addition, as the summary chart below indicates, for each of these laws, states that have not enacted these parallel laws are the source of a greater proportion of short TTC crime guns than states that have enacted these laws.
Enable
s Inc
arcera
tion f
or
Straw P
urcha
sers
Enable
s Inc
arcera
tion f
or
Straw P
urcha
sers
Enable
s Inc
arcera
tion f
or Buy
ers
who Fals
ify P
urcha
se In
formati
on
Enable
s Inc
arcera
tion f
or Buy
ers
who Fals
ify P
urcha
se In
formati
on
Enable
s Inc
arcera
tion f
or Dea
lers
who Viol
ate B
ackg
round
Che
ck La
ws
Enable
s Inc
arcera
tion f
or Dea
lers
who Viol
ate B
ackg
round
Che
ck La
ws
Does n
ot Ena
ble In
carce
ration
for S
traw P
urcha
sers
Does n
ot Ena
ble In
carce
ration
for S
traw P
urcha
sers
Does n
ot Ena
ble In
carce
ration
for B
uyers
who Fals
ify P
urcha
se In
formati
on
Does n
ot Ena
ble In
carce
ration
for B
uyers
who Fals
ify P
urcha
se In
formati
on
Does n
ot Ena
ble In
carce
ration
for D
ealer
s
who Viola
te Bac
kgrou
nd C
heck
Laws
Does n
ot Ena
ble In
carce
ration
for D
ealer
s
who Viola
te Bac
kgrou
nd C
heck
Laws
Crime Gun Export Rate per 100,000 Inhabitants
14.1National Average
9.5
20.8%
15.6
23.0%
10.9
20.6%
19.9
12.0
21.3%
18.3
Relationship Between Crime Gun Export Rates and State Laws Enabling Local Prosecution and Incarceration for Specific Violations
20
16
12
8
4
0
Proportion of Crime Guns with a Short
Time-to-Crime(Less Than
Two Years Be-tween Original Purchase and Recovery in a
Crime)
22.6%National Average
Relationship Between Time-to-Crime and State Laws Enabling Local Prosecution and Incarceration for Specific Violations
25%
20%
15%
10%
5%
0%
24.9% 24.8%
A REPORT FROM MAYORS AGAINST ILLEGAL GUNS 13

States That Require Background Checks for All Handgun Sales at Gun Shows
14 TRACE THE GUNS: THE LINK BETWEEN GUN LAWS AND INTERSTATE GUN TRAFFICKING
B. Background Checks for all Handgun Sales at Gun Shows
States that do not require background checks for all handgun sales at gun shows export crime guns at a rate more than two and a half times greater than states that do, and are the source of a greater proportion of short TTC crime guns.
Under current federal law, private sellers, who maintain that they sell guns only occasionally, do not need to be licensed23 and so are exempt from running background checks regardless of where they sell a gun.24 This gap in federal background check laws, often called the “Gun Show Loophole,” is associated with gun shows because they are a large and central marketplace where purchasers who wish to avoid detection can easily connect with private sellers. Private sales at gun shows are a reliable way for dangerous individuals – such as gun traffickers, convicted felons, and people with serious mental illness – to avoid background checks when they purchase guns.25
To date, 16 states and the District of Columbia have enacted state laws to close the Gun Show Loophole. These states have taken a variety of approaches,26 including:
Requiring universal background checks conducted at the time of purchase for all gun sales;• 27 Requiring background checks conducted at the time of purchase for all handgun sales;• 28 Requiring a background check conducted at the time of purchase at gun shows;• 29 Requiring state-issued permits to purchase any gun from private sellers with a • background check not necessarily conducted at the time of purchase;30 and Requiring state-issued permits to purchase handguns from private sellers with a • background check not necessarily conducted at the time of purchase.31
HI
ND
SD WIMI
K
CTRI
MA
Delaware
NC
AK
WWashington, D.C.
PA
MDIL
NY
CO
OR
New JerseyIANE
WA
NV
ID
MT
WY
UTCA
AZNM
TX
OK AR
MOKS
MN
FL
ALMSLA
GASC
TN
KY
IN OHWV VA
NH
MEVT
Requiring State-Issued Permits to Purchase any gun from Private Sellers with a Background Check not Necessarily at the time of Purchase
Requiring State-Issued Permits to Purchase Handguns from Private Sellers with a Background Check not Necessarily at the Time of Purchase
No Gun Show Background Checks By Unlicensed Sellers or Purchase Permits Required
Requiring Universal Background Checks at the Time of Purchase for all Gun Sales
Requiring Background Checks at the Time of Purchase for all Handgun Sales
Requiring Background Checks at the Time of Purchase at Gun Shows (No Check Required for Other Private Sales)

These 16 states and the District of Columbia have an average export rate of 7.5 crime guns per 100,000 inhabitants.32 In comparison, the 34 states that do not require background checks for all handgun sales at gun shows have an average export rate of 19.8 crime guns per 100,000 inhabitants, a rate more than two and a half times greater than the rate of states that do.
Do Not Require Background Checks for
All Handgun Sales at Gun Shows
Require Background Checks for All Handgun
Sales at Gun Shows
Crime Gun Export Rate per 100,000 Inhabitants
14.1National Average
7.5
19.8
Relationship Between Crime Gun Export Rates and State Laws Requiring Background Checks for All Handgun Sales at Gun Shows
20
16
12
8
4
0
A REPORT FROM MAYORS AGAINST ILLEGAL GUNS 15
Do Not Require Background Checks for
All Handgun Sales at Gun Shows
Require Background Checks for All Handgun
Sales at Gun Shows
Proportion of Crime Guns with a Short
Time-to-Crime(Less Than
Two Years Be-tween Original Purchase and Recovery in a
Crime)
22.6%National Average
17.3%
25.1%
The states that do not require background checks for all handgun sales at gun shows are also the source of a greater proportion of short TTC crime guns – 25.1% of guns originating from these states have a short TTC, while only 17.3% of guns originating from states that require background checks for all handgun sales at gun shows have a short TTC.
Relationship Between Time-to-Crime and State Laws Requiring Background Checks for All Handgun Sales at Gun Shows
25%
20%
15%
10%
5%
0%

C. Purchase Permits for All Handgun Sales
States that do not require purchase permits for all handguns export crime guns at a rate more than three times greater than states that do require purchase permits for all handguns, and are the source of a greater proportion of short TTC crime guns.
Federal law requires background checks for people who buy guns, but only if they do so from a licensed dealer and only at the time of purchase.33 Many states go beyond this federal minimum by requiring some sort of purchase permit. Such requirements could deny guns to criminals and help to regulate the secondary gun market in several ways. First, they ensure that a background check will be done on the buyer even if the seller is not a federally licensed dealer. This prevents people who are not allowed to possess guns from avoiding background checks by simply buying from occasional sellers.34 Second, they often require that a prospective gun buyer visit a law enforcement agency to get the permit – which may deter criminals and traffickers from applying.35 Finally, because law enforcement agencies may be given more time under state law to determine whether an applicant is eligible for a permit, such requirements may allow a more thorough background checking than federal law allows.36
Thirteen states and the District of Columbia37 require purchase permits for all handgun sales.38
States That Require Purchase Permits for All Handgun Sales
16 TRACE THE GUNS: THE LINK BETWEEN GUN LAWS AND INTERSTATE GUN TRAFFICKING
HI
ND
SD WIMI
K
CTRI
MA
Delaware
NC
AK
WWashington, D.C.
PA
MarylandIL
NY
CO
OR
New JerseyIANE
WA
NV
ID
MT
WY
UTCA
AZNM
TX
OK AR
MOKS
MN
FL
ALMSLA
GASC
TN
KY
IN OHWV VA
NH
MEVT
State Requires Purchase Permits for all Gun Sales
State Requires Purchase Permits for Handgun Sales Only
State Does Not Require Purchase Permits for Handgun Sales

No Purchase Permits Required
Purchase Permits Required
Crime Gun Export Rate per 100,000 Inhabitants
14.1National Average
6.2
19.2
Relationship Between Crime Gun Export Rates and State Laws Requiring Purchase Permits for All Handgun Sales
20
16
12
8
4
0
No Purchase Permits Required
Purchase Permits Required
Proportion of Crime Guns with a Short
Time-to-Crime(Less Than
Two Years Be-tween Original Purchase and Recovery in a
Crime)
22.6%National Average
16.1%
24.8%
Relationship Between Time-to-Crime and State Laws Requiring Purchase Permits for All Handgun Sales
25%
20%
15%
10%
5%
0%
A REPORT FROM MAYORS AGAINST ILLEGAL GUNS 17
These 13 states and the District of Columbia, which require purchase permits for handguns have an average export rate of 6.2 crime guns per 100,000 inhabitants. Conversely, the 37 states that do not require purchase permits for all handgun sales export crime guns at a rate of 19.2 crime guns per 100,000 inhabitants, more than three times greater than the rate of states that do.
Furthermore, the states that do not require purchase permits for all handgun sales are also the source of a greater proportion of short TTC guns – 24.8% of guns originating from these states have a short TTC, while only 16.1% of guns originating from states that do require purchase permits for all handgun sales have a short TTC.

18 TRACE THE GUNS: THE LINK BETWEEN GUN LAWS AND INTERSTATE GUN TRAFFICKING
D. Local Law Enforcement Discretion to Approve or Deny Concealed Carry Permits
States that do not grant discretion to law enforcement to approve or deny concealed carry permits export crime guns at more than twice the rate of states that grant such discretion, and states without law enforcement discretion are the source of a greater proportion of short TTC crime guns.
States differ not only in their laws about purchasing guns, but also in their laws about carrying concealed handguns. The vast majority of states require a permit from the state or a local government (often, from a county sheriff) to carry a concealed weapon.39
This report analyzes the effect of one fundamental difference among state laws on concealed handgun carrying: some states require law enforcement to issue a concealed carry permit to a person who meets state-specific criteria, such as never having been convicted of certain crimes.40 Other states grant a law enforcement agency discretion to approve or deny a concealed carry permit,41 if for example, the police know the person from domestic violence complaints and that he or she had been subject to a restraining order that has expired. Similarly, discretion allows a sheriff to deny a permit to someone who has been arrested and convicted of misdemeanor crimes that suggest that he or she poses a threat to themselves or to others, even if he or she has not been convicted of a prohibiting felony under federal or state law.42 Although the vast majority of concealed carry permittees are law abiding citizens, a concealed carry permit can facilitate gun trafficking by allowing a trafficker to carry guns in other states43 and many states exempt holders of these permits from other laws that may impede gun trafficking.44
As shown in the accompanying map, 24 states and the District of Columbia45 allow law enforcement discretion to deny a concealed carry permit, and two states prohibit carrying of a handgun entirely – and so are excluded from this analysis.46
States That Grant Discretion to Local Law Enforcement to Approve or Deny Concealed Carry Permits
HI
ND
SD WIMI
K
CTRI
MA
Delaware
NC
AK
WWashington, D.C.
PA
MDIL
NY
CO
OR
New JerseyIANE
WA
NV
ID
MT
WY
UTCA
AZNM
TX
OK AR
MOKS
MN
FL
ALMSLA
GASC
TN
KY
IN OHWV VA
NH
MEVT
States that Grant no Discretion to Local Law Enforcement to Approve or Deny Concealed Carry Permits
States that Prohibit Concealed Carry Permits
States that Grant Broad Discretion to Local Law Enforcement to Approve or Deny Concealed Carry Permits
States that Grant Limited Discretion to Local Law Enforcement to Approve or Deny Concealed Carry Permits

Local Law Enforcement Has No Discretion to
Approve or Deny Concealed Carry
Permits
Local Law Enforcement Has Discretion to Approve or Deny Concealed Carry
Permits
Proportion of Crime Guns with a Short
Time-to-Crime(Less Than
Two Years Be-tween Original Purchase and Recovery in a
Crime)
22.6%National Average18.7%
25.1%
A REPORT FROM MAYORS AGAINST ILLEGAL GUNS 19
Relationship Between Crime Gun Export Rates and State Laws Granting Discretion to Local Law Enforcement to Deny Concealed Carry Permits
Local Law Enforcement Has No Discretion to
Approve or Deny Concealed Carry
Permits
Local Law Enforcement Has Discretion to Approve or Deny Concealed Carry
Permits
Crime Gun Export Rate per 100,000 Inhabitants
14.1National Average
9.6
Relationship Between Time-to-Crime and State Laws Granting Discretion to Local Law Enforcement to Deny Concealed Carry Permits
20
16
12
8
4
0
25%
20%
15%
10%
5%
0%
19.9
These 24 states and the District of Columbia that allow discretion have an average export rate of 9.6 crime guns per 100,000 inhabitants.47 In comparison, the 24 states that grant no discretion to law enforcement48 have an average export rate of 19.9 crime guns per 100,000 inhabitants, more than twice the rate of states that do.
Furthermore, the states that do not grant any discretion to law enforcement are also the sources of a greater proportion of short TTC crime guns – 25.1% of guns originating from these states have a short TTC, while only 18.7% of guns originating from states that grant discretion to law enforcement have a short TTC.

20 TRACE THE GUNS: THE LINK BETWEEN GUN LAWS AND INTERSTATE GUN TRAFFICKING
E. Gun Possession By Violent Misdemeanants
States that allow gun possession by any violent misdemeanant export crime guns at a rate more than two and a half times greater than states that prohibit gun possession by at least some violent misdemeanants, and are the source of a greater proportion of short TTC crime guns.
While federal law prohibits individuals convicted of felonies and domestic violence misdemeanors from possessing firearms, individuals convicted of other violent misdemeanors are free to purchase and possess guns.49 Typically, a misdemeanor is a crime punishable with incarceration for one year or less. Violent misdemeanors50 can include serious crimes such as stalking, assault, harassment, or battery. Research suggests that individuals previously convicted of violent misdemeanors are significantly more likely to commit violent crimes again than those who were previously convicted of non-violent misdemeanors.51
Currently, 14 states and the District of Columbia52 go beyond federal law and prohibit at least some violent misdemeanants from possessing firearms.
States That Prohibit Violent Misdemeanants from Possessing Guns
HI
ND
SD WIMI
K
CTRI
MA
Delaware
NC
AK
WWashington, D.C.
PA
MarylandIL
NY
CO
OR
New JerseyIANE
WA
NV
ID
MT
WY
UTCA
AZNM
TX
OK AR
MOKS
MN
FL
ALMSLA
GASC
TN
KY
IN OHWV VA
NH
MEVT
State Prohibits Gun Possession by At Least Some Violent Misdemeanants
State Allows Gun Possession by any Violent Misdemeanant

These states have an average export rate of 7.1 crime guns per 100,000 inhabitants. In comparison, the 36 states that allow gun possession by any violent misdemeanant have an average export rate of 18.7 crime guns per 100,000 inhabitants, a rate more than two and a half times greater than the rate of states that do not.
Futhermore, the states that allow gun possession by any violent misdemeanant are also the source of a greater proportion of short TTC guns – 24.8% of guns originating from these states have a short TTC, while only 16.3% of guns originating from states that prohibit gun possession by at least some violent misdemeanants have a short TTC.
Allow Gun Possession by
Any Violent Misdemeanant
Prohibit Gun Possession by at
Least Some Violent Misdemeanants
Crime Gun Export Rate per 100,000 Inhabitants
14.1National Average
7.1
18.7
Allow Gun Possession by
Any Violent Misdemeanant
Prohibit Gun Possession by at
Least Some Violent Misdemeanants
Proportion of Crime Guns with a Short
Time-to-Crime(Less Than
Two Years Be-tween Original Purchase and Recovery in a
Crime)
22.6%National Average
16.3%
24.8%
A REPORT FROM MAYORS AGAINST ILLEGAL GUNS 21
Relationship Between Crime Gun Export Rates and State Laws Prohibiting Gun Possession by Violent Misdemeanants
Relationship Between Time-to-Crime and State Laws Prohibiting Gun Possession by Violent Misdemeanants
20
16
12
8
4
0
25%
20%
15%
10%
5%
0%
22 TRACE THE GUNS: THE LINK BETWEEN GUN LAWS AND INTERSTATE GUN TRAFFICKING
F. Reporting Lost or Stolen Guns to Law Enforcement
States that do not require gun owners to report lost or stolen guns to police export crime guns at a rate more than two and a half times greater than states that require such reporting, and are the source of a greater proportion of short TTC crime guns.
Lost or stolen guns account for a large share of firearms trafficking.53 Over 150,000 firearms were reported lost or stolen in 2008.54 Eighty-five percent of these guns were never recovered, and tens of thousands more were likely never even reported.55 Reporting lost or stolen guns to local law enforcement fights illegal gun trafficking in two ways. First, it enables police to respond more rapidly to a report that a gun was stolen and possibly return it to its owner or track down the thieves. Second, if a trafficker or straw buyer is identified through gun tracing and confronted by police, such a requirement prevents them from evading responsibility by claiming that the crime gun was stolen from them. Federal law requires FFLs to report lost or stolen guns, but this requirement does not apply to other gun owners.56
Currently, seven states and the District of Columbia57 require gun owners to report lost or stolen guns to local law enforcement.
States That Require Reporting Lost or Stolen Guns to Law Enforcement
HI
ND
SD WIMI
K
CTRI
MA
Delaware
NC
AK
WWashington, D.C.
PA
MarylandIL
NY
CO
OR
New JerseyIANE
WA
NV
ID
MT
WY
UTCA
AZNM
TX
OK AR
MOKS
MN
FL
ALMSLA
GASC
TN
KY
IN OHWV VA
NH
MEVT
State Requires Reporting Lost or Stolen Guns to Law Enforcement
State Does Not Require Reporting Lost or Stolen Guns to Law Enforcement
Do Not Require Reporting Lost or
Stolen Guns to Law Enforcement
Require Reporting Lost or Stolen Guns to Law Enforcement
Proportion of Crime Guns with a Short
Time-to-Crime(Less Than
Two Years Be-tween Original Purchase and Recovery in a
Crime)
17.8%
23.1%22.6%
National Average
A REPORT FROM MAYORS AGAINST ILLEGAL GUNS 23
Relationship Between Crime Gun Export Rates and State Laws Requiring Reporting Lost or Stolen Guns to Law Enforcement
Do Not Require Reporting Lost or
Stolen Guns to Law Enforcement
Require Reporting Lost or Stolen Guns to Law Enforcement
Crime Gun Export Rate per 100,000 Inhabitants
14.1National Average
6.2
16.1
Relationship Between Time-to-Crime and State Laws Requiring Reporting Lost or Stolen Guns to Law Enforcement
20
16
12
8
4
0
25%
20%
15%
10%
5%
0%
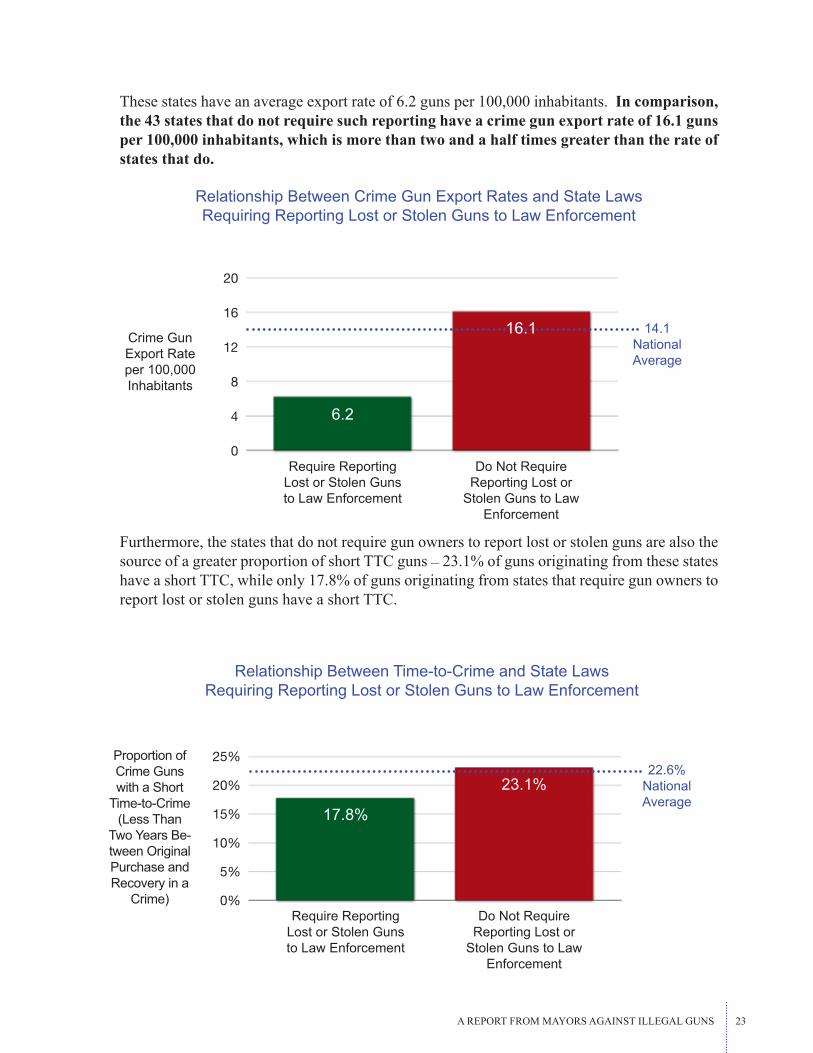
These states have an average export rate of 6.2 guns per 100,000 inhabitants. In comparison, the 43 states that do not require such reporting have a crime gun export rate of 16.1 guns per 100,000 inhabitants, which is more than two and a half times greater than the rate of states that do.
Furthermore, the states that do not require gun owners to report lost or stolen guns are also the source of a greater proportion of short TTC guns – 23.1% of guns originating from these states have a short TTC, while only 17.8% of guns originating from states that require gun owners to report lost or stolen guns have a short TTC.

24 TRACE THE GUNS: THE LINK BETWEEN GUN LAWS AND INTERSTATE GUN TRAFFICKING
G. Local Control of Firearms Regulations
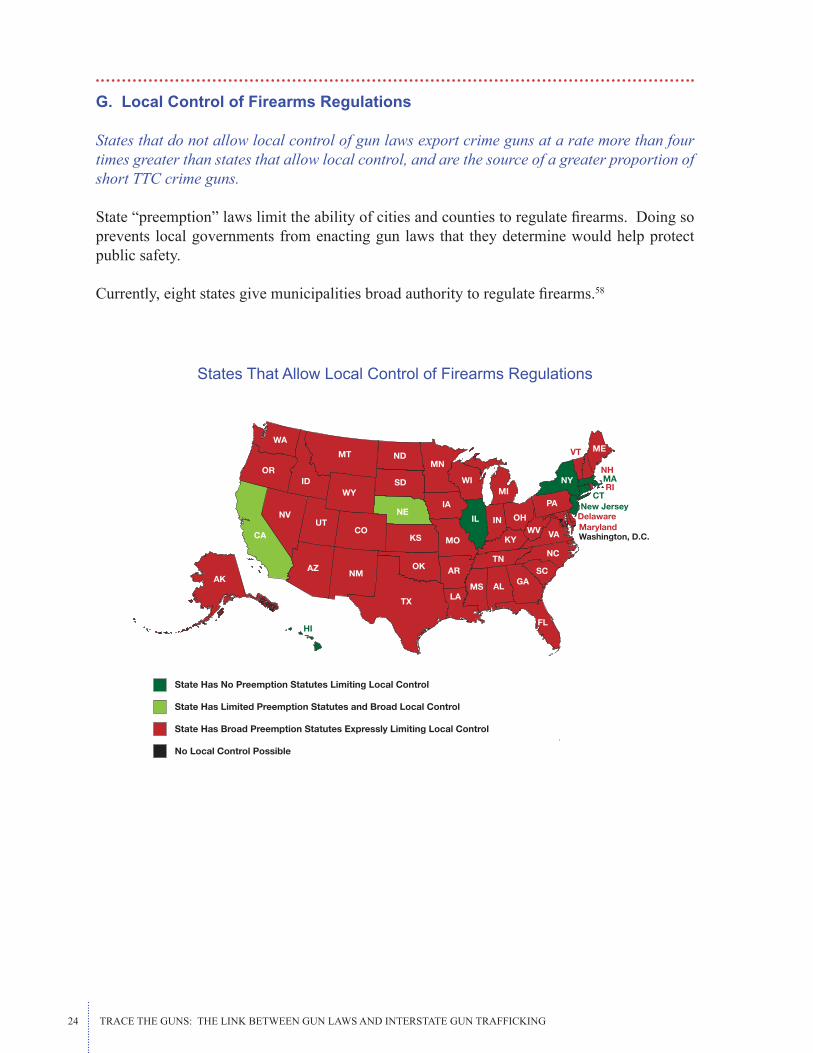
States that do not allow local control of gun laws export crime guns at a rate more than four times greater than states that allow local control, and are the source of a greater proportion of short TTC crime guns.
State “preemption” laws limit the ability of cities and counties to regulate firearms. Doing so prevents local governments from enacting gun laws that they determine would help protect public safety.
Currently, eight states give municipalities broad authority to regulate firearms.58
States That Allow Local Control of Firearms Regulations
HI
ND
SD WIMI
K
CTRI
MA
Delaware
NC
AK
WWashington, D.C.
PA
MarylandIL
NY
CO
OR
New JerseyIANE
WA
NV
ID
MT
WY
UTCA
AZNM
TX
OK AR
MOKS
MN
FL
ALMSLA
GASC
TN
KY
IN OHWV VA
NH
MEVT
State Has No Preemption Statutes Limiting Local Control
State Has Limited Preemption Statutes and Broad Local Control
State Has Broad Preemption Statutes Expressly Limiting Local Control
No Local Control Possible

A REPORT FROM MAYORS AGAINST ILLEGAL GUNS 25
Relationship Between Crime Gun Export Rates and State Laws Allowing Local Control of Firearms Regulations
Do Not Allow Local Control of Gun Laws
Do Not Allow Local Control of Gun Laws
Allow Local Control of Gun Laws
Allow Local Control of Gun Laws
Crime Gun Export Rate per 100,000 Inhabitants
Proportion of Crime Guns with a Short
Time-to-Crime(Less Than
Two Years Be-tween Original Purchase and Recovery in a
Crime)
14.1National Average
22.6%National Average
4.4
13.6%
18.2
24.3%
Relationship Between Time-to-Crime and State Laws Allowing Local Control of Firearms Regulations
20
16
12
8
4
0
25%
20%
15%
10%
5%
0%
These states export crime guns at a rate of 4.4 guns per 100,000 inhabitants. In contrast, the 42 states59 that do not allow local control of gun laws have an export rate of 18.2 crime guns per 100,000 inhabitants, more than four times greater than the rate of states that do.
Furthermore, the states that do not allow local control of firearms regulations are also the source of a greater proportion of short TTC crime guns – 24.3% of guns originating from these states have a short TTC, while only 13.6% of guns originating from states that allow local control of firearms regulations have a short TTC.

26 TRACE THE GUNS: THE LINK BETWEEN GUN LAWS AND INTERSTATE GUN TRAFFICKING
H. State Inspection of Gun Dealers
States that do not allow or require state inspection of gun dealers export crime guns at a rate that is 50% greater than states that allow or require state inspections of gun dealers, and are the source of a greater proportion of short TTC crime guns.
State inspections enable law enforcement to detect potential indications of illegal gun activity, including improper record keeping or a dealer whose gun inventory does not match their sales records.60 Although federal law allows ATF to inspect FFLs once per year 61 and ATF has set a goal of inspecting each FFL once every three years,62 FFLs are inspected only on average once every 10 years.63 In light of limited ATF resources, state inspections can supplement these infrequent federal inspections.
Twenty-three states and the District of Columbia64 allow or require state authorities to supplement federal ATF inspections.
States That Allow or Require State Inspections of Gun Dealers
HI
ND
SD WIMI
K
CTRI
MA
Delaware
NC
AK
WWashington, D.C.
PA
MarylandIL
NY
CO
OR
New JerseyIANE
WA
NV
ID
MT
WY
UTCA
AZNM
TX
OK AR
MOKS
MN
FL
ALMSLA
GASC
TN
KY
IN OHWV VA
NH
MEVT
State Allows or Requires State Inspections of Gun Dealers
State Does Not Allow or Require State Inspections of Gun Dealers

These states export crime guns at a rate of 11.5 crime guns per 100,000 inhabitants. The 27 states that do not allow or require state inspections export crime guns at a rate of 17.2 crime guns per 100,000 inhabitants, which is 50% greater than the rate of states that allow or require inspections of gun dealers.
Furthermore, the states that do not allow or require state inspections are also the source of a greater proportion of short TTC crime guns – 25.1% of guns originating from these states have a short TTC, while only 19.5% of guns originating from states that allow or require state inspections have a short TTC.
A REPORT FROM MAYORS AGAINST ILLEGAL GUNS 27
Relationship Between Crime Gun Export Rates and State Laws Permitting or Mandating Dealer Inspections
Relationship Between Time-to-Crime and State Laws Permitting or Mandating Dealer Inspections
Do Not Allow or Require State Inspections
Do Not Allow or Require State Inspections
Allow or Require State Inspections
Allow or Require State Inspections
Crime Gun Export Rate per 100,000 Inhabitants
Proportion of Crime Guns with a Short
Time-to-Crime(Less Than
Two Years Be-tween Original Purchase and Recovery in a
Crime)
14.1National Average
22.6%National Average
11.5
19.5%
17.2
25.1%
20
16
12
8
4
0
25%
20%
15%
10%
5%
0%

28 TRACE THE GUNS: THE LINK BETWEEN GUN LAWS AND INTERSTATE GUN TRAFFICKING
States that Have Enacted Key Gun Laws Examined in this ReportA. States that Enable Local
Prosecution and Incarceration For: B. Requires Background Checks for
All Handgun Sales at Gun
Shows
C. Requires Purchase Permit for
All Handgun Purchases
D. Grants Local Law
Enforcement Discretion to
Deny Concealed Carry Permits
E. Prohibits Gun Pos-
session by Violent Misde-
meanants
F. Requires Reporting
Lost or Stolen Guns
G. Allows Local Control
of Gun Regulations
H. Requires or Allows Dealer Inspections1. Straw
Purchasing
2. Falsifying Purchaser
Information
3. Failing to Conduct Deal-er Background
Checks
Alabama
Alaska
Arizona
Arkansas
California
Colorado
Connecticut
Delaware
District of Columbia N/A
Florida
Georgia
Hawaii
Idaho
Illinois N/A
Indiana
Iowa
Kansas
Kentucky
Louisiana
Maine
Maryland
Massachusetts
Michigan
Minnesota
Mississippi
Missouri
Montana
Nebraska
Nevada
New Hampshire
New Jersey
New Mexico
New York
North Carolina
North Dakota
Ohio
Oklahoma
Oregon
Pennsylvania
Rhode Island
South Carolina
South Dakota
Tennessee
Texas
Utah
Vermont
Virginia
Washington
West Virginia
Wisconsin N/A
Wyoming

Although the rates at which states export crime guns vary significantly, states that have enacted strong gun laws have significantly lower export rates than states with weak gun laws. As the summary chart below indicates, this association holds for all of the ten gun laws examined in this analysis. Across the ten laws, states that have not enacted these gun laws are associated with an average crime gun export rate that is more than twice the rate (18.3 guns per 100,000 inhabitants) of the states that have enacted these laws (8.5 crime guns per 100,000 inhabitants).
A REPORT FROM MAYORS AGAINST ILLEGAL GUNS 29
Average Export Rates for States With or Without Specific Gun Regulations
Enable
Inca
rcerat
ion fo
r Dea
lers w
ho Viol
ate B
ackg
round
Che
ck La
ws
Enable
Inca
rcerat
ion fo
r Buy
ers w
ho Fals
ify Purc
hase
Infor
mation
Enable
Inca
rcerat
ion fo
r Stra
w Purc
hase
rs
Requir
e Bac
kgrou
nd C
heck
s for
All Han
dgun
Sales a
t Gun
Shows
Purcha
se P
ermits
Req
uired
Gran
t Disc
retion
to Lo
cal L
aw Enfo
rcemen
t to App
rove o
r Den
y Con
ceale
d Carr
y Perm
its
Prohibi
t Gun
Pos
sess
ion by
At Lea
st Som
e Viol
ent M
isdem
eana
nts
Requir
e Rep
orting
Lost
or Stol
en G
uns t
o Law
Enfo
rcemen
t
Allow Lo
cal C
ontro
l of G
un La
ws
Allow or
Req
uire S
tate I
nspe
ction
s
Does N
ot Ena
ble In
carce
ration
for D
ealer
s who
Violate
Backg
round
Che
ck La
ws
Does N
ot Ena
ble In
carce
ration
for B
uyers
who
Falsify
Purcha
se In
formati
on
Does N
ot Ena
ble In
carce
ration
for S
traw P
urcha
sers
Do Not
Requir
e Bac
kgrou
nd C
heck
s for
All Han
dgun
Sales a
t Gun
Shows
No Purc
hase
Perm
its R
equir
ed
Do Not
Grant D
iscret
ion to
Loca
l Law
Enforce
ment to
Approv
e or D
eny C
once
aled C
arry P
ermits
Allow G
un P
osse
ssion
by Any
Violen
t Misd
emea
nt
Do Not
Requir
e Rep
orting
Lost
or Stol
en G
uns t
o Law
Enfo
rcemen
t
Do Not
Allow Lo
cal C
ontro
l of G
un La
ws
Do Not
Allow or
Requir
e Stat
e Ins
pectio
ns
Crime Gun Export Rate per 100,000 Inhabitants
6.2 7.1
4.4
7.5
12.0
10.9
9.5
9.6
6.2
11.5
19.2
18.219
.8
18.319
.9
19.9
14.1National Average
18.7
15.6
16.1 17
.2
20
16
12
8
4
0
CONCLUSION

Likewise, as the summary chart below indicates, the states with weak gun laws are also the source of a greater proportion of crime guns with a short TTC than states with strong gun laws. Across the ten laws, states that have not enacted these laws are associated with a proportion of short TTC crime guns that is greater than the national average.
Taken together, crime gun trace data show not only that states with weaker gun laws are more often the source of guns found at crime scenes in other states (as shown by export rates) but also that guns from those states with weak laws are more often trafficked (as shown by short TTC). This demonstrates a strong connection between these gun laws and reductions in the movement of crime guns across state lines.
This association strongly suggests that gun traffickers favor these states as sources and that effective gun laws are an important tool in reducing criminal access to trafficked guns. Enacting common-sense gun laws may reduce criminal access to trafficked guns in the United States.
30 TRACE THE GUNS: THE LINK BETWEEN GUN LAWS AND INTERSTATE GUN TRAFFICKING
Proportion of Short Time-to-Crime Guns for States With or Without Specific Gun Regulations
30%
25%
20%
15%
10%
5%
0%
Proportion of Crime Guns with a Short
Time-to-Crime(Less Than
Two Years Be-tween Original Purchase and Recovery in a
Crime)
Enable
Inca
rcerat
ion fo
r Dea
lers w
ho Viol
ate B
ackg
round
Che
ck La
ws
Enable
Inca
rcerat
ion fo
r Buy
ers w
ho Fals
ify Purc
hase
Infor
mation
Enable
Inca
rcerat
ion fo
r Stra
w Purc
hase
rs
Requir
e Bac
kgrou
nd C
heck
s for
All Han
dgun
Sales a
t Gun
Shows
Purcha
se P
ermits
Req
uired
Gran
t Disc
retion
to Lo
cal L
aw Enfo
rcemen
t to App
rove o
r Den
y Con
ceale
d Carr
y Perm
its
Prohibi
t Gun
Pos
sess
ion by
At Lea
st Som
e Viol
ent M
isdem
eana
nts
Requir
e Rep
orting
Lost
or Stol
en G
uns t
o Law
Enfo
rcemen
t
Allow Lo
cal C
ontro
l of G
un La
ws
Allow or
Req
uire S
tate I
nspe
ction
s
Does N
ot Ena
ble In
carce
ration
for D
ealer
s who
Violate
Backg
round
Che
ck La
ws
Does N
ot Ena
ble In
carce
ration
for B
uyers
who
Falsify
Purcha
se In
formati
on
Does N
ot Ena
ble In
carce
ration
for S
traw P
urcha
sers
Do Not
Requir
e Bac
kgrou
nd C
heck
s for
All Han
dgun
Sales a
t Gun
Shows
No Purc
hase
Perm
its R
equir
ed
Do Not
Grant D
iscret
ion to
Loca
l Law
Enforce
ment to
Approv
e or D
eny C
once
aled C
arry P
ermits
Allow G
un P
osse
ssion
by Any
Violen
t Misd
emea
nt
Do Not
Requir
e Rep
orting
Lost
or Stol
en G
uns t
o Law
Enfo
rcemen
t
Do Not
Allow Lo
cal C
ontro
l of G
un La
ws
Do Not
Allow or
Requir
e Stat
e Ins
pectio
ns
16.1
%
16.3
%
13.6
%17.3
%21.3
%
20.6
%
20.8
%
18.7
%
17.8
%
19.5
%23.0
%
23.1
%
22.6%National Average24.8
%
24.3
%
25.1
%
24.8
%
24.9
%
25.1
%
25.1
%
24.8
%

Sources of Data
This analysis uses the most up-to-date ATF aggregate trace data available. Aggregated ATF trace data identify the state where the traced gun was first sold at retail (the “source state”), and the state where the traced gun was recovered at a crime scene (the “recovery state”). The aggregated ATF data examined in this analysis was taken from two different sources: (1) data published by ATF on its website on April 14, 2010 and (2) data provided by ATF to Mayors Against Illegal Guns on March 4, 2010 in response to a request submitted in January 2009.
The data set published by ATF on April 14, 2010 was extracted from its Firearms Tracing System database on March 9, 2010 and summarizes the total number of crime guns recovered and traced in each state and the District of Columbia, and the number of recovered crime guns originating from the top-15 source states. The data set provided to Mayors Against Illegal Guns on March 4, 2010 was extracted from the Firearms Tracing System database on February 23, 2010 and summarizes for each recovery state the number of guns recovered from all source states from 2006 to 2009.
Increased Data Precision
This report relies on source state and recovery state data for all 50 states and the District of Columbia. This information enabled a more complete analysis of interstate crime gun trafficking patterns than was used in the 2008 Mayors Against Illegal Guns report, The Movement of Illegal Guns in America. The 2008 report relied on data published by ATF that identified only the top-15 source states for crime guns recovered in a particular state. This year, ATF provided to Mayors Against Illegal Guns data detailing the number of crime guns recovered in a particular state and originating from each of the 50 states and the District of Columbia. See footnote eight for additional information as to how this improved the analysis of this report.65
Data Estimation
Among the 2,601 data points that identified the number of guns sourced by one state and recovered in another state, ATF omitted data in 27 instances. For each of these 27 omitted data points, a recovery state was missing data for guns from exactly one source state. This analysis estimated these omitted data points by calculating the difference between the April and March data sets for the total number of recovered guns where the source state was identified. The difference was then distributed to each recovery state that was missing exactly one source state. Overall, these estimates were used for only one-tenth of one percent of the 145,321 crime guns recovered where a source state was identified.
APPENDIX I: METHODOLOGICAL CONSIDERATIONS
A REPORT FROM MAYORS AGAINST ILLEGAL GUNS 31

Other Methodological Considerations
Trace data analysis is the best way to evaluate the trafficking of crime guns across state borders, but the data have some noteworthy limitations:
Traced firearms do not represent all crime guns. While there is a strong correlation between the number of guns that are traced and the number of guns used in crimes, these figures are not identical because not all guns used in crimes are recovered, and not every recovered crime gun is traced.
Not all efforts to trace guns are successful. In 2009, ATF was unable to identify the source states in 39% of all trace attempts. There are a variety of reasons that a trace request may not be successful, including improper recordkeeping by distributors and manufacturers, obliterated serial numbers on the guns, and that the relevant records have been discarded after the 20-year record retention requirement has expired.66 While this undercounts the number of guns, there is no evidence that this systematically distorts the findings of this analysis because the distribution of incomplete traces does not vary substantially among states.
32 TRACE THE GUNS: THE LINK BETWEEN GUN LAWS AND INTERSTATE GUN TRAFFICKING

APPENDIX II: SUMMARY OF STATE GUN EXPORTS
50.3 6.9 6.5
6.3 6.1
4.8
33.2 33.0
3.6
2.8 2.6
2.3 2.2
32.4 31.3
30.6 28.3
46.8
34.9 33.4
Mississippi Michigan illinois
Rhode island Minnesota
califoRnia
AlAbAMA south CArolinA
Massachusetts
new JeRsey new yoRk
hawaii d.c.
VirginiA indiana
nevada geoRgia
west viRginia
kentucky alaska
MS WV KY AK AL SC VA IN NV GA STATE LAW MI IL RI MN CA MA NJ NY HI DC
Enables Incarceration for Straw Purchasers
Enables Incarceration for Buyers who Falsify Purchase Information
Enables Incarceration for Dealers who Violate Background Check Laws
Requires Background Checks for all Handguns at Gun Shows
Requires Purchase Permits for All Handgun Sales
Allows Local Law Enforcement Discretion to Deny Concealed Carry Permits
Prohibits Gun Possession by Any Violent Misdemeanants
Requires Reporting Lost or Stolen Guns to Law Enforcement
Allows Local Control of Firearms Regulations
Allows State Inspection of Gun Dealers
Have Enacted the Law Law Not ApplicableHave Not Enacted the Law
HI
ND
SD WIMI
K
CTRI
MA
Delaware
NC
AK
WWashington, D.C.
PA
MarylandIL
NY
CO
OR
New JerseyIA
WA
NV
ID
MT
WY
UTCA
AZNM
TX
OK AR
MOKS
MN
FL
ALMSLA
GASC
TN
KY
IN OHWV VA
NH
MEVT
NE
national aveRage 14.1
The TeN STATeS WITh The HIGHEST EXPORT RATES & The TeN STATeS WITh The LOWEST EXPORT RATES
stAtEs With HIGHEST EXPORT RATES(CRIME GUNS EXPORTED PER 100,000 INHABITANTS)
stAtEs With LOWEST EXPORT RATES(CRIME GUNS EXPORTED PER 100,000 INHABITANTS)
A REPORT FROM MAYORS AGAINST ILLEGAL GUNS 33

APPENDIX III: UNDERSTANDING HOW AN ATF CRIME GUN TRACE WORKS
Law enforcement recovers a gun at a crime scene.
The recovering law enforcement agency identifies the gun’s make, model, and serial number and reports this information to ATF.
ATF checks the serial number of the recovered gun against its records of multiple handgun sales and the records of out-of-business federally licensed dealers and some records gathered from dealers who are under special scrutiny. If these checks of internal records do not produce results, ATF will contact the gun manufacturer and then the wholesaler to identify where the gun was originally sold. ATF then contacts the retailer who sold the gun to identify the first person who purchased the gun.
In order to identify the first purchaser, the retailer manually checks the federal form 4473, which is the federal back-ground check form that all prospective purchasers must complete in order to buy a gun from a federally licensed dealer (FFL). Gun dealers are required to keep the com-pleted 4473 forms on file for 20 years after each purchase. From these forms, the retailer provides the purchaser’s identification information to local law enforcement.
With the identification of the first purchaser, ATF and local law enforcement can then investigate the relationship of the buyer to the crime, identifying possible links between the source and the crime.
1. Law Enforcement Recovers Gun
2. Law Enforcement Identifies Gun
3. ATF Determines Initial Dealer
4. Dealer Identifies Original Purchaser
5. ATF Investigates Link to Crime
34 TRACE THE GUNS: THE LINK BETWEEN GUN LAWS AND INTERSTATE GUN TRAFFICKING

APPENDIX IV: TRACETHEGUNS.ORG
For an interactive display of information covered in this report, visit
www.TraceTheGuns.org
A REPORT FROM MAYORS AGAINST ILLEGAL GUNS 35

ENDNOTES
1 Centers for Disease Control and Prevention, Website for the National Center for Health Statistics, available at: http://www.cdc.gov/nchs/fastats/homicide.htm (last visited September 12, 2010).2 This analysis expands upon The Movement of Illegal Guns in America, a 2008 report released by Mayors Against Illegal Guns that revealed that states with the weakest gun laws are significantly more likely to be a source of interstate crime guns.3 This report uses a Time-to-Crime of less than two years as an indicator of gun trafficking. ATF has recently relied on two measures of TTC – less than two years and less than one year – as indicators of gun trafficking. ATF Press Release, ATF Posts 2009 Los Angeles Crime Gun Data (May 11, 2010), available at http://www.atf.gov/press/releases/2010/05/051110-la-posts-2009-crime-gun-data.html (last visited September 12, 2010) and ATF Press Release, ATF Shares 2008 NY State Crime Gun Data (July 8, 2009), available at http://www.atf.gov/press/releases/2009/07/070809-ny-atf-shares-trace-data.html (last visited September 12, 2010). 4 The data analyzed in this report was provided by the Department of Alcohol, Tobacco, Firearms and Explosives to Mayors Against Illegal Guns on March 4, 2010 in response to a request submitted in January 2009. This data is only available because of recent reforms to Congressional restrictions on the use of crime gun trace data. Since 2003, annual Congressional appropriations riders known as the “Tiahrt Amendments” prohibited ATF from publicly releasing crime gun trace data. Prior to 2003, ATF had regularly released crime gun trace data and routinely produced reports analyzing gun trafficking trends. See e.g. Department of the Treasury, Bureau of Alcohol, Tobacco and Firearms, Youth Crime Gun Interdiction Initiative Reports (1997 - 2002). In 2007 and 2009, Mayors Against Illegal Guns, and over 30 police organizations launched national campaigns to reform the Tiahrt Amendment restrictions. In 2007, Mayors Against Illegal Guns succeeded in securing language in the Tiahrt Amendment restrictions that explictly allowed law enforcement agencies and prosecutors to share with each other any trace data they acquire connected to their criminal investigations. In addition, ATF was explicitly allowed to begin releasing limited statistical reports using aggregated trace data. These limited statistical reports paved the way for the coalition’s 2008 report, The Movement of Illegal Guns in America. In 2009, Mayors Against Illegal Guns secured new language in the Tiahrt Amednments that restored full access for state and local law enforcement to ATF’s gun trace database. Although there are still significant restrictions on the use of ATF crime gun trace data, the recent reforms allowed ATF to provide the data relied upon in this report to Mayors Against Illegal Guns.5 U.S. Department of Treasury, Bureau of Alcohol, Tobacco and Firearms, Following the Gun: Enforcing Federal Law Against Firearms Traffickers, at iii (2000), available at http://www.mayorsagainstillegalguns.org/downloads/pdf/Following_the_Gun%202000.pdf (last visited September 12, 2010). 6 While ATF trace data generally identify the state in which a gun was first sold at retail, in some unusual cases they may reflect a more recent retail sale. Such cases arise if the more recent resale was part of a multiple handgun purchase, if it came from a dealer under a very rare form of ATF scrutiny known as a “demand letter,” or if it came from a dealer who was out of business and had transferred its records to ATF.7 See infra page 31, describing the methodology used to analyze this data. The 43,254 crime gun exports reflect guns that originated from any U.S. state or the District of Columbia that were recovered out-of-state. This figure includes 416 guns originally purchased in a U.S. state or in the District of Columbia, and recovered in the U.S. territories (e.g. Puerto Rico, U.S. Virgin Islands). Likewise the state-by-state table on page 7 of this report includes, in the case of imports, guns originally purchased in a U.S. territory and recovered in a U.S. state or the District of Columbia; in the case of exports, guns originally purchased in a U.S. state or the District of Columbia and recovered in a U.S. territory. Additionally, in calculating the export rates discussed in the bulk of this report, guns recovered in crimes in a U.S. territory and originating from a U.S. state or the District of Columbia, are included.
36 TRACE THE GUNS: THE LINK BETWEEN GUN LAWS AND INTERSTATE GUN TRAFFICKING

8 The 2009 national average crime gun export rate (14.1 crime guns per 100,000 inhabitants) is 25% greater than the 2007 national average crime gun export rate reported in The Movement of Illegal Guns in America (11.3 crime guns per 100,000 inhabitants) because that report relied on ATF data that only identified the top-15 source states for crime guns recovered in a particular state. The 2009 crime gun trace data provided by ATF to Mayors Against Illegal Guns included the number of crime gun exports from the bottom-35 source states, which increased the raw total of crime gun exports reported for each state. As a result, the export rate for each state and the national average export rate increased. 9 In calculating TTC, if the date that a gun was recovered at a crime scene is unknown, then ATF will typically substitute the date that the law enforcement agency requested the trace data when calculating the gun’s TTC.10 See ATF Shares 2008 NY State Crime Gun Data, supra note 3.11 In past years, TTC data was only available for crime guns recovered in each state.12 One of the laws examined here – requiring purchase permits for handguns – was also examined as a subset of laws enacted to close the Gun Show Loophole. It is studied again here separately because purchase permits help control the secondary gun market by requiring all prospective buyers undergo a background check at some point in time. In addition, many states require purchase permits that also provide law enforcement with an important investigative tool.13 While enacting each of these laws has a strong association with both lower crime gun export rates and a smaller proportion of short TTC guns, this association may also reflect the collective effect of a state’s gun laws.14 U.S. Department of Justice, Bureau of Alcohol, Tobacco, Firearms, and Explosives, FY 2010 – FY 2016, Strategic Plan, at 10 (2010), available at http://www.atf.gov/publications/general/strategic-plan/ (last visited September 12, 2010).15 In a straw purchase, a person who is not the actual buyer of the gun undergoes the background check and completes the paperwork. An individual may participate in a straw purchase on behalf of a prohibited purchaser or a gun trafficker who does not want the gun to be traced back to him or her. A straw purchaser violates federal law by falsely completing federally required purchase paperwork. See 18 U.S.C. §§ 922(a)(6), 924(a)(1)(A), 3571 (2010).16 District of Columbia: D.C. Code. §§ 7-2505.02, 7-2507.06 (2010) (Misdemeanor subject to incarceration of one year or less); Hawaii: Haw. Rev. Stat. §§ 134-2(f), 134-2(h), 134-17(c), 706-663 (2009) (Misdemeanor subject to incarceration of one year or less); Illinois: 430 Ill. Comp. Stat. 65/3(a), 65/14(e), 730 Ill. Comp. Stat. 5/5-4.5-55 (2010) (Class A misdemeanor subject to incarceration of less than one year); Iowa: Iowa Code §§ 724.16, 903.1 (2010) (Aggravated misdemeanor subject to incarceration of two years or less); Maryland: Md. Code ann., pub. Safety §§ 5-136(b), 5-143 (2010) (Misdemeanor subject to incarceration of five years or less); Massachusetts: maSS. Gen. lawS ch. 140, §§ 128, 128A, 131E(b) (2010) (Subject to incarceration of between two and one-half and ten years); New Jersey: N.J. Stat. ann. §§ 2C:39-10(a), 2C:43-6(a)(4), 2C:58-3(a) (2010) (Crime of the fourth degree subject to incarceration of 18 months or less); New York: N.Y. Penal law §§ 70.15; 265.17 (2010) (Class A misdemeanor subject to incarceration of one year or less); North Carolina: N.C. Gen. Stat. §§ 15A-1340.21(b)(1), 15A-3410.23(c), 14-402(a) (2010) (Class 2 misdemeanor subject to incarceration of 30 days or less if no prior convictions); Virginia: Va. Code ann. §§ 18.2-10(f), 18.2-308.2:2(L1) (2010) (Class 6 Felony subject to incarceration of not less than one year nor more than five years). This classification does not include states that only criminalize a straw purchase on behalf of a prohibited purchaser, because a gun trafficker who participates in a straw purchase may not be a prohibited purchaser.17 18 U.S.C. §§ 922(a)(6), 924(a)(1)(A), 3571 (2010).18 Alabama: ala. Code §§ 13A-11-81, 13A-11-84(a) (2010) (Subject to incarceration of five years or less); California: Cal. penal Code § 12076(b)(1) (2009) (Misdemeanor subject to incarceration in a county jail of one year or less or incarceration in a state prison for a term of 8, 12, or 18 months); Colorado: Colo. Rev. Stat. § 12-26-103 (2009) (Misdemeanor subject to incarceration of one year or less); Connecticut: Conn. Gen. Stat. §§ 29-34(a), 53a-35a(7) (2010) (Class D felony subject to incarceration of not less than one year nor more than five years); Delaware: Del. Code ann. tit. 11, §§ 1448A(l), 4205(b)(7) (2010) (Class G felony subject to incarceration of up to two years); District of Columbia: D.C. Code §§ 7-2507.04(a), 7-2507.06, 22-4511, 22-4515 (2010) (Subject to incarceration of one year or less); Florida: Fla. Stat. §§ 775.082(3)(d), 790.065(12) (2009) (Felony of the third degree subject to incarceration of five years or less); Hawaii: Haw. Rev. Stat. §§ 134-17(a), 706-660, 706-663 (2009) (Misdemeanor subject to incarceration of one year or less;
A REPORT FROM MAYORS AGAINST ILLEGAL GUNS 37

if done intentionally, then it is a Class C felony subject to incarceration of five years or less); Illinois: 430 Ill. Comp. Stat. 65/14(d-5), 730 Ill. Comp. Stat. 5/5-4.5-35 (2010) (Class 2 felony subject to incarceration of not less than three years and not more than seven years); Indiana: Ind. Code §§ 35-47-2.5-12, 35-50-2-7 (2010) (Class D felony subject to incarceration of between six months and three years); Iowa: Iowa Code §§ 724.21, 902.9(4) (2010) (Class D felony subject to incarceration of five years or less); Maryland: Md. Code ann., Pub. Safety § 5-139 (2010) (Misdemeanor subject to incarceration of three years or less); Massachusetts: MaSS. Gen. lawS ch. 140, §§ 129, 129B(8), 131P(d) (2010) (Subject to incarceration of two years or less, depending on the circumstances under which false information is given); Michigan: MICH. Comp. lawS § 750.232a (2010) (Felony subject to incarceration of four years or less if individual makes material false statement on an application for a license to purchase a pistol; Misdemeanor subject to incarceration of 90 days or less if individual uses false identification to purchase a firearm); Minnesota: MInn. Stat. § 624.7131(11), 609.0341(1) (2009) (Gross misdemeanor subject to incarceration of one year or less); Nebraska: Neb. Rev. Stat. §§ 28-105, 69-2408, 2420 (2010) (Class IV felony subject to incarceration of five years or less); New Hampshire: N.H. Rev. Stat. ann. §§ 159:11, 651:2 (2010) (Misdemeanor subject to incarceration of one year or less); New Jersey: N.J. Stat. Ann. §§ 2C:39-10(c), 2C:43-6 (2010) (Crime of the third degree subject to incarceration of between three years and five years); New York: N.Y. Penal law §§ 70.15, 175.30, 400.00 (2010) (Class A misdemeanor subject to incarceration of one year or less); North Dakota: N.D. Cent. Code §§ 62.1-03-04, 62.1-03-06, 12.1-32-01 (2010) (Class A misdemeanor subject to incarceration of one year or less); Oregon: OR. Rev. Stat. §§ 161.615, 166.416 (2010) (Class A misdemeanor subject to incarceration of one year or less); Pennsylvania: 18 Pa. ConS. Stat. §§ 1103(3), 6111(g)(4) (2010) (Felony of the third degree subject to incarceration of seven years or less); Rhode Island: R.I. Gen. lawS §§ 11-47-23 (2009) (Subject to incarceration of five years or less); South Carolina: S.C. Code ann. §§ 23-31-160, 23-31-190 (2010) (Felony subject to incarceration of five years or less); Utah: UtaH Code ann. §§ 76-3-203(3), 76-10-527(2) (2010) (Felony of the third degree subject to incarceration of five years or less); Virginia: Va. Code ann. §§ 18.2-10(e), 18.2-308.2.2(K) (2010) (Class 5 felony subject to incarceration of ten years or less); Washington: WaSH. Rev. Code §§ 9A.72.040, 9.41.090(6), 9A.20.021 (2010) (Gross misdemeanor subject to incarceration of one year or less); Wisconsin: WIS. Stat. § 175.35(2e), 175.35(3) (2010) (Subject to incarceration of 9 months or less).19 Maine punishes violators with a fine only of $50. Me. Rev. Stat. ann. tit. 15, § 455(2) (2009).20 Dealer inspection laws, dealer record keeping laws, and state licensing of gun dealers, along with other laws, may also impact gun trafficking. Daniel Webster, et. al. Effects of State-Level Firearm Seller Accountability Polices on Firearm Trafficking, 86 J. of uRb. HealtH 525, 525, 527-530 (May 2009). Academic experts have noted that, as with each of the gun laws analyzed in this report, enforcement may vary from state to state and that a lack of enforcement can mitigate the effectiveness of these laws. However, enacting these laws provides a mechanism to prosecute dealers that violate gun laws and is an important initial step to deter gun trafficking. 21 18 U.S.C. §§ 922(t)(1), 3571, 3581; 27 C.F.R. § 478.124 (2010).22 Alabama: Ala. Code §§ 13A-11-79, 13A-11-84(a), 41-9-649 (2010) (Subject to incarceration of less than one year); California: Cal. penal Code § 12076(c)(2), 12076(d)(1) (2009) (Misdemeanor subject to incarceration in a county jail of one year or less or incarceration in a state prison for a term of 8, 12, or 18 months); Connecticut: Conn. Gen. Stat. § 29-33(c), 29-33(i), 53a-35a(7) (2010) (Class D felony subject to incarceration of not less than one year nor more than five years); Delaware: Del. Code ann. tit. 11, §§ 1448A, 4206(a) (2010) (Class A misdemeanor subject to incarceration of one year or less); District of Columbia: D.C. Code §§ 7-2505.02, 7-2507.06 (2010) (Subject to incarceration of one year or less); Florida: Fla. Stat. §§ 775.082(3)(d), 790.065(1) (2009) (Felony of the third degree subject to incarceration of five years or less); Georgia: Ga. Code ann. §§ 16-1-10, 16-11-172, 17-10-3 (2010) (Misdemeanor subject to incarceration of one year or less); Hawaii: Haw. Rev. Stat. §§ 134-2, 706-663 (2009) (Misdemeanor subject to incarceration of one year or less); Illinois: 430 Ill. Comp. Stat. 65/3(a), 65/14(e), 730 Ill. Comp. Stat. 5/5-4.5-55 (2010) (Class A misdemeanor subject to incarceration of less than one year); Indiana: Ind. Code §§ 35-47-2.5-4(a), 35-47-2-23, 35-50-3-3 (2010) (Class B misdemeanor subject to incarceration of 180 days or less); Iowa: Iowa Code §§ 724.16(1), 903.1(2) (2010) (Aggravated misdemeanor subject to incarceration of two years or less); Maryland: Md. Code ann., pub. Safety §§ 5-120, 5-121, 5-143 (2010) (Misdemeanor subject to incarceration of less than five years); Michigan: MICH. Comp. lawS §§ 28.422, 750.223(1) (2010) (Misdemeanor subject to incarceration of 90 days or less); Minnesota: MInn. Stat. §§ 624.7132, 609.0341(1) (2009) (Gross misdemeanor subject to incarceration of one year or less); Nebraska: Neb. Rev. Stat. §§ 28-105(1), 69-2410, 69-2421 (2010) (Class IV felony subject to incarceration of five years or less); New Jersey: N.J. Stat. ann. §§ 2C:39-10, 2C:43-6, 2C:58-2(a) (2010)
38 TRACE THE GUNS: THE LINK BETWEEN GUN LAWS AND INTERSTATE GUN TRAFFICKING

(Crime of the fourth degree subject to incarceration of 18 months or less); New York: N.Y. Penal law §§ 70.15, 400.00 (2010) (Class A misdemeanor subject to incarceration of one year or less); North Carolina: N.C. Gen. Stat. § 14-402, 14-404, 15A-1340.21(b)(1) (2010) (Class 2 misdemeanor subject to incarceration of 30 days or less if no prior convictions); Oregon: OR. Rev. Stat. §§ 166.412(2)(d), 166.418, 161.615 (2010) (Class A misdemeanor subject to incarceration of one year or less); Pennsylvania: 18 Pa. ConS. Stat. §§ 1104, 6111(b)(3), 6111(g)(1) (2010) (Misdemeanor of the second degree subject to incarceration of two years or less); Rhode Island: R.I. Gen. lawS §§ 11-47-26, 11-47-35(a)(2) (2009) (Subject to incarceration of five years or less); Tennessee: Tenn. Code ann. §§ 39-17-1303(a)(3), 39-17-1316(c), 40-35-111(e) (2010) (Class A misdemeanor subject to incarceration of 11 months and 29 days or less); Utah: UtaH Code ann. §§ 76-3-204(1), 76-10-526, 76-10-527 (2010) (Class A misdemeanor subject to incarceration of one year or less); Virginia: Va. Code ann. §§ 18.2-10(f), 18.2-308.2.2(B), 18.2-308.2.2(L) (2010) (Class 6 felony subject to incarceration of five years or less); Washington: WaSH. Rev. Code §§ 9.41.090, 9.41.110(8), 9A.20.021(1)(c) (Class C felony subject to incarceration of five years or less) (2010); Wisconsin: WIS. Stat. §§ 175.35(2)(c), 175.35(3) (2010) (Subject to incarceration of 9 months or less).23 18 U.S.C. §§ 921(a)(21)(C), 921(22), 922(a)(1)(a) (2010). 24 18 U.S.C. § 922(t)(1); 27 C.F.R. §§ 478.124, 478.129(b) (2010). This report classifies states that require state-issued permits as having closed the Gun Show Loophole, unlike The Movement of Illegal Guns in America, which did not. While instant background checks provide the most effective way of screening for prohibited purchasers, purchase permits that require background checks also screen for prohibited purchasers at some point in time.25 According to ATF, 30% of guns involved in federal gun trafficking prosecutions are connected in some way to gun shows. See Following the Gun: Enforcing Federal Law Against Firearms Traffickers, supra note 5 at 13 (2000) (gun shows were associated with 25,862 out of 84,128 total trafficked firearms connected to the prosecutions examined in the report).26 Certain states, such as California, Illinois, Connecticut, and Rhode Island, require background checks for all handgun sales at gun show and also require purchase permits to buy a handgun from a private seller. This analysis classified those states according to their gun show background check requirement.27 California: Cal. penal Code §§ 12072(d), 12082 (2010); District of Columbia: d.C. Code ann. §§ 7-2501.01, 7-2502.03, 7-2505.01, 7-2505.02 (2010); Rhode Island: R.I. Gen. lawS §§ 11-47-35 – 11-47-35.2 (2009).28 Connecticut: Conn. Gen. Stat. § 29-33(c) (2010); Pennsylvania: 18 pa. ConS. Stat. §§ 6111(b), 6111(c), 6111(f)(1), (2) (2010); Maryland: md. Code. ann., pub. Safety §§ 5-101(p), 5-101(r), 5-121, 5-124, 5-130(j) (2010). 29 Colorado: Colo. Rev. Stat. § 12-26.1-101 (2009); Illinois: 430 Ill. Comp. Stat. 65/3(a-5), 65/3.1 (2010); New York: n.y. Gen. buS. law §§ 895-897 (2010); Oregon: oR. Rev. Stat. §§ 166.412, 432-441 (2010).30 Hawaii: Haw. Rev. Stat. ann. §§ 134-2, 134-13 (2009); Massachusetts: maSS. Gen. lawS ch. 140, §§ 121, 129B, 129C, 131, 131A, 131E, 131P (2010); New Jersey: n.J. Stat. ann. § 2C:58-3 (2010).31 Iowa: Iowa Code §§ 724.15 – 724.20 (2010); Michigan: mICH. Comp. lawS §§ 28.422, 28.422a (2010); Nebraska: neb. Rev. Stat. ann. §§ 69-2403, 2404, 2405, 2409, 2410 (2010); North Carolina: n.C. Gen. Stat. §§ 14-402 – 14-404 (2010).32 After Coloradans passed a state referendum to close the Gun Show Loophole in 2000, Colorado’s export rate ranking decreased from 17th in 2000 to 27th in 2001. Since then, its export rate ranking has continued to decline, and in 2009, Colorado ranked 32nd among the states. See Americans for Gun Safety, The Gun Show Loophole and Crime, at 17 (February 2004). See also Tillie Fong, Colo. Hailed for Closing Gun Show Loophole; But Some Dispute Findings that Action has Cut Crime, Rocky Mountain News (Feb. 24, 2004). 33 18 U.S.C. § 922(t) (2010). 34 This measure overlaps with the analysis conducted of state laws requiring background checks for all handgun sales at gun shows. Sales by nonlicensed sellers are often collectively referred to as the “secondary market.”35 E.g. Conn. Gen. Stat. §§ 29-33, 29-36f – 29-36i (2010). However, not all of the states analyzed in this section require this. E.g. neb. Rev. Stat. ann. §§ 69-2403, 2404, 2405, 2409 (2010) (allowing a purchase permit application to be mailed to local law enforcement).
A REPORT FROM MAYORS AGAINST ILLEGAL GUNS 39

36 maSS. Gen. lawS. ch. 140, §§ 121, 129B, 129C, 131, 131A, 131E, 131P (2010) (allowing the licensing authority 40 days to approve or deny the application). But see 18 U.S. C. § 922(t)(1)(B)(ii) (allowing a gun sale if the federal background check is inconclusive after three business days).37 California: Cal. penal Code §§ 12800 – 12808 (2010); Connecticut: Conn. Gen. Stat. §§ 29-33, 29-36f – 29-36i (2010); District of Columbia: D.C. Code ann. §§ 7-2502.01, 7-2502.03, 7-2502.07 (2010); Hawaii: Haw. Rev. Stat. ann. §§ 134-2, 134-13 (2009); Illinois: 430 Ill. Comp. Stat. 65/1 - 65/15a (2010); Iowa: Iowa Code §§ 724.15 – 724.20 (2010); Maryland: md. Code ann., pub. Safety §§ 5-118, 5-121 (2010); Massachusetts: maSS. Gen. lawS ch. 140, §§ 121, 129B, 129C, 131, 131A, 131E, 131P (2010); Michigan: mICH. Comp. lawS §§ 28.422, 28.422a (2010); Nebraska: neb. Rev. Stat. ann. §§ 69-2403, 2404, 2405, 2409 (2010); New Jersey: n.J. Stat. ann. § 2C:58-3 (2010); New York: N.Y. penal law §§ 400.00 – 400.01 (2010); North Carolina: N.C. Gen. Stat. §§ 14-402 – 14-404 (2010); Rhode Island: R.I. Gen. lawS §§ 11-47-35 – 11-47-35.1 (2009). This analysis includes Nebraska, because Nebraska’s laws require individuals who purchase guns from private sellers to obtain a purchase permit. 38 Purchase permits can also vary by the type of firearm that they regulate. A smaller subset of these states – 4 states and the District of Columbia – also require purchase permits for shotgun and rifle sales. 39 States’ concealed carrying laws often allow exceptions for law enforcement officers and other small segments of the population, such as on-duty security guards.40 See e.g. fla. Stat. § 790.06(2) (2009). These states are sometimes referred to as “shall-issue” states, because authorities “shall issue” the permit if the listed criteria are met.41 Such laws grant varying levels of discretion. The broadest form of discretion is sometimes referred to as a “may issue” law, because it states that authorities “may issue” a permit – which allows them to choose not to issue it – or allow them to deny a permit for any sort of “good cause.” See e.g., Conn. Gen. Stat. § 29-28(b) (2010) (commissioner “may . . . .issue” permanent permits); wyo. Stat. § 6-8-104(b) (2010) (under which the state is “authorized” but not required to grant permits). Other states allow law enforcement to deny a permit based on a particular type of concern about the applicant, such as lack of “good moral character,” lack of “suitability” to receive a permit, or presenting a danger to oneself or the community. See e.g. Utah Code § 53-5-704(1)(a), (2)(a) (2009) (requiring that permits be denied if there is “proof that the applicant is not of good character”); mont. Code ann., § 45-8-321 (2) (2010) (“The sheriff may deny an applicant a permit to carry a concealed weapon if the sheriff has reasonable cause to believe that the applicant . . . may be a threat to the peace and good order of the community . . . .”). States that allow law enforcement to deny a permit to drug addicts, alcoholics or habitual drunkards are not included as allowing discretion because they apply only in very specific factual circumstances (and drug addicts are barred from possessing guns by federal law anyway).42 Law enforcement discretion allows police to prohibit gun possession by persons convicted of additional crimes beyond non-discretionary prohibitions under state or federal law.43 Such privileges are sometimes called “reciprocity,” because many states allow carrying under agreements in which two states agree to allow carrying by holders of each others’ permits. Other states have enacted statutes that allow carrying by anyone who holds a permit from a state with similar standards.44 For example, both Iowa and Nebraska exempt carry permit holders from purchase permit requirements and Virginia exempts carry permit holders from their limit of one handgun per purchaser per month. Iowa Code § 724.15(2)(d) (2010); neb. Rev. Stat. § 69-2403(2)(f) (2010); va. Code ann. 18.2-308.2:2(P)(2)(h) (2010).45 The following states grant broad discretion: Alabama: ala. Code § 13A-11-75 (2010); California: Cal. penal Code § 12050(a)(1)(A) (2009); Connecticut: Conn. Gen. Stat. § 29-28(b) (2010); Delaware: del. Code ann. tit. 11, § 1441 (2010); District of Columbia: d.C. Code § 22-4506; Hawaii: Haw. Rev. Stat. ann. § 134-9 (2009); Iowa: Iowa Code §§ 724.8, 724.11 (2009); Maryland: md. Code ann., pub. Safety §§ 5-303, 5-306 (2010); Massachusetts: maSS. Gen. lawS ch. 140, § 131 (2010); New Jersey: n.J. Stat. ann. § 2C:58-4 (2010); New York: n.y. penal law § 400.00 (2010); Rhode Island: R.I. Gen. lawS §§ 11-47-11, 11-47-18 (2009); Utah: 2010 Utah Laws ch. 62 (amending Utah Code § 53-5-704); Wyoming: wyo. Stat. ann. § 6-8-104 (2010). The following states grant limited discretion: Arkansas: aRk. Code. ann. § 5-73-308 (2010); Colorado: Colo. Rev. Stat. § 18-12-203 (2009); Indiana: Ind. Code ann. § 35-47-2-3 (2010); Maine: me. Rev. Stat. ann. tit. 25, § 2003 (2009); Michigan: mICH. Comp. lawS § 28.425b(5b)(7)(n) (2010); Minnesota: mInn. Stat. §§ 624.714(6)(a), 624.714(12)(b)(2) (2009); Missouri: mo. Rev. Stat. §§ 571.101; Montana:
40 TRACE THE GUNS: THE LINK BETWEEN GUN LAWS AND INTERSTATE GUN TRAFFICKING

mont. Code ann. § 45-8-321 (2009); New Hampshire: n.H. Rev. Stat. ann. § 159-6 (2010); Oregon: oR. Rev. Stat. § 166.293(2) (2010); Pennsylvania: 18 pa. ConS. Stat. § 6109 (2010).46 720 Ill. Comp. Stat. 5/24-1(a)(4) (2010); wIS. Stat. § 941.23 (2010). Because this report analyzes the effect of state laws on crime guns recovered in 2009 – and therefore sold in that year or earlier – it does not reflect states’ most current laws. Several states have recently changed their laws on concealed handguns; for example, the District of Columbia banned concealed carrying, see d.C. law 17-388 § 2(f) (repealing d.C. Code § 22-4506, which allowed the police to issue permits), and Utah removed its “good moral character” requirement for permits and so became a state with only narrow law enforcement discretion, see 2010 Utah Laws ch. 62 (amending Utah Code § 53-5-704). 47 Furthermore, laws that allow broader law enforcement discretion appear to have a greater effect. Thirteen states and the District of Columbia had “may issue” laws or otherwise granted broad law enforcement discretion (Alabama, California, Connecticut, Delaware, the District of Columbia, Hawaii, Iowa, Maryland, Massachusetts, New Jersey, New York, Rhode Island, Utah, and Wyoming). These states have an export rate of 6.6 crime guns per 100,000 inhabitants, and 14.9% of their exported crime guns have a short TTC. Both of these figures are lower than the average for states that grant some level of discretion.48 This figure includes Alaska and Vermont, the two states that allow people to carry concealed handguns without permits (and so grant no discretion to law enforcement). 49 18 U.S.C. § 922(g)(9) (2010). 50 In this report, “violent misdemeanors” refers to violent misdemeanor crimes other than domestic violence crimes. Domestic violence misdemeanants are already prohibited from possessing guns by federal law.51 See Garen J. Wintemute, et. al., Prior Misdemeanor Convictions as a Risk Factor for Later Violent and Firearm-Related Criminal Activity Among Authorized Purchasers of Handguns, 280 J. am. medICal aSS’n 2083, 2086-87 (Dec. 23, 1998); Garen J. Wintemute, et. al., Subsequent Criminal Activity Among Violent Misdemeanants Who Seek to Purchase Handguns, 285 J. am. medICal aSS’n, 1019, 1019-20, 1024 (Feb. 28, 2001). 52 Alabama: ala. Code §§ 13A-4-2(d)(4), 13A-5-7, 13A-7-7, 13-8-43, 13A-11-70, 13A-11-72 (2010) (including attempt to commit burglary in the third degree and attempt to commit robbery in the third degree); California: Cal. penal Code §§ 240, 241, 242, 243, 12021(c) (2010) (including assault and battery); Connecticut: Conn. Gen. Stat. §§ 53a-35a, 53a-58, 53a-61, 53a-175, 53a-217c (2010) (including criminally negligent homicide, riot in the first degree, and assault in the third degree); Delaware: del. Code ann. tit. 11, §§ 611, 1448(a)(1), 4391(1) (2010) (including assault in the third degree); District of Columbia: d.C. Code §§ 7-2501.01, 7-2502.03(a)(2), 2507.06, 22-404, 22-3006, 22-4501, 23-1331(4) (2010) (including assault); Hawaii: Haw. Rev. Stat. §§ 134-1, 134-7(b), 707-712 (2009) (including assault in the third degree); Illinois: 430 Ill. Comp. Stat. 65/8(k), 720 Ill. Comp. Stat. 5/12-1, 5/12-2, 5/12-3 (2010) (including assault, aggravated assault, and battery); Iowa: Iowa Code §§ 708.2C, 724.15(1)(e) (2010) (including assault in violation of individual rights); Maryland: md. Code ann., pub. Safety §§ 3-203, 3-802, 5-101(c), 5-133(c) (2010) (including assault in the second degree and stalking); Massachusetts: maSS. Gen. lawS. ch. 140, §§ 129B(1), ch. 265 § 13A (2010), Massachusetts Felony and Misdemeanor Master Crime List, available at http://www.mass.gov/courts/admin/sentcomm.html (including assault); Minnesota: mInn. Stat. §§ 609.582(4), 609.749(2), 609.2231(4), 624.713(1)(11) (2009) (including assault motivated by bias, burglary in the fourth degree, and harassment); New Jersey: n.J. Stat. ann. §§ 2C:39-7(6)(a), 2C:58-3 (2010) (including aggravated assault committed in another state); New York: n.y. penal law §§ 120.50, 130.52, 265.00(17), 400.00(1)(c) (2010) (including stalking in the third and fourth degrees, forcible touching, and criminal possession of a weapon in the fourth degree); North Dakota: n.d. Cent. Code. § 62.1-02-01(b), 12.1-17-03, 12.1-17-05 (2009) (including reckless endangerment and menacing); Pennsylvania: 18 pa. ConS. Stat. §§ 2709.1, 2902, 6105(b) (2010) (including stalking and unlawful restraint). This analysis considers a misdemeanor to be a crime punishable with incarceration of one year or less unless specified in a state’s statutes.53 Following the Gun: Enforcing Federal Law Against Firearms Traffickers, supra note 5, at 10.54 See Letter from Jerome M. Pender, Acting Assistant Director, Criminal Justice Information Services Division, FBI, to the Honorable Michael R. Bloomberg, Mayor of New York City (May 27, 2009) (on file with Mayors Against Illegal Guns).55 Id.
A REPORT FROM MAYORS AGAINST ILLEGAL GUNS 41

56 18 U.S.C. § 923(g)(6) (2010).57 Connecticut: Conn. Gen. Stat. § 53-202(g) (2010); District of Columbia: d.C. Code ann. § 7-2502.08(1)(A) (2010); Massachusetts: maSS. Gen. lawS ch. 140, § 129C (2010); Michigan: mICH. Comp. lawS § 28.430 (2010); New Jersey: n.J. Stat. ann. § 2C:58-19 (2010); New York: n.y. penal law § 400.10 (2010); Ohio: oHIo Rev. Code ann. §§ 2923.20(A)(5), (B) (2010); Rhode Island: R.I. Gen. lawS § 11-47-48.1 (2009).58 Legal Community Against Violence, Regulating Guns in America: An Evaluation and Comparative Analysis of Federal, State and Selected Local Gun Laws, at 11-15 (2008), details the case law surrounding preemption of local law in these states. This analysis excludes the District of Columbia because it is a federal district. In addition, although California and Nebraska expressly preempt local firearms regulation in limited areas such as registration or licensing, this report considers these states as allowing local control of gun laws because local governments in both states retain broad authority to regulate firearms outside these areas. Among states that broadly limit local control, local governments still have limited flexibility to enact gun laws. For example, Florida’s Constitution allows local counties in Florida to require background checks for all gun sales at public gun shows, which several counties have done. Article VIII § 5(b) of the Florida Constitution. In addition, more than 25 cities in Pennsylvania require reporting of lost or stolen guns, including Allentown, Erie, Harrisburg, Philadelphia, Pittsburgh, and Reading. Reviewing courts in Pennsylvania have dismissed lawsuits challenging this requirement. See National Rifle Association et. al. v. City of Philadelphia, 977 A.2d 78 (Pa. Commw. Ct. 2009); National Rifle Association v. City of Pittsburgh, 2010 Pa. Commw. LEXIS 309 (Pa. Commw. Ct. 2010).59 Although the Ohio Court of Appeals has ruled that Ohio’s law limiting local control was unconstitutional, this analysis classifies Ohio as a state that does not allow local control because: (1) the court ruling was issued only in November 2009, and (2) an appeal of this decision is currently pending before the Ohio Supreme Court. See City of Cleveland v. Ohio, 2009-Ohio-5968 (Ohio Ct. App. 2009).60 Effects of State-Level Firearm Seller Accountability Policies on Firearm Trafficking, supra note 20, as discussed in note 20, noting that one dealer regulation may work most effectively if a state has also enacted other dealer regulations, such as requiring dealers to conduct background checks, dealer record keeping laws, and state licensing of gun dealers, and that weak enforcement of these laws can mitigate their effectiveness.61 18 U.S.C. § 923(g)(1) (2010).62 Brian Bennett, Turning a Blind Eye to Gun Dealers, Time.com, May 8, 2007, available at http://www.time.com/time/nation/article/0,8599,1618392,00.html (last visited September 12, 2010) (reporting that ATF’s stated goal is to complete a routine inspection of dealers once every three years).63 William Krouse, Congressional Research Service, The Bureau of Alcohol, Tobacco, Firearms and Explosives (ATF): Budget and Operations for FY 2010, at 11 (2010). 64 John Vernick, et. al., Regulation of Firearm Dealers in the United States: An Analysis of State Law and Opportunities for Improvement, J.l. med. & etHICS, at 3-6 (Winter 2006). 65 See supra note 8. 66 See Youth Crime Gun Interdiction Initiative Crime Gun Trace Reports: National Report, supra note 4, at 27, 50-51 (2000) available at http://www.atf.gov/firearms/ycgii/2000/index.htm (last visited September 12, 2010).
42 TRACE THE GUNS: THE LINK BETWEEN GUN LAWS AND INTERSTATE GUN TRAFFICKING
