tracing university–industry knowledge transfer through a ... · level, such as the triple helix...
TRANSCRIPT
General rights Copyright and moral rights for the publications made accessible in the public portal are retained by the authors and/or other copyright owners and it is a condition of accessing publications that users recognise and abide by the legal requirements associated with these rights.
Users may download and print one copy of any publication from the public portal for the purpose of private study or research.
You may not further distribute the material or use it for any profit-making activity or commercial gain
You may freely distribute the URL identifying the publication in the public portal If you believe that this document breaches copyright please contact us providing details, and we will remove access to the work immediately and investigate your claim.
Downloaded from orbit.dtu.dk on: Mar 18, 2020
Tracing university–industry knowledge transfer through a text mining approach
Woltmann, Sabrina L.; Alkærsig, Lars
Published in:Scientometrics
Link to article, DOI:10.1007/s11192-018-2849-9
Publication date:2018
Document VersionPeer reviewed version
Link back to DTU Orbit
Citation (APA):Woltmann, S. L., & Alkærsig, L. (2018). Tracing university–industry knowledge transfer through a text miningapproach. Scientometrics, 117(1), 449-472. https://doi.org/10.1007/s11192-018-2849-9
1
1 Introduction
Impact is of increasing importance for universities in addition to traditionaltasks of research and teaching. This Third Mission means that many universi-ties expand their efforts beyond the production of knowledge to translate it intosocioeconomic relevant contributions(D’Este and Patel, 2007; Etzkowitz et al,2000). Driven by the need to make their research known in order to secure(public) funding, universities implement various forms of transfer activities,such as adaption of strategic licensing and university patenting, which ensurethat their findings are (commercially) utilized (Gulbrandsen and Slipersaeter,2007). However, the detection of relevant knowledge transfer remains non triv-ial. Thus, new methodologies are needed to quantitatively assess knowledgetransfer of universities to enable a more holistic analysis. This paper examinesthe transfer of university research to the industry through a novel combina-tion of methods based on established text mining tools. We use additional datasources and metrics, to move beyond the traditional proxy indicators. We aimto identify the potential and limits of contemporary text mining tools for adetection of identical knowledge pieces. Text documents are already used innumerous studies as data sources and are, hence, suitable to answer relevantpresent-day questions (Zhang et al, 2016). Our approach is unique, since itcaptures identical knowledge pieces in the university and the industry in its(geographical) proximity. The intention is to capture the transfer without fo-cusing on specific transfer channels, collaboration types or related commercial-ization mechanisms. The knowledge detection is made through the applicationof existing text mining methods, namely the latent dirichlet allocation (LDA)and the algebraic indexing method called term-frequency, inverse documentfrequency (TFIDF). LDA is a known topic model, used to identify underlyingstructures in entire text collections, while TFIDF indexing can be used to ex-tract keywords for single documents. We use a combination of both methodsto identify identical knowledge pieces.
2 Literature
Knowledge transfer concerns ”(. . . ) the conveyance of knowledge from oneplace, person or ownership to another. Successful knowledge transfer meansthat transfer results in successful creation and application of knowledge inorganizations ”Liyanage et al (2009)[p. 122], including the necessity of uti-lization of this particular knowledge.1 Given the particular role of universitieswithin the field of knowledge transfer, a great deal of literature has estab-lished a well developed empirical basis for the assessment of university drivenknowledge transfer (Agrawal, 2001; Perkmann and Walsh, 2007). The empir-ical approaches are often derived from integrated models on the institutional
1 Technology transfer and knowledge transfer are in the literature strongly interrelatedconcepts and are widely used as interchangeable terms (Grimpe and Hussinger, 2013; Sungand Gibson, 2000).

2
level, such as the triple helix model (Etzkowitz and Leydesdorff, 2000a), whichare regularly reduced to a bilateral university-industry focused concept thatinvestigates collaborations between universities and firms on individual, orga-nizational or national level (Siegel et al, 2003; D’Este and Patel, 2007).
Additionally, the research is also divided into formal and informal knowl-edge transfer. Formal transfer will eventually ”result in a legal instrumentalitysuch as, for example, a patent, license or royalty agreement (. . . )” (Arundeland Marco, 2008, p. 642), while informal transfer is seen as resulting frominformal communication and does not lead to outcomes that fall under intel-lectual property regulations (Tijssen et al, 2009; Link et al, 2007). Overall,the main attention in the literature on university-industry knowledge transferhas been given to formal knowledge transfer often focusing on the commer-cial value the knowledge yields (Thursby et al, 2001; Wu et al, 2015; Han,2017). Due to the abstract nature of knowledge transfer its actual measure-ment remains challenging and relies heavily on proxy indicators. The indicatorsfor formal (commercialized) knowledge transfer, even though well developed,fail to measure instances where knowledge cannot easily be commercialized,patented or licensed (Cheah, 2016; Cohen et al, 2002; Agrawal and Henderson,2002). These circumstances have left the research community with a gap intracing and measuring the university-industry knowledge transfer (Sung andGibson, 2000) and the need to investigate and assess potential new methods.
2.1 Text mining: empirical applications
One of the contemporary approaches to solve various kinds of measurementor detection challenges is the application of data mining or in particular textmining (Aggarwal and Zhai, 2012). In this regard, computational linguistics,the scientific base of text mining, became increasingly relevant for empiricalstudies in a number of unrelated academic fields (Yau et al, 2014; Aggarwaland Zhai, 2012; Gaikwad et al, 2014). Previously great insights in disciplineslike social sciences, biology, and economics have been achieved through the useof text mining tools (Zhang et al, 2016; Garechana et al, 2017). Text miningapplications have also gained traction within research concerning knowledgenetworks and knowledge flows (Magerman et al, 2010; Leydesdorff, 2004). Instudies investigating the influence on knowledge generation and dissemina-tion of universities, the triple helix model (Etzkowitz and Leydesdorff, 2000b)is often used as a foundation to unveil concrete knowledge linkages (Meyeret al, 2003). These studies aim to measure the underlying structures of the(knowledge driven) relationships between governments, academia, and indus-try and apply regularly text mining based measurements (Khan and Park,2011). These contemporary text mining applications are often used in com-bination with other bibliometric tools. An evaluation of university-industryinteraction can, for instance be done through and the identification of keywords and co-occurrences (Khan and Park, 2011). So today’s understandingof the triple helix interaction has been immensely increased by relying on

3
bibliometric, network and text mining approaches (Glanzel and Thijs, 2012;Zhang et al, 2014).
However, approaches on tracing knowledge transfer remain at a relativelyrudimentary level. Even though some studies show the successful applicationof text mining methods (Van Eck and Waltman, 2017; Tussen et al, 2000), theconcrete outcomes remain often undetected. The application of these methodsalso remain challenging (Meyer et al, 2003). The main challenges today includethe identification of the actual contributions of university research without lim-iting analyses to too narrow indicators or being to imprecise. Often only trendsare detected, since measures like citations and references do not hold up well inan industry context (Jaffe et al, 2000). Hence, new detailed measurements forknowledge transfer are needed. Our study provides an assessment of the use oftext mining methods to extract relevant pieces of knowledge from universitiesand identify them within companies’ public documents. The contribution andinnovative approach of this study is to identify the concrete pieces research,such as the results of an experiment or a novel method, from a universitypublication base and trace them.
3 Methodology
We focus on knowledge transfer overall, which particularly includes the aspectsof technology transfer.
Our approach is different to conventional knowledge flow detection in thesense that we aim to identify concrete research outcomes including for instancea concrete technology, method, algorithm, chemical formula etc. and focus lesson similar working fields or just coherent topics. This focus makes the actualidentification and verification more challenging in a technical sense. We usea combination of two well known techniques the latent dirichlet allocation(LDA) and the term-frequency, inverse document frequency (TFIDF). Thiscombination allows the extraction of relevant keywords per text and also forentire text collections, which allow a keyword comparison.
Generally, text mining can be used to describe the extraction of knowledgefrom free or unstructured text. This encompasses everything from informationretrieval to text classification and clustering (Kao and Poteet, 2007). Currentrapid developments in computational linguistics provide improved accuracyand feasibility (Chapman and Hall/CRC, 2010; Collobert et al, 2011). Thetask of identifying content similarity, however, remains up until today chal-lenging. In particular as the similarity between linguistically highly diversetexts remains widely unsolved.
In the following, we outline the particular methods and algorithms used tofulfill the study’s objectives. We aim to give insights into current developmentsin the field as well as determine the used methods and specify, parameters andtools used. We aim to trace concrete research outcomes from the university,which requires key word extraction, comparison, efficient pattern recognitionand similarity measures.

4
Identifying similarities within texts is a very particular area of text mining.Similarity measures can be based on probabilistic as well as algebraic mod-els. However, these practices are often used to detect actual paraphrasing andthese models are limited to identify word-to-word or phrase-to-phrase simi-larity (Rus et al, 2013). However, for our purpose these applications are toonarrow and focus plainly on the linguistic composition and are only applicableon extremely short text snippets.
We make use some of the same basic tools, but combine them in differentmanners to identify overlapping content for entire documents.
As we aim at tracing concrete research results from the university, it isnecessary to combine the comparison between topics and the TFIDF indexing.Therefore, it is not enough to identify that two corpora (a website and adepartment) share the same topic, for instance ’wind energy’, but that forinstance a new assessment model (developed and described in the publication)is used by the company. This insight can only be generated on a document-to-document level, but needs to be supported on a corpus topic level. Thisis crucial, since there are no other concrete indications for transfer, such ascitations or references.
3.1 Pre-processing
To apply text mining procedures, the pre-processing of the data is essential. Itentails data cleaning and additionally conversion of unstructured raw text intostatistical and computational useful units. The quality of text mining results ishighly depending on the thoroughness of the pre-processing. The main objec-tive is to capture relevant characters and erase obsolete items (Paukkeri andHonkela, 2010). We follow the procedures as described by Ponweiser (2012, p33), i.e.:
– Define word boundaries as white spaces,– Delete unwanted elements (e.g. special characters, punctuation, . . . ),– Convert all characters to lower case,– Remove stopwords (common words that don’t carry content information),– ’Stemming’ words, this reduces words to their morphological word stem
(Schmidtler and Amtrup, 2007, 126),– Remove words that are shorter than three characters.
The pre-processed texts are merged into structured units and, in our case,also thematically classified units, the text corpora. To prepare the texts collec-tions into a statistically useful format, the corpora are converted into document-term matrices. A document-term matrix is the most common vector space rep-resentation of document corpora. Rows correspond to documents and columnsto terms. It contains the feature (term) frequencies (number of occurrences)for each document (Richardson et al, 2014; Chapman and Hall/CRC, 2010).These matrices are usually highly dimensional and sparse and accordinglymost text mining methods most include dimensionality reduction (Berry andCastellanos, 2007).

5
Fig. 1 Steps of statistical method application for the different samples

6
In a document-term matrix the element at (m,n) is the word count (fre-quency) of the i’th word (w) in the j’th document (d).
Term−Documentmatrix =
wn
x1,1 x1,2 ... x1,ndm x2,1 x2,2 ... x2,n
.... . .
xm,1 xm,2 ... xm,n
(1)
3.2 Term weighting and indexing schemes
Various term weighting schemes, determining the value of each entry, are avail-able. The weight for each term can be derived by the application of differentmeasures and is based on the frequencies of term occurrences. Specific textmining models rely on a particular term weighting input (Xia and Chai, 2011).
– Binary weighting takes values 1 or 0 depending on whether or not a termoccurs,
– Term-frequency (TF), which is the actual number of occurrences of a termfor a given document.
– Term-frequency, inverse document frequency (TFIDF), assigns higher weightto terms that occur in a small number of documents (Xia and Chai, 2011).
The TFIDF is a simple numerical indexing method, which has been appliedin various contexts (Franceschini et al, 2016; Zhang et al, 2016) and givesrespectable results on its own, but it also serves as basis for various moreadvanced models, like the Vector Space Model (VSM) or Latent SemanticAnalysis (LSA) (Mao and Chu, 2007).
The principal assumption behind the TFIDF is that words that occur oftenin a document are relevant for its content, but words that are used in manydocuments are less content specific for the single document. Frequent wordsthat are used in many texts carry less contextual information and obtain alower score (Robertson, 2004). TFIDF indexing enables a dimensionality re-duction providing a small set of content relevant terms. Most commonly theTFIDF is calculated by multiplying the term frequency TF , the number oftimes word w appears in document d; and the inverse document frequencyIDF , which is the logarithm of the total number of documents D divided bythe number of documents that contain the word w denote dw (Aizawa, 2003).
TF (w, d) =∑
wi
IDF (w,D) = log(D
dw)
TFIDF = tf(w, d)× idf(w,D)

7
The TFIDF approach suffers from some shortcomings. First, it might repre-sent only the content of a particular text fragment, which is a major drawbackfor long texts. Second, IDF assumes that terms, which rarely occur over a col-lection of documents, are more content related, while in reality they are justmore distinctive. Third, empty terms and function terms are often assignedtoo high scores (Xia and Chai, 2011). Nevertheless, the TFIDF approach hasbeen proven to provide very robust and high quality results (Robertson, 2004).
For the purpose of this study, we use (among other metrics) the TFIDFindexing to determine the most characteristic words for each document. Herebywe reduce the dimensionality and enable a comparison of keyword of differenttexts with each other. Hence, the lists, generated for each document are usedto identify common terms between two types of documents, abstracts andwebsite pages.
3.3 Latent Dirichlet Allocation (LDA)
LDA is an application of topic modeling and is a fully automated method basedon statistical learning, which aims to identify latent (unobservable) topicalstructure in a text corpus (Blei et al, 2003; Griffiths and Steyvers, 2004). LDAextracts underlying structures of texts and translates them into topics, whichare composed of terms that are assigned together with a certain probabilityto each topic.
LDA works as follows, described by Grun and Hornik (2011, p. 4) andPonweiser (Ponweiser (2012, p.15)):
1. For each topi,. we decide what words are likely (term distribution describedas β ∼ Dirichlet(δ)
2. For each document,(a) we decide what proportions of topics should be in the document, (topic
proportions defined by θ ∼ Dirichlet(α).i. for each word in the document:
A. we choose a topic (zi ∼Multinomial(θ)).B. given this topic, we choose a likely word (generated in step 1.)
from a multinomial probability distribution conditioned on thetopic zi : p(wi|zi, β).
To improve the performance of the LDA we added one pre-processing stepthat excluded terms, which occur in more than 90% of the documents in thedocument-term matrix. The resulting topics are more specified and do notcontain generic terms. The LDA algorithm needs to start with a pre-definednumber of topics denoted K. Separate approaches were used for estimatingK for the academic corpora and for the companies website corpora. For theacademic abstracts, K was estimated using the following approach: we ap-proximate the marginal corpus likelihood (depending on K) by taking theharmonic mean for each corpus after applying LDA for different numbers ofK. Hereby we are sampling the best ’fit’ for a set of possible K values. The

8
harmonic mean takes one chain of samples as argument to first collect all sam-ple log-likelihoods and subsequently calculates the harmonic mean of theselikelihoods. The log-likelihood values are determined by first fitting the modeland to do this over a sequence of topic models with different numbers of topics.This is an approximation of p(w|K), i.e., the likelihood of the corpus giventhe number of topics (Ponweiser, 2012). The upper level for K was set to 200.However, this method is computationally very expensive and is therefore onlyfeasible for the shorter texts in the academic corpora.
For the websites corpora, we set the topic number according to each indi-vidual corpus size. We simply use the total number of documents for settingK, assuming that a larger corpus contains more distinct topics:
Dm ≥ 3000 : K = 200
Dm ≥ 2000 : K = 150
Dm ≥ 1000 : K = 100
Dm ≤ 1000 : K = 50
The hyper-parameters for the LDA are in our case aligned to the needsto identify common content rather than to classify a document into a topic.Hence, we use the Gibbs sampling for determining the posterior probabilityof the latent variables. We use standard α =50/k as parameters of the priordistributions. For more information on determining the posterior probabilityof the latent variable see B. Grun and K. Hornik Grun and Hornik (2011).
3.4 Jaccard Similarity Coefficient
To measure the similarity between the sets of identified keywords, we use theJaccard similarity coefficient as metric (Niwattanakul et al, 2013). We chosethis similarity measure as it only includes element presence in a given set. Itis applicable for the LDA and/or TFIDF generated keywords. This has twomajor advantages for our purpose: First, Jaccard similarity is not based on theinput of scores or probabilities, which would in our case be hard to compare,since they result from different corpora and even usual normalization’s arenot necessarily good enough. Second, the overlap over terms is comparativelylow, due to the high linguistic difference between academic writing and publicwebsites, which is not the case for most other studies, focusing on more similartypes of documents (Zhang et al, 2016). Therefore in our case a set compar-ison is more relevant. The similarity measure yields scores that are highlydependant on pre-processing and data type, and therefore needs specificallyadjusted thresholds for our study. However, this said, it is not given that inother circumstances with similar goals other similarity measures, such as thecosine similarity or euclidean distance will not be more appropriate.
The Jaccard similarity is based on the size of the intersection divided by thesize of the union of the sets. The measure is between 0 and 1, 1 indicating most

9
similarity (identical sets) and 0 indicating least similar: no common feature inthe two sets. Given the set of keywords from one document of the publicationdatabase denoted KA and the second set of keywords from one page of thewebsites denoted KB , the Jaccard similarity denoted J(KA,KB) is obtainedwith:
J(KA,KB) =|KA ∩KB ||KA ∪KB |
=|KA ∩KB |
|KA|+|KB |−|KA ∩KB |
The thresholds for a minimum similarity for further examination were cho-sen based on preliminary results. In all applications, we only consider it apotential match if keyword lists return a certain minimum Jaccard similar-ity. However, the Jaccard similarity tends to benefit smaller sets. Hence, wedecided to set a common threshold to a minimum of 0.13 and another usedindicator threshold consisted in multiplying the Jaccard similarity with theintersection of the two sets, giving higher weight to sets with a higher amountof common words. Two sets with Jaccard similarity lower than 0.15 need morethan 7 words in common in order to pass the criteria, while set pairs withJaccard similarity higher than 0.15 can have smaller intersections.
3.5 Manual classification and verification
To determine whether the findings of the algorithms are actually relevant orvalid, we needed human inspection and final verification. This is necessarysince we are working with unlabeled text data and would not be able to verifythe results without human confirmation. This step verifies the data and enablesinsights about the performance of the computational tools. Especially, sincethe data sample does not provide the possibility to have a labeled trainingdata set, meaning that we have no training data, which could offer objectivelabels for the text matches. However, this is not really a possibility due tothe huge amount of text pairs and the high level of complexity of the textdocuments.
We used 3 independent people from different disciplines to decide aboutthe similarity of the text snippets. They were asked to categorize the textmatches into one of 5 categories:
1. Identical topic = University contribution2. Identical topic = Potential university contribution3. Common topic = Unlikely directly related4. Different topic = No match in content5. Unclear = could not be classified
In the first label we included also findings about identical topics, which are aUniversity contribution, but to a public entity, or media article or news aboutuniversity research. If needed the people could resort to the actual full textpublication, in case the abstract did not provide enough information for a finalverification.
10
The human result classifiers background is as follow: three academics (PhDstudents) from different fields and one engineer. A fourth person was thenmaking final decisions when disagreement is observed between the three humanclassifiers.The general idea is to use people that are capable to identify researchtopics and applications in various context.
4 Test Data Sample
To test our text mining methods we use Technical University of Denmark(DTU) and its economic environment as example case. To establish a first testsample, DTU is an appropriate case for this research for the following rea-sons: First, focusing on a technical university enabled us to study leading edgetechnology research with direct connections to industry innovation. Second,DTU provides a well documented case and the number of research institutionsin Denmark is rather small, which allows straightforward attributions to aspecific university. Third, Denmark has a high level of digitization and dataavailability, making it a promising setting for applying text mining. The scopeis ideal as a first use case especially since DTU has already a comparativelyhigh level of commercially relevant knowledge (http://www.dtu.dk/english/Collaboration/Industrial_Collaboration) and industry ties, which sup-ports the assumption that there it is a fruitful case for tracing knowledgetransfer. The type of research is very applied and hence highly relevant to theprivate economy.
As we aim to detect knowledge transfer from universities to the industry,we use the research output of the university as baseline since publication textsare the formalized output and dissemination channel of university researchand contain all important research findings of a university (Toutkoushian et al,2003). On the other hand, we use websites, which are companies channels usedto ensure their visibility for potential consumers and investors including theirmost recent R&D successes and collaboration efforts(Branstetter, 2006; Heinzeand Hu, 2006). The comparison of these two sources aims to detect knowledgeoverlap seems feasible.
Furthermore, Denmark, as national context, is ideal as its research is almostexclusively published in English language and most companies also use Englishas secondary, if not as first corporate language. This is highly relevant forthe application of the text pattern recognition and for co-word occurrencemeasures.
4.1 Publication Database
We focus only on recent research outcomes by a university and exclude widelyknown and commonly accepted knowledge. Therefore, only novel scientificinsights, technological innovations, like leading edge technologies shape thescope of this study.

11
Table 1 Total publications for the years: 2005-2016
Year Abstracts Only Texts Abstract OR Text All publications
2005-2010 16,502 2,738 3,854 40,4552011-2016 28,517 5,137 11,963 38,0112005-2016 45,019 7,875 15817 78,466
To identify relevant university research, we use the universities publicationspublished by the university between 2005 and March 2016 . In the case of DTU,the data is taken from a database named ORBIT http://orbit.dtu.dk/en/.The retrieved entries present main research outputs by at least one employeeof the university. However, the registration of research items only becamemandatory in the year 2012, so it is important to mention that data coverageis not equal across the all years of the observation. The data provided bythe database include a collection of academic abstracts, open-source full-textpublications and publication meta-data. The meta-data includes among others:year, author(s), title, journal name, university section id, internal id, and DOI(digital object identifier). The number of all publication records for the timeperiod is 78,466. For more detailed information on the available publicationdata, see Table 1. We cleaned the abstract data by removing all entries, whichhad no real text in the abstracts field, which resulted in 55 removed entries.
We classified the texts (abstracts and full-texts) by their database assigneddepartmental codes, which we converted into collections of research areas. Thisprovides a pre-classification of texts by their fields. The sub-setting resultedin 24 separate research fields (see Section 2) of which three are irrelevantfor the academic output of the university. (We excluded approximately 250articles including 1) publications registered to the university administration,2) publications registered to the bachelor program, and 3) one set that wasdirectly linked to a large company). The collection of these research area basedcorpora will in the following be referred to as ’academic’ corpora or by theirindividual name if this is relevant for the interpretation of the results. Mosttext mining methods perform better on more contextual coherent corpora andhence achieve better performances.
The distribution shows that the coverage and also the research outputvaries a lot between the research fields. This is crucial to keep in mind whenanalyzing the amount of observed knowledge transfer according to the fields.Especially, given that fields like Nuclear technology have only 316 abstractsbut a high coverage since the entire output is only 422 articles, this might bedue to the size of the research group at the university and/ or the groups age(see Section 2)
We chose the abstracts to serve as main research sample. This shortenscomputational time and enables better investigation of relevant fields andtexts. The findings from this preliminary analysis are then used to find mostrelevant corpora for more in-depth and more extensive exploitation of themethods.

12
Table 2 Data coverage by research field: 2005-2017
Department Abstract Text Total % of Abst
Compute/Math 3890 1933 5791 67%Biochemistry 2343 1038 4338 54%Chemistry 1420 413 2352 60%Civil Eng. 2122 1017 3675 58%Electrical Eng. 3519 1778 4363 81%Energy Conversion 1244 521 1536 81%Environmental Eng. 1699 1269 3851 44%Management Eng. 2569 1886 4521 57%Mechanical Eng. 2999 1223 4293 70%Nanotechnology 1935 918 3064 63%Photonics 4262 2090 5617 76%Physics 1434 685 1911 75%Biology 2339 902 3562 66%Transport 860 470 1686 51%Wind Energy 1421 1158 1972 72%Food Sciences 2846 1651 6210 46%Aquatics 1481 787 4786 31%Space Research 1432 782 2137 67%Nuclear Technology 316 200 422 75%Veterinary Sciences 1520 820 2594 59%Other 2648 1954 8841 30%
4.2 Companies
The second data source, providing the company knowledge, was gathered fromcorporate company websites, since knowledge chunks, which are displayed ona website have to be of a certain commercial relevance for a firm.
First, we identified the key criteria for relevant companies, which are de-fined as: a) having a national (Danish) company registry number (CVR) andb) having had a collaboration contract with the university between 2006 and2016. This constitutes a direct formal link between the companies and theuniversity, which is the ideal basis to test and verify the new method.
To identify more potentially relevant companies, we generated one net-work on the basis of hyperlinks between the university and company websites.Hereby we identified additional partners linked to the university website. Thelist of websites contained many online service platforms. Large online serviceproviders and social media sites (e.g. Google, Facebook, or YouTube) wereexcluded from the sample.
The websites themselves needed to provide as a minimum a set of 5 Englishweb-pages with in English minimum of and more than 100 English words perpage and display the CVR number on the website. We fetched the HTMLcontent of the websites using a self designed web-crawler (https://github.com/nobriot/web_explorer) and converted it to usable plain text cleaningit from any remaining code tags. These online text samples were collectedbetween August 2016 and November 2016. Exploring the websites, we visited

13
908,288 total web-pages (single text documents in total), that had to be filteredby the above mentioned criteria for websites.
The number of total number of companies, which could be identified ascollaborators of the university between 2006-2016 was 1225 of which 699 hada CVR number written on their website and 544 were displaying the An-partsselskab (ApS) abbreviation (which describes limited liability companiesin Denmark). Certain companies went out of business, underwent mergers orwere just renamed. We tried to identify the new names or entities, howeverthis was not in all cases possible. We were left with a final sample of 445 com-panies. The firms in this sample operate mainly in technology intensive sectorsand are firms with strong R & D divisions. Therefore it included companieswith contents related to the research performed at the university.
To provide an overview of the composition of the firm sample we decidedto identify the main industry field of each company by using additional textbased tools. This is reasonable since the identification of topics and clusteringof texts has a long tradition and has successfully been used in various researchareas.
Table 3 Page and term numbers per website (descriptive)
Pages (P.) P. Mean P. Median Terms T. Mean T. Median
total 138544 311 69 2185191 4911 2233lower boundry 5 – – 38 – –1st quantile 22 12 10 905 521 5232nd quantile 69 42 40 2233 1476 14083rd quantile 257 142 130 6018 3819 36754th quantile 10106 155 591 67351 13866 10466
We applied the LDA for the clustering of companies (for more details seeSection 3 to identify the main categories for the firms, showing the overalldistribution of firms that work within one topic or field. We used our knowl-edge of the sample to set the optimal number of topics (K = 45). To avoidtoo generic topic clusters we erased all words that were used in more than80% of the websites, which removes website specific terminologies, such as thecontact information, impressums and similar. For a better understanding wesummarized the single topics with their most relevant keywords for each topic(see Table 4). The clustering cannot be assumed as reliable as the labels fromthe scientific fields, however they show clear focus in some fields (see Table 5).
The number and length of pages varies a great deal between companywebsites (see Table 3). Some have an English summary for their main contents,while others, often multinationals have their entire website in English. Thisdifference in length clearly influences the performance of the statistical models,since long text documents generally influence these models more than shortones. In this sample collection, we also ensured to capture the content of PDFsor similar formats stored on the websites. These required special treatment

14
Table 4 Example topics for the company websites with their top terms
Topic 1 Topic 2 Topic 3 Topic 4 Topic 5 Topic 6
design gas hear health product shareproduct oil loss sustain food reportpartner develop implant board process annualcustom report support report sugar cashread million sound news farm market
Topic 7 Topic 8 Topic 9 Topic 10 Topic 11 Topic 12
water drink lab network oil healthpower milk cell support vessel journalplant cream order data gas researchsystem process center center ship clinicpump fill support switch power medic
Topic 13 Topic 14 Topic 15 Topic 16 Topic 17 Topic 18
custom drill wind light cancer plandata reservoir project electron influenza consultplatform seismic system power prevent projectnetwork fluid public wire flu designcloud data product tool control environment
Table 5 Topic distribution of the websites
Topic nr. 1 2 3 4 5 6 7 8 9 10 11 12 13 14 1526 3 4 2 37 6 1 9 12 7 1 7 21 25 1
Topic nr. 16 17 18 19 20 21 22 23 24 25 26 27 28 29 3034 1 16 23 13 9 2 2 3 2 7 2 10 2 7
Topic nr. 31 32 33 34 35 36 37 38 39 40 41 42 43 44 451 61 2 17 5 4 2 11 1 3 21 3 4 13 2
and are treated as pages of the websites. Each website is stored as its owncorpus. Even though this might seem drastic, it is a sufficient way to ensure acomparable pre-classification like research fields and fosters the performanceof the statistical methods.
5 Results
We divide this section according to the results of each applied method to givean explicit insight into the performances and future potential of the singleapplications. It is crucial to keep in mind that this study is a first step toverify effectiveness, limitations and eventually identify applicable thresholdsand suggest future improvements. Finally, we set the results into context andevaluate the outcomes based on the studies objectives. In each subsection weclearly describe which data samples are used and why. This is crucial because ofthe varying demands of the different methods. The different methods generated

15
different outcomes in terms of keyword lists, due to their different levels ofapplication (document or corpus level)(see Table 6).
Our pre-processing revealed some specific challenges, in particular in thecase of the academic abstracts. The abstracts contain, for instance, chemicalformulas and notations, which rely heavily on numbers and/or special charac-ters. These are removed during the course of the pre-processing and thereforelost in the subsequent application. The only possibility to later identify sameformulas to use them for similarity measures is the assumption that the re-moval of those characters will always result in an identical end character string,but it might not always be the case. Often the result may not be identifiable asthe particular formula, but still provides a match. In some rare cases HTML,or other code tags prevented the identical deconstruction and in such cases, wedid not find a way to identify the matching strings. However, some terms mayseem like the result of poor pre-processing, but are in reality just a representa-tion of specific models, formulas or project names shrunk to an unidentifiablestring of characters. The websites on the other hand are challenging in a dif-ferent way: they contain different language snippets, which are embedded inevery site forcing language detection on lower levels. Therefore we decided toonly integrate web-pages that have a minimum of 80% English terms. Addi-tionally we found that the linguistic composition of websites is comparativelyrepetitive within a website, meaning that the words companies use to describeproducts or services are not very diverse, which leads to high number countsfor single terms. Publications, on the other hand, have a much richer vocabu-lary and therefore suffer less from this skewed word distribution. To accountfor this different composition of the two text types we normalized or removedthe words in question when needed.
5.1 Text Comparisons
To identify potential text documents with identical knowledge pieces we firstcompare the keywords from publications and websites with the computa-tional methods.Hereby, we identify text pairs that potentially contain identicalknowledge content. However, in the final step these potential matches have tobe manually verified.
The keywords are derived through TFIDF indexing or extracted from thetopics of LDA. The LDA on the academic corpora resulted in 915 distinctivetopics for all 21 academic corpora. The LDA for the websites resulted in 8250distinct topics (see Table 6).
To verify the performance of the LDA application, we manually inspectedthe derived topics for several corpora to ensure the performance, including thedecision regarding topic numbers and prior settings.
The manual inspection revealed a much clearer picture with the academictexts than with the websites. The topics for the single scientific areas seemvery distinct and reasonable (see Table 7).
16
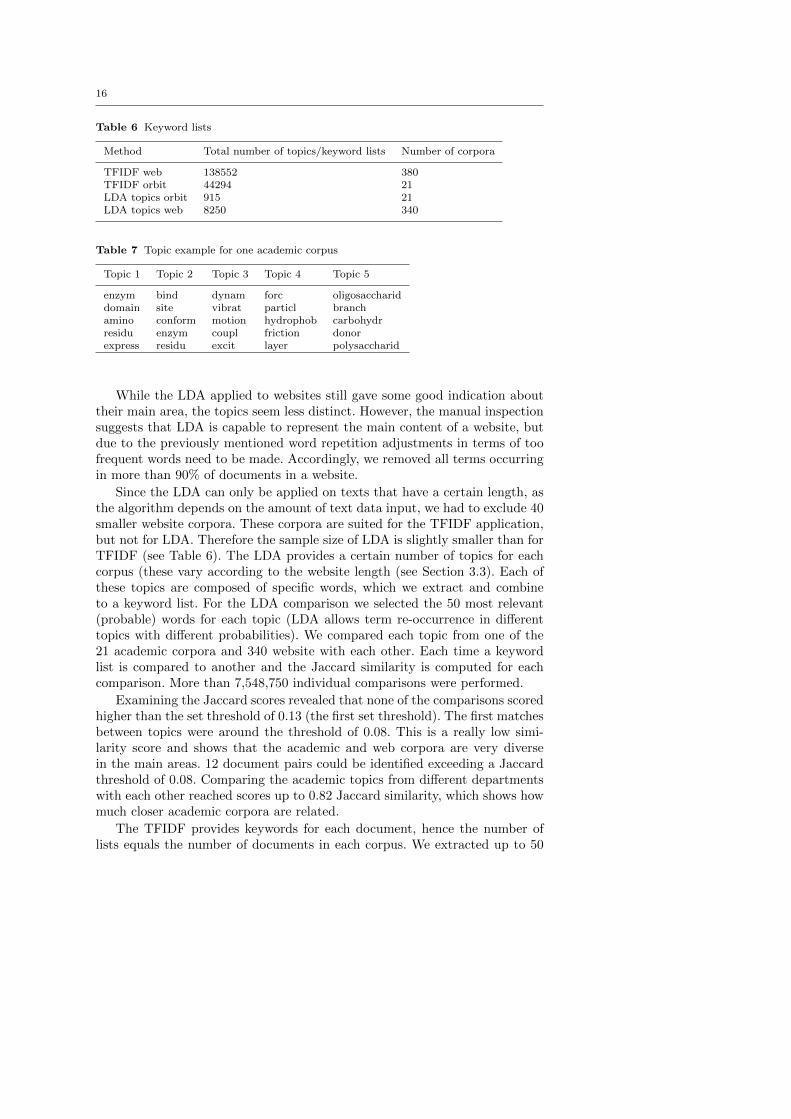
Table 6 Keyword lists
Method Total number of topics/keyword lists Number of corpora
TFIDF web 138552 380TFIDF orbit 44294 21LDA topics orbit 915 21LDA topics web 8250 340
Table 7 Topic example for one academic corpus
Topic 1 Topic 2 Topic 3 Topic 4 Topic 5
enzym bind dynam forc oligosacchariddomain site vibrat particl branchamino conform motion hydrophob carbohydrresidu enzym coupl friction donorexpress residu excit layer polysaccharid
While the LDA applied to websites still gave some good indication abouttheir main area, the topics seem less distinct. However, the manual inspectionsuggests that LDA is capable to represent the main content of a website, butdue to the previously mentioned word repetition adjustments in terms of toofrequent words need to be made. Accordingly, we removed all terms occurringin more than 90% of documents in a website.
Since the LDA can only be applied on texts that have a certain length, asthe algorithm depends on the amount of text data input, we had to exclude 40smaller website corpora. These corpora are suited for the TFIDF application,but not for LDA. Therefore the sample size of LDA is slightly smaller than forTFIDF (see Table 6). The LDA provides a certain number of topics for eachcorpus (these vary according to the website length (see Section 3.3). Each ofthese topics are composed of specific words, which we extract and combineto a keyword list. For the LDA comparison we selected the 50 most relevant(probable) words for each topic (LDA allows term re-occurrence in differenttopics with different probabilities). We compared each topic from one of the21 academic corpora and 340 website with each other. Each time a keywordlist is compared to another and the Jaccard similarity is computed for eachcomparison. More than 7,548,750 individual comparisons were performed.
Examining the Jaccard scores revealed that none of the comparisons scoredhigher than the set threshold of 0.13 (the first set threshold). The first matchesbetween topics were around the threshold of 0.08. This is a really low simi-larity score and shows that the academic and web corpora are very diversein the main areas. 12 document pairs could be identified exceeding a Jaccardthreshold of 0.08. Comparing the academic topics from different departmentswith each other reached scores up to 0.82 Jaccard similarity, which shows howmuch closer academic corpora are related.
The TFIDF provides keywords for each document, hence the number oflists equals the number of documents in each corpus. We extracted up to 50
17
highest indexed terms for each document (see Table 6). We compared eachTFIDF keyword list from the academic documents with all keyword lists fromthe websites.The maximum length of the keyword lists was set to 50 extract-ing the words with the highest TFIDF scores (see Section 3). However, sometexts, mostly the academic abstracts, were too short to generate a list of 50words, hence we decided to set the length of the list of words to all wordsremaining after cleaning and pre-processing. We additionally excluded around10 websites, as they were too short for the application of the TFIDF. However,comparisons for shorter texts are object to the adjusted Jaccard threshold (seeSection 3) to ensure that the short keyword lists are not dominating the finalmatch sample with less relevant matches. We retrieved 44,294 lists for theacademic abstracts. and 138,552 keyword lists for the websites resulting in6,137,022,288 comparisons.
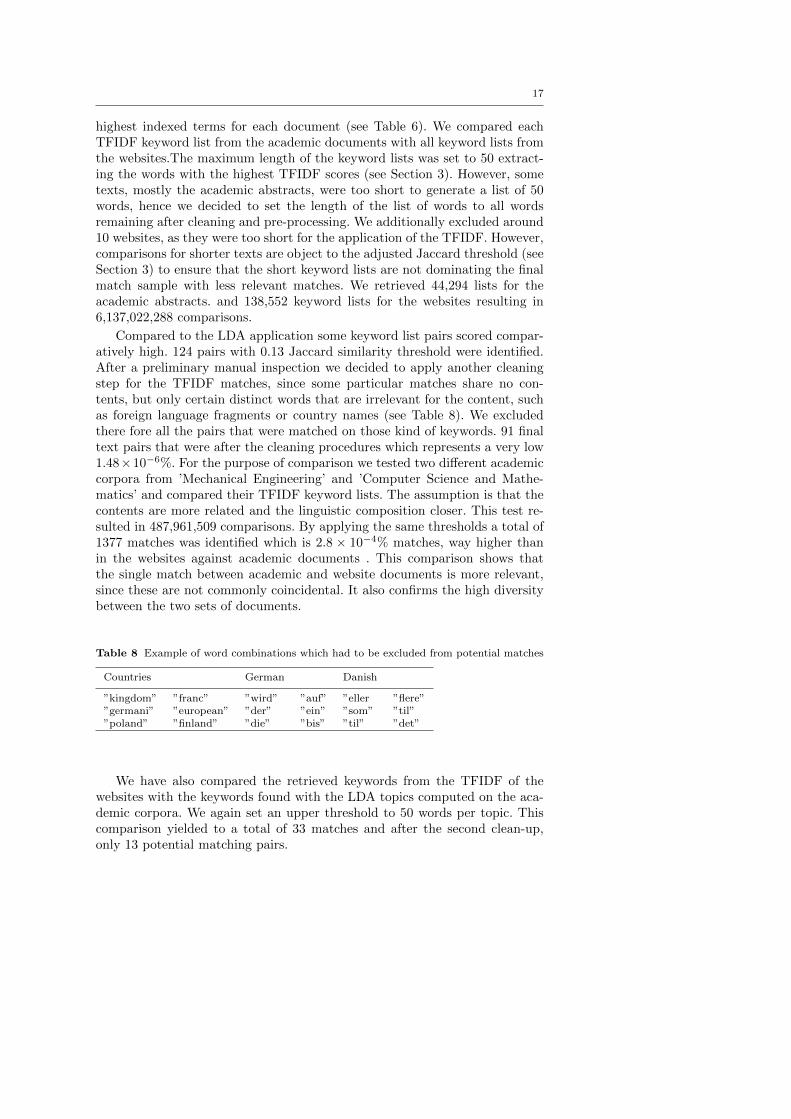
Compared to the LDA application some keyword list pairs scored compar-atively high. 124 pairs with 0.13 Jaccard similarity threshold were identified.After a preliminary manual inspection we decided to apply another cleaningstep for the TFIDF matches, since some particular matches share no con-tents, but only certain distinct words that are irrelevant for the content, suchas foreign language fragments or country names (see Table 8). We excludedthere fore all the pairs that were matched on those kind of keywords. 91 finaltext pairs that were after the cleaning procedures which represents a very low1.48×10−6%. For the purpose of comparison we tested two different academiccorpora from ’Mechanical Engineering’ and ’Computer Science and Mathe-matics’ and compared their TFIDF keyword lists. The assumption is that thecontents are more related and the linguistic composition closer. This test re-sulted in 487,961,509 comparisons. By applying the same thresholds a total of1377 matches was identified which is 2.8 × 10⁻⁴% matches, way higher thanin the websites against academic documents . This comparison shows thatthe single match between academic and website documents is more relevant,since these are not commonly coincidental. It also confirms the high diversitybetween the two sets of documents.
Table 8 Example of word combinations which had to be excluded from potential matches
Countries German Danish
”kingdom” ”franc” ”wird” ”auf” ”eller ”flere””germani” ”european” ”der” ”ein” ”som” ”til””poland” ”finland” ”die” ”bis” ”til” ”det”
We have also compared the retrieved keywords from the TFIDF of thewebsites with the keywords found with the LDA topics computed on the aca-demic corpora. We again set an upper threshold to 50 words per topic. Thiscomparison yielded to a total of 33 matches and after the second clean-up,only 13 potential matching pairs.

18
To identify the actual documents belonging to an actual topic generatedby the LDA is not straightforward, since only a probability distribution overdocuments is given. Hence, we used for each topic the two documents with thehighest probability. This resulted in each TFIDF text having two potentialmatches for academic abstracts.
5.2 Human verification of the text pairs
The results generated with the TFIDF to TFIDF comparison and the LDAto LDA comparisons show a significant theme overlap between the text doc-uments. Comparing the text pairs retrieved from these both applications re-sulted in 10 common matches, meaning that the TFIDF and LDA returned 10times the same text pairs. Interestingly, in the manual verification these doc-uments are websites that achieved many hits via both applications, but referonly to overall similar content, but did not share identical research content.This means in the classical application of topics models to detect knowledgeflows these pairs would have been a valid match. In our case,however, we aretracing some more specific content and these pairs do not provide clearly thesame concepts, models or other knowledge. This is crucial, since these arethe matches that would have been a positive identification of knowledge flowsaccording to traditional measures using only LDA. Certain research areas re-vealed to be particularly dominating the text pairs, as well as in the truepositives and in the entire matched sample. The overall comparison suggestsa clear dominance of certain university departments in the matches. SomeDepartments are most represented in the matched pairs.
The combination of LDA and TFIDF reveals common interests of firms andthe university and also shows which departments most are represented withinthe pages. Especially given that some of the comparatively small academiccorpora (see Table 2) are most relevant according to the Jaccard similarityand the actual matches. In Figure 2 we can clearly see that some departmentsare much more dominant when it comes to the pair-wise comparison. Thismeans that the methods are most successful for those corpora, not determiningwhether it is only a content relatedness or fully identical contents. However,the other corpora seems not suited for our approach.
This is an example for a true positive, so a real text pair, which has commoncontent and refer to the same knowledge would be the following two texts:

19
Fig. 2 TFIDF and LDA showing the most dominant research areas leading to matches thatexceed the threshold
Academic abstract Website document”Swarm is the fifth Earth Ex-plorer mission in ESAs Liv-ing Planet Programme to belaunched in 2009. The objectiveof the Swarm mission is to pro-vide the best ever survey of thegeomagnetic field and its tem-poral evolution. The innova-tive constellation concept and aunique set of dedicated instru-ments will provide the neces-sary observations that are re-quired to separate and modelthe various sources of the geo-magnetic field (...)”
”Absolute Scalar Magne-tometers from CNES andCEA/LETI which were se-lected by the ESA for theSwarm mission. (...) TheSwarm mission ; a constella-tion of three identical satellitesin three different polar orbitsbetween 400 and 550 km al-titude to measure the Earthsmagnetic field (...)”
These texts show that the company is actually displaying the ’Swarm’, whichis the topic of the academic publication. In particularly hard cases or verylimited information from the abstract the validators could fall back on the fulltexts of the publication.

20
Academic abstract Website document”Higher-Order ambisonics(HOA) ; and a matrix inver-sion method. HOA optimizesthe reproduced sound at a sweetspot in the center of the arraywith radius determined by aspherical microphone array; which is used to derive thespherical harmonics decompo-sition of the reference sound.The four-loudspeaker-basedmethod equalizes the magni-tude response at the ears ofa head and torso simulator(HATS) for sound reproduction(...)”
”Higher-order ambisonics ;matrix inversion method ;ETSI TS 103 224 and matrixinversion method optimizedfor a specific device. For eachmethod ; the quality of thereproduced sound was eval-uated both objectively andsubjectively ; at microphonesclose to a device under testand at the ears of a Head AndTorso Simulator (HATS) (...)”
The second example is according to the human verification only thematicrelated and does not qualify as a full match. Hence, we have to declare it afalse positive. In this particular case they are very closely linked thematically,but the publication is based on the four loudspeaker method, which is not thecase in the website. Therefore, these pages are labeled under category 3.
Given this examples it is obvious that the actual task is not simple and isit might appear in the first place. Therefore, we needed to ensure the qualityof the assessment and ensured that several persons from different backgroundswere performing the assessment. The manual verification was performed bythree persons, two researchers (PhD candidates) and one engineer, and a fourthperson to handle possible mismatches in the assessment. All three are scientistsand hence familiar with research and the interpretation of research results.The topic to topic comparison, with an adjusted threshold of 0.08 Jaccardsimilarity resulted in no positive evaluated match between texts, this confirmsthe assumption that the threshold has to be carefully chosen, in particular inregard to semantically very diverse texts.
Table 9 Overlap in manual decisions
Academic 1 & 2 Academic 1 & Eng. Academic 2 & Engineer All
Total 67% 61% 58% 48%Category 1 80% 65% 60% 60%Category 1 & 2 74% 56% 50% 44%Category 2 21% 29% 14% 21%Category 3 61% 54% 48% 38%Category 4 51% 49% 43% 30%
21
Given the assessment it is clear that the engineer has a much harder timeto verify identical contents that are not within his area of expertise. To see theconfidence levels of each verification they made qualitative comments to theirdecisions, which enabled a more accurate final assessment. In Table 9 certaininconsistencies become evident. The overlap within the relevant categories 1and 2 the low consistency was solely caused by their different understandingof the definition and was finally solved and decided based on their qualitativecomments. They also commented on pairs that seemed unclear or difficult toclassify to them, or in which they claimed to have specific expertise,the finallabeling could be made very accurate. In particular most of the academicsassessments revealed an insecurity between two labels while the other wascertain about a particular label. However, the overlap for the engineer wasmuch lower and the comments showed only a few certain classifications withinhis area of expertise. Revealing that mainly trained academics, used to readingacademic texts, are capable to mange this tasks with sufficient confidencelevels.
The fourth person (academic) had evaluate the qualitative statements,read the texts and make a final decision in alignment to the previous assess-ments.This strategy ensured the the quality of the results. Given the distribu-tion of decisions (see Figure 3) one of the main inconsistencies in the overalldistribution was also the low usage of number label number 5 by the secondacademic, this label however should be inconsistent since it is the label for toremove the text pairs where the validator was really insecure about the labels.
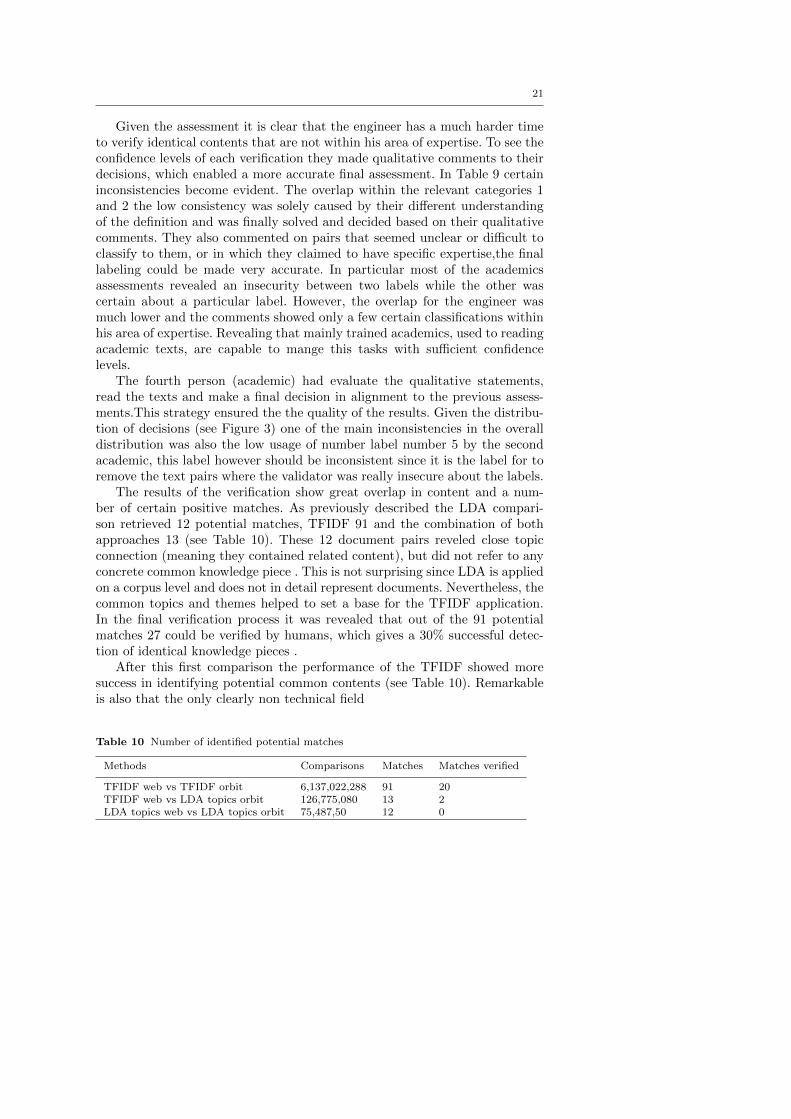
The results of the verification show great overlap in content and a num-ber of certain positive matches. As previously described the LDA compari-son retrieved 12 potential matches, TFIDF 91 and the combination of bothapproaches 13 (see Table 10). These 12 document pairs reveled close topicconnection (meaning they contained related content), but did not refer to anyconcrete common knowledge piece . This is not surprising since LDA is appliedon a corpus level and does not in detail represent documents. Nevertheless, thecommon topics and themes helped to set a base for the TFIDF application.In the final verification process it was revealed that out of the 91 potentialmatches 27 could be verified by humans, which gives a 30% successful detec-tion of identical knowledge pieces .
After this first comparison the performance of the TFIDF showed moresuccess in identifying potential common contents (see Table 10). Remarkableis also that the only clearly non technical field
Table 10 Number of identified potential matches
Methods Comparisons Matches Matches verified
TFIDF web vs TFIDF orbit 6,137,022,288 91 20TFIDF web vs LDA topics orbit 126,775,080 13 2LDA topics web vs LDA topics orbit 75,487,50 12 0

22
Fig. 3 Decision distribution of the manual assessment
5.3 Technical Considerations
Given the progress made in the past decade the text similarity measures mightbecome sophisticated enough to compare full texts, but for the time being wewill have to apply additional strategies. For further refinement and extension,it could be considered to adopt another method for associating the documentsto the LDA topics. For example, we could pick the documents connected to thehighest ranking words in a given LDA topic instead of taking the highest topicprobability in a document. This might be another option for future research.However, due to the size of the original sample and the complexity of theactual labeling, for now it is not possible to estimate the error on how muchof the actual knowledge transfer, or the true positives are not identified.
Our findings suggest that our first estimated thresholds proved to be notaccurate enough. 0.134 Jaccard distance would have been the ideal thresholdfor finding all text pairs for the TFIDF with a list union size close to 100words. The best threshold would have been 0.144, here we have the best tradeof between false positives and missing findings. In Figure 2, we show the poten-tial changes in categories (label assignment) with improved thresholds of theJaccard measure. We lost only one match and reduced the error rates by morethan 50%. The amount of first and second order matches gradually decreaseswith lower Jaccard similarity, as well as the content relatedness. Therefore, wesuggest to evaluate the hits in future sequential, meaning to rank the hits bytheir Jaccard similarity and assess the first hits and stop when the amount ofpositive hits decreased significantly.
6 Conclusion
The purpose of this study was to offer new insights into both, formal andinformal modes of knowledge transfer. The outcome is the development ofnovel detection and measurement approach for knowledge transfer, captur-
23
ing instances of knowledge transfer, which are largely overlooked by currentmethods (Agrawal, 2001). Hence, this study enables new perspectives and fur-ther in-depth understanding for reshaping existing notions on what constitutessuccessful university-industry collaboration in particular for policy makers andother stakeholders. It also provides generalizable and comparable findings andidentifies and verifies the transfer of concrete pieces of knowledge, enablingthe detection of common knowledge.
The tools we applied to detect university research as being used and dis-played by private firms were indeed able to identify those instances. Thisstudy detects the use of publicly produced knowledge and moves beyond thetraditional proxy indicators. Our results are not bound to the usual formalindicators and capture formal and informal knowledge transfer, as long as it isdisplayed from the company side. The high level of detail enables the study toshow, which knowledge pieces are relevant enough for the industry to display.The trace of knowledge transfer can be directly linked to specific studies orresearch areas. More than 5 % of the firms actually displayed some concreteknowledge driven from the university on their websites. Additionally, we stilltraced highly related working topics and working areas proven to be simpleamong the university collaborators, which adds a value to the method allowinguniversities to capture the most related topics with the firms in their environ-ment (see Figure 3 all matches contained in the third label (category 3)).In summary, the method provides insights about the transferred knowledgeand is a novel quantitative assessment. It provides statistical correlation mea-sures, which could be used supplementary to already existing methods fromthe Triple Helix concept.
Even though the findings are still on a comparatively small scale, thisoutcome indicates that the method can successfully detect knowledge transfer.It found several instances where models, methods and clinical studies of theuniversity were used but not directly cited. This is only a first step, but showsclearly the potential of the methods. And even though our approach revealsnothing about the underlying processes and the how of knowledge transfer fromuniversity to industry we broaden the measurement spectrum for the instanceswhere knowledge transfer happened,regardless of the channels or mechanisms.Furthermore, the applied methods show that it is actually possible to identifyconcrete pieces of research knowledge in linguistically very diverse documents.This study is a first step towards an novel supplementary identification ofconcrete university-industry knowledge transfer.
This insight increases the understanding of the principal value of universityresearch independently from its direct commercial success, highlighting thedissemination potential and the absorption of relevant research. Based on thesefindings, we might broaden the definition of ’valuable’ research beyond whatnormally is considered valuable through patenting and licensing contracts.This would include changes within the focus on commercial value of publicresearch, lending further support to the potential of new streams of researchnot identified through more traditional measurements. This could improve thefunding situation for relevant but not easily commercialized research in the

24
future, since it would enable decision makers in the university and externallyto take into consideration what knowledge is actually used in the industrylater. Obviously, our methods still require adjustments, but it is certainly astep to improve the understanding about public research relevance, and astrong indication that the current measures are insufficient in capturing allcommercially valuable research outputs.
7 Future Outlook and limitations
From an application perspective, several dimensions must be evaluated beforethe method can be widely adapted. For instance, it is crucial to benchmark thenew method against the traditional indicators to assess the actual knowledgegain. Additionally, this method could be applied in different empirical settingsto better understand the overall performance and application possibilities.
From a conceptual point of view, it has to be determined what this knowl-edge actually represents for companies and research dissemination. This es-timation might not be as straightforward as it is in the case of patents orlicenses, but must represent a commercial value to a company. Patents andlicenses typically carry a certain commercial value, whereas the value of infor-mation on corporate websites is less understood.
From a performance perspective of the method our work can be viewed asa first step, using comparatively established methods. Technically, however,there are several improvements and bench-marking options possible. Hence,we suggest to refine the statistical methods and add more advanced statisticallearning methods to improve the error rates. Focusing on the best performingresearch areas (see Figure 2) would also be an option to improve the perfor-mance by strategically adjusting it to the given field.
Given these results, simpler classification might be necessary in future.Additionally, in the contrary to our expectations, the rightful classificationseems to be difficult for non academics particularly when the content does notmatch the area of expertise. This speaks for the high quality performance ofthe method: if human cannot easily distinguish false and true positives meansthat the method is performing well, since humans are usually performing betterwhen it comes to this kind of tasks.
Despite the current limitations, we see clear future potential as the flexibil-ity of the tools including potential for adaptation make them useful in variouscontexts.
Acknowledgements We thank the people performing the human validation of our resultsand the helpful comments we received on several conferences.

25
References
Aggarwal CC, Zhai C (2012) Mining text data. Springer Science & Business MediaAgrawal A, Henderson R (2002) Putting Patents in Context: Exploring Knowledge Transfer
from MIT. Mgmt Sci 48(1):44–60Agrawal AK (2001) University-to-industry knowledge transfer: literature review and unan-
swered questions. International Journal of Management Reviews 3(4):285–302Aizawa A (2003) An information-theoretic perspective of tf–idf measures. Information Pro-
cessing & Management 39(1):45–65Arundel A, Marco CB (2008) Developing internationally comparable indicators for the com-
mercialization of publicly-funded researchBerry MW, Castellanos M (2007) Survey of Text Mining: Clustering, Classification, and
Retrieval, Second Edition p 241Blei DM, Ng AY, Jordan MI (2003) Latent dirichlet allocation. Journal of machine Learning
research 3(Jan):993–1022Branstetter L (2006) Is foreign direct investment a channel of knowledge spillovers? Evidence
from Japan’s FDI in the United States. Journal of International Economics 68(2):325–344,DOI 10.1016/j.jinteco.2005.06.006
Chapman, Hall/CRC (2010) Handbook of Natural Language Processing, Second Edition.DOI 10.1007/978-1-4612-3426-5 15
Cheah S (2016) Framework for measuring research and innovation impact. Innovation18(2):212–232, DOI 10.1080/14479338.2016.1219230
Cohen WM, Nelson RR, Walsh JP (2002) Links and impacts: the influence of public researchon industrial r&d. Management science 48(1):1–23
Collobert R, Weston J, Bottou L, Karlen M, Kavukcuoglu K, Kuksa P (2011) NaturalLanguage Processing (almost) from Scratch. The Journal of Machine Learning 12:2493–2537
D’Este P, Patel P (2007) University–industry linkages in the uk: What are the factorsunderlying the variety of interactions with industry? Research policy 36(9):1295–1313
Etzkowitz H, Leydesdorff L (2000a) The dynamics of innovation: from national systems andmode 2 to a triple helix of university–industry–government relations. Research policy29(2):109–123
Etzkowitz H, Leydesdorff L (2000b) The dynamics of innovation: from National Systemsand ‘Mode 2’ to a Triple Helix of university... Research Policy 29(2):109
Etzkowitz H, Webster A, Gebhardt C, Terra BRC (2000) The future of the university and theuniversity of the future: evolution of ivory tower to entrepreneurial paradigm. Researchpolicy 29(2):313–330
Franceschini S, Faria LGD, Jurowetzki R (2016) Unveiling scientific communities aboutsustainability and innovation. A bibliometric journey around sustainable terms. Journalof Cleaner Production 127:72–83, DOI 10.1016/j.jclepro.2016.03.142
Gaikwad SV, Chaugule A, Patil P (2014) Text mining methods and techniques. InternationalJournal of Computer Applications 85(17)
Garechana G, Rıo-Belver R, Bildosola I, Salvador MR (2017) Effects of innovation man-agement system standardization on firms: evidence from text mining annual reports.Scientometrics 111(3):1987–1999
Glanzel W, Thijs B (2012) Using core documents for detecting and labelling new emergingtopics. Scientometrics 91(2):399–416
Griffiths TL, Steyvers M (2004) Finding scientific topics. Proceedings of the NationalAcademy of Sciences of the United States of America pp 5228–35
Grimpe C, Hussinger K (2013) Formal and informal knowledge and technology transfer fromacademia to industry: Complementarity effects and innovation performance. Industry andinnovation 20(8):683–700
Grun B, Hornik K (2011) topicmodels : An R Package for Fitting Topic Models. Journal ofStatistical Software 40(13):1–30
Gulbrandsen M, Slipersaeter S (2007) The third mission and the entrepreneurial universitymodel. In: Universities and Strategic Knowledge Creation: Specialization and Perfor-mance in Europe, chap 4, pp 112–143

26
Han J (2017) Technology commercialization through sustainable knowledge sharing fromuniversity-industry collaborations, with a focus on patent propensity. Sustainability9(10):1808
Heinze N, Hu Q (2006) The evolution of corporate web presence: A longitudinal study oflarge American companies. International Journal of Information Management 26(4):313–325, DOI 10.1016/j.ijinfomgt.2006.03.008
Jaffe AB, Trajtenberg M, Fogarty MS (2000) Knowledge spillovers and patent citations:Evidence from a survey of inventors. American Economic Review 90(2):215–218
Kao A, Poteet SR (2007) Natural language processing and text mining. Springer Science &Business Media
Khan GF, Park HW (2011) Measuring the triple helix on the web: Longitudinal trends inthe university-industry-government relationship in korea. Journal of the Association forInformation Science and Technology 62(12):2443–2455
Leydesdorff L (2004) The university–industry knowledge relationship: Analyzing patentsand the science base of technologies. Journal of the Association for Information Scienceand Technology 55(11):991–1001
Link AN, Siegel DS, Bozeman B (2007) An empirical analysis of the propensity of academicsto engage in informal university technology transfer. Industrial and Corporate Change16(4):641–655
Liyanage C, Ballal T, Elhag T, Li Q (2009) Knowledge communication and translation - aknowledge transfer model. Journal of Knowledge Management 13(3):118–131
Magerman T, Van Looy B, Song X (2010) Exploring the feasibility and accuracy of la-tent semantic analysis based text mining techniques to detect similarity between patentdocuments and scientific publications. Scientometrics 82(2):289–306
Mao W, Chu WW (2007) The phrase-based vector space model for automatic retrievalof free-text medical documents. Data and Knowledge Engineering 61(1):76–92, DOI10.1016/j.datak.2006.02.008
Meyer M, Sinilainen T, Utecht JT (2003) Towards hybrid triple helix indicators: A study ofuniversity-related patents and a survey of academic inventors. Scientometrics 58(2):321–350
Niwattanakul S, Singthongchai J, Naenudorn E, Wanapu S (2013) Using of jaccard coef-ficient for keywords similarity. In: Proceedings of the International MultiConference ofEngineers and Computer Scientists, vol 1
Paukkeri Ms, Honkela T (2010) Likey : Unsupervised Language-independent KeyphraseExtraction (July):162–165
Perkmann M, Walsh K (2007) University–industry relationships and open innovation: To-wards a research agenda. International Journal of Management Reviews 9(4):259–280
Ponweiser M (2012) Latent Dirichlet Allocation in R. PhD thesisRichardson GM, Bowers J, Woodill aJ, Barr JR, Gawron JM, Levine Ra (2014) Topic
Models: A Tutorial with R. International Journal of Semantic Computing 08(01):85–98Robertson S (2004) Understanding inverse document frequency: On theoretical arguments
for idf. Journal of Documentation 60:2004Rus V, Niraula N, Banjade R (2013) Similarity Measures Based on Latent Dirichlet Alloca-
tion, Springer Berlin Heidelberg, Berlin, Heidelberg, pp 459–470Schmidtler MA, Amtrup JW (2007) Automatic document separation: A combination of
probabilistic classification and finite-state sequence modeling. In: Natural Language Pro-cessing and Text Mining, Springer, pp 123–144
Siegel DS, Waldman DA, Atwater LE, Link AN (2003) Commercial knowledge transfers fromuniversities to firms: improving the effectiveness of university-industry collaboration. TheJournal of High Technology Management Research 14(1):111–133
Sung TK, Gibson DV (2000) Knowledge and Technology Transfer : Levels and Key Factors.Proceeding of the 4th International Conference on Technology Policy and Innovation
Thursby JGJJG, Jensen Ra, Thursby MCM (2001) Objectives, characteristics and outcomesof university licensing: A survey of major US universities. The Journal of TechnologyTransfer 26(1):59–72
Tijssen RJ, Van Leeuwen TN, Van Wijk E (2009) Benchmarking university-industry researchcooperation worldwide: performance measurements and indicators based on co-authorshipdata for the world’s largest universities. Research Evaluation 18(1):13–24
27
Toutkoushian RK, Porter SR, Danielson C, Hollis PR (2003) Using publications counts tomeasure an institution’s research productivity. Research in Higher Education 44(2):121–148
Tussen R, Buter R, Van Leeuwen TN (2000) Technological relevance of science: An assess-ment of citation linkages between patents and research papers. Scientometrics 47(2):389–412
Van Eck NJ, Waltman L (2017) Citation-based clustering of publications using citnetexplorerand vosviewer. Scientometrics 111(2):1053–1070
Wu Y, Welch EW, Huang WL (2015) Commercialization of university inventions: Individualand institutional factors affecting licensing of university patents. Technovation 36:12–25
Xia T, Chai Y (2011) An improvement to TF-IDF: Term distribution based term weightalgorithm. Journal of Software 6(3):413–420
Yau CK, Porter A, Newman N, Suominen A (2014) Clustering scientific documents withtopic modeling. Scientometrics 100(3):767–786
Zhang Y, Zhou X, Porter AL, Gomila JMV, Yan A (2014) Triple helix innovation in chi-nas dye-sensitized solar cell industry: hybrid methods with semantic triz and technologyroadmapping. Scientometrics 99(1):55–75
Zhang Y, Zhang G, Chen H, Porter AL, Zhu D, Lu J (2016) Topic analysis and forecastingfor science, technology and innovation: Methodology with a case study focusing on bigdata research. Technological Forecasting and Social Change 105:179–191