track 2™ version 5 the ultimate process management software
TRANSCRIPT

TRACK 2™ Version 5
The ultimate process management software
Process MonitoringProcess Monitoring is only the first step in is only the first step in
improving process improving process efficiency.efficiency.

• Extensive Analytical Tools
TRACK 2TRACK 2 Process Management Process Management Software* is all other steps...Software* is all other steps...
• Data Input
*Built with 12 years of user feedback.
• Operational Control Limit Checks
Easily configure Easily configure TRACK 2TRACK 2 to to model your specific process:model your specific process:
• No built in constraints

Easily configure Easily configure TRACK 2TRACK 2 to to model your specific process:model your specific process: • No built in constraints
• Point/click and fill in blanks to describe inputs once.

Easily configure Easily configure TRACK 2TRACK 2 to to model your specific process:model your specific process: • No built in constraints
• Point/click and fill in blanks to describe inputs once.
• Carry forward measurements from previous readings (meter readings, inventory, etc.)

Easily configure Easily configure TRACK 2TRACK 2 to to model your specific process:model your specific process: • No built in constraints
• Point/click and fill in blanks to describe inputs once.
• Carry forward measurements from previous readings (meter readings, inventory, etc.)
• Add calculations by clicking on entries and operators

Easily configure Easily configure TRACK 2TRACK 2 to to model your specific process:model your specific process:
• No built in constraints
• Point/click and fill in blanks to describe inputs once.
• Carry forward measurements from previous readings (meter readings, inventory, etc.)
• Add calculations by clicking on entries and operators
• Impose operational control limits on any input or calculation, and provide instructions on what to do if the limit is exceeded.

Easily configure Easily configure TRACK 2TRACK 2 to to model your specific process:model your specific process: • No built in constraints
• Point/click and fill in blanks to describe inputs once.
• Carry forward measurements from previous readings (meter readings, inventory, etc.)
• Add calculations by clicking on entries and operators
• Impose operational control limits on any input or calculation, and provide instructions on what to do if the limit is exceeded.
• Save common configurations to a clone library where they can be reused at will.
• Detect trends that can lead to problems later,
Powerful data analysis allows Powerful data analysis allows you to:you to:

• Detect trends that can lead to problems later,
Powerful data analysis allows Powerful data analysis allows you to:you to:
• Improve operational efficiency,

• Detect trends that can lead to problems later,• Improve operational efficiency,
Powerful data analysis allows Powerful data analysis allows you to:you to:
• Reduce downtime from equipment failure,

• Detect trends that can lead to problems later,• Improve operational efficiency,• Reduce downtime from equipment failure,
Powerful data analysis allows Powerful data analysis allows you to:you to:
• Quickly troubleshoot problems when they do occur,

• Detect trends that can lead to problems later,• Improve operational efficiency,• Reduce downtime from equipment failure,• Quickly troubleshoot problems when they do
occur,
Powerful data analysis allows Powerful data analysis allows you to:you to:
• Generate a wide range of management reports.
TRACK 2 is packed with tools that let TRACK 2 is packed with tools that let you convert unrelated data into you convert unrelated data into valuable information using..valuable information using....
Data Table
Graphs
Reports
SPC Charts

Data TableData Table
• Data (measurements) can be added, edited or deleted directly on the table. Calculated columns (red headers) are automatically updated.
Table of Data

• Out of limit conditions are immediately noted:
• Red – above limits
• Blue – below limits
• Spoken alert
• Immediate access to corrective actions
Table of DataData TableData Table
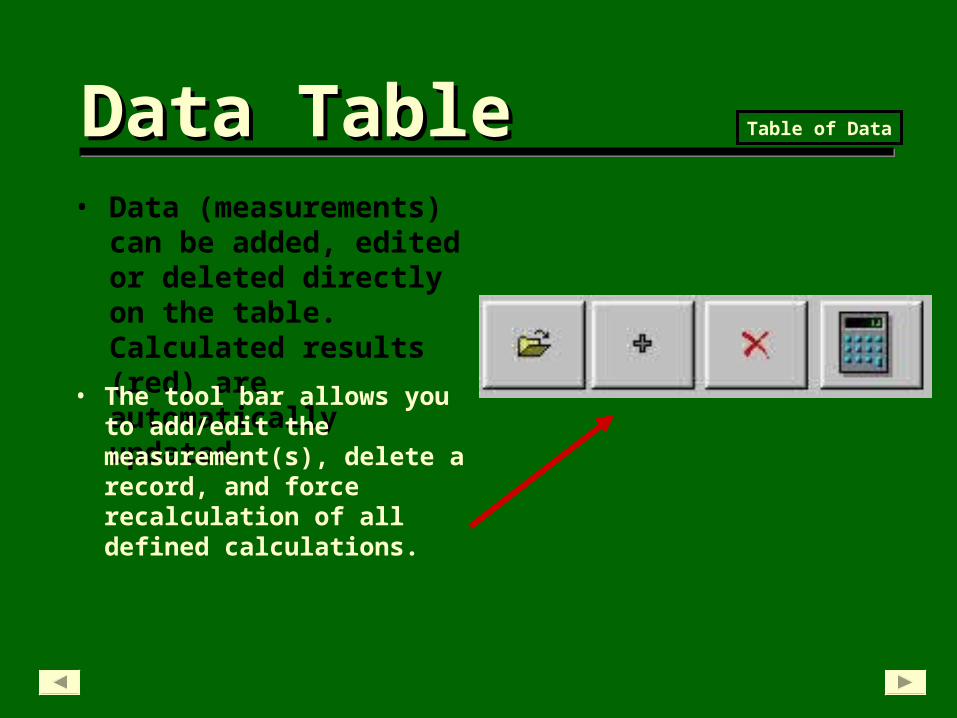
Data TableData Table• Data (measurements) can be
added, edited or deleted directly on the table. Calculated results (red) are automatically updated.
Table of Data
• The tool bar allows you to add/edit the measurement(s), delete a record, and force recalculation of all defined calculations.
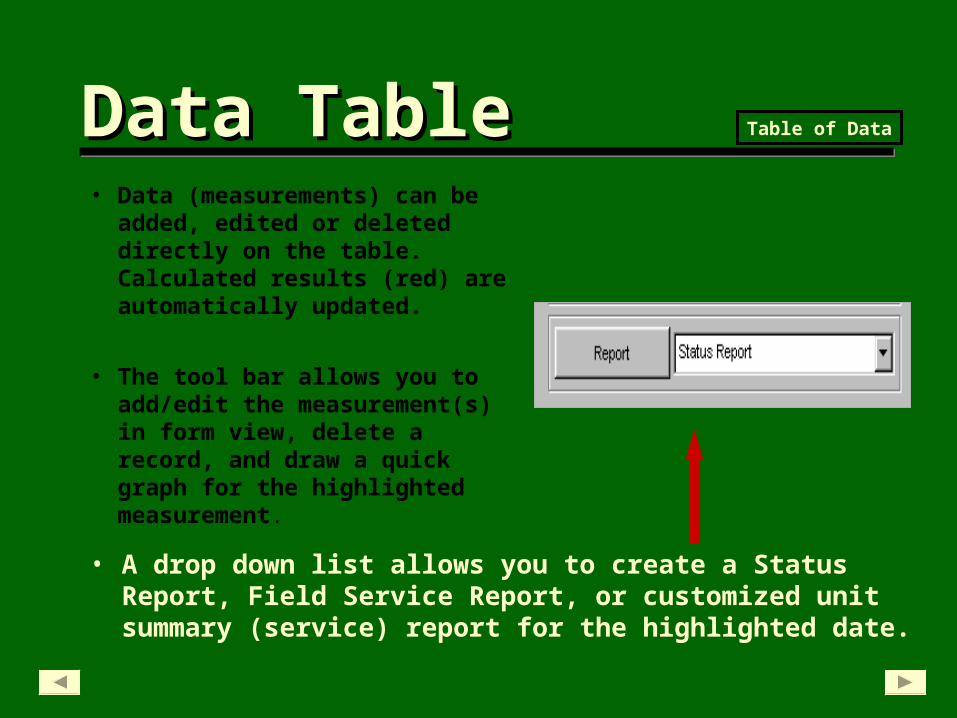
Data TableData Table• Data (measurements) can be
added, edited or deleted directly on the table. Calculated results (red) are automatically updated.
• The tool bar allows you to add/edit the measurement(s) in form view, delete a record, and draw a quick graph for the highlighted measurement.
• A drop down list allows you to create a Status Report, Field Service Report, or customized unit summary (service) report for the highlighted date.
Table of Data

GraphsGraphs
• Compare up to four measurements on one screen.
Tables of numbers are easy to understand when graphed
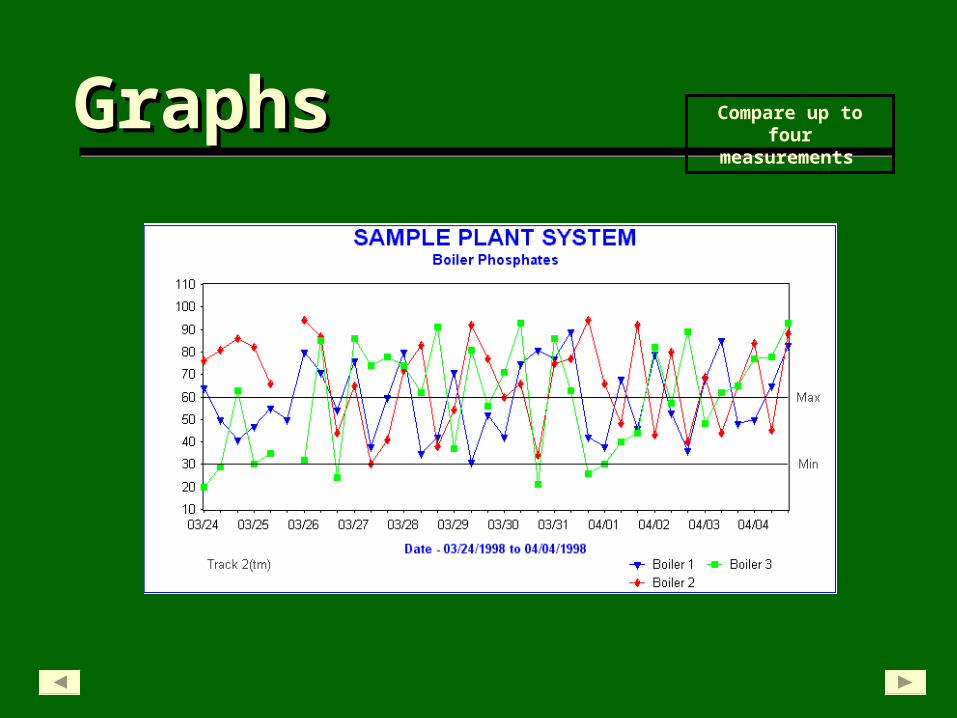
Graphs Graphs Compare up to four measurements
• Compare up to four measurements on one screen.
GraphsGraphs Tables of numbers are easy to understand when graphed
• Impose statistically derived trend lines.
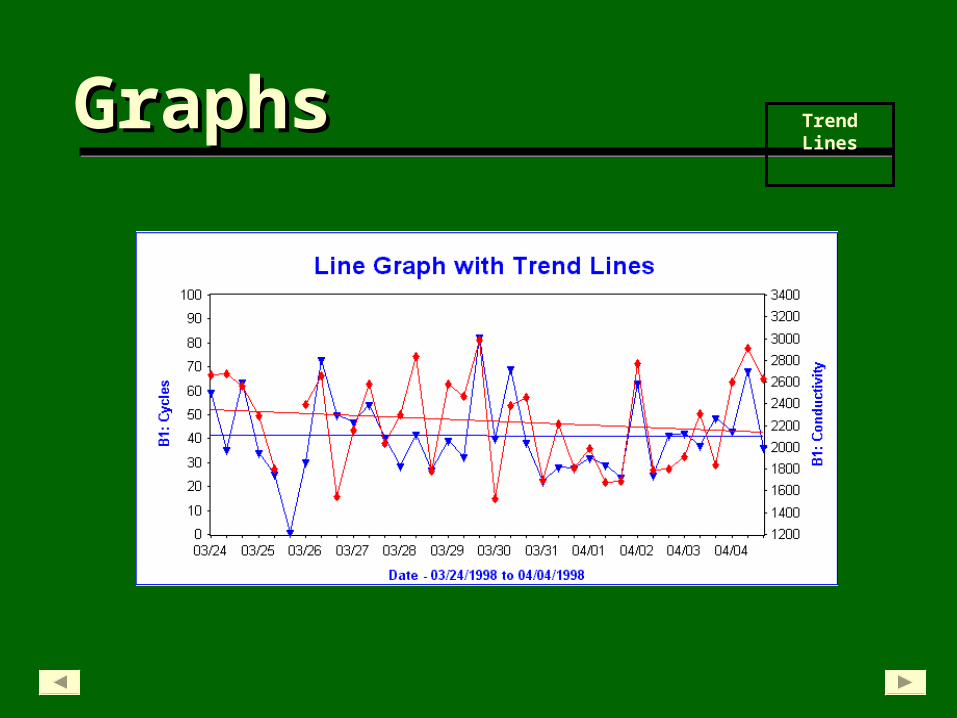
GraphsGraphs Trend Lines

• Compare up to four measurements on one screen.• Impose statistically derived trend lines.
GraphsGraphs Tables of numbers are easy to understand when graphed
• Display line, bar, area or point graphs.
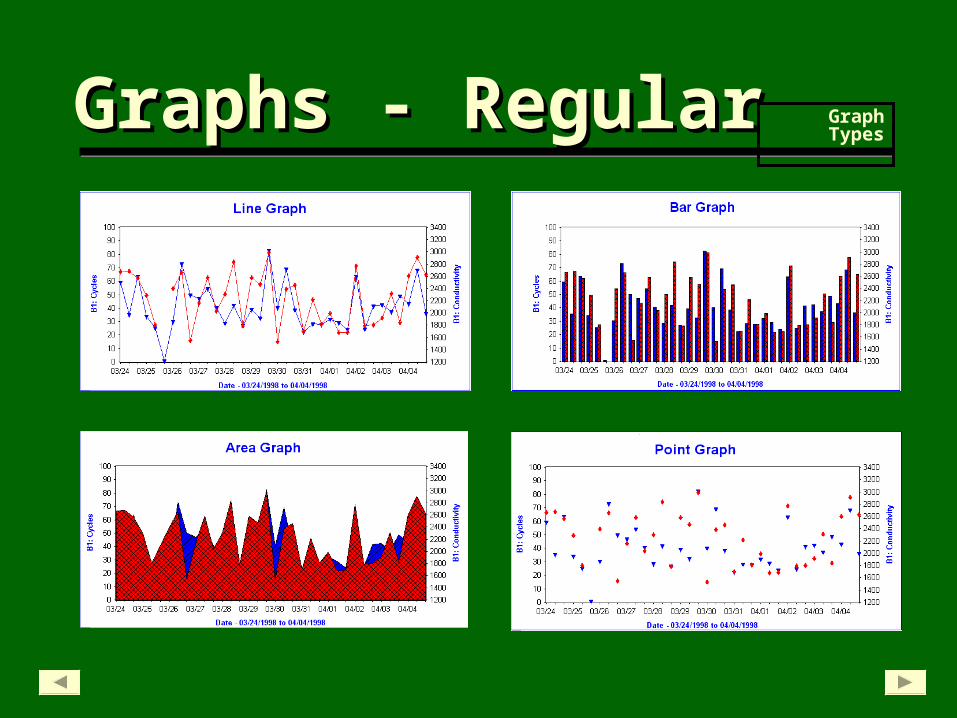
Graphs - RegularGraphs - Regular Graph Types

Graphs – 3DGraphs – 3D Graph Types
• Compare up to four measurements on one screen.• Impose statistically derived trend lines.• Display line, bar, area or point graphs.
GraphsGraphs Tables of numbers are easy to understand when graphed
• Configure many of the graph’s characteristics, like colors and fonts.
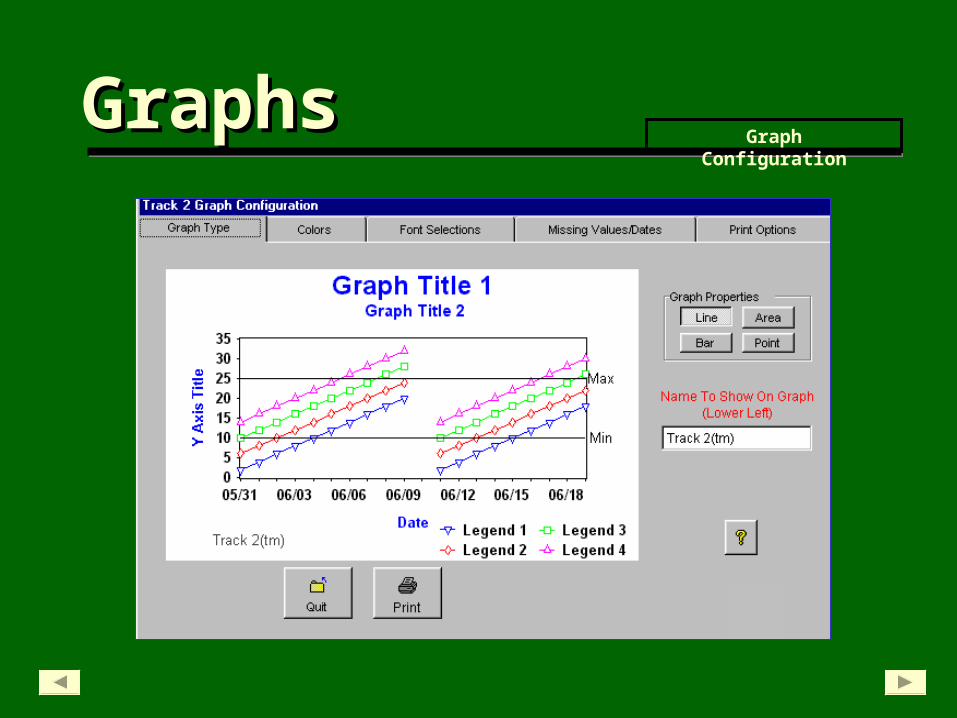
GraphsGraphsGraph Configuration

• Compare up to four measurements on one screen.• Impose statistically derived trend lines.• Display line, bar, area or point graphs.• Configure many of the graphs characteristics, like
colors and fonts.
GraphsGraphs Tables of numbers are easy to understand when graphed
• Send the graph to a printer, graphic file on the hard drive, clipboard or pdf file.

GraphsGraphs Output Options
Save to clipboard (copy/paste image into another document)Save to clipboard (copy/paste image into another document)
PrintPrint
Save to graphic file (bmp and gif formats)Save to graphic file (bmp and gif formats)
Save to an Adobe pdf file

ReportsReports
• Status report gives detailed information about one input session, including the reading or calculation, the control limit, whether the entry is in range, corrective action and comments.
Reports give ready access to the data in many ways
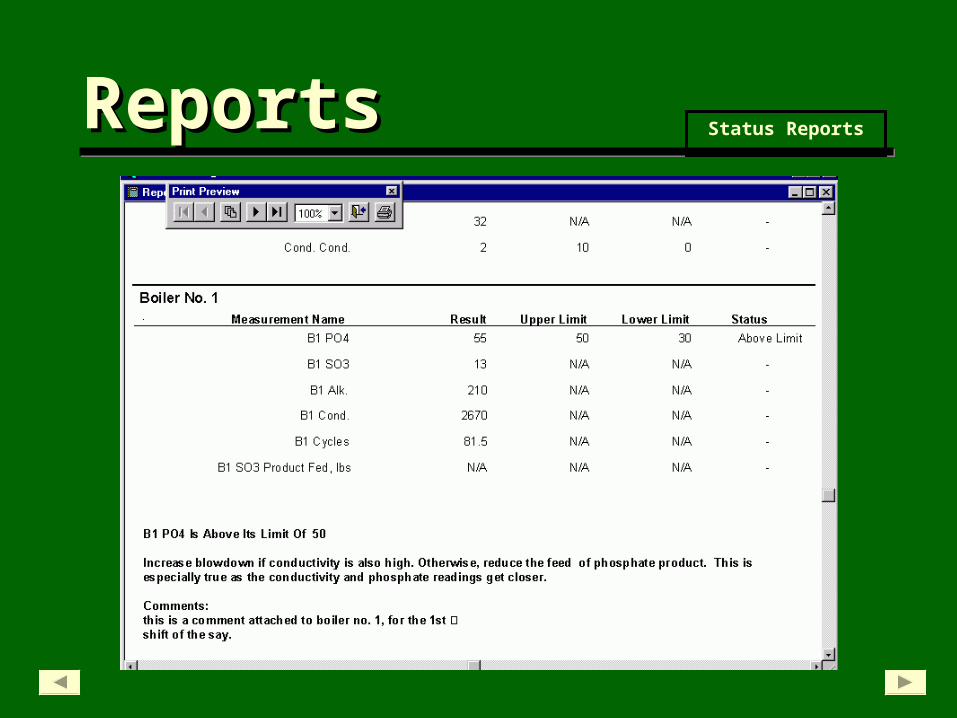
ReportsReports Status Reports
ReportsReports Exceptions Reports
•Exceptions report gives detailed information about the out-of-limit conditions that occurred during one input session, including the reading or calculation, the control limit, corrective action and comments.

ReportsReports Exceptions Reports
• Status report gives detailed information about one input session, including the reading or calculation, the control limit, whether the entry is in range, corrective action and comments.
ReportsReports Reports give ready access to the data in many ways
• Unit Summary, or Service Report, displays similar information from different units.

ReportsReports Unit Summary Reports
•a.k.a. Service Report
•Convenient way to display similar information for different units.
•Generated from Table of Data.
•Add comments.
•Store for later review and editing.
•Customize with your company logo.

• Status report gives detailed information about one input session, including the reading or calculation, the control limit, whether the entry is in range, corrective action and comments.
• Service Report , or Unit Summary Report, displays similar information from different units.
ReportsReports Reports give ready access to the data in many ways
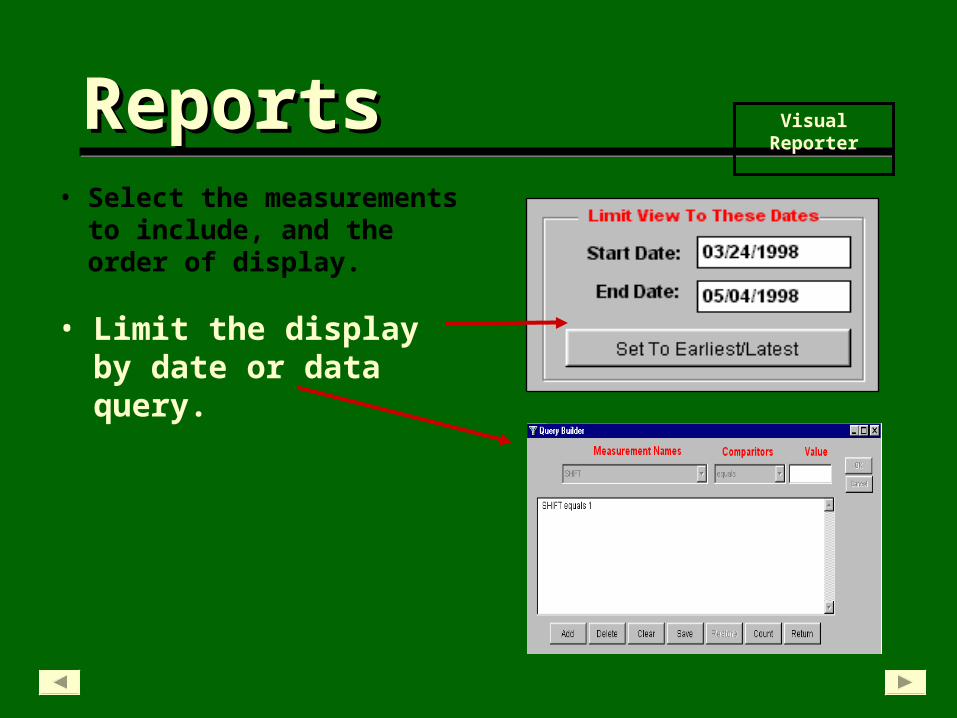
• Visual Reporter is the ultimate, completely configurable report writer.
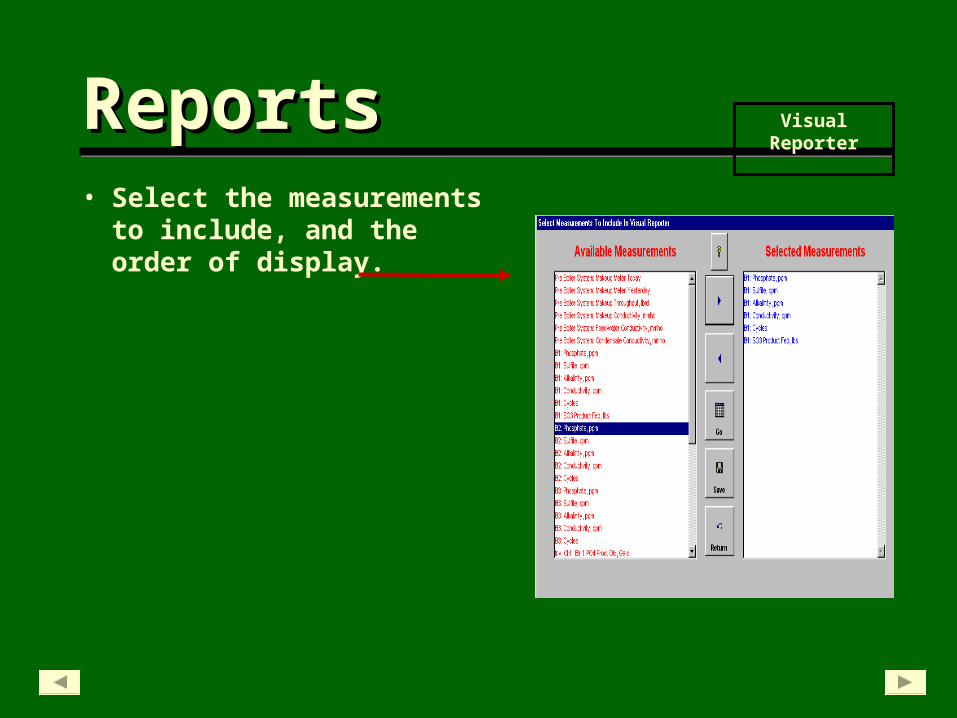
• Select the measurements to include, and the order of display.
ReportsReports Visual Reporter
ReportsReports Visual Reporter
• Limit the display by date or data query.
• Select the measurements to include, and the order of display.
ReportsReports Visual Reporter
• Limit the display by date or data query.
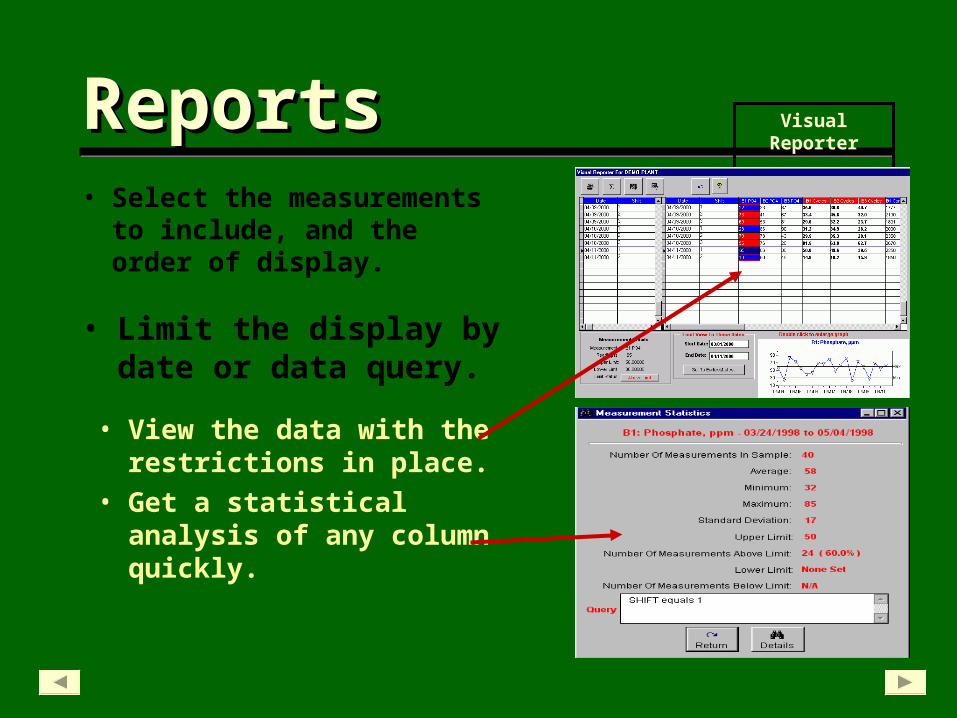
• Select the measurements to include, and the order of display.
• View the data with the restrictions in place.
• Get a statistical analysis of any column quickly.

• Select the measurements to include, and the order of display.
• Limit the display by date or data query.
• View the data with the restrictions in place.
• Get a statistical analysis of any column quickly.
ReportsReports Visual Reporter
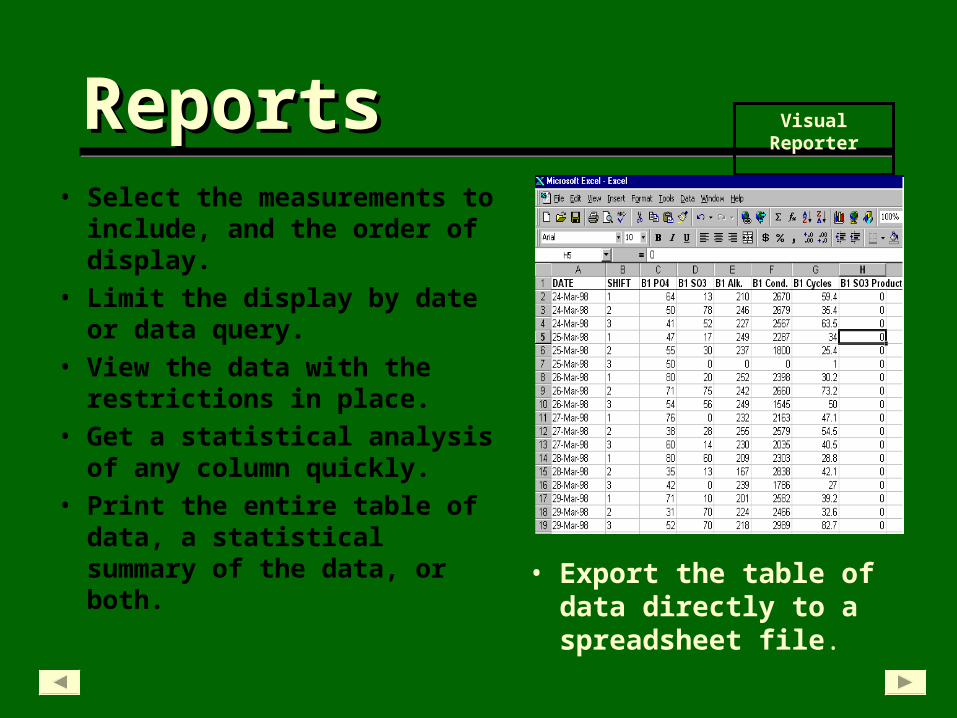
• Print the entire table of data, a statistical summary of the data, or both.
• Select the measurements to include, and the order of display.
• Limit the display by date or data query.
• View the data with the restrictions in place.
• Get a statistical analysis of any column quickly.
• Print the entire table of data, a statistical summary of the data, or both.
ReportsReports Visual Reporter
• Export the table of data directly to a spreadsheet file.
• Process improvement tools are built in, and are automatically available for every input and calculation.
SPC ChartsSPC Charts Statistical Process Control
• Process improvement tools are built in, and are automatically available for every input and calculation.
• All you need to do is bracket the dates of interest, and TRACK 2 does the rest.
SPC ChartsSPC Charts Statistical Process Control
• Process improvement tools are built in, and are automatically available for every input and calculation.
• All you need to do is bracket the dates of interest, and TRACK 2 does the rest.
SPC ChartsSPC Charts Statistical Process Control
• Pinpoint specific items that need to be improved.

• Process improvement tools are built in, and are automatically available for every input and calculation.
• All you need to do is bracket the dates of interest, and TRACK 2 does the rest.
• Pinpoint specific items that need to be improved.
SPC ChartsSPC Charts Statistical Process Control
• Three different SPC charts provide an excellent view of the process over any period of time.
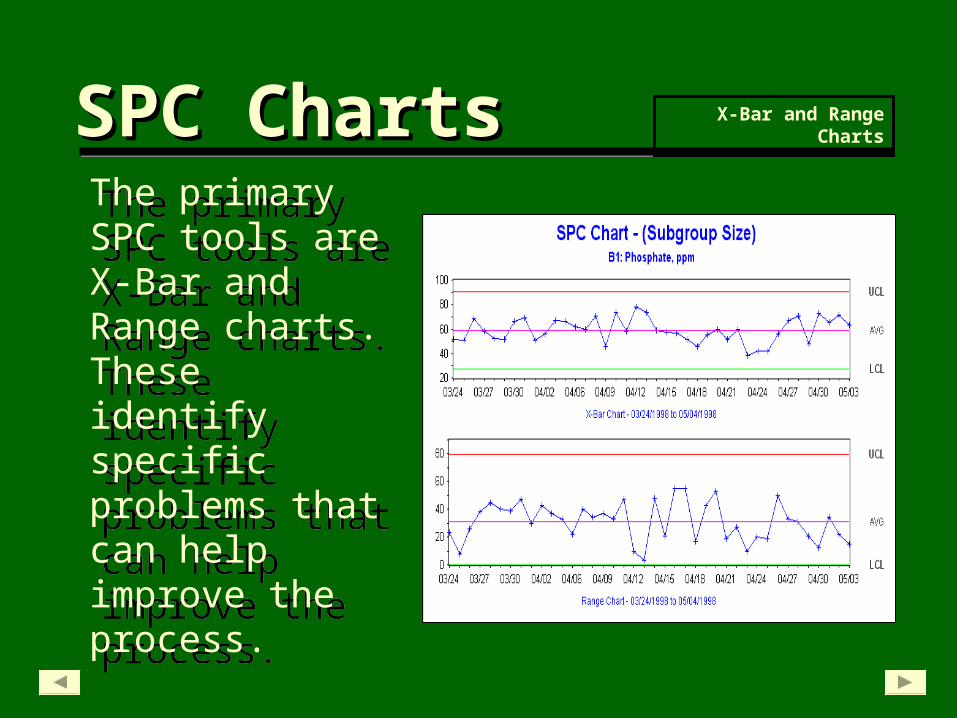
The primary SPC tools are X-Bar and Range charts. These identify specific problems that can help improve the process.
The primary SPC tools are X-Bar and Range charts. These identify specific problems that can help improve the process.
SPC ChartsSPC Charts X-Bar and Range Charts
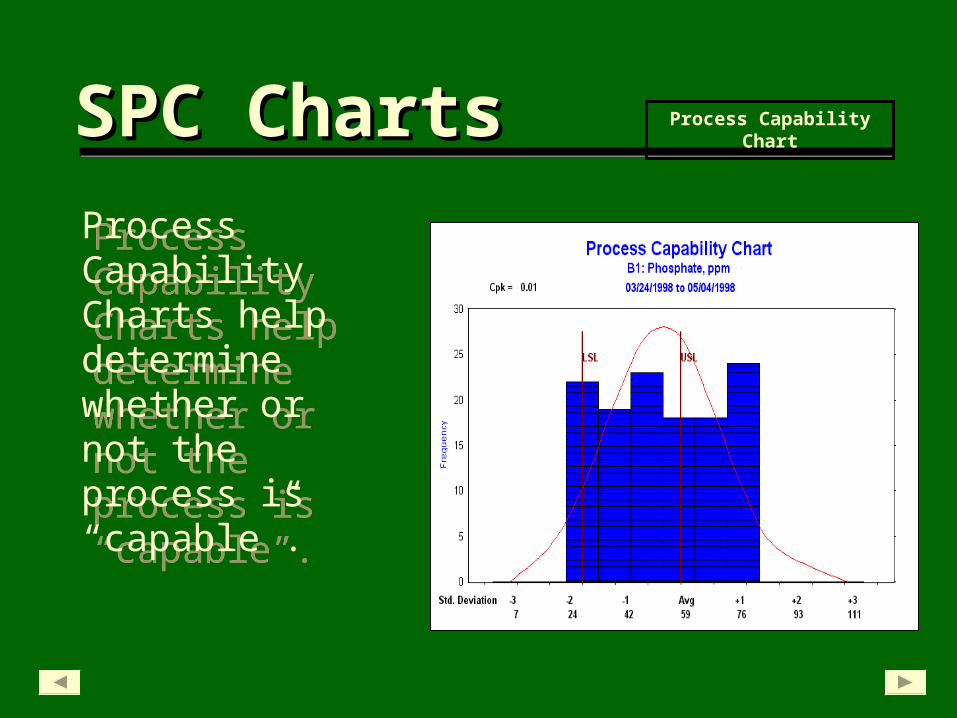
Process Capability Charts help determine whether or not the process is “capable”.
Process Capability Charts help determine whether or not the process is “capable”.
SPC ChartsSPC Charts Process Capability Chart
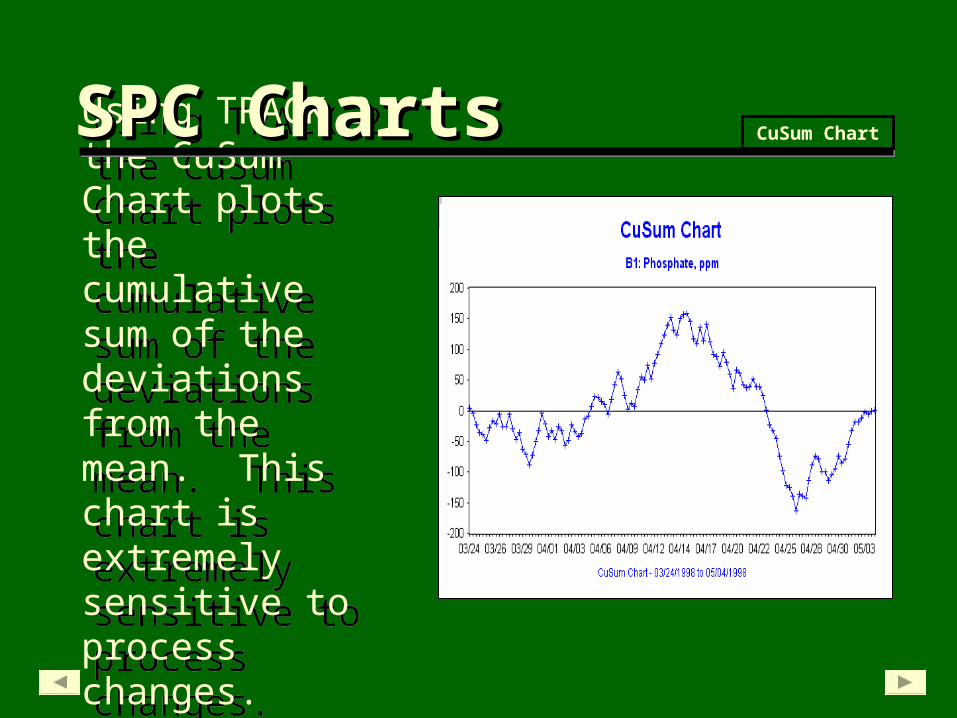
Using TRACK 2 the CuSum Chart plots the cumulative sum of the deviations from the mean. This chart is extremely sensitive to process changes.
Using TRACK 2 the CuSum Chart plots the cumulative sum of the deviations from the mean. This chart is extremely sensitive to process changes.
SPC ChartsSPC Charts CuSum Chart

• Everything that can be printed in Track 2 can be sent to a pdf file, using the built-in pdf driver.
Pdf OutputPdf Output Pdf Output
•Graphs
•Reports•Internal word processor

• Like a paper report, all of the individual pdf files can be collected into one complete report.
Pdf OutputPdf Output Pdf Output
And that report can be emailed without ever leaving Track 2.

• Everything you need to send email has been built into Track 2, so getting the pdf to interested parties is easy.
Email SystemEmail System Email System
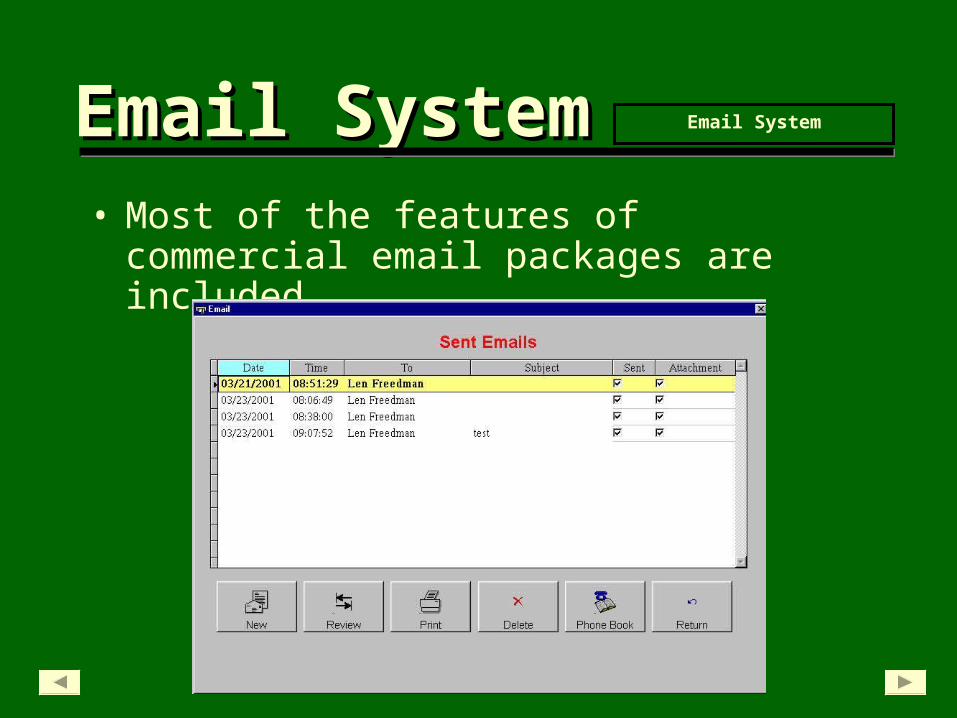
• Most of the features of commercial email packages are included.
Email SystemEmail System Email System
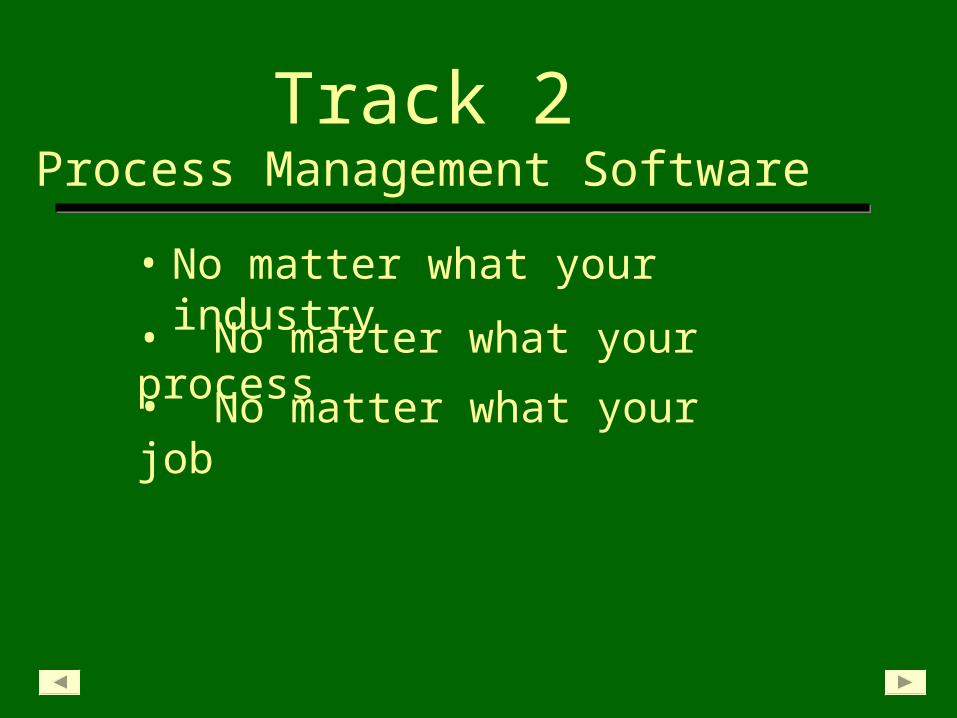
Track 2Process Management Software
• No matter what your industry
• No matter what your job
• No matter what your process

• versatile – model any process
Track 2Process Management Software can help you meet all of your goals and objectives with a program that is:
• very cost-effective
• powerful – calculations, trends, statistics, SPC, data queries…and
more!•
•flexible – manual & data-logged input
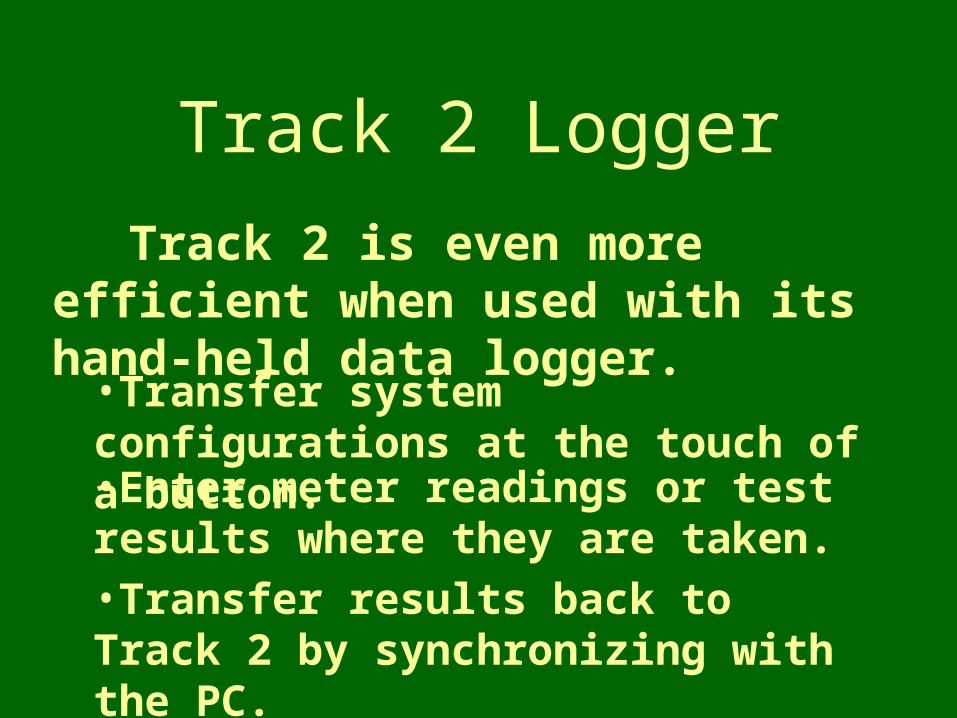
Track 2 Logger
Track 2 is even more efficient when used with its hand-held data logger.
•Transfer system configurations at the touch of a button.•Enter meter readings or test results where they are taken.•Transfer results back to Track 2 by synchronizing with the PC.
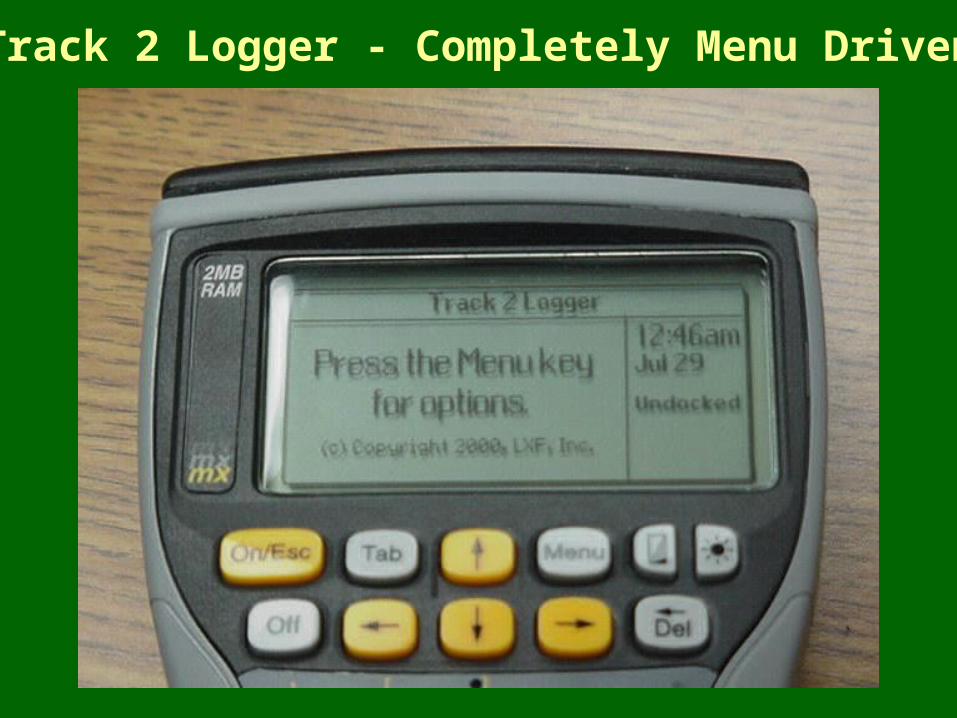
Track 2 Logger - Completely Menu Driven

Track 2 Logger – Holds Configuration For
Multiple Systems

Track 2 Logger – Enter Data In Any Order
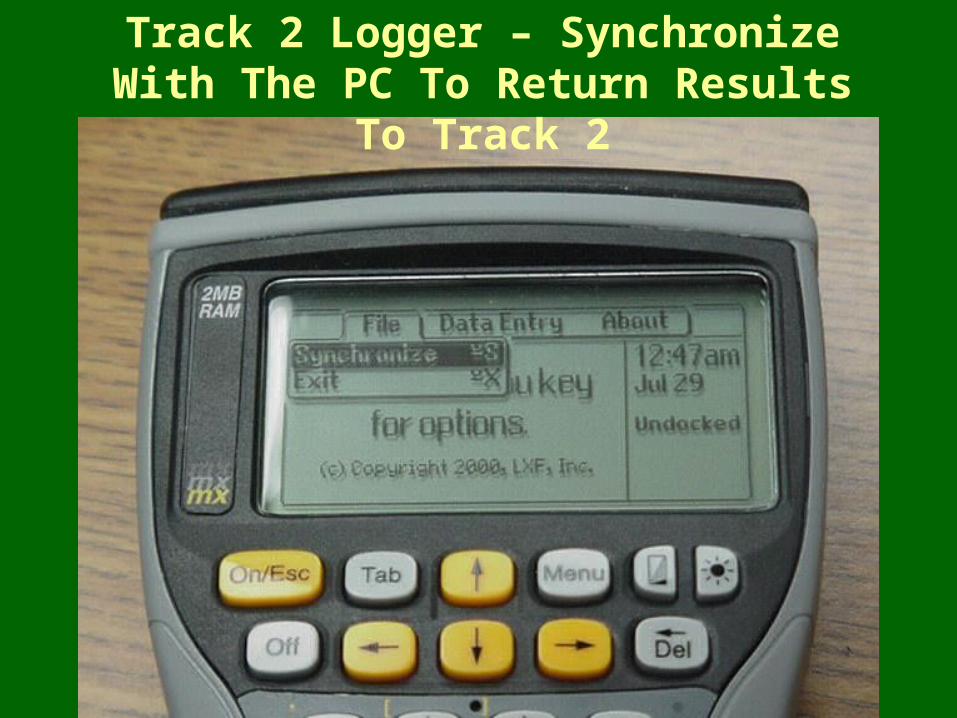
Track 2 Logger – Synchronize With The PC To Return Results To Track 2
Track 2Process Management Software
No matter how the raw data gets into the program, there will never
be a better time, or a better way, to get control of your process

For more information, or to For more information, or to place an order, contact us at:place an order, contact us at:
LXF IncorporatedP.O. Box 7951
Wilmington, DE 19803Phone: (302) 479-0706
Fax: (302) 479-0790email: [email protected], www.lxf.com