track vehicle project: camera triggering, gps localization
TRANSCRIPT

1
Design Review
Track Vehicle Project:
Camera Triggering,
GPS localization, and Motion Control
System
Team members:
Jilin Jiang Kuangxiao Gu
Jialun Liu
Team #25 Oct, 1st, 2012
2
Table of Content Page Number
1. Introduction…………………………………………………3
2. Design
1) Block Diagram………………………………………….4
2) Block Description……………………………………….5
3. Requirement and Verifications…………………………….13
4. Ethical Problems……………………………………………16
5. Costs………………………………………………………….17
6. Schedule………………………………………………………18
7. Reference……………………………………………………...20
8. Appendix………………………………………………………21

3
1. Introduction
The scrutinizing and recording of the condition of railroad has been a laborious and time-consuming job for a long time. The railway workers have to walk along the railroad and examine every single spike, anchor, and tie plate components. Such a method is inefficient and sometimes vulnerable to human mistakes, which may result in severe consequences regarding to transportation safety. Fortunately, a new inspection method has been prompted by the Computer Vision and Robotics Laboratory at the University of Illinois. Utilizing a track vehicle equipped with cameras and techniques in computer vision, this new design employs a computer to discover and analyze defects on railroad track, which can bring significant savings for human resource and money. The role we play in this big project is to design and build an integrated system and various programs which features camera triggering, GPS localization, voltage converter, wireless speed monitor, and emergency brake based on remote manual control or automatic obstacle sensing. These new components and circuits will enable the track vehicle to fulfill its tasks and greatly enhance its practicality. For example, the camera triggering program controls the behavior of the camera such that the images can be taken consecutively and data retrieved includes all the information we need for defect inspection and analysis by computer. Also, the GPS system will be installed so that each picture can be mapped to some real physical position for the railroad inspector to confirm the railway part to be repaired. [2] We will build our new system and combine it with a previous senior design group work (Team29 Fall11), to implement a complete working prototype which, by the end of our project, can be controlled remotely (speed control and emergency brake) and gather information (for GPS and railroad images) automatically. The features, user benefits, circuit diagram presented here and in the following parts are all from our original design or assembly.
Objectives:
Product features:
12V to 5V DC voltage converter which provides both mechanical power supply and circuit power supply, portable for the vehicle
Automatic photo shot triggering based on vehicle’s traveling distance interval Consecutive pictures covering entire railroad route of interest Positioning data retrieved by GPS with synchronization mechanism to ensure the
correspondence between the pictures and GPS coordinates Instant speed feedback with display Back-up switch (“brake”) to stop the vehicle from button on vehicle or remote
control

4
User benefits:
Easy access and organized image/coordinates data with time log for later computer analysis algorithm and physical inspection
Automatic picture triggering and GPS data retrieval Portable power supply to meet all the need of the system Remote speed feedback for user to monitor the vehicle Emergency back-up mechanism to stop vehicle according to remote shut-down
command or automatic obstacle sensing 2. Design 1. Block Diagram
*The blocks highlighted in black are the modules we will design or utilize.

5
Lines in red: Power lines Lines in black: Signal lines Dotted lines: Wireless signal Dotted block: Mechanical part that will be implemented by other engineers 2. Block Description
For blocks that are not highlighted, we will just simply discuss their functions or
characteristics.
12V Marine Battery
The 12V DC Marine Deep-Cycle Battery provides power for the motor and after we build a 12V to 5V DC converter it will also provide Vcc to many other circuits and components in the system.
Remote Control Pad & Receiver/Converter for Controller Circuit The pad is essentially a remote controller which transmits command signals to start/stop the motor and control the speed of the vehicle. The receiver/converter picks up these wireless signals and feed the motor speed controller with appropriate input (three in total). These two parts are built by previous group.
Motor Speed Controller Circuit & Motor These two parts are bought online. The motor speed controller takes 12V DC power input from battery and powers up the motor. The speed controller takes input signals for the receiver/converter circuit above and thereby controls the motor’s speed. The motor is a Dayton 12V DC input electricity-driven model with maximum 64RPM.
Speed Encoder A Hall-Effect rotation sensor mounted on the axis of wheels is included in this module, which detects the cycle of the wheels. The whole speed encoder (Series 62A22-02-P) will give outputs as power train in square waves. A complete cycle corresponds to 250 peaks in its output signal.
GPS See “GPS data receiving and conversion” section in Data Collecting and Integrating Module.
Camera
See “Camera and Camera Control Circuit” section in Data Collecting and Integrating Module. Camera images are taken in .raw format and will be sent back to computer through an IEEE 1394 fire wire.

6
Laptop
The laptop is used for data storage. Specifically, the GPS positions and photo shot by camera will be sent to the laptop. More detail
12V to 5V DC/DC converter
This unit is a typical buck converter. The input voltage is 12V and the output voltage is 5V. This buck converter will be used for powering up the Ultrasonic distance sensor, the Speed Monitoring and Emergency Alarm System, the Data Collecting & Integrating Circuit and the Receiver and Converter Unit. Since the Ultrasonic sensor is sensitive to the input voltage, additional 5V Zener diodes may be added to the output in order to stabilize the output voltage, although they are not included in our preliminary simulation.
The following picture is the preliminary simulation in Multisim. The output voltage is 5.096V.
The Pulse signal driving the PMOS will be provided by a PWM controller,
TL494. This component is powered by 12V and the switching frequency is adjustable up to 300 kHz. TL494 also provide compensation function so that we can add it into our buck converter design to optimize it.
The diode 1N5820 has a maximum reverse biased voltage of 20V, which is much bigger than the 12V and thus should work fine.
The overall power efficiency is 1.298/1.892=68.6%; the data is derived from the following simulation:

7
(The calculation of the values of components is in the appendix)
Data Collecting and Integrating Circuit This module is essentially the data and signal exchange center for many functions in our project which includes:
1. Speed Calculation It takes the output from speed encoder and processes it with a microprocessor
(PIC16F877A). The data from speed encoder is actually just “rotation signal” which only tells us the cycles of the wheel evolving with time. In order to convert this “rotation signal” to a speed signal, we need to count the pulses within a fixed period by using a “timer”. Suppose in the internal programming we define the count period to be T, and the number of pulses receiving from the speed encoder in this period is N. By measurement we found the radius of the wheel is 17.5cms. Suppose the oscillator of this microprocessor is f such that the sampling interval is small enough to detect most of the pulses, then we know:
𝑠𝑝𝑒𝑒𝑑 = 𝑑𝑖𝑠𝑡𝑎𝑛𝑐𝑒𝑇
= 𝑁250∗2𝜋𝑅𝑚
𝑇∗ 12𝜋𝑅𝑠
∗ 2𝜋𝑅𝑤 = 𝑁𝜋𝑅𝑚𝑅𝑤125𝑇𝑅𝑠
where Rm is the motor shaft gear radius, Rs is the vehicle main shaft gear radius, Rw is the wheel radius. This is the general calculation for vehicle speed. We’re also considering mount the rotation sensor directly on the wheel axis so that speed
= 𝑁𝜋𝑅𝑤125𝑇
, which can simplify the calculation.
Once instant speed is calculated, we need to send it to the speed monitoring module. Since the speed data will be displayed on a two-digit seven-segment screen, which requires an 8 bit signal input (4 bit for first decimal digit and 4 bit for another decimal digit). An algorithm based on C language in the microprocessor to yield desired 8 bit speed data format is: (content in brackets is

8
example calculation) (Say that the speed we calculated is 5.37m/s) • Take integer part of the value (5.37 -> 5) • Divide last result by 10 and take the integer ratio and the remainder
(5\10=0 mod 5) • Convert the integer ratio and remainder into two 4-bit binary data respectively
(0 -> 0000, 5 -> 0011) • The two 4-bit binary data will be transmitted to the seven-segment display later
to show the speed.
2. Generating Camera Triggering Signal The signal from the speed encoder will be counted and converted to the
distance moved by the track vehicle by the microcontroller. The formula for this conversion is:
𝐷 = 125𝐷𝑅𝑠𝜋𝑅𝑚𝑅𝑤
, where D is the displacement of the vehicle
Then this distance will be compared with a threshold value. If D≥ 𝑡ℎ𝑟𝑒𝑠ℎ𝑜𝑙𝑑, then it means the vehicle has moved enough distance from where the last picture was taken and so new picture should be taken now. Otherwise, the vehicle will keep moving without the camera being triggered. The triggering signal will finally control the camera to take pictures.
Calculations will be made to determine the camera field-of-view (FOV) and the threshold value will be matched to that to ensure consecutive photos cover the entire area. The flow chart is as follows:

9
3. GPS data receiving and sending The GPS data from GPS unit will be first converted from RS232 to USART TTL
by MAX232N chip. Then the USART TTL signal will be fed into the PIC microcontroller and then be sent back to the laptop.
The hardware for this circuit is done by previous group but we still need to finish the programming work in order to fulfill our camera triggering goal. The circuit diagram below is for reference.
[1]
Camera The camera we are using is dragonfly DR2-COL. The input requirement is 12V DC
voltage. The interfaces are 6-pin IEEE-1394 for camera control and data transmission and 8-pin GPIO for external triggering. In order for the camera to be triggered by an external signal, we are going to use the 8-pin GPIO for connection.
As the table shown below:
10
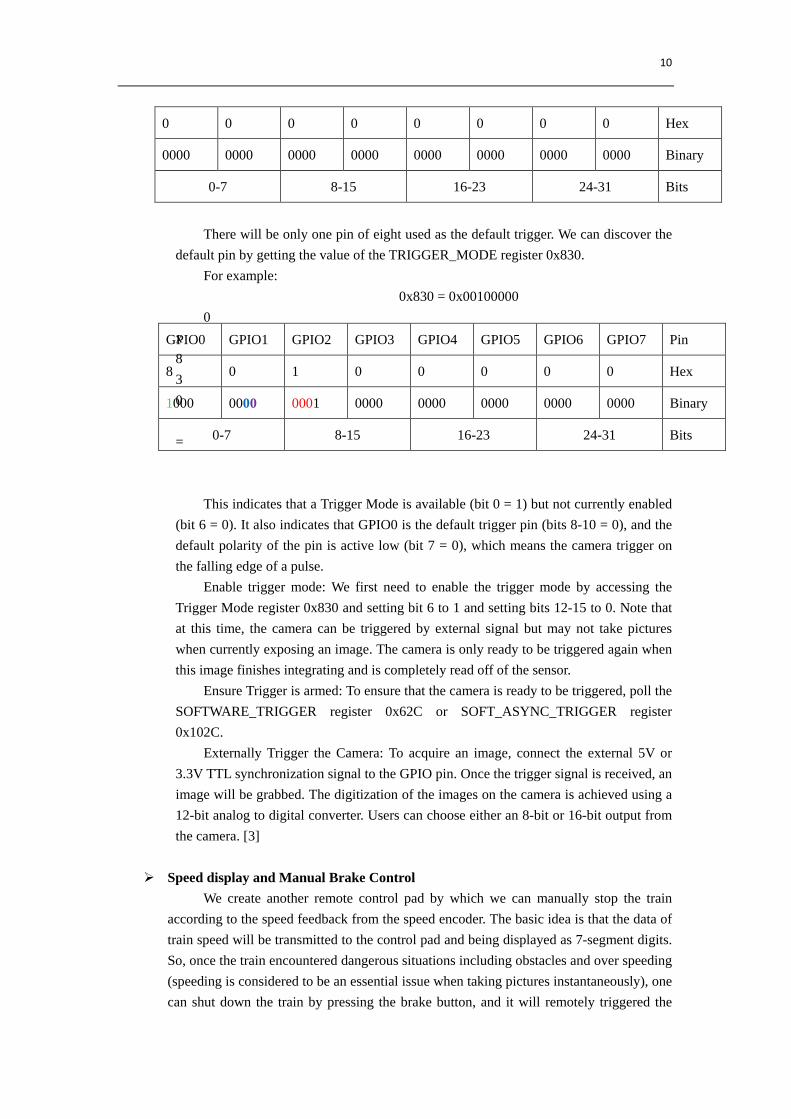
There will be only one pin of eight used as the default trigger. We can discover the
default pin by getting the value of the TRIGGER_MODE register 0x830. For example: 0x830 = 0x00100000 0
x830 =
This indicates that a Trigger Mode is available (bit 0 = 1) but not currently enabled
(bit 6 = 0). It also indicates that GPIO0 is the default trigger pin (bits 8-10 = 0), and the default polarity of the pin is active low (bit 7 = 0), which means the camera trigger on the falling edge of a pulse.
Enable trigger mode: We first need to enable the trigger mode by accessing the Trigger Mode register 0x830 and setting bit 6 to 1 and setting bits 12-15 to 0. Note that at this time, the camera can be triggered by external signal but may not take pictures when currently exposing an image. The camera is only ready to be triggered again when this image finishes integrating and is completely read off of the sensor.
Ensure Trigger is armed: To ensure that the camera is ready to be triggered, poll the SOFTWARE_TRIGGER register 0x62C or SOFT_ASYNC_TRIGGER register 0x102C. Externally Trigger the Camera: To acquire an image, connect the external 5V or 3.3V TTL synchronization signal to the GPIO pin. Once the trigger signal is received, an image will be grabbed. The digitization of the images on the camera is achieved using a 12-bit analog to digital converter. Users can choose either an 8-bit or 16-bit output from the camera. [3]
Speed display and Manual Brake Control We create another remote control pad by which we can manually stop the train
according to the speed feedback from the speed encoder. The basic idea is that the data of train speed will be transmitted to the control pad and being displayed as 7-segment digits. So, once the train encountered dangerous situations including obstacles and over speeding (speeding is considered to be an essential issue when taking pictures instantaneously), one can shut down the train by pressing the brake button, and it will remotely triggered the
0 0 0 0 0 0 0 0 Hex
0000 0000 0000 0000 0000 0000 0000 0000 Binary
0-7 8-15 16-23 24-31 Bits
GPIO0 GPIO1 GPIO2 GPIO3 GPIO4 GPIO5 GPIO6 GPIO7 Pin
8 0 1 0 0 0 0 0 Hex
1000 0000 0001 0000 0000 0000 0000 0000 Binary
0-7 8-15 16-23 24-31 Bits
11
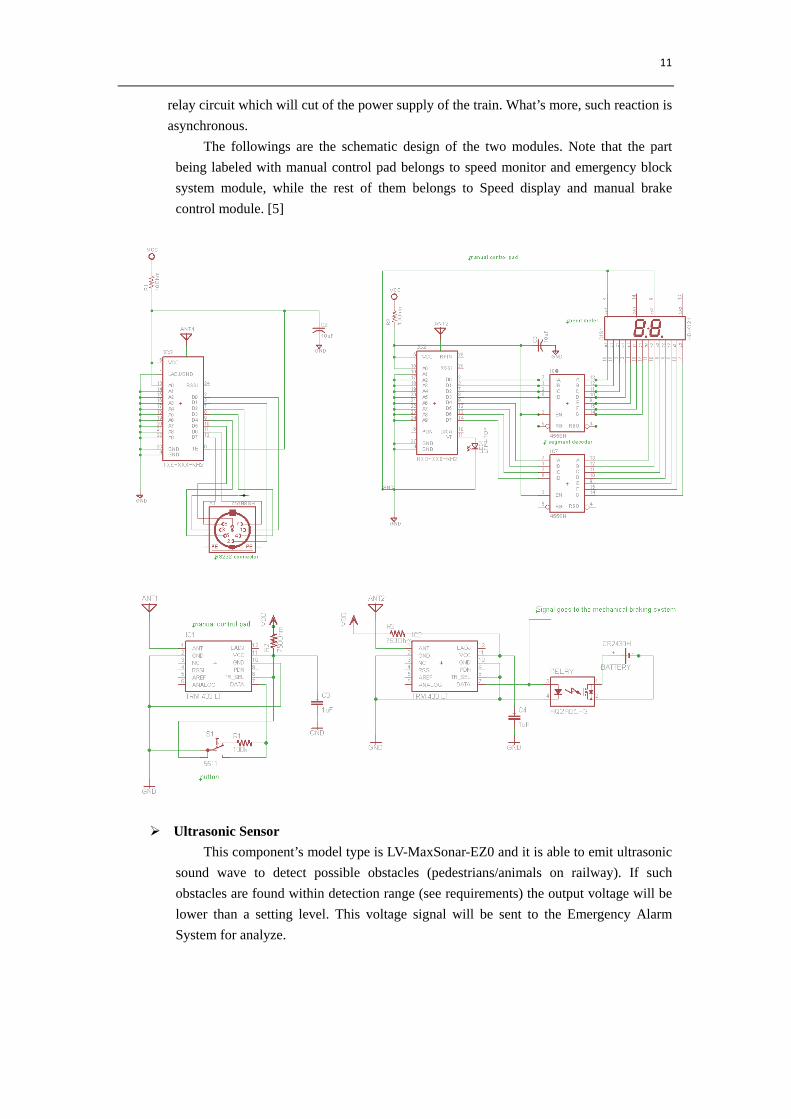
relay circuit which will cut of the power supply of the train. What’s more, such reaction is asynchronous.
The followings are the schematic design of the two modules. Note that the part being labeled with manual control pad belongs to speed monitor and emergency block system module, while the rest of them belongs to Speed display and manual brake control module. [5]
Ultrasonic Sensor
This component’s model type is LV-MaxSonar-EZ0 and it is able to emit ultrasonic sound wave to detect possible obstacles (pedestrians/animals on railway). If such obstacles are found within detection range (see requirements) the output voltage will be lower than a setting level. This voltage signal will be sent to the Emergency Alarm System for analyze.

12
Speed Monitoring and Emergency Alarm System This system will receive the voltage signal from the Ultrasonic distance sensor. The
voltage signal will be converted to a digital signal by the ADC in PIC microcontroller. The register used to store the converted digital signal is 10bits and the voltage signal from the sensor ranges from 60mV to 2.48V [4]. This gives us a voltage resolution of (2.48-0.06)/210 = 2.36 mV, which is enough to make precise measurement. According to the datasheet of the Ultrasonic sensor, for every inch that the object moves closer to the sensor, the output voltage will drop by 5/512 = 9.77 mV. So theoretically, we should have a distance resolution up to 2.36/9.77 = 0.24 inch. However, the actually resolution depends on many factors, including the voltage into the sensor, the position of the object and so on.
After converting to digital value, the voltage will be compared with a threshold value (769mV), which corresponds to approximately 2 meters. If the voltage falls below this threshold value, then it means the object is within 2 meters to the front of the car and thus a stop signal will be generated. The stop signal will be fed into a braking system, which is a mechanical system and it will be built by mechanical students in the future.

13
III. Requirements and Verifications Table, Tolerance
After all the physical assembly and programming work we should have our complete railroad vehicle model. Our project is a bit different since our project is based on a previously done project. We will test the function of our modules independently from previous group’s work. Generally speaking, at this stage of the project, we hope the bulk DC-DC converter will give us the 5V power supply used in the system with acceptable efficiency. Also, once started, the programming in our microchip will process the signal from speed encoder and generate a triggering signal which activates the camera after every certain distance (to be determined, should be around 70~80cm), which ensures uniform picture covering the whole route for security check. At the same time, the GPS will receive signal from satellites and calculates its location ~5Hz and these location data will be continuously feed into the computer. Note that all of the pictures and GPS information with corresponding time should be stored and recorded in logs respectively for future data analysis.
Module/Components & Requirements Verifications 1. Buck Converter This unit should output a 5V DC when input is 12V DC. The output voltage ripple should be smaller than 0.5V and the output voltage deviation should be within 1V. The maximum output current is around 250mA.
1. Test the specifications of this circuit according to the requirement 1.1 The input voltage to buck converter is 12V
and the output voltage is 5V. 1.2 Output voltage ripple: Put a 0.5V peak-peak
AC voltage with 12V DC offset to the buck converter, and then use the oscilloscope to look at the output voltage. The output voltage should be around 5V with a ripple voltage smaller than 0.5V.
1.3 Output voltage change: apply different value of resistors (1M, 100k, 20k, 5k, 1k, 500) to the output as load; the output voltage should be around 5V with a deviation no more than 1V.
1.4 Output current change: apply different value of resistors (1M, 100k, 20k, 5k, 1k, 500) to the output as load; the output current should be able to reach 250mA while the output voltage stays around 5V (with a deviation no more than 1V).
2. GPS module The GPS module just contains a single PG11 GPS engine and it must acquire the longitude and latitude of the current location. The data should be
2. Test the GPS at a certain place (point) for several times (reset before each time) and retrieve the data. If data are sent in correct format, decode the information in a computer and compare each

14
sent in NMEA 0183 protocol to Main PIC. Location accuracy should be within 10 meters.
test’s location output to see if the overall variance is less than 10m. Note that additional programming might need for the data retrieval.
3. Data Collecting & Integrating Circuit 3.1 This circuit must pick up the signals from the
speed encoder and convert it to a triggering signal with error <5%.
3.2 PIC1 chip check: It must be able to receive data from speed encoder and output corresponding triggering signal.
3.3 PIC2 chip check: It must be able to transmit data from the speed encoder to the computer.
3. With correct input specified in (1), test if the output triggering signal (use oscilloscope) happened on time according to the rotations of the wheels (by observing data from the speed encoder). Calculate and compare the %error. 3.1 Test its inquisition of the signals from the
speed encoder and its conversion by oscilloscope at input/output pins.
3.2 Connect the output to the computer to see if the speed encoder’s signals are recognizable.
4 Camera
This camera should be able to take a picture whenever a triggering signal is detected. After that, the picture should be transmitted back to the laptop and can be properly displayed.
4. Test that the power from the battery can be split out with thin wires which can power up the camera. 4.1 For triggering signal coming from Data
Collecting & Integrating Circuit, check whether it can be correctly recognized by the camera.
4.2 Connect the camera to a laptop to see if pictures are sent successfully and quality is good enough (no obvious blurry parts from vibration).
5 Speed Monitoring and Emergency Alarm
System.
This module will be able to receive the output
from ultrasonic sensor and convert it to obstacle
distance. When an object is present at a distance
closer than 2 meter, a braking signal should be
generated within 0.5 seconds. In order to
minimize false alarms, the detected distance
should be stable without too many fluctuations.
5. Test the sensitivity and stability of the output from the ultrasonic sensor. 5.1 Place an object in front of the car. Move
this object closer and closer to the car and at the same time use a multimeter to test the output from the Ultrasonic sensor. The voltage should be decreasing as the object is moving closer to the sensor, at a scale of 9.77mV/inch. When the object is more than 7 meters away, the output voltage should be around 3V. When the object is closer than 20cm, the voltage should be around 100mV.
5.2 Place an object at a certain distance away from the sensor and use the multimeter to test the output voltage. The output voltage should be stable with a fluctuation smaller than 40mV. This means that the uncertainty of the distance is within around 10cm.

15
6 Speed display and Manual Brake Control
6.1 The power supplied to all of the transmitters and receivers should be on and equal to 5 volts or within 5% deviation.
6.2 When pressing the system emergency brake button, there should be a signal indicating the mechanical braking system is activated immediately.
6.3 When the transmitter of speed monitor module is sending data to the control pad side, the LED indicating the addresses of transmitter and receiver are perfectly matched should be solid green.
The digits read by the 7-segment display
shouldn’t have errors or non-digit symbols.
6.1 Neither the transmitter nor the receivers can handle the voltage greater than 5 volts when sending analog signals, so the voltage at Vcc should not exceed 5 volts.
6.2 When testing waveform on one of the oscilloscopes in lab, hit the Mode/Coupling button. On the Trigger Mode and Coupling Menu choose Mode Auto and switch to Mode Normal. It should capture the waveform of RS-232.
6.3 The visualized speed should be identical to the speed shown on the laptop screen by the Putty program which was developed by the previous team. The differences between these two should not be greater than 10%.
6.4 Simulate the waveform of both the input signal of transmitter and output signal of receivers. Compare the value of these two; the differences between them should not exceed 5% since we are implementing a noisy free power supply.
The data speed transferred by RS232 connector should be in the exact format we need for the remote control part. The more significant four bits should display the tenths’ digit of the speed while the lower four bits should display the single digit of the speed. NOT the binaries of values of the speed. i.e., ’35’ should be displayed as ‘00110101’ instead of ‘00100011’.
Tolerance Analysis The main goal of our project is to correctly trigger the camera and GPS such that the pictures will be taken in a consecutive manner and each picture can be matched to a GPS coordinate. At this stage, we hope the GPS has accuracy within 10m range. That is to say, once defects are found in data analysis, corresponding GPS location can be retrieved from the log and it should be within 10m range to the real locations of those defects, so that railway technicians can track down the problematic part on the railway in relatively short time. We will also check the picture samples’ uniformity by taking pictures under the same speed. Then the vehicle will be operated at varying speed. We will check if the pictures are still consecutive and even without losing any area passed through by the vehicle. To ensure this requirement we propose the consecutive two images should have ~20cm railway area overlapping in the image to avoid losing data. To compensate for the lack of accuracy of the

16
GPS, we will utilize the encoder signal to estimate distance traveled by the vehicle and hence further increasing this position accuracy recorded. Another point to discuss is the obstacle sensing. In our primary goal we hope the sonar with our threshold configuration should be able to detect the obstacle within an area in front of the sensor with 2 meters in length and three inches in width. The error tolerance of the detection area should be +- 10 cm in length and +- 1 inch in width. Besides, we hope our antenna can communicate within a maximum distance around 10 meters (with 10% fluctuation). Finally, a stable voltage around 5V is desired for reliable operation, the error range we proposed is shown in the verification part. IV. Ethical Problems
The biggest issue with this system is that the battery used on it is a lead storage battery. This kind of battery is environmental harmful. Once the outer shell is broken, the electrolyte in the battery will leak out, which will stay in the environment for a long time before degradation. So a more environmental friendly power source is preferred such as solar power or hydrogen fuel cell.
Another potential hazard is that the braking system we’re now designing is incomplete since the mechanical brake (like one used in a car) is beyond our scope for this project. For most of the time the vehicle is at around human’s walking speed so once “stop signal’ is received the motor will stop and the vehicle will decelerate gradually due to friction, without large potential dangerous momentum. However, if the vehicle is accelerated when going down a slope, it will be very hard to stop it in a short distance due to its heavy weight. According to the BRAKE SYSTEM SAFETY STANDARDS for FREIGHT and OTHER NON-PASSENGER TRAINS and EQUIPMENT (49 C.F.R. PART 232), Code of Federal Regulations: "All trains shall be equipped with an emergency application feature that produces an irretrievable stop". So in order for our track vehicle to work on a real railway, an effective mechanical braking system is mandatory to ensure the safety of the workers and railroad operation. What’s more, a normal gas braking system or Electronically Controlled Pneumatic (ECP) Brakes system is just too big to be installed on this cart. One solution to this problem is to use the motor as an emergency brake. Specifically, the motor will be operated in a reverse direction when emergency braking is required thus reducing the vehicle speed. One thing to note is that this method is not intended for regular braking operation because it will probably damage the motor, transmission system or overload the motor driving circuit. Future discussion and work might be needed in mechanical engineering range.

17
V. Cost Labor
Name (Rate/Hour)*2.5*(Total Hours) Total Price Jilin Jiang (30$/Hour)*2.5*(120 Hours) $ 9000.0
Kuangxiao Gu (30$/Hour)*2.5*(120 Hours) $ 9000.0 Jialun Liu (30$/Hour)*2.5*(120 Hours) $ 9000.0
Labor Total $ 27000.0 Parts Parts Model Quantity Price ($) Capacitor 100 uF 2 0.2
10 uF 2 0.2 1 uF 2 0.2 470 uF Electrolytic capacitors 1 0.5
Inductor 60 uH 1 1 Resistor 470 Ω 1 0.1 Resistor 10k Ω 2 0.2 Resistor 750 Ω 2 0.2 PMOS SI9400DY 1 1.5 PWM Controller TL494 1 0.5 Diode 1N5820 1 0.58 Ultrasonic sensor LV-Maxsonar-EZ0 1 30 Microcontroller PIC16F877A 1 5 Oscillator ECS-100Ax 1 2.63 Camera Dragonfly2 DR2-COL 1 sample Antenna Linx 4 28 Female connector 8-pin RS232 1 15 LED NTE electronic 1 2 Dual LED display Cathode DC56-11EWA 1 1 7-segment decoders NXP HEF4543BP,652 2 2 transmitter TXE-433-KH2 1 8 receiver RXD-433-KH2 1 14 transceiver TRM-433-LT 2 30 Button switch Push button switch 1 3 Relay circuit Four Seasons 35874 1 10 Total 155.81 Total Cost: 27155.81 USD

18
VI. Schedule Week Date Task Responsibility 1 8/27 – 9/2 Post project ideas All 2 9/3 – 9/9 Pick up projects and find group member All 3 9/10 –
9/16 Submit RFA All
4 9/17 – 9/23
Talk with John M. Hart Submit Proposal Set weekly meeting time with John and TA
All
5 9/24 – 9/30
Sign up for design review Kuangixao Gu
Read the report of previous group All
Hook up the system to check its functions and figure out what still needs to be done
All
Detailed design of camera triggering module, 12V-5V DC/DC Converter
Kuangxiao Gu
Check the camera and GPS unit and find out the control protocol, the power and data transmission protocol
Jilin Jiang Jialun Liu
Write the Design Review All
6 10/1 – 10/7
Design Review Check with TA and Prof. to verify the project requirement
All
Ordering parts Jialun Liu
Detailed design on Speed display & Manual Brake Control
Jilin Jiang, Jialun Liu
Camera triggering module complete Kuangxiao Gu
7 10/8 – 10/14
Test the camera triggering unit Kuangxiao Gu
Continue on Speed display & Manual Brake Control
Jilin Jiang, Jialun Liu
Build the DC/DC converter Kuangxiao Gu
8 10/15 – 10/21
Continue on Speed display & Manual Brake Control
Jilin Jiang, Jialun Liu
Ordering PCB Jilin Jiang Trouble shooting camera triggering unit, DC/DC converter
Kuangxiao Gu
9 10/22 – 10/28
Speed Monitor and Emergency Braking System
Kuangxiao Gu, Jialun Liu
19
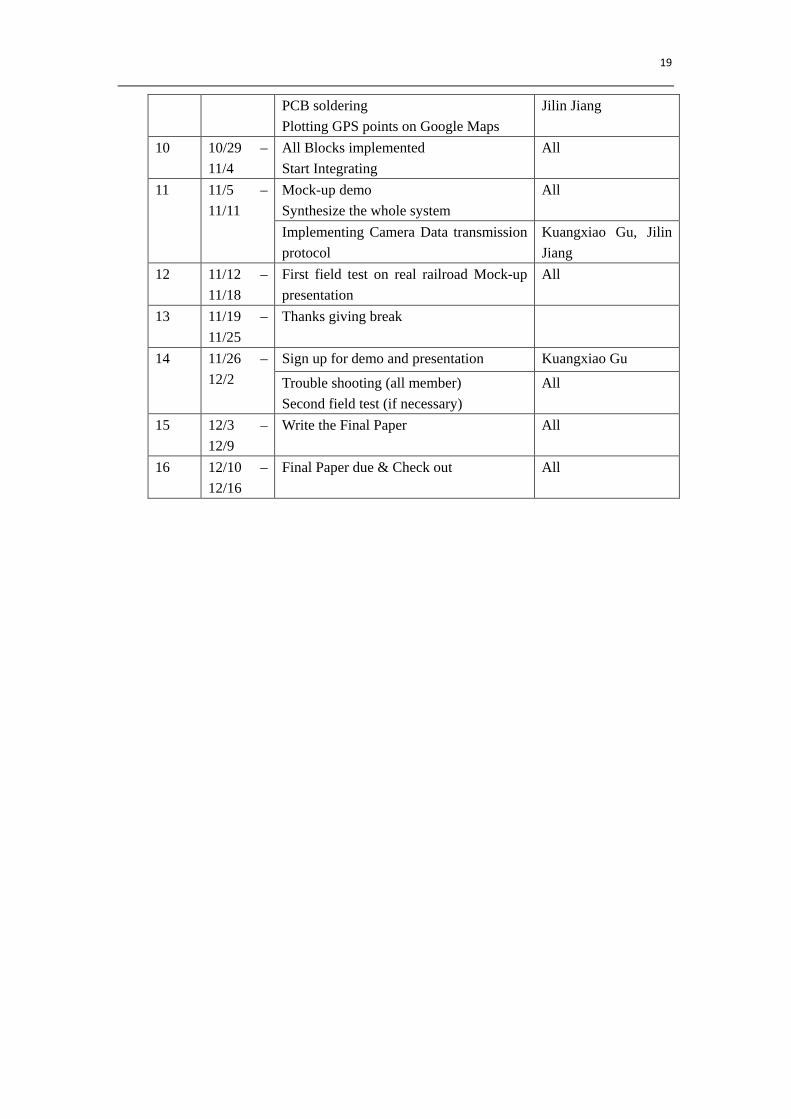
PCB soldering Plotting GPS points on Google Maps
Jilin Jiang
10 10/29 – 11/4
All Blocks implemented Start Integrating
All
11 11/5 – 11/11
Mock-up demo Synthesize the whole system
All
Implementing Camera Data transmission protocol
Kuangxiao Gu, Jilin Jiang
12 11/12 – 11/18
First field test on real railroad Mock-up presentation
All
13 11/19 – 11/25
Thanks giving break
14 11/26 – 12/2
Sign up for demo and presentation Kuangxiao Gu
Trouble shooting (all member) Second field test (if necessary)
All
15 12/3 – 12/9
Write the Final Paper All
16 12/10 – 12/16
Final Paper due & Check out All

20
Reference
[1] Group 29 Fall 2011, Design review document
http://courses.engr.illinois.edu/ece445/projects/fall2011/project29_design_review.pdf
[2] Advancements in Railroad Track Inspection Using Machine-Vision Technology, Edwards
et al, 2009, Computer Vision and Robotics Laboratory, Beckman Institute for Advanced
Science and Technology, University of Illinois at Urbana-Champaign
[3] Point Grey production official site
http://www.ptgrey.com/products/dragonfly2/dragonfly2_firewire_camera.asp
[4] LV-Maxsonar-EZ0 Ultrasonic distance sensor datasheet
http://www.maxbotix.com/documents/MB1000_Datasheet.pdf
[5] Linx technology official site
http://www.linxtechnologies.com

21
Appendix
• Design specification:
Vin = 12 V Vout = 5 V Duty_cycle = 5/12 f = 200 kHz Iripple = 0.25 A Vripple,out = 0.1V Iload,Max = 1 A
• 𝐿 = (𝑉𝑖𝑛−𝑉𝑜𝑢𝑡)∗𝑑𝑢𝑡𝑦_𝑐𝑦𝑐𝑙𝑒𝑓∗𝐼𝑟𝑖𝑝𝑝𝑙𝑒
= (12−5)∗5/12200∗0.25∗1000
= 58.33 uH
• 𝐶 = 𝐼𝑟𝑖𝑝𝑝𝑙𝑒∗𝑑𝑢𝑡𝑦_𝑐𝑦𝑐𝑙𝑒𝑓(𝑉𝑟𝑖𝑝𝑝𝑙𝑒−𝐸𝑆𝑅∗𝐼𝑟𝑖𝑝𝑝𝑙𝑒)
= 0.25∗5/12200∗1000(0.1−0.2∗0.25)
= 10.42 uF
(Although the calculation results only requires a output capacitor of 10 uF, we found that a bigger capacitor can reduce the ripple voltage significantly. Two 100uF capacitors give a ripple voltage of 789uV while one 10uF capacitor gives a ripple voltage of 15mV. Considering that the voltage of the battery may vary according to the load of the motor and the Ultrasonic sensor is sensitive to supply voltage, we chose bigger capacitor for better voltage stability.)

22
Big output capacitor (2*100uF) have a much smaller ripple voltage than a single 10uF capacitor
• Vdiode,reverse ≥ 12𝑉, Idiode ≥ Iload,Max = 1 A
(1N5820 has a maximum reverse voltage of 20A and max current equals to 3A, which can be used in our design)
• |VPMOS,DS| ≥ 𝑉𝑖𝑛 − 𝑉𝑜𝑢𝑡 = 7𝑉, ID > RIload,Max (SI9400DY has VPMOS,DS =-20V and ID = 2.5A, which can be used in our design. Another reason we choose SI9400DY is that this PMOS has a relatively small turn-on and turn-off delay, which are 10ns and 20ns respectively. A faster turning time means we can use higher frequency PWM controller and thus get higher efficiency and smaller peripheral components, such as inductors and capacitors)
• We also tried to add zener diodes to the output end of this buck converter. This
modification is trying to deal with the voltage change of the battery. When using a single buck converter with no compensation, once the battery voltage changes, the output voltage will change, which is not desired. By adding zener diodes to the output end of the buck converter, the output voltage will be stabilized at 5V as long as the input voltage to the zener diode is bigger than 7 V. In the simulation below, the input voltage (battery
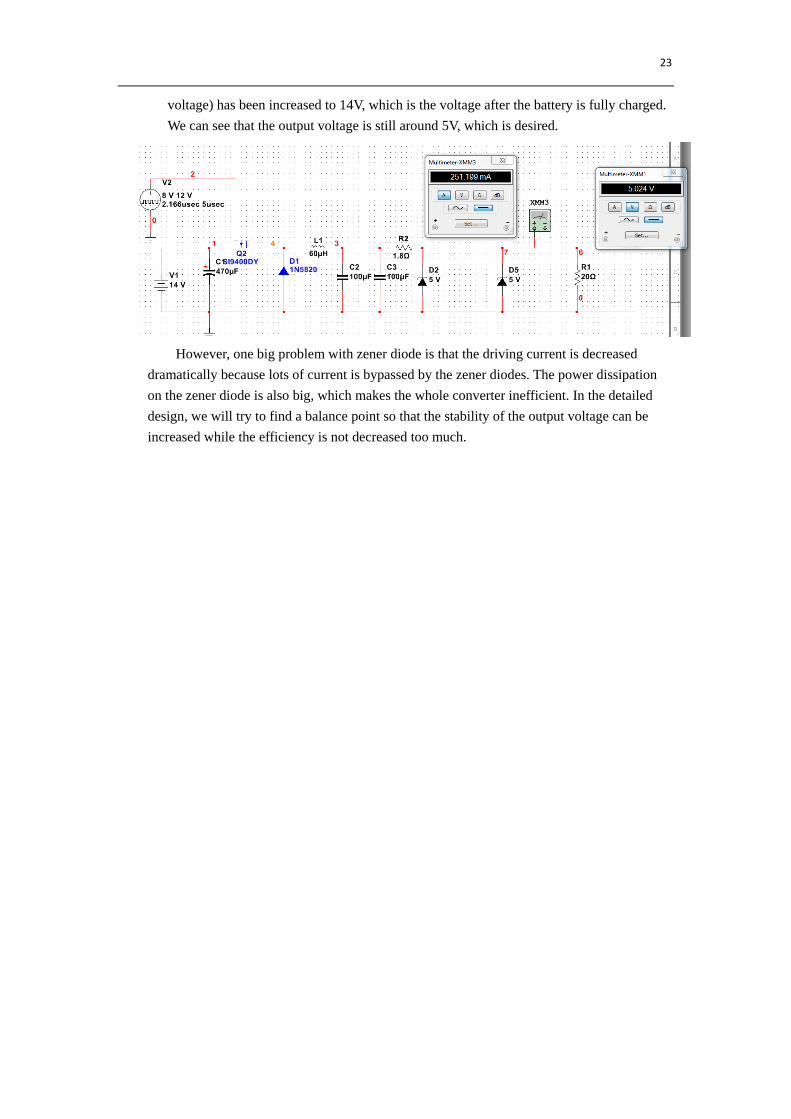
23
voltage) has been increased to 14V, which is the voltage after the battery is fully charged. We can see that the output voltage is still around 5V, which is desired.
However, one big problem with zener diode is that the driving current is decreased
dramatically because lots of current is bypassed by the zener diodes. The power dissipation on the zener diode is also big, which makes the whole converter inefficient. In the detailed design, we will try to find a balance point so that the stability of the output voltage can be increased while the efficiency is not decreased too much.