tracking the trend 2016 (corporate currency review)
TRANSCRIPT

Review of The Corporate Currency Market
AFP The Association For Financial
Professionals
Wells Fargo
Deloitte
KPMG
FiREapps
With Statistics From:
Tracking the Trends:
2016

0
30
60
90
120
Q4 2008 Q4 2009 Q4 2010 Q4 2011 Q4 2012 Q4 2013 Q4 2014 Q4 2015 Q4 2016 Q4 2017Innovators Early Adopters
Early Majority
Late Majority
B/S Currency Risk Management
P/L Currency Risk Management
10
20
30
40
Innovators Early Adopters
Laggards
Currency Impact By Quarter from FiREapps Research1
The Currency Risk Management Tech Adoption Curve
Tracking the Trends: 2016 Corporate Currency Market Review
Volatility and a multitude of crises characterize the last 5 quarters for corporate currency risk management pros.
Only five short years ago, in 2011, the world went through a euro-driven currency crisis— one less complex, but similar in magnitude to the last 5 quarter’s top-line impacts.
In 2011, shortly after the euro crisis, we saw a rapid rise in adoption of our currency risk management solutions for the corporate balance sheet.
Those that adopted technology as a result of 2011 were prepared for 2015, but that doesn’t mean they were done innovating.
Early 2015 brought a volatility spike that once again preceded (and drove) the adoption of technology to manage currency risk. This time, on the P&L, and at a faster pace than was with balance sheet in 2008.
The anecdotal adoption curve above lays out the timeline pretty well: 2008 marks the beginning of adoption for balance sheet
currency risk management technology. Similarly, 2011 serves as the catalyst necessary to accelerate its adoption.
Fast forward to 2015 and major complexity and volatility were still major variables in the need for more real-time insights. This lent to the birth and integration of P&L analytics.
The near 7-year span between one adoption curve beginning, and the next, is in agreement with KPMG’s argument that any standards in the area of treasury software that are 7+ years old are no longer appropriate.2
This mentality drives a requirement for ongoing innovation. That drives rapid evolution of technology in treasury, bringing with it challenges and opportunities for large multinational corporations.
In the past 18 months, concurrent with volatility, the amount of research available to corporate currency risk managers has skyrocketed.
This report is designed to do three key things:
1) Highlight recent trends and key statistics from the currency markets
2) Summarize the key findings, trends, and conversations that characterize corporate currency risk management today
3) Help you and your organization to become more currency aware
Using this document, you should be able to benchmark your current outcomes, critically assess where your organization fits in the adoption cycle of each approach and gauge your level of understanding (compared to your peers in the market).
This research is comprised of key findings from KPMG, Deloitte, Wells Fargo, the Association for Financial Professionals and FiREapps.
As you read through, it may be helpful to keep a couple things in mind:
• Some companies are the innovators, some are the early adopters and some tend to fall behind technologically. Anecdotally, this is often a cultural thing. Critically assess your organization’s style and work within that context.
• Initially, it is most important to determine where to start by asking what is most important to the organization. Where do you think you are most at risk?
The adoption of strategies to satisfy rapidly changing international market conditions is both necessary and timely. In today’s market, not doing so means risking falling behind the competition. The following research will show you what early-adopters in the space have been tackling and struggling with for the past 7 years.
The Currency Risk Management Adoption Curve
2
Key Findings from Across the Corporate Currency Industry
3
Latest Research Corporate Currency Awareness
6
Learn More: Where to Start Driving Currency Awareness
10
Additional Market Research 12
References/Sources 13
TABLE OF CONTENTS
1 "Q4 CURRENCY REPORT:$33.94 BN HEADWIND." FiREapps Q4 Currency Report. 12 Apr. 2016.
2 "Position Paper Treasury 4.0" | KPMG | DE." Position Paper Treasury 4.0 | KPMG | DE. 22 Sept. 2015.
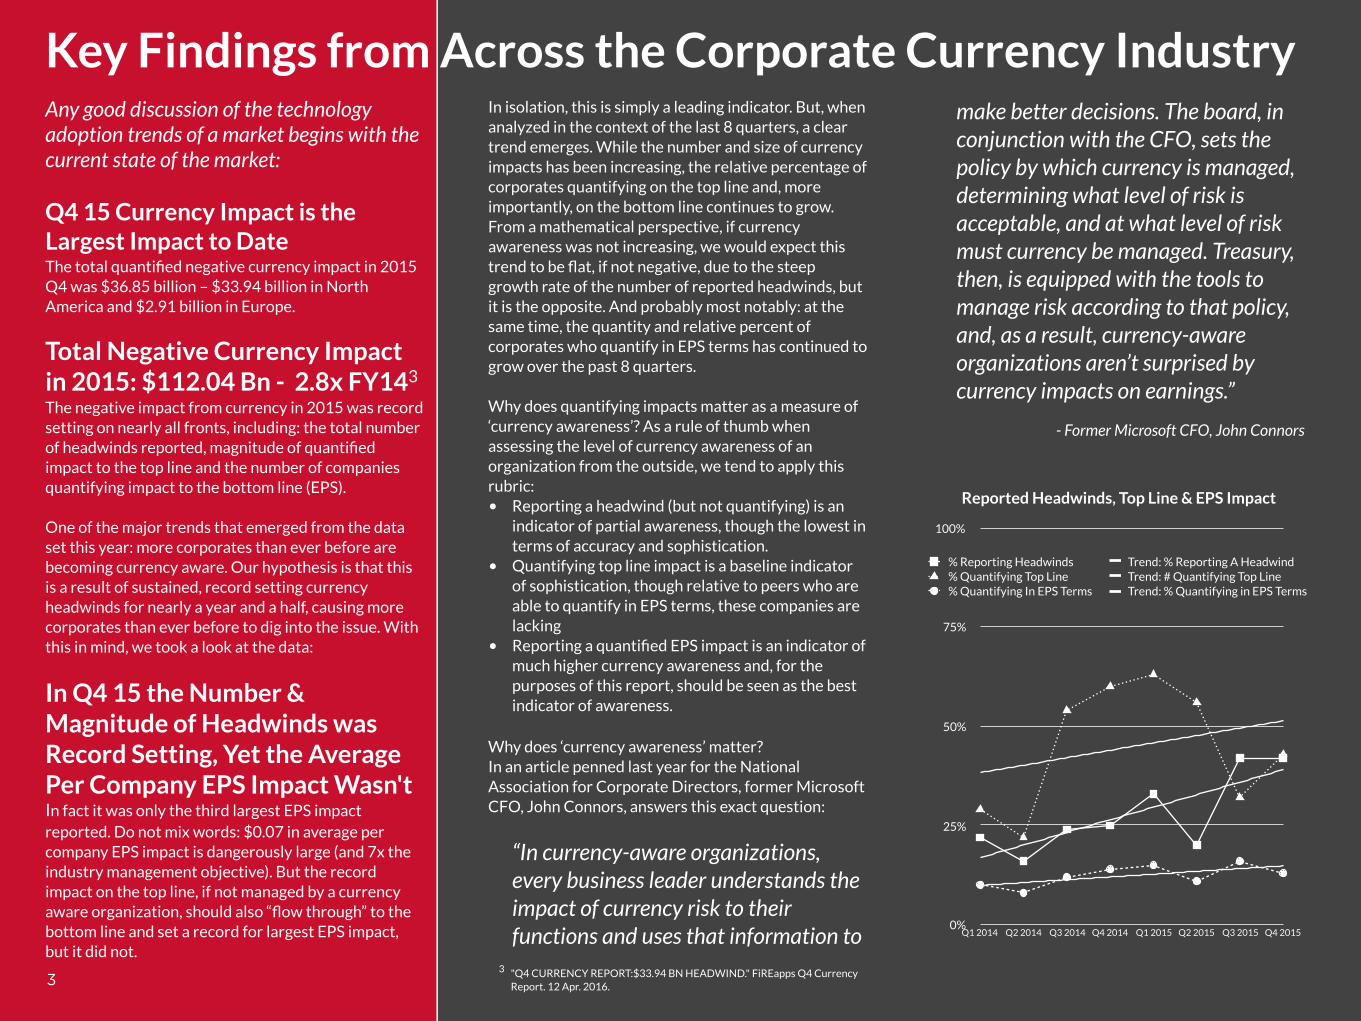
Any good discussion of the technology adoption trends of a market begins with the current state of the market:
Q4 15 Currency Impact is the Largest Impact to Date The total quantified negative currency impact in 2015 Q4 was $36.85 billion – $33.94 billion in North America and $2.91 billion in Europe.
Total Negative Currency Impact in 2015: $112.04 Bn - 2.8x FY143 The negative impact from currency in 2015 was record setting on nearly all fronts, including: the total number of headwinds reported, magnitude of quantified impact to the top line and the number of companies quantifying impact to the bottom line (EPS).
One of the major trends that emerged from the data set this year: more corporates than ever before are becoming currency aware. Our hypothesis is that this is a result of sustained, record setting currency headwinds for nearly a year and a half, causing more corporates than ever before to dig into the issue. With this in mind, we took a look at the data:
In Q4 15 the Number & Magnitude of Headwinds was Record Setting, Yet the Average Per Company EPS Impact Wasn't In fact it was only the third largest EPS impact reported. Do not mix words: $0.07 in average per company EPS impact is dangerously large (and 7x the industry management objective). But the record impact on the top line, if not managed by a currency aware organization, should also “flow through” to the bottom line and set a record for largest EPS impact, but it did not.
In isolation, this is simply a leading indicator. But, when analyzed in the context of the last 8 quarters, a clear trend emerges. While the number and size of currency impacts has been increasing, the relative percentage of corporates quantifying on the top line and, more importantly, on the bottom line continues to grow. From a mathematical perspective, if currency awareness was not increasing, we would expect this trend to be flat, if not negative, due to the steep growth rate of the number of reported headwinds, but it is the opposite. And probably most notably: at the same time, the quantity and relative percent of corporates who quantify in EPS terms has continued to grow over the past 8 quarters.
Why does quantifying impacts matter as a measure of ‘currency awareness’? As a rule of thumb when assessing the level of currency awareness of an organization from the outside, we tend to apply this rubric: • Reporting a headwind (but not quantifying) is an
indicator of partial awareness, though the lowest in terms of accuracy and sophistication.
• Quantifying top line impact is a baseline indicator of sophistication, though relative to peers who are able to quantify in EPS terms, these companies are lacking
• Reporting a quantified EPS impact is an indicator of much higher currency awareness and, for the purposes of this report, should be seen as the best indicator of awareness.
Why does ‘currency awareness’ matter? In an article penned last year for the National Association for Corporate Directors, former Microsoft CFO, John Connors, answers this exact question:
“In currency-aware organizations, every business leader understands the impact of currency risk to their functions and uses that information to
make better decisions. The board, in conjunction with the CFO, sets the policy by which currency is managed, determining what level of risk is acceptable, and at what level of risk must currency be managed. Treasury, then, is equipped with the tools to manage risk according to that policy, and, as a result, currency-aware organizations aren’t surprised by currency impacts on earnings.”
3
0%
25%
50%
75%
100%
Q1 2014 Q2 2014 Q3 2014 Q4 2014 Q1 2015 Q2 2015 Q3 2015 Q4 2015
% Reporting Headwinds Trend: % Reporting A Headwind% Quantifying Top Line Trend: # Quantifying Top Line% Quantifying In EPS Terms Trend: % Quantifying in EPS Terms
Reported Headwinds, Top Line & EPS Impact
Key Findings from Across the Corporate Currency Industry
- Former Microsoft CFO, John Connors
3 "Q4 CURRENCY REPORT:$33.94 BN HEADWIND." FiREapps Q4 Currency Report. 12 Apr. 2016.

“
“
“
Historically, when a CEO was asked about the impact of currency volatility on the financial statement, the CEO passed the question to the CFO who more than likely passed it to the treasurer. The treasurer’s generic answer was almost always “I think we’re okay but I don’t have the resources to say exactly what our value at risk is.” Currency risk management was viewed like insurance, and as is often the case, it is only when a fire breaks out that the organization realizes it was under-insured. Smart CFOs knew this 4 quarters ago as characterized by, then CFO & Senior Vice President at Google, Patrick Pichette during Google’s Q4 14 earnings call.
The Rise of Currency Aware CFOs
On the flip side of that, I just want to kind of reinforce the fact that our FX hedging program continues to do exactly what it's supposed to do, which is in a low volatility environment we buy insurance and in moments where we have such shocks like we're having right now, we did get a lot of benefit out of this hedging program.”
Unfortunately, the majority did not share this sentiment and thus we have seen the “fire” of currency impacts rage for five quarters now. As a result of the heat, an increasing number of organizations are apparently figuring out how to manage it. As more companies join their ranks, we should see EPS impact averages continue on a downward trend. Additionally, as the awareness trend increases, we expect to see more CEOs guide boards, investors, and analysts on how currency volatility is expected to impact the top line and what the organization is doing to protect earnings per share.
One emblem of the early stages of this growing currency awareness is CEOs’ increasing ability to preempt/answer tough questions from analysts who are themselves getting smarter about currency. For example, Apple CEO, Tim Cook, began to talk currencies only 3 minutes into Apple’s earnings call, demonstrating a level of currency awareness not seen previously from Apple, especially at the CEO level:
Patrick Pichette, CFO & Senior Vice President, Google | Q4 2014
Our results are particularly impressive given the challenging global macroeconomic environment. We're seeing extreme conditions unlike anything we have experienced before just about everywhere we look … Since the end of fiscal 2014 for instance, the Euro and British pound are down double digits and major currencies such as the Canadian dollar, Australian dollar, Mexican peso, and Turkish lira have declined 20% or more. The Brazilian real is down more than 40% and the Russian ruble has declined more than 50%.”
“Two-thirds of Apple's revenue is now generated outside the United States, so foreign currency fluctuations have a very meaningful impact on our results … $100 of Apple's non-US dollar revenue in Q4 of 2014 translated to only $85 last quarter due to the weakening currencies in our international markets. As you can see, the movement has been dramatic. Last quarter alone, the currency impact has been very large …The 8% growth rate I spoke about earlier translates to $80.8 billion in constant currency revenue, which is $5 billion more than our reported revenue. For perspective, that difference is about the size of the annual revenue of a Fortune 500 company.”
Tim Cook, CEO, Apple | Q4 2015
Another example of the dramatically increased trend of currency awareness in the C-suite can be found at Procter & Gamble. In their Q4 2015 earnings call, the CFO spent nearly 10 minutes (and 4 follow-up questions) walking analysts and investors through the intricacies of how P&G is impacted by currencies and what it means to the business:
Given the magnitude of the foreign exchange impact, I thought it might be helpful to again recount how FX impacts our earnings …First, transaction impacts increase the cost …The second impact is balance sheet revaluation … Third, income statements of foreign subsidiaries like Argentina that do not use the U.S. dollar as their functional currency are translated back to U.S. dollars at the new exchange rates … I said we would not cut smart investment to offset foreign exchange impacts, which meant we could very well end up below the earnings per share guidance range…”
Jon Moeller, CFO, Procter & Gamble Co. | Q4 2015
4
-40%
0%
40%
80%
120%
160%
1/31/12 5/31/12 9/30/12 1/31/13 5/31/13 9/30/13 1/31/14 5/31/14 9/30/14 1/31/15 5/31/15 9/30/15
USD/EUR USD/RUB USD/GBP USD/BRL USD/JPY USD/ARSUSD/CHF USD/CNY USD/VEF USD/CAD
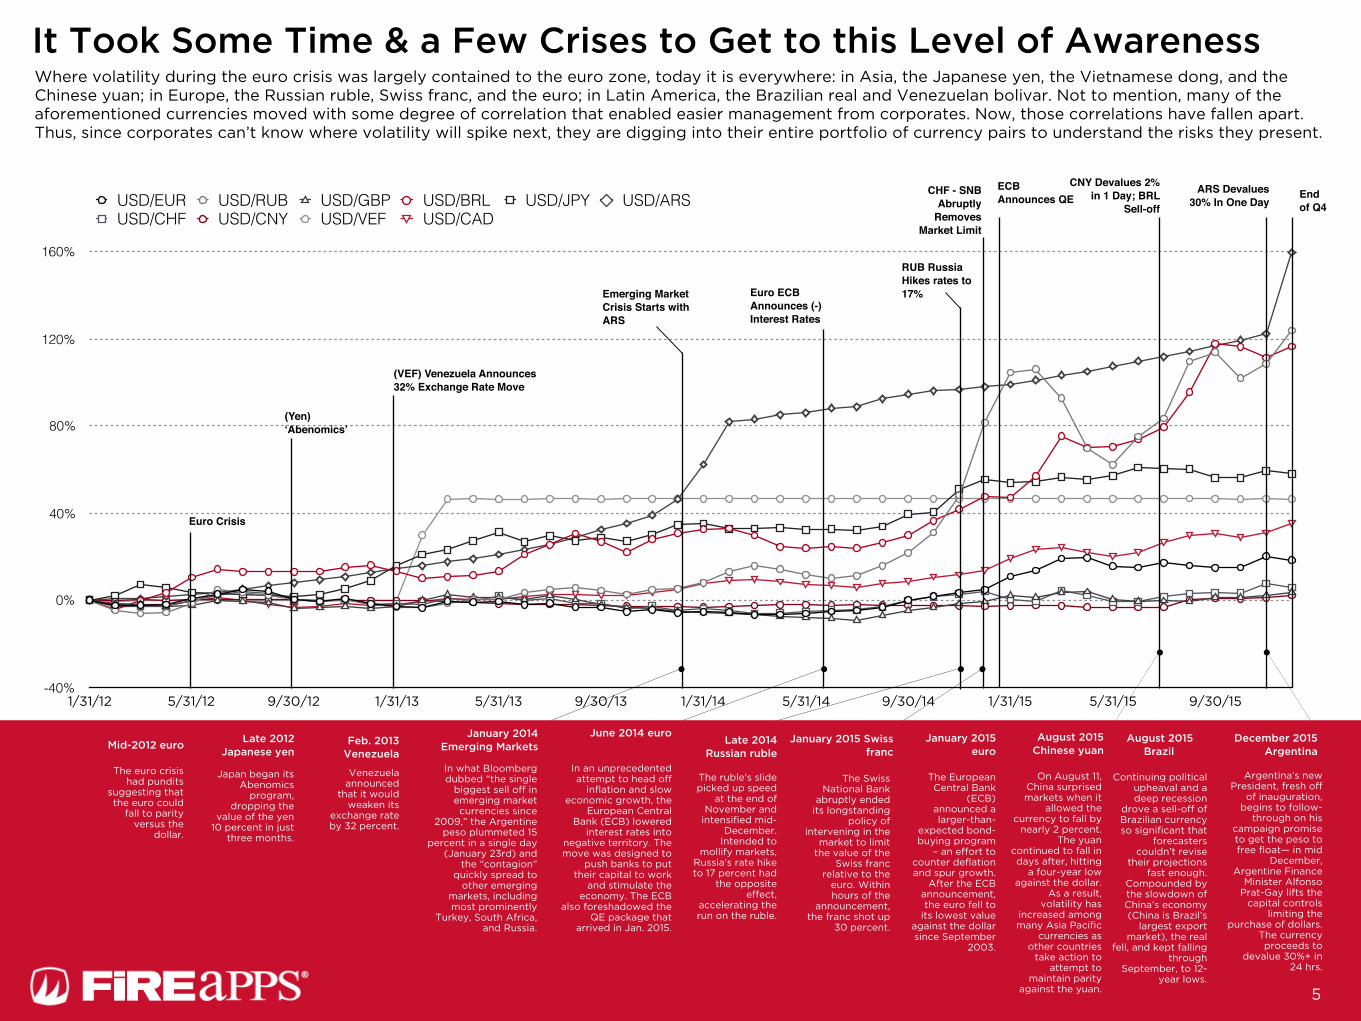
Euro Crisis
(Yen) ‘Abenomics’
(VEF) Venezuela Announces 32% Exchange Rate Move
Emerging Market Crisis Starts with ARS
Euro ECB Announces (-) Interest Rates
RUB Russia Hikes rates to 17%
CHF - SNB Abruptly
Removes Market Limit
ECB Announces QE
CNY Devalues 2% in 1 Day; BRL
Sell-off
Where volatility during the euro crisis was largely contained to the euro zone, today it is everywhere: in Asia, the Japanese yen, the Vietnamese dong, and the Chinese yuan; in Europe, the Russian ruble, Swiss franc, and the euro; in Latin America, the Brazilian real and Venezuelan bolivar. Not to mention, many of the aforementioned currencies moved with some degree of correlation that enabled easier management from corporates. Now, those correlations have fallen apart. Thus, since corporates can’t know where volatility will spike next, they are digging into their entire portfolio of currency pairs to understand the risks they present.
It Took Some Time & a Few Crises to Get to this Level of Awareness
5
End of Q4
ARS Devalues 30% In One Day
The euro crisis had pundits
suggesting that the euro could
fall to parity versus the
dollar.
Japan began its Abenomics
program, dropping the
value of the yen 10 percent in just
three months.
Venezuela announced
that it would weaken its
exchange rate by 32 percent.
In what Bloomberg dubbed “the single
biggest sell off in emerging market currencies since
2009,” the Argentine peso plummeted 15
percent in a single day (January 23rd) and
the “contagion” quickly spread to
other emerging markets, including most prominently
Turkey, South Africa, and Russia.
The ruble's slide picked up speed
at the end of November and
intensified mid-December.
Intended to mollify markets,
Russia's rate hike to 17 percent had
the opposite effect,
accelerating the run on the ruble.
The Swiss National Bank
abruptly ended its longstanding
policy of intervening in the
market to limit the value of the
Swiss franc relative to the
euro. Within hours of the
announcement, the franc shot up
30 percent.
The European Central Bank
(ECB) announced a larger-than-
expected bond-buying program
– an effort to counter deflation and spur growth.
After the ECB announcement, the euro fell to
its lowest value against the dollar since September
2003.
In an unprecedented attempt to head off
inflation and slow economic growth, the
European Central Bank (ECB) lowered
interest rates into negative territory. The move was designed to
push banks to put their capital to work
and stimulate the economy. The ECB
also foreshadowed the QE package that
arrived in Jan. 2015.
Mid-2012 euroLate 2012
Japanese yenFeb. 2013
Venezuela
January 2014 Emerging Markets
Late 2014 Russian ruble
January 2015 Swiss franc
January 2015 euro
August 2015 Brazil
August 2015 Chinese yuan
June 2014 euro
Continuing political upheaval and a deep recession
drove a sell-off of Brazilian currency so significant that
forecasters couldn’t revise
their projections fast enough.
Compounded by the slowdown of China’s economy (China is Brazil’s
largest export market), the real
fell, and kept falling through
September, to 12-year lows.
On August 11, China surprised markets when it
allowed the currency to fall by
nearly 2 percent. The yuan
continued to fall in days after, hitting
a four-year low against the dollar.
As a result, volatility has
increased among many Asia Pacific
currencies as other countries
take action to attempt to
maintain parity against the yuan.
December 2015 Argentina
Argentina’s new President, fresh off
of inauguration, begins to follow-
through on his campaign promise to get the peso to free float— in mid
December, Argentine Finance
Minister Alfonso Prat-Gay lifts the
capital controls limiting the
purchase of dollars. The currency proceeds to
devalue 30%+ in 24 hrs.
5

Latest Research: Corporate Currency Awareness
With Statistics From:
AFP The Association For Financial
Professionals
Wells Fargo
Deloitte
KPMG
FiREapps

2016 Deloitte Global Foreign Exchange Survey
(56%)
Lack the visibility of FX exposures and reliability of forecasts
48% Said they still use manual exposure identification and capture processes
31%
Rely on 3 or more sources to identify exposures
Corporates use manual forecasts
1 in 3Have fully or largely manual processes
Top three sources of ineffectiveness in managing FX risk
0
25
50
75
100
Inaccurate Forecasts
Poor Communication
Non-transparent Exposures
68%
47% 40%
1 in 2 2 in 5
(36%)(62%)
The 2016 Deloitte Global Foreign Exchange Survey was designed to provide:
“Insight into the challenges corporates encounter when managing currency risk and possible causes (and solutions) for these challenges, as well as FX risk management structures, strategies and processes adopted by corporates across the globe. “
Survey of: 133 corporations around the globe, representing a wide array of sizes, geographies & industries.
2015 Deloitte Global Corporate Treasury Survey
Treasurers noted their biggest challenges are the ability to repatriate cash and to manage foreign exchange (FX) volatility
Companies remain challenged by visibility into global operations, including cash and financial exposures.
Cited insufficient technology infrastructure to support their department
1 in 2 2 in 5 2 in 5
More than 100 top corporations from around the globe—representing a wide array of global scales, industrial footprints, and geographic headquarters—participated in Deloitte’s biannual survey. We have pulled out some of their key findings:
4 "2015 Global Corporate Treasury Survey | Deloitte US | Enterprise Risk Services." Deloitte United States. June 2015.
5"2016 Global Foreign Exchange Survey | Deloitte UK." Deloitte United Kingdom. 2016.
5
4
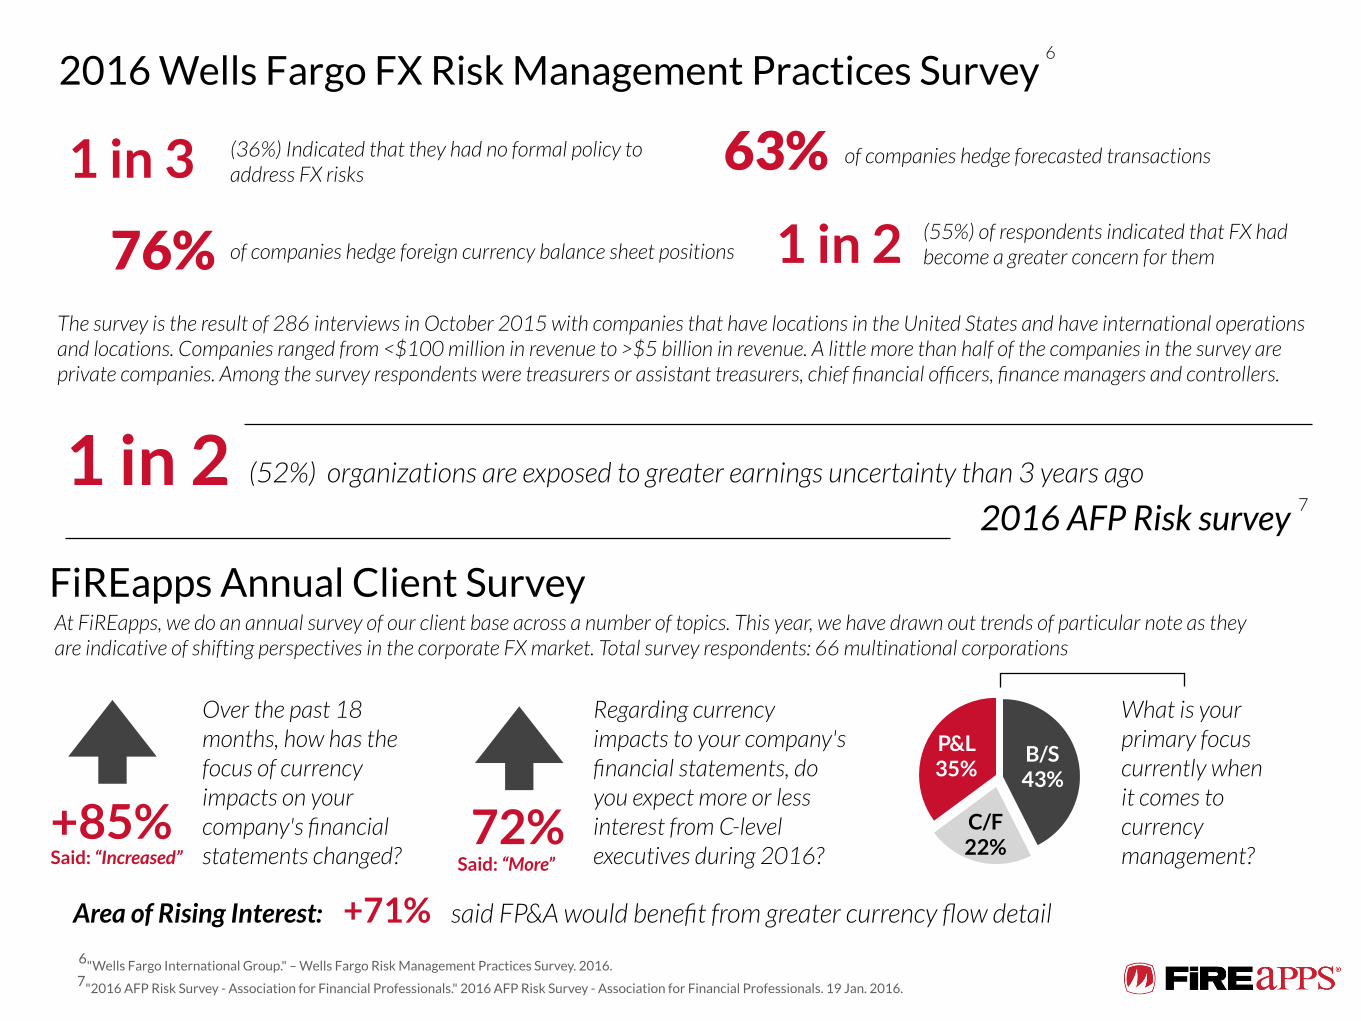
FiREapps Annual Client Survey
Over the past 18 months, how has the focus of currency impacts on your company's financial statements changed?
+85%Said: “Increased”
Regarding currency impacts to your company's financial statements, do you expect more or less interest from C-level executives during 2016?
P&L 35%
C/F 22%
B/S 43%
What is your primary focus currently when it comes to currency management?
+71% said FP&A would benefit from greater currency flow detail
2016 Wells Fargo FX Risk Management Practices Survey
(36%) Indicated that they had no formal policy to address FX risks
(55%) of respondents indicated that FX had become a greater concern for them 76% of companies hedge foreign currency balance sheet positions
63% of companies hedge forecasted transactions
The survey is the result of 286 interviews in October 2015 with companies that have locations in the United States and have international operations and locations. Companies ranged from <$100 million in revenue to >$5 billion in revenue. A little more than half of the companies in the survey are private companies. Among the survey respondents were treasurers or assistant treasurers, chief financial officers, finance managers and controllers.
(52%) organizations are exposed to greater earnings uncertainty than 3 years ago
2016 AFP Risk survey1 in 2
72%Said: “More”
Area of Rising Interest:
At FiREapps, we do an annual survey of our client base across a number of topics. This year, we have drawn out trends of particular note as they are indicative of shifting perspectives in the corporate FX market. Total survey respondents: 66 multinational corporations
1 in 3
1 in 2
6
6"Wells Fargo International Group." – Wells Fargo Risk Management Practices Survey. 2016. 7"2016 AFP Risk Survey - Association for Financial Professionals." 2016 AFP Risk Survey - Association for Financial Professionals. 19 Jan. 2016.
7

Contribution 1: Centralized hedging
In the event of a decentralized currency management approach, risk exposures are hedged by national subsidiaries via their local banks. In that case, hedges frequently are used that have an offsetting effect from a group perspective. (For example, subsidiary 1 buys US dollars three months forward against pound sterling and subsidiary 2 sells US dollars for euros at the same terms.) Centralization of currency exposure at central treasury usually reduces the exposure to be hedged and avoids offsetting hedging transactions, whereby it should be kept in mind that there is risk of exposure to the group’s reporting currency, the euro.
If it is assumed that the currency exposures to be hedged are reduced by 20 per cent for each currency, hedging cost is reduced by about EUR 10,000 with an average bid/ask spread of 0.0001. There is further potential, particularly for exposures in currency areas with less liquidity.
Contribution 2: Reducing processing cost
Centralizing currency management means that processing cost can be reduced. As this cost usually consists of personnel expenses in treasury, central implementation of currency management significantly increases efficiency, as illustrated by the following sample calculation:
At foreign subsidiaries, local hedging transactions are processed by a total of 15 full-time employees (local treasury staff, traders and handling staff) at an average personnel expenditure of EUR 50,000 annually per employee. By centralizing these activities at the central group treasury, staff required for local currency management can be reduced by about 20 per cent. If it is assumed that, as a consequence, the number of staff required for currency management at group level will also decrease accordingly, the optimization of structures will result in a positive contribution of EUR 150,000.
Contribution 3: Determination of currency exposure
The contribution to profit from currency management can take on very different dimensions very quickly. Let us assume the company miscalculates exposure — experience has shown that this happens very frequently! The reasons for inaccuracies in determining currency exposure are multifold and range from unknown covenants in supply or procurement contracts, currency exposure from the procurement of raw materials, to simple errors and inaccuracies or a lack of due diligence when entering data locally.
Let us assume, therefore, that the euro/US dollar exposure is in fact EUR 25 million or 10 percent higher than has been officially reported. (This seems perfectly realistic based on experience.) As this exposure (US dollar long) is unknown, it is not hedged. Let us now assume that the US dollar is subject to devaluation over the course of the year from 1.32 to 1.38 against the euro. Fluctuations in exchange rate of around 5 percent as in this example are perfectly normal, even fluctuations of 10 percent are not unusual, not to mention fluctuations of up to 20 percent for currencies of emerging economies. The resulting foreign exchange loss therefore is around EUR 825,000.
Depending on its origin, this foreign exchange loss is apparent neither in the balance sheet nor in the income statement and therefore is not transparent in any reporting. Believe me, I have seen many such cases, both as treasurer and advisor.
The main objective of a currency management strategy usually is to stabilize currency gains or losses. It is difficult to quantify the resulting contribution to value, as the associated positive effects of control have an impact on a variety of areas (from procurement cost to communication to capital markets). The positive effects of the optimization of currency management are obvious:
8,9”Position Paper Corporate Treasury – out of the comfort zone | KPMG | DE.” Position Paper Corporate Treasury – out of the comfort zone | KPMG | DE. Sept. 2015.
Excerpt From KPMG’s Treasury Positioning Paper9
“
Establishing the ROI for Currency Risk Management…In 2015, KPMG released research outlining the mathematical impact treasury, when smartly operating, can have on overall sales. According to their calculations: the ROI can be as high as 1% (0.68%)8. Additionally, according to KPMG, among treasury’s many functions that return value, currency risk management has one of the highest returns on investment. Below is an excerpt from the larger piece, which details 3 areas of value which result from effectively managing currency risk. The whole piece is undoubtedly worth the entire read. For a link to the original, please see page 13.
”

Learn More + Where to Start Driving Currency Awareness
Additional resources worth reading & an actionable template that should help
you begin to score your organization’s current level of currency awareness.

Take the Next Step: Do you know how currency aware your organization actually is? Use the FX Exposure Management Capability Model below to determine your company’s current capabilities. If you want to move up in the scale, you will have a concrete checklist/goals to improve towards. As a next step: at FiREapps, we help companies walk through these issues and evolve on a daily basis; we would be more than happy to sit down and discuss what you have found. Simply drop us a note at: [email protected]
11
Outcomes Consistent, material, unexplained FX gain/loss
Occasional, material unexplained FX gain/loss
Periodic, immaterial unexplained FX gain/loss
Explainable FX gain/loss within risk tolerance
Controlled FX gain/loss
Each row of checkboxes below corresponds to the category on its left. For each row, select one checkbox that is most applicable.. When completed, look at each column individually. The one with the most items checked will be an indicator of your company’s ability to manage foreign currency exposure. Take special note of the items checked towards the left of the page— these are key opportunities for improvement.
Multicurrency Accounting (MCA)
Systems & Revaluation Processes
▢ Incorrect MCA configuration or no MCA functionality
▢ Incorrect MCA configuration ▢ Some issues with MCA configuration
▢ Minimal issues with MCA configuration
▢ Properly configured and maintained MCA system
▢ Incorrect revaluation configurations and lack of effective controls
▢ Incorrect revaluation configurations and lack of effective controls
▢ Periodic issues with revaluation and configuration process
▢ Minimal issues with revaluation and configuration process
▢ Proper revaluation controls and testing processes
Multicurrency Accounting
Transaction & Processes Controls
▢ Intercompany transactions (I/C) not in balance and not reconciled
▢Intercompany transactions (I/C) not in balance and not reconciled
▢ I/C transactions are in balance and reconciled
▢ I/C transactions are in balance and reconciled
▢I/C transaction balance and effective process in place for settlement
▢ Lack of MC translation controls contributing to embedded FX G/L
▢ Lack of MC transaction controls contributing to embedded FX G/L
▢ Lack of MC transaction controls contributing to embed FX G/L
▢ Basic controls for MC transactions in place
▢Proper controls in place for MC transactions, period testing of controls
Exposure Definition and Analytics
▢ Manual, spreadsheet based ▢ Manual, spreadsheet based ▢ Manual, spreadsheet based ▢ Automated exposure data gathering and analytics
▢ Automated exposure data gathering and analytics
▢ No FX gain/loss analytics and exception management
▢ Limited FX gain/loss analytics, no exception management
▢ Performs FX gain/loss analysis, no exception management
▢ Performs FX gain/loss analysis, no exception management
▢ Monthly FX gain/loss analysis with effective exception management
▢ Unable to effectively quantify FX exposures
▢ Limited ability to effectively quantify FX exposures
▢ Limited ability to effectively quantify FX exposures
▢ Automated exposure calculation ▢ Automated expsoure calculation
▢ Lack of visibility into exposure root causes
▢ Limited visibility into exposure root causes
▢ Limited visibility into exposure root causes
▢ In-depth visibility and understanding of exposures
▢ In-depth visibility and understanding of exposures
Exposure Management Decision
Making
▢ Decentralized and uncoordinated ▢ Decentralized and uncoordinated ▢ Decentralized and uncoordinated ▢ Centralized decision making and transaction execution
▢ Centralized decision making and transaction execution
▢ Process latency resulting in increased market risk
▢ Process latency resulting in increased market risk
▢ Process latency resulting in increased market risk
▢ Minimal process latency ▢ Minimal process latency
▢Frequent hedging mistakes resulting in under-hedged/ over-hedged exposures
▢Periodic hedging mistakes resulting in under-hedged/ over-hedged exposures
▢Occasional hedging mistakes resulting in under-hedged/ over-hedged exposures
▢ Efficient and cost-effective use of derivatives for hedging
▢ Efficient and cost-effective use of derivatives for hedging
▢ Reactive decision making ▢ Reactive decision making ▢ Reactive decision making ▢ Proactive decision making ▢ Proactive decision making
FX Rate Conversions ▢ No strategy for recording FX transactions
▢ No strategy for recording FX transactions
▢ Increasing awareness of impact of FX rate conventions
▢ Strategy in place for FX rate conventions
▢ Established rate conventions for recording transactions
Risk Management Framework and Policy
▢ No formal policy definition, Treasury working in isolation
▢ Basic FX risk management policy ▢ Comprehensive FX risk management policy
▢ Comprehensive FX risk management policy ▢ Enterprise risk management policy
and risk tolerances
▢ No process benchmarks or metrics ▢ No process benchmarks or metrics ▢ No process benchmarks or metrics ▢ Minimal benchmarks or metrics ▢ Established benchmarks and metrics
▢ No formal role coordination with other departments
▢ Limited coordination with other departments
▢ Limited coordination with other departments
▢ Cross-functional coordination & collaboration
▢ Cross-functional coordination and collaboration
1 2 3 4 5

Additional Currency Market Research
FiREapps Q4 2015 Currency Report
Association for Financial Professionals: Currency surprises impact a corporate in obvious ways, and not-so-obvious ways. When a company’s revenue is regularly eroded by currency surprises, it has less cash available for productive activity. That loss has ripple effects, including credit rating downgrades that raise the firm’s cost of capital and debt covenant breaches that limit its access to liquidity. Both reduce available cash and limit the firm’s ability to deliver maximum profit to shareholders.
For more detail on the deeper-seated impacts of currency surprises, check out the AFP Exchange article: Below the Surface: FX impacts on revenue are just the tip of the iceberg
Savvy corporates are adopting a roundtable approach to currency risk management. Currency has become an issue outside the halls of treasury. Modern currency aware organizations understand that currency impacts many areas of the company, and all of those areas are represented at the company’s currency roundtable. Everyone at the currency roundtable has access to accurate, complete, and timely exposure data and the analytics to understand how those exposures impact their functional area – and, conversely, how decisions they make affect currency exposures and the company’s overall financial performance.
For more detail on the currency roundtable approach, check out the blog post: Currency Impacts Every Function of the Organization – So Who’s at Your Currency Roundtable?
CFO.com : 3 Currency Predictions for 2016 What other surprises lie in wait for us in 2016? We took a look at the year ahead in early January and some predictions have already come to fruition, others have been surprising to even us. No doubt, this year we could easily see more surprises out of the Middle East given the intense geopolitical turmoil there. We will see more surprises out of China, Latin America and Eastern Europe; but the real truth is that no one knows where the impact could come from next.
For more detail out the page at: 3 Currency Predictions for 2016
Wells Fargo 2016 Risk Management Practices Survey
KPMG Position Paper: Corporate Treasury out of the comfort zone
Deloitte 2016 Global FX Survey
AFP 2016 Risk Survey
Additional Articles/Blogs Worth Reading
[We borrowed from some of these when writing this report. See pg. 19 for links]

"2015 Global Corporate Treasury Survey | Deloitte US | Enterprise Risk Services." Deloitte United States. June 2015. http://www2.deloitte.com/us/en/pages/risk/articles/2015-global-corporate-treasury-survey.html
"2016 Global Foreign Exchange Survey | Deloitte UK." Deloitte United Kingdom. 2016. http://www2.deloitte.com/uk/en/pages/risk/articles/2016-global-foreign-exchange-survey.html
"Wells Fargo International Group." – Wells Fargo Risk Management Practices Survey. 2016. https://www.wellsfargo.com/com/focus/risk-management-survey/
"2016 AFP Risk Survey - Association for Financial Professionals." 2016 AFP Risk Survey - Association for Financial Professionals. 19 Jan. 2016. http://www.afponline.org/risksurvey/
"Q4 CURRENCY REPORT:$33.94 BN HEADWIND." FiREapps Q4 Currency Report. 12 Apr. 2016. http://fireapps.com/learn/q4-currency-report.html
“FiREapps Treasury State of the Market Survey.” FiREapps. 8 Mar. 2016.
"Position Paper Treasury 4.0" | KPMG | DE." Position Paper Treasury 4.0 | KPMG | DE. 22 Sept. 2015. https://home.kpmg.com/de/en/home/insights/2015/09/position-paper-treasury-4-0.html
"Position Paper Corporate Treasury – out of the comfort zone | KPMG | DE.” Position Paper Corporate Treasury – out of the comfort zone | KPMG | DE. Sept. 2015. https://assets.kpmg.com/content/dam/kpmg/pdf/2015/09/KPMG-Position-Paper-out-comfort-zone-EN.pdf
References / Sources
FiREapps is the leading provider of Corporate Currency Analytics and management technologies. Established in 2000, FiREapps developed the first solution to automate foreign exchange exposure management for multinational companies. Through a combination of software solutions and expert analysis, FiREapps helps companies to ensure they’re accurately measuring and managing their FX exposures. Numerous companies rely on FiREapps to give them unmatched data insights, help them reduce risk and increase efficiency every day. FiREapps is headquartered in Scottsdale, Ariz., with offices in Portland, London and Frankfurt. For more information, visit www.fireapps.com.
About FiREapps