tracking toxaphene in the north american great lakes basin. 2. a strong episodic long-range...
TRANSCRIPT

Tracking Toxaphene in the NorthAmerican Great Lakes Basin.2. A Strong Episodic Long-RangeTransport EventJ I A N M I N M A , * , †
S R I N I V A S A N V E N K A T E S H , † Y I - F A N L I , †
Z U O H A O C A O , ‡ A N DS R E E R A M A D A G G U P A T Y †
Air Quality Research Branch, Meteorological Service ofCanada, 4905 Dufferin Street, Toronto, Ontario M3H 5T4,Canada, and Meteorological Service of Canada, 867 LakeshoreRoad, Burlington, Ontario L7R 4A6, Canada
In this paper we examine the modeled daily toxapheneair concentrations from September 9 to 13, 2000, duringwhich air concentration levels were 2-3 orders of magnitudehigher than those derived from in situ measurementsaround the Great Lakes during the same year and duringthe 1990s. Meteorological conditions revealed that a typicaldeformation flow system associated with a high-pressure system extending from the east coast of Canadato the southern United States was one of the criticalelements that enabled the transport of toxaphene to theGreat Lakes. Cloud bands seen on satellite imagery and therain band predicted by an atmospheric forecast modelindicate that the system also delivered warm and humidair from the Gulf of Mexico and the southern United Statesto the Great Lakes. This resulted in strong wet depositionof toxaphene to the lakes. Substantial increase in theair concentration of toxaphene over the Great Lakes inthis short period contributed greatly to raising the annualaverage daily air concentration for all of 2000. Theresults suggest that such an episodic event could be amajor pathway for atmospheric transport of toxaphene fromthe southern United States to the Great Lakes.
IntroductionIn the accompanying paper (2) we examined the transportof toxaphene in the year 2000 from source regions in NorthAmerica to the Great Lakes basin. In that study a regional-scale numerical model that included atmospheric transportand soil/air and water/air exchanges (1) was used to assessthe effect of toxaphene residues in U.S. soils on the toxaphenebudget over the Great Lakes basin. The highest monthlyaveraged air concentration over the basin for the year of2000 was found in the month of September (2). Given theusual strong dependence of toxaphene air concentration andsoil/air exchange on temperature (3-5), the abnormally hightoxaphene air concentrations over the Great Lakes inSeptember, a time of year when the temperature in the regionwas already on its way down from the summer values, was
an unexpected result. It was found that the magnitudes ofthe modeled mean monthly toxaphene air concentrations atthe first model level 1.5 m above ground (the model has 12levels in the vertical from the surface to 7000 m) ranged fromseveral tens to several hundreds of picograms per cubic meterover the lakes. These are 2-3 orders of magnitude higherthan those derived from in situ measurements around theGreat Lakes during September of the same year and duringthe 1990s (2, 6). Clearly, the local sources of toxaphene in thenortheast United States (see accompanying paper, 2) withtoxaphene soil residues of 1800 t in 2000 are not high enoughto yield such high air concentrations. However, with tox-aphene residues in soil of 22 700 t in the southeast UnitedStates, an order of magnitude higher than those in thenortheast, long-range and trans-boundary atmospherictransport on a regional scale to the Great Lakes basin is apossibility (2).
A key finding reported in the accompanying paper (2)was that the impact of the largest toxaphene reservoir in thesoutheast United States on the Great Lakes ecosystem wasmore significant during spring and autumn than duringsummer, due primarily to interseasonal variations in theatmospheric circulation systems. This indicated that thecontributions of toxaphene residue in soil in the differentregions of the United States to its concentration levels in theatmosphere and deposition amount to the Great Lakes wereseason-dependent and underwent a pronounced shift,particularly in the winter/spring and summer/autumntransition periods. The modeling results demonstrated thatthe impact of the principal toxaphene sources in the southeastUnited States on the deposition of this insecticide to theGreat Lakes was strongest in the autumn season (2), theseason during which the main track of the jet stream andseveral common storm tracks originating in the Gulf of Mexicoand the southern United States find their way across theUnited States northward up to the Great Lakes basin. Autumnis also one of the stormiest periods of the year in the region,leading to strong air mass exchange between low and highlatitudes. In the winter season, although weather systemsare very active and the large-scale atmospheric circulationfavors long-range transport, lower air temperatures reducethe soil/air exchange and surface/air partitioning of tox-aphene and other semivolatile organic compounds, therebylowering their levels in the atmosphere and reducing theirdeposition to the Great Lakes.
In addition to favorable meteorological conditions, theoccurrence of an extended episodic long-range transport ofa pollutant also depends on the availability of the pollutantin the source region (7, 8), atmospheric circulation withminimal dispersion, and limited chemical destruction (9)during transport. In this study toxaphene is assumed to bere-emitted to the air continuously from the contaminatedsoils in the United States, with the emission rate beingdetermined by the compound’s chemical-physical proper-ties at prevailing environmental conditions. Also, with arelatively long half-life in the air (6), toxaphene is not subjectto much chemical or photochemical degradation in theatmosphere during transport (10). Further, because theaverage atmospheric motion is zonal (west to east), a large-scale meridional (south to north) air mass exchange betweenthe low- and high-latitude regions is most likely to be episodicand on a time scale of a few days to a week. This suggeststhat toxaphene re-emissions from the major sources in thesoutheast United States are most likely to impact the GreatLakes ecosystem at such times of episodic meridional long-range transport.
* Corresponding author phone: (416) 739-4857; fax: (416) 739-4288; e-mail: [email protected].
† Air Quality Research Branch, Meteorological Service of Canada,Toronto.
‡ Meteorological Service of Canada, Burlington.
Environ. Sci. Technol. 2005, 39, 8132-8141
8132 9 ENVIRONMENTAL SCIENCE & TECHNOLOGY / VOL. 39, NO. 21, 2005 10.1021/es050946e CCC: $30.25 Published 2005 by the Am. Chem. Soc.Published on Web 09/30/2005

Episodic transport of persistent organic pollutants to theGreat Lakes has been noted previously (11-13). Glassmeyeret al. (13) have reported observing an abnormally hightoxaphene air concentration on September 9, 1996, on thecoast of Lake Superior. There were also other high toxapheneair concentration events documented in field studies (14-16). Such episodic events occur on a relatively large spatialscale (over 1000 km) but their temporal scales are relativelyshort (less than a week). However, such events are seldomcaptured by observations because of the lack of sufficientspatial and temporal resolutions in the measurements. As aresult, the details of the occurrence of episodic transport ofpesticides from North American sources to the Great Lakesbasin are still poorly understood. In this paper, we report ona September 2000 event of strong atmospheric transport oftoxaphene from its major source region in the southeastUnited States to the Great Lakes basin. The type of atmo-spheric motion and weather systems (e.g., fronts) associatedwith such an event are quite common in the North Americancontinent and also in other subtropical and mid-latitude areasaround the world (17). The regional-scale model discussedin ref 1, which includes atmospheric transport and soil/airand water/air exchange of pesticides, is used to perform themodel simulations. The detailed modeling strategies andnumerical experiments have been described in the ac-companying paper (2). To identify quantitatively the con-tribution of different sources in the United States to thetoxaphene budget over the Great Lakes, six different sourceloading scenarios were examined. The analysis in this paperis based on the modeling results from model scenario 1 thatincludes all toxaphene sources in the United States (2).
The September 2000 EventThe modeled daily air concentrations during the 5-day periodof September 9-13, 2000, indicate a dramatic increase oftoxaphene air concentrations occurring over the entire GreatLakes basin. Over the five-day period, the calculated maxi-mum daily values at the model grids near the center of eachof the Great Lakes were 463 pg m-3 over Lake Ontario, 3190pg m-3 over Lake Erie, 716 pg m-3 over Lake Huron, 3360 pgm-3 over Lake Michigan, and 346 pg m-3 over Lake Superior.In the subsequent discussions, we will refer to this period ofanomalous increase in the air concentrations of toxaphene
over the Great Lakes as the September event. Modeled dailytoxaphene air concentrations at 1.5 m height at these gridpoints from September 7 to 14, 2000, are illustrated in Figure1 (note that the event started on September 9, but in thefigure we also present the air concentrations on September7 and 8 as the base values). The air concentration valuesduring the September event are considerably higher thanthe 0.5-54 pg m-3 range measured in the rest of 2000 andcited in ref 2 (3.6 pg m-3 measured on September 21, sampledonce per month) and also higher than the 1-100 pg m-3
range measured over the Great Lakes basin throughout the1990s as noted in ref 6. This sharply increased air concentra-tion was also reflected in the monthly averaged air concen-trations for September as shown in Figure 3 of the accom-panying paper (2). Accordingly, the maximum monthlyaccumulated dry and wet depositions to the lakes occurringin September 2000 (2) were also associated with a sharpincrease in daily depositions during the same period. Forexample, the maximum daily wet deposition to Lakes Erieand Ontario during the September event exceeds 2 kg (onSeptember 12); and the maximum daily dry deposition toLakes Erie and Michigan was 1 and 2 kg on September 9 and11, respectively. These daily deposition values are even greaterthan monthly depositions to the lakes in the rest of the monthsin 2000. Table 1 lists the maximum of all daily air concentra-tions (picograms per cubic meter) at 1.5 m height averaged
FIGURE 1. Modeled daily air concentration (picograms per cubic meter) at grid point near the center of each lake at 1.5 m height fromSeptember 7 to 14, 2000.
TABLE 1. Standard Deviations of Daily Air Concentrations,Daily Dry Depositions, and Daily Wet Depositions Averagedover Each Lake throughout 2000a
concn(pg m-3)
dry deposition(kg day-1)
wet deposition(kg day-1)
Lakes σc Cmax σFd Fd,max σFw Fw,max
Ontario 65.0 954 0.009 0.126 0.128 2.450Erie 210.3 3721 0.054 0.991 0.144 2.287Huron 55.2 849 0.019 0.271 0.093 1.760Michigan 215.4 3771 0.121 2.094 0.013 0.206Superior 23.9 417 0.029 0.546 0.004 0.005
a Maximum daily air concentrations (Cmax) at 1.5 m height, maximumdaily dry deposition flux (Fd,max), and maximum wet deposition flux(Fw,max) averaged over each lake for the period of the September eventare also shown.
VOL. 39, NO. 21, 2005 / ENVIRONMENTAL SCIENCE & TECHNOLOGY 9 8133

over each lake for the period of the September event and thestandard deviation (picograms per cubic meter) of daily airconcentrations averaged over each lake throughout 2000.Table 1 also shows the maximum of all daily dry and wetdepositions (kilograms per day) to the lakes during the sameperiod and the standard deviations (kilograms per day) oftheir respective daily depositions to the lakes throughout2000. As seen, the maximum daily values of air concentrationand depositions over each lake (except for wet deposition toLake Superior) exceed, by a factor of 10, the standard deviationof their respective daily air concentration and depositions in2000. It must be noted that the large values of the annualstandard deviations are actually due primarily to the ex-ceptionally high air concentrations observed during the
September event. For example, if we excluded the daily airconcentration for September 9-13, the standard deviationfor Lake Erie would become 29 pg m-3
, as compared to210 pg m-3 with those days included (Table 1). This suggeststhat this sporadic event, though occurring only for a fewdays, has a major contribution to the annual statistics ofmodeled daily toxaphene air concentrations over the GreatLakes basin.
This anomalous increase in air concentrations of tox-aphene over the Great Lakes basin and depositions to thelakes during the September event is clearly an indication ofoccurrence of a strong long-range atmospheric transport fromits major sources in the southern United States under afavorable atmospheric circulation pattern. Figure 2 illustrates
FIGURE 2. Modeled daily air concentration (picograms per cubic meter) overlaid by daily averaged vector winds at 1200 m height abovethe surface (the eighth model level) for the days of September 5-12, 2000. The bar at left low corner of each figure (knots) indicatesmagnitude of wind vector.
8134 9 ENVIRONMENTAL SCIENCE & TECHNOLOGY / VOL. 39, NO. 21, 2005
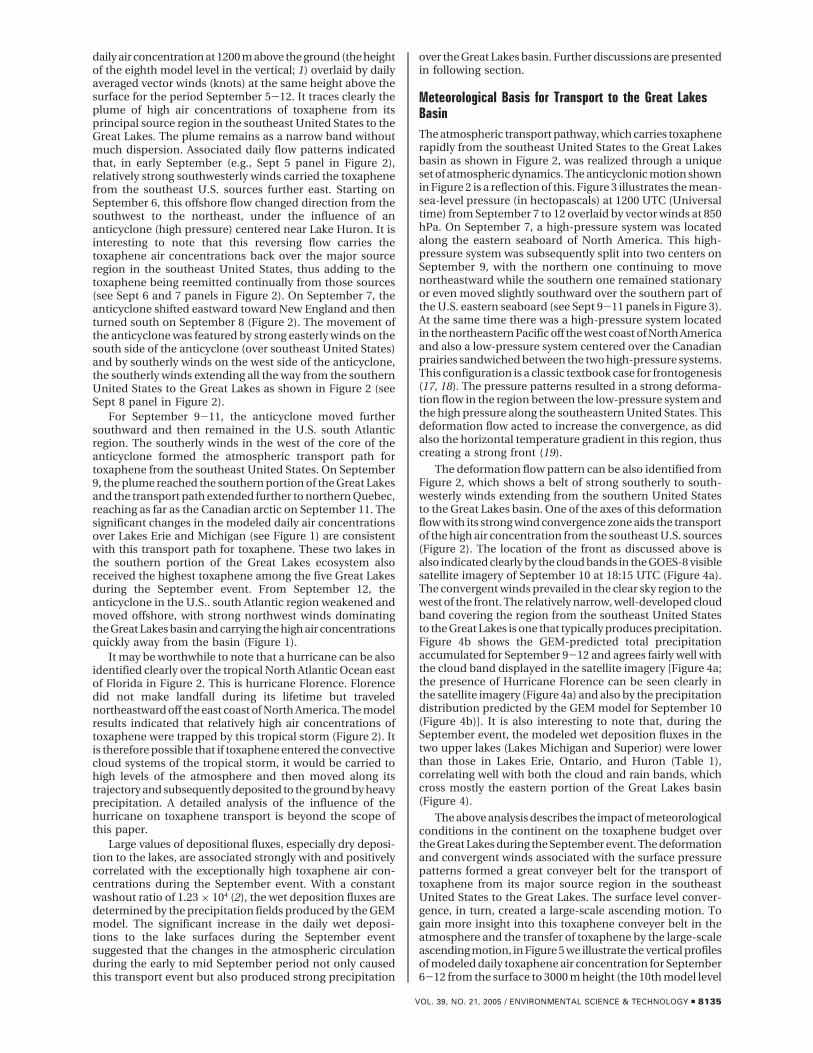
daily air concentration at 1200 m above the ground (the heightof the eighth model level in the vertical; 1) overlaid by dailyaveraged vector winds (knots) at the same height above thesurface for the period September 5-12. It traces clearly theplume of high air concentrations of toxaphene from itsprincipal source region in the southeast United States to theGreat Lakes. The plume remains as a narrow band withoutmuch dispersion. Associated daily flow patterns indicatedthat, in early September (e.g., Sept 5 panel in Figure 2),relatively strong southwesterly winds carried the toxaphenefrom the southeast U.S. sources further east. Starting onSeptember 6, this offshore flow changed direction from thesouthwest to the northeast, under the influence of ananticyclone (high pressure) centered near Lake Huron. It isinteresting to note that this reversing flow carries thetoxaphene air concentrations back over the major sourceregion in the southeast United States, thus adding to thetoxaphene being reemitted continually from those sources(see Sept 6 and 7 panels in Figure 2). On September 7, theanticyclone shifted eastward toward New England and thenturned south on September 8 (Figure 2). The movement ofthe anticyclone was featured by strong easterly winds on thesouth side of the anticyclone (over southeast United States)and by southerly winds on the west side of the anticyclone,the southerly winds extending all the way from the southernUnited States to the Great Lakes as shown in Figure 2 (seeSept 8 panel in Figure 2).
For September 9-11, the anticyclone moved furthersouthward and then remained in the U.S. south Atlanticregion. The southerly winds in the west of the core of theanticyclone formed the atmospheric transport path fortoxaphene from the southeast United States. On September9, the plume reached the southern portion of the Great Lakesand the transport path extended further to northern Quebec,reaching as far as the Canadian arctic on September 11. Thesignificant changes in the modeled daily air concentrationsover Lakes Erie and Michigan (see Figure 1) are consistentwith this transport path for toxaphene. These two lakes inthe southern portion of the Great Lakes ecosystem alsoreceived the highest toxaphene among the five Great Lakesduring the September event. From September 12, theanticyclone in the U.S.. south Atlantic region weakened andmoved offshore, with strong northwest winds dominatingthe Great Lakes basin and carrying the high air concentrationsquickly away from the basin (Figure 1).
It may be worthwhile to note that a hurricane can be alsoidentified clearly over the tropical North Atlantic Ocean eastof Florida in Figure 2. This is hurricane Florence. Florencedid not make landfall during its lifetime but travelednortheastward off the east coast of North America. The modelresults indicated that relatively high air concentrations oftoxaphene were trapped by this tropical storm (Figure 2). Itis therefore possible that if toxaphene entered the convectivecloud systems of the tropical storm, it would be carried tohigh levels of the atmosphere and then moved along itstrajectory and subsequently deposited to the ground by heavyprecipitation. A detailed analysis of the influence of thehurricane on toxaphene transport is beyond the scope ofthis paper.
Large values of depositional fluxes, especially dry deposi-tion to the lakes, are associated strongly with and positivelycorrelated with the exceptionally high toxaphene air con-centrations during the September event. With a constantwashout ratio of 1.23 × 10⁴ (2), the wet deposition fluxes aredetermined by the precipitation fields produced by the GEMmodel. The significant increase in the daily wet deposi-tions to the lake surfaces during the September eventsuggested that the changes in the atmospheric circulationduring the early to mid September period not only causedthis transport event but also produced strong precipitation
over the Great Lakes basin. Further discussions are presentedin following section.
Meteorological Basis for Transport to the Great LakesBasinThe atmospheric transport pathway, which carries toxaphenerapidly from the southeast United States to the Great Lakesbasin as shown in Figure 2, was realized through a uniqueset of atmospheric dynamics. The anticyclonic motion shownin Figure 2 is a reflection of this. Figure 3 illustrates the mean-sea-level pressure (in hectopascals) at 1200 UTC (Universaltime) from September 7 to 12 overlaid by vector winds at 850hPa. On September 7, a high-pressure system was locatedalong the eastern seaboard of North America. This high-pressure system was subsequently split into two centers onSeptember 9, with the northern one continuing to movenortheastward while the southern one remained stationaryor even moved slightly southward over the southern part ofthe U.S. eastern seaboard (see Sept 9-11 panels in Figure 3).At the same time there was a high-pressure system locatedin the northeastern Pacific off the west coast of North Americaand also a low-pressure system centered over the Canadianprairies sandwiched between the two high-pressure systems.This configuration is a classic textbook case for frontogenesis(17, 18). The pressure patterns resulted in a strong deforma-tion flow in the region between the low-pressure system andthe high pressure along the southeastern United States. Thisdeformation flow acted to increase the convergence, as didalso the horizontal temperature gradient in this region, thuscreating a strong front (19).
The deformation flow pattern can be also identified fromFigure 2, which shows a belt of strong southerly to south-westerly winds extending from the southern United Statesto the Great Lakes basin. One of the axes of this deformationflow with its strong wind convergence zone aids the transportof the high air concentration from the southeast U.S. sources(Figure 2). The location of the front as discussed above isalso indicated clearly by the cloud bands in the GOES-8 visiblesatellite imagery of September 10 at 18:15 UTC (Figure 4a).The convergent winds prevailed in the clear sky region to thewest of the front. The relatively narrow, well-developed cloudband covering the region from the southeast United Statesto the Great Lakes is one that typically produces precipitation.Figure 4b shows the GEM-predicted total precipitationaccumulated for September 9-12 and agrees fairly well withthe cloud band displayed in the satellite imagery [Figure 4a;the presence of Hurricane Florence can be seen clearly inthe satellite imagery (Figure 4a) and also by the precipitationdistribution predicted by the GEM model for September 10(Figure 4b)]. It is also interesting to note that, during theSeptember event, the modeled wet deposition fluxes in thetwo upper lakes (Lakes Michigan and Superior) were lowerthan those in Lakes Erie, Ontario, and Huron (Table 1),correlating well with both the cloud and rain bands, whichcross mostly the eastern portion of the Great Lakes basin(Figure 4).
The above analysis describes the impact of meteorologicalconditions in the continent on the toxaphene budget overthe Great Lakes during the September event. The deformationand convergent winds associated with the surface pressurepatterns formed a great conveyer belt for the transport oftoxaphene from its major source region in the southeastUnited States to the Great Lakes. The surface level conver-gence, in turn, created a large-scale ascending motion. Togain more insight into this toxaphene conveyer belt in theatmosphere and the transfer of toxaphene by the large-scaleascending motion, in Figure 5 we illustrate the vertical profilesof modeled daily toxaphene air concentration for September6-12 from the surface to 3000 m height (the 10th model level
VOL. 39, NO. 21, 2005 / ENVIRONMENTAL SCIENCE & TECHNOLOGY 9 8135

in the vertical; 1). These vertical profiles are along the blueline in Figure 4b, a line passing through grid point 150 (seeFigure 2 of the accompanying paper). The value at a givenpoint along this line is the average of the values betweenvertical lines 120 and 180 along the row passing through thatpoint. That is, the vertical profile (along the blue line in Figure4b) represents the average of the values along the beltbounded by the solid black lines in Figure 4b, a belt thatincludes the region from the southeast U.S. sources to theGreat Lakes basin. Although the source of toxaphene wasground-based (from contaminated agricultural soils), model
simulations showed the presence of high air concentrationsof this insecticide at relatively high levels of the atmospherethroughout the September event, as seen in Figure 5. Thisis due primarily to the strong updrafts that followed thereverse flow (due to easterly winds), which brought thetoxaphene that was already offshore back over the sourceregion, thus enhancing the toxaphene air concentrations.The daily changes in the concentration profiles in the verticalfurther confirmed northward transport of the toxaphene inair from its principal sources in the southern United Statesduring the September event. This transport occurred most
FIGURE 3. Mean-sea-level pressure (hectopascals) at 1200 UTC from September 7 to 12 overlaid by winds (denoted by arrows) at 850 hPa.Wind speed scale is in knots. Note that the domain is different from the model domain. Source: http://weatheroffice.ec.gc.ca/data.
8136 9 ENVIRONMENTAL SCIENCE & TECHNOLOGY / VOL. 39, NO. 21, 2005

effectively at the higher levels in the atmosphere rather thannear the surface, where strong surface friction and turbulencequickly dissipate any well-organized large-scale flow andweaken any transport of the pesticide.
In addition, this weather system creates a highwaythat transports warm and humid air from the southernUnited States and the Gulf of Mexico northward up toHudson Bay. This can be seen clearly from the spatialpattern of the deformation flow (Figure 2) and also fromthe narrow cloud and rain bands (Figure 4). In otherwords, the warm and humid air originating from thelower latitudes combined with the large-scale conver-gence would become a primary source for the precipita-tion, which in turn determined the temporal and spatialdistribution of the toxaphene wet deposition fluxes to theGreat Lakes (Table 1).
Transport into MexicoIn the course of this study it was also seen (Figure 2) thatthere was significant transport of toxaphene from the majorU.S. sources toward Mexico (as no toxaphene emissionsinventory from Mexico was available, the model simulationsdid not include any emissions of toxaphene from Mexicansources). At the model grid point (54, 18) [see Figure 1a ofthe accompanying paper (2) for location] representing centralMexico, we found that the modeled toxaphene air concen-tration at 1.5 m height increased from 36 pg m-3 on September6 to 720 pg m-3 on September 10 and then to 8824 pg m-3
on September 12. The evolution of the winds and sea-levelpressure fields illustrated in Figures 2 and 3 suggests that thestrong easterly winds in the southeast United States associ-ated with southward movement of the anticyclone off the
FIGURE 4. (a) GOES-8 visible satellite image on September 10, 2000, at 18:15 UTC. The image was made available through NOAA Satelliteand Information at www.ncdc.noaa.gov/oc/ncdc.html. (b) Accumulated GEM predicted daily precipitation (millimeters) for September9-12, 2000. Solid black and blue lines indicate cross-section and central line for vertical profiles of modeled daily air concentration asillustrated in Figure 5.
VOL. 39, NO. 21, 2005 / ENVIRONMENTAL SCIENCE & TECHNOLOGY 9 8137

eastern seaboard would deliver toxaphene air concentrationsfrom the southeast United States to Mexico before September8. Thereafter, the typical deformation flow, one componentof which has winds directed toward the Great Lakes whilethe other pushes the toxaphene southwestward (see Sept 11panel in Figure 2), played an important role in the continuedtransport of toxaphene to Mexico.
An Extended Memory of the September Event in SoilCompared with the atmosphere, soil is a slowly varyingmedium. In our model, toxaphene enters the soil primarilyvia dry and wet depositions. It is then redistributed betweenthe gaseous, dissolved, and adsorbed phases (1, 4) withinthe soil. The much longer half-life of toxaphene in soil thanin air implies that once the increased toxaphene air con-centration leads to increased deposition, it results inincreasing concentrations of this chemical in the soil, whichthen persist for a longer period than in the atmosphere. We
would then expect that, although the episodic high airconcentrations over the Great Lakes during the Septemberevent were observed for only a few days as shown in Figure1, its impact on the environmental fate of toxaphene in theecosystem is likely to persist for many days after the event.To gain insight into this extended memory of the Septemberevent in the soil, Figure 6 shows the modeled daily soilconcentrations (micrograms per kilogram) at two selectedmodel grid points in the Great Lakes basin. On the basis ofthe initial soil residue distribution as shown in Figure 1b ofthe accompanying paper (2), the model grid in southernMichigan [grid (155, 100), Figure 6a] can be regarded as aweak (local) source grid, and the other in western Ontarioin Canada, as a receptor grid (167, 100) (Figure 6a). Temporalvariation of soil concentration within the three soil layers ofthe model are examined for the source grid (Figure 6b) andfor the receptor grid (Figure 6c). At the source grid, the soilconcentrations (Figure 6b) in the deep “reservoir” layer (1-10 cm below the surface) defined in refs 2 and 4 decline
FIGURE 5. Meridional cross section (along the blue line in Figure 4b) of vertical profiles of modeled daily air concentration (picogramsper cubic meter) from the surface to 3000 m height for September 6-12, 2000. The values along the blue line are zonally averaged valueswithin the solid black lines in Figure 4b (grids 120-180 along x-axis). The location (abscissa) indicates regions across the central lineof this belt (along grid 150, the central grid line between 120 and 180, as shown by the solid blue line in Figure 4b). These are GM, Gulfof Mexico; GE, Georgia; TE, Tennessee; KE, Kentucky; IN, Indiana; MI, Michigan; SU, Lake Superior; NO, northern Ontario; and HB, HudsonBay.
8138 9 ENVIRONMENTAL SCIENCE & TECHNOLOGY / VOL. 39, NO. 21, 2005

monotonically over the course of the year, due largely todegradation. In the relatively shallow “buffer” soil layer (0.1-1cm), the temporal trend of soil concentrations is mostlyidentical to that in the “reservoir layer” (toxaphene wasassumed to be well-mixed initially in the soil at the sourcegrids) but increases substantially after September 10, indi-cating the strong soil/air exchange resulting from the rapid
increase in air concentration and subsequent deposition.Because of the quick response of the top (exchange) soillayer (0-0.1 cm) to changes in air concentration, the greatestincrease in the soil concentration occurred in this layer. Theincrease of the soil concentrations of toxaphene persists fortwo months, well into mid-November, as shown by the bufferlayer soil concentrations in Figure 6b.
FIGURE 6. (a) Model grids in the Great Lakes basin; two grids indicating a weak source grid (155, 100) and a receptor grid (167, 100) aremarked. (b) Modeled daily soil concentrations of toxaphene (grams per kilogram) (b) at a weak source grid (155, 100) and (c) at a receptorgrid (167, 100) in the Great Lakes basin in 2000.
VOL. 39, NO. 21, 2005 / ENVIRONMENTAL SCIENCE & TECHNOLOGY 9 8139

While the concentrations of toxaphene in the soil exchangelayer (the top layer) varies through the summer months (Juneto August) at the selected source (Figure 6b) and receptor(Figure 6c) grids in the Great Lakes basin, the concentrationchanges are most pronounced during the September event(Figure 6b,c). Compared to the early summer (June), the soilconcentrations in the exchange layer during the period ofthe September event increased by a factor of 5 at the weaksource grid and by a factor of almost 10 at the receptor grid.The sharply increased concentrations in the soil exchangelayer were then reflected in the buffer layer via leaching anddiffusion. Clearly, the chemical exchange between theexchange and buffer layers in the soil is much slower thanthat between the air and the exchange layer of the soil. Thesharp increase in the concentration levels in the exchangelayer in fact leads to a reversal of the decreasing trend in thebuffer layer at the weak source grid after September 9 (Figure6b). At the receptor grid, the concentrations in the bufferlayer are enhanced. Given these increases in the buffer layerconcentrations, the impact on the Great Lakes ecosystemcontinues long after toxaphene in the atmosphere was clearedaway from the Great Lakes basin by strong northwest windsafter September 12. Also, given the fact that by Septemberthe air temperatures in the Great Lakes basin were alreadyon their way down, emissions may be subject to globaldistillation/cold condensation effects (20), thus furtherprolonging the period for which the Great Lakes basinecosystem may be impacted. It is very possible that theenhanced toxaphene soil residues may re-volatilize into theatmosphere during the spring/summer months the followingyear when the air temperatures are once again on theupswing.
It should be pointed out that both field measurementsand modeling studies (21-23) have revealed that vegetation(forest, grass, etc.) canopies may play an important role inthe fate of organochlorine pesticides. It has been reported(21, 22) that forests tend to increase net atmosphericdeposition, decrease air concentration, and speed up chemi-cal transfer between air and soil. Toxaphene is a semivolatilecompound that is likely affected by atmosphere-vegetationexchange processes (23). Such processes may includedegradation loss, foliar uptake though dry particle depositionand gaseous uptake in canopies, absorption by vegetation,and plant/air partition. In the coupled modeling system (1)employed in this study, the effect of plant canopies onturbulent exchange of air concentrations is introducedthrough the surface roughness lengths for momentum andheat transfer near an underlying surface, which are definedon the basis of different surface properties (24). The soil/airexchange module considers explicitly the effect of plantcanopies on dry particle deposition (1, 24). However, otherpotential air/vegetation exchange processes (e.g., gaseousdry deposition) were neglected because of significant un-certainties that still exist in the parametrization of theseprocesses. Although this could potentially result in anoverestimate of atmospheric concentrations and an under-estimate of soil concentrations (23), it is unlikely to changethe direction of the exchange flux between the air and soiland hence the conclusions from this study.
The numerical modeling results presented in this studyprovide evidence of a strong episodic long-range and trans-boundary transport of toxaphene from major sources in therelatively low-latitude regions of the southern United Statesto the mid- and high-latitude regions in the Great Lakes basinand further north. It is worthwhile to point out that, to identifyand study episodic long-range transport events with a timescale of several days to a week, daily meteorological condi-tions must be taken into account in any organochlorinepesticides model. Given that the mean atmospheric flowsare essentially zonal (east-west), meridional atmospheric
motion that determines south-north exchange of air massand pollutants is in reality a perturbation with a time scaleof less than a week over the mean atmospheric circulation.Such a perturbation is easily filtered out by monthly andannually averaged atmospheric circulations. The outcomesof the study could be beneficially applied to identify potentialsources and pathways of some of the other toxic compoundsdetected in the Great Lakes ecosystem. It is logical to expectthat, for those organochlorine pesticides that were used orare being used heavily in the southern United States (4, 14-16, 22), their transport to the Great Lakes basin is likely tobe associated with similar episodic transport events. Giventheir relative intensity, such episodic events can have a largeimpact on the annual budget of toxic compounds over theGreat Lakes ecosystem. Thus the episodic long-range trans-port process can be regarded as a major pathway forcompounds in the Great Lakes basin. Considering that strongepisodic transport of organochlorine pesticides may notreadily be detected by existing in situ measurement systems,modeling may be a viable approach for the investigations ofepisodic transport of organochlorine pesticides into otherecologically sensitive environments such as the NorthAmerican arctic.
AcknowledgmentsThis study is partially funded by Environment Canada andthe Great Lakes Binational Toxics Strategy.
Literature Cited(1) Ma, J.; Daggupaty, S. M.; Harner, T.; Li, Y. F. Impacts of lindane
usage in the Canadian Prairies on the Great Lakes ecosystem.1. Coupled atmospheric transport model and modeled con-centrations in air and soil. Environ. Sci. Technol. 2003, 37, 3774-3781.
(2) Ma, J.; Venkatesh, S.; Li, Y. F.; Daggupaty, S. M. Trackingtoxaphene in the North American Great Lakes basin. 1. Impactof toxaphene residues in United States soils. Environ. Sci.Technol. 2005, 39, 8123-8131.
(3) Hoff, R. M.; Muir, D. C. G.; Grift, N. P.; Brice, K. A. Measurementof PCCs in air in southern Ontario. Chemosphere 1993, 27, 2057-2062.
(4) Harner, T.; Bidleman, T. F.; Jantunen, L. M. M.; Mackay, D.Soil-air exchange model of persistent pesticides in the UnitedStates cotton belt. Environ. Toxicol. Chem. 2001, 20, 1612-1621.
(5) Jantunen, L. M. M.; Bidleman, T. F.; Harner, T.; Parkhurst, W.J. Toxaphene, chlordane, and other organochlorine pesticidesin Alabama air. Environ. Sci. Technol. 2000, 34, 5097-5105.
(6) MacLeod, M.; Woodfine, D.; Brimacombe, J.; Toose, L.; Mackay,D. A dynamic mass budget for toxaphene in North America.Environ. Toxicol. Chem. 2002, 21, 1628-1637.
(7) Yienger, J. J.; Galanter, M.; Holloway, T. A.; Phadnis, M. J.;Guttikunda, S. K.; Carmichael, G. R.; Moxim, W. J.; Levy, H., II.The episodic nature of air pollution transport from Asia to NorthAmerica. J. Geophys. Res., 2000, 105, 26931-26945.
(8) Jaffe, D. A.; McKendry, I. G.; Anderson, T.; Price, H. Six ‘new’′episodes of trans-Pacific transport of air pollutants. Atmos.Environ. 2003, 37, 391-404.
(9) Holzer, M.; McKendry, I. G.; Jaffe, D. A. Springtime trans-Pacificatmospheric transport from East Asia: A transit-time probabilitydensity function approach. J. Geophys. Res. 2003, 108, Doi:10.1029/2003JD003558.
(10) Voldner, E. C.; Schroeder, W. H. Modelling of atmospherictransport and deposition of toxaphene into the Great Lakesecosystem. Atmos. Environ. 1989, 23, 1949-61.
(11) Willett, K. L.; Ulrich, E. M.; Hites, R. A. Differential toxicity andenvironmental fates of hexachlorocyclohexane isomers. Environ.Sci. Technol. 1998, 32, 2197-2207.
(12) Bidleman, T. F.; Falconer, R. L. Using enantiomers to tracepesticide emissions. Environ. Sci. Technol. 1999, 33, 206A-209A.
(13) Glassmeyer, S. T.; Brice, K. A.; Hites, R. A. Atmosphericconcentration of toxaphene on the coast of Lake Superior. J.Great Lakes Res. 1999, 25, 492-499.
8140 9 ENVIRONMENTAL SCIENCE & TECHNOLOGY / VOL. 39, NO. 21, 2005

(14) James, R. R.; McDonald, J. G.; Symonik, D. M.; Swackhamer, D.L.; Hites, R. A. Volatilization of toxaphene from Lakes Michiganand Superior. Environ. Sci. Technol. 2001, 35, 3653-3660.
(15) James, R.; Hites, R. A. Atmospheric transport of toxaphene fromthe southern United States to the Great Lakes region. Environ.Sci. Technol. 2002, 36, 3474-3481.
(16) Hoh, E.; Hites, R. A. Sources of toxaphene and other organo-chlorine pesticides in North America as determined by airmeasurements and potential source contribution functionanalyses. Environ. Sci. Technol. 2004, 38, 4187-4194.
(17) Riehl, H. Introduction to the Atmosphere;, McGraw-Hill Inc.:New York, 1965.
(18) Holton, J. R. An Introduction to Dynamic Meteorology; AcademicPress: San Diego, CA, 1992.
(19) Charron, M.; Manzini, E. Gravity waves from fronts: param-etrization and middle atmosphere response in a GeneralCirculation Model. Atmos. Sci. 2002, 59, 923-941.
(20) Mackay, D.; Wania, F. Transport of contaminants to the Arctic:partitioning, processes and models. Sci. Total Environ. 1995,160/161, 25-38.
(21) Horstmann, M.; McLachlan, M. S. Atmospheric deposition ofsemivolatile organic compounds to two forest canopies. Atmos.Environ. 1998, 32, 1799-1809.
(22) McLachlan, M. S.; Horstmann, M. Forests as filters of airborneorganic pollutants: A model. Atmos. Environ. 1998, 32, 413-420.
(23) Wania, F.; McLachlan, M. S. Estimating the influence of forestson the overall fate of semivolatile organic compounds using amultimedia fate model. Environ. Sci. Technol. 2001, 35, 582-590.
(24) Ma, J.; Daggupaty, S. M. Effective deposition velocities for gasesand particles over heterogeneous terrain. J. Appl. Meteorol. 2000,39, 1379-1390.
Received for review May 17, 2005. Revised manuscript re-ceived August 11, 2005. Accepted August 19, 2005.
ES050946E
VOL. 39, NO. 21, 2005 / ENVIRONMENTAL SCIENCE & TECHNOLOGY 9 8141