trade and industry chamber fund for · pdf filefund for research into industrial development,...
TRANSCRIPT

TRADE AND INDUSTRY CHAMBER
FUND FOR RESEARCH INTO INDUSTRIAL DEVELOPMENT,
GROWTH AND EQUITY (FRIDGE)
Date of submission
26th February 2010
Final Report Submitted by
Ozone Business Consulting Proprietary Limited
Private Bag 3658, Halfway House, Midrand
Tel: 011 805 6710
O3bc™
A STUDY ON THE IMPACT OF UPSTREAM PRICING PRACTICES IN THE CHEMICAL
SECTOR ON THE DEVELOPMENT OF THE SOUTH AFRICAN CHEMICAL SECTOR
AS A WHOLE

FRIDGE Chemical Sector Upstream Pricing Practices – Final Report
Ozone Business Consulting (Pty) Ltd Page 2
THE IMPACT OF UPSTREAM PRICING PRACTICES IN THE CHEMICAL SECTOR ON THE
DEVELOPMENT OF THE SOUTH AFRICAN CHEMICAL SECTOR AS A WHOLE
This document was prepared by a consortium consisting of:
Ozone Business Consulting (Pty) Ltd.
Le Roux Consulting
Conningarth Economists
PLEASE TAKE NOTE BEFORE READING
Note 1: This document contains sensitive commercial information related to the pricing and
business practises of the products included. For confidentiality purposes the information is
restricted to the FRIDGE CPG members only, and cannot be freely distributed within their
respective constituencies without prior permission.
Note 2: The research process was unsuccessful in achieving significant participation of
downstream industries in providing pricing and financial data. In addition poor participation by
downstream industry resulted in a statistically insignificant number of participants providing at
least 5 years of financials, as required to produce sound or scientific EVC results. In cases where
the small sample size could compromise the conclusions, the conclusions and policy options
relating to price have been qualified accordingly in the report.

FRIDGE Chemical Sector Upstream Pricing Practices – Final Report
Ozone Business Consulting (Pty) Ltd Page 3
Table of Contents
LIST OF ABBREVIATIONS..................................................................................................................................................................................................6
LIST OF FIGURES ...............................................................................................................................................................................................................9
LIST OF TABLES ...............................................................................................................................................................................................................13
EXECUTIVE SUMMARY....................................................................................................................................................................................................14
1. INTRODUCTION......................................................................................................................................................................................................39
1.1. Background to the Study................................................................................................................................................................................39
1.2. Objectives .......................................................................................................................................................................................................40
1.3. Deliverables ....................................................................................................................................................................................................41
1.4. Methodology ...................................................................................................................................................................................................41
1.5. Problems experienced in the Research Process ..........................................................................................................................................43
1.6. Data Sources and Accuracy ..........................................................................................................................................................................45
2. POLYPROPYLENE..................................................................................................................................................................................................49
2.1. Market definition of upstream chemical products..........................................................................................................................................49
2.2. SA Market structure and shares of upstream chemical producers ..............................................................................................................53
2.3. Costs and pricing of upstream chemicals products ......................................................................................................................................57
2.4. Major downstream industries that purchase upstream products..................................................................................................................69
2.5. International competitiveness of South African chemicals pricing ...............................................................................................................73
2.7. Impact of pricing on downstream purchasers - Demand Elasticity ......................................................................................................................87
2.7. Impact of pricing on downstream purchasers – EVC....................................................................................................................................92
2.8. Conclusions – Polypropylene ........................................................................................................................................................................97
3. POLYETHYLENE (HDPE, LDPE, LLDPE)............................................................................................................................................................100
3.1. Market definition of upstream chemical products........................................................................................................................................100
3.2. SA Market structure and shares of upstream chemical producers ............................................................................................................104
3.3. Costs and pricing of upstream chemicals products ....................................................................................................................................111
3.4. Major downstream industries that purchase upstream products................................................................................................................120
3.5. International competitiveness of South African chemicals pricing .............................................................................................................126
3.7. Impact of pricing on downstream purchasers - Demand Elasticity ............................................................................................................147
3.8. Impact of pricing on downstream purchasers – EVC..................................................................................................................................149
3.9. Conclusions – Polyethylene ................................................................................................................................................................................155
4. PVC.........................................................................................................................................................................................................................160
4.1. Market definition of upstream chemical products........................................................................................................................................160
4.2. SA Market structure and shares of upstream chemical producers ............................................................................................................163
4.3. Costs and pricing of upstream chemicals products ....................................................................................................................................167
4.4. Major downstream industries that purchase upstream products................................................................................................................175
4.5. International competitiveness of South African chemicals pricing .............................................................................................................179
4.7. Impact of pricing on downstream purchasers - Demand Elasticity ............................................................................................................190
4.8. Impact of pricing on downstream purchasers – EVC..................................................................................................................................192
4.9. Conclusions – PVC..............................................................................................................................................................................................193
5. FEEDSTOCK / RAW MATERIALS FOR FERTILIZERS (PHOSPHATE ROCK, PHOSPHORIC ACID & AMMONIA) .....................................197
5.1. Market definition of upstream chemical products........................................................................................................................................197
5.2. SA Market structure and shares of upstream chemical producers ............................................................................................................203
5.3. Costs and pricing of upstream chemicals products ....................................................................................................................................209
5.4. Major downstream industries that purchase upstream products................................................................................................................213
5.5. International competitiveness of South African chemicals pricing .............................................................................................................216

FRIDGE Chemical Sector Upstream Pricing Practices – Final Report
Ozone Business Consulting (Pty) Ltd Page 4
5.6. Impact of pricing on downstream purchasers - Demand Elasticity ............................................................................................................232
5.7. Impact of pricing on downstream purchasers – EVC..................................................................................................................................235
5.8. Conclusions – Fertilizers feedstocks ...........................................................................................................................................................243
6. TITANIUM DIOXIDE...............................................................................................................................................................................................245
6.1. Market definition of upstream chemical products........................................................................................................................................245
6.2. SA Market structure and shares of upstream chemical producers ............................................................................................................247
6.3. Costs and pricing of upstream chemicals products ....................................................................................................................................251
6.4. Major downstream industries that purchase upstream products................................................................................................................253
6.5. International competitiveness of South African chemicals pricing .............................................................................................................254
6.6. Impact of pricing on downstream purchasers - Demand Elasticity ............................................................................................................259
6.7. Impact of pricing on downstream purchasers – EVC..................................................................................................................................259
6.8. Conclusions – Titanium dioxide...................................................................................................................................................................264
7. ACRYLIC ACID AND ESTERS..............................................................................................................................................................................266
7.1. Market definition of upstream chemical products........................................................................................................................................266
7.2. SA Market structure and shares of upstream chemical producers ............................................................................................................268
7.3. Costs and pricing of upstream chemicals products ....................................................................................................................................270
7.4. Major downstream industries that purchase upstream products................................................................................................................275
7.5. International competitiveness of South African chemicals pricing .............................................................................................................276
7.6. Impact of pricing on downstream purchasers - Demand Elasticity ............................................................................................................285
7.7. Impact of pricing on downstream purchasers – EVC..................................................................................................................................285
7.8. Conclusions – Acrylic acid and acrylates ....................................................................................................................................................285
8. GLOBAL REALITY TEST.......................................................................................................................................................................................287
8.1. Introduction ..........................................................................................................................................................................................................287
8.2. Reality Test for Polymer Conversion: The Country Comparison of Polymer Consumption ............................................................................288
8.3. Per Capita GDP vs. Per Capita Polymer Usage for all Polymers ......................................................................................................................289
8.4. Per Capita GDP vs. Per Capita Polymer Usage for all Polymers - Data for All Mid size Countries .................................................................292
8.5. Polymer Conversion: Historical Growth in Contribution to GDP .......................................................................................................................294
8.6. South Africa versus Chile – Polymer Conversion...............................................................................................................................................295
8.7. Polystyrene – A fully imported Polymer for SA...................................................................................................................................................295
8.9. Conclusions..........................................................................................................................................................................................................296
9. DRIVERS FOR GROWTH IN THE DOWNSTREAM CHEMICAL SECTOR .............................................................................................................299
9.1. Introduction...................................................................................................................................................................................................299
9.2. Identification of Drivers.................................................................................................................................................................................299
9.3. Weightings of Drivers ...................................................................................................................................................................................300
9.4. South Africa’s Relative Position...................................................................................................................................................................302
9.5. Other important factors ................................................................................................................................................................................305
10. POLICY OPTIONS FOR PRICING PRACTICE...............................................................................................................................................307
10.1. Review and Conclusions of Global comparison and micro-economic outcomes ......................................................................................307
10.2. Description of Identified Policy Options and impact upon upstream and downstream sectors.................................................................323
10.3. Ensuring local availability of polymers.........................................................................................................................................................325
10.4. Ensuring availability of polymer at competitive prices ................................................................................................................................327
10.5. Promotion of exports of industrial and consumer goods ............................................................................................................................328
10.6. Reducing freight logistics costs ...................................................................................................................................................................331
10.7. Increasing innovation capability of polymer converters ..............................................................................................................................331
APPENDIX 1: DEMAND ELASTICITY......................................................................................................................................................................334
APPENDIX 2: ECONOMIC VALUE CREATED (EVC).............................................................................................................................................343

FRIDGE Chemical Sector Upstream Pricing Practices – Final Report
Ozone Business Consulting (Pty) Ltd Page 5
APPENDIX 3: DISCUSSION ON INTERNATIONAL PRICING MECHANISMS - REFERENCE PRICES FOR POLYMERS..............................358
APPENDIX 4: POLYPROPYLENE CONVERTERS.................................................................................................................................................366
APPENDIX 5: POLYETHYLENE CONVERTERS....................................................................................................................................................368
APPENDIX 6: PVC CONVERTERS..........................................................................................................................................................................369

FRIDGE Chemical Sector Upstream Pricing Practices – Final Report
Ozone Business Consulting (Pty) Ltd Page 6
LIST OF ABBREVIATIONS
ANS Ammonium nitrate solution
ANPP Ammonium nitrate porous prills
ARMSA Association of Rotational Moulders of South Africa
ASGISA Accelerated and Shared Growth Initiative for South Africa
BA Butyl acrylate
BOPP Bi-axially oriented film
BPL Bone Phosphate of Lime or Tri-calcium Phosphate
CFR Cost and Freight
CHIETA Chemical Industries Education and Training Authority
CIF Cost, Insurance, and Freight
DAP Di-ammonium Phosphate
DCP Di-calcium Phosphate
EA Ethyl acrylate
EC European Community
EPASA Expanded Polystyrene Association of South Africa
EPDM Ethylene-propylene-diene rubber
EPZ Export Processing Zones
EVC Economic Value Creation Model
FOB Free on board
FRIDGE Fund for Research Into Industrial Development Growth and Equity
FSSA Fertilizer Society of SA
GAA Glacial acrylic acid
GDP Gross Domestic Product
GDS Growth and Development Summit
HDPE High density polyethylene
H3PO4 Phosphoric acid
IMF International Monetary Fund
IoM Institute of Materials
IPP Import parity pricing
IRR Internal Rate of Return
IVC Intrinsic value created
JV Joint venture

FRIDGE Chemical Sector Upstream Pricing Practices – Final Report
Ozone Business Consulting (Pty) Ltd Page 7
K Weighted average cost of capital
LAN Lime ammonium nitrate
LC Letter of Credit
LDPE Low density polyethylene
LLDPE Linear-low density polyethylene
MAP Mono-ammonium Phosphate
MCC Mitsubishi Chemical Corporation
MCP Mono-calcium Phosphate
MERSETA Manufacturing, Engineering and Related Services Sector Education and Training Authority
MGA Merchant Grade Acid
NEDLAC National Economic Development and Labour Council
NPK Nitrogen, Phosphorus, Potassium
PASAF Polyurethane Association of South Africa
PBIT Profit before Interest and Tax
PCA Plastics Converters Association
PDASA Plastic Distributors Association of South Africa
PET Polyethylene terephthalate
PFSA Plastics Federation of South Africa
PISA Plastics Institute of South Africa
PMMA Plastic Mould Makers Association
PP Polypropylene
PPA Purified Phosphoric Acid
PVC Polyvinylchloride
SA or RSA Republic of South Africa
SAMPLAS South African Machinery Suppliers Association for Plastics, Printing, Paper and Allied
Industries
SAPIA South African Polymer Importers Association
SAPMA South African Paint Manufacturers Association
SAPPMA South African Plastic Pipe Manufacturers Association
SDA Sasol Dia Acrylates
SME Small and Medium Sized Enterprises
SSP Single super phosphate
the dti The Department of Trade and Industry

FRIDGE Chemical Sector Upstream Pricing Practices – Final Report
Ozone Business Consulting (Pty) Ltd Page 8
tpa Tons per annum
TSP Triple Super Phosphate
UK United Kingdom
USA or US United States of America
USSR Union of the Soviet Socialist Republics
VAT Value added tax
VCM Vinyl chloride monomer
WTO World Trade Organization
FRIDGE Chemical Sector Upstream Pricing Practices – Final Report
Ozone Business Consulting (Pty) Ltd Page 9
LIST OF FIGURES
Figure 2.1 Polypropylene Value Chain
Figure 2.2 Global Application of Primary Polypropylene
Figure 2.3 Polypropylene – Sasol Polymers Flow Diagram
Figure 2.4 Polypropylene – Dow Plastics Schematic Diagram
Figure 2.5 SA Polypropylene Market Breakdown
Figure 2.6 Relative Polypropylene Cost Structures – South and International
Figure 2.7 Historical South African Sales – Polypropylene Derivatives
Figure 2.8 Polypropylene Historical Local and Export Volumes
Figure 2.9 Historical Local Delivered Prices – Polypropylene All Grades
Figure 2.10 Historical Local Delivered Prices, Including Averages Prices for Large and Small Companies –
Polypropylene All Grades
Figure 2.11 South Africa and International Polypropylene Domestic Prices
Figure 2.12 Time Series Comparison of Domestic Prices and FOB Prices in the USA
Figure 2.13 Time Series Comparison of Delivered Domestic Prices and FOB Prices in North West Europe
Figure 2.14 EVC Results – Upstream Polymers
Figure 2.15 IVC Results – Upstream Polymers
Figure 2.16 Sensitivity of EVC and Profit Before Interest and Tax to Selling Price, Sales Volume, Cost of
Sales and K – Upstream Polymers
Figure 3.1 Polyethylene Value Chain
Figure 3.2 LDPE – Sasol Polymers Flow Diagram
Figure 3.3 LLDPE – Sasol Polymers Flow Diagram
Figure 3.4 HDPE – Dow Plastics Schematic Diagram
Figure 3.5 South African LDPE Market Breakdown
Figure 3.6 South African LLDPE Market Breakdown
Figure 3.7 South African HDPE Market Breakdown
Figure 3.8 Polyethylene Cost Structures – South Africa and International
Figure 3.9 Historical Local and Export Volumes – LDPE
Figure 3.10 Historical Local and Export Volumes – LLDPE
Figure 3.11 Historical Local and Export Volumes – HDPE
Figure 3.12 Historical local Delivered Prices – LDPE All Grades
Figure 3.13 Historical Local Delivered Prices – LLDPE All Grades
Figure 3.14 Historical Local Delivered Prices – HDPE All Grades

FRIDGE Chemical Sector Upstream Pricing Practices – Final Report
Ozone Business Consulting (Pty) Ltd Page 10
Figure 3.15 South Africa and International LDPE Domestic Prices
Figure 3.16 South and International LLDPE Domestic Prices
Figure 3.17 South Africa and International HDPE Domestic Prices
Figure 3.18 Historical South African Sales – Polyethylene Derivatives
Figure 3.19 Time Series Comparison of Domestic Prices and FOB Prices in the USA
Figure 3.20 Time Series Comparison of Domestic Prices and FOB Prices in North West Europe
Figure 3.21 Time Series Comparison of Domestic Prices and FOB Prices in the USA
Figure 3.22 Time Series Comparison of Domestic Prices and FOB Prices in North West Europe
Figure 3.23 EVC Results – Downstream Polymers
Figure 3.24 IVC Results – Downstream Polymers
Figure 3.25 Sensitivity of EVC and Profit Before Interest and Tax to Selling Price, Sales Volume, Cost of
Sales and K – Downstream Polymers
Figure 3.26 IVC Comparison – Upstream and Downstream Polymers
Figure 3.27 EVC Results – Publicly Traded Downstream Company
Figure 3.28 IVC Results – Publicly Traded Downstream Company
Figure 4.1 Polyvinyl Chloride Value Chain
Figure 4.2 Global Market Breakdown of Polyvinyl Chloride
Figure 4.3 Polyvinyl Chloride – Sasol Polymers Flow Diagram
Figure 4.4 South African Polyvinyl Chloride Market Breakdown
Figure 4.5 Relative Polyvinyl Chloride Cost Structures – South Africa and International
Figure 4.6 Historical Local and Export Volumes – Polyvinyl Chloride
Figure 4.7 Historical Local Delivered Prices – PVC All Grades
Figure 4.8 South Africa and International Polyvinyl Chloride Domestic Prices
Figure 4.9 Comparison of Domestic and FOB Prices of Polyvinyl Chloride in the USA
Figure 4.10 Comparison of Domestic and FOB Prices of Polyvinyl Chloride in North West Europe
Figure 5.1 Phosphate Rock Value Chain
Figure 5.2 Ammonia Value Chain
Figure 5.3 Global Phosphate Rock production and Exports – 2003
Figure 5.4 Historical Local and Export Volumes – Ammonia
Figure 5.5 Historical Local Delivered Prices – Ammonia
Figure 5.6 Historical Local and Export Volumes – Phosphate Rock
Figure 5.7 Historical Local Ex-Factory and Delivered Prices – Phosphate Rock
Figure 5.8 Historical Local and Export Volumes – Phosphoric Acid

FRIDGE Chemical Sector Upstream Pricing Practices – Final Report
Ozone Business Consulting (Pty) Ltd Page 11
Figure 5.9 Historical Local Delivered prices – Phosphoric Acid
Figure 5.10 Historical International and South Africa Domestic Prices – Ammonia
Figure 5.11 Historical Local and International Prices – Phosphate Rock
Figure 5.12 Historical Local and International Prices – Phosphoric Acid
Figure 5.13 Historical South Africa Sales – Major Ammonia Derivatives
Figure 5.14 Historical Non-Captive South African Production – Phosphoric Acid
Figure 5.15 Historical South African Sales – Major Phosphoric Acid Derivatives
Figure 5.16 EVC Results – Upstream Fertilizers
Figure 5.17 IVC Results – Upstream Fertilizers
Figure 5.18 Sensitivity of EVC and Profit Before Interest and Tax to Selling Prices, Sales Volume, Cost of
Sales and K – Upstream Fertilizers
Figure 5.19 EVC Results – Downstream Fertilizers
Figure 5.20 IVC Results – Downstream Fertilizers
Figure 5.21 Sensitivity of EVC and Profit Before Interest and Tax to Selling Price, Sales Volume, Cost of
Sales and K – Downstream Fertilizers
Figure 5.22 IVC Comparison – Upstream and Downstream Fertilizers
Figure 6.1 Titanium Dioxide Value Chain
Figure 6.2 Huntsman Tioxide Flow Diagram
Figure 6.3 South African Titanium Dioxide Pigment Market Breakdown
Figure 6.4 Relative Titanium Dioxide Pigment Cost Structures – South Africa and International
Figure 6.5 Historical Local and Export Volumes – Titanium Dioxide Pigments
Figure 6.6 Historical Local Delivered Prices – Titanium Dioxide Pigments
Figure 6.7 South Africa and International Titanium Dioxide Pigments Domestic Prices
Figure 6.8 EVC Results – Upstream Pigments
Figure 6.9 IVC Results – Upstream Pigments
Figure 6.10 Sensitivity of EVC and Profit Before Interest and Tax to Selling Price, Sales Volume, Cost of
Sales and K – Upstream Pigments
Figure 7.1 Acrylic Acid and Esters Value Chain
Figure 7.2 Acrylic Acid and Acrylate Esters – Sasol Dia Acrylates JV Flow Diagram
Figure 7.3 Relative Glacial Acrylic Acid and Acrylate Esters Cost Structures – South Africa and
International
Figure 7.4 Historical Local and Export Volumes – Glacial Acrylic Acid
Figure 7.5 Historical Local and Export Volumes – Butyl Acrylate

FRIDGE Chemical Sector Upstream Pricing Practices – Final Report
Ozone Business Consulting (Pty) Ltd Page 12
Figure 7.6 Historical Local and Export Volumes – Ethyl Acrylate
Figure 7.7 Historical Local Delivered Prices – Glacial Acrylic Acid
Figure 7.8 Historical Local Delivered Prices – Butyl Acrylate
Figure 7.9 Historical Local Delivered Prices – Ethyl Acrylate
Figure 7.10 South Africa and International Glacial Acrylic Acid Domestic Prices
Figure 7.11 South Africa and International Butyl Acrylate Domestic Prices
Figure 7.12 South Africa and International Ethyl Acrylate Domestic Prices
Figure 8.1 All Polymers – 2004: Per Head Polymer Usage vs Per Capita GDP for South Africa and 97
Other Countries
Figure 8.2 All Polymers – 2004: Per Head Polymer Usage vs Per Capita GDP for South Africa and All Mid
Size Countries
Figure 8.3 All Polymers – 2004: Per Head Polymer Usage vs Per Capta GDP for South Africa and All Mid
Size Countries
Figure 8.4 Polystyrene – 2004: Per Head Polymer Usage vs Per Capita GDP for South Africa and All Mid
Size Countries
Figure 10.1 Polypropylene Installed Capacity and Domestic Demand in South Africa (1994-2007)
Figure 10.2 LDPE Installed Capacity and Domestic Demand in South Africa (1994-2007)
Figure 10.3 LLDPE Installed Capacity and Domestic Demand in South Africa (1994-2007)
Figure 10.4 HDPE Installed Capacity and Domestic Demand in South Africa (1994-2007)
Figure 10.5 PVC Installed Capacity and Domestic Demand in South Africa (1994-2007)

FRIDGE Chemical Sector Upstream Pricing Practices – Final Report
Ozone Business Consulting (Pty) Ltd Page 13
LIST OF TABLES
Table 2.1 Polypropylene – Tariff Protection in Other Countries
Table 2.2 Polypropylene – Import Parity Price Calculation
Table 2.3 Polypropylene – Methodology and Assumptions Used in Establishing a Derived Import Parity
Price in Selected Countries
Table 2.4 Polypropylene End-Products – Tariff Protection in South Africa
Table 3.1 Major Polyethylene Producers
Table 3.2 Polyethylene – Tariff Protection in Other Countries
Table 3.3 Polyethylene – Import Parity Price Calculation
Table 3.4 Polyethylene End-Products Tariff Protection in South Africa
Table 4.1 Polyvinyl Chloride – Tariff Protection in Other Countries
Table 4.2 Polyvinyl Chloride – Import Parity Price Calculation
Table 4.3 Polyvinyl Chloride End-Products Tariff Protection in South Africa
Table 5.1 ADF Test Statistics Without Drift and Trend
Table 5.2 Trace Test Statistics
Table 5.3 Vector Error Correction Estimates for Fertilizer Markets
Table 7.1 Glacial Acrylic Acid and Acrylate Esters – Import Parity Price Calculation
Table 8.1 Per Capita Polymer Usage vs Per Capita GDP for RSA and Chile
Table 9.1 Drivers for Downstream Plastic Conversion Development – Proposed Weightings for a
Developing Country
Table 9.2 Growth Factor Weightings for Downstream Plastic Conversion
Table 9.3 Propensity for Downstream Development

FRIDGE Chemical Sector Upstream Pricing Practices – Final Report
Ozone Business Consulting (Pty) Ltd Page 14
EXECUTIVE SUMMARY
Background
E1 The South African government has prioritised the chemical industry for spearheading
growth and development for the country as a whole as part of a much broader government
growth and development agenda. In order to realize such aspirations in the chemical
industry in particular, the (chemical) sector development strategy’s focus is upon
downstream development and beneficiation of abundant feedstock. The government wants
the chemical industry as a whole and the downstream chemical industry in particular to
meet the economic aspirations such as competitiveness, investment, exports, job creation
and equity. One of the ways of achieving competitiveness is to ensure competitive cost
inputs and therefore pricing practices are one of the important factors in the development of
the chemical industry. It is against this background that during the Nedlac Chemical Sector
Summit process it was agreed to conduct a study on the role of pricing practices in the
South African chemical sector. One of the pricing practices is import parity pricing (IPP),
which is the pricing of a locally manufactured product that it would cost to import. Pricing
practices as applied by the upstream chemical industry and the implications on the
downstream chemical industry was the subject of this investigation. The investigation was
focussed only on the following value chains: Polypropylene (PP), Polyethylene (LDPE,
LLDPE, HDPE), Polyvinyl chloride (PVC), titanium dioxide, acrylic acid, and fertilizer
feedstock or raw materials; namely, ammonia and phosphoric acid.
Methodology
E2 The information required for this investigation was gathered from local and international
databases and other desk sources. Furthermore, personal and telephonic interviews were
done with upstream and downstream role-players. Among international sources used were
ICIS LOR, Platts Polymerscan, Tecnon Parpinelli and Harriman Chemsult. These sources
were used for the pricing data as they publish weekly and monthly quotes on the prices that
prevailed for various markets around the world. Data on the conversion and usage of

FRIDGE Chemical Sector Upstream Pricing Practices – Final Report
Ozone Business Consulting (Pty) Ltd Page 15
polymers was sourced from Tecnon Parpinelli and CMAI while data on the country
populations and GDP was sourced from the IMF and the World Bank.
.
E3 When it comes to international competitiveness of the South African chemicals pricing, time
series for price comparisons were compiled for the period January 1994 to January 2005
for China, India, Northwest Europe and the USA. Pricing data collected from international
sources/agencies was compared with that collected from the relevant upstream and
downstream companies in South Africa as a means of verification. Similarly, local pricing
data collected from upstream companies was compared with that received from
downstream companies for verification.
E4 In terms of assessing the impact of the South African upstream chemical industry pricing
practices on the development of the downstream chemical industry, a comparison of the
relative development of downstream chemical industries for a range of countries with the
status in South Africa was done. This comparison of the relative development of the
downstream chemical sector is called the “Reality Test”. A comparison of the Per Capita
GDP versus Per Capita Polymer Usage for all countries is a well established “Reality Test”
worldwide. The “Reality Test” attempts to check if there is any correlation between the
stage of economic development as measured by Per Capita GDP with the size of the
polymer conversion sector as measured by Per Capita polymer converted within a country.
A sample of 97 countries has been selected for this comparison and the comparison was
done for polymers only since polymers represented the most value of all the intermediate
products which were the subject of this investigation.
E5 In order to analyse the impact of upstream pricing practices on the downstream industry the
Economic Value Creation Model (EVC) was used. EVC is a practical measure of the
company's operating performance that correlates with the value of the company. What
makes it so relevant is that it takes into account a cost that conventional measures exclude,
namely, the cost of equity. EVC is simply the before interest and after tax operating profit
minus the total annual cost of capital. In essence, the objective of this study was to
determine the impact of IPP in particular across both the upstream and downstream

FRIDGE Chemical Sector Upstream Pricing Practices – Final Report
Ozone Business Consulting (Pty) Ltd Page 16
elements of the chemical industry. Accordingly, financial data from upstream companies in
the research sample has been agglomerated, as was the financial data from downstream
companies. The effect is that no single company can be identified in the report.
E6 In order to make valid comparisons of the impact of selling price changes on both the
upstream and downstream levels of the chemical industry, it was necessary to determine
the relationship that existed between selling price changes and changes in sales to
customers. Technically, this relationship is known as the "elasticity of demand". Accordingly
a Demand Elasticity analysis was done in order to check the relationship between potential
changes in prices to the quantity of products sold.
Challenges encountered during the research
E7 The major challenge experienced during the research process was the lack of co-operation
from downstream companies. To address the situation contacts were made with Executive
Directors of the respective associations that the value chains under investigation fall within
in order to encourage their members to take part in the investigation. Furthermore, three
workshop sessions were held in Cape Town, Durban and Johannesburg with the aim of
encouraging downstream companies to give their submissions for this investigation. The
respective value chain associations invited their members to these workshops on top of the
invitations issued by the researchers. Even with this effort the study failed to get a
significant number of downstream companies to participate in the investigation for the value
chains polymers and titanium dioxide, with the exception of fertiliser raw
materials/feedstock value chain. Accordingly, in cases where the downstream sample size
could compromise conclusions drawn, such conclusions have been qualified in the report.
The nature of the South African industry
E8 The South African chemical industry generally has a mostly well-developed and
concentrated (with few manufacturers) upstream industry and a downstream industry that is
generally perceived as underdeveloped that comprises of many players.

FRIDGE Chemical Sector Upstream Pricing Practices – Final Report
Ozone Business Consulting (Pty) Ltd Page 17
Polymers
E9 Polypropylene supply in South Africa is concentrated with only two suppliers; namely, Sasol
Polymers in Secunda and Safripol (formerly Dow Plastics) in Sasolburg. Sasol Polymers
also produce LDPE, LLDPE and PVC while Safripol also produce HDPE. In terms of
feedstock PP is manufactured from propylene monomer which is supplied by only two
manufacturers; namely, Sasol Synthetic Fuels in Secunda and Sapref (Shell and BP
refinery) in Durban. South Africa has a unique propylene monomer supply from the Fischer
Tropsch (coal gasification) synthetic fuel technology employed by Sasol in Secunda. The
Fischer Tropsch process streams are relatively rich in recoverable propylene while
relatively smaller quantities of propylene monomer are also recoverable from conventional
refinery operations like Sapref. LDPE, LLDPE and HDPE are all manufactured from
ethylene monomer which is also supplied by Sasol Synthetic Fuels in Secunda. PVC is
manufactured from ethylene monomer and chlorine. Sasol Polymers manufacture chlorine
captively (for own in-house consumption) from salt.
E10 In terms of application PP is used in the manufacturing of appliances (what is normally
referred to as white goods), automotive batteries, automotives, buckets, domestic
ware/furniture, closures and caps, food containers, woven packaging/bags and fibres
(carpets and other). Of these the dominant market applications are woven packaging/bags
(20%), non-woven other (18%), domestic ware/furniture (15%) and fibres (15%). In case of
polyethylene, more than 70% is for packaging applications. PVC is used in two main
product categories; namely, flexible and rigid products. The PVC market is different to the
polyethylene in that it is not dominated by packaging applications, but rather it is used in a
variety of other applications and in particular construction. More than 45% of the PVC
market applications is pipes and packaging is only 10% while by way of comparison the PP
market applications for pipes in only 1%.
E11 The cost structure of South African based upstream polymers operations is not directly
comparable to international operations largely because of two reasons. Firstly because
both Safripol and Sasol Polymers have integrated operations that are manufacturing both
Polypropylene and Polyethylene. Secondly, in the case of Sasol Polymers, the production

FRIDGE Chemical Sector Upstream Pricing Practices – Final Report
Ozone Business Consulting (Pty) Ltd Page 18
infrastructure includes an olefin purification operation that purifies ethylene and propylene
that is obtained in crude form from the Fischer Tropsch process. It is important to note that
the ethylene and propylene supplied by Sasol Synthetic Fuels to Sasol Polymers is not
polymer grade but raw condensate, hence there is a purification operation at the Sasol
Polymers side. This is a unique operation on a global basis. Generally feedstock costs in
South Africa’s case is a lower portion of total costs compared to international
manufacturers, while other costs, which include variable and fixed manufacturing costs, but
no depreciation, are higher in South Africa’s case. However, in absolute terms South
Africa’s cost base is relatively higher than the international norm due to relatively small
manufacturing plant sizes.
E12 Tariff protection in South Africa for polymers supplied from non-European countries is 10%
ad valorem import duty calculated based on the FOB price while for Europeans countries it
is 7.5% ad valorem. In other words the upstream manufacturers enjoy tariff protection of
10% (PP), 8.4% (Polyethylene and PVC) ad valorem duty at the most. By contrast tariff
protection for (downstream) products manufactured from polymers is in the order of 15% –
20% for most products and up to a high of 24% for one particular product. It is only in the
case of a few polyethylene downstream products that tariff protection is as low as 5%.
Therefore, for most products downstream tariff protection is not only higher than tariff
protection upstream, it is also calculated on a figure than is numerically higher in weight
terms meaning that on a Rand/ton basis the protection is up to four times higher for
downstream products compared to the upstream polymers.
Fertilizer feedstocks/raw materials
Phosphate rock
E13 There is only one commercial supplier of phosphate rock in South Africa. Phosphate rock is
mined by Foskor in Phalaborwa for commercial supply but there is also another mine in
Lephalale owned by Fer-Min-Ore Phosphate. Unlike Foskor, Fer-Min-Ore beneficiates the
phosphate rock they mine for the production of single super phosphate which they supply
to the market. The South African phosphate rock resource base has a poor P2O5 content
compared to other world sources. In South Africa, phosphate rock has to be beneficiated to

FRIDGE Chemical Sector Upstream Pricing Practices – Final Report
Ozone Business Consulting (Pty) Ltd Page 19
increase P2O5 contents from less than 10% to an average 38%. Elsewhere in the world
phosphate rock is mostly applied to the soil as is (as fertilizer) due to a higher P2O5 content.
South Africa is the 9th largest global producer with a 2.1% share.
E14 Phosphate rock in South Africa is igneous which is found through deep mining versus most
of the world supply which is sedimentary and is near the surface. South Africa’s phosphate
rock is produced by means of a mining process, followed by a metallurgical beneficiation
and concentration process that involves chemical flotation and drying. This process
increases the average P2O5 contents from less than 10% to an average 38%. Major
exporting countries elsewhere in the world have phosphate resources that have a natural
P2O5 contents that is high enough not to require expensive chemical processing and drying.
In addition, the inland position of Foskor also results in high inland transportation cost to the
Richards Bay harbour for export. In South Africa’s case the major cost elements are
therefore related to typical mining operations, including materials handling and milling, as
well as the beneficiation process. The beneficiation process and waste management of the
flotation tailings are an added cost for South Africa compared to major global suppliers.
E15 There is no tariff protection on phosphate rock.
Phosphoric acid
E16 Phosphoric acid is produced by Foskor in Richards Bay, Sasol Nitro in Phalaborwa and
Omnia in Rustenburg. Phosphoric acid is a unique value chain for the study in that
downstream companies have captive production. The three major fertilizer companies use
100% of the commercial (non-captive) phosphoric acid.
E17 Phosphoric acid is commercially available in a range of qualities and concentrations.
These range from crude phosphoric acid containing most of the impurities present in
phosphate rock to a very pure phosphoric acid containing very low impurity levels. Crude
phosphoric acid has low concentrations of 40-54% P2O5 and it is used for the manufacture
of fertilizers such as di-ammonium phosphate (DAP) and triple super phosphate (TSP).
Very pure phosphoric acid has concentrations of 75% and 85% and it is used for food

FRIDGE Chemical Sector Upstream Pricing Practices – Final Report
Ozone Business Consulting (Pty) Ltd Page 20
applications and other high value end-uses. The greatest use of phosphoric acid by far is
in the manufacture of phosphate chemicals consumed primarily as carriers of phosphorus
in fertilizers and animal feeds. Phosphoric acid is also used in the manufacture of
phosphate chemicals for use in water treatment and detergent builders, dentifrices, fire
control chemicals and a host of smaller markets. Consumption of phosphoric acid for its
acid properties per se is relatively small (e.g. beverage acidulation).
E18 Phosphoric acid is produced by means of the reaction of sulfuric acid with phosphate rock.
The cost of production therefore includes the cost of production of sulfuric acid as well. The
main cost element in sulfuric acid production is sulfur feedstock. South Africa has little
sulfur feedstock, and the majority of requirements are imported from Canada. Due to the
low unit cost of sulfur, logistical handling and shipping costs are relatively high, making the
cost of sulfuric acid production high. The major cost items in phosphoric acid production are
therefore phosphate rock and sulfuric acid, which account for around two-thirds of total
production costs.
E19 There is no tariff protection on the major derivatives of phosphoric acid.
Ammonia
E20 Sasol is the only producer of ammonia in South Africa. Sasol operates two ammonia
operations, one in Sasolburg and one in Secunda. The other plants in Modderfontein
(AECI) and Milnerton (Calref) have been closed down since they were no longer
economically viable to operate and maintain. The Sasolburg plant is a conventional unit,
previously using Sasol’s own synthesis gas produced from coal, and pure nitrogen. This
plant has now been converted to use reformed natural gas supplied from Mozambique.
Sasol’s operation in Secunda is utilising the so-called Phenosolvan process. The plant
recovers ammonia that becomes available from Sasol’s coal gasification operations.
Ammonia production from the Phenolsolvan process is part of an integrated process that
produces a range of other products. The cost structure of ammonia production could not be
established.

FRIDGE Chemical Sector Upstream Pricing Practices – Final Report
Ozone Business Consulting (Pty) Ltd Page 21
E21 The major application markets for ammonia are in fertilizer (50%) and explosives
manufacturing (45%). The downstream sectors affected by ammonia feedstock are mainly
the primary fertilizer and explosives production sector. This includes Sasol Nitro’s fertilizer
and explosives business units which also purchase ammonia at arm’s length from Sasol
Nitro’s ammonia business unit. Sasol Nitro’s ammonia, fertilizer and explosives business
units operate as separate business units.
E22 There is no duty protection on the major ammonia derivatives.
Titanium dioxide
E23 Titanium feedstock is typically obtained from natural deposits of heavy mineral sands,
which contain titanium ores together with other minerals such as Iron and Zircon. Around
one-third of global titanium ore is supplied as slag produced from lower grade ores. This
slag is then used for pigment manufacturing. South Africa is a major global source of
titanium feedstock, accounting for around 17% of the total global supply, and 50% of
particularly titanium slag. Titanium slag operations are Richards Bay Minerals and Ticor in
Richards Bay and Namaqua Sands in Saldanha Bay.
E24 Huntsman Tioxide in Umbongwintini is the only titanium dioxide pigment manufacturer in
South Africa. The operation is relatively old and small in capacity. Also, it is based upon
older sulphate-based technology, compared to newer plants that are based upon chloride
technology. South Africa’s overall cost per ton of pigment is significantly higher than
international low-cost producers. Titanium dioxide is the standard white pigment used
principally in paints (79%), plastics conversion (10%), inks (3%) and other formulations
such as paper. It is the most important pigment in the world, accounting for about 70% of
total volume.
E25 There is an import duty of 10% applicable to titanium dioxide pigments

FRIDGE Chemical Sector Upstream Pricing Practices – Final Report
Ozone Business Consulting (Pty) Ltd Page 22
Acrylic acid and Acrylate esters
E26 Acrylic acid and acrylate esters are produced by Sasol Dia Acrylates in Sasolburg,
previously a joint venture between Sasol and Mitsubishi Chemical Corporation of Japan but
now fully-owned by Sasol with a license and off take agreement with Mitsubishi. Glacial
acrylic acid, is used primarily to manufacture water treatment chemicals, as well as
emulsion polymers while acrylate esters are mainly used to manufacture emulsion
polymers. Sasol Dia Acrylates manufactures acrylic acid from propylene monomer, while
acrylate esters are manufactured from n-butanol, which is in turn manufactured from
propylene, and ethanol in addition to acrylic acid. Propylene is supplied by Sasol Synthetic
Fuels in Secunda and Sapref in Durban, the only two suppliers.
E27 The cost structure of acrylic acid and acrylate esters manufacturing in South Africa is not
directly comparable to international glacial acrylic acid and acrylate esters operations in
that the Sasol Dia Acrylates has an integrated operation that is manufacturing n-butanol as
well as acrylates. It is important to note that the feedstock used in South Africa’s case is
propylene, ethanol and butanol, while in the international manufacturer’s case the
feedstock is acrylic acid and butanol.
E28 There is no tariff protection for glacial acrylic acid, ethyl acrylate and butyl acrylate.
The nature of the global industry
Polymers
E29 PP is produced in a range of grades; namely, homopolymer, impact copolymer and random
copolymer. It is produced by many countries and it is traded in large volumes (45 times the
South African market) around the globe. Injection moulding and fibre and filament are the
world's largest end uses for PP, at 33% and 29%, respectively, followed by film uses at
18%. The injection moulding end-use category seems to be inversely related to the maturity
and overall growth of consumption in countries and regions. That is, as a country/region
matures and growth slows, the PP end-use breakdown shifts toward injection moulding.
Transportation constitutes one of the major end-use markets for injection-moulded PP.
Numerous other types of products are injection moulded from PP. Tariff protection is

FRIDGE Chemical Sector Upstream Pricing Practices – Final Report
Ozone Business Consulting (Pty) Ltd Page 23
comparable to that of South Africa for selected countries except in the case of Malaysia
where it is the highest at 30% and it is calculated on CIF basis.
E30 Polyethylenes are produced in a range of grades. LDPE and LLDPE grades are commodity
and special film grades, extrusion coating LDPE grades, injection moulding grades and
rotational moulding grades in pellet or ground powder form. HDPE grades are blow and
injection moulding, bottle and film grades. Polyethylenes in general are regarded as
commodity products that are produced by many countries and is well-traded in large
volumes (44 times the South African market) around the globe. Global plant sizes are
increasing due to economies of scale issues. Tariff protection is comparable to that of
South Africa for selected countries except in the case of Malaysia where it is the highest at
30% and it is calculated on CIF basis.
E31 Film applications are by far the largest market for LDPE, split roughly 50/50 between
packaging and non-packaging uses. Extrusion coating is the second largest market for
LDPE worldwide. Extrusion coating continues to be a growth area for LDPE, largely
because of innovations in packaging technology. Injection moulding is the third-most-
important consumer of LDPE. The two largest net importing regions for LDPE in 2006 were
Asia (excluding Japan) and Central/South America while the United States and Japan are
net exporters. The major applications for LLDPE are packaging, particularly film for bags
and sheets. Other applications are cable covering, toys, lids, buckets and containers and
pipes. The Middle East, Canada and Asia are the largest net exporters of LLDPE. Major net
importers are Western Europe, the United States and China. Blow moulding and injection
moulding are the dominant end uses in both Western Europe and North America,
accounting for 55% – 60% of total consumption. In contrast, consumption of HDPE in these
end applications constitutes only about 30% – 40% of total HDPE consumed in Japan and
the rest of Asia. As a percentage of total HDPE consumption, film usage in Japan and the
rest of Asia is over twice as much as the film share in either the United States or Western
Europe.

FRIDGE Chemical Sector Upstream Pricing Practices – Final Report
Ozone Business Consulting (Pty) Ltd Page 24
E32 PVC is produced in a range of grades; namely, rigid, flexible, and injection moulding. Rigid
applications account for 65 –75% of total consumption. Flexible PVC is used for film and
sheet, wire and cable insulation, floor coverings, synthetic leather products, coatings and
many other consumer goods. PVC consumption is mostly influenced by the construction
market, as about 60% of world consumption is for pipe, fittings, siding, windows, fencing
and other applications. PVC is increasingly used as a replacement for traditional
construction materials such as wood and metals, and glass in packaging applications; so its
growth has been above that experienced by the overall construction industry. The global
market size for PVC is 50 times the size of the South African market. Tariff protection is
comparable to that of South Africa for selected countries and it is the highest in Malaysia at
20% and it is calculated on CIF basis.
Fertilizer feedstocks/raw materials
Phosphate rock
E33 Globally the primary end-use for phosphate rock is phosphoric acid and phosphate
fertilizers manufacturing. Since the 1970s the rate of consumption has been increasing
although the rate of growth has slowed consistently. The second biggest demand sector is
detergents. Consumption in this market application has been affected by the growing
acceptance that phosphates lead to pollution of waterways. The pattern of consumption of
phosphate rock is affected more by seasonal weather patterns and regulations covering its
use, than by alternate periods of growth and recession that characterise the consumption of
other industrial minerals.
Phosphoric acid
E34 Globally phosphoric acid is the leading inorganic acid produced and consumed in terms of
production value. It is the second largest in terms of volume after sulfuric acid. By far its
greatest use is in the manufacture of phosphate chemicals consumed primarily as carriers
of phosphorus in fertilizers and animal feeds. Phosphoric acid is also used in the
manufacture of phosphate chemicals for use in water treatment and detergent builders,
dentifrices, fire control chemicals and a host of smaller markets. Consumption of
phosphoric acid for its acid properties per se (beverage acidulation) is relatively small.

FRIDGE Chemical Sector Upstream Pricing Practices – Final Report
Ozone Business Consulting (Pty) Ltd Page 25
E35 The primary market for wet phosphoric acid is the production of phosphate fertilizer
products (ammonium phosphates and triple super phosphate). Fertilizer production
accounts for approximately 85% of the global market for wet phosphoric acid. The balance
is consumed in a variety of industrial applications. The United States is the largest
consumer, accounting for about 35% of world consumption in 2002, and Southwest Asia,
Africa and Western Europe combined accounted for an additional 28%. Consumption in the
former USSR, which accounted for 21% of world consumption in 1986, accounted for only
8% in 2002. Africa dominates the export market for wet phosphoric acid with 68% of world
export volume. The United States, Western Europe and the Middle East are also large
exporters.
Ammonia
E36 Ammonia is predominantly made from natural gas, and there has been a continuous shift in
production capacity towards regions with low-cost natural gas. Global plant sizes are also
increasing due to economies of scale issues. In 1974 the developing countries accounted
for 27% of ammonia capacity. By 2003 their share was 52%. Some 88% of world ammonia
production is processed or used in the countries where it is produced. The remaining 12%
of world ammonia production enters international trade directly for all end-users.
Titanium dioxide
E37 There are about sixty plants worldwide manufacturing titanium dioxide with an average
capacity of 60 thousand metric tons per year. In recent years, the industry has been
restructuring towards consolidation but not new capacity. The top six producers accounted
for about 80% of total worldwide capacity. The major consuming industries for titanium
dioxide pigments are mature sectors in the developed world, and those are surface
coatings, paper and paperboard, inks and plastics. Paints and coating applications account
for the largest global share (around 75%), while inks and plastics and paper account for
most of the rest.

FRIDGE Chemical Sector Upstream Pricing Practices – Final Report
Ozone Business Consulting (Pty) Ltd Page 26
E38 In terms of manufacturing technology used, chloride and sulphate based pigment can be
substituted in around 80% of applications. Around 10% of the market can only use chloride-
based pigment (automotive paints), while 10% prefers to use sulphate process pigment
(inks).
Acrylic acid and Acrylate esters
E39 Glacial acrylic acid and acrylate esters are well traded in large volumes (about 90 times the
South African market) around the globe. Unlike in South Africa, about 30% of acrylic acid is
converted to super absorbents (super absorbents are not made in South Africa yet) and
around 55% is converted to acrylate esters. Major markets for the esters include surface
coatings (60%), textiles (15%), adhesives (12%) and plastics. Polyacrylic acid or
copolymers find applications in super absorbents, detergents, dispersants, flocculants and
thickeners. Super absorbent polymers are used primarily in disposable diapers.
E40 The largest global producers of acrylic acid are BASF (23% market share) followed by
Rohm and Haas/StoHaas (20%), Dow (14%), Nippon Shokubai (11%), ATOFINA,
Mitsubishi Chemical Company and Formosa Plastics.
Global pricing practices
Polymers
E41 Global prices are determined by supply and demand basis on a global scale, but are
particularly driven by the Far East, due to the availability of low-cost polymers and ill-
considered expansions in the 1990’s in countries such as Korea, as well as the ever-
growing demand from China. However, it is necessary to distinguish between the large
developed countries/regions of USA/Canada, Western Europe and Japan from all other
countries. Reason being these countries or regions have very large markets in relation to
the quantity of product that is available from countries that export polymers. These
countries/regions are largely self-sufficient in supply. There are limited imports into and
exports from these countries/regions in relation to the size of the domestic market. While
individual polymer users in each of these countries could import product from anywhere,

FRIDGE Chemical Sector Upstream Pricing Practices – Final Report
Ozone Business Consulting (Pty) Ltd Page 27
the quantum of these imports in relation to the size of the market is such that the price of
the imports would have no noticeable impact on the market price within the region.
E42 By contrast, developing countries or regions such as South Asia, South East Asia, North
Asia, Africa and South America are much more open to imports than the larger markets.
Over the years, the market price in each of these countries (including the price in South
Africa) has become set by reference to a “Reference Price” that is reported/published by
one of several polymer price reporting agencies. There are three Reference Prices that
have evolved and are used as the basis for setting prices in developing countries and
regions. These are CFR Hong Kong, FOB US Gulf Coast and FOB North Western Europe.
The application of Reference Pricing is such that all countries in the Asia Pacific and East
Africa (including South Africa) have prices that fall within the influence of the CFR Hong
Kong Reference Price. In other words, the CFR Hong Kong price sets/influences the
market price in each of the countries in South Asia, South East Asia, North Asia, East &
Southern Africa and Oceania (Australia and New Zealand). For polymer supplied to South
America even if out of the Middle East, the CFR South American port is set by reference to
the FOB US Gulf Coast price. The same applies for polymer supplied to countries in North
Africa and the Eastern Mediterranean out of the Middle East, the CFR port price is set by
reference to the FOB NW Europe price.
E43 In times when installed production capacity exceeds demand, which is the norm for most of
the price cycle, high cost producers are barely able to cover their costs and cut back supply
accordingly, while those with a lower cost base will achieve a low return. During these
periods, little re-investment occurs because of the low returns and, as demand increases
with time, a stage is eventually reached where demand exceeds installed production
capacity. At this time prices rise rapidly and high margins are earned prompting new
capacity investment and within 1 - 2 years, another situation of excess capacity and
subsequent low margins exists. Historically, this price cycle repeats itself every 6 - 8 years.
It is important to note that polymer producers’ returns are realised over entire price cycles.
The high returns earned for short periods during the peaks of price cycles, and the
inadequate returns experienced during the trough, balance out the average return for the

FRIDGE Chemical Sector Upstream Pricing Practices – Final Report
Ozone Business Consulting (Pty) Ltd Page 28
polymer producers. This need for an adequate long term average return on investment is
typical of the international polymer industry and applies to all regions, including South
Africa.
Fertilizer Feedstocks/Raw Material
Phosphate rock
E44 Phosphate rock is priced according to the available P2O5 contents in the rock, taking into
account the logistical cost to move the rock to the site where beneficiation takes place. The
higher the relative P2O5 contents the higher the price. Global prices for phosphate rock are
determined on a supply/demand basis, but are mainly determined by India as they import
around 10% of global phosphate rock trade. The major Indian importers publish on an
annual basis the phosphate rock price, after negotiations with the major suppliers. Global
supply of phosphate rock has to be competitive based on the set prices, as importation of
downstream products such as DAP will result in uncompetitive regional phosphate rock
suppliers being forced out of the market.
Phosphoric acid
E45 Global prices for phosphoric acid are also set by India, due to their dominance as importer
of phosphoric acid.
Ammonia
E46 Ammonia price is calculated for each preceding month on the 15th of the previous month
based upon the average published spot price out of the Middle East and Yuzhny. This
takes into account the average exchange rates for the previous four weeks and also makes
provision for a competitive position for limestone ammonium nitrate fertilizer versus urea.
Ammonia price is therefore based on a set formula.
Titanium dioxide
E47 Titanium dioxide is a commodity item and hence pricing is driven by world demand and
supply. The price is calculated on the basis of a published price in a specific region or
country. Customers monitor prices from all major trading regions and the lowest price
FRIDGE Chemical Sector Upstream Pricing Practices – Final Report
Ozone Business Consulting (Pty) Ltd Page 29
available at any point in time is then used by them as a basis for negotiations with their
pigment supplier. Pigment suppliers tend to publish these agreed prices on a regular basis.
Acrylic acid and Acrylate esters
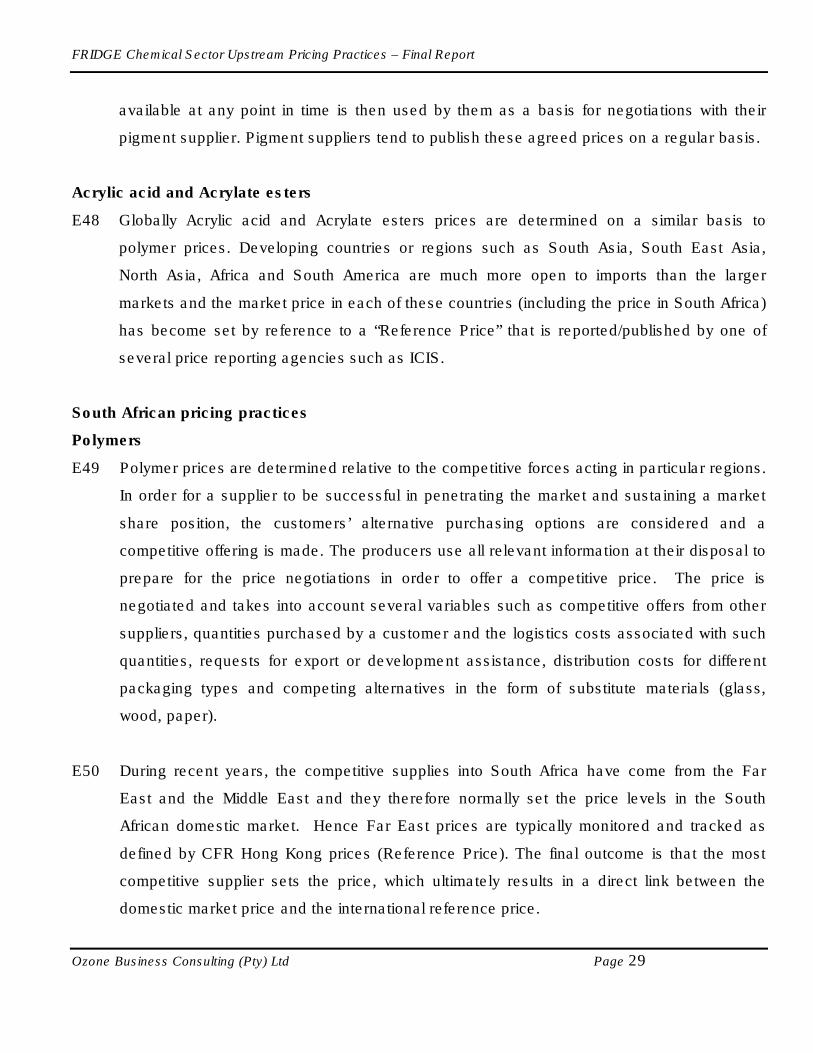
E48 Globally Acrylic acid and Acrylate esters prices are determined on a similar basis to
polymer prices. Developing countries or regions such as South Asia, South East Asia,
North Asia, Africa and South America are much more open to imports than the larger
markets and the market price in each of these countries (including the price in South Africa)
has become set by reference to a “Reference Price” that is reported/published by one of
several price reporting agencies such as ICIS.
South African pricing practices
Polymers
E49 Polymer prices are determined relative to the competitive forces acting in particular regions.
In order for a supplier to be successful in penetrating the market and sustaining a market
share position, the customers’ alternative purchasing options are considered and a
competitive offering is made. The producers use all relevant information at their disposal to
prepare for the price negotiations in order to offer a competitive price. The price is
negotiated and takes into account several variables such as competitive offers from other
suppliers, quantities purchased by a customer and the logistics costs associated with such
quantities, requests for export or development assistance, distribution costs for different
packaging types and competing alternatives in the form of substitute materials (glass,
wood, paper).
E50 During recent years, the competitive supplies into South Africa have come from the Far
East and the Middle East and they therefore normally set the price levels in the South
African domestic market. Hence Far East prices are typically monitored and tracked as
defined by CFR Hong Kong prices (Reference Price). The final outcome is that the most
competitive supplier sets the price, which ultimately results in a direct link between the
domestic market price and the international reference price.

FRIDGE Chemical Sector Upstream Pricing Practices – Final Report
Ozone Business Consulting (Pty) Ltd Page 30
E51 Prices agreed to with customers can be adjustable month by month or, quarter by quarter,
or fixed for longer periods. Generally, there is a price continuum across the customer base.
It should be noted though that over a relatively long period average domestic delivered
prices compared to average calculated prices of imports on an import parity basis would be
fairly close to each other. Import duties are inherent in the domestic market prices and
therefore their removal will result in overall price reduction.
Fertilizer feedstock/raw materials
Phosphate rock
E52 Historically up until May 2004 the price of phosphate rock was determined on the basis of
import parity price for Di-ammonium Phosphate (DAP) and phosphoric acid. The rock
contents of DAP and phosphoric acid were calculated, and split on a ratio of 60/40 to
determine the phosphate rock price. This formula was found to be unsustainable, and after
negotiations with customers a new formula was agreed upon. The new pricing formula is
indexed upon the CFR price of phosphate rock in India.
Phosphoric acid
E53 Phosphoric acid is priced on an import parity basis, using the Indian CFR price as a basis.
An agreement has been reached between suppliers and customers whereby the local price
will be equivalent to the Indian CFR price, decreased by 25% of the freight cost from India.
Ammonia
E54 Ammonia is sold on contract to explosives, fertilizer and mainly on a non-contractual basis
to smaller industrial customers. A contract price formula is used to determine the monthly
selling price of ammonia to explosives and fertilizer industry customers. The contract price
is based upon the actual FOB import prices to South Africa from the Middle East (75%) and
Yuzhny, Russia (25%) including all logistics costs. The ammonia contract price formula
also makes provision for a competitive position for limestone ammonium nitrate fertilizer
versus imported urea. The ammonia price for each preceding month is calculated on the
15th of the previous month based upon the average published spot price out of the Middle

FRIDGE Chemical Sector Upstream Pricing Practices – Final Report
Ozone Business Consulting (Pty) Ltd Page 31
East and Yuzhny for the previous four weeks and the average exchange rates for the same
period.
Titanium dioxide
E55 The local titanium dioxide pigment producer sells polymer products to customers in markets
which include South Africa and other countries or regions. Their policy is to sell at the
market price prevailing in each of these regions at any point in time, and this also applies to
sales in South Africa. Titanium dioxide is a commodity item and hence pricing is driven by
world demand and supply.
Acrylic acid and Acrylate esters
E56 The pricing philosophy practiced in South Africa was introduced by the local producer as
part of a market entry strategy to enable market growth aligned with business objectives. It
should be borne in mind that the local plant was commissioned in 2004 and the pricing
philosophy was introduced then. The following factors are taken into consideration when
setting the local market price; global market price, Rand/Dollar exchange rate, packaging
types and exports incentives among others. The local producer’s domestic prices are
comparable with prices in the USA and Asia. Prevailing domestic prices in South Africa are
derived from the published ICIS LOR data by taking the average of the lowest values
quoted for North West Europe (Free Delivered) and Asia Pacific on a CIF basis of the
preceding week’s published prices at the time of determination. This pricing philosophy
may be revisited in future as market conditions change.
International competitiveness of South African pricing
Polymers
E57 International competitiveness assessment done has revealed that prices paid by South
African downstream users are always within range of prices that prevailed in the regions or
countries covered for this investigation (China, India, NW Europe and the USA) over a 10
year period, mostly at the lower end of the range. It should be noted that China is the most
competitive (lowest priced market) in the world. In the early part of the period under review,
the prices in South Africa were much lower than those in China and India. However, as

FRIDGE Chemical Sector Upstream Pricing Practices – Final Report
Ozone Business Consulting (Pty) Ltd Page 32
imports into China have grown over the period the CFR Hong Kong price has fallen to the
low end of the range. In addition, import duties in China have fallen. Both factors have
contributed to a narrowing of the gap between prices in South Africa and those in China.
Fertiliser feedstock/Raw material
Phosphate rock
E58 South Africa’s domestic prices are not directly comparable with international phosphate
rock prices because the price of phosphate rock depends upon the relative P2O5 content
which is expressed as Bone Phosphate of Lime (BPL) or Tricalcium Phosphate. Due to this
factor, it would not have been useful to compare South Africa’s inland prices against a
range of countries, as this would require a detailed knowledge of actual BPL contents in
those countries, and that information was not readily available. However, using Morocco’s
export FOB price as the largest exporter and adjusting it relative to South Africa’s BPL,
domestic prices in South Africa are historically similar to Morocco’s export prices and below
Indian CFR prices, which does not take into account logistics costs in India.
Phosphoric acid
E59 Phosphoric acid delivered prices in South Africa were compared to Indian CFR prices, as
India is the price setter for phosphoric acid on a global basis due to their exceptionally large
import volumes. The comparison showed that domestic delivered prices in South Africa
were historically comparable to Indian CFR prices, which does not take into account
logistics costs in India.
Ammonia
E60 South African domestic prices are directly linked by means of the formula-applied pricing
mechanism to international prices. The price history of international ammonia prices in
major producing and consuming countries (India, Middle East, Russia and US Gulf Coast)
compared to South African domestic prices showed that India, which is a major ammonia
importing country, had an average price of around 3.7% lower than South Africa over the
period July 1996 to April 2005. Over the same period domestic prices in South Africa were
on average 1.8% lower than the US Gulf Coast prices.

FRIDGE Chemical Sector Upstream Pricing Practices – Final Report
Ozone Business Consulting (Pty) Ltd Page 33
Titanium dioxide
E61 Prices paid by South African downstream users are always within range of prices that
prevailed in the regions covered for this investigation (Asia Pacific, North America and NW
Europe) over a period of 5 years.
Acrylic acid and Acrylate esters
E62 A historically long enough assessment could not be done since the local plant had been
trading these products for a period of only one year during the course of this investigation.
Impact of pricing on downstream purchasers
Polymers
E63 The impact of the current pricing practices of the upstream players on the downstream was
assessed firstly by looking at the EVC for both the upstream and downstream sectors
separately and also by looking at the elasticity of demand for downstream plastics
products. It was not possible to obtain the required information for the EVC analysis at
individual product level because the operations are integrated. The analysis was therefore
conducted on the combined polymers for the upstream separately and downstream
separately for the period 1997 to 2005.
E64 For upstream polymers, the EVC analysis indicated that the return on capital was
frequently lower than the weighted average cost of capital. This means that the current
pricing practices of the upstream sector are not resulting in super profits for the upstream
sector, as measured against the total cost of capital.
E65 Despite all efforts no financial data was submitted by downstream companies for EVC
analysis pertaining to the PP and PVC value chains. Only four companies, accounting for
around 30% of the polyethylene market, provided financial data for the EVC analysis. The
EVC analysis of polyethylene downstream companies that submitted financial data
indicates that the return on capital was lower than the weighted average cost of capital in
every year except only two of the years. This situation means that a final conclusion on the

FRIDGE Chemical Sector Upstream Pricing Practices – Final Report
Ozone Business Consulting (Pty) Ltd Page 34
financial performance of the downstream sector could not be reached. However the
financial information submitted shows that the downstream companies that responded are
not making super profits either.
E66 In terms of elasticity of demand it was not possible to collect sufficient information to enable
the plotting of historical and future demand elasticity for polymers over all the various
applications in order to obtain an aggregate view of its price elasticity. As such, the
research used the results of an econometric study done in 2005 by Professor Johannes
Fedderke in order to come up with a practical verification of the elasticity of demand of
polymers by doing a market segments analysis of the respective major applications. The
market segments analysis showed that in excess of 80% of end-use applications for PP
and Polyethylene there is no significant demand elasticity. However, for PVC there is no
significant demand elasticity for most end-use applications, with the notable exception of
packaging bottles and sheet. Overall this means that polymer elasticity of demand can only
be impacted by product substitution, which in most cases occurs at elevated price
differentials due to technical considerations as for example, changing from plastic bottles to
glass.
Fertilizer feedstock/raw materials
E67 The impact of the current pricing practices of the upstream players on the downstream was
assessed firstly by looking at the EVC for both the upstream and downstream sectors
separately and also by looking at the elasticity of demand for fertilisers. The EVC value
analysis illustrated that the downstream fertilizers sector had returns that were higher than
the cost of capital by 2005 while in the upstream fertilizers sector the returns were lower at
the same time. This seems to illustrate an inversely proportional relationship between
upstream and downstream financial performance.
E68 The elasticity of demand analysis for fertilizers showed that fertilizers demand responds
positively to GDP growth to a large extend as well as to rainfall. However the elasticity is
relatively less when it comes to price changes.

FRIDGE Chemical Sector Upstream Pricing Practices – Final Report
Ozone Business Consulting (Pty) Ltd Page 35
Titanium dioxide
E69 The impact of the current pricing practices of the upstream players on the downstream was
assessed firstly by looking at the EVC for both the upstream and downstream sectors
separately and also by looking at the elasticity of demand for downstream products.
E70 EVC analysis was conducted for 1997 to 2005 for the only upstream company. The
analysis indicates that the first 6 years starting in 1997, with the exception of 1997,
recorded returns were higher than the weighted average cost of capital. However, from
2003 to 2005 the returns have been lower than the weighted average cost of capital. The
lower returns between 2003 and 2005 outweighed the returns made in the earlier years to
the extent that the IVC became negative by 2005. No historical financial information on
downstream titanium dioxide pigments has been provided and therefore no comparison
could be made between the upstream and downstream.
E71 From a practical perspective, most titanium dioxide pigments are used in the paints
industry. In this application titanium dioxide pigments accounts for around 20 – 25% of raw
material costs, or around 10 – 13% of selling prices. At retail level titanium dioxide
pigments accounts for only around 5% of the price. It is therefore unlikely that a decrease in
titanium dioxide pigment prices will significantly increase demand for paints.
Acrylic acid and Acrylate esters
E72 There was no historically long enough data to do an analysis since the operation has only
being trading for one year.
Global competitiveness of the South African downstream industry
E73 A “Reality Test” was done in order to assess the global competitiveness of the downstream
industry. A comparison of the Per Capita GDP versus Per Capita Polymer Usage for all
countries is a well-established “Reality Test”. A selection of 97 countries was used in this
analysis for comparison with South Africa. The “Reality Test” attempts to find out if there is
any correlation between the stage and size of economic development (as measured by per

FRIDGE Chemical Sector Upstream Pricing Practices – Final Report
Ozone Business Consulting (Pty) Ltd Page 36
capita GDP) with the size of the polymer conversion sector (as measured by per capita
polymer converted within the economy).
E74 The “Reality Test” showed that in relation to the 97 other countries used for this
investigation, South African downstream polymer conversion industry is not lagging in
terms of development, taking into account South Africa’s current state of economic
development. Also, it is economic activity within an economy that directly impacts on
demand for plastic products and primary polymers. Countries such as South Korea and
Taiwan whose polymer conversion eventually gets incorporated into more exports of
consumer goods are the ones that lead the polymer conversion sector in terms of being at
the highest level of development. Therefore for the South African polymer conversion
sector to reach a higher level of development more than this “Reality Test” suggests, South
Africa needs to export more finished goods which have plastic components.
E75 The “Reality Test” was done for polymers only because as a value chain polymers
represent the most value of all the intermediate products included in the study.
Growth drivers in the downstream sector
E76 There are several identified drivers for growth in the downstream chemical sector. These
drivers for growth tend to be universally applicable, with the only difference being the
relative importance of such drivers as impacted upon by local circumstances. Proximity to
large export markets, the availability of polymer from local manufacturing and the
availability of polymers at competitive prices are just three of the several identified growth
drivers.
E77 This assessment showed that the most important growth driver category for the successful
development of a downstream polymer industry is market related, and that competitive
pricing of polymer plays a role, but in proportion to all the other factors. The success or
health of a conversion industry is therefore not determined by a single driver, but a
combination of drivers. Development of a successful downstream beneficiation strategy
therefore needs to take all the factors into account. By enforcing an improvement of one

FRIDGE Chemical Sector Upstream Pricing Practices – Final Report
Ozone Business Consulting (Pty) Ltd Page 37
factor without addressing the other factors will not result in the desired development of the
downstream sector.
E78 Although this has been done for the polymer value chain only it should be noted that these
growth drivers are also applicable to most of the other value chains as far as the
development of the downstream sector is concerned.
Potential policy options for the development of the entire industry
E79 The workshops held to encourage the downstream to participate in the research in terms of
providing information were also used as a platform to debate the policies that the
downstream sector would want to see implemented for the development of the sector.
Although the downstream participation was low, the policy options were debated and noted
nonetheless. Where the policy options related to the level of participation of the
downstream it is acknowledged that the assessment could have been compromised by the
small sample size. Further policy options based on constraints to downstream
developments and other conclusions of the study which are also presented and evaluated
are not dependent on the sample size as they have been identified in the Accelerated
Shared Growth Initiative.
E80 The study revealed that local availability of polymer played a stronger role in the
development of the downstream industry. Any policy options that could affect the
continued existence of the upstream industry therefore need to be considered with great
care. As such ensuring sustainable local manufacturing should be one of the government’s
policies.
E81 One of the policy options that emanated from the workshops is the removal of import duties
for primary polymers. The immediate effect of duty removal is for local feedstock prices to
fall based upon competitive pressure from imports. Import duties are inherent in the market
price and therefore their removal will lead to price reduction. The demand elasticity
evaluation has however indicated that lowered prices will not result in significant market

FRIDGE Chemical Sector Upstream Pricing Practices – Final Report
Ozone Business Consulting (Pty) Ltd Page 38
expansion. In terms of profitability, the upstream sector will be negatively affected and
further investment may be compromised.
E82 Other potential policy options identified are:
• Ensuring availability of polymers at competitive prices
• Promotion of exports of industrial consumer goods
• Reducing freight logistics costs
• Increasing innovation capability
• Increased duty protection for downstream products
• Fast-track approach to anti-dumping investigations
• Prevention of illegal imports

FRIDGE Chemical Sector Upstream Pricing Practices – Final Report
Ozone Business Consulting (Pty) Ltd Page 39
1. INTRODUCTION
1.1. Background to the Study
The South African chemical industry has a mostly well-developed upstream industry with a few
primary producers, and an apparently relatively underdeveloped downstream industry that
comprises of many players. As part of a much broader government agenda, the chemical sector
has been prioritised within ASGISA (Accelerated and Shared Growth Initiative for South Africa) for
spearheading growth and development for the country as a whole. Furthermore, the dti’s
chemical sector development strategy’s focus is upon downstream development and beneficiation
of abundant feedstock in order to meet economic aspirations such as competitiveness,
investment, exports, job creation and equity. Pricing practices are an important factor in the
development of the chemical sector and particularly relevant to the competitiveness of the sector.
One pricing practice is import parity pricing (IPP) which is the pricing of a product that it would cost
to import, including notional costs such as transport and import tariffs.
Pursuant to the Growth and Development Summit (GDS) agreement to address this issue, a set of
studies on the impact of IPP on downstream manufacturing sectors and sub-sectors in the South
African economy were commissioned in various sectors. During the Nedlac Chemicals Sector
Summit process, it was agreed that a tri-partite study under the auspices of FRIDGE would be
conducted on the role of pricing practices, including IPP, in the South African Chemical sector.
One of the ways of achieving competitiveness along the value chains is to ensure competitive cost
inputs. By investigating the impact of pricing practices and other factors that affect the
competitiveness of the downstream chemical sector, the extent to which these factors contribute
to the value chain’s competitiveness or otherwise can be verified.
The aim of this study is to research the impact of pricing practices, in the chemical sector of the
South African economy with particular emphasis on the development of the sector as a whole.

FRIDGE Chemical Sector Upstream Pricing Practices – Final Report
Ozone Business Consulting (Pty) Ltd Page 40
1.2. Objectives
a) The objective of the study was to investigate and assess the impact of upstream pricing
practices on the upstream and downstream industries (including the long term). The assessment
was focused on the impact of pricing practices on the following aspects of upstream and
downstream economic performance:
• Output
• Value added
• Employment
• Investment
• Exports
b) An evaluation of the relative development of downstream chemical sectors for a range of
countries, and comparison with the status in South Africa. This comparison needed to identify any
significant underdevelopment of the SA downstream sectors. This comparison of relative
development of downstream chemical sector is called the “Reality Test” within the context of this
study. For selected Upstream/Downstream combinations, these are simply tests to find out the
relative level of development of the respective value chains. The Reality checks if there is any
correlation between the state of economic development as measured by per capita GDP with the
size of domestic consumption of the respective primary chemicals as measured by per capita
consumption.
c) The value chains to be investigated emanate from the following primary chemicals:
• Polypropylene
• Polyethylene (HDPE, LDPE, LLDPE)
• PVC
• Feedstock / raw materials for Fertilizers (phosphate rock and ammonia)
• Titanium dioxide
• Acrylic acid
FRIDGE Chemical Sector Upstream Pricing Practices – Final Report
Ozone Business Consulting (Pty) Ltd Page 41
1.3. Deliverables
The major deliverables of the study are as follows:
• Market definition of upstream chemical products
• Market structure and shares of upstream chemical producers
• Costs and pricing of upstream chemicals products
• Major downstream industries that purchase upstream products
• International competitiveness of South African chemicals pricing
• Impact of pricing on downstream purchasers
• Policy options for pricing practice
1.4. Methodology
The information required for this investigation was sourced from local and international databases
and other desk sources, as well as personal and telephonic interviews with upstream and
downstream role-players.
The interviews were conducted with respondents that were selected from upstream and
downstream participants on the basis of their relative importance in the value-chain. By focusing
on larger role-players, it was ensured that extrapolations of data accurately reflect the true nature
of the products/industry. However, some smaller SME players were also included in each product
category to identify possible price discrimination against them.
• In terms of international competitiveness of South African chemicals pricing, time series for
price comparisons were compiled over at least the last five years. The prices are reflected
in US Dollar based upon the average exchange rates of the selected economies for the
applicable periods. The sourcing of international price data was done by means of personal
contacts with international upstream companies and consulting companies to access
published contract prices. Sources of pricing data in this case included ICIS LOR, Tecnon
Parpinelli, Harriman Chemsult and Platts Polymerscan.

FRIDGE Chemical Sector Upstream Pricing Practices – Final Report
Ozone Business Consulting (Pty) Ltd Page 42
International price data collected was correlated with that collected from the relevant upstream
and downstream companies in South Africa as a means of verification.
The “Reality Test” attempts to check if there is any correlation between the stage of economic
development as measured by per capita GDP with the size of the polymer conversion sector as
measured by per capita polymer converted within a country. Data on the conversion and usage of
polymer was sourced from independent sources Tecnon Parpinelli and CMAI. Data on the country
populations and GDP was sourced from the IMF and the World Bank.
In order to analyse the impact of upstream pricing practices on downstream players an objective,
proven and validated methodology which is applicable to all types of businesses was used. A
formula developed by Modijliani and Miller, for which they won a Nobel price in 1969, called the
Economic Value Creation Model (EVC) was used to evaluate the impact of pricing practices in the
vertically integrated chemical industry. EVC = R – K, where R is the calculated return (Net
Operating Profit After Tax) and K is the cost of generating the return (Weighted Average Cost of
Capital). Any meaningful model of future performance will be influenced by assumptions regarding
asset replacement cost. It is for this reason that historic data was used in the EVC model. EVC will
provide the same result as IRR but it is easier to follow on a year by year basis. An expanded
explanation of the suitability of using EVC for measuring value in this study compared to other
methods is provided in Appendix 2.
A Demand Elasticity analysis was also done in order to check the relationship between potential
changes in prices to the quantity of products sold. This category of information reflects estimates
of the likely changes in selling prices and sales volumes for each of the product categories that
could result from price changes (i.e. increases and decreases) associated with raw material inputs
purchased from upstream producers. These estimates were used to calculate the Demand
Elasticity (i.e. changes in the quantity of products purchased) resulting from increases and/or
decreases in downstream producers' selling prices. The methodology used was based on an
analysis done by Professor Johannes Fedderke from SA Econometric Research Unit analysis,
which is entitled: “Price Elasticities in Sasol’s LDPE, LLDPE, PVC and PP markets - Assessment

FRIDGE Chemical Sector Upstream Pricing Practices – Final Report
Ozone Business Consulting (Pty) Ltd Page 43
of upstream feedstock impact on final applications and its price elasticity”. Further explanation of
this methodology and the relevance of the results thereof are provided in Appendix 1.
1.5. Problems experienced in the Research Process
A major problem experienced during the research process was the lack of co-operation
experienced from the selected downstream respondents. In contrast, most of the selected
upstream respondent companies with the exception of the fertilizer value chain, have provided
completed questionnaires within the requested timeframe.
As illustration, the following table shows the level of participation by downstream companies for
the full duration of the study:
Completed Questionnaires
Financial
Value Chain
General
Completed History*
LDPE 3 1 5 years
HDPE 4 0 n/a
LLDPE 2 1 1 year
PP 9 0 n/a
PVC 5 1 5 years
HDPE/PP 1 1 10 years
LDPE/LLDPE/HDPE 3 2 10 years
LDPE/LLDPE/HDPE/PP 1 1 9 years
Fertilizers feedstock 3 1 10 years
Titanium dioxide 1 0 n/a
TOTAL 32 8
* History means the number of historical years that the financial data was provided for.
No downstream financial data was received for the value chains HDPE, PP, Titanium dioxide and
Acrylates. This made it impossible to derive downstream EVC results for the polymers value
chains separately as proposed in the methodology. In total companies, accounting for around 30%

FRIDGE Chemical Sector Upstream Pricing Practices – Final Report
Ozone Business Consulting (Pty) Ltd Page 44
of the polyethylene market based on consumption volumes, provided financial data. However, in
the case of two companies the time period of the data did not correspond historically with the
information provided by upstream companies. This means the data was for a shorter time period.
For PVC, only one company provided financial data and the data did not correspond historically
with the information provided by upstream companies.
The general pattern by downstream companies was that of excitement upon hearing about the
study and been given an opportunity to make an input. However, once the potential respondents
saw the information requirements in the questionnaires, most of them changed their attitudes and
subsequently their response was that they would not be able to take part in the study.
The reasons advanced by the contacted companies for declining to participate in the investigation
are as follows:
• Lack of time and/or human resources to commit to the investigation [80% of all
declines]
• Upstream companies will always do what they like in terms of pricing regardless of
any interventions [10% of all declines]
• Other reasons [10%]
While it is true that some downstream companies are SMEs, and they are sometimes
understaffed, it is certainly not true for the majority of them and even more so for the relatively
large companies. However, lack of capacity was cited in most instances as the reason for not
participating for all the various sizes of downstream companies alike. All respondents (32) filled in
the general questionnaire and very few of them (8) filled in the financial questionnaire.
Contacts were made with the Executive Directors of the associations that the value chains under
investigation fall within in order to encourage their members to take part in the investigation.
Furthermore, three feedback sessions were held around the country to encourage the
downstream companies to give their submissions for this investigation. What this effort achieved
was more enthusiasm from the association members to participate in the study in the sense that

FRIDGE Chemical Sector Upstream Pricing Practices – Final Report
Ozone Business Consulting (Pty) Ltd Page 45
more came forward and expressed an interest to participate. However, once the companies saw
the information requirements the rate of declines escalated.
The number of downstream companies that responded to this investigation represents the
following levels of market coverage in the respective value chains. [The level of market coverage
was based on the respondents’ collective consumption volumes of the feedstocks under
investigation, and not on their sales.] :
• Polymers – 17% of total value chain based on consumption volumes. Operations that
submitted financial data collectively account for about 6% of total value chain based on
consumption volumes.
• Fertilizer raw materials – 90% of total value chain based on estimated non-captive
consumption volumes. Operations that submitted financial data collectively account for
about 50% of total value chain based on consumption volumes.
• Titanium dioxide – 14% of total value chain based on consumption volumes. No financial
data was submitted.
1.6. Data Sources and Accuracy
There are several reputable sources of data on international polymer prices. The ones that are
most often used in contracts or as “Reference Prices” are: ICIS LOR and Platts Polymerscan.
These sources provide weekly and monthly quotes on the prices they deem to have prevailed for
the following markets and used as Reference Prices:
• North West Europe: Delivered Prices for large domestic customers (located close to
Rotterdam) and FOB (free on board) prices for product available for exports.
• USA: Delivered Prices for large domestic customers (close to the US Gulf Coast) and FOB
prices for product available for exports from US Gulf Coast ports.
• Far East: CFR Hong Kong for product sold in all Far East and SE Asian countries.
As China has become such a large importer of all polymers, the CFR Hong Kong price is
accepted as being “at the low end of the range of international market prices”.

FRIDGE Chemical Sector Upstream Pricing Practices – Final Report
Ozone Business Consulting (Pty) Ltd Page 46
There is no accepted source of data for the market prices (or prices paid by customers) in all other
countries. In all countries the development of a market price is the outcome of discussion and
negotiation between buyer and seller around the customer’s alternate sources of supply (usually
from imports).
Trade journals are a source of data on the “price range” that is deemed to have prevailed for a
time before publication of the trade journal. The prices quoted in trade publications are not usually
used in contracts. However, they can be used by customers in negotiation with suppliers in
obtaining discounts off the supplier’s List Price.
For countries not included in the published data of ICIS LOR or Platts Polymerscan, all industry
commentators develop “proxy” market prices based on the quoted Reference Prices (e.g. CFR
Hong Kong, Del NW Europe, FOB USGC Export Prices, etc.) by developing an Import Parity Price
equivalent in the country. The Derived Import Parity Price includes all the costs a customer will
incur in importing a polymer. These include:
• Shipping
• Import duties
• Landing & clearing charges
• Warehouse charges
• Finance charges
• Any other government costs or taxes
• Transport to the user.
Polymers covered are LDPE, LLDPE, HDPE, PP and PVC for the time period: Jan 1994 – July
2005 on a monthly basis. Countries included in the initial price comparison exercise:
• South Africa (inland price paid by converters)
• USA (Gulf Coast)
• North West Europe – delivered users close to Rotterdam
• China

FRIDGE Chemical Sector Upstream Pricing Practices – Final Report
Ozone Business Consulting (Pty) Ltd Page 47
• India
Price Comparison Basis: Price paid by polymer converters on a delivered basis in US$ per tonne.
For South Africa, the price is the “average price for all polymer sold during the month”.
For USA and NW Europe, it is the delivered price paid by large customers relatively close to
Rotterdam. For China and India, it is the derived import parity price for large customers.
Note: The import parity price is the accepted and established way of estimating the market price
in these two countries (China and India).
Source of Data:
• South Africa: Upstream - Sasol Polymers, Dow Chemicals and Importers. The published
results of Sasol Polymers as a business unit within the Sasol group were consistent with
the raw data presented to the consultants for the EVC calculations. In addition, Sasol
Polymers offered to have the information submitted to consultants audited for accuracy by
an independent audit company.
• Historical pricing data received from the upstream and downstream data was comparable
with historical pricing data provided by international consultants and sources. Historical
pricing data as used in the study was therefore verifiable and thus reliable.
• EVC conclusions relating to the upstream are based on financial data supplied by them.
Similarly, the downstream EVC conclusions are based on the financial data received from
the downstream companies that responded.
• USA and NW Europe: ICIS LOR, Platts Polymerscan, Harriman Chemsult and Tecnon
Parpinelli.
• China and India: Derived Import Parity Prices using methodology and assumptions
approved by independent international consultants.
The Reference Prices from ICIS LOR and Platts Polymerscan are considered 100%
reliable/accurate as Reference Prices. However, customers can and will negotiate discounts off
the quoted Reference Price.

FRIDGE Chemical Sector Upstream Pricing Practices – Final Report
Ozone Business Consulting (Pty) Ltd Page 48
As the prices reported for South Africa are “average monthly prices for all polymer sold in the
month”, the prices will be higher than the Derived Import Parity Prices for China and India as
these are developed from a Reference Price that is applicable to large customers.
The Derived Import Parity Prices for China and India estimated by the consultant are considered
to be accurate within +/- 5% for any month, but over a longer period (i.e. annual averages) the
error range is lower. The reasons are:
• Shipping costs could be different from that used by the consultants.
• Periodically, there are parcels of “distressed cargoes” that are made available at less than
the prevailing Reference Price.

FRIDGE Chemical Sector Upstream Pricing Practices – Final Report
Ozone Business Consulting (Pty) Ltd Page 49
2. POLYPROPYLENE
2.1. Market definition of upstream chemical products
a) Introduction
Polypropylene (PP) in primary, or unconverted, form is part of the Primary Polymer and Rubber
sub-sector of the chemical industry. Polypropylene is the fastest growing commodity polymer
category globally, and is only surpassed by polyethylene in market size. PP has a very low density
and good mechanical properties [especially when filled or compounded], and is therefore very
suitable for sectors where large volume, cost & weight are issues.
b) Value chain
PP is made by means of the catalytic polymerisation of pure propylene, usually in large, integrated
plants that are operated on a continuous basis. Propylene feedstock is primarily obtained from
large olefin crackers, using crude-oil refinery based streams. Smaller quantities are also directly
recovered from refinery streams. South Africa has unique propylene supply from the Fischer
Tropsch synthetic fuel technology employed by Sasol in Secunda. Fischer Tropsch process
streams are relatively rich in recoverable propylene. Smaller quantities of propylene feedstock are
also recovered from conventional refinery operations. The value chain for PP is summarised in the
diagram below:

FRIDGE Chemical Sector Upstream Pricing Practices – Final Report
Ozone Business Consulting (Pty) Ltd Page 50
Figure 2.1: Polypropylene Value Chain
c) Applications and Global Market Size
In 2004, global PP production grew to 38 million metric tons operating at 89% of active capacity,
with an estimated value of $33 billion. This level of production represents an average annual
growth of 6.8% from the 1998 level. (Source: SRI Consulting)
The estimated breakdown of global application of primary polypropylene is shown in the diagram
below:
Polypropylene Primary polymer – produced by Sasol Polymers in Secunda and Dow Plastics in Sasolburg
AutomotivePlastic
Products
Other plasticProducts
Propylene – globally mainly from olefin cracking operations
But in SA primarily supplied by Sasol ex Fischer Tropsch
PackagingPlastic
Products
Plastic conversion processes:Injection moulding, Blow moulding, Extrusion, etc.

FRIDGE Chemical Sector Upstream Pricing Practices – Final Report
Ozone Business Consulting (Pty) Ltd Page 51
Figure 2.2: Global Application of Primary Polypropylene
0%
20%
40%
60%
80%
100%
North
America
Western
Europe
Japan China Other Asia Other
Regions
Other Unidentified Blow Moulding
Film and Sheet Fibres and Filament Injection Moulding
Source: SRI Consulting
Injection moulding and fibre and filament are the world's largest end uses for PP, at 33% and
29%, respectively, followed by film uses at 18%. As demonstrated above by the geographic
breakdown of consumption patterns, there are wide differences in the end-use patterns of PP
across regions and countries.
The injection moulding end-use category seems to be inversely related to the maturity and overall
growth of consumption in countries and regions. That is, as a country/region matures and growth
slows, the PP end-use breakdown shifts toward injection moulding, perhaps because moulding
growth is a function of inter-material substitution, which takes time to take hold.
Transportation constitutes one of the major end-use markets for injection-moulded PP. Numerous
other types of products are injection moulded from PP, including container caps and closures,
appliance parts, disposable syringes and a wide variety of household and miscellaneous products.
Polypropylene's very low density (0.89-0.91 gram per cubic centimetre) combined with its good
mechanical properties (especially when talc-filled or compounded with EPDM elastomers) and

FRIDGE Chemical Sector Upstream Pricing Practices – Final Report
Ozone Business Consulting (Pty) Ltd Page 52
injection-moulding characteristics make it especially suitable for the large-volume cost- and
weight-conscious automotive market.
In the textiles fibres arena, PP is used in carpet backing and has a strong growth market in carpet
face yarn, particularly in the United States. Polypropylene fibre also plays an important part in the
non-wovens market, an end use that continues to experience rapid growth in virtually all regions of
the world.
Polypropylene film provides excellent optical clarity and low moisture vapour transmission,
enabling it to be used in snack food packaging, pressure-sensitive tape backing and labels.
Smaller markets for PP films include a diverse group of product areas such as shrink-film over
wrap, capacitor and other electronic industry films, photo and graphic arts applications, soft-goods
over wrap and disposable diaper tabs and closures.
d) Impact of different product grades or performance specifications on market
applications
The main grade of PP is homopolymer, or pure unfilled or compounded product. Homopolymers
are polymers formed from a large single monomer unit (molecule), with a long chain of the same
monomer units. Homopolymer PP is a translucent, crystalline polymer that exhibits high stiffness,
good impact strength at room temperatures, and good electrical insulation properties. The
commercial grades of polypropylene homopolymer are available in a wide range of melt flows and
molecular weight distributions. Homopolymer grades of polypropylene are available for various
fabrication processes such as injection moulding, sheet and thermoforming, bi-axially oriented film
(BOPP), capacitor film, fibre spinning, and slit tape. Suppliers such as ExxonMobil offer speciality
grades of homopolymer PP that claim superior properties in specific applications such as
thermoforming.
PP is co-polymerised with ethylene, for a PP with increased toughness at ambient and below zero
temperatures. PP is also compounded with elastomers such as EPDM to obtain high-impact
properties, and also filled with glass or minerals such as chalk, mica and talc. This typically

FRIDGE Chemical Sector Upstream Pricing Practices – Final Report
Ozone Business Consulting (Pty) Ltd Page 53
reduces cost and cycle times, and also imparts mechanical strength and dimensional stability to
end products [e.g. garden furniture].
e) Level of competition in supply for major geographic export markets for upstream
products
There are a large number of PP plants in operation globally. The major companies include Dow
Chemical, Exxon Mobil, Basell, Sabic, BP, Atofina, Borealis, Sinopec, Equistar and Formosa.
2.2. SA Market structure and shares of upstream chemical producers
2.2.1. Domestic industry structure
a) Feedstock for Polypropylene production
Polypropylene (PP) is manufactured from propylene monomer. Propylene supply in SA is
concentrated with only two suppliers, namely Sasol Secunda and Sapref [Shell/BP] in Durban.
Sasol’s capacity is currently around 530 000 t/a and Sapref around 32 000 t/a. However, Sapref’s
supply in 2003 was only 20 000 t/a. There is a possibility of further propylene extraction in Durban.
The Sasol Project Turbo that was approved in late-2003 will add a further 430 000 t/a propylene
capacity.
b) Polypropylene Production
Polypropylene supply in SA is also concentrated with only two suppliers, namely Sasol Polymers
in Secunda, and Dow Plastics in Sasolburg.
Sasol Polymers’ PP is produced by reacting propylene over a titanium based catalyst (Ziegler
Natta catalyst) in a gas phase reactor, utilizing BASF technology (BASF’s technology was
acquired by Novolen Technology Holdings who now develops and licenses this technology).
Stringent control of temperatures, pressures, additive, catalyst and other hydrocarbon streams
ensure that a quality finished product is produced.

FRIDGE Chemical Sector Upstream Pricing Practices – Final Report
Ozone Business Consulting (Pty) Ltd Page 54
The polymer production capability of the PP plant is 230 000 tpa (original capacity 120 000 tpa). A
flow diagram of the manufacturing process is as follows:
Figure 2.3: Polypropylene – Sasol Polymers Flow Diagram
Feedstock Final Product
FeedPurification
PropyleneReactor(Train 1)
Degassing(Train 1)
CatalystCo-catalystChemicals
Blending(Train 1)
Extrusion(Train 1)
ProductionStorage
Silos
PPBagging
PPWarehouse
PPLoading Bay
PPCustomers
PPBulk Silos
Hydrogen
Reactor 1(Train 2)
Reactor 2(Train 2)
PP Resin
PP Resin
Additives
Degassing(Train 2)
Blending(Train 2)
Extrusion(Train 2)
Hydrogen
Hydrogen
Ethylene
Pentene
Carrier vent gas toMonomers for purification
Dow Plastics has an estimated PP production capacity of 120 - 130 000 t/a. A schematic diagram
of the Dow Plastics process, demonstrating the complexity, is shown below:

FRIDGE Chemical Sector Upstream Pricing Practices – Final Report
Ozone Business Consulting (Pty) Ltd Page 55
Figure 2.4: Polypropylene – Dow Plastics Schematic Diagram
c) Polypropylene Market
The SA market size in 2004 for polypropylene primary polymer used in local plastic conversion
was estimated at 223 000 tons, of which 93.7% was supplied by local producers. Local uses
include appliances, batteries, automotive, buckets, chairs & furniture, closures and caps, food
containers, woven packaging/bags, fibres. The breakdown of the market is demonstrated in the
following diagram.
C 3
Reactor
FeedTEAL
Donor
Catalyst
Oil &
Grease
Baby-Loop
Prepolimerisation
High Pressure
Degassing
Low Pressure
Degassing
PK501
Dryer
Steamer
Atmer
Flash Drum
Bagfilter
Gasphase
ReactorE-301
PK-301
D-201
E-301D-301
R-201
T-301
R-202
D-202
R-200
D-502
T-502
T-501
T-302
F-301
D-501
PK-301
R-401
D-302
T-402
D-106
Silo’s
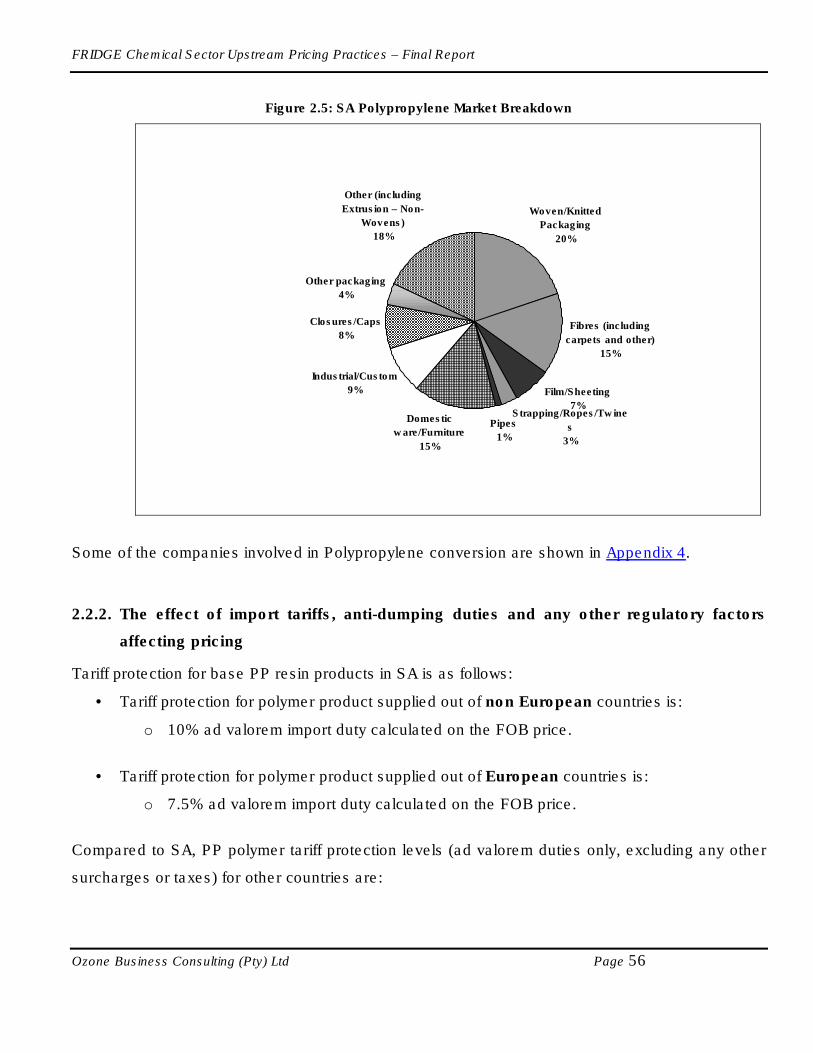
FRIDGE Chemical Sector Upstream Pricing Practices – Final Report
Ozone Business Consulting (Pty) Ltd Page 56
Figure 2.5: SA Polypropylene Market Breakdown
Woven/Knitted
Packaging
20%
Fibres (including
carpets and other)
15%
Strapping/Ropes/Twine
s
3%
Domestic
ware/Furniture
15%
Industrial/Custom
9%
Closures/Caps
8%
Other packaging
4%
Other (including
Extrusion – Non-
Wovens)
18%
Pipes
1%
Film/Sheeting
7%
Some of the companies involved in Polypropylene conversion are shown in Appendix 4.
2.2.2. The effect of import tariffs, anti-dumping duties and any other regulatory factors
affecting pricing
Tariff protection for base PP resin products in SA is as follows:
• Tariff protection for polymer product supplied out of non European countries is:
o 10% ad valorem import duty calculated on the FOB price.
• Tariff protection for polymer product supplied out of European countries is:
o 7.5% ad valorem import duty calculated on the FOB price.
Compared to SA, PP polymer tariff protection levels (ad valorem duties only, excluding any other
surcharges or taxes) for other countries are:

FRIDGE Chemical Sector Upstream Pricing Practices – Final Report
Ozone Business Consulting (Pty) Ltd Page 57
Table 2.1: Polypropylene – Tariff Protection in Other Countries
Country Duty basis on: PP
United States FOB 6.5%
China CIF1 9.7%
Japan CIF 6.5%
Canada n/a None
Indonesia CIF 10.0%
Chile CIF 8.0%
Australia FOB 5.0%
Malaysia CIF 30.0%
India CIF 10.0%
2.2.3. The global nature of the industry
PP is produced in a range of grades [e.g. homopolymer, impact copolymer and random
copolymer], but in general is regarded as a commodity product that is produced by many countries
and is well-traded in large volumes (10 million tons/annum – 45 times the SA market) around the
globe, demonstrating its global nature. Global prices are determined by supply/demand basis on a
global scale, but are particularly driven by the Far East, due to the availability of low-cost product
and ill-considered expansions in the 1990’s in countries such as Korea, as well as the ever-
growing demand from China. Global plant sizes are also increasing, due to economies-of-scale
issues.
2.3. Costs and pricing of upstream chemicals products
2.3.1. The cost structure of the industry and global comparison
The cost structure of SA based operations is not directly comparable to international PP
operations, in that:
1 It should be noted that CIF prices are higher than FOB, based upon freight and insurance costs. A duty on a CIF prices is therefore effectively higher than a similar duty on a FOB price

FRIDGE Chemical Sector Upstream Pricing Practices – Final Report
Ozone Business Consulting (Pty) Ltd Page 58
a) Both PP producers have integrated operations that are manufacturing both PP and
polyethylene.
b) In the case of Sasol Polymers, the production infrastructure includes an olefin purification
operation that purifies ethylene and propylene that is obtained in crude form from the Fischer
Tropsch process – this is a unique operation on a global basis.
The relative cost structures for SA based operations, compared with standard global PP
operations are shown in the figure below. The international PP information is based on SRI
consulting data – US Gulf Coast.
Figure 2.6: Relative PP Cost Structures – SA and International (US Gulf Coast)2
0102030405060708090
100
South Africa International
Olefin Feedstock Other Cost
Labour Selling and overheads
Based upon these cost structures, feedstock in SA’s case is a lower portion of total costs, while
other costs, which include variable and fixed manufacturing costs, but no depreciation, are higher
in SA’s case. It should be noted in SA’s case the feedstock used is not polymer grade propylene,
but the raw propylene condensate supplied to the Sasol Polymers purification unit from the Sasol
2 It should be noted that in absolute terms SA’s cost base is higher due to relatively small plant sizes

FRIDGE Chemical Sector Upstream Pricing Practices – Final Report
Ozone Business Consulting (Pty) Ltd Page 59
Secunda upstream operations. The transfer cost mechanism of this feedstock stream has not
been analysed in this report.
2.3.2. SA Production Advantages & Disadvantages
SA advantages include:
• Sufficient and cost competitive propylene feedstock based upon Fischer Tropsch synthetic
fuel upstream operations.
• Globally competitive polymer production technology and facilities.
• Well-developed downstream converter sector with widespread end-product applications.
SA disadvantages include:
• Relatively small local and regional market.
• Long distance from attractive export markets.
• Inland location of production facilities in the case of exports.
2.3.3. Upstream pricing practices with respect to downstream domestic purchasers
Local PP producers sell polymer products to customers in markets which include the RSA and
other African countries, Asia, USA, Europe and South America. Their policy is to sell at the market
price prevailing in each of these regions, and this also applies to sales in South Africa.
It should be noted that the local F.O.B price is not the price paid by these export customers. The
following serves as an example for PP:
- Average local delivered price: R7.23/kg in South Africa.
- In 2004 average F.O.B. price under tariff 39.02.10 to all destinations was R5.93/kg (98 938 tons;
R587 million).
- The major country that SA exported to was Hong Kong: average F.O.B. price of R5.71 (18 924
tons)
- The difference between local delivered prices and F.O.B price to Hong Kong was around 21%

FRIDGE Chemical Sector Upstream Pricing Practices – Final Report
Ozone Business Consulting (Pty) Ltd Page 60
- Selling in Hong Kong requires logistical costs, duties/tariffs, inland distribution and agent’s
commission. Comparative delivered prices between countries/regions as shown by Figure 2.11 in
particular reveal that the prices are set by the market.
The producers use all relevant information at their disposal to prepare for the price negotiations in
order to offer a competitive price. The price is negotiated and takes into account inter alia:
• competitive offers from other suppliers (prevailing market price),
• the quantities purchased by a customer and the costs associated with such quantities,
• requests for export or development assistance,
• distribution costs for different packaging types (viz. bags, bulk or semi-bulk),
• Sasol Polymers’ total offering (commercial, product, technical and service components),
and
• Competing alternatives whether these are substitute materials (glass, wood, paper) or
imported finished products.
The validity of these prices is part of the negotiations and can be adjustable month by month or,
quarter by quarter, or fixed for longer periods (typically less than 6 months). Generally, there is a
price continuum across the customer base. It should be noted though that over a relatively long
period average delivered prices compared to average calculated prices of imports on an import
parity basis would be fairly close to each other.
Included in producers’ offering is a technical and engineering service, which is available to all
customers. This technical and engineering service covers the following aspects:
• product and application development,
• engineering expertise for converter’s equipment modification,
• technical expertise for use of complementary products,
• assistance with operation problems, and
• problem solving on converters equipment.
In order to fully explain the PP producers’ domestic pricing policy, a description of global polymer
price mechanisms and their impact on South African domestic polymer prices will be further
FRIDGE Chemical Sector Upstream Pricing Practices – Final Report
Ozone Business Consulting (Pty) Ltd Page 61
discussed. In Appendix 3 a detailed description of international pricing practices, based upon
reference prices, is shown.
a) Europe and USA Polymer Prices:
The domestic prices of the commodity polymers (LDPE, LLDPE, PVC and PP) in Europe and the
USA are targeted at levels that provide adequate long term returns on investment to producers
investing in new plants. These targeted price levels are generally achieved because the markets
are large, there are several domestic producers and levels of “dumped” imports are relatively low.
In times when installed production capacity exceeds demand, which is the norm for most of the
price cycle, high cost producers are barely able to cover their costs and cut back supply
accordingly, while those with a lower cost base will achieve a low return. During these periods,
little re-investment occurs because of the low returns and, as demand increases with time
(normally 5-6 years), a stage is eventually reached where demand exceeds installed production
capacity. At this time prices rise rapidly and high margins are earned prompting new capacity
investment and within 1-2 years, another situation of excess capacity and subsequent low margins
exists. Historically, this price cycle repeats itself every 6-8 years.
It is important to note that polymer producers’ returns are seen over entire price cycles. The high
returns earned for short periods during the peaks of price cycles, and the inadequate returns
experienced during the trough, balance out the average return for the polymer producers. Hence,
earnings during the peak should not be seen in isolation, nor viewed as excessive. This need for
an adequate long term average return on investment is typical of the international polymer
industry and applies to all regions, including South Africa. This is because the polymer market is
effectively a single global market and the same price cycle applies to all producers in all regions of
the world that trade with each other.
b) Far East Polymer Prices:
Until the early 1990s, prices of polymers in the Far East were set out of the USA and were
generally higher than in either Europe or the USA. When the Korean petrochemical expansions
occurred, these resulted in overcapacity in the region and a hunger for market share that eroded

FRIDGE Chemical Sector Upstream Pricing Practices – Final Report
Ozone Business Consulting (Pty) Ltd Page 62
margins. As a result, since the mid-1990s, prices in the Far East have been generally lower than
either Europe or the USA, and in many instances, at a level that barely covers the costs of raw
materials and failed to adequately reward the investment to a Far East producer.
c) Middle East Polymer Prices:
In recent years the very large polymer plant investments in the Middle East have had an influence
on the global supply/demand balance. Most of this production is exported into China and is
economically viable at the Far East price levels due to low feedstock costs and very efficient
economies-of-scale. The Middle East producers generally adopt a “price follower” strategy as
determined by market competition in the Far East and other export destinations.
d) South African Polymer Prices:
As with all regions in the global market, polymer prices are determined relative to the competitive
forces acting in the particular region. In order for a supplier to be successful in penetrating the
market and sustaining a market share position, the customers’ alternative purchasing options
must be considered and a competitive offering made.
South African polymer producers follow the above approach. They do not select a particular price
from a particular region and rigorously apply that to determine its price to the South African
domestic market. They are driven by market dynamics and react to the lowest price imports being
offered by competitive suppliers to its customers. Prices of locally manufactured substitute
materials, such as paper, metal and glass, are also monitored and considered for the market
sectors where they compete as alternatives to polymers.
During recent years, the competitive supplies have come from the Far East and the Middle East
and they therefore normally set the price levels in the South African domestic market. Hence Far
East prices are typically monitored and tracked as defined by Hong Kong CFR prices. Because
traded volume of polymer through Hong Kong (destined for China) is active, substantial and
continuous, this is a reliable, well reported and globally recognized competitive source which is
used to monitor international price trends.

FRIDGE Chemical Sector Upstream Pricing Practices – Final Report
Ozone Business Consulting (Pty) Ltd Page 63
SA PP producers regularly monitor the published international polymer price data and in addition,
they are either active in both exporting and importing of commodity polymers, or they are part of a
major multinational polymer producer and are able to supplement the published information with
their own trade experience. Competitive pricing information is also obtained from customers
during supply negotiation discussions and is often used in preference to the data obtained from
the trade consultants mentioned above.
The above discussed points form the basis for the market price and hence for the customer price
negotiations.
In addition, the local cost of feedstock (propylene in the case of PP), also has to be taken into
consideration. In the case of Dow Plastics, this price is determined by Sasol Polymers, which is
their major source of the feedstock.
e) Rebates and discounts
The major rebate category on PP is for export of customer/finished goods. Export rebates are
given to encourage customers to convert the exported product to finished goods and exporters
themselves export the value added finished goods.
There are special pricing schemes available to all customers (large and small) and include:
• Rebates for the development of new products and markets to compete with alternative
materials,
• Rebates to compete with imports of finished goods,
• Rebates for exports of finished goods (export rebate), and
• Rebates for early settlement.
The first two rebate schemes are available for a specific application or development; are
applicable for a limited period and limited to the volume for the specific purchases (that is not
across the full volume of polymer purchased). These rebates are specifically designed to facilitate
or assist:

FRIDGE Chemical Sector Upstream Pricing Practices – Final Report
Ozone Business Consulting (Pty) Ltd Page 64
• Converter development and introduction of products into the market by reducing the cost of
the raw material during the early stages of the product life cycle (namely development,
market introduction and acceptance),
• Converter competitiveness in the export market to overcome competitors who may have
geographic, labour cost, governmental incentives, fiscal or other competitive advantages,
or
• Converters to be more competitive in the local market against final product imports from
international converters (which is sometimes dumped) who have labour cost, governmental
incentives, fiscal or other competitive advantages.
The early settlement rebate scheme is to encourage customers to reduce the credit terms, which
is mutually beneficial to both supplier and consumer.
Analysis of the downstream responses showed that the uptake of the rebate schemes mentioned
above is on a case by case basis. One upstream respondent mentioned that 10% of volumes sold
(not customers) are making use of the export rebate schemes. This is verifiable by the export
data.
f) Upstream suppliers’ view on Actual Pricing Mechanism Versus Import Parity Pricing
The pricing mechanism prevailing in South Africa is one where the price is negotiated, based on
offers in an open market where products are readily traded across national boundaries. The
outcome is that the most competitive supplier sets the price and it is better referred to as market
pricing. The pricing methodology is commonly seen internationally in most countries that are
signatories to the WTO. It prevails in countries with a free, open-access market, rather than the
regulated price-setting typically found in centrally planned economies. In South Africa this
situation is no different as locally produced products compete with imports. The advantage of this
method of pricing is that it directly links the domestic price to the international reference prices
(See Appendix 3). It also brings a country’s pricing practices in line with all the countries that are
signatories to the WTO and its rules on trade and eliminates the creation of subsidies throughout
polymer value chain.
FRIDGE Chemical Sector Upstream Pricing Practices – Final Report
Ozone Business Consulting (Pty) Ltd Page 65
An aspect that should be borne in mind is that the price of the imported product is typically set by
the spot price of another region, which is substantially lower than that region’s domestic price, as it
is set by producers only needing to cover their marginal operational costs. The international
domestic prices are normally “delivered prices”. In most producing countries the domestic supply
typically consume a significant portion of the producers’ volume, so enabling the export volumes
to be priced using marginal costing. This results in domestic delivered prices in countries that
compete through trade, having domestic delivered prices that are broadly in the same range, as is
the case in South Africa. This is due to the combination of freight and duty values not being too
dissimilar to the difference between domestic price and spot in the exporters’ market. However, it
should be noted that in producing countries where average costs are fairly constant (as it in the
case in the South African polymer manufacturing industry), marginal costs are usually equal to
average costs. Also, in South Africa’s case, variable costs are higher than the international norm
because of poor economies of scale. It should also be noted that where marginal costing is
practiced it is used only in the short term.
The actual pricing mechanism in SA can therefore be regarded as a “Market Reference Pricing”.
A definition for the SA market reference pricing is as follows:
A market reference price is where the price is negotiated based on offers in an open market where
products are readily traded across national boundaries. The outcome is that the most competitive
supplier sets the price, which results in a direct link between the domestic price and the
international reference prices.
A definition of Import Parity Pricing is as follows:
An import parity price is a mechanistic formula-based calculation which is done by specifically
calculating a price based on what it would cost to import the product. The inputs into the formula
include the following: a reference price for the product (usually on an FOB basis), all costs
associated with transporting the product to a port in South Africa, import duties & taxes, landing

FRIDGE Chemical Sector Upstream Pricing Practices – Final Report
Ozone Business Consulting (Pty) Ltd Page 66
and clearing costs, inland transport costs, storage costs and local delivery costs. For example,
the cost of fuel in South Africa is determined via a formula-based IPP.
The difference between market pricing and import parity pricing is that in the case of the former
prices change continuously based on the cheapest available source at a particular point in time. In
the case of import parity pricing, the price is calculated on the basis of a published price in a
specific region or country and the ultimate price is formula-based. Furthermore, in the case of
market pricing, customers monitor prices from all major trading regions and the lowest price
available at any point in time is then used by them as a basis for negotiations with their polymer
supplier.
The breakdown below gives an example of how an import parity price is calculated:
Table 2.2: Polypropylene – Import Parity Price Calculation
Estimated Import Parity Price
= FOB (lowest cost source)3 Based on published information
(ICISLOR, Platts or Harriman)
+ Freight from source to Durban (South
Africa)
Cost to get polymer to South Africa
+ Freight insurance Insurance on goods in transit
Convert to Rands Above normally quoted in US Dollars
+ Logistic costs includes
• Landing cost • Transport cost (Inland / coastal) • Duty (ad valorem duty on FOB
price in rands)
Landing Costs comprise of terminal
handling costs, wharfage – Cargo
dues, Carrier service fee, Agency fee,
Handover and document fees and
disbursements on landing and
wharfage, and duty and customs
3 A FOB (free on board) is a INCO 2000 term, in which the responsibility of the supplier is transferred to the buyer
when the goods have been delivered on the rail of named carrier at a named port. As discussed, FOB prices are
normally spot sale values and are lower than the corresponding domestic price, as the prices are normally based on
the producers marginal cost of production.

FRIDGE Chemical Sector Upstream Pricing Practices – Final Report
Ozone Business Consulting (Pty) Ltd Page 67
VAT.
Transport costs for inland would
include container turn in and railage.
Transport cost for coastal would
include cartage to customer.
Duty currently 10% of FOB price.
+ Indirect costs Adjusts for example stock holding
costs, payment terms, LC costs,
container destuffing and warehousing
costs
Based upon the schedule shown above, the actual calculated IPP price for PP in July 2005 is
shown in the following table:

FRIDGE Chemical Sector Upstream Pricing Practices – Final Report
Ozone Business Consulting (Pty) Ltd Page 68
Table 2.3: Polypropylene – Methodology and Assumptions Used in Establishing a Derived Import Parity Price
in Selected Countries Based on the Reference Price4
Price Linkages and Derived Import Parity Price in Selected Countries
Polymer: PP
Period: Jul-05 Domestic
Reference Prices
Country ---------------------> RSA China India Australia S. Korea Taiwan Turkey Brazil USA NW Europe
Source of (Marginal) Polymer Imports (1) Unit SK/Sing Sing/SK/Aus RSA/Sing/SK SK ME/Sing Sing/SK/Aus NW E/RSA USA
Reference Price: Point of Reference CFR HK CFR HK CFR HK CFR HK CFR HK CFR HK FOB NW E FOB USGC
Reference Price $/tonne 1,028 1,028 1,028 1,028 1,028 1,028 994 961Transport Adjustment to Ref Price (2)
See Note (3) (4) (5) (6) (7) (8) (9) (10)Quantum of Adjustment 50 10 35 45 10 15 45 45
CFR Port 1,078 1,038 1,063 1,073 1,038 1,043 1,039 1,006
Handling & Clearing % of CFR 1.5% 1.0% 1.5% 1.5% 1.5% 1.5% 1.5% 3.0%
$/tonne 16 10 16 16 16 16 16 30Import Duty % of CFR 10.0% 9.7% 10.0% 5.0% 10.0% 10.0% 10.0% 15.0%
$/tonne 108 101 106 54 104 104 104 151
Transport to Converter $/tonne 25 75 55 20 20 20 20 15
Other Costs $/tonne 21 <--Ave:
Del Cost to Converter $/tonne 1,227 1,224 1,262 1,163 1,177 1,183 1,178 1,202 1,202 1,244 1,097% of Ave 102% 102% 105% 97% 98% 98% 98% 100%
Additional Notes ------> (11)
Notes:
1.2.
3.
4.
5.
6.
7.
8.
9.
10.
11.
SK = S. Korea, ME = Middle East, Sing = Singapore, NW E = NW Europe, USGC = US Gulf Coast, Aus = Australia
This is the amount that is added to the Reference price to get the CFR Port Value
Marginal imports into South Africa come from S.Korea and these have tended to set the CFR price of imports. This is expected tocontinue for some time. The quantum assumed is the estimated cost of shipping polymer to South Africa, less the estimated cost
of shipping from Korea to Hong Kong.
While polymer is imported from a number of sources, the CFR China price is set by the CFR Hong Kong Reference Price plus
an amount equivalent to shipping from Hong Kong to a port in China.
India's marginal imports seem to come predominantly from Singapore, South Africa and South Korea. There is very little PP produced in
the Middle East. The quantum is set by the cost of shipping from South Korea, less the estimate cost of shipping from Korea to HK.
While Australia is a net exporter of PP, the prices are set by the marginal imports from South Korea on the same basis as the prices set
in China and India.While South Korea is a net exporter of PP, the prices are set by cost of imports (from Singapore, Thailand and Australia) with reference
to the CFR Hong Kong Reference Price.
The prices in Taiwan are set by the CFR Hong Kong Reference Price plus the cost of shipping from Hong Kong.
The price in Turkey is set by the cost of imports from NW Europe.
The price in Brazil is set by the cost of cost of polymer imported from the USA.
The additional costs in India are: Special Ausiliary Duty (2%) and higher clearing charges.
As at July 2005, marginal imports of Polypropylene into South Africa came from South Korea and
therefore these have tended to set the CFR price of imports in South Africa. This situation (source
of marginal imports) is expected to continue until one region/country has more surplus production
that would be exported at marginal costing at a lower landed price. This means the CFR price of
imports into South Africa changes continually over time. Similarly, South Africa is also a player in
marginal imports into other countries.
4 Please note that the Reference Price is normally a spot price of a particular region or country. It is not arrived at by
using a particular formula. There are three Reference Prices that have evolved for the global polymer industry that are used as the basis for setting prices in developing countries and regions. Those are CFR Hong Kong, FOB US Gulf Coast and FOB North Western Europe.

FRIDGE Chemical Sector Upstream Pricing Practices – Final Report
Ozone Business Consulting (Pty) Ltd Page 69
2.4. Major downstream industries that purchase upstream products
2.4.1. End-use structure
The local PP polymer market of 223 000 tons/annum in 2004 is supplied in more or less equal
volumes by Sasol Polymers and Dow Plastics, with imports accounting for around 6% of the
market. The end-use structure for PP polymer is segmented into the grade of polymer used, as
well as the conversion technology employed.
The major PP grade is homopolymer, which accounts for 70% of the market. Homopolymer is
mainly used in extrusion processes (80%) for applications such as artificial hair, BOPP, fibres,
film, flooring, sanitary ware (non-wovens), ropes and twine, stationary, strapping and woven cloth.
Moulding processes (injection and blow moulding) account for 20% of homopolymer consumption,
and is used in applications such as appliances, chairs and closures.
The other main PP grade is copolymer, which accounts for 28% of the market. Copolymer is
mainly used in extrusion processes (10%) for applications such as pipe and twin walled
applications. Moulding processes (injection and blow moulding) account for 90% of copolymer
consumption, and is used in applications such as automotive, batteries, buckets (water based
paint, industrial packaging), crates, house wares, food containers, pallets, pipe fittings and
furniture.
Random copolymer accounts for only 2% of the market and is used for moulded cosmetic
containers and food containers (75%), as well as coating for hot fill application (25%).
In most downstream applications there are many converters, although major companies tend to
dominate in each application sector. However, the segmentation threshold between large and
small customers is the ability of the customers to take full truck loads of polymer per order. For
PP a full truckload represents 33 tons, and on average more than 87% of the total supply volume
is for more than the threshold minimum order quantity. Both PP polymer producers employ
distributors for customers that require less than a full truckload per order.

FRIDGE Chemical Sector Upstream Pricing Practices – Final Report
Ozone Business Consulting (Pty) Ltd Page 70
PP polymer is used to manufacture a large range of end-products, including packaging products
such as crates and buckets, textile products such as carpets, non-wovens and netting,
construction products such as sheeting, as well as many other types.
The figure below indicates for few product categories the historical growth in output, as supplied
by a small number of downstream respondents.
Figure 2.7: Historical SA Sales – PP Derivatives
0
5000
10000
15000
20000
25000
2000 2001 2002 2003 2004
Year
Metr
ic t
on
s
Solid sheeting Corrugated sheeting Chairs Other
The above figure is based upon a small sample, but it still indicates a positive growth pattern for
the products included (this is supported by sales volumes provided by upstream producers).
Growth is attained by both general market growth, as well as new applications. This illustrates the
significant growth that PP based products experienced in general around the world, but also
specifically in SA.

FRIDGE Chemical Sector Upstream Pricing Practices – Final Report
Ozone Business Consulting (Pty) Ltd Page 71
2.4.2. Impact of feedstock cost on total cost structure
Based on limited respondent input, PP polymer accounts for 50 – 73% of Cost-of-sales, with the
balance shared between other manufacturing costs (mainly labour), and
sales/administration/distribution costs.
2.4.3. Organisation of downstream players
The Plastics Federation of South Africa (PFSA) is an umbrella body for the plastics value chain
under which there are several associations. The Plastics Converters Association (PCA)
represents the interests of converters in the plastics industry. The PCA is the biggest association
in terms of membership with 316 members. There are also associations such as the South African
Polymer Importers Association (SAPIA) that represent the interests of 12 importers in the industry.
SAMPLAS is an association that represents 14 suppliers of machinery to the plastics industry
while the Plastics Institute of South Africa (PISA) represents individuals in the industry. Other
associations or interest groups in the plastics value chain are Association of Rotational Moulders
of South Africa (ARMSA) which has a membership of 43 companies 13 of which are outside of
South Africa, Expanded Polystyrene Association of South Africa (EPASA), South African Plastic
Pipe Manufacturers Association (SAPPMA), and Institute of Materials (IoM). The following
associations still exist but are no longer active in the plastics industry, Plastic Mould Makers
Association (PMMA), Polyurethane Association of South Africa (PASAF), and Plastic Distributors
Association of South Africa (PDASA).
2.4.4. Downstream sector ability to influence input prices received
Downstream respondents indicated that they have very little leverage to influence prices for PP
polymer, even though there are two local producers. One the reason offered is that not all grades
are being offered by both suppliers.
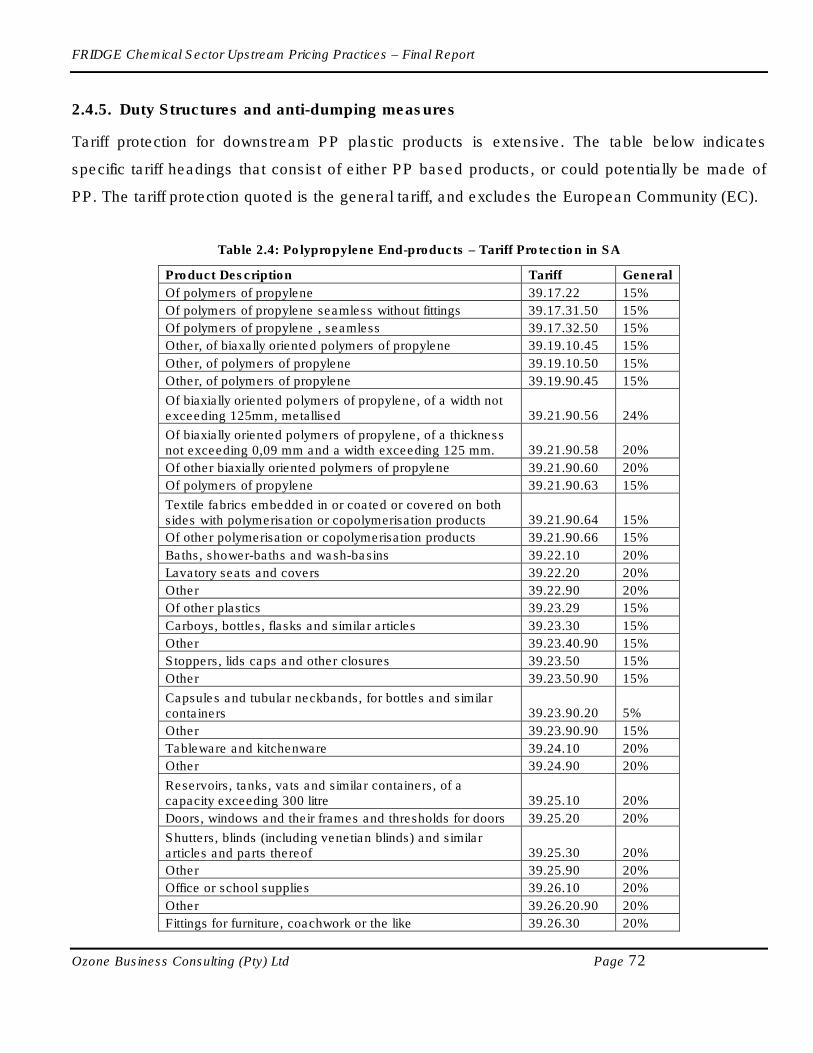
FRIDGE Chemical Sector Upstream Pricing Practices – Final Report
Ozone Business Consulting (Pty) Ltd Page 72
2.4.5. Duty Structures and anti-dumping measures
Tariff protection for downstream PP plastic products is extensive. The table below indicates
specific tariff headings that consist of either PP based products, or could potentially be made of
PP. The tariff protection quoted is the general tariff, and excludes the European Community (EC).
Table 2.4: Polypropylene End-products – Tariff Protection in SA
Product Description Tariff General
Of polymers of propylene 39.17.22 15%
Of polymers of propylene seamless without fittings 39.17.31.50 15%
Of polymers of propylene , seamless 39.17.32.50 15%
Other, of biaxally oriented polymers of propylene 39.19.10.45 15%
Other, of polymers of propylene 39.19.10.50 15%
Other, of polymers of propylene 39.19.90.45 15%
Of biaxially oriented polymers of propylene, of a width not exceeding 125mm, metallised 39.21.90.56 24%
Of biaxially oriented polymers of propylene, of a thickness not exceeding 0,09 mm and a width exceeding 125 mm. 39.21.90.58 20%
Of other biaxially oriented polymers of propylene 39.21.90.60 20%
Of polymers of propylene 39.21.90.63 15%
Textile fabrics embedded in or coated or covered on both sides with polymerisation or copolymerisation products 39.21.90.64 15%
Of other polymerisation or copolymerisation products 39.21.90.66 15%
Baths, shower-baths and wash-basins 39.22.10 20%
Lavatory seats and covers 39.22.20 20%
Other 39.22.90 20%
Of other plastics 39.23.29 15%
Carboys, bottles, flasks and similar articles 39.23.30 15%
Other 39.23.40.90 15%
Stoppers, lids caps and other closures 39.23.50 15%
Other 39.23.50.90 15%
Capsules and tubular neckbands, for bottles and similar containers 39.23.90.20 5%
Other 39.23.90.90 15%
Tableware and kitchenware 39.24.10 20%
Other 39.24.90 20%
Reservoirs, tanks, vats and similar containers, of a capacity exceeding 300 litre 39.25.10 20%
Doors, windows and their frames and thresholds for doors 39.25.20 20%
Shutters, blinds (including venetian blinds) and similar articles and parts thereof 39.25.30 20%
Other 39.25.90 20%
Office or school supplies 39.26.10 20%
Other 39.26.20.90 20%
Fittings for furniture, coachwork or the like 39.26.30 20%

FRIDGE Chemical Sector Upstream Pricing Practices – Final Report
Ozone Business Consulting (Pty) Ltd Page 73
Product Description Tariff General
Statuettes and other ornamental articles 39.26.40 20%
Beads, not coated with pearl essence 39.26.90.03 15%
Transmission belts 39.26.90.20 5%
Power transmission line equipment 39.26.90.25 5%
Other 39.26.90.90 20%
In most cases where tariff protection is applicable the rate is in the order of 15 – 20%, which is
higher than the 10% applicable to primary PP polymer. It is also calculated on a figure that is
numerically higher per weight, meaning that in Rand/ton the protection is up to 4 times higher for
downstream sector than the upstream.
None of the downstream respondents have indicated any anti-dumping investigation, or action, in
any of their PP products.
2.5. International competitiveness of South African chemicals pricing
2.5.1. Introduction
It is important in the analysis of pricing that a common understanding of pricing terminology is
agreed upon, especially in the context of a comparative analysis. The main issue that is involved
is the concept of an inland price for products, which is the price paid by local customers in a
particular country [which can be based on a delivered, or ex-factory basis], compared to export
prices, which are the export based prices for producers in a particular country.
The competitiveness of South African chemicals pricing is dealt with under the following headings:
• Historical SA feedstock market volumes and pricing levels
• Comparison of SA inland prices for feedstock with international prices
• Historical sales levels for key downstream products
• Basis for SA pricing calculations
• Key differentiation factors for purchasing feedstock
• Operations: (Upstream/ Downstream: Basis for operation [e.g. 24/7]; Average age and
original cost of equipment; Capacity utilisation; Workforce)

FRIDGE Chemical Sector Upstream Pricing Practices – Final Report
Ozone Business Consulting (Pty) Ltd Page 74
• Assessment of global competitiveness of downstream producers
• Ability for downstream to expand product range based on lower feedstock prices
• Impact of current pricing practices (Skills; Wages; Technology; Long-term sustainability;
Import replacement)
2.5.2. Historical SA feedstock market volumes and pricing levels
The historical local and export sales volumes of PP, as well as average delivered prices are
shown in the figures below.
Figure 2.8: Historical Local & Export Volumes – PP
0
50000
100000
150000
200000
250000
2000 2001 2002 2003 2004
Year
Metr
ic t
on
s
Local Sales from localProduction
Export Sales from localProduction
Imports
Local sales from local production are showing a general growth pattern, growing by 9.5% annually
over the last 3 years. This is the most significant growth for all kinds of polymer. Exports were
generally constant for the last few years. A fire at one of the polypropylene plants severely
disrupted the production operations for approximately 9 months in 2000, leading to significant
imports.
Homopolymer PP is the dominant product, accounting for approximately 70% of total local
consumption. The international market prices for impact copolymer and random copolymer are

FRIDGE Chemical Sector Upstream Pricing Practices – Final Report
Ozone Business Consulting (Pty) Ltd Page 75
typically 4% and 8% respectively higher than the homopolymer grade. Similar price differences
are seen in the South African market. Local delivered prices based upon total volumes and total
values for the respective years are shown in the figure below (ex-factory prices are not available
as PP is sold on a delivered basis):
Figure 2.9: Historical Local Delivered Prices (Excluding VAT) – PP All grades
R 0.00
R 1,000.00
R 2,000.00
R 3,000.00
R 4,000.00
R 5,000.00
R 6,000.00
R 7,000.00
R 8,000.00
R 9,000.00
2000 2001 2002 2003 2004
Year
Pri
ce -
R/t
on
Local Delivered Prices -Upstream
Upstream StandardDeviation
Local Delivered Prices -Downstream
Downstream StandardDeviation
Note: Downstream data was based on a small sample size. The difference between upstream and downstream prices can be attributed to not all downstream companies having participated in the study and that to the fact that downstream companies also buy polymer from other companies, such as traders and other importers, who were not part of the upstream sample participating in the study.
It should be noted that the prices shown to be paid by downstream respondents are numerical
averages, and not weighted averages. As polymer product is mostly sold to large customers, a
weighted average will result in lower values to bulk rebates provided.
Information provided by upstream suppliers, based upon detailed “per customer” pricing analysis
indicated the following:
• The average price difference between the largest 10 customers, and the smallest 10
customers is the order of 7%
• The weighted average price shown before from upstream suppliers is within 1% of the price
paid by the largest 10 customers
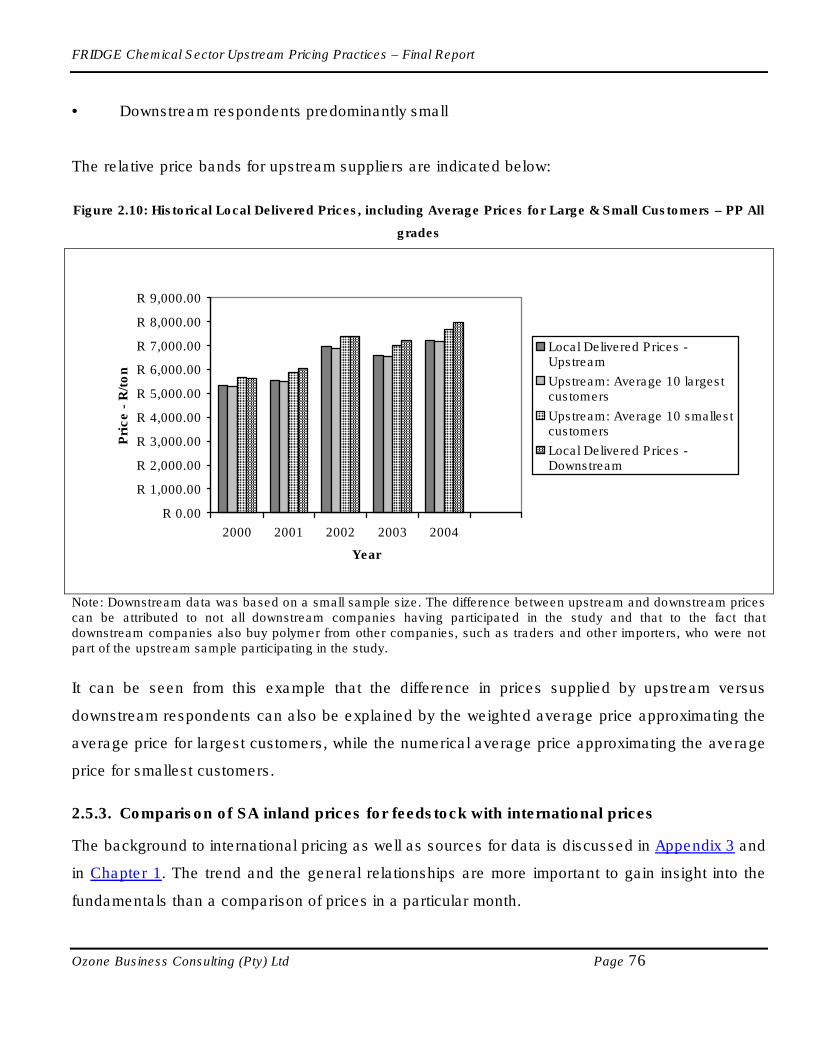
FRIDGE Chemical Sector Upstream Pricing Practices – Final Report
Ozone Business Consulting (Pty) Ltd Page 76
• Downstream respondents predominantly small
The relative price bands for upstream suppliers are indicated below:
Figure 2.10: Historical Local Delivered Prices, including Average Prices for Large & Small Customers – PP All
grades
Note: Downstream data was based on a small sample size. The difference between upstream and downstream prices can be attributed to not all downstream companies having participated in the study and that to the fact that downstream companies also buy polymer from other companies, such as traders and other importers, who were not part of the upstream sample participating in the study.
It can be seen from this example that the difference in prices supplied by upstream versus
downstream respondents can also be explained by the weighted average price approximating the
average price for largest customers, while the numerical average price approximating the average
price for smallest customers.
2.5.3. Comparison of SA inland prices for feedstock with international prices
The background to international pricing as well as sources for data is discussed in Appendix 3 and
in Chapter 1. The trend and the general relationships are more important to gain insight into the
fundamentals than a comparison of prices in a particular month.
R 0.00
R 1,000.00
R 2,000.00
R 3,000.00
R 4,000.00
R 5,000.00
R 6,000.00
R 7,000.00
R 8,000.00
R 9,000.00
2000 2001 2002 2003 2004
Year
Pri
ce -
R/t
on
Local Delivered Prices -Upstream
Upstream: Average 10 largestcustomers
Upstream: Average 10 smallestcustomers
Local Delivered Prices -Downstream

FRIDGE Chemical Sector Upstream Pricing Practices – Final Report
Ozone Business Consulting (Pty) Ltd Page 77
Figure 2.11: SA and International Polypropylene Domestic Prices
PP: COMPARISON OF INTERNATIONAL DOMESTIC PRICES (DELIVERED TO CONVERTER)
400
600
800
1,000
1,200
1,400
1,600
1,800
2,000
2,200
Jan-94 Jan-95 Jan-96 Jan-97 Jan-98 Jan-99 Jan-00 Jan-01 Jan-02 Jan-03 Jan-04 Jan-05
US
$/t
on
CHINA NW EUROPE USA South Africa INDIA
Some conclusions and commentary on the data shown above are as follows:
• When comparing average prices as obtained from downstream respondents, SA domestic
prices are still in the middle-to-lower end of the price band; these average prices (in US$)
are as follows:
o 2000: $ 807
o 2001: $ 698
o 2002: $ 704
o 2003: $ 968
o 2004: $ 1,230
• Prices around the world are linked.
• In any month, there can be a very wide variation in the prices. The following are some of
the reasons:

FRIDGE Chemical Sector Upstream Pricing Practices – Final Report
Ozone Business Consulting (Pty) Ltd Page 78
o The derived import parity prices (for India and China) assume an instantaneous
connection with the Reference Price (CFR Hong Kong). In reality there is a time lag
of between 6 and 8 weeks.
o Fluctuations in the currencies in relation to the US$ will have an impact because in
all countries (except the USA) the prices paid by local converters is in the local
currency.
o During periods of regional shortages or surpluses, international and local
supply/demand balances will play a role. For example, during the periods of tight
supply, the local domestic prices in the USA were considerably higher than those in
Europe and Asia. Due to supply constraints, it was not possible to physically ship
product to the (massive) US market and the local producers were able to maintain
prices higher than import parity (from Europe or the Middle East).
• In the early part of the period under review, there was a big variation in the prices for all
polymers. The major factor contributing to this is that China and India had relatively high
import duties (>35%), but these have been reduced and this has brought the prices across
all countries covered much closer together.
• Prices paid by South African converters are always in the range of prices that prevailed in
the regions or countries covered, mostly at the lower end of the range. It should be noted
that China is the most competitive (lowest priced market) in the word. In the early part of
the period under review, the prices in South Africa were much lower than those in China
and India. However, as imports into China have grown over the period the CFR Hong
Kong price has fallen to the low end of the range. In addition, import duties have fallen.
Both factors have contributed to a narrowing of the gap between prices in South Africa and
those in China.
• For the monthly comparison over the recent past years, there have been periods when the
price in China was lower (sometimes considerably so) than the price in South Africa.
However, this comparison does not take into account the fact that there is a 6-10 week lag
between the prices in South Africa and the prices in China. From the analysis of only the
recent data it seems that prices in China have on average been lower than those in South
Africa, even if a price lag is taken into account. A contributing factor is that the cost of

FRIDGE Chemical Sector Upstream Pricing Practices – Final Report
Ozone Business Consulting (Pty) Ltd Page 79
shipping has been high in relation to the cost of shipping a few years back. The shipping
cost is expected to fall to a more normal/acceptable range.
2.5.4. Basis for SA Downstream Products pricing calculations
According to the small sample of downstream respondents, product pricing is based upon the cost
of production, and converters are striving to achieve an acceptable return on capital. However,
due to the large number of downstream competitors, they have little leverage on their customers,
which are often companies much larger than themselves.
They have some leverage in terms of prices, based upon polymer cost increases. However, the
downstream pricing mechanisms typically require a period of around 3 months before polymer
price changes can be incorporated, while upstream price changes are affected sooner. But this
was disputed by “the downstream of downstream”, that is, the retailers, who mentioned during
discussions on demand elasticity that converters implement polymer price changes immediately
after they get notice of price increase from polymer suppliers. However, no pricing data was
collected from them.
2.5.5. Key differentiation factors for purchasing feedstock
The first differentiation factor is to determine the most suitable PP grade, based upon product
requirements and costs. Once the grade has been determined, suppliers are chosen on the basis
of quality, continuity of supply and price.
2.5.6. Downstream Operations
Basis for operation [e.g. 24/7]
All respondent operations are operating on a 24hour basis, but only 60% operate 7 days/week,
and the balance 5 days/week.

FRIDGE Chemical Sector Upstream Pricing Practices – Final Report
Ozone Business Consulting (Pty) Ltd Page 80
Average age and original cost of equipment
The age of PP converting equipment reported by the respondents varies from 5 – 18 years with an
average of around 10 years. The average original cost of equipment is R26 million.
Capacity utilisation
Capacity utilisation varies between 40% and 95%, with an average of 72%, not taking into account
idle weekend time.
Workforce
The average number of the workforce for respondent companies is 106, with around 59% in
manufacturing. A notable situation is the employment of contractors instead of full-time
employees, due to insecurity of demand and low plant utilisation rates.
2.5.7. Assessment of global competitiveness of downstream producers
The relative small sample of downstream respondents (not representative and potentially
subjective) indicated that PP conversion in SA is either of average competitiveness, or below.
Some reasons given were:
• Small local market necessitates short production runs and low capacity utilisation.
• One respondent indicated that PP in SA is 33% more expensive than in the USA, which
makes them uncompetitive, although their equipment, manufacturing procedures,
marketing and distribution are world class. This anecdotal price reference is however not
borne out by the international price comparison done.
• Some export orders for engineering components are being won against competition from
China, USA and the UK, but could be better with more support from local polymer
suppliers.
• One respondent claimed that imported modified PP can be sourced at a 30% discount to
local homopolymer. Again, this anecdotal price reference is however not borne out by the
international price comparison done.

FRIDGE Chemical Sector Upstream Pricing Practices – Final Report
Ozone Business Consulting (Pty) Ltd Page 81
Downstream respondents have commented that integrated international producers such as
Formosa Plastics are accused of transferring polymer at marginal cost to conversion operations
for exports. This is a major problem for plastic converters all around the world. In China,
converters that are based in an "export processing zone" do have access to lower priced polymers
because they do not have to pay import duties provided the polymer is converted into a product
that is exported. Similarly, plastic converters in South Africa have access to certain polymers
(really only PP at present) at export parity prices for PP converted into products that are exported.
The difficulty arises from the fact that converters in South Africa supplying product into the
domestic market sometimes have to compete with Chinese (and other Asian converters) that have
access to polymers at less-than-the-domestic price because they are located in export processing
zones or have access to polymer at special prices.
Chinese exports have rebate of duty, similar to SA’s exporters. Landed imported end-product is
subject to duty typically in the range of 15 – 20% which should protect the domestic industry
against WTO compliant imported end-products. It should be noted that end-products attract up to
four times the Rand/ton duty protection compared to that of the upstream polymer. If the domestic
converters cannot compete against such product, it indicates that either the Chinese exports are
cross-subsidised (dumped), duty is not being administered properly or that SA converters are not
competitive.
This is where anti-dumping regulations are supposed to help and aggrieved converters can call
upon their governments to evaluate if dumping is taking place. Proving that any product from
China is dumped is very difficult.
Regarding fully integrated producers like Formosa Plastics, the problem of transfer pricing of
polymer to a conversion operation is real and does exist. Technically, this is illegal and not
allowed under WTO rules and anti-dumping measures can be made against such an exporter.
However, once again proving that dumping is taking place is not easy and in the time between
dumped imports arriving and proving a case can take more than twelve months. Trade policies

FRIDGE Chemical Sector Upstream Pricing Practices – Final Report
Ozone Business Consulting (Pty) Ltd Page 82
are important in enhancing the competitiveness of a country. However the available
countervailing measures are not uniformly applied in all countries.
2.5.8. Ability for downstream to expand product range based on lower feedstock prices
Respondents are either unsure, or only have assumed views regarding their ability to expand
based on lower feedstock cost. One respondent indicated they export an extruded intermediary
product that is very cost sensitive, and lower feedstock price will result in higher volumes. Another
respondent indicated that plastic boxes, a relatively new application will show much higher growth
replacing paper/board products, but a lower PP feedstock price is required.
2.5.9. Impact of current pricing PP polymer practices
Skills
The relatively small sample of downstream respondents generally do not see a major effect on
skills levels caused by current pricing practices, although indirectly they feel it is negative, as skill
are mainly developed during period of buoyant growth.
Upstream respondents commented that the growth of the local polymer industry has encouraged
and required the development of technical, managerial, business and operational skills that are
necessary to efficiently conduct business through the whole polymer value chain. The
downstream conversion industry in South Africa is well developed and typically follows
international polymer industry value chain norms; namely large national conversion companies,
large independent companies and multitude of smaller entrepreneurial type operations. These
companies can either focus on polymer conversion or can be multifaceted companies specialising
in, for example, packaging irrespective of material type - steel, glass, paper or polymer.
Wages
Downstream respondents generally feel that wages are agreed to in bargaining councils, and are
not influenced by feedstock pricing. However, there is a trend to part-time contractors, mainly
induced by low margins, which are ascribed to high feedstock prices. The downstream focus could
FRIDGE Chemical Sector Upstream Pricing Practices – Final Report
Ozone Business Consulting (Pty) Ltd Page 83
also become more focused on labour intensive operations adding further value to end-products,
but this requires lower material costs.
Upstream respondents commented that the established polymer pricing practices have allowed for
the sustained development and growth of the downstream industry, the major employers of labour
within this industry.
Technology
The relatively small sample of downstream respondents believe that low margins caused by
upstream polymer pricing practices are a major driver towards more capital intensive equipment,
in order to improve productivity. Some respondents, however, feel that they do not make enough
margin to invest in necessary new technology.
Upstream respondents commented that the sophistication of the South African end user market is
comparable with that of developed countries and hence the local polymer conversion industry is
required to keep pace with global developments in polymer technology. Consumer requirements
for specialised applications in turn require that the conversion industry invests in the necessary
skills and equipment to facilitate the development and production of these applications and
products (import replacement). Hence the upstream polymer production industry assists the
conversion industry by developing new grades, enhancing and modifying existing grades to meet
these requirements. Thus both the upstream and downstream industry players are required to
track and apply changes in polymer technology into their operations and product offering.
Long-term sustainability
Downstream respondents have concerns that the long-term sustainability of the downstream
sector is threatened by the economies of scale and high capital re-investment in China in
particular. Current pricing practices are incorrectly stated by some respondents that they do not
offer anything special to enhance exports, and thereby helping to alleviate the negative impact of
the small domestic market.

FRIDGE Chemical Sector Upstream Pricing Practices – Final Report
Ozone Business Consulting (Pty) Ltd Page 84
Upstream respondents feel that to keep pace with growth, long term sustainability of the local
polymer industry will be required to expand its operations to meet the increased demand and this
can only continue if all parts of the polymer value chain are profitable and the invested capital
(equipment and skills) is adequately rewarded.
Import replacement
Downstream respondents (based on small non-representative sample) believe that current
polymer pricing practises have created little incentive for end-users to source locally, especially as
end-products have similar mass to volume ratios as the primary polymer. The only drivers left for
import replacement are convenience and “Quick response” issues.
Upstream respondents view is that if the alternative is considered for a moment (no local polymer
production and all polymer goods are imported), the polymer conversion industry would be
significantly exposed to the global supply and demand balances which would manifest itself in
reliability of supply and would significant expose the domestic market to price fluctuations and
polymer merchants wishing to take advantage of the import situation. Secondly, South Africa itself
would not be able to handle the importation of these vast quantities of polymer raw materials and
the market would likely switch to the importation of semi finished goods and final products which
would significant damage the South African polymer conversion industry. The current pricing
practices have allowed for the growth and development of the local polymer conversion industry
as supplied by local production and as such facilitated the replacement of imports (polymer and
semi-finished goods) with locally produced products. In countries where there is no local producer
there is a significantly under developed polymer value chain, as semi finished and final products
are imported rather than development of a capital intensive downstream industry.
2.6. Comparison of inland prices with export prices
No time series data was available for export prices of product that was exported out of South
Africa. The comparison has therefore been done on the average local delivered prices as received
from Polypropylene manufacturers and converters and average export prices. In 2004, the
average local delivered price for Polypropylene was R 7.23/kg. The average F.O.B. price in the
same year was R 5.93/kg. The major destination for South African exports was Hong Kong. The
FRIDGE Chemical Sector Upstream Pricing Practices – Final Report
Ozone Business Consulting (Pty) Ltd Page 85
average F.O.B. price to Hong Kong was R 5.71/kg. The difference between the local delivered
prices and F.O.B. price to Hong Kong was around 21%. It should be noted that selling these
exports in Hong Kong has to add onto the F.O.B. price logistics costs, tariff duties, inland
distribution and agents’ commission. This is why the selling price in China is comparable to that
prevailing in South Africa as shown in Figure 2.11 in section 2.5.3 above.
Time series data of export prices has however been obtained for a period of 10 years for other
countries or regions; namely the USA and North West Europe. Figures 2.12 and 2.13 below show
that the 21% difference between delivered domestic prices and export prices in South Africa is not
unusual. For example, in the case of the USA the difference between their delivered domestic
prices and FOB prices was as high as 24% by May 2005. It should be noted that the FOB price is
not the price paid in the export market, rather it is the price at which the polymer exits the borders
of the source country. Upon landing at the export market logistical costs, duties/tariffs (where
applicable), inland distribution and agent’s commission (in some instances) and other costs are
added onto the price at which the polymer exited the borders of the source country. The difference
between the delivered domestic price and the FOB price does not mean the domestic customers
subsidize export customers. It should be mentioned that the gap between the two is sometimes
much closer if not non-existent. Only for a limited period (May 2004 to May 2005) was the
domestic price in the USA lower than the export price. The same trend should be expected in the
case of South Africa as well.

FRIDGE Chemical Sector Upstream Pricing Practices – Final Report
Ozone Business Consulting (Pty) Ltd Page 86
Figure 2.12 Time series comparison of delivered domestic prices and FOB prices in the USA
PP
0
200
400
600
800
1,000
1,200
1,400
1,600
1,800
Jan-
94
May
-94
Sep
-94
Jan-
95
May
-95
Sep
-95
Jan-
96
May
-96
Sep
-96
Jan-
97
May
-97
Sep
-97
Jan-
98
May
-98
Sep
-98
Jan-
99
May
-99
Sep
-99
Jan-
00
May
-00
Sep
-00
Jan-
01
May
-01
Sep
-01
Jan-
02
May
-02
Sep
-02
Jan-
03
May
-03
Sep
-03
Jan-
04
May
-04
Sep
-04
Jan-
05
May
-05
US$/tonne
US Export Price US Domestic Price
The same trend is evident in the case of North West Europe as shown in figure 2.13 below,
although the difference between the delivered domestic prices and the FOB price is relatively
smaller and in some instances non-existent. The reason for the small difference is because of the
close proximity of the export destinations and because of the relatively small volumes available for
exports.

FRIDGE Chemical Sector Upstream Pricing Practices – Final Report
Ozone Business Consulting (Pty) Ltd Page 87
Figure 2.13 Time series comparison of delivered domestic prices and FOB prices in NW Europe
PP
0
200
400
600
800
1,000
1,200
1,400
1,600
Jan-94
May
-94
Sep
-94
Jan-
95
May
-95
Sep
-95
Jan-
96
May
-96
Sep
-96
Jan-
97
May
-97
Sep
-97
Jan-
98
May
-98
Sep
-98
Jan-
99
May
-99
Sep
-99
Jan-
00
May
-00
Sep
-00
Jan-
01
May
-01
Sep
-01
Jan-
02
May
-02
Sep
-02
Jan-
03
May
-03
Sep
-03
Jan-
04
May
-04
Sep
-04
Jan-05
May
-05
US$/tonne
NW Europe Export Price NW Europe Domestic Price
An important feature of the polymer industry world-wide is that in any country that has surplus in
any polymer, the price at which the polymer is exported is different (and usually lower) than the
price at which it is sold to domestic users even after allowing for transport and other logistics
costs. This statement is supported by the trend of the historical FOB and domestic prices of the
USA and North West Europe. A comparison between the domestic and FOB prices in the USA
and NW Europe over the ten year period shows that:
• In both regions the polypropylene export price is usually lower than the domestic price.
• However, there are periods when the export price is very close to or actually higher than the
domestic price. This takes place when the export demand increases faster than domestic,
leading to higher export prices for a short period of time.
2.7. Impact of pricing on downstream purchasers - Demand Elasticity
2.7.1. Introduction
The approach followed to determine demand elasticity in the PP value chain is described in
Appendix 1.
FRIDGE Chemical Sector Upstream Pricing Practices – Final Report
Ozone Business Consulting (Pty) Ltd Page 88
2.7.2. Demand Elasticity Analysis for PP
Measuring the demand elasticity of PP consumption is done by assessing the elasticity (change)
of the polymer consumption to price movements of polymer sold by the upstream. The actual
change in consumption is determined by how much PP is consumed at lower or higher prices
through the whole value chain, and when measured over all PP consumed, will reflect the
aggregate of PP elasticity in all its different applications.
It was not possible to collect accurate information from sufficient companies to enable the plotting
of historical and future demand elasticity for PP over all its many applications to obtain an
aggregate view of its price elasticity. As such, alternative methods have been used to calculate
demand elasticity.
During the course of 2005, Professor Johannes Fedderke of the Southern African Econometric
Research Unit undertook a study of price elasticity in Sasol’s LDPE, LLDPE, PVC and PP
markets. This study set out to determine the price elasticity of demand and the price elasticity of
supply for these commodities in South Africa. The input data used covered the period from
January 1994 to June 2005. The study which uses sophisticated econometric techniques draws
on 10 years of quarterly polymer consumption, polymer price and national economic data to
determine both the supply and demand side price dynamics to determine the product’s elasticity.
The results of this study indicated for PP that a 10% decrease in price would result in a 2%
increase in market size, and vice versa. The implication is that for PP any price decrease will
result in a less than proportional increase in market size.
This elasticity study deals with the elasticity of polymer resin, produced by the upstream, supplied
to the downstream and gives the aggregate across all PP’s market segments (all value chains).
2.7.3. Practical Verification of Demand Elasticity for PP
To further investigate the demand elasticity of PP a market segment analysis was done. As the
demand elasticity for PP resin is determined by the price elasticity of all its value chains (market

FRIDGE Chemical Sector Upstream Pricing Practices – Final Report
Ozone Business Consulting (Pty) Ltd Page 89
segments) to the price of PP, the price aggregate elasticity determined above can be verified from
a practical perspective by evaluating the portion of the PP polymer cost in the final product that is
being sold. If the end-product which determines the demand of the PP used contains a small
portion of PP (e.g. soft drink bottle caps made of PP), the cost of PP will have a small impact on
the price of the end-product and that particular segment will be inelastic to the price of PP sold by
the upstream, as a reduction in price will not lead to a material drop in the price of the end-product
(e.g. soft drinks in this example). Conversely if the product has been made predominantly of PP
(e.g. garden furniture made of PP), the cost of PP will have a greater impact on the final price of
the product and it will have a greater elasticity to the price of PP provided by the upstream.
By reviewing the market segments for the various grades of PP, assessing the market segment
and the amount of PP contained in the final product, an understanding of the complete PP value
chain’s elasticity to price can be obtained, to verify the outcome of the more rigorous analysis
conducted by Prof Fedderke.
This was done for the various segments for PP and is shown below:
a) PP - Homopolymer extrusion grade (50% of PP demand)
Major
applications
% Cost of
PP polymer
in converted
product
End-use product % Cost of
PP polymer
in end-use
product
PP Polymer Demand
Elasticity for end-product
1. Woven cloth 40 – 50% Packaged vegetables,
maize meal, etc.
2 – 5% Small possibility for maize;
generally not elastic
2. Flooring 40 – 50% Installed Carpets
(includes cost of
installation)
< 10% A significant decrease in PP
price, e.g. >20% required to
influence demand elasticity
3. Non-
wovens
40 – 50% Waterproofing,
industrial, consumer
Retail: <10%
Other: 5-10%
Some LDPE competition, but
generally not elastic
4. BOPP-film 40 – 50% Packaging for snacks
(e.g. crisps), etc.
<3% No demand elasticity

FRIDGE Chemical Sector Upstream Pricing Practices – Final Report
Ozone Business Consulting (Pty) Ltd Page 90
The conclusion is that for 80% plus of the applications, PP polymer constitutes such a small
fraction of the end-product price that it cannot impact on the demand elasticity.
b) PP - Homopolymer moulding grade (14% of PP demand)
Major
applications
% Cost of
PP polymer
in converted
product
End-use product % Cost of
PP polymer
in end-use
product
PP Polymer Demand
Elasticity for end-product
1. Plastic
chairs (80%)
40 – 50% Retail Furniture 20 – 25% Demand elasticity likely, but
expected to require >10%
change in PP price
The conclusion is that price changes in PP polymer have a possibility to impact on the demand
elasticity.
c) PP – Impact Co-polymer extrusion grade (3% of PP demand)
Major
applications
% Cost of
PP polymer
in converted
product
End-use product % Cost of
PP polymer
in end-use
product
PP Polymer Demand
Elasticity for end-product
1. Pipes 50 – 60% Retail sales of drain
pipes, etc.
40 – 50% PP price cannot impact
demand for construction
projects; some competition
with PVC
The conclusion is that although PP polymer constitutes a significant fraction of the retail end-
product price that it cannot impact on the demand elasticity of construction projects, where pipes
account for <1% of total cost.

FRIDGE Chemical Sector Upstream Pricing Practices – Final Report
Ozone Business Consulting (Pty) Ltd Page 91
d) PP – Impact Co-polymer moulding grade (29% of PP demand)
Major
applications
% Cost of
PP polymer
in converted
product
End-use product % Cost of
PP polymer
in end-use
product
PP Polymer Demand
Elasticity for end-product
1. Buckets 40 – 50% Packaging e.g. paints
etc.
<5% Some steel competition, but
generally not elastic unless
>20% price changes
2. House-
wares
40 – 50% Tupperware,
lunchboxes, etc.
< 25% Could have some elasticity
as products are lower-range
3. Food
containers
40 – 50% Ice cream, industrial
packaging
<5% No demand elasticity
4. Crates 40 – 50% Materials handling
support for industrial
products
<1% No demand elasticity
The conclusion is that for 80% plus of the applications, PP polymer constitutes such a small
fraction of the end-product price that it cannot impact on the demand elasticity.
The technical analysis done by Professor Fedderke has indicated a relatively small elasticity. The
practical examples of final products elasticity provided in the study were merely an effort to explain
the results of the technical analysis. The practical examples show that interim product elasticity
can only be impacted upon by product substitution, which in most cases occur only at elevated
price differentials due to technical considerations (e.g. changing from plastic to glass bottles
requires complete packaging system changes).
The general conclusion for PP polymer is therefore that for in excess of 80% of end-use
applications there is no significant demand elasticity. This is therefore a verification of the
statistical analysis that indicated a low elasticity.

FRIDGE Chemical Sector Upstream Pricing Practices – Final Report
Ozone Business Consulting (Pty) Ltd Page 92
2.7. Impact of pricing on downstream purchasers – EVC
2.7.1. Introduction
Given the relationship that exists between sales volumes and price (as measured in this study by
the demand elasticity curves), the challenge is to find an equitable method of comparing the
impact on the financial performance of upstream and downstream businesses of the chemical
industry brought about by changes in selling prices and sales volumes. The measure used must
be unbiased and objective, and based on readily available data.
The measure that meets the above criterion that has been used in this study is Economic Profit,
also known as Economic Value Created (EVC). A basic introduction and description of EVC and
the methodology employed is shown in Appendix 2.
EVC is a practical measure of the company's operating performance that correlates with the value
of the company. What makes it so relevant is that it takes into account a cost that conventional
measures exclude, namely, the cost of equity. Economic value created is simply the before
interest and after tax operating profit, R, minus the total annual cost of capital, K. It is expressed
as follows.
EVC = R – K
In this model,
R is the stream of cash available to the providers of capital, and
K is the total cost of the capital used, including the cost of equity and debt
The weighted average cost of capital (K) would normally vary across industries and over time.
EVC is relatively insensitive to variations in K in the value chains measured.
This study seeks to determine the relative impact of pricing policies between upstream and
downstream protagonists. Accordingly the view was taken that a single K could be applied as a
consistent-and-equal benchmark for all companies in the study. This approach eliminates the
moving benchmark effect of applying a different K to each company in each year.

FRIDGE Chemical Sector Upstream Pricing Practices – Final Report
Ozone Business Consulting (Pty) Ltd Page 93
Table 2.4: Determination of K - Weighted average cost of capital %
Target debt as % of capital 50
Risk free rate of return % 12
Market rate of return % 20
Risk index (beta) 1.5
Cost of equity % 24
Marginal debt rate % 15
Marginal corporate tax rate % 30
Cost of debt % 10.5
K, Weighted average cost of capital % 17.25
Accounting measures do not correlate well with share price. The accounting model is precise but
inadequate. Value creation is a long term economic, not an accounting, concept. Value creation
takes account of risk and the cost of equity and looks beyond the company into the market. As an
economic measure it can also be used to take account of the time value of earnings. Although
accounting measures are precise they do not measure value. Therefore when an accounting
measure is used as a proxy for value it will be precisely wrong. EVC is the closet proxy for
measuring value and therefore the choice is between being precisely wrong or approximately
right.
2.7.2. Actual EVC results for upstream companies (All polymers)
Due to the integration of production facilities, it was not possible to obtain the required information
for the EVC analysis at individual product level. The analysis was therefore conducted on the
combined polymers upstream and downstream sectors.
The following EVC graph represents the actual EVC values in each year between 1997 and 2005
for upstream polymers. The graph indicates that the return on capital was less than the weighted
average cost of capital as measured by K (17.25) more frequently than it was equal or above K.
However, this does not mean the upstream has been making losses. What this means is that the
providers of equity don’t get rewarded for their risk, but the business can still operate profitably. It
should be noted furthermore that the EVC values shown on the graph below represent both

FRIDGE Chemical Sector Upstream Pricing Practices – Final Report
Ozone Business Consulting (Pty) Ltd Page 94
upstream polymers manufacturers, namely, Dow Plastics and Sasol Polymers. In the case of
Sasol, the focus for this study was on Sasol Polymers, the polymers manufacturing unit within the
group and not on the whole group. Therefore profits of Sasol Limited as a group cannot be
equated to those of Sasol Polymers.
Sasol Polymers, situated within Sasol’s chemical businesses, is a separate company within the
Sasol Group, and has a supply agreement for raw material from another Sasol Group company,
Sasol Synfuels. The supply of these raw materials is based upon a pricing mechanism that sets
the price at the equivalent fuel value, i.e. the gate price of fuel (which is set by using the regulated
Basic Fuel Price mechanism, which in turn is directly set by international fuel prices. Therefore,
Sasol Synfuels sells the feedstock at a price that they would have realised in the marketplace if it
was converted to saleable fuels. This mechanism ensures that there is no cross-subsidization
between fuels and polymers businesses and hence the respective profitability of the businesses is
a true reflection of the value add of the chemicals and fuel businesses.
Figure 2.14: EVC Results – Upstream Polymers
Upstream Polymers
-2000000
-1500000
-1000000
-500000
0
500000
1000000
1500000
1997 1998 1999 2000 2001 2002 2003 2004 2005
1997 to 2005
EV
C
EVC

FRIDGE Chemical Sector Upstream Pricing Practices – Final Report
Ozone Business Consulting (Pty) Ltd Page 95
The following IVC graph represents the intrinsic value calculated for upstream polymers. IVC is
starting capital plus the cumulative value of each year’s EVC, discounted to present time. In this
instance, “present time” is 1997.
The graph illustrates the cumulative effect of economic value calculated by the end of each year
between 1997 and 2005. When EVC calculations shows returns that are lower than K, the
weighted average cost of capital over long periods of time as in the polymer business below it
becomes increasingly more difficult to reverse the accumulated returns that are lower than K. The
intrinsic value shows large accumulated returns that are below K by 2005.
Figure 2.15: IVC Results – Upstream Polymers
Upstream Polymers
-2500000
-2000000
-1500000
-1000000
-500000
0
500000
1000000
1500000
1 2 3 4 5 6 7 8 9
1997 to 2005
IVC
IVC
The following graph illustrates the relative sensitivity of EVC and Profit before Interest and Tax
(PBIT) to Selling Price, Sales Volume, Cost of Sales and K in upstream polymers. The bar groups
indicate by what percentage PBIT and EVC would change for a one percent improvement in
Prices or Sales Volumes or Cost of Sales or K. (Note: The inverse is also true, i.e. a 1% decrease
in values).

FRIDGE Chemical Sector Upstream Pricing Practices – Final Report
Ozone Business Consulting (Pty) Ltd Page 96
Figure 2.16: Sensitivity of EVC and Profit Before Interest and Tax (PBIT) to Selling Price, Sales Volume, Cost
of Sales and K – Upstream Polymers
Upstream Polymer Relative Sensitivity
0
2
4
6
8
10
12
14
1%
Price
1%
Volume
-1%
CoS
-1%
K
% Change in input
% c
han
ge i
n p
erf
orm
an
ce
PBIT EVC
Note that the inverse of what this graph shows is also true. That is, PBIT and EVC would change by the same percentage points but in the opposite direction for a one percent decline in Prices or Volumes or one percent increase in Cost of Sales or K.
Note the following:
• EVC is relatively insensitive to K
• EVC (and PBIT) are relatively insensitive to Sales Volume
• EVC (and PBIT) are very sensitive to Selling Price and Cost of Sales
2.7.7. Downstream Polymers
No financial data was received for downstream Polypropylene EVC analysis. The EVC was
calculated for each year between 1997 and 2005 for combined downstream polymers. Please
refer to Appendix 2 for downstream EVC results of combined polymers.

FRIDGE Chemical Sector Upstream Pricing Practices – Final Report
Ozone Business Consulting (Pty) Ltd Page 97
2.8. Conclusions – Polypropylene
Production capacity for PP in SA is around 355 000 tpa, increasing to 685 000 tpa by completion
of Sasol’s Project Turbo. The SA market size in 2004 for polypropylene primary polymer used in
local plastic conversion was estimated at 223 000 tons, of which 93.7% was supplied by local
producers. This indicated significant excess capacity which is expected to increase even more
beyond the year 2006 as a result of Project Turbo.
Global PP prices are determined by supply/demand basis on a global scale, but are particularly
driven by the Far East, due to the availability of low-cost product from ill-considered expansions
done in the 1990’s in countries such as Korea, as well as the ever-growing demand from China.
Global plant sizes are also increasing, in order to benefit from economies-of-scale issues. By
comparison South African plants are relatively small and thus local PP manufacturers have
relatively high cost base in absolute terms.
Local PP producers sell polymer products to customers in markets which include South Africa and
other African countries, Asia, USA, Europe and South America. Their policy is to sell at the market
prices prevailing in each of these regions at any time, and this also applies to sales in South
Africa. Therefore, PP pricing mechanism prevailing in South Africa is one where the price is
negotiated, based on offers in an open market where products are readily traded across national
boundaries. The outcome is that the most competitive supplier sets the price and is thus referred
to as market pricing as opposed to formula-driven IPP. It should be noted though that the local
prices are referenced to the landed costs of competitive imports. Local suppliers do not select a
particular price from a particular region and rigorously apply that to determine its price to the
South African domestic market. They are driven by market dynamics and react to the lowest price
imports being offered by competitive suppliers to South African customers. The prices in export
markets are based on marginal cost (variable cost) globally and hence are usually lower than
domestic prices as explained in section 2.6 above.

FRIDGE Chemical Sector Upstream Pricing Practices – Final Report
Ozone Business Consulting (Pty) Ltd Page 98
Prices of locally manufactured substitute materials, such as paper, metal and glass, are also
monitored and considered for the market sectors where they compete as alternatives to polymers.
A combination of all these factors culminates into a domestic price at a particular point in time.
Excess domestic production capacity as in the case of Polypropylene in South Africa is no
guarantee that domestic prices will be lower than FOB prices. For example, Australia and South
Korea are both net exporters of Polypropylene and yet their domestic prices are set by marginal
imports from other countries with reference to the CFR Hong Kong reference price. A comparison
between domestic and FOB prices that prevailed in North West Europe and the USA over a 10
year period revealed that in cases where there is surplus Polypropylene, the price at which the
polymer is exported is with few exceptions always lower than the price at which it is sold to
domestic users. The same situation was found to be the case in South Africa. In general, the
further away the export market as in the case of South Africa’s exports to Hong Kong, the higher
the price differential between the domestic price and the FOB price. The converse is also true,
that is, the closer the export market like in the case of North West Europe’s exports which go
within Europe, the smaller the price differential. There are limited periods when the FOB price is
very close to or actually higher than the domestic price. This takes place when the export
demand increases faster than domestic, leading to higher FOB prices for a short period of time.
Analysis of South Africa’s domestic PP prices compared to a number of major competing
countries, including China, US, NW Europe and India, showed that:
• Prices around the world are linked.
• In any month, there can be a very wide variation in the prices.
• Prices paid by South African converters are always in the range of prices that prevailed in
the countries or regions (China, India, North West Europe and USA) covered in this
analysis, mostly at the lower end of the range.
In the latter period of the analysis China was the most competitive (lowest priced market) in the
world. In the early part of the period under review, the prices in South Africa were much lower
than those in China and India.
FRIDGE Chemical Sector Upstream Pricing Practices – Final Report
Ozone Business Consulting (Pty) Ltd Page 99
The global reality test revealed that South Africa’s PP conversion industry is not lagging in terms
of development, taking into account South Africa’s current state of economic development.
Countries such as South Korea and Taiwan, that have highly developed conversion industries,
have developed vigorous manufacturing sectors that export the bulk of production (cars, industrial
products, white goods and consumer electronics) that contain plastic components. It is these
countries in particular that South Africa can learn from.
The results of the demand elasticity analysis indicated that a 10% decrease in PP price would
result in a 2% increase in market size, and vice versa. The implication is that for PP any price
change will result in a less than proportional change in market size. From a practical perspective
the conclusion is that for 80% plus of the applications, PP polymer constitutes such a small
fraction of the end-product price (or installed cost) that price changes cannot impact on the
demand elasticity.
Due to the integration of production facilities, it was not possible to obtain the required information
for the EVC analysis at individual product level. The analysis was therefore conducted on the
combined polymers upstream and downstream sectors for the period 1997 to 2005.
For upstream polymers, the EVC analysis indicated that the return on capital was frequently
lower than the weighted average cost of capital, K. This is a clear indicator that the current pricing
practices of the upstream sector are not resulting in high levels of profitability, as measured
against the total cost of capital, K. This situation means that the downstream sector is not making
super profits.
For downstream PP, despite all efforts no company provided historical financial data for EVC
analysis. The analysis was done for combined polymers. Although statistically insignificant, the
EVC analysis of combined polymers indicates that the return on capital was lower than the
weighted average cost of capital, K in every year except 1997 and 1999. This situation means that
the downstream sector is not making super profits either.

FRIDGE Chemical Sector Upstream Pricing Practices – Final Report
Ozone Business Consulting (Pty) Ltd Page 100
3. POLYETHYLENE (HDPE, LDPE, LLDPE)
3.1. Market definition of upstream chemical products
a) Introduction
Polyethylene consists of three distinct product categories, namely:
• High-density polyethylene – HDPE
• Low-density polyethylene – LDPE
• Linear Low-density polyethylene – LLDPE
Polyethylene in primary, or unconverted, form is part of the Primary Polymer and Rubber sub-
sector of the chemical industry.
Low density polyethylene (LDPE) has a melting point of 220 - 260 0C and a density of 0.91-0.94
g/cm3. LDPE is more flexible than HDPE due to lower crystallinity. Sasol manufactures LDPE in
Sasolburg. LDPE manufacturing is a relatively simple polymerisation process, requiring only
ethylene as feedstock. LDPE is a commodity type polymer, used predominantly (83%) in
packaging film and sheet applications.
High-density polyethylene (HDPE) has a melting point of 220 - 310 0C and a density of 0.95-
0.97 g/cm3. HDPE is more rigid than LDPE due to higher crystallinity. HDPE is manufactured by
Dow Plastics at Sasolburg. Ethylene is the major building block for the polymer, although alpha-
olefin co-monomers may be incorporated at levels of 1–2 weight percent to modify polymer
properties. Blow moulding and injection moulding are the dominant end uses.
Linear Low-density polyethylene (LLDPE) has a melting point of 220 - 260 0C and a density of
0.92 g/cm3. LLDPE has higher tensile strength and exhibits higher impact and puncture resistance
than LDPE. Sasol also manufactures LLDPE at Sasolburg. It is a more complex polymerisation
process, requiring ethylene as well as an alpha-olefin such as hexene as feedstock.

FRIDGE Chemical Sector Upstream Pricing Practices – Final Report
Ozone Business Consulting (Pty) Ltd Page 101
b) Value chain
The value chain for Polyethylene is summarised in the diagram below:
Figure 3.1: Polyethylene Value Chain
c) Applications and Global Market Size
Low density polyethylene (LDPE):
In 2004, global LDPE production grew to 19 million metric tons operating at 85% of active
capacity, with an estimated value of $22 billion. (Source: SRI Consulting)
LDPE resins are usually converted to plastic products by blown film or cast film extrusion. Other
fabricating methods that commonly use LDPE resins are injection moulding and extrusion coating.
LDPE resins are sold to fabricators in a pelletised form.
Film applications are by far the largest market for LDPE, split roughly 50/50 between packaging
and non-packaging uses. Typical applications for food packaging include baked goods, dairy
products, frozen food, produce, meat and poultry, candy, and cookies. Non-food packaging
includes industrial liners, heavy-duty sacks, multi-wall sack liners, and shrink-wrap, bundling and
LDPE & LLDPE Primary polymer – produced by Sasol Polymers in Sasolburg
HDPE Primary polymer – produced by Dow Plastics in Sasolburg
Packaging
films
Pipes andOther plastic
Products
Ethylene – globally mainly from olefin cracking operationsBut in SA only supplied by Sasol ex Fischer Tropsch
Other Packaging
Products
Plastic conversion processes:Injection moulding, Blow moulding, Extrusion, etc.

FRIDGE Chemical Sector Upstream Pricing Practices – Final Report
Ozone Business Consulting (Pty) Ltd Page 102
over wrap, grocery sacks, merchandise bags, and garment bags. Typical non-packaging uses
include household wrap and bags, garbage bags, industrial sheeting and roll-stock, agricultural
film, and disposable diaper backing.
Extrusion coating is the second-largest market for LDPE worldwide. Typical applications include
the coating of paper and paperboard products for packaging liquids such as milk and juices, the
coating of foil to provide a heat-seal layer in multi-layer film structures, and the coating of paper
and woven cloth to provide a moisture barrier. Extrusion coating continues to be a growth area for
LDPE, largely because of innovations in packaging technology.
Injection moulding is the third-most-important consumer of LDPE resins worldwide. Typical
applications include toys, house wares, lids and caps, and closures for containers.
The two largest net importing regions for LDPE in 2001 were Asia (excluding Japan) with 1.6
million metric tons and Central/South America with 0.2 million metric tons. North America,
Western Europe and Japan had combined net exports of 0.7 million metric tons. The rest of the
world had net imports of 92 000 metric tons. By 2006, Asia (excluding Japan) will still be the
largest net importer; South America and Western Europe will be much smaller net importers. The
United States, Japan and the rest of the world will remain net exporters. (Source SRI Consulting)
Linear Low density polyethylene (LLDPE):
In 2004, global LLDPE production grew to 16 million metric tons, with an estimated value of $17
billion. (Source: SRI Consulting).
The major applications for LLDPE are packaging, particularly film for bags and sheets. Lower
thickness (gauge) may be used compared to LDPE. Other applications are cable covering, toys,
lids, buckets and containers and pipes.
The Middle East, Canada and Asia are the largest net exporters of LLDPE. Major net importers
are Western Europe, the United States and China. (Source SRI Consulting)

FRIDGE Chemical Sector Upstream Pricing Practices – Final Report
Ozone Business Consulting (Pty) Ltd Page 103
High-density polyethylene (HDPE):
In 2004, global HDPE production grew to 25 million metric tons, with an estimated value of $29
billion. (Source: SRI Consulting)
Blow moulding and injection moulding are the dominant end uses in both Western Europe and
North America, accounting for 55–60% of total consumption. In contrast, consumption of HDPE in
these end uses constitutes only about 30–40% of total HDPE consumed in Japan and in Other
Asia. As a percentage of total HDPE consumption, film usage in Japan and Other Asia is over
twice as great as the film share in either the United States or Western Europe. (Source SRI
Consulting)
d) Impact of different product grades or performance specifications on market
applications
The main grades of polyethylene are the three types discussed above, namely LDPE, LLDPE and
HDPE. However, each of these types of polyethylene has various different grades, mainly to
obtain improved properties and cost effectiveness in end – applications. These grades include
variations in molecular weights and structures.
e) Level of competition in supply for major geographic export markets for upstream
products
There are a large number of polyethylene plants in operation globally. The major companies are
shown in the table below:
Table 3.1: Major Polyethylene Producers
Polymer/Rubber Type Major Identified Manufacturers
Low Density Polyethylene
(LDPE) Dow Chemical, Exxon Mobil, Basell, Sabic, BP, Atofina, Borealis, Sinopec,
Equistar, Formosa
Linear Low Density
Polyethylene (LLDPE) Dow Chemical, Exxon Mobil, Basell, Sabic, BP, Atofina, Borealis, Sinopec,
Equistar, Formosa
High Density Polyethylene
(HDPE) Dow Chemical, Exxon Mobil, Basell, Sabic, BP, Atofina, Borealis, Sinopec,
Equistar, Formosa, Chevron, Phillips

FRIDGE Chemical Sector Upstream Pricing Practices – Final Report
Ozone Business Consulting (Pty) Ltd Page 104
3.2. SA Market structure and shares of upstream chemical producers
3.2.1. Domestic industry structure
a) Feedstock for Polyethylene production
Polyethylene is manufactured from ethylene monomer. Ethylene supply in SA is concentrated with
only one supplier, namely Sasol Secunda. Sasol’s capacity is currently around 454 000 t/a; the
capacity will increase to 672 000 t/a as a result of Project Turbo.
b) Polyethylene Production
LDPE & LLDPE
The Polythene Business of Sasol Polymers produces two types of polyethylene:
• Low Density Polyethylene (LDPE) is produced by reacting ethylene with an organic
peroxide initiator in high pressure, high temperature autoclaves, utilizing ICI technology (ICI
was previously a licensor and operator of LDPE technology, but now have refocused their
business on the speciality and pharmaceutical sectors of the global chemicals market).
• Linear Low Density Polyethylene (LLDPE) is produced by reacting ethylene over a titanium
based catalyst (Ziegler Natta catalyst) in a gas phase reactor, utilizing Univation technology
(originally licensed by Union Carbide).
Stringent control of temperatures, pressures, additive, catalyst and other hydrocarbon streams
ensure that a quality finished product is produced.
The current polymer production capability of the LDPE plant is 100 000 t/a (original capacity 60
000 t/a) and that of the LLDPE plant is 150 000 t/a (original capacity 70 000 t/a), however the
LLDPE production currently is limited to approximately 100 000 t/a based on ethylene availability.

FRIDGE Chemical Sector Upstream Pricing Practices – Final Report
Ozone Business Consulting (Pty) Ltd Page 105
Figure 3.2: LDPE – Sasol Polymers Flow Diagram
Feedstock Final ProductFeedstock Final Product
Compounding
PE Resin
Additives
Packaging Warehouse
PrimaryCompression
SecondaryCompression
Reactor
CatalystInjection
Ethylene
Propane
CatalystMixing
High PressureSeparator
Recycle gas cooling
Extrusion
MasterbatchAddition
Masterbatch
Degassing
Blending
LDPEBagging
LDPEWarehouse
LDPECustomers
LDPEResin

FRIDGE Chemical Sector Upstream Pricing Practices – Final Report
Ozone Business Consulting (Pty) Ltd Page 106
Figure 3.3: LLDPE – Sasol Polymers Flow Diagram
A significant expansion of ethylene capacity will come on line in mid-2006, enabling the LLDPE
plant to run at full capacity, and the replacement of the existing LDPE plant with a state-of-the-art,
220 000 tpa operation using ExxonMobil tubular technology at a cost of over R 2 billion.
Feedstock Final ProductFeedstock Final Product
Compounding
PE Resin
Additives
Packaging Warehouse
EthyleneCompression
EthylenePurification
Reactor
CatalystInjection
Ethylene
CatalystManufacture
Degassing Extrusion
MasterbatchAddition
Masterbatch
Blending
LLDPEBagging
LLDPEWarehouse
LLDPECustomers
LLDPE Resin
Additives
Hexene-1 / Butene-1
Hydrogen
Nitrogen
Co-catalyst

FRIDGE Chemical Sector Upstream Pricing Practices – Final Report
Ozone Business Consulting (Pty) Ltd Page 107
HDPE
Dow Plastics in Sasolburg with a capacity of 160 000 tons/annum is the only HDPE producer. A
schematic diagram of the Dow Plastics process, demonstrating the complexity, is shown below:
Figure 3.4: HDPE – Dow Plastics Schematic Diagram
c) Polyethylene Market
The SA market size in 2004 for polyethylene primary polymer used in local plastic conversion was
estimated as follows:
• LDPE: 135 000 t/a
• LLDPE: 139 000 t/a
• HDPE: 158 000 t/a
• Total: 432 000 t/a

FRIDGE Chemical Sector Upstream Pricing Practices – Final Report
Ozone Business Consulting (Pty) Ltd Page 108
The breakdown of the polyethylene market is demonstrated in the following diagrams.
Figure 3.5: South African LDPE Market Breakdown
Packaging
(including
film/sheet)
83%
Injection
moulding
4%
Wire and Cable
4%
Other
9%
The LDPE market is dominated by packaging applications, particularly extruded film.
Figure 3.6: South African LLDPE Market Breakdown
Packaging
(including
film/sheet)
71%
Wire and
Cable
12%
Injection
moulding
4%
Other
13%
The LLDPE market is also dominated by packaging applications, especially extruded films and
sheeting.

FRIDGE Chemical Sector Upstream Pricing Practices – Final Report
Ozone Business Consulting (Pty) Ltd Page 109
Figure 3.7: South African HDPE Market Breakdown
Packaging
70%
Extrusion –
Pipes
13%
Other
17%
Packaging applications of various kinds, including extruded sheeting, blow-moulding and injection
moulding dominate the use of HDPE primary polymer. Polyethylene converters are shown in
Appendix 5.
3.2.2. The effect of import tariffs, anti-dumping duties and any other regulatory factors
affecting pricing
Tariff protection for base polyethylene resin products [LDPE, LLDPE, HDPE] in SA is as follows:
• Tariff protection for polymer product supplied out of non European countries is:
o 10% ad valorem import duty calculated on the FOB price
• Tariff protection for polymer product supplied out of European countries is:
o 8.4% ad valorem import duty calculated on the FOB price

FRIDGE Chemical Sector Upstream Pricing Practices – Final Report
Ozone Business Consulting (Pty) Ltd Page 110
Compared to SA, polyethylene polymer tariff protection levels (ad valorem duties only, exclude
any other surcharges or taxes) for some other countries are:
Table 3.2: Polyethylene – Tariff Protection in Other Countries
Country Duty basis on: Polyethylene
United States FOB 6.5%
China CIF 10.3%
Japan CIF 6.5%
Canada n/a None
Indonesia CIF 10.0%
Chile CIF 8.0%
Australia FOB 5.0%
Malaysia CIF 30.0%
India CIF 10.0%
3.2.3. The global nature of the industry
Polyethylene [LDPE, LLDPE, HDPE] are produced in a range of grades. These are:
• HDPE grades:
o Injection moulding
o Bottle
o Film
• LDPE and LLDPE grades:
o Commodity and special film grades,
o Extrusion coating LDPE grades,
o Injection moulding grades,
o Rotational moulding grades in pellet or ground powder form.
Polyethylene in general are regarded as a commodity product that is produced by many countries
and is well-traded in large volumes (LDPE & LLDPE: 9.9 million tons/annum; HDPE 9.2 million
tons/annum – 44 times the SA market) around the globe, demonstrating its global nature. Global

FRIDGE Chemical Sector Upstream Pricing Practices – Final Report
Ozone Business Consulting (Pty) Ltd Page 111
prices are determined by supply/demand basis on a global scale, but are particularly driven by the
Far East, due to the availability of low-cost product and ill-considered expansions in the 1990’s in
countries such as Korea, as well as the ever-growing demand from China. Global plant sizes are
also increasing, due to economies-of-scale issues.
3.3. Costs and pricing of upstream chemicals products
3.3.1. The cost structure of the industry and global comparison
The cost structure of SA based upstream operations is not directly comparable to international
polyethylene operations, in that:
a) Both polyethylene producers have integrated operations that are manufacturing both PP
and polyethylene.
b) In the case of Sasol Polymers, the production infrastructure includes an olefin purification
operation that purifies ethylene and propylene that is obtained in crude form from the Fischer
Tropsch process – this is a unique operation on a global basis.
The relative cost structures for SA based operations, compared with standard global polyethylene
operations are shown in the figure below. The international polyethylene information is based on
SRI consulting data – US Gulf Coast. It should be noted that absolute costs are higher in SA due
to the relatively small local plants.

FRIDGE Chemical Sector Upstream Pricing Practices – Final Report
Ozone Business Consulting (Pty) Ltd Page 112
Figure 3.8: Relative Polyethylene Cost Structures – SA and International (US Gulf Coast)
0
10
20
30
40
50
60
70
80
90
100
South A
fric
a
Inte
rnat
ional-H
DPE
Inte
rnatio
nal-L
LDPE
Inte
rnatio
nal-L
DPE
Olefin Feedstock Other Cost Labour Selling and overheads
Based upon these cost structures, feedstock in SA’s case is a lower portion of total costs for all
types, while other costs, which include variable and fixed manufacturing costs, but no
depreciation, are higher in SA’s case. This is partly explained by the relatively small scale of SA
plants. It should be noted in SA’s case that the feedstock used is not polymer grade ethylene, but
the raw ethylene-rich stream supplied to the Sasol Polymers purification unit from the Sasol
Secunda upstream operations. The transfer cost mechanism of this feedstock stream has not
been analysed in this report.
3.3.2. SA Production Advantages & Disadvantages
SA advantages include:
• Cost competitive ethylene feedstock based upon Fischer Tropsch synthetic fuel upstream
operations. Local shortage to be eliminated shortly.
• Globally competitive polymer production technology and facilities, especially upgraded
LDPE operations.

FRIDGE Chemical Sector Upstream Pricing Practices – Final Report
Ozone Business Consulting (Pty) Ltd Page 113
• Relatively well-developed downstream converter sector with widespread end-product
applications.
SA disadvantages include:
• Relatively small local production facilities compared to new globally competitive facilities.
• Relatively small local and regional market.
• Long distance from attractive export markets.
• Inland location of production facilities in the case of exports.
3.3.3. Upstream pricing practices with respect to downstream domestic purchasers
Local polyethylene producers sell polymer products to customers in markets which include the
RSA and other African countries, Asia, USA, Europe and South America. Their policy is to sell at
the market price prevailing in each of these regions at any time, and this also applies to sales in
South Africa.
The producers use all relevant information at their disposal to prepare for the price negotiations in
order to offer a competitive price. The price is negotiated and takes into account inter alia:
• competitive offers from other suppliers (prevailing market price),
• the quantities purchased by a customer and the costs associated with such quantities,
• requests for export or development assistance,
• distribution costs for different packaging types (viz. bags, bulk or semibulk),
• Sasol Polymers’ and Dow Plastics’ (in case of HDPE) total offering (commercial, product,
technical and service components), and
• Competing alternatives whether these are substitute materials (glass, wood, paper) or
imported finished products.
The validity of these prices is part of the negotiations and can be adjustable month by month or,
quarter by quarter, or fixed for longer periods (typically less than 6 months). Generally, there is a
price continuum across the customer base. It should be noted though that over a relatively long

FRIDGE Chemical Sector Upstream Pricing Practices – Final Report
Ozone Business Consulting (Pty) Ltd Page 114
period average delivered prices compared to average calculated prices of imports on an import
parity basis would be fairly close to each other.
Included in producers’ offering is a technical and engineering service, which is available to all
customers. This technical and engineering service covers the following aspects:
• product and application development,
• engineering expertise for converter’s equipment modification,
• technical expertise for use of complementary products,
• assistance with operation problems, and
• problem solving on converters equipment.
In order to fully explain the polyethylene producers’ domestic pricing policy, a description of global
polymer price mechanisms and their impact on South African domestic polymer prices will be
further discussed. In Appendix 3 a detailed description of international pricing practices, based
upon reference prices, is shown.
a) Europe and USA Polymer Prices:
The domestic prices of the commodity polymers (LDPE, LLDPE, and HDPE) in Europe and the
USA are targeted at levels that provide adequate long term returns on investment to producers
investing in new plants. These targeted price levels are generally achieved because the markets
are large, there are several domestic producers and levels of “dumped” imports are relatively low.
In times when installed production capacity exceeds demand, which is the norm for most of the
price cycle, high cost producers are barely able to cover their costs and cut back supply
accordingly, while those with a lower cost base will achieve a low return. During these periods,
little re-investment occurs because of the low returns and, as demand increases with time
(normally 5-6 years) a stage is eventually reached where demand exceeds installed production
capacity. At this time prices rise rapidly and high margins are earned prompting new capacity
investment and within 1-2 years, another situation of excess capacity and subsequently low
margins exist. Historically, this price cycle repeats itself every 6-8 years.

FRIDGE Chemical Sector Upstream Pricing Practices – Final Report
Ozone Business Consulting (Pty) Ltd Page 115
It is important to note that polymer producers in these regions only achieve satisfactory returns
over entire price cycles. The high returns earned for short periods during the peaks of price
cycles, and the inadequate returns experienced during the trough, balance out the average return
for the polymer producers. Hence, earnings during the peak should not be seen in isolation, nor
viewed as excessive. This need for an adequate long term average return on investment is typical
of the international polymer industry and applies to all regions, including South Africa. This is
because the polymer market is effectively a single global market and the same price cycle applies
to all producers in all regions of the world that trade with each other.
b) Far East Polymer Prices:
Until the early 1990s, prices of polymers in the Far East were set out of the USA and were
generally higher than in either Europe or the USA. When the Korean petrochemical expansions
occurred, these resulted in overcapacity in the region and a hunger for market share that eroded
margins. As a result, since the mid-1990s, prices in the Far East have been generally lower than
either Europe or the USA, and in many instances, at a level that barely covers the costs of raw
materials and failed to adequately reward the investment to a Far East producer.
c) Middle East Polymer Prices:
In recent years the very large polymer plant investments in the Middle East have had an influence
on the global supply/demand balance. Most of this production is exported into China and is
economically viable at the Far East price levels due to low feedstock costs and very efficient
economies-of-scale. The Middle East producers generally adopt a “price follower” strategy as
determined by market competition in the Far East and other export destinations.
d) South African Polymer Prices:
As with all regions in the global market, polymer prices are determined relative to the competitive
forces acting in the particular region. In order for a supplier to be successful in penetrating the
market and sustaining a market share position, the customers’ alternative purchasing options
must be considered and a competitive offering made.

FRIDGE Chemical Sector Upstream Pricing Practices – Final Report
Ozone Business Consulting (Pty) Ltd Page 116
South African polymer producers follow the above approach. They do not select a particular price
from a particular region and rigorously apply that to determine its price to the South African
domestic market. They are driven by market dynamics and react to the lowest price imports being
offered by competitive suppliers to its customers. Prices of locally manufactured substitute
materials, such as paper, metal and glass, are also monitored and considered for the market
sectors where they compete as alternatives to polymers.
During recent years, the competitive supplies have come from the Far East and the Middle East
and they therefore normally set the price levels in the South African domestic market. Hence Far
East prices are typically monitored and tracked as defined by Hong Kong CFR prices. Because
traded volume of polymer through Hong Kong (destined for China) is active, substantial and
continuous, this is a reliable, well reported and globally recognized competitive source which is
used to monitor international price trends.
As discussed above, imports into South Africa from the Middle East are potentially more
competitive and sometimes at lower prices than those from the Far East. Although imports from
the Far East (e.g. Korea) are normally the lowest priced in South Africa, pricing strategies in the
South African domestic market sometimes need to meet low priced polymer from the Middle East
and other regions.
SA polyethylene producers regularly monitor the published international polymer price data and in
addition, they are either active in both exporting and importing of commodity polymers, or they are
part of a major multinational polymer producer and are able to supplement the published
information with their own trade experience.
Competitive pricing information is also obtained from customers during supply negotiation
discussions and is often used in preference to the data obtained from the trade consultants.
The above discussed points form the basis for the market price and hence for the customer price
negotiations.

FRIDGE Chemical Sector Upstream Pricing Practices – Final Report
Ozone Business Consulting (Pty) Ltd Page 117
In addition, the local cost of feedstock (ethylene in the case of polyethylene), also has to be taken
into consideration. In the case of Dow Plastics, this price is determined by Sasol Polymers, which
is their major source of the feedstock.
e) Rebates and discounts
Individual customers’ prices are negotiated taking into account a number of factors which includes
the quantities purchased by a customer, which typically results in larger customers receiving a
more favourable price.
There are special pricing schemes available to all customers (large and small) and include:
• Rebates for the development of new products and markets to compete with alternative
materials,
• Rebates to compete with imports of finished goods, and
• Rebates for exports of finished goods (export rebate).
The first two rebate schemes are available for a specific application or development, are
applicable for a limited period and limited to the volume for the specific purchases (that is not
across the full volume of polymer purchased). These rebates are specifically designed to facilitate
or assist:
• Converter development and introduction of products into the market by reducing the cost of
the raw material during the early stages of the product life cycle (namely development,
market introduction and acceptance),
• Converter competitiveness in the export market to overcome competitors who may have
geographic, labour cost, governmental incentives, fiscal or other competitive advantages,
• Converters to be more competitive in the local market against final product imports from
international converters (which is sometimes dumped) who have labour cost, governmental
incentives, fiscal or other competitive advantages.

FRIDGE Chemical Sector Upstream Pricing Practices – Final Report
Ozone Business Consulting (Pty) Ltd Page 118
f) Upstream suppliers’ view on Actual Pricing Mechanism Versus Import Parity Pricing
Firstly it needs to be understood that prices quoted to South African converters are export prices
and not domestic prices of exporting regions. Export prices are always lower (up to 25%) when
compared to domestic prices and are generally based on marginal costings. However, it should be
noted that in producing countries where average costs are fairly constant (as it in the case in the
South African polymer manufacturing industry), marginal costs are usually equal to average costs.
Also, in South Africa’s case, variable costs are higher than the international norm because of poor
economies of scale. It should also be noted that where marginal costing is practiced it is used only
in the short term. In section 2.3.3 a more detailed explanation of the definition and calculation of
IPP, based upon PP is provided.
The pricing mechanism prevailing in South Africa is one where the price is negotiated, based on
offers in an open market where products are readily traded across national boundaries. The
outcome is that the most competitive supplier sets the price and this is better referred to as market
pricing. This pricing methodology is commonly seen internationally in most countries that are
signatories to the WTO. It prevails in countries with a free, open-access market, rather than the
regulated price-setting typically found in centrally planned economies. In South Africa this
situation is no different as locally produced products compete with imports. The application of this
method of pricing is such that it directly links the domestic price to the international price. It also
brings a country’s pricing practices in line with all the countries that are signatories to the WTO
and its rules on trade and eliminates the creation of subsidies throughout polymer value chain.
An aspect that should be borne in mind is that the price of the imported product is typically set by
the spot price of another region, which is substantially lower than that region’s domestic price, as it
is set by producers incorporating only their marginal operational costs. International domestic
prices are normally “delivered prices”. In most producing countries the domestic supply typically
consumes a significant portion of the producers’ volume, so enabling the export volumes to be
priced using marginal costing. This results in domestic delivered prices in countries that compete
through trade, having domestic delivered prices that are broadly in the same range, as is the case
in South Africa. This is due to the combination of freight and duty values not being too dissimilar to
the difference between domestic price and spot in the exporters’ market.

FRIDGE Chemical Sector Upstream Pricing Practices – Final Report
Ozone Business Consulting (Pty) Ltd Page 119
Import parity pricing is a mechanistic formula driven calculation and is done by specifically
calculating a price based on what it would have cost to import the product based on published
price data and is thus a proxy or estimate of the local delivered price of a competitive imported
product to a downstream converter. This would include all inward transport and other real costs
that would be associated with importing the polymer into South Africa. The breakdown below
gives an example of these considerations:
Table 3.3: Polyethylene – Import Parity Price Calculation
Estimated Import Parity Price
= FOB (lowest cost source)(1) Based on published information
(ICISLOR, Platts or Harriman)
+ Freight from source to Durban (South
Africa)
Cost to get polymer to South Africa
+ Freight insurance Insurance on goods in transit
Convert to Rands Above normally quoted in US Dollars
+ Logistic costs includes
• Landing cost • Transport cost (Inland / coastal) • Duty (ad valorem duty on FOB
price in rands)
Landing Costs comprise of terminal
handling costs, wharfage – Cargo
dues, Carrier service fee, Agency fee,
Handover and document fees and
disbursements on landing and
wharfage, and duty and customs
VAT.
Transport costs for inland would
include container turn in and railage.
Transport cost for coastal would
include cartage to customer.
Duty currently 10% of FOB price.
+ Indirect costs Adjusts for example stock holding
costs, payment terms, LC costs,
container destuffing and warehousing

FRIDGE Chemical Sector Upstream Pricing Practices – Final Report
Ozone Business Consulting (Pty) Ltd Page 120
costs
Note 1: A FOB (free on board) is a INCO 2000 term, in which the responsibility of the supplier is transferred to the buyer when the goods have been delivered on the rail of named carrier at a named port. As discussed, FOB prices are normally spot sale values and are lower than the corresponding domestic price, as the prices are normally based on the producers marginal cost of production.
The difference between market pricing and import parity pricing is that in the case of the former
prices change continuously based on the cheapest available source at a particular point in time. In
the case of import parity pricing, the price is calculated on the basis of a published price in a
specific region or country and the ultimate price is formula-based. Furthermore, in the case of
market pricing, customers monitor prices from all major trading regions and the lowest price
available at any point in time is then used by them as a basis for negotiations with their polymer
supplier.
3.4. Major downstream industries that purchase upstream products
3.4.1. End-use structure
The local polyethylene polymer market in 2004 was estimated as follows:
• LDPE: 135 000 tons/annum, Supplied mainly by Sasol Polymers and around 31% imported
polymer
• LLDPE: 139 000 tons/annum, Supplied mainly by Sasol Polymers and around 38%
imported polymer
• HDPE: 158 000 tons/annum, Supplied mainly by Dow Plastics and around 21% imported
polymer
The end-use structure for polyethylene polymer is segmented into the grade of polymer used, as
well as the conversion technology employed.

FRIDGE Chemical Sector Upstream Pricing Practices – Final Report
Ozone Business Consulting (Pty) Ltd Page 121
LDPE
The film commodity grades are the dominant grades. Internationally, the extrusion coating and
injection moulding grades prices are generally 3 – 4% higher than the commodity film grades, in
the South African market similar prices is achieved.
Film grades account for around 82% of LDPE demand. Major uses include consumer food and
beverage shrink, collation films and shrink pallet shrouds, Industrial liners, dunnage bags, surface
protection and bulk bags, consumer thin printed films such as hygiene film, bread bags, liquid
packaging, Fertilizer, polymers, pet food, compost and nursery substrates, building sand and
many others.
Moulding grades account for around 12% of demand. Extrusion grades account for around 6% of
demand. Major uses include colour and additive masterbatches and igniter cord jacketing.
The upstream polymer supplier has primary volume segregation which divides the customer base
into small and large customers. This threshold is the ability of the customers to take full truck
loads of polymer per delivery. Customer order requirements for less than the threshold are
referred to an in-house distribution company, who provide a break bulk service in which the
customers are supplied with their required quantities (ranging from 1 bag of polymer (25kg) to a
few ton deliveries). Full truck loads for LDPE equate to 20 ton deliveries. The volume classification
for commodity customers is as follows:
Segment Size (tpa) Volume (%)
Large Groups and large independents > 1999 58%
Small groups and medium independents Between 1000 and 1999 18%
Small independents Between 20 and 999 24%
The average price spread across all these groups is typically less than 4% (largest to smallest).

FRIDGE Chemical Sector Upstream Pricing Practices – Final Report
Ozone Business Consulting (Pty) Ltd Page 122
LLDPE
The film commodity grades are the dominant grades. Internationally, the injection moulding grades
prices are generally 3 – 4% higher than the commodity film grades, in the South African market
similar prices is achieved.
Film grades account for around 71% of LLDPE demand. Major uses include Industrial liners,
dunnage bags, surface protection and bulk bags, consumer thin printed films such as hygiene film,
bread bags, liquid packaging, hand wrap, domestic cling film, pallet machine stretch and power
stretch film, fertilizer, polymers, pet food, compost and nursery substrates, building sand and
many others.
Moulding grades account for around 24% of demand. Major uses include chemical and water
tanks, fuel tanks, crayfish traps, filtration units, caps and closures and general house ware
containers.
Extrusion grades account for around 5% of demand. Major uses include pipe extrusion, e.g. drip
feed irrigation pipes.
The upstream polymer supplier has primary volume segregation which divides the customer base
into small and large customers. This threshold is the ability of the customers to take full truck
loads of polymer per delivery. Customer order requirements for less than the threshold are
referred to an in-house distribution company, who provide a break bulk service in which the
customers are supplied with their required quantities (ranging from 1 bag of polymer (25kg) to a
few ton deliveries). Full truck loads for LLDPE equate to 20 ton deliveries. The volume
classification for commodity customers is as follows:
Segment Size (tpa) Volume (%)
Large Groups and large independents > 1999 58%
Small groups and medium independents Between 1000 and 1999 18%
Small independents Between 20 and 999 24%

FRIDGE Chemical Sector Upstream Pricing Practices – Final Report
Ozone Business Consulting (Pty) Ltd Page 123
The average price spread across all these groups is typically less than 4% (largest to smallest).
HDPE
The vast majority of HDPE grades, be it injection moulding, blow moulding and film extrusion trade
within a narrow band of around US$20/ton, or 1.8% of the current polymer price. An estimated
20% of the business consists of drum and tape, which is fetching a further $20 premium (3.6% of
current polymer price) and pipe which may cost $80-100/t more than commodity materials (around
8% more).
Injection moulding grades account for around 24% of HDPE demand. Major end-uses are crates,
mobile refuse bins and sundry moulding.
Blow moulding grades account for around 40% of demand. Major uses include smaller containers
for milk and fruit juice bottles, detergents, cosmetics and toiletries, as well as larger drums for
agricultural and general chemicals, fruit concentrates and, lubrication oil.
Extrusion grades account for around 36% of demand. Major uses include film for retail packaging
as well as knitted or woven products used for shade and other netting, vegetable and fruit bags.
The upstream polymer supplier has primary volume segregation which divides the customer base
into small and large customers. This threshold is the ability of the customers to take full truck
loads of polymer per delivery. Customer order requirements for less than the threshold are
referred to a distribution company, who provide a break bulk service in which the customers are
supplied with their required quantities (ranging from 1 bag of polymer (25kg) to a few ton
deliveries). Full truck loads for HDPE equate to 33 ton deliveries. Around 45% of sales are to large
companies that consume in excess of 10 000 t/a of HPDE polymer.

FRIDGE Chemical Sector Upstream Pricing Practices – Final Report
Ozone Business Consulting (Pty) Ltd Page 124
3.4.2. Impact of feedstock cost on total cost structure
Based on limited respondent input (14 respondents), polyethylene polymer accounts for 50 – 73%
of cost-of-sales, with the balance shared between other manufacturing costs (mainly labour), and
sales/administration/distribution costs.
3.4.3. Organisation of downstream players
The Plastics Federation of South Africa (PFSA) is an umbrella body for the plastics value chain
under which there are several associations. The Plastics Converters Association (PCA)
represents the interests of converters in the plastics industry. The PCA is the biggest association
in terms of membership with 316 members. There are also associations such as the South African
Polymer Importers Association (SAPIA) that represent the interests of 12 importers in the industry.
SAMPLAS is an association that represents 14 suppliers of machinery to the plastics industry
while the Plastics Institute of South Africa (PISA) represents individuals in the industry. Other
associations or interest groups in the plastics value chain are Association of Rotational Moulders
of South Africa (ARMSA) which has a membership of 43 companies 13 of which are outside of
South Africa, Expanded Polystyrene Association of South Africa (EPASA), South African Plastic
Pipe Manufacturers Association (SAPPMA), and Institute of Materials (IoM). The following
associations still exist but are no longer active in the plastics industry, Plastic Mould Makers
Association (PMMA), Polyurethane Association of South Africa (PASAF), and Plastic Distributors
Association of South Africa (PDASA).
3.4.4. Downstream sector ability to influence input prices received
Downstream respondents indicated that they have very little leverage to influence prices for
polyethylene polymer, except for volume, which result in relatively small discounts.
3.4.5. Duty Structures and anti-dumping measures
Tariff protection for downstream polyethylene plastic products is extensive. The table below
indicates specific tariff headings that consist of either polyethylene based products, or could

FRIDGE Chemical Sector Upstream Pricing Practices – Final Report
Ozone Business Consulting (Pty) Ltd Page 125
potentially be made of polyethylene. The tariff protection quoted is the general tariff, and excludes
the EC.
Table 3.4: Polyethylene End-products – Tariff Protection in SA
Other 39.17.10.90 10%
Other 39.17.21.90 15%
Of polymers of ethylene, seamless 39.17.32.20 15%
Of polymers of ethylene, seamless without fittings 39.17.39.20 15%
Of polymers of ethylene 39.19.10.10 15%
Of polymer of ethylene 39.19.90.10 15%
Of polymers of ethylene 39.20.10 15%
Of polymers of ethylene 39.21.19.40 15%
Other, of polymers of ethylene 39.21.90.26 15% Textile fabrics embedded in or coated or covered on both sides with polymerisation or copolymerisation products 39.21.90.64 15%
Of other polymerisation or copolymerisation products 39.21.90.66 15%
Baths, shower-baths and wash-basins 39.22.10 20%
Lavatory seats and covers 39.22.20 20%
Other 39.22.90 20%
Of polymers of ethylene 39.23.21 15%
Carboys, bottles, flasks and similar articles 39.23.30 15%
Other 39.23.40.90 15%
Stoppers, lids caps and other closures 39.23.50 15%
Other 39.23.50.90 15% Capsules and tubular neckbands, for bottles and similar containers 39.23.90.20 5%
Other 39.23.90.90 15%
Tableware and kitchenware 39.24.10 20%
Other 39.24.90 20% Reservoirs, tanks, vats and similar containers, of a capacity exceeding 300 litre 39.25.10 20%
Doors, windows and their frames and thresholds for doors 39.25.20 20% Shutters, blinds (including venetian blinds) and similar articles and parts thereof 39.25.30 20%
Other 39.25.90 20%
Office or school supplies 39.26.10 20%
Other 39.26.20.90 20%
Fittings for furniture, coachwork or the like 39.26.30 20%
Statuettes and other ornamental articles 39.26.40 20%
Beads, not coated with pearl essence 39.26.90.03 15%
Transmission belts 39.26.90.20 5%
Power transmission line equipment 39.26.90.25 5%
Other 39.26.90.90 20%
In most cases where tariff protection is applicable the rate is in the order of 15 – 20%, which is
higher than the 10% applicable to primary polyethylene polymer.

FRIDGE Chemical Sector Upstream Pricing Practices – Final Report
Ozone Business Consulting (Pty) Ltd Page 126
None of the downstream respondents have indicated any anti-dumping investigation, or action, in
any of their polyethylene based products.
3.5. International competitiveness of South African chemicals pricing
3.5.1. Introduction
It is important in the analysis of pricing that a common understanding of pricing terminologies is
agreed upon, especially in the context of a comparative analysis. The main issue that is involved
is the concept of an inland price for products, which is the price paid by local customers in a
particular country [which can be based on a delivered, or ex-factory basis], compared to export
prices, which are the export based prices for producers in a particular country.
The competitiveness of South African chemicals pricing is dealt with under the following headings:
• Historical SA feedstock market volumes and pricing levels
• Comparison of SA inland prices for feedstock with international prices
• Historical sales levels for key downstream products
• Basis for SA pricing calculations
• Key differentiation factors for purchasing feedstock
• Operations: (Upstream/ Downstream: Basis for operation [e.g. 24/7]; Average age and
original cost of equipment; Capacity utilisation; Workforce)
• Assessment of global competitiveness of downstream producers
• Ability for downstream to expand product range based on lower feedstock prices Impact of
current pricing practices (Skills; Wages; Technology; Long-term sustainability; Import
replacement)
3.5.2. Historical SA feedstock market volumes and pricing levels
The historical local and export sales volumes of LDPE and delivered prices are shown in the
figures below. For commercial sensitivity no actual data values are published on the chart.

FRIDGE Chemical Sector Upstream Pricing Practices – Final Report
Ozone Business Consulting (Pty) Ltd Page 127
Figure 3.9: Historical Local & Export Volumes – LDPE
0
20000
40000
60000
80000
100000
120000
2000 2001 2002 2003 2004
Year
Metr
ic t
on
s
Local Sales from localProduction
Export Sales from localProduction
Imports
Local sales from local production are showing a general constant pattern, while imports are
showing a relative growth pattern. Exports are generally small and have been constant for the last
few years.
Figure 3.10: Historical Local & Export Volumes – LLDPE
0
20000
40000
60000
80000
100000
120000
2000 2001 2002 2003 2004
Year
Metr
ic t
on
s
Local Sales from localProduction
Export Sales from localProduction
Imports
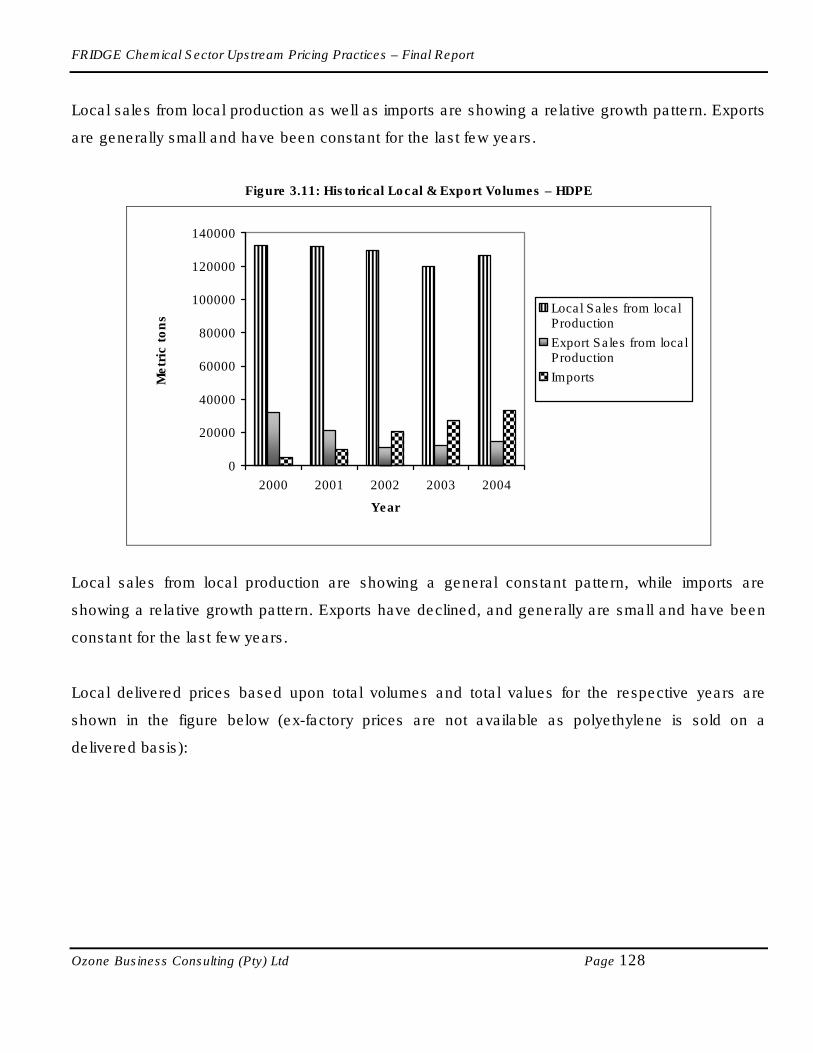
FRIDGE Chemical Sector Upstream Pricing Practices – Final Report
Ozone Business Consulting (Pty) Ltd Page 128
Local sales from local production as well as imports are showing a relative growth pattern. Exports
are generally small and have been constant for the last few years.
Figure 3.11: Historical Local & Export Volumes – HDPE
0
20000
40000
60000
80000
100000
120000
140000
2000 2001 2002 2003 2004
Year
Metr
ic t
on
s
Local Sales from localProduction
Export Sales from localProduction
Imports
Local sales from local production are showing a general constant pattern, while imports are
showing a relative growth pattern. Exports have declined, and generally are small and have been
constant for the last few years.
Local delivered prices based upon total volumes and total values for the respective years are
shown in the figure below (ex-factory prices are not available as polyethylene is sold on a
delivered basis):
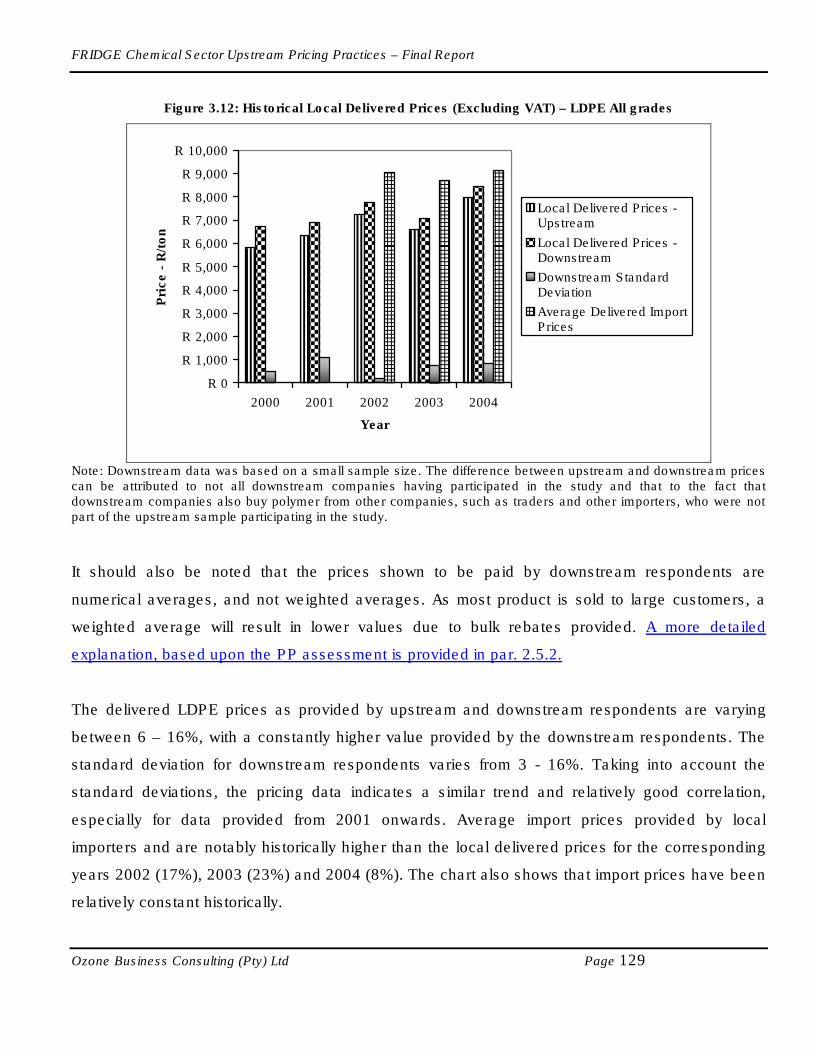
FRIDGE Chemical Sector Upstream Pricing Practices – Final Report
Ozone Business Consulting (Pty) Ltd Page 129
Figure 3.12: Historical Local Delivered Prices (Excluding VAT) – LDPE All grades
R 0
R 1,000
R 2,000
R 3,000
R 4,000
R 5,000
R 6,000
R 7,000
R 8,000
R 9,000
R 10,000
2000 2001 2002 2003 2004
Year
Pri
ce -
R/t
on
Local Delivered Prices -Upstream
Local Delivered Prices -Downstream
Downstream StandardDeviation
Average Delivered ImportPrices
Note: Downstream data was based on a small sample size. The difference between upstream and downstream prices can be attributed to not all downstream companies having participated in the study and that to the fact that downstream companies also buy polymer from other companies, such as traders and other importers, who were not part of the upstream sample participating in the study.
It should also be noted that the prices shown to be paid by downstream respondents are
numerical averages, and not weighted averages. As most product is sold to large customers, a
weighted average will result in lower values due to bulk rebates provided. A more detailed
explanation, based upon the PP assessment is provided in par. 2.5.2.
The delivered LDPE prices as provided by upstream and downstream respondents are varying
between 6 – 16%, with a constantly higher value provided by the downstream respondents. The
standard deviation for downstream respondents varies from 3 - 16%. Taking into account the
standard deviations, the pricing data indicates a similar trend and relatively good correlation,
especially for data provided from 2001 onwards. Average import prices provided by local
importers and are notably historically higher than the local delivered prices for the corresponding
years 2002 (17%), 2003 (23%) and 2004 (8%). The chart also shows that import prices have been
relatively constant historically.
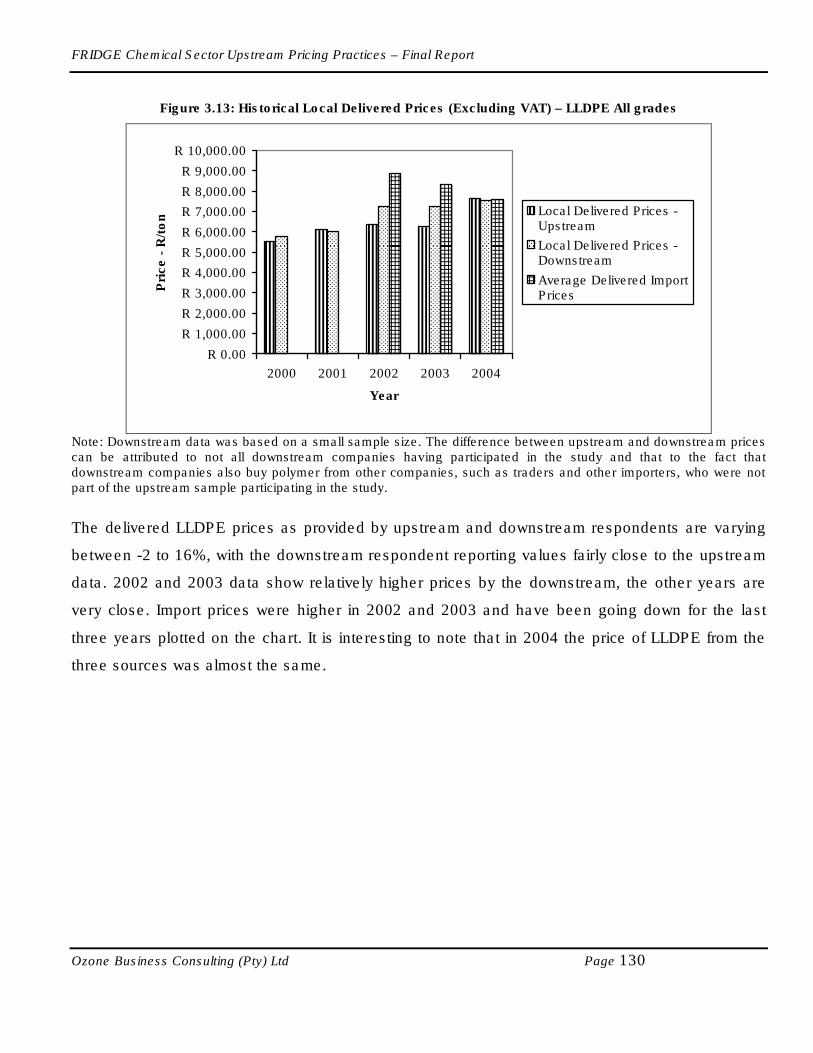
FRIDGE Chemical Sector Upstream Pricing Practices – Final Report
Ozone Business Consulting (Pty) Ltd Page 130
Figure 3.13: Historical Local Delivered Prices (Excluding VAT) – LLDPE All grades
R 0.00
R 1,000.00
R 2,000.00
R 3,000.00
R 4,000.00
R 5,000.00
R 6,000.00
R 7,000.00
R 8,000.00
R 9,000.00
R 10,000.00
2000 2001 2002 2003 2004
Year
Pri
ce -
R/t
on Local Delivered Prices -
Upstream
Local Delivered Prices -Downstream
Average Delivered ImportPrices
Note: Downstream data was based on a small sample size. The difference between upstream and downstream prices can be attributed to not all downstream companies having participated in the study and that to the fact that downstream companies also buy polymer from other companies, such as traders and other importers, who were not part of the upstream sample participating in the study.
The delivered LLDPE prices as provided by upstream and downstream respondents are varying
between -2 to 16%, with the downstream respondent reporting values fairly close to the upstream
data. 2002 and 2003 data show relatively higher prices by the downstream, the other years are
very close. Import prices were higher in 2002 and 2003 and have been going down for the last
three years plotted on the chart. It is interesting to note that in 2004 the price of LLDPE from the
three sources was almost the same.

FRIDGE Chemical Sector Upstream Pricing Practices – Final Report
Ozone Business Consulting (Pty) Ltd Page 131
Figure 3.14: Historical Local Delivered Prices (Excluding VAT) – HDPE All grades
0
1000
2000
3000
4000
5000
6000
7000
8000
9000
10000
2000 2001 2002 2003 2004
Year
Pri
ce -
R/t
on
Local Delivered Prices -Upstream
Local Delivered Prices -Downstream
Downstream StandardDeviation
Average Delivered ImportPrices
Note: Downstream data was based on a small sample size. The difference between upstream and downstream prices can be attributed to not all downstream companies having participated in the study and that to the fact that downstream companies also buy polymer from other companies, such as traders and other importers, who were not part of the upstream sample participating in the study.
It should be noted that the prices shown to be paid by downstream respondents are numerical
averages, and not weighted averages. As most product is sold to large customers, a weighted
average will result in lower values do bulk rebates provided.
The delivered HDPE prices as provided by upstream and downstream respondents are varying
between 5 – 21%, with a constantly higher value provided by the downstream respondents. The
standard deviation for downstream respondents varies between 4 – 12%. Taking into account the
standard deviations, the pricing data indicates a similar trend and relatively good correlation.
Variance between downstream pricing data and data supplied by importers is 11%, 17%, and 4%
for 2002, 2003, and 2004, respectively.
3.5.3. Comparison of SA inland prices for feedstock with international prices
The background to international pricing as well as sources for data is discussed in Appendix 3 and
in Chapter 1. The trend and the general relationships are more important to gain insight into the
fundamentals than a comparison of prices in a particular month.

FRIDGE Chemical Sector Upstream Pricing Practices – Final Report
Ozone Business Consulting (Pty) Ltd Page 132
The derived prices for China and India are preliminary, as the consultant is seeking confirmation
from international consultants of some of the assumptions used in the build-up of the derived
import parity price. The choice of India and China as countries for comparison with South Africa is
because both countries are large import markets for polymers. The comparison for polyethylene is
shown separately for LDPE, LLDPE and HDPE.
a) LDPE
Figure 3.15: SA and International LDPE Domestic Prices
LDPE: COMPARISON OF DOMESTIC PRICES (DELIVERED TO CONVERTER)
400
600
800
1,000
1,200
1,400
1,600
1,800
2,000
2,200
Jan-94 Jan-95 Jan-96 Jan-97 Jan-98 Jan-99 Jan-00 Jan-01 Jan-02 Jan-03 Jan-04 Jan-05
US
$/t
on
ne
CHINA NW EUROPE USA South Africa INDIA
When comparing average LDPE prices as obtained from downstream respondents, SA domestic
prices are still in the middle-to-lower end of the price band; these average prices (in US$) are as
follows:

FRIDGE Chemical Sector Upstream Pricing Practices – Final Report
Ozone Business Consulting (Pty) Ltd Page 133
o 2000: $ 969
o 2001: $ 797
o 2002: $ 736
o 2003: $ 949
o 2004: $ 1 303
b) LLDPE
Figure 3.16: SA and International LLDPE Domestic Prices
LLDPE: COMPARISON OF INTERNATIONAL DOMESTIC PRICES (DELIVERED TO
CONVERTER)
200
400
600
800
1,000
1,200
1,400
1,600
1,800
Jan-94 Jan-95 Jan-96 Jan-97 Jan-98 Jan-99 Jan-00 Jan-01 Jan-02 Jan-03 Jan-04 Jan-05
US
$/t
on
ne
CHINA NW EUROPE USA South Africa INDIA
When comparing average LLDPE prices as obtained from downstream respondents, SA domestic
prices are still in the middle-to-lower end of the price band; these average prices (in US$) are as
follows:
o 2000: $ 833

FRIDGE Chemical Sector Upstream Pricing Practices – Final Report
Ozone Business Consulting (Pty) Ltd Page 134
o 2001: $ 691
o 2002: $ 689
o 2003: $ 973
o 2004: $ 1 165
c) HDPE
Figure 3.17: SA and International HDPE Domestic Prices
HDPE: COMPARISON OF INTERNATIONAL DOMESTIC PRICES (DELIVERED TO CONVERTER)
400
600
800
1,000
1,200
1,400
1,600
1,800
2,000
Jan-94 Jan-95 Jan-96 Jan-97 Jan-98 Jan-99 Jan-00 Jan-01 Jan-02 Jan-03 Jan-04 Jan-05
US
$/t
on
CHINA NW EUROPE USA South Africa INDIA
When comparing average HDPE prices as obtained from downstream respondents, SA domestic
prices are still in the middle-to-lower end of the price band; these average prices (in US$) are as
follows:
o 2000: $ 923
o 2001: $ 823
o 2002: $ 731
o 2003: $ 933

FRIDGE Chemical Sector Upstream Pricing Practices – Final Report
Ozone Business Consulting (Pty) Ltd Page 135
o 2004: $ 1 303
Some conclusions and commentary on the data shown above are as follows:
• Prices around the world are linked.
• In any month, there can be a very wide variation in the prices. The following are some of
the reasons:
o The derived import parity prices (for India and China) assume an instantaneous
connection with the Reference Price (CFR Hong Kong). In reality there is a time lag
of between 6 and 8 weeks.
o Fluctuations in the currencies in relation to the US$ will have an impact because in
all countries (except the USA) the prices paid by local converters is in the local
currency.
o During periods of regional shortages or surpluses, international and local
supply/demand balances will play a role. For example, during the periods of tight
supply, the local domestic prices in the USA were considerably higher than those in
Europe and Asia. Due to supply constraints, it was not possible to physically ship
product to the (massive) US market and the local producers were able to maintain
prices higher than import parity (from Europe or the Middle East).
• In the early part of the period under review, there was a big variation in the prices for all
polymers. The major factor contributing to this is that China and India had relatively high
import duties (>35%), but these have been reduced and this has brought the prices across
all countries covered much closer together.
• Prices paid by South African converters are generally not out of line with prices paid in the
countries included in the comparison. In the early part of the period under review, the
prices in South Africa were much lower than those in China and India. However, as
imports into China have grown over the period the CFR Hong Kong price has fallen to the
low end of the range. In addition, import duties have fallen. Both factors have contributed
to a narrowing of the gap between prices in South Africa and those in China.
• For the monthly comparison over the recent past years, there have been periods when the
price in China was lower (sometimes considerably so) than the price in South Africa.

FRIDGE Chemical Sector Upstream Pricing Practices – Final Report
Ozone Business Consulting (Pty) Ltd Page 136
However, this comparison does not take into account the fact that there is a 6-10 week lag
between the prices in South Africa and the prices in China. From the analysis of only the
recent data it seems that prices in China have on average been lower than those in South
Africa, even if a price lag is taken into account. A contributing factor is that the cost of
shipping has been high in relation to the cost of shipping a few years back. The shipping
cost is expected to fall to a more normal/acceptable range.
3.5.4. Historical sales levels for key downstream products
Polyethylene polymers are used to manufacture a large range of end-products, including
packaging products such as consumer food and beverage shrink, collation films and shrink pallet
shrouds, Industrial liners, dunnage bags, surface protection and bulk bags, as well as many other
types.
The figure below indicates for few product categories the historical growth in output, as supplied
by a small number of downstream respondents.
Figure 3.18: Historical SA Sales – Polyethylene Derivatives
0
10000
20000
30000
40000
50000
60000
70000
80000
90000
100000
2000 2001 2002 2003 2004
Year
Metr
ic t
on
s
HDPE - Crates HDPE - Up to 5l bottles HDPE - Pipes HDPE - Film
Note: No useful information obtained on other product categories
FRIDGE Chemical Sector Upstream Pricing Practices – Final Report
Ozone Business Consulting (Pty) Ltd Page 137
The overall growth in selected HDPE products indicates a cyclical nature. The film category,
however, was severely impacted by governments regulations related to the use of thin-walled
carrier bags, and a major decline has manifested itself since 2003. The other product categories
are showing a general growth pattern.
3.5.5. Basis for SA Downstream Products pricing calculations
According to the small sample of downstream respondents, product pricing is based upon the cost
of production, and converters are striving to achieve an acceptable return on capital. They also
have to take into consideration perceived value of the end product, alternatives [e.g. other
materials such as glass], inflation and exchange rates. With large customers price negotiations
take place once a year.
However, due to the large number of downstream competitors, they have little leverage on their
customers, which are often companies much larger than themselves. They have some leverage in
terms of prices, based upon polymer cost increases, or oil price movements, which generally
impact on polymer prices as well as wage negotiations. However, the downstream pricing
mechanisms typically require a period of around 3 months before polymer price changes can be
incorporated, while upstream price changes are effected sooner. This was disputed by “the
downstream of downstream”, that is, the retailers, who mentioned during discussions on demand
elasticity that converters implement polymer price changes immediately. However, no pricing data
was collected from them.
3.5.6. Key differentiation factors for purchasing feedstock
Suppliers are chosen on the basis of quality, continuity of supply and price.
3.5.7. Downstream Operations
Basis for operation [e.g. 24/7]
All respondent operations are operating on a 24hour basis, but only 56% operate 7 days/week,
and the balance 5 days/week.

FRIDGE Chemical Sector Upstream Pricing Practices – Final Report
Ozone Business Consulting (Pty) Ltd Page 138
Average age and original cost of equipment
The age of PP converting equipment reported by the respondents varies from 2 – 12 years with an
average of around 7.5 years. The average original cost of equipment is R25 million.
Capacity utilisation
Capacity utilisation varies between 60% and 95%, with an average of 76%, not taking into account
idle weekend time.
Workforce
The average number of the workforce for respondent companies is 390, with around 82% in
manufacturing.
3.5.8. Assessment of global competitiveness of downstream producers
Downstream respondents indicated that polyethylene conversion in SA is competitive, except for a
few issues. The issues mentioned were:
• Small local market necessitates short production runs and low capacity utilisation.
• Some respondents are adamant that they are competitive in all respects, except for
polymer prices, where the 10% duty prevents them from penetrating export markets.
• SA’s overheads are high [a function of economies-of-scale], while shipping costs to export
markets for bulky products are also high.
• Competing countries such as China have much lower wages.
Downstream respondents have commented that integrated international producers such as
Formosa Plastics are accused of transferring polymer at marginal cost to conversion operations
for exports. This is a major problem for plastic converters all around the world. In China,
converters that are based in an "export processing zone" do have access to lower priced polymers
because they do not have to pay import duties provided the polymer is converted into a product
that is exported.

FRIDGE Chemical Sector Upstream Pricing Practices – Final Report
Ozone Business Consulting (Pty) Ltd Page 139
The difficulty arises from the fact that converters in South Africa supplying product into the
domestic market sometimes have to compete with Chinese (and other Asian converters) that have
access to polymers at less-than-the-domestic price because they are located in export processing
zones or have access to polymer at special prices. This is where anti-dumping regulations are
supposed to help and aggrieved converters can call upon the government to evaluate if dumping
is taking place. Proving that any product from China is dumped is very difficult.
The problem of transfer pricing of polymer to a conversion operation is real and does exist.
Technically, this is illegal and not allowed under WTO rules and anti-dumping measures can be
made against such an exporter. However, once again proving that dumping is taking place is not
easy and in the time between dumped imports arriving and proving a case can take more than
twelve months. Trade policies are important in enhancing the competitiveness of a country.
However the available countervailing measures are not uniformly applied in all countries.
3.5.9. Ability for downstream to expand product range based on lower feedstock prices
Respondents are unsure of their ability to expand based on lower feedstock prices. One
respondent indicated that they export an extruded intermediary product that is very cost sensitive,
and lower feedstock will result in higher volumes. Some respondents are, however confident that
they could increase by 25 – 50% on the basis of increased exports, as well as substitution of other
materials, should polymer prices decrease by the rate of duty [10%].
3.5.10. Impact of current polyethylene polymer pricing practices
Skills
Downstream respondents generally do not see a major effect on skills levels caused by current
pricing practices, although there is a feeling that high polymer prices necessitates multi-skilling, in
that minimum workers are employed, and existing workers have to do more tasks. Upstream
respondents commented that the growth of the local polymer industry has encouraged and
required the development of technical, managerial, business and operational skills that are
necessary to efficiently conduct business through the whole polymer value chain. The
downstream conversion industry in South Africa is relatively well developed and typically follows

FRIDGE Chemical Sector Upstream Pricing Practices – Final Report
Ozone Business Consulting (Pty) Ltd Page 140
international polymer industry value chain norms; namely large national conversion companies,
large independent companies and multitude of smaller entrepreneurial type operations. These
companies can either focus on polymer conversion or can be multifaceted companies specialising
in, for example, packaging irrespective of material type - steel, glass, paper or polymer.
Wages
Downstream respondents generally feel that wages are agreed by in bargaining councils, and are
not influenced by feedstock pricing, although increasing polymer costs are placing pressure on
wages. The downstream focus could also become more focused on labour intensive operations
adding further value to end-products, but this requires lower material costs.
Upstream respondents commented that the polymer pricing practices have allowed for the
sustained development and growth of the downstream industry, the major employers of labour
within this industry.
Technology
Downstream respondents believe that low margins caused by upstream labour practices are a
major driver towards more capital intensive equipment, in order to improve productivity. One
respondent indicated that high polymer prices are forcing innovative approaches in existing
practises, sometimes leading to improvements. Some respondents, however, feel that they do not
make enough margin to invest in necessary new technology.
Upstream respondents commented that the sophistication of the South African end user market is
comparable with that of developed countries and hence the local polymer conversion industry is
required to keep pace with global developments in polymer technology. Consumer requirements
for specialised applications in turn require that the conversion industry invests in the necessary
skills and equipment to facilitate the development and production of these applications and
products (import replacement). Hence the upstream polymer production industry assists the
conversion industry by developing new grades, enhancing and modifying existing grades to meet
these requirements. Thus both the upstream and downstream industry players are required to
track and apply changes in polymer technology into their operations and product offering.

FRIDGE Chemical Sector Upstream Pricing Practices – Final Report
Ozone Business Consulting (Pty) Ltd Page 141
Long-term sustainability
Downstream respondents have concerns that the long-term sustainability of the downstream
sector is threatened by the economies of scale and high capital re-investment in China in
particular. Current pricing practices do not offer anything special to enhance exports, and thereby
helping to alleviate the negative impact of the small domestic market. Another constraint against
long-term sustainability is that polymer is effectively priced at spot prices, causing large
fluctuations that are hampering long-term planning.
Upstream respondents feel that to keep pace with growth, long term sustainability of the local
polymer industry will be required to expand its operations to meet the increased demand and this
can only continue if all parts of the polymer value chain are profitable and the invested capital
(equipment and skills) is adequately rewarded.
Import replacement
Downstream respondents believe that current polymer pricing practises have created little
incentive for end-users to source locally, especially as end-products have similar mass to volume
rations as the primary polymer. The only drivers left for import replacement are convenience and
“Quick response” issues. In some polyethylene products imports are low due to duties as well as
bulkiness of products.
Upstream respondents view is that if the alternative is considered for a moment (no local polymer
production and all polymer goods are imported), the polymer conversion industry would be
significantly exposed to the global supply and demand balances which would manifest itself in
reliability of supply and would significant expose the domestic market to price fluctuations and
polymer merchants wishing to take advantage of the import situation. Secondly, South Africa itself
would not be able to handle the importation of these vast quantities of polymer raw materials and
the market would likely switch to the importation of semi finished goods and final products which
would significant damage the South African polymer conversion industry. The current pricing
practices have allowed for the growth and development of the local polymer conversion industry
as supplied by local production and as such facilitated the replacement of imports (polymer and
semi-finished goods) with locally produced products. In countries where there is no local producer

FRIDGE Chemical Sector Upstream Pricing Practices – Final Report
Ozone Business Consulting (Pty) Ltd Page 142
there is a significantly under developed polymer value chain, as semi finished and final products
are imported rather than development of a capital intensive downstream industry.
3.6. Comparison of domestic prices with export prices
No time series data was available for export prices of products that were exported out of South
Africa. The comparison has therefore been done on the average local delivered prices as received
from Polyethylene manufacturers and converters and average export prices.
a) LDPE
In 2004, the average local delivered price for LDPE was R 8.44/kg. The average F.O.B. export
price in the same year was R 7.53/kg. The major destination for South African exports was
Zimbabwe. The average export price to Zimbabwe was R 7.90/kg. The difference between the
local delivered prices and export prices to Zimbabwe was around 6%. It should be noted that
selling these exports in Zimbabwe has to add onto the export price logistics costs, tariff duties,
inland distribution and agents’ commission. The relatively lower percentage differential between
the domestic price in South Africa and the export price to Zimbabwe is a function of logistics costs
based on geographical proximity.
Time series data of export prices has however been obtained for a limited period for other
countries or regions; namely the USA and North West Europe. Figures 3.19 and 3.20 below show
that the difference between delivered domestic prices in South Africa and FOB prices is not
unusual. For example, in the case of the USA the difference between their delivered domestic
prices and export prices was as high as about 41% between May and September 2000 but down
to about 24% by the last quarter of 2004. It should be mentioned that the gap between the two is
sometimes much closer. However for the whole 10 year period as shown in the chart the domestic
price was always above the export price. The same trend should be expected in the case of South
Africa as well. It should be noted that the FOB price is not the price paid in the export market,
rather it is the price at which the polymer exits the borders of the source country. Upon landing at
the export market logistical costs, duties/tariffs (where applicable), inland distribution and agent’s
commission (in some instances) and other costs are added onto the price at which the polymer

FRIDGE Chemical Sector Upstream Pricing Practices – Final Report
Ozone Business Consulting (Pty) Ltd Page 143
exited the borders of the source country. The difference between the delivered domestic price and
the FOB price does not mean that domestic customers subsidize export customers.
Figure 3.19. Time series comparison of domestic prices and FOB prices in the USA
LDPE
0
200
400
600
800
1,000
1,200
1,400
1,600
1,800
Jan-
94
May
-94
Sep
-94
Jan-
95
May
-95
Sep
-95
Jan-
96
May
-96
Sep
-96
Jan-
97
May
-97
Sep
-97
Jan-
98
May
-98
Sep
-98
Jan-
99
May
-99
Sep
-99
Jan-
00
May
-00
Sep
-00
Jan-
01
May
-01
Sep
-01
Jan-
02
May
-02
Sep
-02
Jan-
03
May
-03
Sep
-03
Jan-
04
May
-04
Sep
-04
Jan-
05
May
-05
US$/tonne
US Export Price US Domestic Price
The same trend is evident in the case of North West Europe as shown in figure 3.20 below,
although the difference between the delivered domestic prices and the FOB prices is relatively
smaller and in some instances non-existent. This is as a result of the geographical proximity of the
export markets which are within Europe. For a limited period only (between January and May
1995) the domestic price was lower than the FOB price by about 25%.
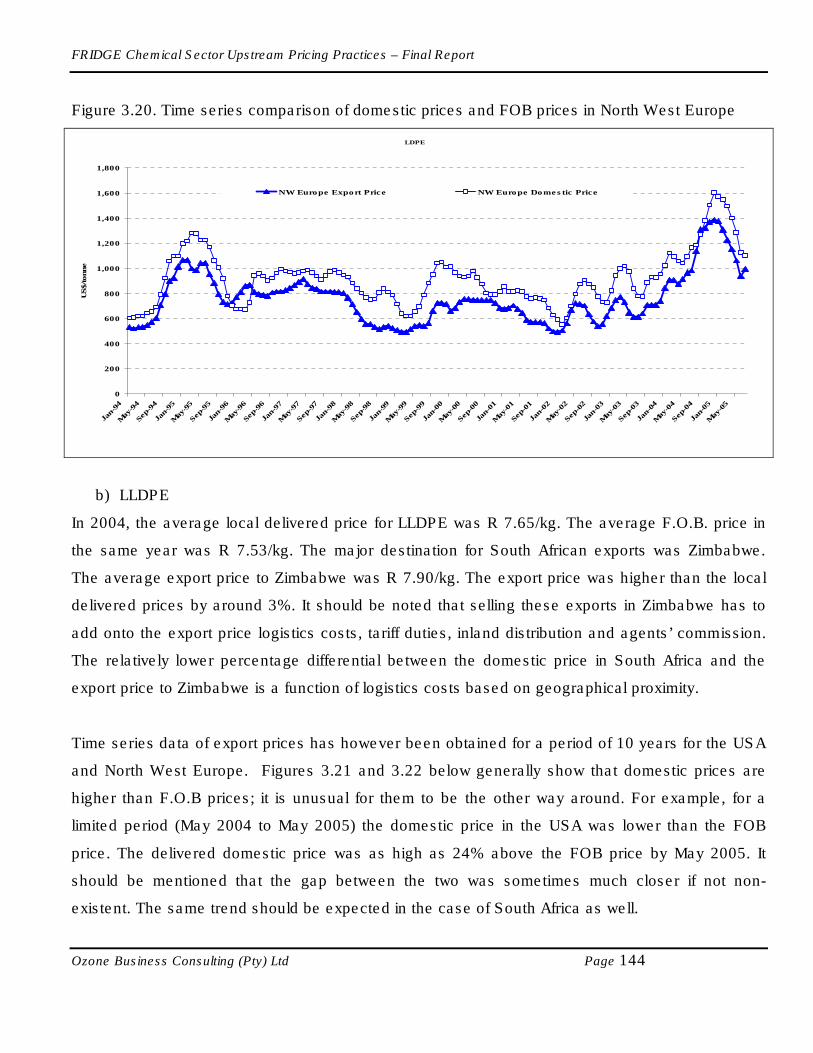
FRIDGE Chemical Sector Upstream Pricing Practices – Final Report
Ozone Business Consulting (Pty) Ltd Page 144
Figure 3.20. Time series comparison of domestic prices and FOB prices in North West Europe
LDPE
0
200
400
600
800
1,000
1,200
1,400
1,600
1,800
Jan-94
May
-94
Sep
-94
Jan-95
May
-95
Sep
-95
Jan-96
May
-96
Sep
-96
Jan-97
May
-97
Sep
-97
Jan-98
May
-98
Sep
-98
Jan-99
May
-99
Sep
-99
Jan-00
May
-00
Sep
-00
Jan-01
May
-01
Sep
-01
Jan-02
May
-02
Sep
-02
Jan-03
May
-03
Sep
-03
Jan-04
May
-04
Sep
-04
Jan-05
May
-05
US$/tonne
NW Europe Export Price NW Europe Domestic Price
b) LLDPE
In 2004, the average local delivered price for LLDPE was R 7.65/kg. The average F.O.B. price in
the same year was R 7.53/kg. The major destination for South African exports was Zimbabwe.
The average export price to Zimbabwe was R 7.90/kg. The export price was higher than the local
delivered prices by around 3%. It should be noted that selling these exports in Zimbabwe has to
add onto the export price logistics costs, tariff duties, inland distribution and agents’ commission.
The relatively lower percentage differential between the domestic price in South Africa and the
export price to Zimbabwe is a function of logistics costs based on geographical proximity.
Time series data of export prices has however been obtained for a period of 10 years for the USA
and North West Europe. Figures 3.21 and 3.22 below generally show that domestic prices are
higher than F.O.B prices; it is unusual for them to be the other way around. For example, for a
limited period (May 2004 to May 2005) the domestic price in the USA was lower than the FOB
price. The delivered domestic price was as high as 24% above the FOB price by May 2005. It
should be mentioned that the gap between the two was sometimes much closer if not non-
existent. The same trend should be expected in the case of South Africa as well.

FRIDGE Chemical Sector Upstream Pricing Practices – Final Report
Ozone Business Consulting (Pty) Ltd Page 145
Figure 3.21. Time series comparison of domestic prices and FOB prices in the USA
LLDPE
0
200
400
600
800
1,000
1,200
1,400
1,600
Jan-
94
May
-94
Sep
-94
Jan-
95
May
-95
Sep
-95
Jan-96
May
-96
Sep
-96
Jan-
97
May
-97
Sep
-97
Jan-
98
May
-98
Sep
-98
Jan-
99
May
-99
Sep
-99
Jan-
00
May
-00
Sep
-00
Jan-01
May
-01
Sep
-01
Jan-
02
May
-02
Sep
-02
Jan-
03
May
-03
Sep
-03
Jan-04
May
-04
Sep
-04
Jan-
05
May
-05
US$/tonne
US Export Price US Domestic Price
In the case of North West Europe as shown in figure 3.22 below, the difference between the
delivered domestic prices and the F.O.B price was virtually non-existent and when there was a
difference, it was negligible. This is as a result of the geographical proximity of the export markets
which are within Europe as well as the unavailability of polymer for export.
Figure 3.22. Time series comparison of domestic prices and FOB prices in North West Europe
LLDPE
0
200
400
600
800
1,000
1,200
1,400
1,600
1,800
Jan-94
May-94
Sep
-94
Jan-95
May-95
Sep
-95
Jan-96
May-96
Sep
-96
Jan-97
May-97
Sep
-97
Jan-98
May-98
Sep
-98
Jan-99
May-99
Sep
-99
Jan-00
May-00
Sep
-00
Jan-01
May-01
Sep
-01
Jan-02
May-02
Sep
-02
Jan-03
May-03
Sep
-03
Jan-04
May-04
Sep
-04
Jan-05
May-05
US$/tonne
NW Europe Export Price NW Europe Domestic Price

FRIDGE Chemical Sector Upstream Pricing Practices – Final Report
Ozone Business Consulting (Pty) Ltd Page 146
An important feature of the polymer industry world-wide is that in any country that has a surplus in
any polymer, the price at which the polymer is exported is different (and usually lower) than the
price at which it is sold to domestic users even after allowing for transport and other logistics
costs. This statement is supported by the trend of the historical export and domestic prices of the
USA and North West Europe for LDPE and LLDPE over a ten year period. The comparison shows
that:
• In both regions the LDPE FOB price in particular and periodically the LLDPE export price are
usually lower than the domestic price.
• However, there are also periods when the FOB price is very close to or actually higher than
the domestic price. This takes place when the domestic market is tight and there is limited
amount of product available for export.
c) HDPE
In 2004, the average local delivered price for HDPE was R 7.17/kg. The average F.O.B. export
price in the same year was R 6.03/kg. The major destination for South African exports was Congo
(Brazzaville). The average F.O.B. export price to Congo was R 5.25/kg. The difference between
the local delivered prices and F.O.B. price to Congo was around 27%. It should be noted that
selling these exports in Congo has to add onto the F.O.B. price logistics costs, tariff duties, inland
distribution and agents’ commission. It is therefore expected that the domestic delivered price in
Congo will be comparable to that prevailing in South Africa.
No time series data was available from other regions or countries for comparative purpose.
Although there is no time series data for other regions, the same trend seen already in the other
polymers is expected to be the case with HDPE.

FRIDGE Chemical Sector Upstream Pricing Practices – Final Report
Ozone Business Consulting (Pty) Ltd Page 147
3.7. Impact of pricing on downstream purchasers - Demand Elasticity
3.7.1. Introduction
The approach followed to determine demand elasticity is described in Appendix 1.
3.7.2. Demand Elasticity Analysis for Polyethylene
It was not possible to collect accurate information from sufficient companies to enable the plotting
of historical and future demand elasticity for polyethylene. As such, alternative methods have
been used to calculate demand elasticity.
Professor Johannes Fedderke of the Southern African Econometric Research Unit undertook a
study of price elasticity in Sasol’s LDPE, LLDPE, PVC and PP markets during the course of 2005.
The study which uses sophisticated econometric techniques draws on 10 years of quarterly
polymer consumption (excluding HDPE), polymer price and national economic data to determine
both the supply and demand side price dynamics to determine the product’s elasticity. The input
data used covered the period from January 1994 to June 2005.
The results of this study indicated for LDPE that a 10% decrease in price would result in a 3%
increase in market size, and vice versa. For LLDPE a 10% decrease in price would result in a 7%
increase in market size, and vice versa. The implication is that for polyethylene any price
decrease will result in a less than proportional increase in market size.
3.7.3. Practical Verification of Demand Elasticity for Polyethylene
A market segment analysis was done to further investigate the demand elasticity of Polyethylene.
Demand elasticity for polyethylene can be verified from a practical perspective, by evaluating the
relative portion the polyethylene polymer cost in the final product that is being sold. This provides
a measure of elasticity as it can determine the extent to which the final product is price sensitive.
An analysis for the major polymer grades, as well as end-use applications, is shown below:

FRIDGE Chemical Sector Upstream Pricing Practices – Final Report
Ozone Business Consulting (Pty) Ltd Page 148
a) LDPE - all grades
Major
applications
% Cost of
LDPE
polymer in
converted
product
End-use product % Cost of
LDPE
polymer in
end-use
product
LDPE Polymer Demand
Elasticity for end-product
1. Packaging
Film
70% Packaged
manufactured goods,
etc.
<1% No demand elasticity
2. Industrial
film
50% Construction sheeting,
dam sheeting
< 15% No demand elasticity
3. Shrink film 70% Beverage packaging,
pallet stabilisation
<1% No demand elasticity
4. Check-out
bags
70% Retail –fashion stores,
etc.
<1% No demand elasticity
The conclusion is that for 90% plus of the applications, LDPE polymer constitutes such a small
fraction of the end-product price that it cannot impact on the demand elasticity.
b) LLDPE – all grades
Major
applications
% Cost of
LLDPE
polymer in
converted
product
End-use product % Cost of
LLDPE
polymer in
end-use
product
LLDPE Polymer Demand
Elasticity for end-product
1. Packaging
Film
60% Packaged
manufactured goods,
etc.
<1% No demand elasticity
2. Roto-
moulding
60% Water & fuel tanks 40% Demand elasticity likely, but
expected to require >10%
change in LLDPE price –
material substitution
The conclusion is that LLDPE polymer has a possibility to impact on the demand elasticity in less
than 20% of the end-use applications.

FRIDGE Chemical Sector Upstream Pricing Practices – Final Report
Ozone Business Consulting (Pty) Ltd Page 149
The general conclusion for polyethylene polymers is therefore that for in excess of 80 - 90% of
end-use applications there is no significant demand elasticity. This is therefore a verification of the
statistical analysis that indicated a low elasticity.
3.8. Impact of pricing on downstream purchasers – EVC
Due to the integration of production facilities, it was not possible to obtain the required information
for the EVC analysis at individual polymer level. The analysis was therefore conducted on the
combined polymers for both the upstream and downstream sectors.
Please refer to Appendix 2 for upstream EVC results for combined polymers.
3.8.1. Downstream Polymers
In total four companies, accounting for around 30% of the polyethylene market, based on
consumption volumes, provided financial data. However, some of the financial data (two
companies) did not correspond historically with the financial information provided by upstream
companies.
The following EVC graph represents the actual values calculated in each year between 1997 and
2005 for combined downstream polymers. The graph indicates that the return on capital as
measured against the cost of capital, K, was below K in every year except 1997 and 1999.
However, this does not mean the downstream has been making losses all these years.
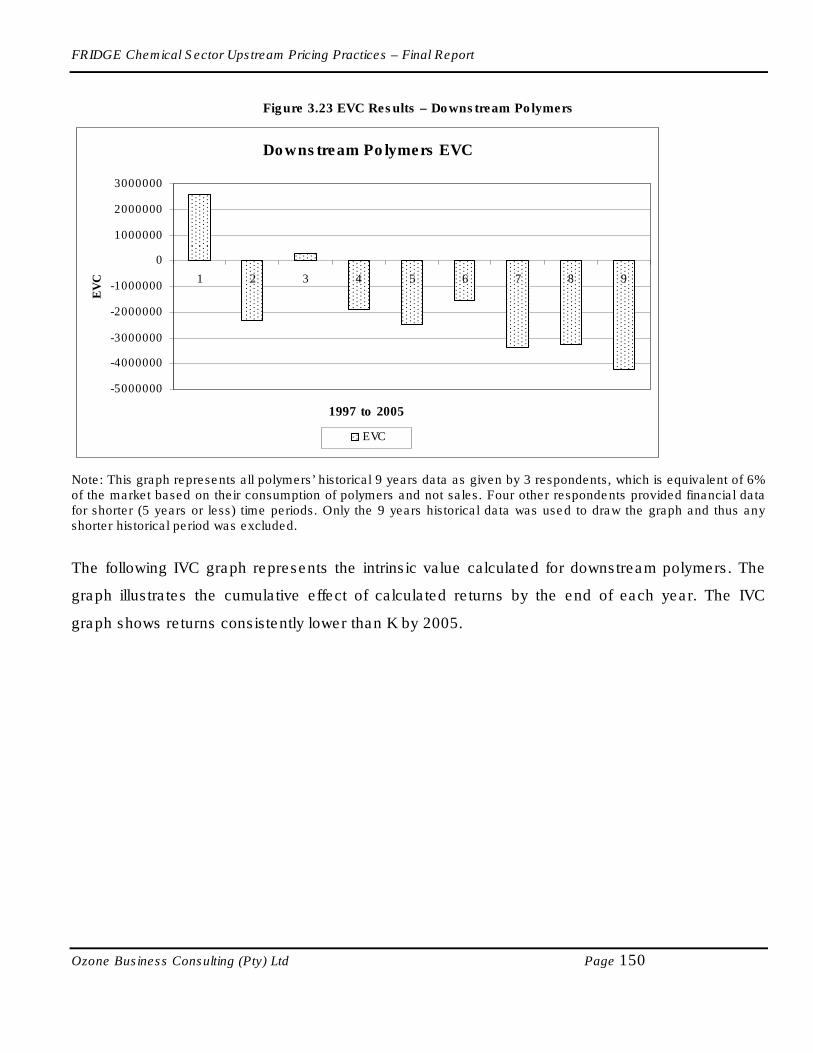
FRIDGE Chemical Sector Upstream Pricing Practices – Final Report
Ozone Business Consulting (Pty) Ltd Page 150
Figure 3.23 EVC Results – Downstream Polymers
Downstream Polymers EVC
-5000000
-4000000
-3000000
-2000000
-1000000
0
1000000
2000000
3000000
1 2 3 4 5 6 7 8 9
1997 to 2005
EV
C
EVC
Note: This graph represents all polymers’ historical 9 years data as given by 3 respondents, which is equivalent of 6% of the market based on their consumption of polymers and not sales. Four other respondents provided financial data for shorter (5 years or less) time periods. Only the 9 years historical data was used to draw the graph and thus any shorter historical period was excluded.
The following IVC graph represents the intrinsic value calculated for downstream polymers. The
graph illustrates the cumulative effect of calculated returns by the end of each year. The IVC
graph shows returns consistently lower than K by 2005.

FRIDGE Chemical Sector Upstream Pricing Practices – Final Report
Ozone Business Consulting (Pty) Ltd Page 151
Figure 3.24 IVC Results – Downstream Polymers
Downstream Polymers Intrinsic Value
-20000000
-15000000
-10000000
-5000000
0
5000000
1 2 3 4 5 6 7 8 9
!997 to 2005
IVC
IVC
Note: This graph represents all polymers’ historical 9 years data as given by 3 respondents, which is equivalent of 6% of the market based on their consumption of polymers and not sales. Four other respondents provided financial data for shorter (5 years or less) time periods. Only the 9 years historical data was used to draw the graph and thus any shorter historical period was excluded.
The following graph illustrates the relative sensitivity of EVC and Profit before Interest and Tax
(PBIT) to Selling Price, Sales Volume, Cost of Sales and K in downstream polymers.
The bar groups indicate by what percentage PBIT and EVC would change for a one percent
improvement in Prices or Volumes or Cost of Sales or K.

FRIDGE Chemical Sector Upstream Pricing Practices – Final Report
Ozone Business Consulting (Pty) Ltd Page 152
Figure 3.25 Sensitivity of EVC and Profit before Interest and Tax (PBIT) to Selling Price, Sales Volume, Cost of
Sales and K – Downstream Polymers
Downstream Polymer Relative Sensitivity
0
2
4
6
8
10
12
1% 1% -1% -1%
Price Volume CoS K
% Change in Input
% C
ha
ng
e i
n P
erf
orm
an
ce
PBIT EVC
Note: This graph represents all polymers’ historical 9 years data as given by 3 respondents, which is equivalent of 6% of the market based on their consumption of polymers and not sales. Four other respondents provided financial data for shorter (5 years or less) time periods. Note that the inverse of what this graph shows is also true. That is, PBIT and EVC would change by the same percentage points but in the opposite direction for a one percent decline in prices or volumes or one percent increase in Cost of Sales or K.
Note the following;
• EVC is insensitive to K
• EVC (and PBIT) are insensitive to Sales Volume
• EVC (and PBIT) are insensitive to Cost of sales
• EVC is relatively sensitive to Selling Price
• PBIT is very sensitive to Selling Price
It can be expected that a symmetrical result will be obtained for a one percent decline or increase
in Prices or Volumes or Cost of Sales or K.
Although statistically insignificant, the EVC analysis of combined polymers indicates that the
return on capital was lower than the weighted average cost of capital, K in every year except 1997
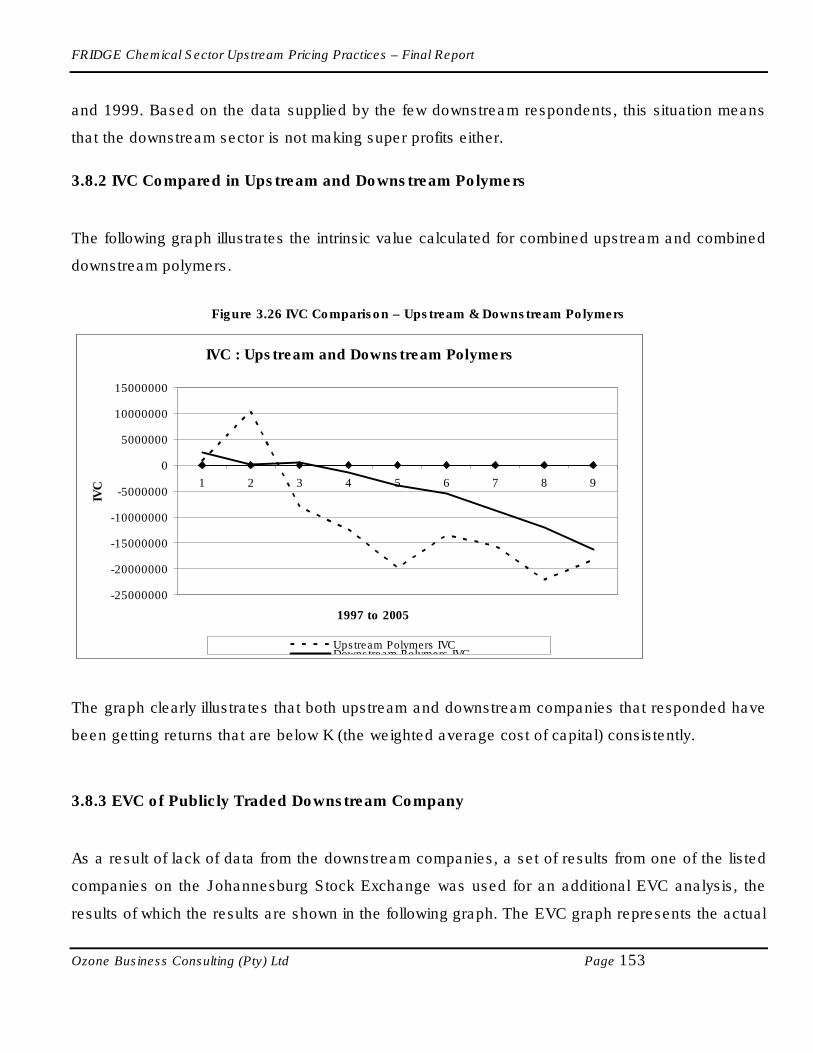
FRIDGE Chemical Sector Upstream Pricing Practices – Final Report
Ozone Business Consulting (Pty) Ltd Page 153
and 1999. Based on the data supplied by the few downstream respondents, this situation means
that the downstream sector is not making super profits either.
3.8.2 IVC Compared in Upstream and Downstream Polymers
The following graph illustrates the intrinsic value calculated for combined upstream and combined
downstream polymers.
Figure 3.26 IVC Comparison – Upstream & Downstream Polymers
IVC : Upstream and Downstream Polymers
-25000000
-20000000
-15000000
-10000000
-5000000
0
5000000
10000000
15000000
1 2 3 4 5 6 7 8 9
1997 to 2005
IVC
Upstream Polymers IVCDownstream Polymers IVC
The graph clearly illustrates that both upstream and downstream companies that responded have
been getting returns that are below K (the weighted average cost of capital) consistently.
3.8.3 EVC of Publicly Traded Downstream Company
As a result of lack of data from the downstream companies, a set of results from one of the listed
companies on the Johannesburg Stock Exchange was used for an additional EVC analysis, the
results of which the results are shown in the following graph. The EVC graph represents the actual

FRIDGE Chemical Sector Upstream Pricing Practices – Final Report
Ozone Business Consulting (Pty) Ltd Page 154
values calculated for combined polymers in each year between 2000 and 2005 for this listed
company. The graph indicates that the business is volatile, indicating large swings in the EVC
value year by year. This is confirmation that the results should not be seen in isolation but rather
throughout the full commodity cycle.
Figure 3.27 EVC Results – Publicly Traded Downstream Company
-20000
-10000
0
10000
20000
30000
40000
1 2 3 4 5 6
2000 to 2005
EV
C
EVC
For the listed company, the IVC graph that follows show that the higher than K (cost of capital)
return recorded in 2003 outweighed the years when returns were lower than K, and IVC has
remained positive through 2005. Again, this is a case of little data (5 years) that does not cover
the full commodity cycle. Also, this particular company was active in acquisitions and this can
affect the EVC.
.

FRIDGE Chemical Sector Upstream Pricing Practices – Final Report
Ozone Business Consulting (Pty) Ltd Page 155
Figure 3.28 IVC Results – Publicly Traded Downstream Company
-20000
-15000
-10000
-5000
0
5000
10000
15000
20000
25000
30000
1 2 3 4 5 6
2000 to 2005
IVC
IVC
3.9. Conclusions – Polyethylene
The current polymer production capability of the LDPE plant is 100 000 t/a and that of the LLDPE
plant is 150 000 t/a, however the LLDPE production currently is limited to approximately 100 000
t/a based on ethylene availability. With Sasol’s Project Turbo fully implemented, LDPE capacity
will increase to 220 000 t/a, LLDPE will operate at full capacity. HDPE capacity is 160 000 t/a.
The SA market size in 2004 for polyethylene primary polymer used in local plastic conversion was
estimated as follows:
• LDPE: 135 000 t/a
• LLDPE: 139 000 t/a
• HDPE: 158 000 t/a
• Total: 432 000 t/a
After implementation of Project Turbo, there will be an excess of LDPE available.
Polyethylene is regarded as commodity products and is produced by many countries and is well-
traded in large volumes. Global polyethylene prices are determined by supply/demand basis on a
FRIDGE Chemical Sector Upstream Pricing Practices – Final Report
Ozone Business Consulting (Pty) Ltd Page 156
global scale, but are particularly driven by the Far East, due to the availability of low-cost product
from ill-considered expansions in the 1990’s in countries such as Korea, as well as the ever-
growing demand from China. Global plant sizes are also increasing and so is capacity more
especially in China, in order to benefit from economies-of-scale issues. South African polyethylene
manufacturers have a relatively high cost base in absolute terms due to the relatively small local
plants.
Local polyethylene producers sell polymer products to customers in markets which include South
Africa and other African countries, Asia, USA, Europe and South America. Their policy is to sell at
the market price prevailing in each of these regions at any time. Polyethylene polymer prices are
determined relative to the competitive forces acting in a particular region. In order for a supplier to
be successful in penetrating the market and sustaining a market share position, the customers’
alternative purchasing options must be considered and a competitive offering made. This also
applies to polyethylene sales in South Africa. Therefore, the polyethylene pricing mechanism
prevailing in South Africa is one where the price is negotiated based on offers in an open market
where products are readily traded across national boundaries. The outcome is that the most
competitive supplier sets the price and is thus referred to as market pricing as opposed to formula-
driven IPP.
Local polyethylene manufacturers do not select a particular price from a particular region and
rigorously apply that to determine the price for the South African domestic market. They are
driven by market dynamics and react to the lowest price imports being offered by competitive
suppliers to South African customers. In most producing countries the domestic demand typically
consumes a significant portion of the producers’ volume, so enabling the export volumes to be
priced using marginal costing. This means that FOB prices are usually lower than domestic prices.
During recent years, the competitive supplies have come from the Far East and the Middle East
and they therefore normally set the price levels in the South African domestic market. Prices of
locally manufactured substitute materials, such as paper, metal and glass, are also monitored and
considered for the market sectors where they compete as alternatives to polymers. All these
issues form the basis for the market price and thus for the customer price negotiations.
FRIDGE Chemical Sector Upstream Pricing Practices – Final Report
Ozone Business Consulting (Pty) Ltd Page 157
After implementation of Project Turbo, an excess of LDPE will be available. From 2007 South
Africa will be a net exporter of LDPE. However, excess domestic production capacity is no
guarantee that domestic prices will always be lower than FOB prices because of marginal
costings of exports by other countries or regions. A comparison between domestic and export
prices that had prevailed in North West Europe and the USA over a 10 year period revealed that
in cases where there is surplus LDPE and LLDPE, the price at which the polymer is exported is
almost always lower than the price at which it is sold to domestic users. The same situation was
found to be the case in South Africa. In general, the further away the export market like in the
case of South Africa’s HDPE exports to Congo, the higher the price differential between the
domestic price and the export price. The converse is also true, that is, the closer the export
market like in the case of South Africa’s LDPE and LLDPE exports to Zimbabwe and North West
Europe’s LLDPE exports which go within Europe, the smaller the price differential. There are
limited periods when the export price is very close to or actually higher than the domestic price.
This takes place when the export demand increases faster than domestic, leading to higher FOB
prices for a short period of time.
Analysis of South Africa’s domestic polyethylene prices compared to a number of major
competing countries, including China, US, NW Europe and India, showed that:
• Prices around the world are linked.
• In any month, there can be a very wide variation in the prices.
• Prices paid by South African converters are always in the range of prices that prevailed in
the countries or regions covered in this analysis, mostly at the lower end of the range.
• In the latter period of the analysis China is the most competitive (lowest priced market) in
the world.
The global reality test for polyethylene showed that SA’s level of conversion for LLDPE and HDPE
in particular is around halfway above the level that can be expected from a country with SA’s level
of economic development, indicating the existence of relatively well-developed markets for these
particular polymers. South Africa’s comparison with Taiwan, Malaysia, Saudi Arabia, South Korea
and Poland shows that the latter countries have higher per capita polymer usage than the “trend

FRIDGE Chemical Sector Upstream Pricing Practices – Final Report
Ozone Business Consulting (Pty) Ltd Page 158
line” would dictate. There is therefore scope for the South African polymer production and
conversion industries to learn from countries such as mentioned that have higher per capital
polymer usage to develop and implement strategies to increase per capita usage in South Africa.
The results of the demand elasticity indicated that a 10% decrease in LDPE price would result in a
3% increase in market size, and vice versa. For LLDPE the respective data shows that a 10%
decrease in price would result in a 7% increase, and vice versa. The implication is that any price
changes will result in a less than proportional change in market size. From a practical perspective
the general conclusion for polyethylene polymers is therefore that for in excess of 80 - 90% of
end-use applications there is no significant demand elasticity.
Due to the integration of production facilities, it was not possible to obtain the required information
for the EVC analysis at individual product level. The analysis was therefore conducted on the
combined polymers upstream and downstream sectors for the period 1997 to 2005.
For upstream polymers, the EVC analysis indicated that the return on capital was frequently
lower than the weighted average cost of capital, K. This is a clear indicator that the current pricing
practices of the upstream sector are not resulting in high levels of profitability, as measured
against the total cost of capital, namely K. This situation means that the upstream sector is not
making super profits.
In the case of Sasol, the focus for this study was on Sasol Polymers, the LDPE and LLDPE
manufacturing unit within the group and not on the whole group. Therefore profits of Sasol Limited
as a group cannot be equated to those of Sasol Polymers. Sasol Polymers, situated within the
Sasol’s chemical businesses, is a separate company within the Sasol Group, and has a supply
agreement for raw material from another Sasol Group company, Sasol Synfuels. The supply of
these raw materials is based upon a pricing mechanism that sets the price at the equivalent fuel
value, i.e. the gate price of fuel which is set by Basic Fuel Price mechanism which in turn is
directly set by international fuel prices. Therefore, Sasol Synfuels sells the feedstock at a price
that they would have realised in the marketplace if it was converted to saleable fuels. This
mechanism ensures that there is no cross-subsidization between fuels and polymers businesses
FRIDGE Chemical Sector Upstream Pricing Practices – Final Report
Ozone Business Consulting (Pty) Ltd Page 159
and hence the respective profitability of the businesses is a true reflection of the value add of the
chemicals and fuel businesses.
.
For downstream polyethylene a reasonable survey response was obtained. In total four
companies, accounting for around 30% of the polyethylene market, provided financial data.
However, some of the data (two companies) did not correspond historically with the information
provided by upstream companies. Although statistically insignificant, the EVC analysis of
combined polymers indicates that the return on capital was lower than the weighted average cost
of capital, K in every year except 1997 and 1999. This situation means that the downstream sector
companies that responded are not making super profits either.
The listed company analysed showed a return larger than the cost of capital (K) in 2003 that
outweighed the years of returns that were lower than the cost of capital, and IVC has remained
positive through 2005. This particular company was active in acquisitions, which caused the large
increase in EVC.

FRIDGE Chemical Sector Upstream Pricing Practices – Final Report
Ozone Business Consulting (Pty) Ltd Page 160
4. PVC
4.1. Market definition of upstream chemical products
a) Introduction
Polyvinylchloride (PVC) in primary, or unconverted form is part of the Primary Polymer and
Rubber sub-sector of the chemical industry. PVC is the second-largest commodity thermoplastic
produced in the world, after the polyethylene. PVC is the most versatile of all thermoplastics. It
can be converted either into rigid products of considerable strength and hardness or into flexible
articles, when compounded with plasticisers.
b) Value chain
PVC is made by means of the catalytic polymerisation of ethylene and chlorine, usually in large,
integrated plants that are operated on a continuous basis. Ethylene feedstock is primarily obtained
from large olefin crackers, using ethane and other crude-oil refinery based streams. South Africa
has unique ethylene supply from the Fischer Tropsch synthetic fuel technology employed by Sasol
in Secunda. The value chain for PVC is summarised in the diagram below:

FRIDGE Chemical Sector Upstream Pricing Practices – Final Report
Ozone Business Consulting (Pty) Ltd Page 161
Figure 4.1: Polyvinylchloride Value Chain
c) Applications and Global Market Size
In 2004, global PVC production grew to 29 million metric tons with an estimated value of $27
billion. (Source: SRI Consulting)
Rigid applications account for 65–75% of total consumption. The major end use is pipe and
fittings; other leading rigid applications are siding, windows, fencing and packaging sheet. Flexible
PVC is used for film and sheet, wire and cable insulation, floor coverings, synthetic leather
products, coatings and many other consumer goods.
PVC consumption is mostly influenced by the construction market, as about 60% of world
consumption is for pipe, fittings, siding, windows, fencing and other applications. PVC is
increasingly used as a replacement for traditional construction materials such as wood and
metals, and glass in packaging applications; so its growth has been above that experienced by the
overall construction industry.
PVC Primary polymer – produced by Sasol Polymers in Sasolburg
Rigid Products:
Pipes, fittings,Windows,Packaging sheets
Ethylene – globally mainly fromolefin cracking operationsBut in SA only supplied by Sasol ex Fischer Tropsch
Plastic conversion processes:Injection moulding, Blow moulding, Extrusion, etc.
Chlorine – manufacturedon-site from saltand electricityBy-product
Caustic soda
SaltCoal
PVC Compounds – produced by independentCompounders and in-house by converters
Flexible Products:
Film and sheet, wire and cable insulation,floor coverings, synthetic leather products,
coatings and many other consumer goods
PlasticisersFillersOther addititves
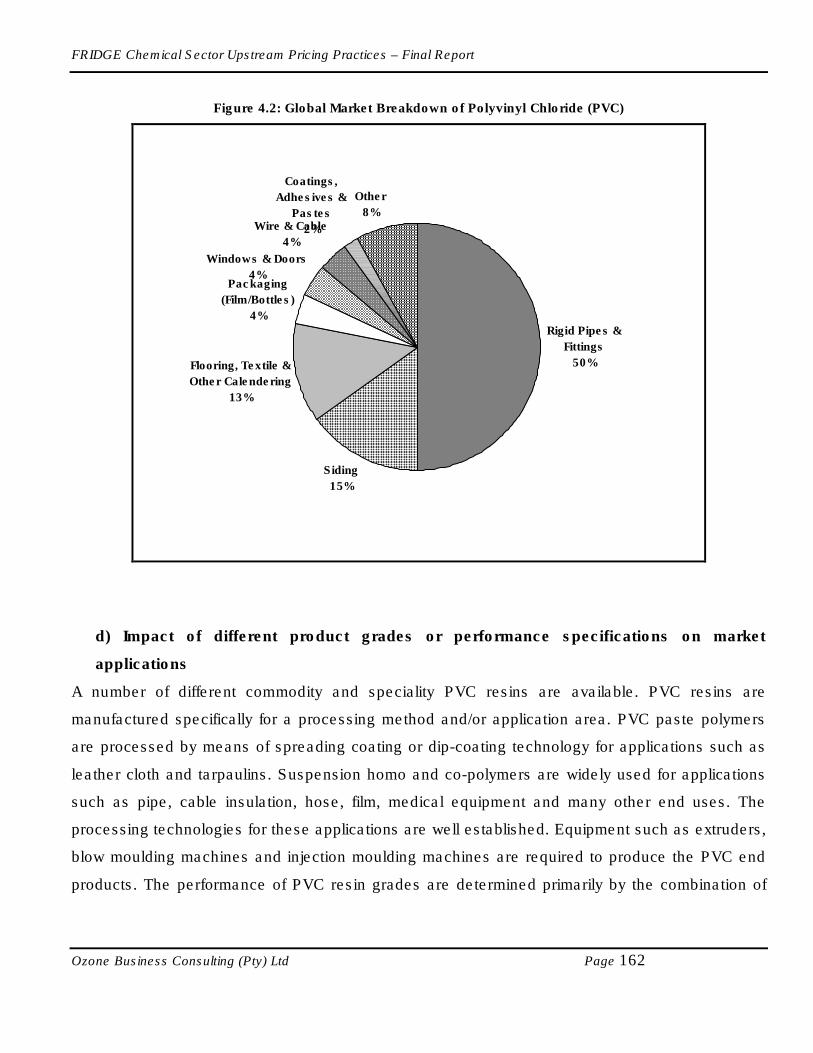
FRIDGE Chemical Sector Upstream Pricing Practices – Final Report
Ozone Business Consulting (Pty) Ltd Page 162
Figure 4.2: Global Market Breakdown of Polyvinyl Chloride (PVC)
Rigid Pipes &
Fittings
50%
Siding
15%
Flooring, Textile &
Other Calendering
13%
Packaging
(Film/Bottles)
4%
Windows & Doors
4%
Wire & Cable
4%
Coatings,
Adhesives &
Pastes
2%
Other
8%
d) Impact of different product grades or performance specifications on market
applications
A number of different commodity and speciality PVC resins are available. PVC resins are
manufactured specifically for a processing method and/or application area. PVC paste polymers
are processed by means of spreading coating or dip-coating technology for applications such as
leather cloth and tarpaulins. Suspension homo and co-polymers are widely used for applications
such as pipe, cable insulation, hose, film, medical equipment and many other end uses. The
processing technologies for these applications are well established. Equipment such as extruders,
blow moulding machines and injection moulding machines are required to produce the PVC end
products. The performance of PVC resin grades are determined primarily by the combination of

FRIDGE Chemical Sector Upstream Pricing Practices – Final Report
Ozone Business Consulting (Pty) Ltd Page 163
molecular weight and the particle morphology. PVC resin has a glass transition temperature of
800C and a processing temperature of 160 - 1800C is required.
e) Level of competition in supply for major geographic export markets for upstream
products
PVC is a global product, manufactured by roughly 150 companies in approximately fifty countries.
Major producers include Ineos Vinyls, Arkema, Vinnolit, BF Goodrich and many more.
4.2. SA Market structure and shares of upstream chemical producers
4.2.1. Domestic industry structure
a) Feedstock for PVC production
PVC is manufactured from ethylene monomer and chlorine. Ethylene supply in SA is concentrated
with only one supplier, namely Sasol Secunda. Sasol’s capacity is currently around 454 000 t/a; to
increase to 672 000 as a result of Project Turbo. Sasol manufactures chlorine captively from salt
(Sodium chloride).
b) PVC Production
PVC is produced by reacting vinyl chloride monomer (VCM) with an organic peroxide initiator in an
autoclave, utilizing INEOS technology (a major global PVC producer and technology supplier).
Stringent control of temperatures, pressures, additives and batch processing time ensure that a
quality finished product is produced. VCM is produced by the chlorination of ethylene to form
ethylene dichloride, using the oxychlorination and the direct chlorination production route, followed
by the cracking of this intermediate to vinyl chloride monomer. Sasol Polymers produces chlorine
from salt utilising diaphragm and membrane separation technology.
Originally the PVC plant was built with a capacity of 100 000 t/a. The most recent expansion
increased the capacity of the VCM and PVC plants to 200 000 t/a, at a cost of R 250 million.
These production increases have allowed Sasol Polymers to serve the growing South Africa PVC
market with quality PVC products.

FRIDGE Chemical Sector Upstream Pricing Practices – Final Report
Ozone Business Consulting (Pty) Ltd Page 164
Figure 4.3: PVC – Sasol Polymers Flow Diagram
c) PVC Market
The SA market size in 2004 for PVC primary polymer used in local plastic conversion was
estimated at 156 000 tons. PVC polymer is used in two main categories of products, namely
flexible or rigid products. Flexible products include large quantities of plasticisers (usually
phthalate based). PVC products, especially rigid products, also include fillers such as limestone
(calcium carbonate), which are used to lower the cost of end-products, but also to enhance
mechanical properties. The addition of these and other additives contribute to the actual size of
locally converted PVC products to be in the order of 250 000 tons per annum.
The PVC market is different to the other polymers in that is not dominated by packaging
applications, but is used in many other applications, in particular construction. PVC converters are
shown in Appendix 6.
Feedstock Final Product
PolymerisationReactors
(8 off)
VCM
Charge
Water
VCM
Stripping
PVC / VCM slurry
Gas Holders
VCM
Recovery
Unreacted VCM
PVC
Drying Plant
PVC
Powder
PVC
Bagging Silos
PVC
Bulk Silos
PVC
Bagging Plant
PVC
Warehouse
PVC
Loading Bay
PVC
Customer
PVC
Resin
PVC Resin
ClarifierEffluent
Effluent
Drying /
Screening
Multi-grade
PVC
Cooling Tower
andChiller
Catalyst and
Chemicals
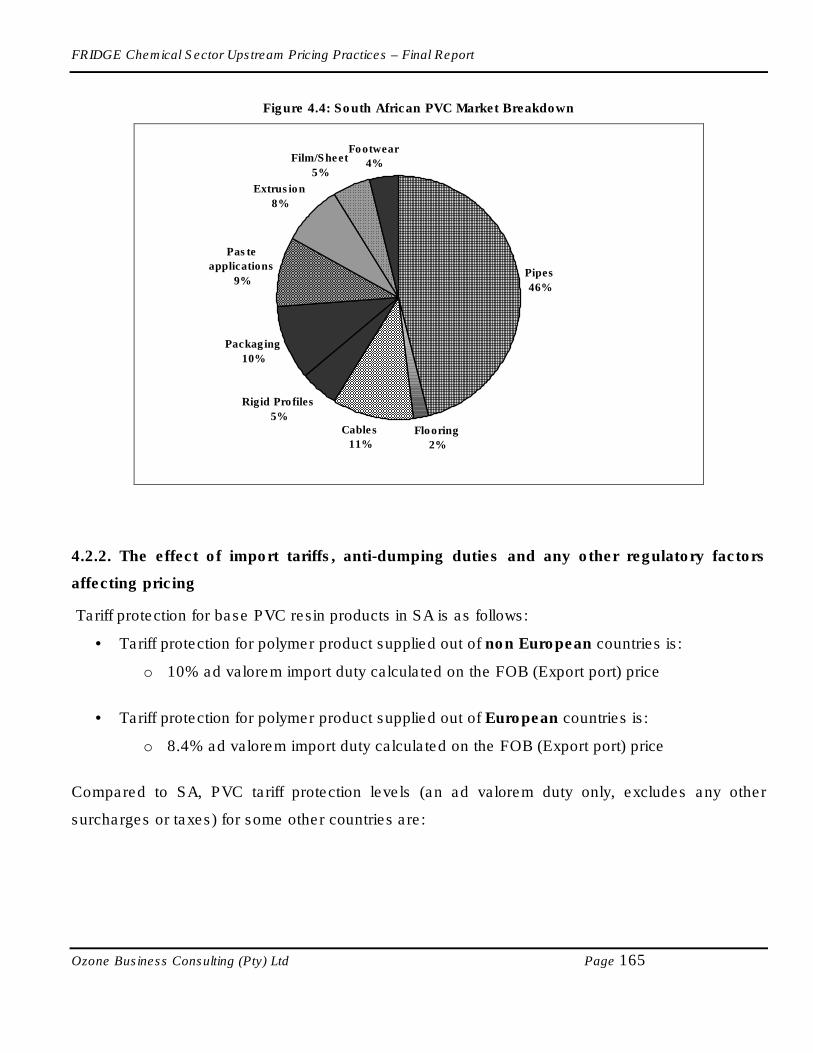
FRIDGE Chemical Sector Upstream Pricing Practices – Final Report
Ozone Business Consulting (Pty) Ltd Page 165
Figure 4.4: South African PVC Market Breakdown
Pipes
46%
Flooring
2%
Cables
11%
Rigid Profiles
5%
Packaging
10%
Paste
applications
9%
Extrusion
8%
Film/Sheet
5%
Footwear
4%
4.2.2. The effect of import tariffs, anti-dumping duties and any other regulatory factors
affecting pricing
Tariff protection for base PVC resin products in SA is as follows:
• Tariff protection for polymer product supplied out of non European countries is:
o 10% ad valorem import duty calculated on the FOB (Export port) price
• Tariff protection for polymer product supplied out of European countries is:
o 8.4% ad valorem import duty calculated on the FOB (Export port) price
Compared to SA, PVC tariff protection levels (an ad valorem duty only, excludes any other
surcharges or taxes) for some other countries are:

FRIDGE Chemical Sector Upstream Pricing Practices – Final Report
Ozone Business Consulting (Pty) Ltd Page 166
Table 4.1: PVC – Tariff Protection in Other Countries
Country Duty basis on: PVC
United States FOB 6.5%
China CIF 9.7%
Japan CIF 4.6%
Canada n/a None
Indonesia CIF 10.0%
Chile CIF 8.0%
Australia FOB 5.0%
Malaysia CIF 20.0%
India CIF 10.0%
4.2.3. The global nature of the industry
PVC is produced in a range of grades [e.g. rigid PVC, Flexible PVC, Injection moulding PVC], but
in general is regarded as a commodity product that is produced by many countries and is well-
traded in large volumes (8 million tons/annum – 50 times the SA market) around the globe,
demonstrating the exposure of the relatively small SA market in relation to the global trading
market size.
Commodity PVC suspension grades are distinguishable by the molecular weight (denoted as K-
value), which determines the resin’s suitability for end-use application. The grade denoted K66 or
K67 is the dominant grade and is used for rigid extrusions such as pipe and conduit.
Internationally, this grade has the highest consumption by volume and is thus the most traded
PVC grade. Due to it being the most predominant grade, K66/K67 represents the marginal ton in
deep sea markets and therefore drives the international PVC prices. Global prices are determined
by supply/demand basis on a global scale, but are particularly driven by the Far East, due to the
availability of low-cost product and ill-considered major expansions in the 1990’s in countries such
as Korea, as well as the ever-growing demand from China. Global plant sizes are also increasing,
in order to benefit from economies-of-scale issues.

FRIDGE Chemical Sector Upstream Pricing Practices – Final Report
Ozone Business Consulting (Pty) Ltd Page 167
4.3. Costs and pricing of upstream chemicals products
4.3.1. The cost structure of the industry and global comparison
The cost structure of SA based operations is not directly comparable to international PVC
operations, in that:
a) The SA PVC producer has an integrated operation that is manufacturing PVC, PP and
polyethylene.
b) The production infrastructure includes an olefin purification operation that purifies ethylene
that is obtained in crude form from their Fischer Tropsch process – this is a unique operation
on a global basis.
The relative cost structures for the SA based operations, compared with standard global PVC
operations are shown in the figure below. The international PVC information is based on SRI
Consulting data – US Gulf Coast.
Figure 4.5: Relative PVC Cost Structures – SA and International (US Gulf Coast)
0102030405060708090
100
South Africa International
Olefin Feedstock Other Cost
Labour Selling and overheads
Based upon these cost structures, feedstock in SA’s case is a lower portion of total costs, while
other costs, which include variable and fixed manufacturing costs, but no depreciation, are higher

FRIDGE Chemical Sector Upstream Pricing Practices – Final Report
Ozone Business Consulting (Pty) Ltd Page 168
in SA’s case. It should be noted in SA’s case the feedstock used is not polymer grade ethylene,
but the raw ethylene-rich stream supplied to the Sasol Polymers purification unit from the Sasol
Secunda upstream operations. The transfer cost mechanism of this feedstock stream has not
been analysed in this report. The other costs include the purification cost of the raw feedstock
stream.
4.3.2. SA Production Advantages & Disadvantages
SA advantages include:
• Cost competitive ethylene feedstock based upon Fischer Tropsch synthetic fuel upstream
operations. Local shortage to be eliminated shortly.
• Globally competitive polymer production technology and facilities
• Relatively well-developed downstream converter sector with widespread end-product
applications.
SA disadvantages include:
• Relatively small local production facilities compared to new globally competitive facilities.
• Relatively small local and regional market.
• Long distance from attractive export markets.
• Inland location of production facilities in the case of exports.
4.3.3. Upstream pricing practices with respect to downstream domestic purchasers
The local PVC producer sells polymer products to customers in markets which include the RSA
and other African countries, Asia, Europe and South America. Their policy is to sell at the market
price prevailing in each of these regions at any time, and this also applies to sales in South Africa.
The producer uses all relevant information at their disposal to prepare for the price negotiations in
order to offer a competitive price. The price is negotiated and takes into account inter alia:
• competitive offers from other suppliers (prevailing market price),
• the quantities purchased by a customer and the costs associated with such quantities,

FRIDGE Chemical Sector Upstream Pricing Practices – Final Report
Ozone Business Consulting (Pty) Ltd Page 169
• requests for export or development assistance,
• distribution costs for different packaging types (viz. bags, bulk or semibulk),
• Sasol Polymers’ total offering (commercial, product, technical and service components),
and
• competing alternatives whether these are substitute materials (glass, wood, paper) or
imported finished products.
The validity of these prices is part of the negotiations and can be adjusted month by month or,
quarter by quarter, or fixed for longer periods (typically less than 6 months). Generally, there is a
price continuum across the customer base. It should be noted though that over a relatively long
period average delivered prices compared to average calculated prices of imports on an import
parity basis would be fairly close to each other.
Included in the producer’s offering is a technical and engineering service, which is available to all
customers. This technical and engineering service covers the following aspects:
• product and application development,
• engineering expertise for converter’s equipment modification,
• technical expertise for use of complementary products,
• assistance with operation problems, and
• problem solving on converters equipment.
In order to fully explain the PVC producers’ domestic pricing policy, a description of global polymer
price mechanisms and their impact on South African domestic polymer prices will be further
discussed. In Appendix 3 a detailed description of international pricing practices, based upon
reference prices, is shown.
a) Europe and USA Polymer Prices:
The domestic prices of PVC in Europe and the USA are targeted at levels that provide adequate
long term returns on investment to producers investing in new plants. These targeted price levels
are generally achieved because the markets are large, there are several domestic producers and
levels of “dumped” imports are relatively low.

FRIDGE Chemical Sector Upstream Pricing Practices – Final Report
Ozone Business Consulting (Pty) Ltd Page 170
In times when installed production capacity exceeds demand, which is the norm for most of the
price cycle, high cost producers are barely able to cover their costs and cut back supply
accordingly, while those with a lower cost base will achieve a low return. During these periods,
little re-investment occurs because of the low returns and, as demand increases with time
(normally 5-6 years), a stage is eventually reached where demand exceeds installed production
capacity. At this time prices rise rapidly and high margins are earned prompting new capacity
investment and within 1-2 years, another situation of excess capacity and subsequent low margins
exists. Historically, this price cycle repeats itself approximately every 6-8 years.
It is important to note that polymer producers in these regions only achieve satisfactory returns
over entire price cycles. The high returns earned for short periods during the peaks of price
cycles, and the inadequate returns experienced during the trough, balance out the average return
for the polymer producers. Hence, earnings during the peak should not be seen in isolation, nor
viewed as excessive. This need for an adequate long term average return on investment is typical
of the international polymer industry and applies to all regions, including South Africa. This is
because the polymer market is effectively a single global market and the same price cycle applies
to all producers in all regions of the world that trade with each other.
b) Far East Polymer Prices:
Until the early 1990s, prices of polymers in the Far East were set out of the USA and were
generally higher than in either Europe or the USA. When the Korean petrochemical expansions
occurred, these resulted in overcapacity in the region and a hunger for market share that eroded
margins. As a result, since the mid-1990s, prices in the Far East have been generally lower than
either Europe or the USA, and in many instances, at a level that barely covers the costs of raw
materials and failed to adequately reward the investment to a Far East producer.
c) Middle East Polymer Prices:
In recent years the very large polymer plant investments in the Middle East have had an influence
on the global supply/demand balance. Most of this production is exported into China and is
economically viable at the Far East price levels due to low feedstock costs and very efficient

FRIDGE Chemical Sector Upstream Pricing Practices – Final Report
Ozone Business Consulting (Pty) Ltd Page 171
economies-of-scale. The Middle East producers generally adopt a “price follower” strategy as
determined by market competition in the Far East and other export destinations.
d) South African Polymer Prices:
As with all regions in the global market, polymer prices are determined relative to the competitive
forces acting in the particular region. In order for a supplier to be successful in penetrating the
market and sustaining a market share position, the customers’ alternative purchasing options
must be considered and a competitive offering made.
The South African PVC producer follows the above approach. They do not select a particular
price from a particular region and rigorously apply that to determine its price to the South African
domestic market, they are driven by market dynamics. South African customers monitor prices
from all major trading regions and the lowest price available at any point in time is then used by
them as a basis for the negotiation with their polymer supplier. Prices of locally manufactured
substitute materials, such as paper, metal and glass, are also monitored and considered for the
market sectors where they compete as alternatives to PVC.
During recent years, the most competitive supplies have come from the Far East and the Middle
East and they therefore normally set the price levels in the South African domestic market. Hence
Far East prices are typically monitored and tracked as defined by Hong Kong CFR prices.
Because traded volume of polymer through Hong Kong (destined for China) is active, substantial
and continuous, this is a reliable, well reported and globally recognized competitive reference
point which is used to monitor international price trends.
The SA PVC producer regularly monitors the published international polymer price data and in
addition, they are often active in both exporting and importing of commodity polymers, in addition
they are in ongoing contact with other major multinational polymer producers and technology
suppliers and are able to supplement the published information with their own trade experience.

FRIDGE Chemical Sector Upstream Pricing Practices – Final Report
Ozone Business Consulting (Pty) Ltd Page 172
Competitive pricing information is also obtained from customers during supply negotiation
discussions and is often used in combination with the data obtained from the trade consultants
and sources mentioned above.
The above discussed points form the basis for the market price and hence for the customer price
negotiations.
e) Rebates and discounts
The major rebate category on PVC is for export of customer’s finished goods. Due to the very
high capital needed to build a polymer plant, its output need to be maximised. Therefore, export
rebate mechanisms are employed to encourage customers to grow volumes by exporting finished
goods. This adds value to local exports and assist customers to grow sales volumes and run at full
capacity.
There are special pricing schemes available to all customers (large and small) and include:
• Rebates for the development of new products and markets to compete with alternative
materials,
• Rebates to compete with imports of finished goods,
• Rebates for exports of finished goods (export rebate).
The first two rebate schemes are available for a specific application or development; are
applicable for a limited period and limited to the volume for the specific purchases (that is not
across the full volume of polymer purchased). These rebates are specifically designed to facilitate
or assist:
• Converter development and introduction of products into the market by reducing the cost of
the raw material during the early stages of the product life cycle (namely development,
market introduction and acceptance),
• Converter competitiveness in the export market to overcome competitors who may have
geographic, labour cost, governmental incentives, fiscal or other competitive advantages,
or

FRIDGE Chemical Sector Upstream Pricing Practices – Final Report
Ozone Business Consulting (Pty) Ltd Page 173
• Converters to be more competitive in the local market against final product imports from
international converters (which is sometimes dumped) who have labour cost, governmental
incentives, fiscal or other competitive advantages.
The early rebate settlement scheme is to encourage customers to reduce the credit terms, which
is mutually beneficial to both supplier and consumer.
f) Upstream supplier’s view on Actual Pricing Mechanism Versus Import Parity Pricing
The pricing mechanism prevailing in South Africa is one where the price is negotiated, based on
offers in an open market where products are readily traded across national boundaries. The
outcome is that the most competitive supplier sets the price and this practice is better referred to
as market pricing. The pricing methodology is commonly practised internationally in most
countries that are signatories to the WTO. It prevails in countries with a free, open-access market,
rather than the regulated price-setting typically found in centrally planned economies. In South
Africa this situation is no different as locally produced products compete with imports. The
application of this method of pricing is such that it directly links the domestic price to the
international price. It also brings a country’s pricing practices in line with all the countries that are
signatories to the WTO and its rules on trade and eliminates the creation of subsidies throughout
polymer value chain.
An aspect that should be borne in mind is that the price of the imported product is typically set by
the spot price of another region, which is substantially lower than that region’s domestic price, as it
is set by producers incorporating only their marginal operational costs. International domestic
prices are normally “delivered prices”. In most producing countries the domestic supply typically
consume a significant portion of the producers’ volume, so enabling the export volumes to be
priced using marginal costing. This results in domestic delivered prices in countries that compete
through trade, having domestic delivered prices that are broadly in the same range, as is the case
in South Africa. This is due to the combination of freight and duty values not being too dissimilar to
the difference between domestic price and spot in the exporters’ market. However, it should be
noted that in producing countries where average costs are fairly constant (as it in the case in the
South African polymer manufacturing industry), marginal cost is usually equal to average cost.

FRIDGE Chemical Sector Upstream Pricing Practices – Final Report
Ozone Business Consulting (Pty) Ltd Page 174
Also, in South Africa’s case, variable costs are higher than the international norm because of poor
economies of scale. It should also be noted that where marginal costing is practiced it is used only
in the short term.
Import parity pricing is a mechanistic formula driven calculation and is done by specifically
calculating a price based on what it would have cost to import the product based on spot prices
quoted by a supplier from another trading region and is thus a proxy or estimate of the local
delivered price of a competitive imported product to a downstream converter. [See section 2.3.3
for a more detailed explanation of import parity pricing]. This would include all inward transport
and other real costs that would be associated with importing the polymer into South Africa. The
breakdown below gives an example of these considerations:
Table 4.2: PVC – Import Parity Price Calculation
Estimated Import Parity Price
= FOB (lowest cost source)(1) Based on published information (ICIS
LOR, Platts or Harriman)
+ Freight from source to Durban (South
Africa)
Cost to get polymer to South Africa
+ Freight insurance Insurance on goods in transit
Convert to Rands Above normally quoted in US Dollars
+ Logistic costs includes
• Landing cost • Transport cost (Inland / coastal) • Duty (ad valorem duty on FOB
price in rands)
Landing Costs comprise of terminal
handling costs, wharfage – Cargo
dues, Carrier service fee, Agency fee,
Handover and document fees and
disbursements on landing and
wharfage, and duty and customs
VAT.
Transport costs for inland would
include container turn in and railage.
Transport cost for coastal would
FRIDGE Chemical Sector Upstream Pricing Practices – Final Report
Ozone Business Consulting (Pty) Ltd Page 175
include cartage to customer.
Duty currently 10% of FOB price.
+ Indirect costs Adjusts for example stock holding
costs, payment terms, LC costs,
container destuffing and warehousing
costs
Note 1: A FOB (free on board) is a INCO 2000 term, in which the responsibility of the supplier is transferred to the buyer when the goods have been delivered on the rail of named carrier at a named port. As discussed, FOB prices are normally spot sale values and are lower than the corresponding domestic price, as the prices are normally based on the producers marginal cost of production.
The difference between market pricing and import parity pricing is that in the case of the former
prices change continuously based on the cheapest available source at a particular point in time. In
the case of import parity pricing, the price is calculated on the basis of a published price in a
specific region or country and the ultimate price is formula-based. Furthermore, in the case of
market pricing, customers monitor prices from all major trading regions and the lowest price
available at any point in time is then used by them as a basis for negotiations with their polymer
supplier.
4.4. Major downstream industries that purchase upstream products
4.4.1. End-use structure
The local PVC polymer market of 156 000 tons/annum in 2004 is supplied mainly by Sasol
Polymers, with imports accounting for around 5% of the market. The end-use structure for PVC
polymer is segmented into the grade of polymer used, as well as the conversion technology
employed.
The major PVC grade is a grade for rigid applications (Code: S6721), which accounts for 60% of
the market. This rigid PVC grade is mainly used in pressure pipe, sewer and drain pipe, gutters
and down pipes, conduit and profiles.

FRIDGE Chemical Sector Upstream Pricing Practices – Final Report
Ozone Business Consulting (Pty) Ltd Page 176
The other main PVC grade is a grade for flexible applications (Code: S7106), which accounts for
22% of the market. This flexible PVC grade is mainly used in medical products, cable, cling film
and footwear.
Two smaller volume grades are produced for rigid packaging and injection moulding applications
(Code: S5718 and S6110), which accounts for 10% of the market. These grades are mainly used
in bottles, rigid sheet and rigid fittings.
In most downstream applications there are many converters, although major companies tend to
dominate in each application sector. Around 70% of the market is represented by large converters
that use in excess of 15 000 tons/annum of polymer.
The PVC business is different to other polymers, as there are only a few small customers and
hence the business is able to provide a cost effective bulk tanker service and full truck loads to its
customers from its warehouses infrastructure and facilities. For the other polymers customers that
order small quantities consolidated loads are used to service their requirements. The average
segment price spread over the customer base is typically 3%.
4.4.2. Impact of feedstock cost on total cost structure
Based on limited respondent input (5 respondents), PVC polymer and additives accounts for 50 –
73% of cost-of-sales, with the balance shared between other manufacturing costs (mainly labour),
and sales/administration/distribution costs.
4.4.3. Organisation of downstream players
The Plastics Federation of South Africa (PFSA) is an umbrella body for the plastics value chain
under which there are several associations. The Plastics Converters Association (PCA)
represents the interests of converters in the plastics industry. The PCA is the biggest association
in terms of membership with 316 members. There are also associations such as the South African
Polymer Importers Association (SAPIA) that represent the interests of 12 importers in the industry.

FRIDGE Chemical Sector Upstream Pricing Practices – Final Report
Ozone Business Consulting (Pty) Ltd Page 177
SAMPLAS is an association that represents 14 suppliers of machinery to the plastics industry
while the Plastics Institute of South Africa (PISA) represents individuals in the industry. Other
associations or interest groups in the plastics value chain are Association of Rotational Moulders
of South Africa (ARMSA) which has a membership of 43 companies 13 of which are outside of
South Africa, Expanded Polystyrene Association of South Africa (EPASA), South African Plastic
Pipe Manufacturers Association (SAPPMA), and Institute of Materials (IoM). The following
associations still exist but are no longer active in the plastics industry, Plastic Mould Makers
Association (PMMA), Polyurethane Association of South Africa (PASAF), and Plastic Distributors
Association of South Africa (PDASA).
4.4.4. Downstream sector ability to influence input prices received
Downstream respondents indicated that they have very little leverage to influence prices for PVC.
Global dynamics drive polymer and end- product prices up and down and the market adjusts
prices accordingly to remain competitive.
4.4.5. Duty Structures and anti-dumping measures
Tariff protection for downstream PVC products is extensive. The table below indicates specific
tariff headings that consist of either PVC based products, or could potentially be made of PVC.
The tariff protection quoted is the general tariff, and excludes the EC.
Table 4.3: PVC End-products – Tariff Protection in SA
Product Description Tariff General Of polymers of vinyl chloride 39.17.23 15% Of polymers of vinyl chloride, seamless 39.17.32.40 15% Of polymers of vinyl chloride, seamless without fittings(excluding plaiting material with a rattan core 39.17.39.30 15% of polymers of vinyl chloride 39.18.10 15% Of polymers of vinyl chloride 39.19.10.30 15% Of other polymers of vinyl chloride 39.19.90.30 16%
Of polymers of vinyl chloride 39.21.12 16%

FRIDGE Chemical Sector Upstream Pricing Practices – Final Report
Ozone Business Consulting (Pty) Ltd Page 178
Product Description Tariff General
Of polymers of vinyl chloride 39.21.90.47 15% Baths, shower-baths and wash-basins 39.22.10 20% Lavatory seats and covers 39.22.20 20%
Other 39.22.90 20% Boxes, cases, crates and similar articles 39.23.10 15% Carboys, bottles, flasks and similar articles 39.23.30 15% Other 39.23.40.90 15% Stoppers, lids caps and other closures 39.23.50 15% Other 39.23.50.90 15% Capsules and tubular neckbands, for bottles and similar containers 39.23.90.20 5% Other 39.23.90.90 15% Tableware and kitchenware 39.24.10 20% Other 39.24.90 20% Reservoirs, tanks, vats and similar containers, of a capacity exceeding 300 liter 39.25.10 20% Doors, windows and their frames and thresholds for doors 39.25.20 20% Shutters, blinds (including venetian blinds) and similar articles and parts thereof 39.25.30 20% Other 39.25.90 20%
Office or school supplies 39.26.10 20% Other 39.26.20.90 20%
Fittings for furniture, coachwork or the like 39.26.30 20% Statuettes and other ornamental articles 39.26.40 20% Beads, not coated with pearl essence 39.26.90.03 15% Transmission belts 39.26.90.20 5% Power transmission line equipment 39.26.90.25 5% Other 39.26.90.90 20%
In most cases where tariff protection is applicable the rate is in the order of 15 – 20%, which is
higher than the 10% applicable to primary PVC polymer.
Although none of the downstream respondents have indicated any anti-dumping investigation or
action in any of their PVC products, the cable manufacturers have applied for anti-dumping
measures and the industry now enjoy dumping protection against a number of countries.

FRIDGE Chemical Sector Upstream Pricing Practices – Final Report
Ozone Business Consulting (Pty) Ltd Page 179
4.5. International competitiveness of South African chemicals pricing
4.5.1. Introduction
It is important in the analysis of pricing that a common understanding of pricing terminologies is
agreed upon, especially in the context of a comparative analysis. The main issues that are
involved include the concept of an inland price for products, which is the price paid by local
customers in a particular country [which can be based on a delivered, or ex-factory basis],
compared to export prices, which are the export based prices for producers in a particular country.
This concept is explained in Appendix 3, using polypropylene as example.
The competitiveness of South African chemicals pricing is dealt with under the following headings:
• Historical SA feedstock market volumes and pricing levels
• Comparison of SA inland prices for feedstock with international prices
• Historical sales levels for key downstream products
• Basis for SA pricing calculations
• Key differentiation factors for purchasing feedstock
• Operations: (Upstream/ Downstream: Basis for operation [e.g. 24/7]; Average age and
original cost of equipment; Capacity utilisation; Workforce)
• Assessment of global competitiveness of downstream producers
• Ability for downstream to expand product range based on lower feedstock prices
• Impact of current pricing practices (Skills; Wages; Technology; Long-term sustainability;
Import replacement)
4.5.2. Historical SA feedstock market volumes and pricing levels
The historical local and export sales volumes of PVC, as well as average delivered prices are
shown in the figures below.
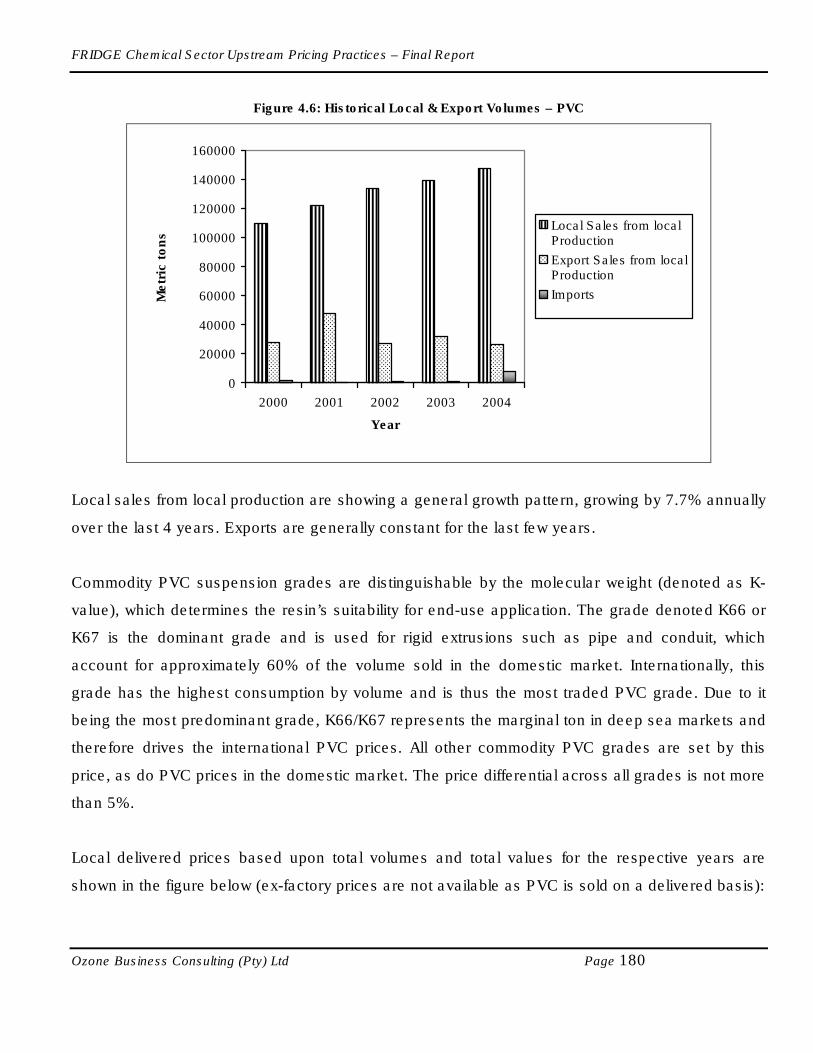
FRIDGE Chemical Sector Upstream Pricing Practices – Final Report
Ozone Business Consulting (Pty) Ltd Page 180
Figure 4.6: Historical Local & Export Volumes – PVC
0
20000
40000
60000
80000
100000
120000
140000
160000
2000 2001 2002 2003 2004
Year
Metr
ic t
on
s
Local Sales from localProduction
Export Sales from localProduction
Imports
Local sales from local production are showing a general growth pattern, growing by 7.7% annually
over the last 4 years. Exports are generally constant for the last few years.
Commodity PVC suspension grades are distinguishable by the molecular weight (denoted as K-
value), which determines the resin’s suitability for end-use application. The grade denoted K66 or
K67 is the dominant grade and is used for rigid extrusions such as pipe and conduit, which
account for approximately 60% of the volume sold in the domestic market. Internationally, this
grade has the highest consumption by volume and is thus the most traded PVC grade. Due to it
being the most predominant grade, K66/K67 represents the marginal ton in deep sea markets and
therefore drives the international PVC prices. All other commodity PVC grades are set by this
price, as do PVC prices in the domestic market. The price differential across all grades is not more
than 5%.
Local delivered prices based upon total volumes and total values for the respective years are
shown in the figure below (ex-factory prices are not available as PVC is sold on a delivered basis):
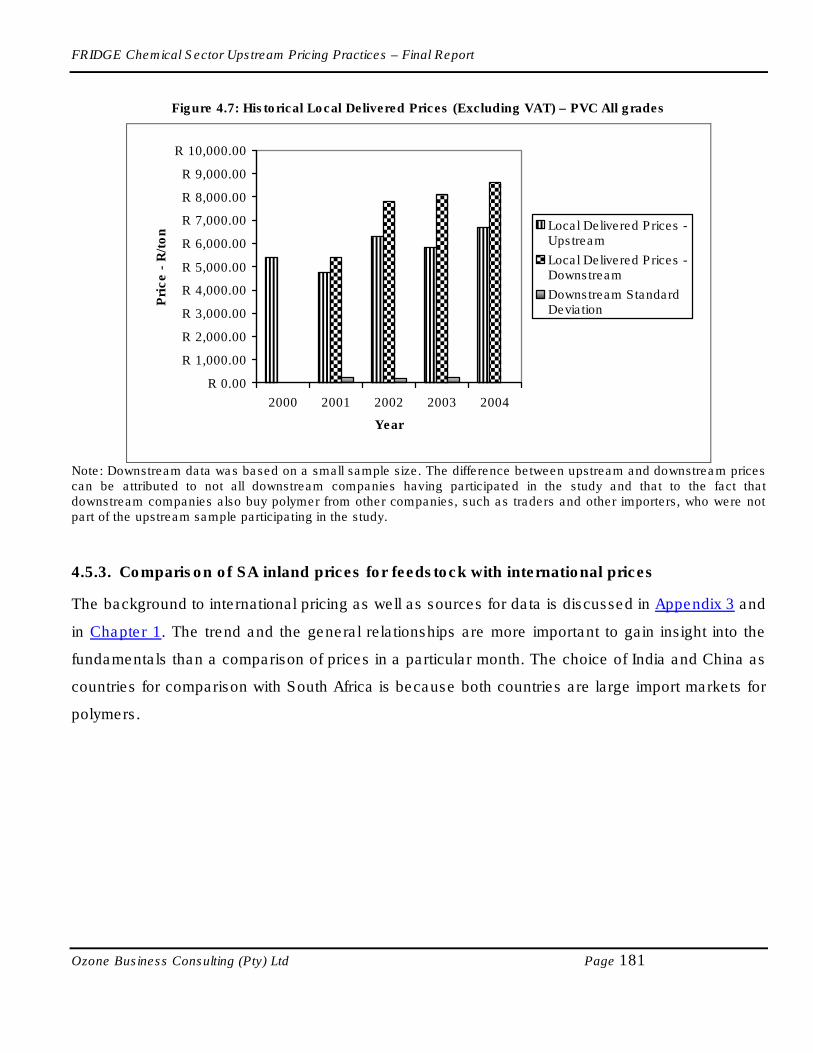
FRIDGE Chemical Sector Upstream Pricing Practices – Final Report
Ozone Business Consulting (Pty) Ltd Page 181
Figure 4.7: Historical Local Delivered Prices (Excluding VAT) – PVC All grades
R 0.00
R 1,000.00
R 2,000.00
R 3,000.00
R 4,000.00
R 5,000.00
R 6,000.00
R 7,000.00
R 8,000.00
R 9,000.00
R 10,000.00
2000 2001 2002 2003 2004
Year
Pri
ce -
R/t
on Local Delivered Prices -
Upstream
Local Delivered Prices -Downstream
Downstream StandardDeviation
Note: Downstream data was based on a small sample size. The difference between upstream and downstream prices can be attributed to not all downstream companies having participated in the study and that to the fact that downstream companies also buy polymer from other companies, such as traders and other importers, who were not part of the upstream sample participating in the study.
4.5.3. Comparison of SA inland prices for feedstock with international prices
The background to international pricing as well as sources for data is discussed in Appendix 3 and
in Chapter 1. The trend and the general relationships are more important to gain insight into the
fundamentals than a comparison of prices in a particular month. The choice of India and China as
countries for comparison with South Africa is because both countries are large import markets for
polymers.
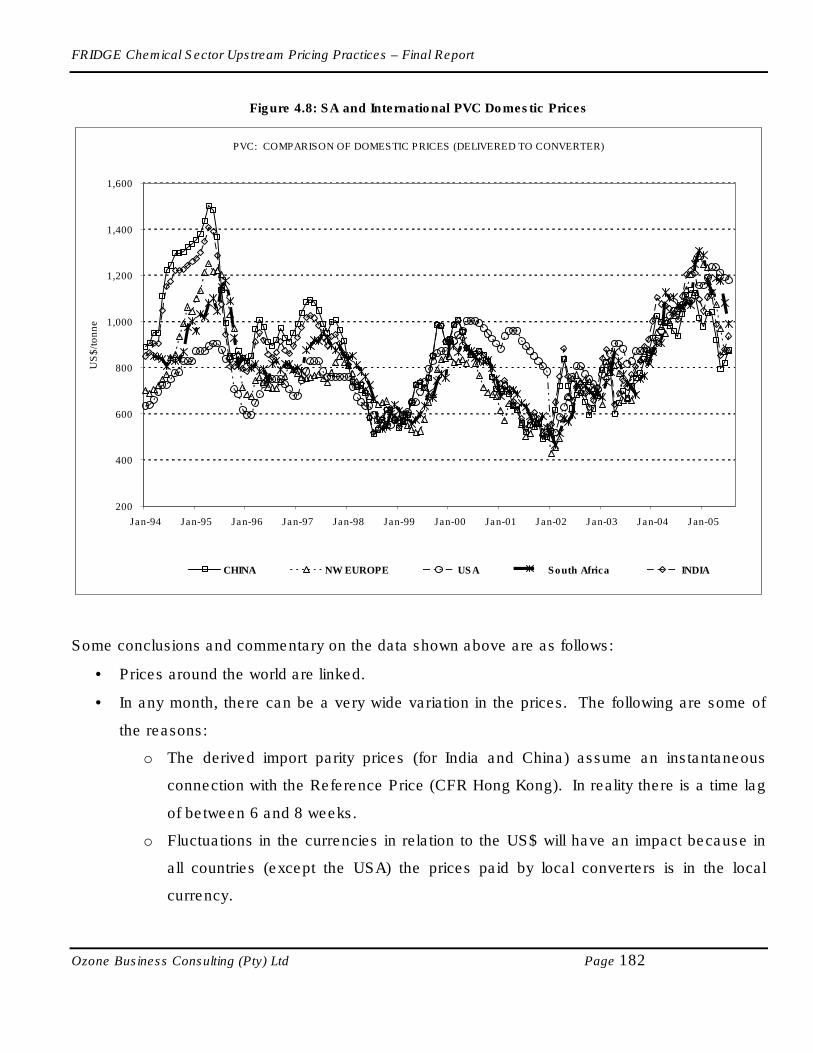
FRIDGE Chemical Sector Upstream Pricing Practices – Final Report
Ozone Business Consulting (Pty) Ltd Page 182
Figure 4.8: SA and International PVC Domestic Prices
PVC: COMPARISON OF DOMESTIC PRICES (DELIVERED TO CONVERTER)
200
400
600
800
1,000
1,200
1,400
1,600
Jan-94 Jan-95 Jan-96 Jan-97 Jan-98 Jan-99 Jan-00 Jan-01 Jan-02 Jan-03 Jan-04 Jan-05
US
$/t
onne
CHINA NW EUROPE USA South Africa INDIA
Some conclusions and commentary on the data shown above are as follows:
• Prices around the world are linked.
• In any month, there can be a very wide variation in the prices. The following are some of
the reasons:
o The derived import parity prices (for India and China) assume an instantaneous
connection with the Reference Price (CFR Hong Kong). In reality there is a time lag
of between 6 and 8 weeks.
o Fluctuations in the currencies in relation to the US$ will have an impact because in
all countries (except the USA) the prices paid by local converters is in the local
currency.

FRIDGE Chemical Sector Upstream Pricing Practices – Final Report
Ozone Business Consulting (Pty) Ltd Page 183
o During periods of regional shortages or surpluses, international and local
supply/demand balances will play a role. For example, during the periods of tight
supply, the local domestic prices in the USA were considerably higher than those in
Europe and Asia. Due to supply constraints, it was not possible to physically ship
product to the (massive) US market and the local producers were able to maintain
prices higher than import parity (from Europe or the Middle East).
• In the early part of the period under review, there was a big variation in the prices for all
polymers. The major factor contributing to this is that China and India had relatively high
import duties (>35%), but these have been reduced and this has brought the prices across
all countries covered much closer together.
Prices paid by South African converters are generally not out of line with prices paid in the
countries included in the comparison. In the early part of the period under review, the prices in
South Africa were much lower than those in China and India. However, as imports into China have
grown over the period the CFR Hong Kong price has fallen to the low end of the range. In
addition, import duties have fallen. Both factors have contributed to a narrowing of the gap
between prices in South Africa and those in China.
4.5.4. Historical sales levels for key downstream products
PVC polymer is used to manufacture a large range of end-products, including pressure pipe,
sewer and drain pipe, gutters and down pipes, conduit, profiles, medical products, cable, cling film
and footwear, bottles, rigid sheet, rigid fittings as well as many other types.
No information regarding historical growth in output was provided by the small number of
downstream respondents.
4.5.5. Basis for SA Downstream Products pricing calculations
In PVC products such as fittings, the direct competition is from imports, and local pricing is directly
based upon competing with these imports, which have a duty of 15%.

FRIDGE Chemical Sector Upstream Pricing Practices – Final Report
Ozone Business Consulting (Pty) Ltd Page 184
4.5.6. Key differentiation factors for purchasing feedstock
The first differentiation factor is to determine the most suitable PVC grade, based upon product
requirements and costs. Once the grade has been determined, suppliers are chosen on the basis
of quality, continuity of supply and price.
4.5.7. Downstream Operations
Basis for operation [e.g. 24/7]
There is only one respondent operation that is operating on a 24 hour basis, but only operates 6
days/week.
Average age and original cost of equipment
There is only one respondent operation that reported equipment of 15 years old. The original cost
of equipment was R6 million.
Capacity utilisation
Capacity utilisation for the one respondent is 90%, not taking into account idle weekend time.
Workforce
The number of the manufacturing workforce for the respondent company is 14.
4.5.8. Assessment of global competitiveness of downstream producers
One downstream respondent indicated that PVC conversion in SA is only of average
competitiveness, mainly because PVC in SA is 20% more expensive than in low-cost countries
such as Saudi Arabia.
4.5.9. Ability for downstream to expand product range based on lower feedstock prices
One respondent indicated that their imports of fittings for local resale are R50 million/annum, and
these could be made locally, but a lower PVC feedstock price is required, as well as a weaker
rand.
FRIDGE Chemical Sector Upstream Pricing Practices – Final Report
Ozone Business Consulting (Pty) Ltd Page 185
4.5.10. Impact of current pricing PVC polymer practices
Skills
One downstream respondent feels that skills are reduced as polymer prices are discouraging
value-adding.
The upstream respondent commented that the growth of the local polymer industry has
encouraged and required the development of technical, managerial, business and operational
skills that are necessary to efficiently conduct business through the whole polymer value chain.
The downstream conversion industry in South Africa is well developed and typically follows
international polymer industry value chain norms; namely large national conversion companies,
large independent companies and multitude of smaller entrepreneurial type operations. These
companies can either focus on polymer conversion or can be multifaceted companies specialising
in, for example, packaging irrespective of material type - steel, glass, paper or polymer.
Wages
One downstream respondent feels that wages are inhibited by low margins caused by high
polymer prices.
The upstream respondent commented that the polymer pricing practices have allowed for the
sustained development and growth of the downstream industry, the major employers of labour
within this industry.
Technology
One downstream respondent believes that low margins caused by upstream polymer pricing
practices are preventing them to invest in necessary new technology.
The upstream respondent commented that the sophistication of the South African end user market
is comparable with that of developed countries and hence the local polymer conversion industry is
required to keep pace with global developments in polymer technology. Consumer requirements

FRIDGE Chemical Sector Upstream Pricing Practices – Final Report
Ozone Business Consulting (Pty) Ltd Page 186
for specialised applications in turn require that the conversion industry invests in the necessary
skills and equipment to facilitate the development and production of these applications and
products (import replacement). Hence the upstream polymer production industry assists the
conversion industry by developing new grades, enhancing and modifying existing grades to meet
these requirements. Thus both the upstream and downstream industry players are required to
track and apply changes in polymer technology into their operations and product offering.
Long-term sustainability
One downstream respondent had concerns that the long-term sustainability of the downstream
sector is threatened, mainly due to low margins caused by high feedstock costs, which favours
imports of finished products even at high rates of duty.
The upstream respondent feels that to keep pace with growth, long term sustainability of the local
polymer industry will be required to expand its operations to meet the increased demand and this
can only continue if all parts of the polymer value chain are profitable and the invested capital
(equipment and skills) is adequately rewarded.
Import replacement
One downstream respondent believes that current polymer pricing practises have created little
incentive for end-users to source locally.
The upstream respondent’s view is that if the alternative is considered for a moment (no local
polymer production and all polymer goods are imported), the polymer conversion industry would
be significantly exposed to the global supply and demand balances which would manifest itself in
unreliability of supply and would significantly expose the domestic market to price fluctuations and
polymer merchants wishing to take advantage of the import situation. Secondly, South Africa itself
would not be able to handle the importation of these vast quantities of polymer raw materials and
the market would likely switch to the importation of semi finished goods and final products which
would significant damage the South African polymer conversion industry. The current pricing
practices have allowed for the growth and development of the local polymer conversion industry
as supplied by local production and as such facilitated the replacement of imports (polymer and

FRIDGE Chemical Sector Upstream Pricing Practices – Final Report
Ozone Business Consulting (Pty) Ltd Page 187
semi-finished goods) with locally produced products. In countries where there is no local producer
there is a significantly under developed polymer value chain, as semi finished and final products
are imported rather than development of a capital intensive downstream industry.
4.6. Comparison of domestic prices with export prices
No time series data was available for export prices of products that were exported out of South
Africa. The comparison has therefore been done on the average local delivered prices as received
from PVC manufacturers and converters and average export prices.
In 2004, the average local delivered price for PVC was R 6.69/kg. The average F.O.B. price in the
same year was R 5.64/kg. The major destination for South African exports was Zimbabwe. The
average export price to Zimbabwe was R 6.20/kg. The difference between the local delivered
prices and export price to Zimbabwe was around 7%. It should be noted that selling these exports
in Zimbabwe has to add onto the export price logistics costs, tariff duties, inland distribution and
agents’ commission. The relatively lower percentage differential between the domestic price in
South Africa and the export price to Zimbabwe is a function of logistics costs based on
geographical proximity.
Time series data of export prices has however been obtained for a limited period for other
countries or regions; namely the USA and North West Europe. Figures 4.9 and 4.10 below show
that the difference between delivered domestic prices in South Africa and export prices is not
unusual. For example, in the case of the USA the difference between their delivered domestic
prices and FOB prices was as high as about 40% between January and May 2001 and as high as
46% by May 2005. It should be mentioned that the gap between the two is sometimes much
closer. In fact for a period of almost one year between January 1994 and January 1995 the
domestic price was lower than the FOB price. However for most of the 10 year period as shown in
the chart the domestic price was always above the export price. The same trend should be
expected in the case of South Africa as well. It should be noted that the FOB price is not the price
paid in the export market, rather it is the price at which the polymer exits the borders of the source
country. Upon landing at the export market logistical costs, duties/tariffs (where applicable), inland
distribution and agent’s commission (in some instances) and other costs are added onto the price
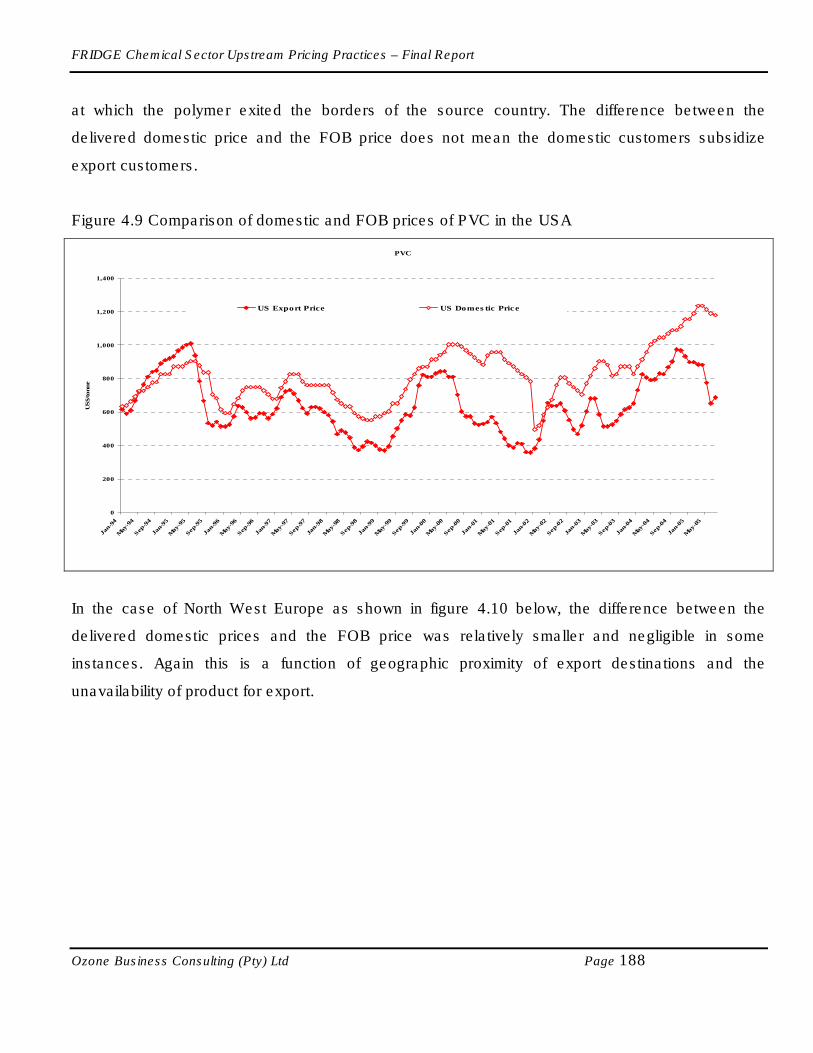
FRIDGE Chemical Sector Upstream Pricing Practices – Final Report
Ozone Business Consulting (Pty) Ltd Page 188
at which the polymer exited the borders of the source country. The difference between the
delivered domestic price and the FOB price does not mean the domestic customers subsidize
export customers.
Figure 4.9 Comparison of domestic and FOB prices of PVC in the USA
PVC
0
200
400
600
800
1,000
1,200
1,400
Jan-
94
May
-94
Sep
-94
Jan-
95
May
-95
Sep
-95
Jan-
96
May
-96
Sep
-96
Jan-
97
May
-97
Sep
-97
Jan-
98
May
-98
Sep
-98
Jan-
99
May
-99
Sep
-99
Jan-
00
May
-00
Sep
-00
Jan-
01
May
-01
Sep
-01
Jan-
02
May
-02
Sep
-02
Jan-
03
May
-03
Sep
-03
Jan-
04
May
-04
Sep
-04
Jan-
05
May
-05
US$/tonne
US Export Price US Domestic Price
In the case of North West Europe as shown in figure 4.10 below, the difference between the
delivered domestic prices and the FOB price was relatively smaller and negligible in some
instances. Again this is a function of geographic proximity of export destinations and the
unavailability of product for export.

FRIDGE Chemical Sector Upstream Pricing Practices – Final Report
Ozone Business Consulting (Pty) Ltd Page 189
Figure 4.10 Comparison of domestic and FOB prices of PVC in North West Europe
PVC
0
200
400
600
800
1,000
1,200
1,400
Jan-9
4
May
-94
Sep
-94
Jan-9
5
May
-95
Sep
-95
Jan-9
6
May
-96
Sep
-96
Jan-9
7
May
-97
Sep
-97
Jan-98
May
-98
Sep
-98
Jan-9
9
May
-99
Sep
-99
Jan-0
0
May
-00
Sep
-00
Jan-0
1
May
-01
Sep
-01
Jan-02
May
-02
Sep
-02
Jan-0
3
May
-03
Sep
-03
Jan-0
4
May
-04
Sep
-04
Jan-0
5
May
-05
US$/tonne
NW Europe Export Price NW Europe Domestic Price
An important feature of the polymer industry world-wide is that in any country that has a surplus in
any polymer, the price at which the polymer is exported is different (and usually lower) than the
price at which it is sold to domestic users even after allowing for transport and other logistics
costs. The comparison of the historical export and domestic prices of the USA and North West
Europe over a ten year period shows that:
• In both regions the PVC export price is usually lower than the domestic price.
• However, there are also periods when the export price is very close to or actually higher than
the domestic price. This takes place when the export demand increases faster than
domestic, leading to higher export prices for a short period of time.
• In general the domestic prices are higher than export prices; it is unusual for these prices to
be the other way around.

FRIDGE Chemical Sector Upstream Pricing Practices – Final Report
Ozone Business Consulting (Pty) Ltd Page 190
4.7. Impact of pricing on downstream purchasers - Demand Elasticity
4.7.1. Introduction
The approach followed to determine demand elasticity in the PVC value chain is described in
Appendix 1.
4.7.2. Demand Elasticity Analysis for PVC
It was not possible to collect accurate information from sufficient companies to enable the plotting
of historical and future demand elasticity for PVC. As such, alternative methods have been used
to calculate demand elasticity.
Professor Johannes Fedderke of the Southern African Econometric Research Unit undertook a
study of price elasticity in Sasol’s LDPE, LLDPE, PVC and PP markets during the course of 2005.
This study set out to determine the price elasticity of demand and the price elasticity of supply for
these commodities in South Africa. The input data used covered the period from January 1994 to
June 2005. The study which uses sophisticated econometric techniques draws on 10 years of
quarterly polymer consumption, polymer price and national economic data to determine both the
supply and demand side price dynamics to determine the product’s elasticity. The results of this
study indicated for PVC that a 10% decrease in price would in small segments of the PVC market
result in a 10% increase in market size, and vice versa. Only in the PVC market is there any
suggestion that price decreases will result in any significant increases in market size. Even in the
case of the PVC market, the implication is that the increase in market size will be no more than
proportional.
4.7.3. Practical Verification of Demand Elasticity for PVC
A market segment analysis was done in order to investigate the demand elasticity of PVC further.
Demand elasticity for PVC can be verified from a practical perspective by evaluating the relative
portion the PVC polymer cost in the final product that is being sold. This provides a measure of

FRIDGE Chemical Sector Upstream Pricing Practices – Final Report
Ozone Business Consulting (Pty) Ltd Page 191
elasticity as it can determine the extent to which the final product is price sensitive. An analysis for
the major polymer grades, as well as end-use applications, is shown below:
a) PVC – rigid extrusion applications (60% of PVC demand)
Major
applications
% Cost of
PVC
polymer in
converted
product
End-use product % Cost of
PVC
polymer in
end-use
product
PVC Polymer Demand
Elasticity for end-product
1. Pressure
pipe
30 – 40% Installed water
reticulation systems,
etc.
1 – 2% PVC price cannot impact
demand for water reticulation
projects
2. Electrical
conduit
30 – 40% Installed electrical
projects
< 1% PVC price cannot impact
demand for electrical
projects
3. Sewer &
drain pipes
30 – 40% Building projects < 1% PVC price cannot impact
demand for sewer and drain
projects
The conclusion is that for 90% plus of the applications, PVC polymer constitutes such a small
fraction of the installed end-product price that it cannot impact on the demand elasticity.
b) PVC – flexible applications (28% of PVC demand)
Major
applications
% Cost of
PVC
polymer in
converted
product
End-use product % Cost of
PVC
polymer in
end-use
product
PVC Polymer Demand
Elasticity for end-product
1. Cable 8 - 10% Electrical projects <2% PVC price cannot impact
demand for electrical
projects
2. Hose 25% Mining hose, garden
hose
10 – 25% PVC price cannot impact
demand for mining use.
Retail could have some

FRIDGE Chemical Sector Upstream Pricing Practices – Final Report
Ozone Business Consulting (Pty) Ltd Page 192
elasticity
The conclusion is that PVC polymer has a possibility to impact on the demand elasticity on the
retail rather industrial side.
c) PVC – Moulding applications (10% of PVC demand)
Major
applications
% Cost of
PVC
polymer in
converted
product
End-use product % Cost of
PVC
polymer in
end-use
product
PVC Polymer Demand
Elasticity for end-product
1. PVC fittings 30 – 40% Pipe fittings, etc. 30 – 40% PVC price cannot impact
demand for water reticulation
projects, which include
labour and other material
costs
2. Bottles 30 – 40% Packaging of
beverages, cosmetics,
etc.
<5% Significant product
substitution between PVC
and PET in bottles – led to
historical demand elasticity
Due to the large impact of product substitution caused by aggressive market share growth of PET
(Saturated polyester) in packaging applications, this PVC category is subject to demand elasticity.
The conclusion for PVC polymer is therefore that for most end-use applications there is no
significant demand elasticity, with the notable exception of packaging bottles and sheet. This is
therefore a verification of the statistical analysis that indicated a low elasticity.
4.8. Impact of pricing on downstream purchasers – EVC
Due to the integration of production facilities, it was not possible to obtain the required information
for the EVC analysis at individual polymer level. The analysis was therefore conducted on the
combined polymers for both the upstream and downstream sectors.

FRIDGE Chemical Sector Upstream Pricing Practices – Final Report
Ozone Business Consulting (Pty) Ltd Page 193
It is also worth noting that only one company supplied historical financial data for downstream
PVC analysis. The data did not correspond historically with that supplied by the upstream. Please
refer to Appendix 2 for EVC results of combined upstream and combined downstream polymers.
4.9. Conclusions – PVC
Production capacity for PVC in SA is around 200 000 t/a. The SA market size in 2004 for PVC
primary polymer used in local plastic conversion was estimated at 156 000 tons. This indicated
some excess capacity.
As with all regions in the global market, PVC prices are determined relative to the competitive
forces acting in the particular region. In order for a supplier to be successful in penetrating the
market and sustaining a market share position, the customers’ alternative purchasing options
must be considered and a competitive offering made. South African PVC producers follow the
same approach. They do not select a particular price from a particular region and rigorously apply
that to determine its price to the South African domestic market. They are driven by market
dynamics and react to the lowest price imports being offered by competitive suppliers to its
customers. Therefore PVC pricing mechanism prevailing in South Africa is one where the price is
negotiated based on offers in an open market where products are readily traded across national
boundaries. The outcome is that the most competitive supplier sets the price and is thus better
referred to as market pricing as opposed to formula-driven IPP. The prices in export markets are
based on marginal cost (variable cost) globally and hence are usually lower than domestic prices.
Prices of locally manufactured substitute materials, such as paper, metal and glass, are also
monitored and considered for the market sectors where they compete as alternatives to polymers.
A combination of all these factors culminates into a domestic price at a particular point in time.
A comparison between domestic and export prices that had prevailed in North West Europe and
the USA over a 10 year period revealed that in cases where there is surplus PVC, the price at
which the polymer is exported is usually lower than the price at which it is sold to domestic users.
FRIDGE Chemical Sector Upstream Pricing Practices – Final Report
Ozone Business Consulting (Pty) Ltd Page 194
The same situation was found to be the case in South Africa. In general, the further away the
export market like in the case of the USA’s exports to Brazil, the higher the price differential
between the domestic price and the export price. The converse is also true, that is, the closer the
export market as in the case of South Africa’s exports to Zimbabwe and North West Europe’s
exports which go within Europe, the smaller the price differential. There are limited periods when
the export price is very close to or actually higher than the domestic price. This takes place when
the export demand increases faster than domestic, leading to higher FOB prices for a short period
of time.
Analysis of South Africa’s domestic PVC prices compared to a number of major competing
countries, including China, US, NW Europe and India, showed that:
• Prices around the world are linked.
• In any month, there can be a very wide variation in the prices because the source of
marginally costed exports changes on a continuous basis from one country/region to
another.
• Prices paid by South African converters are always in the range of prices that prevailed in
the countries or regions (China, India, North West Europe and USA) covered in this
analysis, mostly at the lower end of the range.
• In general the domestic prices are higher than FOB prices; it is unusual for them to be the
other way around.
The global reality test for PVC showed that South Africa’s PVC conversion industry is not lagging
behind in terms of development, taking into account South Africa’s current state of economic
development. Countries such as South Korea and Taiwan, that have highly developed conversion
industries, have developed leading edge conversion technology and products (e.g. flooring) to
serve the international market. It is these countries in particular that South Africa can learn from.
The results of the demand elasticity analysis indicated that a 10% decrease in PVC price would
result in a 10% increase in market size, and vice versa. The implication is that the increase in
market size will be no more than proportional. From a practical perspective the large impact of

FRIDGE Chemical Sector Upstream Pricing Practices – Final Report
Ozone Business Consulting (Pty) Ltd Page 195
product substitution caused by aggressive market share growth of PET (Saturated polyester) in
packaging applications, the PVC bottle packaging category and sheet are subject to demand
elasticity. The general conclusion for PVC polymer is therefore that for most end-use applications
there is no significant demand elasticity.
Due to the integration of production facilities, it was not possible to obtain the required information
for the EVC analysis at individual product level. The analysis was therefore conducted on the
combined polymers upstream and downstream sectors for the period 1997 to 2005.
For upstream polymers, the EVC analysis indicated that the return on capital was frequently
lower than the weighted average cost of capital, K. This is a clear indicator that the current pricing
practices of the upstream sector are not resulting in high levels of profitability, as measured
against the total cost of capital, namely K. This situation means that the upstream sector is not
making super profits.
In the case of Sasol, the focus for this study was on Sasol Polymers, the PVC manufacturing unit
within the group and not on the whole group. Therefore profits of Sasol Limited as a group cannot
be equated to those of Sasol Polymers. Sasol Polymers, situated within the Sasol’s chemical
businesses, is a separate company within the Sasol Group, and has a supply agreement for raw
material from another Sasol Group company, Sasol Synfuels. The supply of these raw materials is
based upon a pricing mechanism that sets the price at the equivalent fuel value, which is set by
Basic Fuel Price mechanism which in turn is directly set by international fuel prices. Therefore,
Sasol Synfuels sells the feedstock at a price that they would have realised in the marketplace if it
was converted to saleable fuels. This mechanism ensures that there is no cross-subsidization
between fuels and polymers businesses and hence the profitability of the businesses is a true
reflection of the value add of the chemicals and fuel businesses.
For downstream PVC, despite all efforts, only one company provided financial data and the data
did not corresponded historically with the information provided by upstream companies. Although
statistically insignificant, the EVC analysis of combined polymers indicates that the return on
capital was lower than the weighted average cost of capital, K in every year except 1997 and

FRIDGE Chemical Sector Upstream Pricing Practices – Final Report
Ozone Business Consulting (Pty) Ltd Page 196
1999. This situation means that the downstream sector companies that responded are not making
super profits either.
The listed company analysed showed a return larger than the cost of capital (K) in 2003 that
outweighed the years of returns that were lower than the cost of capital, and IVC has remained
positive through 2005. This particular company was active in acquisitions, which caused the large
increase in EVC.

FRIDGE Chemical Sector Upstream Pricing Practices – Final Report
Ozone Business Consulting (Pty) Ltd Page 197
5. FEEDSTOCK / RAW MATERIALS FOR FERTILIZERS (PHOSPHATE ROCK,
PHOSPHORIC ACID & AMMONIA)
5.1. Market definition of upstream chemical products
a) Introduction
Feedstock or raw materials for fertilizers included in the study are phosphate rock, merchant
grade phosphoric acid and ammonia.
Phosphate rock is the term applied to marketable concentrates containing phosphate minerals,
e.g. apatite. Internationally some rock of high solubility is applied directly to soil as a fertilizer, (not
a common practice in South Africa) but most commonly phosphate rock is chemically converted to
a soluble form for use in fertilizers. Phosphate rock in SA is beneficiated to increase P2O5 contents
from less than 10% to an average 38%, but elsewhere in the world it is mostly used as is due to a
higher P2O5 content. For example, the USA, which is the largest producer and user of phosphate
rock, has average P2O5 contents of 29% compared to less than 10% for SA. In the USA
conversion of phosphate rock to downstream products such as phosphoric acid and super
phosphates is mostly on-site at the mines.
Phosphoric acid (H3PO4) is commercially available in a range of qualities and concentrations.
These range from crude acid containing most of the impurities present in phosphate rock, of low
concentration (40-54% P2O5), used for the manufacture of fertilizers such as di-ammonium
phosphate (DAP) and triple super phosphate (TSP), to a very pure acid containing very low
impurity levels, of concentrations of 75% and 85% H3PO4, as used for food applications and other
demanding end-uses.
Ammonia (NH3) is made synthetically by means of a reaction between nitrogen and hydrogen.
The hydrogen is prepared from synthesis gas, which typically is produced from natural gas, but
also other sources such as refinery gas, coal, crude oil and even wood. Nitrogen is supplied from
air, or in pure form from air separation plants.

FRIDGE Chemical Sector Upstream Pricing Practices – Final Report
Ozone Business Consulting (Pty) Ltd Page 198
Generally the production of conventional synthetic ammonia is an energy intensive, complex
process, operating at elevated temperatures and pressures. Ammonia gas itself is highly
dangerous. The gas is mostly compressed and liquefied, and transported in special high-pressure
vessels.
In the case of Sasol, the only SA ammonia producer, they operate two ammonia operations, one
in Sasolburg and one in Secunda. The Sasolburg plant is a conventional unit, previously using
Sasol’s own synthesis gas produced from coal. This plant has now been converted to use natural
gas supplied from Mozambique. Sasol’s operation in Secunda is unique in terms of its process.
The plant recovers “occluded ammonia” in coal that becomes available from Sasol’s coal
gasification operations. The ammonia is recovered from the gas liquor stream which also contains
phenols and other tar products.
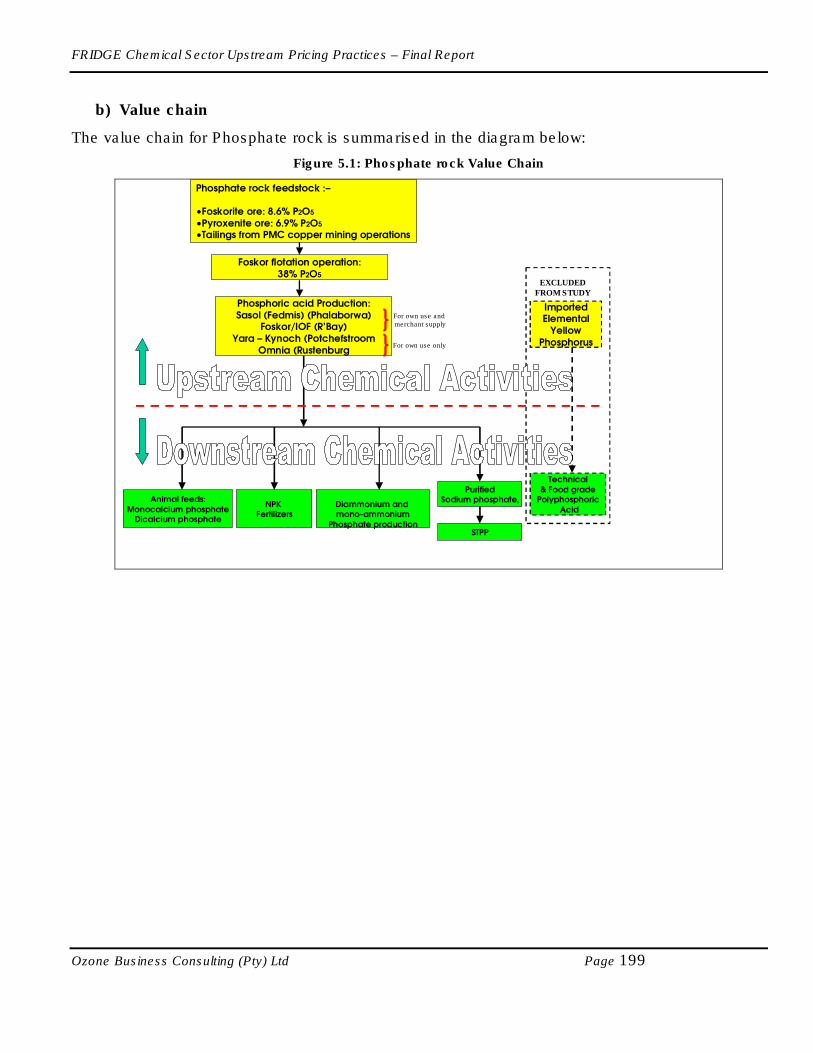
FRIDGE Chemical Sector Upstream Pricing Practices – Final Report
Ozone Business Consulting (Pty) Ltd Page 199
b) Value chain
The value chain for Phosphate rock is summarised in the diagram below:
Figure 5.1: Phosphate rock Value Chain
Foskor flotation operation:38% P2O5
Animal feeds:
Monocalcium phosphateDicalcium phosphate
Diammonium and mono-ammonium
Phosphate production
Phosphate rock feedstock :–
•Foskorite ore: 8.6% P2O5
•Pyroxenite ore: 6.9% P2O5
•Tailings from PMC copper mining operations
NPK Fertilizers
STPP
Phosphoric acid Production:Sasol (Fedmis) (Phalaborwa)
Foskor/IOF (R’Bay)Yara – Kynoch (Potchefstroom
Omnia (Rustenburg
For own use andmerchant supply
For own use only
PurifiedSodium phosphate,
ImportedElemental
YellowPhosphorus
Technical
& Food gradePolyphosphoric
Acid
EXCLUDEDFROM STUDY

FRIDGE Chemical Sector Upstream Pricing Practices – Final Report
Ozone Business Consulting (Pty) Ltd Page 200
The ammonia value chain is as follows:
Figure 5.2: Ammonia Value Chain
Purified ammonia and anhydrous ammonia imports
Fertilisers
Sasol Sasolburg –
Synthetic ammoniaproduction from natural
gas reforming
Sasol Secunda –Recovered ammonia
Ex coal gasificationCoal
Natural gas(previouslySynthesis gas)
Nitric acid production
Explosives
By-productCarbon dioxide
Ammonium nitrate productionOther chemicals:
e.g. Di-ammonium phosphate
Other uses:Animal feeds, mining, etc.
c) Applications and Global Market Size
Phosphate rock:
In 2002, global phosphate rock production grew to 132.6 million metric tons with an estimated
value of $4.8 billion. (Source: DME)
Worldwide consumption of phosphoric acid and phosphate fertilizers - the primary end-use for
phosphate rock - has been increasing since the 1970s, but the rate of growth has slowed
consistently. The second biggest demand sector - detergents - has been affected by the growing
acceptance that phosphates lead to pollution of waterways. The pattern of consumption of
phosphate rock is affected more by seasonal weather patterns and regulations covering its use,

FRIDGE Chemical Sector Upstream Pricing Practices – Final Report
Ozone Business Consulting (Pty) Ltd Page 201
than by alternate periods of growth and recession that characterise the consumption of other
industrial minerals. (Source Roskill)
Phosphoric acid:
Phosphoric acid (H3PO4) is the leading inorganic acid produced and consumed in terms of
production value and it is the second largest in terms of volume—after sulfuric acid. By far its
greatest use is in the manufacture of phosphate chemicals consumed primarily as carriers of
phosphorus in fertilizers and animal feeds. Phosphoric acid is also used in the manufacture of
phosphate chemicals for use in water treatment and detergent builders, dentifrices, fire control
chemicals and a host of smaller markets. Consumption of phosphoric acid for its acid properties
per se is relatively small (e.g., treatment of metal surfaces, beverage acidulation). Phosphoric acid
is the leading intermediate product or processing step between phosphate rock and the end
markets for phosphorus in phosphate form.
World production (and apparent consumption) reached higher levels of about 30 million metric
tons of P2O5 in 2004. The primary market for wet phosphoric acid is the production of phosphate
fertilizer products — ammonium phosphates and triple super phosphate. Fertilizer production
accounts for approximately 85% of the global market for wet phosphoric acid. The balance is
consumed in a variety of industrial applications. The United States is the largest consumer,
accounting for about 35% of apparent world consumption in 2002, and Southwest Asia, Africa and
Western Europe combined accounted for an additional 28%. Consumption in the former USSR,
which accounted for 21% of world consumption in 1986, accounted for only 8% in 2002.
Africa, with 68% of world export volume, dominates the export market for wet phosphoric acid.
The United States, Western Europe and the Middle East are also large exporters.
Ammonia:
In 2003, global ammonia production grew to 110 million metric tons, with an estimated value of
$26 billion. (Source: SRI Consulting)

FRIDGE Chemical Sector Upstream Pricing Practices – Final Report
Ozone Business Consulting (Pty) Ltd Page 202
Ammonia is the basic building block of the world nitrogen industry and is the intermediate product
from which a wide variety of nitrogen fertilizer materials and industrial products are produced.
Fertilizer use accounts for an estimated 85-90% of the end-use market for ammonia. Although the
direct application of ammonia accounts for approximately 25% of the nitrogen fertilizer market in
the United States, on a worldwide basis ammonia is generally processed into a variety of
downstream products prior to being applied to the soil.
The major downstream fertilizer products include urea, ammonium nitrate, ammonium sulfate and
ammonium phosphates. A wide variety of industrial uses for ammonia and its derivative products
account for the remaining 10-15% of the world market, including explosives.
d) Impact of different product grades or performance specifications on market
applications
Phosphate rock:
Phosphate rock is priced according to the available P2O5 contents in the rock, taking into account
the logistical cost to move the rock to the site where beneficiation takes place. The higher the
relative P2O5 contents the higher the price.
Phosphoric acid:
Crude acid of low concentration (40-54% P2O5) (MGA – merchant grade acid) is used for the
manufacture of fertilizers such as di-ammonium phosphate (DAP) and triple super phosphate
(TSP), while a very pure acid containing very low impurity levels, of concentrations of 75% and
85% (PPA – purified phosphoric acid), is used for food applications and other demanding end-
uses. Crude phosphoric acid is also de-fluorinated to produce an animal feed-grade acid.
Ammonia:
Anhydrous ammonia is a commodity chemical with a typical specification of 99.7% purity, and the
balance mainly water. Higher purity ammonia is a speciality product, and not included in this
study.
FRIDGE Chemical Sector Upstream Pricing Practices – Final Report
Ozone Business Consulting (Pty) Ltd Page 203
e) Level of competition in supply for major geographic export markets for upstream
products
Phosphate rock:
Phosphate rock is produced in many countries, of which the majors are:
• USA: 27%
• Morocco: 18.1%
• China: 15.8%
• Russia: 7.9%
SA is the 9th largest global producer with a 2.1% share. In major producing countries such as the
USA there are large numbers of independent producers.
Phosphoric acid:
The United States is the major producer of wet phosphoric acid, accounting for 36% of world
production in 2002, followed by Africa at 19% and Socialist Asia at 10%. The United States and
Africa both significantly increased their share of world production during 1986–2004, while the
shares of the former USSR, Western Europe, Eastern Europe and Japan declined.
Ammonia:
Many producers produce anhydrous ammonia in about 80 countries. In 1974 the developing
countries accounted for 27% of ammonia capacity. By 2003 their share was 52%. Some 88% of
world ammonia production is processed or used in the countries where it is produced. The
remaining 12% of world ammonia production enters international trade directly for all end-users.
(Source: International Fertilizer Industry Association).
5.2. SA Market structure and shares of upstream chemical producers
5.2.1. Domestic industry structure
a) Feedstock for Fertilizer production
Phosphate rock:

FRIDGE Chemical Sector Upstream Pricing Practices – Final Report
Ozone Business Consulting (Pty) Ltd Page 204
Typical natural phosphate rock in SA contains less than 10% phosphorus pentoxide (P2O5). The
major natural resource base is in Phalaborwa. There is no other commercial supply of phosphate
rock in SA. There is however one other phosphate rock mine (Fer-Min-Ore Phosphate) in South
Africa near Steenbokpan in the Limpopo province which beneficiates the phosphate rock for
captive production of SSP (single super phosphate) which they supply to the market.
Ammonia:
Ammonia is produced by Sasol from two distinct Sasol processes – from the Coal-to-Liquid Fuel
process in Secunda and from a dedicated ammonia synthesis process using reformed natural gas
in Sasolburg. South Africa is a net importer of ammonia and typically between 60 000 and 100
000 tons are imported annually.
Sasolburg Ammonia Synthesis Process
The key feedstock into the Sasolburg ammonia synthesis process is natural gas from
Mozambique, which is synthesized in Sasolburg prior to feeding into the ammonia and other Sasol
processes.
The Sasolburg process has undergone a number of de-bottlenecks, with the current budgeted
capacity at approximately 315 000t/a. The process forms an integral part of the Sasolburg Gas
Loop and availability of synthesized gas is dependant on the efficiency of the Gas Loop at any
given time and the economics of the various Sasol processes comprising the Gas Loop.
Sasolburg
Natural Gas
Feedstock
Auto Thermal Reactor
Synthesis Gas
(CO + H2) CO2
CO Shift CO2 Removal
NH3 Synthesis
Air Separation Plant
NH3 Storage
H2
N2
Sasolburg
Natural Gas
Feedstock
Auto Thermal Reactor
Synthesis Gas
(CO + H2) CO2
CO Shift CO2 Removal
NH3 Synthesis
Air Separation Plant
NH3 Storage
H2
N2
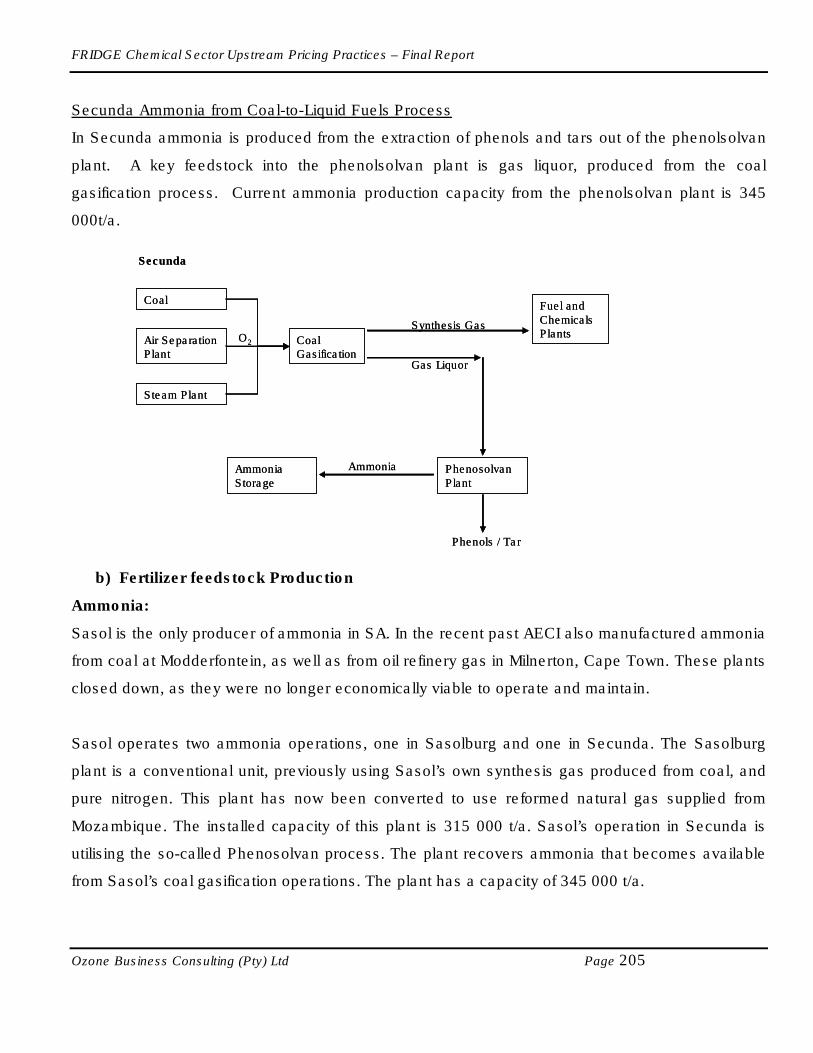
FRIDGE Chemical Sector Upstream Pricing Practices – Final Report
Ozone Business Consulting (Pty) Ltd Page 205
Secunda Ammonia from Coal-to-Liquid Fuels Process
In Secunda ammonia is produced from the extraction of phenols and tars out of the phenolsolvan
plant. A key feedstock into the phenolsolvan plant is gas liquor, produced from the coal
gasification process. Current ammonia production capacity from the phenolsolvan plant is 345
000t/a.
b) Fertilizer feedstock Production
Ammonia:
Sasol is the only producer of ammonia in SA. In the recent past AECI also manufactured ammonia
from coal at Modderfontein, as well as from oil refinery gas in Milnerton, Cape Town. These plants
closed down, as they were no longer economically viable to operate and maintain.
Sasol operates two ammonia operations, one in Sasolburg and one in Secunda. The Sasolburg
plant is a conventional unit, previously using Sasol’s own synthesis gas produced from coal, and
pure nitrogen. This plant has now been converted to use reformed natural gas supplied from
Mozambique. The installed capacity of this plant is 315 000 t/a. Sasol’s operation in Secunda is
utilising the so-called Phenosolvan process. The plant recovers ammonia that becomes available
from Sasol’s coal gasification operations. The plant has a capacity of 345 000 t/a.
Secunda
Coal
Air Separation Plant
Steam Plant
Coal Gasification
Fuel and Chemicals Plants
Phenosolvan Plant
Ammonia Storage
Gas Liquor
Synthesis Gas
Phenols / Tar
O2
Ammonia
Secunda
Coal
Air Separation Plant
Steam Plant
Coal Gasification
Fuel and Chemicals Plants
Phenosolvan Plant
Ammonia Storage
Gas Liquor
Synthesis Gas
Phenols / Tar
O2
Ammonia
FRIDGE Chemical Sector Upstream Pricing Practices – Final Report
Ozone Business Consulting (Pty) Ltd Page 206
Phosphate rock:
Foskor in Phalaborwa employs a relatively expensive flotation process to produce a phosphate
rock concentrate containing around 38% P2O5. This relatively high P2O5 concentration is required
in order to transport the phosphate rock economically to downstream users. Foskor has a stated
capacity of 3.3 million t/a, while production in 2003 was only 2.7 million tons.
Phosphoric acid:
Phosphoric acid is produced in SA at three locations, namely:
• Foskor/IOF in Richards Bay with capacity of 430 000 t/a as P2O5, being increased to
780 000 t/a
• Sasol Nitro [Fedmis] in Phalaborwa with an installed capacity of 325 000 t/a (with the
smaller plant with a capacity of 100 000 t/a being mothballed) as P2O5. The sale of
this operation by Sasol to Foskor did not go ahead because the Competition
Commission recommended that it should not be approved.
• Omnia in Rustenburg with a capacity of 55 000 t/a as P2O5, mostly for captive
consumption.
• Yara [Kynoch Fertilizers] in Potchefstroom with a capacity of 85 000 t/a as P2O5
[Plant has been closed permanently]
c) Fertilizer feedstock Market
The SA market size in 2004 for ammonia was around 710 000 t/a of which around 80 500 tons
were supplied via imports. In 2003 the local market for phosphate rock was 2.6 million tons,
declining to 1.7 million tons in 2004.
5.2.2. The effect of import tariffs, anti-dumping duties and any other regulatory factors
affecting pricing
Ammonia:
There is no tariff protection on ammonia, and no anti-dumping duties have been enacted in the
recent past. Prices are also not affected by other regulatory factors.

FRIDGE Chemical Sector Upstream Pricing Practices – Final Report
Ozone Business Consulting (Pty) Ltd Page 207
Phosphate rock:
There is no tariff protection on phosphate rock, and no anti-dumping duties have been enacted in
the recent past. Prices are also not affected by other regulatory factors.
Phosphoric acid:
There is no tariff protection on phosphoric acid, and no anti-dumping duties have been enacted in
the recent past. Prices are also not affected by other regulatory factors.
5.2.3. The global nature of the industry
Ammonia:
Ammonia is a commodity product that is produced by many countries and is well-traded in large
volumes (13 -18 million tons/annum) around the globe, demonstrating its global nature. Ammonia
is predominantly made from natural gas, and there has been a continuous shift in production
capacity towards regions with low-cost natural gas. Global plant sizes are also increasing, due to
economies-of-scale issues.
Phosphate rock:
Phosphate rock is a commodity product that is produced by many countries and well-traded in
large volumes around the globe, demonstrating its global nature. In 2003 SA produced only 1.8%
of global phosphate rock, and accounted for only 0.8% of global exports. The global supply and
export scenario for phosphate rock is shown in the following diagram:

FRIDGE Chemical Sector Upstream Pricing Practices – Final Report
Ozone Business Consulting (Pty) Ltd Page 208
Figure 5.3: Global Phosphate Rock Production and Exports - 2003
0
5000
10000
15000
20000
25000
30000
35000
USA
All
Oth
er
Moro
cco
Chin
a
Russ
ia
Tunisia
Jord
an
Bra
zil
Isra
el
South A
fric
a
Production Total 145 mill tons Exports Total 30.2 mill tons
Source: DME
Global prices for phosphate rock are determined on a supply/demand basis, but are mainly
determined by India as they import around 10% of global phosphate rock trade. The major Indian
importers publish on an annual basis the phosphate rock price, after negotiations with the major
suppliers. Global supply of phosphate rock has to be competitive based on the set prices, as
importation of downstream products such as DAP will result in uncompetitive regional phosphate
rock supply being forced out of the market.
Phosphoric acid:
Phosphoric acid, similarly to phosphate rock is a commodity product that is produced by many
countries and is well-traded in large volumes around the globe, demonstrating its global nature.
Global prices for phosphoric acid are also set by India, due to their dominance as importer of
phosphoric acid. In 2003 India accounted for 30.1% of global imports, or 3.1 million tons. SA
accounted for 18% of these Indian imports.

FRIDGE Chemical Sector Upstream Pricing Practices – Final Report
Ozone Business Consulting (Pty) Ltd Page 209
5.3. Costs and pricing of upstream chemicals products
5.3.1. The cost structure of the industry and global comparison
Ammonia
The ammonia production from the phenolsolvan plant in Secunda is part of an integrated process
that produces a range of other products, and the cost structure was not assessed as part of the
study. The cost structure for the more conventional ammonia production in Sasolburg has not
been supplied.
Phosphate Rock
SA is not a global low cost producer for both phosphate rock and phosphoric acid, as local
phosphate rock is igneous which is found through deep mining versus most of the world supply of
rock which is sedimentary and is near the surface. SA’s phosphate rock is produced by means of
a mining process, followed by a metallurgical beneficiation and concentration process that
involves chemical flotation and drying. This process increases the average P2O5 contents from
less than 10% to an average 38%. Major exporting countries elsewhere in the world have
phosphate resources that have a natural P2O5 contents that is high enough not to require
expensive chemicals, processing and drying. In addition, the inland position of the phosphate rock
source also results in high inland transportation cost to the export harbour. The major cost
elements are therefore related to typical mining operations, including materials handling and
milling, as well as the beneficiation process. The beneficiation process is an added cost for SA
compared to major global suppliers, as is the waste management of the flotation tailings. No
detailed breakdown of the actual cost of production for phosphate rock was provided.
Phosphoric Acid
Phosphoric acid is produced by means of the reaction of sulfuric acid with phosphate rock. The
cost analysis therefore has to take into consideration the production of sulfuric acid as well. The
main cost element in sulfuric acid production is sulfur feedstock. SA has little sulfur feedstock, and
the majority of requirements are imported from Canada. Due to the low unit cost of sulfur,
logistical handling and shipping costs are relatively high, making the cost of sulfuric acid
production high.

FRIDGE Chemical Sector Upstream Pricing Practices – Final Report
Ozone Business Consulting (Pty) Ltd Page 210
The major cost items in phosphoric acid production are phosphate rock and sulfuric acid, which
account for around two-thirds of total production costs. According to the upstream respondent,
phosphate rock historically was sold at less than import parity, and future inland prices were to be
set at around 26% below calculated import parity prices, as set in India. This advantage is
however negated by the high cost of imported sulfur, which is more or less double the cost of
producers that have inland access to sulphur, as well as the high inland transportation costs in
SA.
5.3.2. SA Production Advantages & Disadvantages
Ammonia
SA advantages include:
• Relatively well-developed downstream consumption into fertilizers and explosives
applications.
SA disadvantages include:
• Relatively small local production facilities compared to new globally competitive facilities.
• Relatively small local and regional market.
• Inland location of production facilities.
Phosphate Rock
The major disadvantage is high cost of production as mentioned previously and the phosphate
rock operation in SA is primarily a mining operation, using chemical flotation technology to
concentrate the ore. The advantages SA has include a large and consistent ore body, access to
mining technology know-how, maintenance and skills, competitive production factors such as
utilities and energy, as well as a good reputation regarding consistently high quality final product
which contains low levels of organic material and heavy metals such as cadmium.
The disadvantages of phosphate rock production in SA are related to the relative low P2O5
contents in the natural ore body, requiring an expensive concentration process, compared to

FRIDGE Chemical Sector Upstream Pricing Practices – Final Report
Ozone Business Consulting (Pty) Ltd Page 211
lowest cost producers elsewhere that can use their natural ore directly for phosphoric acid
production. In addition, the major production is located inland and high transportation cost and
lack of rail capacity are impediments to exports, while local demand is dependant upon the
agricultural industry, which shows large variations in demand on a seasonal and annual basis.
Export freight costs, especially to Europe, is also a disadvantage compared to major suppliers
such as Morocco.
Phosphoric Acid
Phosphoric acid production in SA has relatively few advantages. These include manufacturing
technology know-how, maintenance and skills, competitive production factors such as utilities and
energy, as well as a good reputation regarding consistently good quality final product.
The disadvantages of phosphoric acid production in SA are varying for different operations. Some
operations are small and relatively old compared to global best practice, resulting in poor
efficiencies and particularly high maintenance costs [one operation has recently been closed due
to these factors]. Local demand is dependant upon the agricultural industry, which shows large
variations in demand on a seasonal and annual basis. A major disadvantage is the lack of sulphur
mineral resources in SA, causing expensive importation of nearly 1 million tons/annum. Sulfur is
required to manufacture sulfuric acid, a main raw material for phosphoric acid production.
5.3.3. Upstream pricing practices with respect to downstream domestic purchasers
Ammonia
Ammonia is sold on contract to explosives, fertilizer and mainly on a non-contractual basis to
smaller industrial customers. A contract price formula is used to determine the monthly selling
price of ammonia to explosives and fertilizer industry customers. The contract price is based upon
the actual FOB import prices to South Africa from the Middle East (75%) and Yuzhny, Russia
(25%) and including all logistics costs. The ammonia contract price formula also makes provision
for a competitive position for limestone ammonium nitrate fertilizer versus imported urea. The
ammonia price for each month is calculated on the 15th of the previous month based upon the

FRIDGE Chemical Sector Upstream Pricing Practices – Final Report
Ozone Business Consulting (Pty) Ltd Page 212
average published spot price (FERTECON and FMB) out of the Middle East and Yuzhny for the
previous four weeks and the average exchange rates for the same period.
Phosphate Rock
In the past [up to May, 2004] the price of phosphate rock was determined on the basis of import
parity price for DAP [Di-ammonium Phosphate] and phosphoric acid. The rock contents of DAP
and phosphoric acid were calculated, and split on a ratio of 60/40 to determine the phosphate rock
price. This formula was found to be unsustainable for the producer, and after negotiations with all
buyers a new formula was agreed upon. This is indexed upon the CFR [freight delivered price]
price of phosphate rock in India [currently around $85/ton], starting at a level of $59/ton.
Effectively local phosphate prices are therefore at a discount of 30.6% compared to India, and this
ratio will be maintained in future. However, Sasol Nitro was not party to this agreement and opted
to pursue selling their plant to Foskor as the new price made the plant not economically viable.
This sale transaction was not approved by the Competition Commission and Sasol Nitro as a
result currently produces phosphoric acid from phosphate rock for Foskor by tolling agreement.
Phosphoric Acid
Phosphoric acid is priced on an import parity basis, using the Indian CFR price as basis. A recent
agreement has been struck whereby the local price will be equivalent to the Indian CFR price,
decreased by 25% of the freight cost from India. This would lead to local prices being around 4%
below actual IPP prices.

FRIDGE Chemical Sector Upstream Pricing Practices – Final Report
Ozone Business Consulting (Pty) Ltd Page 213
5.4. Major downstream industries that purchase upstream products
5.4.1. End-use structure
Ammonia
The estimated end-use market structure for ammonia is shown in the table below:
% of total sales Application Major end-users
40- 45 Explosives AEL, BME, Sasol Nitro
45 - 50 Fertilizers Omnia, Yara, Sasol Nitro
Metal Processing Impala Platinum Cyanide Sasol Polymers
5 - 10 Chemical/Biochemical
Bioproducts, African Amines, Anchor Yeast
Phosphate Rock
Phosphate rock is only used to manufacture phosphoric acid. This structure is described in par.
5.2.1.
Phosphoric Acid
Phosphoric acid is used primarily to manufacture phosphate based fertilizer and animal feed
products such as NPK mixes, MAP and DAP as well as MCP and DCP that are produced primarily
by the three major fertilizer producers, all of whom have their own captive phosphoric acid
production, supplemented by third party purchases.
5.4.2. Impact of feedstock cost on total cost structure
Ammonia
Ammonia is mainly used to manufacture ammonium nitrate. The cost of ammonia accounts on
average for more than 80% of the variable production cost of ammonium nitrate.

FRIDGE Chemical Sector Upstream Pricing Practices – Final Report
Ozone Business Consulting (Pty) Ltd Page 214
Phosphate Rock
Phosphate rock is only used to manufacture phosphoric acid. In terms of the total cost structure
for the manufacturing of phosphoric acid, phosphate rock accounts for around 50 – 55% of total
variable costs, and around 40 – 45% of total costs, including fixed costs and depreciation.
Phosphoric Acid
Phosphoric acid is used primarily to manufacture phosphate based fertilizer and animal feed
products. The major purchasers of phosphoric acid also have captive production, leading to
commercial purchases of phosphoric acid accounting for only around 5% of variable costs, and
around 4% of total costs.
5.4.3. Organisation of downstream players
Ammonia
The downstream sectors affected by ammonia feedstock are mainly the primary fertilizer and
explosives production sector. This includes Sasol Nitro’s fertilizer and explosives business units
which also purchase ammonia at arm’s length from Sasol Nitro’s ammonia business unit, Sasol
Nitro’s ammonia, fertilizer and explosives business units operate as separate profit centres and
this ensures equal pricing of ammonia to all consumers including external customers. The fertilizer
companies are corporate members of the fertilizer industry association [Fertilizer Society of SA -
www.fssa.org.za]
Phosphate Rock
The downstream sector affected by phosphate rock feedstock is mainly the primary fertilizer
production sector, which consists of only four major companies, including Foskor who is a captive
producer (producing for own use) of phosphate rock. These companies are corporate members of
the fertilizer industry association [Fertilizer Society of SA - www.fssa.org.za]
Phosphoric Acid
Similarly to phosphate rock, the downstream sector affected by phosphoric acid feedstock is
mainly the primary fertilizer production sector.

FRIDGE Chemical Sector Upstream Pricing Practices – Final Report
Ozone Business Consulting (Pty) Ltd Page 215
5.4.4. Downstream sector ability to influence input prices received
Ammonia
The downstream sector, consists of the three principal producers of ammonium nitrate [including
Sasol Nitro). Sasol Nitro applies formula price for ammonia that also makes provision for a
discount to ensure a competitive position for limestone ammonium nitrate versus imported urea.
Non-captive downstream users have the freedom to import ammonia.
Phosphate Rock
The downstream sector consists of two large fertilizer companies that manufacture phosphoric
acid (the third recently closed their plant), who on a regular basis negotiate the phosphate rock
price for a predetermined period. This excludes Sasol Nitro since Sasol Nitro currently
manufactures phosphoric acid from phosphate rock for Foskor under a toll agreement. However,
once an agreement is reached they do not have the ability to alter it. The ability of the downstream
sector to influence the price comes from the lack of global competitiveness for the exports of
phosphate rock, which means that the upstream producer must preferably find a local market.
Phosphoric Acid
Phosphoric acid is a unique product for the study in that downstream companies have captive
production. The three major fertilizer companies use 100% of the commercial (non-captive)
phosphoric acid. Similarly to phosphate rock, the major fertilizer companies negotiate
independently on a regular basis the price mechanism for a predetermined period. However, once
an agreement is reached they do not have the ability to alter it.
5.4.5. Duty Structures and anti-dumping measures
Ammonia
There are no duty structures on the major derivatives of ammonia, including ammonium nitrate,
NPK fertilizers, MAP & DAP. No anti-dumping measures are currently in place.

FRIDGE Chemical Sector Upstream Pricing Practices – Final Report
Ozone Business Consulting (Pty) Ltd Page 216
Phosphate Rock
There is no duty structure on the importation of phosphoric acid. No anti-dumping measures are
currently in place.
Phosphoric Acid
There are no duty structures on the major derivatives of phosphoric acid, including NPK fertilizers,
MAP & DAP as well as MCP and DCP. No anti-dumping measures are currently in place.
5.5. International competitiveness of South African chemicals pricing
5.5.1. Introduction
It is important in the analysis of pricing that a common understanding of pricing principles is
agreed upon, especially in the context of a comparative analysis. The main issue that is involved
is the concept of an inland price for products, which is the price paid by local customers in a
particular country.
The competitiveness of South African chemicals pricing is dealt with under the following headings:
• Historical SA feedstock market volumes and pricing levels
• Comparison of SA inland prices for feedstock with international prices
• Historical sales levels for key downstream products
• Basis for SA pricing calculations
• Key differentiation factors for purchasing feedstock
• Operations: (Upstream/ Downstream: Basis for operation [e.g. 24/7]; Average age and
original cost of equipment; Capacity utilisation; Workforce)
• Assessment of global competitiveness of downstream producers
• Ability for downstream to expand product range based on lower feedstock prices
• Impact of current pricing practices (Skills; Wages; Technology; Long-term sustainability;
Import replacement)

FRIDGE Chemical Sector Upstream Pricing Practices – Final Report
Ozone Business Consulting (Pty) Ltd Page 217
5.5.2. Historical SA feedstock market volumes and pricing levels
Ammonia
Ammonia sales into the local South African market include both captive sales by Sasol’s ammonia
business unit to Sasol’s s fertilizer and explosives business units as well as third party sales. The
historical local and export sales volumes of ammonia, as well as average ex-factory and delivered
prices are shown in the figures below. For commercial sensitivity no actual data values are
published on the chart.
Figure 5.4: Historical Local & Export Volumes – Ammonia
0
100000
200000
300000
400000
500000
600000
700000
800000
2000 2001 2002 2003 2004
Year
Metr
ic t
on
s
Local Sales from localProduction
Export Sales from localProduction
Imports
Local supply, imports and export volumes show an erratic growth pattern. Exports (which are to
neighbouring Southern African countries) are generally small and declining especially since 2001
when AECI closed down its plants. Therefore South Africa continues to be a net importer of
ammonia.
The contract price formula for ammonia does not determine an ex-factory price, but a delivered
price, with delivery deemed to have taken place from the coast (Richards Bay port). The average

FRIDGE Chemical Sector Upstream Pricing Practices – Final Report
Ozone Business Consulting (Pty) Ltd Page 218
delivered price for ammonia, as provided by upstream and downstream respondents are shown in
the diagram below:
Figure 5.5: Historical Local Delivered Prices - Ammonia
0
500
1000
1500
2000
2500
2000 2001 2002 2003 2004
Year
Pri
ce -
R/t
on
Local Delivered Prices -Upstream
Local Delivered Prices -Downstream
The delivered prices as provided by upstream and downstream respondents are within 5% of
each other, which indicates relatively good correlation. It should be noted that the captive
downstream user was excluded from the calculation, which could account for the differences. It is
also interesting to note that although there was a substantial increase in the value of the Rand
since 2002, the SA delivered prices continued to increase, mainly due to the significant increase in
international $-based prices and freight charges for ammonia.
Phosphate Rock
The historical local and export sales volumes of phosphate rock, as well as average ex-factory
and delivered prices are shown in the figures below. For commercial sensitivity no actual data
values are published on the chart.

FRIDGE Chemical Sector Upstream Pricing Practices – Final Report
Ozone Business Consulting (Pty) Ltd Page 219
Figure 5.6: Historical Local & Export Volumes - Phosphate Rock
0
500000
1000000
1500000
2000000
2500000
3000000
2000 2001 2002 2003 2004
Years
Vo
lum
e -
to
ns
Local Sales
Export Sales
Both local and export volumes show an erratic growth pattern. Exports also vary in a range of 6 –
12% of total production.
Figure 5.7: Historical Local Ex-factory and Delivered Prices - Phosphate Rock
0
50
100
150
200
250
300
350
400
450
500
2000 2001 2002 2003 2004
Years
Pri
ce
- R
/to
n
Local Ex-Factory Prices
Local Delivered Prices

FRIDGE Chemical Sector Upstream Pricing Practices – Final Report
Ozone Business Consulting (Pty) Ltd Page 220
Local delivered prices carry a significant transport cost component, which is as high as 38% of the
total cost.
Phosphoric Acid
Phosphoric acid supply into the local market comprises of captive production as well as
commercial third party supply. The Competition Commission blocked the sale of Fedmis to Foskor
with Sasol now manufacturing phosphoric acid for Foskor under a toll agreement, while Yara
[previously called Kynoch] has closed their Potchefstroom plant. No detailed breakdown of the
commercial sales of phosphoric acid to domestic customers is made, but as an example, in 2004
only around 5% of the roughly 1 million tons produced was sold as commercial sales, while
around 67% was exported, predominantly to India. The historical local and export sales volumes
of phosphoric acid, as well as average ex-factory and delivered prices are shown in the figures
below.
Figure 5.8: Historical Local & Export Volumes – Phosphoric Acid (Local sales include captive)
0
500000
1000000
1500000
2000000
2500000
3000000
2000 2001 2002 2003 2004
Years
Vo
lum
e -
to
ns
Local Sales
Export Sales
Both local and export volumes show an erratic growth pattern. Exports also vary in a range of 6 –
12% of total production.

FRIDGE Chemical Sector Upstream Pricing Practices – Final Report
Ozone Business Consulting (Pty) Ltd Page 221
Figure 5.9: Historical Local Delivered Prices - Phosphoric Acid
2400
2500
2600
2700
2800
2900
3000
3100
3200
2000 2001 2002 2003 2004
Year
Pri
ce -
R/t
on
Local Delivered Prices
Local delivered prices carry a significant transport cost component, which is as high as 38% of the
total cost.
5.5.3. Comparison of SA inland prices for feedstock with international prices
Ammonia
SA inland or domestic prices are directly linked by means of the formula-applied pricing
mechanism to international prices. The price history of international ammonia prices in major
producing and consuming countries, compared to SA domestic price [Richards Bay] is shown in
the diagram below: [Sources: FERTECON, FMB]
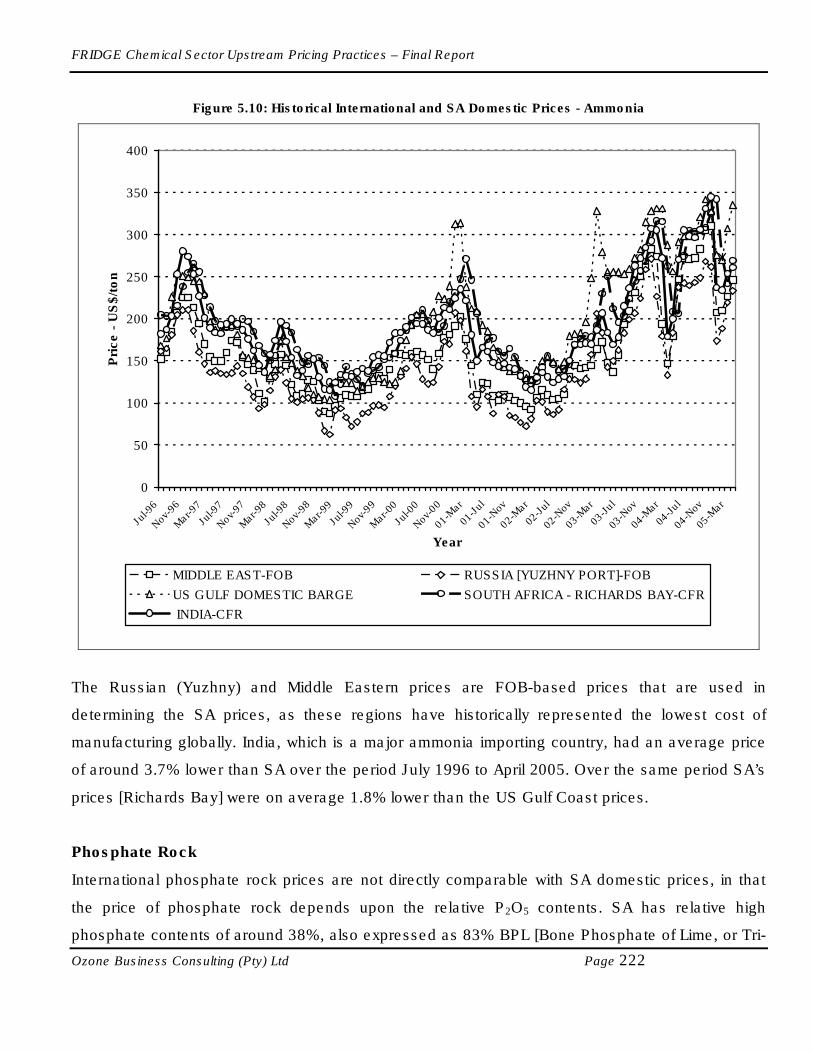
FRIDGE Chemical Sector Upstream Pricing Practices – Final Report
Ozone Business Consulting (Pty) Ltd Page 222
Figure 5.10: Historical International and SA Domestic Prices - Ammonia
0
50
100
150
200
250
300
350
400
Jul-9
6
Nov
-96
Mar-9
7
Jul-9
7
Nov-
97
Mar
-98
Jul-9
8
Nov
-98
Mar
-99
Jul-9
9
Nov
-99
Mar
-00
Jul-0
0
Nov
-00
01-M
ar
01-J
ul
01-Nov
02-M
ar
02-J
ul
02-N
ov
03-M
ar
03-J
ul
03-N
ov
04-M
ar
04-J
ul
04-N
ov
05-M
ar
Year
Pri
ce -
US
$/t
on
MIDDLE EAST-FOB RUSSIA [YUZHNY PORT]-FOB
US GULF DOMESTIC BARGE SOUTH AFRICA - RICHARDS BAY-CFR
INDIA-CFR
The Russian (Yuzhny) and Middle Eastern prices are FOB-based prices that are used in
determining the SA prices, as these regions have historically represented the lowest cost of
manufacturing globally. India, which is a major ammonia importing country, had an average price
of around 3.7% lower than SA over the period July 1996 to April 2005. Over the same period SA’s
prices [Richards Bay] were on average 1.8% lower than the US Gulf Coast prices.
Phosphate Rock
International phosphate rock prices are not directly comparable with SA domestic prices, in that
the price of phosphate rock depends upon the relative P2O5 contents. SA has relative high
phosphate contents of around 38%, also expressed as 83% BPL [Bone Phosphate of Lime, or Tri-

FRIDGE Chemical Sector Upstream Pricing Practices – Final Report
Ozone Business Consulting (Pty) Ltd Page 223
calcium Phosphate]. The major exporter of phosphate rock, Morocco, exports on average a grade
that is 70% BPL, or 32% P2O5.
Due to this factor, it would not be useful to compare SA inland prices against a range of countries,
as it would require a detailed knowledge of actual BPL contents in those countries, and that is not
readily available. It was therefore decided to base the historical price comparison on the basis of
the Moroccan export, or F.O.B. price, adjusted to the SA BPL contents. This is shown in the chart
below. Indian CFR prices, which are an indication of Indian import parity prices, are also shown
and compared to SA delivered prices.
Figure 5.11: Historical Local and International Prices - Phosphate Rock
0
10
20
30
40
50
60
70
80
90
2000 2001 2002 2003 2004
Year
Pri
ce -
US
$/t
on
No
rmali
sed
to
83%
BP
L
Local Ex-factory Prices
Local Delivered Prices
Moroccan F.O.B. Prices
Indian C.F.R. Prices
It is clear that in the case of phosphate rock [taking into account variances in BPL levels], SA
delivered prices are historically well below Indian CFR prices, which exclude Indian inland delivery
costs. Ex-factory SA prices are either below or similar to Moroccan export prices.

FRIDGE Chemical Sector Upstream Pricing Practices – Final Report
Ozone Business Consulting (Pty) Ltd Page 224
Phosphoric Acid
Phosphoric acid delivered prices in SA are compared to Indian CFR prices, as India is the price
setter for phosphoric acid on a global basis due to their exceptionally large import volumes [e.g.
2.9 million tons in 2004].
Figure 5.12: Historical Local and International Prices – Phosphoric Acid
0
50
100
150
200
250
300
350
400
450
2000 2001 2002 2003 2004
Year
Pri
ce -
US
$/t
on
Local Delivered Prices
Indian C.F.R. Prices
Local delivered prices for phosphoric acid [commercial sales between inland based suppliers and
consumers] are relatively closely following the Indian CFR price, which does not take into account
the inland delivery cost in India.
5.5.4. Historical sales levels for key downstream products
Ammonia
Ammonia is mainly used to manufacture ammonium nitrate, which in turn is the major component
of commercial explosives [used as porous prills], as well as a key Nitrogen source in mixed
fertilizers.
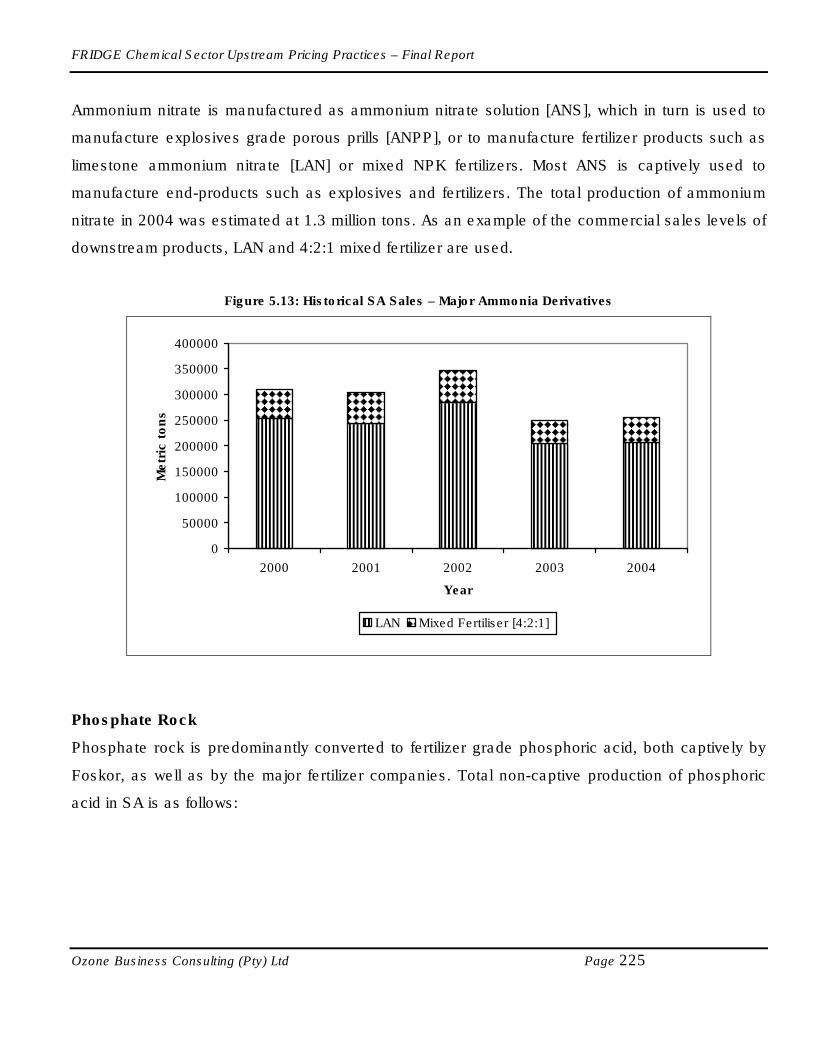
FRIDGE Chemical Sector Upstream Pricing Practices – Final Report
Ozone Business Consulting (Pty) Ltd Page 225
Ammonium nitrate is manufactured as ammonium nitrate solution [ANS], which in turn is used to
manufacture explosives grade porous prills [ANPP], or to manufacture fertilizer products such as
limestone ammonium nitrate [LAN] or mixed NPK fertilizers. Most ANS is captively used to
manufacture end-products such as explosives and fertilizers. The total production of ammonium
nitrate in 2004 was estimated at 1.3 million tons. As an example of the commercial sales levels of
downstream products, LAN and 4:2:1 mixed fertilizer are used.
Figure 5.13: Historical SA Sales – Major Ammonia Derivatives
0
50000
100000
150000
200000
250000
300000
350000
400000
2000 2001 2002 2003 2004
Year
Metr
ic t
on
s
LAN Mixed Fertiliser [4:2:1]
Phosphate Rock
Phosphate rock is predominantly converted to fertilizer grade phosphoric acid, both captively by
Foskor, as well as by the major fertilizer companies. Total non-captive production of phosphoric
acid in SA is as follows:

FRIDGE Chemical Sector Upstream Pricing Practices – Final Report
Ozone Business Consulting (Pty) Ltd Page 226
Figure 5.14: Historical Non-captive SA Production – Phosphoric Acid
0
100000
200000
300000
400000
500000
600000
700000
800000
900000
1000000
2000 2001 2002 2003 2004
Year
Metr
ic t
on
s
Non-captive Phosphoric Acid Production
Phosphoric Acid
Phosphoric acid is used to manufacture a range of mixed fertilizers, as well as fertilizer elements
such as MAP [Mono-ammonium phosphate] and DAP [Di-ammonium phosphate]. It is also used
to manufacture animal feed elements such as MCP [Mono-calcium phosphate] and DCP [Di-
calcium phosphate]. In total around 91% of phosphoric acid is used in fertilizer products, and 9%
in animal feeds.
There is a large range of fertilizers being sold in the market [2 million tons/annum], many of which
contain phosphoric acid derivatives. According to one respondent, sales of two major phosphoric
acid derivatives, both mixed fertilizer types, in SA are as follows:

FRIDGE Chemical Sector Upstream Pricing Practices – Final Report
Ozone Business Consulting (Pty) Ltd Page 227
Figure 5.15: Historical SA Sales – Major Phosphoric Acid Derivatives
0
20000
40000
60000
80000
100000
120000
140000
2000 2001 2002 2003 2004
Year
Metr
ic t
on
s
Mixed Fertiliser [6:3:2} Mixed Fertiliser [3:2:1]
5.5.5. Basis for SA Downstream Products pricing calculations
Ammonia
For ammonium nitrate, prices are based on a factor of approximately 0.4 times the ammonia cost,
plus conversion costs, which differ according to the end-product type. Any price change in
ammonia is immediately transferred to industrial purchasers, but contracted explosives users have
a time lag that is financed by the downstream supplier. This is a major cost factor for explosives
producers, as the price of ammonia over the last few years have continued to rise, with no period
where suppliers could recover this cost. The contractual end-users also have a provision where
they can forward purchase ammonia from Sasol Nitro in order to improve on cost related to
ammonia.
End-users have significant leverage for ammonium nitrate based fertilizer prices in that these
fertilizers can be replaced with imported urea based alternatives. The prices of urea based
fertilizers fluctuate drastically and are largely impacted by global supply demand balances. Prices
for downstream products such as mixed fertilizers are based largely upon the relative costs of
imported alternatives and to a lesser extent conversion costs and costs of feedstock.

FRIDGE Chemical Sector Upstream Pricing Practices – Final Report
Ozone Business Consulting (Pty) Ltd Page 228
Phosphate Rock/Phosphoric Acid
The downstream pricing practises for mixed fertilizers produced locally from phosphoric acid are
largely based upon the imports of competing end-product fertilizers, which has a relationship with
import parity, plus a premium for the added services.
5.5.6. Key differentiation factors for purchasing feedstock
Key differentiation factors for purchasing feedstock include product specifications, price and
service levels. It is difficult to separate factors that lead to price differences with, for example
100% imported fertilizer. It is a mixture of reliability of delivery, price security, consistency in
quality, services such as soil analysis and advice, etc.
For ammonia, downstream companies do have three “forward buying” options per year where
they can opt to use an option depending upon whether ammonia prices are rising or falling.
5.5.7. Operations:
a) Upstream:
Ammonia
The Sasolburg and Secunda plants are operating at 100% of production capacity on a 24 hours/7
days per week basis. The Sasolburg plant requires an 18-day shutdown every four years, and
employs in the order of 55 people [80% in production]. At Secunda the integrated nature of the
phenolsolvan plant makes it difficult to separate personnel employed solely on the ammonia
stream.
Phosphate Rock
The only operation is a mining based plant, operating at around 80% of production capacity on a
24 hours/7 days per week basis. The Foskor operation in Phalaborwa was commissioned in 1951,
and is continuously upgraded and expanded.

FRIDGE Chemical Sector Upstream Pricing Practices – Final Report
Ozone Business Consulting (Pty) Ltd Page 229
Phosphoric Acid
The Foskor Richards Bay plant is operating at around 95% of production capacity on a 24 hours/7
days per week basis. The plant was recently expanded at a capital cost of R1.1 billion from 430 to
780 kilotons/annum capacity, and employs in the order of 600 people [90% in production].
b) Downstream:
Fertilizer plants are operating at around 60 – 100% of production capacity on a 24 hours/7 days
per week basis. Typical operations have equipment that is aged from more 30 years to less than 6
years. Direct investment in equipment involved in downstream fertilizer is in the range of R300 to
R400 million per operation, and employs around 1000 people, of which 70% is in production.
Nitric acid and ammonium nitrate plants are operating at around 87 – 93% of production capacity
on a 24 hours/7 days per week basis. One respondent operation has equipment that is 40 years of
age. Original direct investment in equipment involved was in the range of R130 to R140 million,
and the company employs around 2749 people, of which 68% is in production.
5.5.8. Assessment of global competitiveness of downstream producers
The one respondent company in ammonium nitrate/explosives production indicated that local
operations are reasonably competitive with international operations, based upon studies
conducted by them. In export markets (being neighbouring Southern African countries) permitted
by logistics considerations, the operations are competitive against other exporters.
As far as SA based fertilizer operations are concerned, the general assessment is that they are
not globally competitive, mainly due to the following reasons:
• Logistical costs for SA are high, preventing low-cost access for competing feedstock, but
also increasing cost for exports of end-product, which lower volumes and increase cost of
production.
• Upstream feedstock prices do not allow downstream producers sufficient margin compared
to international integrated operations with a low feedstock base. Low-cost based feedstock

FRIDGE Chemical Sector Upstream Pricing Practices – Final Report
Ozone Business Consulting (Pty) Ltd Page 230
countries such as Morocco also competes with downstream fertilizer in the world market,
based upon integrated plants.
• Small scale and relative age of SA operations have significantly higher fixed and variable
costs compared to large international plants.
• SA interest rates for funding plant expansions and renewals are higher than elsewhere.
• SA tax rates are relatively high, with little or no tax concessions for investment.
• There are skills shortages in areas such as professional technical people and artisans.
It should be noticed that a proper evaluation of global competitiveness can only be done on the
basis of a benchmarking analysis, which is not part of this study, and requires significant
resources. The comments above came from respondents.
5.5.9. Ability for downstream to expand product range based on lower feedstock prices
SA imports in the order of 500 000 t/a of urea, which can be substituted by limestone ammonium
nitrate (which is manufactured from ammonia as the primary feedstock), but it requires a price
reduction of around 15% of the ammonia cost, to be competitive against current urea prices. This
is, however, not a realistic scenario in that local ammonia capacity is already fully utilised. It must
be noted that limestone ammonium nitrate fertilizer generally earns a price premium over urea due
to some properties which are preferred by customers for some fertilizer applications. This allows
South African fertilizer manufacturers to compete with imported urea at current ammonia prices.
Cost, access to feedstock [oil or gas] and scale of manufacturing/market size currently prevents
local investment for production of urea and more ammonia. Because of the constraints on local
production of ammonia and LAN, a reduction in ammonia prices within SA would be unlikely to
have any significant effect on the use by SA farmers of domestically produced LAN or ANS.
By lowering phosphate rock prices in SA, downstream producers could consider further production
of phosphoric acid, in particular to use for further exports of fertilizer NPK mixes. Only 9% of
African farmers use fertilizers, which indicate a huge untapped market for fertilizer exports into
African countries.
.

FRIDGE Chemical Sector Upstream Pricing Practices – Final Report
Ozone Business Consulting (Pty) Ltd Page 231
5.5.10. Impact of current pricing practices on:
a) Skills
There is no significant impact in direct operations. Downstream operations believe that they have
an opportunity through social upliftment projects to develop skills in the emerging farming sector.
Their current low margins in fertilizers do not allow them to initiate such programmes. It is a
possibility that SETA funds could be used for this purpose.
b) Wages
Most downstream players are large companies that pay wages that are on the same level as the
rest of the sector. They do, however, believe that by decreasing the level of feedstock enough, it
will be possible to invest further in downstream capacity with a view on exports, and thereby
increase employment and the total wage bill. Downstream commented in this anecdotal manner
and no detailed explanation was provided by them.
c) Technology
Downstream technology is relatively old, and increased margins would allow for increased
investment in technology advancement, in particular related to environmental improvements.
Again, downstream respondents comment in a general way, and no direct conclusion can be
drawn that a decrease in feedstock prices will result in new investment.
d) Long-term sustainability
The viability of downstream fertilizer operations is assessed on a day-to-day basis, leading in to
the recent announcement of the closure of the Yara phosphoric acid plant in Potchefstroom. New
investment in fertilizer operations has been minimal in the recent past. Also, age of equipment
and small plant sizes are resulting in relatively high costs.
e) Import replacement
The most significant import replacement opportunity in the fertilizer arena is urea, which competes
with LAN made from ammonia. Local capacity constraints in ammonia and LAN cause large
volumes of urea imports (483 833 tons in 2005).
FRIDGE Chemical Sector Upstream Pricing Practices – Final Report
Ozone Business Consulting (Pty) Ltd Page 232
5.6. Impact of pricing on downstream purchasers - Demand Elasticity
5.6.1. Introduction
Market prices are the result of interactions between demand and supply. As such, the impact of
price (P) on demand (Q) cannot be isolated without taking into account the potential impact that
the supply of output to the market would have on both price and quantity. Therefore, it is advisable
to use an estimation technique that allows a simultaneous estimation of both the demand and
supply side in order to determine the price elasticity of demand that is really characteristic of the
market of “fertilizers” in South Africa.
In this study the demand and supply curves of “fertilizers” are separately identified using a
Multivariate Vector Error Correction methodology. This report deals with the estimation of price
elasticity of demand in “Fertilizers market” in South Africa during the period 1995-2004. The data
set to be used in the model consists of quarterly observations of the following time series used in
natural log transform:
• Consumption of fertilizers in South Africa (tons) denoted FERT, from the Fertilizer
Association of South Africa web-site. The original data is annual, quarterly data is
generated by quadratic-match sum interpolation;
• Real price of fertilizers (R), denoted RPRICE, also from the Fertilizer Association of South
Africa;
• Real Gross domestic product of the agriculture, forestry and fishing sector (R), denoted
GDP, from the Reserve Bank of South Africa quarterly bulletin. This variable serves as a
scale variable;
• Production price index for fertilizers , denoted PPI, from StatsSA ; and
• Rainfall in the major crop producing areas denoted RAIN.

FRIDGE Chemical Sector Upstream Pricing Practices – Final Report
Ozone Business Consulting (Pty) Ltd Page 233
5.6.2. Estimation Results
All of the variables used to model the market for fertilizers are integrated of order one. Table 5.1
indicates that ADF test statistics without drift and trend reject the null hypothesis of unit root at 5%
level when the variables are considered in first difference. This is to say that the variables are non-
stationary in levels, but their first-differences are stationary.
Table 5.1: ADF test statistics but without drift and trend. An asterisk (*) denotes rejection of the null of unit
root at the 5% level.
Variable Level Critical value First difference Critical value
L_FERT 0.965 -1.949 -2.049* -1.949
L_RPRICE 0.914 -1.947 -8.471* -1.947
L_GDP 3.037 -1.949 -3.262* -1.949
L_PPI 2.659 -1.950 -4.926* -1.950
L_RAIN -0.276 -1.948 -14.291* -1.948
After checking the order of integration of all the variables in the model, a Trace Test statistic is
used in the next step to test for number of co integrating vectors. The results of the test in Table
5.2 indicate the presence of two co integrating vectors, with two lags in levels.
Table 5.2: Trace Test Statistics. Trend assumption: No deterministic trend. Series: L_FERT, L_RPRICE,
L_GDP, L_PPI, L_RAIN.
Hypothesized No. of CE(s) Eigen value Trace Statistic 0.05 Crit. value Prob.**
None * 0.672513 91.83253 60.06141 0.0000
At most 1 * 0.545083 51.64552 40.17493 0.0024
At most 2 0.400017 23.29046 24.27596 0.0662
At most 3 0.121390 4.899745 12.32090 0.5816
At most 4 0.006667 0.240832 4.129906 0.6822
Notes:
Trace test indicates 2 cointegrating eqn(s) at the 0.05 level

FRIDGE Chemical Sector Upstream Pricing Practices – Final Report
Ozone Business Consulting (Pty) Ltd Page 234
* denotes rejection of the hypothesis at the 0.05 level
**MacKinnon-Haug-Michelis (1999) p-values
The results for the different tests then lead to the following structural specification for the VECM:
Proceeding with restrictions on the short and long run matrix yields the results presented in Table
5.2. Note that restrictions on the short-run matrix depicts the assumption that the price does not
impact on the consumption of fertilizers in the short run due to the fact that the decision on the
quantity of fertilizers to purchase is often taken at the beginning of the season. And the restrictions
on the long-run matrix coefficients reflect the fact that the production costs of fertilizers do not
impact directly on the demand side. The same is applicable in the treatment of rainfalls on the
supply side.
Table 5.3: Vector Error Correction Estimates for Fertilizers markets.
Standard errors in ( ) & t-statistics in [ ]
Cointegrating Eq: Demand Supply
L_FERT 1.000000 1.000000
0.375289 0.024323
(0.18058) (0.16639)
L_RPRICE
[ 2.07822] [ 0.14618]
-1.485515 -1.419594
(0.10451) (0.09452)
L_GDP
[-14.2139] [-15.0190]
0.000000 0.250077
(0.02922)
L_PPI
[ 8.55752]
=Π+−
RAINL
PPIL
GDPL
RPRICEL
FERTL
ktz
_
_
_
_
_
01
01
232221
141211
2515
2414
2313
2212
2111
1 βββ
βββ
αα
αα
αα
αα
αα
FRIDGE Chemical Sector Upstream Pricing Practices – Final Report
Ozone Business Consulting (Pty) Ltd Page 235
-0.036357 0.000000
(0.00341)
L_RAIN
[-10.6665]
The main results presented in Table 5.3 from the estimation of the Vector Error Correction model
are as follows:
• Demand for Fertilizers responds negatively to “price” with an elasticity of –0.38. The
coefficients is statistically significant and of the right sign.
• Demand responds positively to GDP with an elasticity of 1.49. The coefficient is also
statistically significant and with the right sign.
• Demand of fertilizers also responds positively to rainfalls with an elasticity of 0.04. The
coefficient is statistically significant.
• Supply of fertilizers responds negatively to price with elasticity: -0.02. The coefficient is of
the wrong sign. However it is close to zero and statistically non-significant, suggesting that
supply of fertilizers is not affected by changes in prices.
• Supply responds positively to GDP with an elasticity of 1.42. The coefficient is statistically
significant.
• Supply responds negatively to “input cost” with elasticity of -0.25. The coefficient is
statistically significant.
5.7. Impact of pricing on downstream purchasers – EVC
5.7.1. Introduction
Given the relationship that exists between sales volumes and price (as measured in this study by
the demand elasticity curves described in section 5.6), the challenge is to find an equitable
method of comparing the impact on the financial performance of upstream and downstream
businesses of the fertilizer sector of the chemical industry brought about by changes in selling
prices and sales volumes. The measure used must be unbiased and objective, and based on
readily available data.

FRIDGE Chemical Sector Upstream Pricing Practices – Final Report
Ozone Business Consulting (Pty) Ltd Page 236
The measure that meets the above criterion that has been used in this study is Economic Profit,
also known as Economic Value Created (EVC). A basic introduction and description of EVC and
the methodology employed is shown in Appendix 2.
EVC is an economic, not an accounting concept. In order to measure it, one must look not only
within the company, but also into the industry and the economy. Economic value created is a
practical measure of the company's operating performance that correlates with the value of the
company. What makes it so relevant is that it takes into account a cost that conventional
measures exclude, namely, the cost of equity. Economic value created is simply the before
interest and after tax operating profit, R, minus the total annual cost of capital, K. It is expressed
as follows.
EVC = R – K
In this model,
R is the stream of cash available to the providers of capital, and
K is the total cost of the capital used, including the cost of equity and debt
The weighted average cost of capital (K) would normally vary across industries and over time.
EVC is relatively insensitive to variations in K in the industries measured.
This study seeks to determine the relative impact of pricing policies between upstream and
downstream protagonists. Accordingly the view was taken that a single K could be applied as a
consistent-and-equal benchmark for all companies in the study. This approach eliminates the
moving benchmark effect of applying a different K to each company in each year.
Determination of K - Weighted average cost of capital %
Target debt as % of capital 50
Risk free rate of return % 12
Market rate of return % 20
Risk index (beta) 1.5
Cost of equity % 24

FRIDGE Chemical Sector Upstream Pricing Practices – Final Report
Ozone Business Consulting (Pty) Ltd Page 237
Marginal debt rate % 15
Marginal corporate tax rate % 30
Cost of debt % 10.5
K, Weighted average cost of capital % 17.25
5.7.2. Actual EVC results for upstream companies.
The following EVC graph represents the actual values calculated in each year between 1997 and
2005 for upstream fertilizers. The graph indicates that with the exception of 1998 and 1999 the
returns have been significantly and consistently below the weighted average cost of capital as
measured by K.
Figure 5.16: EVC Results – Upstream Fertilizers
Upstream Fertilizer : EVC
-60
-40
-20
0
20
40
60
80
1997 1998 1999 2000 2001 2002 2003 2004 2005
Years 1997 to 2005
EV
C
The following IVC graph represents the intrinsic value calculated for upstream fertilizers. The
graph illustrates the cumulative effect of economic value calculated by the end of each year. The
IVC graph shows large accumulated returns that are lower than the weighted average cost of
capital as measured by K by the year 2005.

FRIDGE Chemical Sector Upstream Pricing Practices – Final Report
Ozone Business Consulting (Pty) Ltd Page 238
Figure 5.17: IVC Results – Upstream Fertilizers
Upstream Fertilizer : IVC
-700000
-600000
-500000
-400000
-300000
-200000
-100000
0
100000
200000
1997 1998 1999 2000 2001 2002 2003 2004 2005
Years 1997 to 2005
IVC
Upstream IVC
The following graph illustrates the relative sensitivity of EVC and Profit before Interest and Tax
(PBIT) to Selling Price, Sales Volume, Cost of Sales and K in upstream fertilizers
The bar groups indicate by what percentage PBIT and EVC would change for a one percent
improvement in Prices or Volumes or Cost of Sales or K.

FRIDGE Chemical Sector Upstream Pricing Practices – Final Report
Ozone Business Consulting (Pty) Ltd Page 239
Figure 5.18: Sensitivity of EVC and Profit before Interest and Tax (PBIT) to Selling Price, Sales Volume, Cost
of Sales and K – Upstream Fertilizers
Upstream Fertilizer Relative Sensitivity
-1
0
1
2
3
4
5
6
7
1
Price
1
Volume
-1
CoS
-1
K
% Change in Input
% C
han
ge i
n P
erf
orm
an
ce
PBIT EVC
Note that the inverse of what this graph shows is also true. That is, PBIT and EVC would change by the same percentage points but in the opposite direction for a one percent decline in Prices or Volumes or one percent increase in Cost of Sales or K.
Note the following:
• EVC is insensitive to K
• EVC (and PBIT) are insensitive to Sales Volume
• EVC (and PBIT) are very sensitive to Cost of Sales
• EVC (and PBIT) are very sensitive to Selling Price
5.7.3. Downstream Fertilizers
The following EVC graph represents the actual values calculated in each year between 1997 and
2005 for downstream fertilizers. The graph indicates that the returns were frequently (six out of
nine years) more than the weighted average cost of capital as measured by K.

FRIDGE Chemical Sector Upstream Pricing Practices – Final Report
Ozone Business Consulting (Pty) Ltd Page 240
Figure 5.19: EVC Results – Downstream Fertilizers
Downstream Fertlizer : EVC
-30000
-20000
-10000
0
10000
20000
30000
40000
50000
60000
1 2 3 4 5 6 7 8 9
Years 1997 to 2005
EV
C
EVC
The following IVC graph represents the intrinsic value calculated for downstream fertilizers. The
graph illustrates the cumulative effect of economic value calculated by the end of each year
between 1997 and 2005. The graph shows that in spite of returns being lower than the weighted
average cost of capital as measured by K in 2000 and 2001 there were large accumulated returns
which were higher than the weighted average cost of capital by 2005.

FRIDGE Chemical Sector Upstream Pricing Practices – Final Report
Ozone Business Consulting (Pty) Ltd Page 241
Figure 5.20: IVC Results – Downstream Fertilizers
Downstream Fertilizer : IVC
-40000
-20000
0
20000
40000
60000
80000
1 2 3 4 5 6 7 8 9
Years 1997 to 2005
IVC
IVC
The following graph illustrates the relative sensitivity of EVC and Profit before Interest and Tax
(PBIT) to Selling Price, Sales Volume, Cost of Sales and K in downstream fertilizers.
The bar groups indicate by what percentage PBIT and EVC would change for a one percent
improvement in Prices or Volumes or Cost of Sales or K.

FRIDGE Chemical Sector Upstream Pricing Practices – Final Report
Ozone Business Consulting (Pty) Ltd Page 242
Figure 5.21: Sensitivity of EVC and Profit before Interest and Tax (PBIT) to Selling Price, Sales Volume, Cost
of Sales and K – Downstream Fertilizers
Downstream Fertilizer Relative Sensitivity
0
0.05
0.1
0.15
0.2
0.25
0.3
0.35
1
Price
1
Volume
-1
CoS
-1
K
% Change in Input
% C
han
ge i
n P
erf
orm
an
ce
PBIT EVC
Note that the inverse of what this graph shows is also true. That is, PBIT and EVC would change by the same percentage points but in the opposite direction for a one percent decline in Prices or Volumes or one percent increase in Cost of Sales or K.
Note the following;
• EVC is insensitive to K
• EVC (and PBIT) are relatively insensitive to Sales Volume
• EVC (and PBIT) are very sensitive to Cost of Sales
• EVC (and PBIT) are very sensitive to Selling Price
5.7.4. IVC Compared in Upstream and Downstream Polymers
The following graph illustrates the intrinsic value calculated for upstream and downstream
fertilizers.

FRIDGE Chemical Sector Upstream Pricing Practices – Final Report
Ozone Business Consulting (Pty) Ltd Page 243
Figure 5.22: IVC Comparison – Upstream & Downstream Fertilizers
Upstream and Downstream Fertilizer : IVC
-800000
-600000
-400000
-200000
0
200000
400000
600000
800000
1 2 3 4 5 6 7 8 9
Years 1997 to 2005
IVC
Upstream Fertilizer IVC Dow nstream Fertilizer IVC
The graph clearly illustrates that by 2005 the downstream fertilizers sector had returns that were
higher than the weighted average cost of capital and the upstream fertilizers sector’s returns were
lower than the cost of capital. It also seems to illustrate an inversely proportional relationship
between low returns upstream and high returns downstream relative to the cost of capital, K.
5.8. Conclusions – Fertilizers feedstocks
Production capacity for ammonia in SA is around 660 000 t/a, and for phosphate rock 3.3 million
t/a. The SA market size in 2004 for ammonia used in local applications such as ammonium nitrate
was estimated at 710 000 tons. This indicates a shortage in ammonia capacity, which is made up
from imports. The SA non-captive market for phosphate rock was 1.7 million t/a in 2004. The
balance of the phosphate rock production is either captively converted to phosphate rock or
exported.

FRIDGE Chemical Sector Upstream Pricing Practices – Final Report
Ozone Business Consulting (Pty) Ltd Page 244
SA inland or domestic ammonia prices are directly linked by means of the formula-applied pricing
mechanism to international prices. There is no import duty on ammonia. The phosphate rock price
is indexed upon the CFR [freight delivered price] price of phosphate rock in India. Effectively local
phosphate prices in 2005 were at a discount of 30.6% compared to India.
Actual delivered ammonia prices in SA during the period 2000 – 2004 were around 5.1% higher
than the US Gulf Coast prices, and 17.6% higher than Indian CFR prices. It should be noted that
both the US and Indian prices have to be adjusted with the respective inland delivery costs to
obtain a true comparison with the South African delivered prices. In the case of phosphate rock
[taking into account variances in BPL levels], SA delivered prices are historically well below Indian
CFR prices, which exclude Indian inland delivery costs. Ex-factory SA prices are either below or
similar to Moroccan export prices.
Taking the reality test into consideration, SA is consuming around 0.65% of global ammonia,
which is in line with SA’s share of global GDP. In the case of phosphate rock SA’s share of
consumption is around 1.2%, which is relatively higher than the contribution to global GDP.
Demand elasticity analysis showed that demand for fertilizers responds negatively to price
changes with a small elasticity of –0.38. Demand responds positively to GDP with an elasticity of
1.49. Demand of fertilizers also responds positively to rainfalls with a small elasticity of 0.04.
The intrinsic value analysis illustrated that the downstream fertilizers sector had returns that were
higher than the cost of capital by 2005 while in the upstream fertilizers sector the returns were
lower at the same time. This seems to illustrate an inversely proportional relationship between
upstream and downstream financial performance.

FRIDGE Chemical Sector Upstream Pricing Practices – Final Report
Ozone Business Consulting (Pty) Ltd Page 245
6. TITANIUM DIOXIDE
6.1. Market definition of upstream chemical products
a) Introduction
Titanium dioxide is the standard white pigment used principally in paints, paper, inks and plastics.
It is the most important pigment in the world, accounting for about 70% of total volume. The
pigment is made by processing a variety of titanium-containing minerals such as ilmenite, rutile,
leucoxene or titanium slag. The leading supplier of titanium feedstock is Australia (33% of total
global supply), followed by South Africa (17%), Canada (13%) and Norway (10%).
b) Value chain
Titanium dioxide is made by treating titanium-rich ore with either chlorine or sulfuric acid, followed
by further processing. For cost- capital outlay reasons, chloride-process plants continue to be
favoured over sulfate plants in industrialized countries, particularly for new production facilities.
Operators of sulfate-process plants have had to invest in reducing the environmental impact to
extend operating lives through projects like effluent treatment of waste acid streams through the
manufacture of co-products like Gypsum which is used in the construction industry. In addition,
rutile pigment from the chloride process has been growing.

FRIDGE Chemical Sector Upstream Pricing Practices – Final Report
Ozone Business Consulting (Pty) Ltd Page 246
The value chain for titanium dioxide pigments is summarised in the diagram below:
Figure 6.1: Titanium dioxide Value Chain
c) Applications and Global Market Size
In 2004, global titanium dioxide pigment production grew to 4 million metric tons with an estimated
value of $8 billion. (Source: IBMA)
The major consuming industries for TiO2 pigments are mature sectors in the developed world—
surface coatings, paper and paperboard, inks and plastics. Therefore, the consumption of TiO2
tends to parallel general economic trends. Paint and coating applications account for the largest
global share (around 75%), while inks and plastics and paper accounting for most of the rest.
Titanium dioxide pigment (Sulfate-process) – produced by Huntsman Tioxide Umbogintwini
Paints & Coatings
Titanium slag and
Mineral production
Plasticmaster batching
Chlorine – manufacturedon-site from salt
and electricity(for Chloride-process)By-product
Caustic soda
Salt
Heavy mineralBeach sands
Plastic Conversion
Sulfuric acid fromMany sources
(Sulfate-process) By-productPig iron
By-productGypsum
Pigmentpreparation
PapermakingOtheruses

FRIDGE Chemical Sector Upstream Pricing Practices – Final Report
Ozone Business Consulting (Pty) Ltd Page 247
d) Impact of different product grades or performance specifications on market
applications
In terms of technology used, chloride and sulphate based pigment can be substituted in around
80% of applications. Around 10% of the market can only use chloride-based pigment [e.g.
automotive paints], while 10% prefers to use sulphate process pigment [e.g. inks]. Sulfate-grade
has a different crystal structure [amorphous; less abrasive and softer], while chloride grade is
more crystalline and harder. There are also further grade specifications in terms of particle size
and distribution, as well as surface coatings applied. Generally, however, the major grade
accounts for around two-thirds of the market.
e) Level of competition in supply for major geographic export markets for upstream
products
There is about sixty plants worldwide (outside of China) making titanium dioxide with an average
capacity of 60 thousand metric tons per year. In recent years, the industry has been restructuring
toward consolidation, but not new capacity. The top six producers now account for about 80% of
total worldwide capacity.
6.2. SA Market structure and shares of upstream chemical producers
6.2.1. Domestic industry structure
a) Feedstock for Titanium pigment production
Titanium feedstock is typically obtained from natural deposits of heavy mineral sands, which
contain titanium ores together with other minerals such as Iron and Zircon. This titanium bearing
ores, mainly ilmenite or rutile types can be used directly in pigment manufacturing, depending
upon the ore concentration and purity. Around one-third of global titanium ore is supplied as a slag
produced from lower grade ores. This slag is then used for pigment manufacturing. SA is a major
global source of titanium feedstock, accounting for around 17% of the total global supply, and 50%
of particularly titanium slag. The operations include Richards Bay Minerals and Ticor in Richards
Bay and Namaqua Sands in Saldanha Bay.
FRIDGE Chemical Sector Upstream Pricing Practices – Final Report
Ozone Business Consulting (Pty) Ltd Page 248
b) Titanium dioxide pigment Production
Titanium dioxide pigment in SA is only manufactured by one operation, namely Huntsman Tioxide
at Umbogintwini. The plant is based on sulfuric acid technology and is relative old, and small, in
terms of other global operations. Production capacity is in the order of 35 000 tpa, but one-third of
the plant is currently mothballed due to a decline in exports, caused mainly by the strong Rand.

FRIDGE Chemical Sector Upstream Pricing Practices – Final Report
Ozone Business Consulting (Pty) Ltd Page 249
Figure 6.2: Huntsman Tioxide Flow Diagram
DIGESTER
WEIGHHOPPER
BALL MILL
SLAG SILOSLAGCLASSIFICATION
FLUO
MOGENSEN
SCREEN
SETTLER SLUDGE DISPOSAL
SLUDGE FILTER
FILTER
HYDROLYSIS
LEACHING
PRE-LEACH
WASHING
H SOwater
steamair
floculatingagent
reducingagent
H SO
water
additions
water
dispersionagent
water
steam
pigment slurry
milled pigment slurry
FILTER
WASHING
DRIER
MICRONISER
FLUO
PACKER
PIGMENT
PIGMENT
BRADLEYMILL
SILOS
DRY MILLING
WETMILLINGSCREENS
COOLER
CALCINER
CALCINERFEED FILTER
HOESCH FILTER
350 C 900 C
POST-LEACHWASHING
washed pulp
Tio pulp
spentH SOplus Feto waste
sludge +
entrained liquor
crudeliquor
clarified liquor
recovery liquor
2 4
2 4
42
2 COOLER
o
o
NaOH
HCL
TITANATEREACTOR
TITANATEWASHING
NUCLEIPREPARATION
SLAG OFF-LOADING
ADDITIONING
gas
UC5-000-3306
TIOXIDE SULPHATE PROCESS
additions

FRIDGE Chemical Sector Upstream Pricing Practices – Final Report
Ozone Business Consulting (Pty) Ltd Page 250
Huntsman Tioxide manufactures only one general purpose grade that meets the needs of the
local industry, particularly for coatings applications.
c) Titanium Pigment Market
The SA market size in 2004 for Titanium dioxide pigment used mainly in paints, inks, plastics and
paper is estimated at 24 000 tons. The breakdown of the market is demonstrated in the following
diagram.
Figure 6.3: South African Titanium dioxide pigment Market Breakdown
Paints & Coatings
79%
Other formulation
7%
Conversion
Plastic
10%
Other
1%
Inks
3%
6.2.2. The effect of import tariffs, anti-dumping duties and any other regulatory factors
affecting pricing
There is an import duty of 10% applicable to titanium dioxide pigments
6.2.3. The global nature of the industry
Titanium dioxide is produced in a large range of grades [e.g. coatings, inks, special coated
grades, etc] but in general is regarded as a commodity product [especially for the major coatings

FRIDGE Chemical Sector Upstream Pricing Practices – Final Report
Ozone Business Consulting (Pty) Ltd Page 251
grade] that is well-traded in large volumes (2.8 million tons/annum – 115 times the SA market)
around the globe, demonstrating its global nature.
6.3. Costs and pricing of upstream chemicals products
6.3.1. The cost structure of the industry and global comparison
The relative cost structures for the SA based operations, compared with standard global titanium
pigment operations are shown in the figure below. It should be noted that the SA operation is
relatively old and small in capacity, as well as based upon older sulphate-based technology,
compared to newer plants that are based upon chloride technology.
The international titanium pigment information is based on IBMA data – US low-cost operation.
Figure 6.4: Relative Titanium Dioxide Pigment Cost Structures – SA and International (USA)
0
10
20
30
40
50
60
70
80
90
100
South Africa International
Slag Feedstock Other Feedstock Other Costs
Based upon these cost structures, feedstock in SA’s case is a lower portion of total costs, while
other costs, which include variable and fixed manufacturing costs, but no depreciation, are higher
in SA’s case. This indicates that SA’s overall cost per ton of pigment is significantly higher than
international low-cost producers.

FRIDGE Chemical Sector Upstream Pricing Practices – Final Report
Ozone Business Consulting (Pty) Ltd Page 252
6.3.2. SA Production Advantages & Disadvantages
Production advantages include:
• Existing plant the only manufacturer on the continent
• Only local producer in SA
• World class Product grade
• Existing plant art of multinational - access to world class, best practice technologies,
methodology's and expertise
Disadvantages for the local manufacturing operation include:
• Capacity, small plant in world scale terms, which impact on competitive manufacturing unit
cost
• Old plant, commissioned 1962 - a temperamental mixture of continuous and batch
processing impact on fixed manufacturing unit cost
• Unique technology, chemical processing experience from other industries not easily applied
in the TiO2 plant and at least 2 to 3 years of in house experience is required to begin to gain
an understanding of the complex interactions on site.
6.3.3. Upstream pricing practices with respect to downstream domestic purchasers
The local titanium dioxide pigment producer sells polymer products to customers in markets which
include the Republic of South Africa and other African countries, as well as other regions. Their
policy is to sell at the market price prevailing in each of these regions at any time, and this also
applies to sales in South Africa. Titanium dioxide is a commodity item and hence pricing is driven
by world demand and supply.
The difference between market pricing and import parity pricing is that in the case of the former
prices change continuously based on the cheapest available source at a particular point in time. In
the case of import parity pricing, the price is calculated on the basis of a published price in a
specific region or country and the ultimate price is formula-based. Furthermore, in the case of
market pricing, customers monitor prices from all major trading regions and the lowest price

FRIDGE Chemical Sector Upstream Pricing Practices – Final Report
Ozone Business Consulting (Pty) Ltd Page 253
available at any point in time is then used by them as a basis for negotiations with their polymer
supplier.
There is a rebate mechanism in place for large customers that are based on volumes. An
estimated 55% of all sales of locally produced product are to large customers. Customers that
order less than a full truck load of product (32 tons) are supplied via regional distributors.
6.4. Major downstream industries that purchase upstream products
6.4.1. End-use structure
The local titanium dioxide pigment market of 24 000 tons/annum in 2004 is supplied mainly by
Huntsman Tioxide, with imports accounting for around 28% of the market. The end-use structure
for titanium dioxide pigment is segmented into the grade of pigment used, as well as the end-
product. Coatings/paints account for 79% of consumption, followed by plastics with 10% and inks
with 5%. The coatings sector consists of around 200 manufacturers, of which the top 15 accounts
for around 75% of the market. The plastics sector consists of a relatively small number of
masterbatch producers, which in turn supply the large converting sector.
The major titanium dioxide pigment is a grade for general coatings/paints applications, which
accounts for around 70% of the market. Around 55% of the market is represented by large
converters that buy in full truck loads.
6.4.2. Impact of feedstock cost on total cost structure
No downstream respondent feedback received.
6.4.3. Organisation of downstream players
The major downstream sector, coatings/paints is well organised via the South African Paint
Manufacturers Association (SAPMA), while the second most important sector, plastics is
organised through the Plastics Federation.

FRIDGE Chemical Sector Upstream Pricing Practices – Final Report
Ozone Business Consulting (Pty) Ltd Page 254
6.4.4. Downstream sector ability to influence input prices received
No downstream respondent feedback received.
6.4.5. Duty Structures and anti-dumping measures
Downstream products from titanium dioxide pigments, such as water-based paints have a duty of
10%, similar to the upstream pigments. In the case of plastic products, where tariff protection is
applicable the rate is in the order of 15 – 20%, which is higher than the 10% applicable to
pigments.
6.5. International competitiveness of South African chemicals pricing
6.5.1. Introduction
It is important in the analysis of pricing that a common understanding of pricing principles is
agreed upon, especially in the context of a comparative analysis. The main issue that is involved
is the concept of an inland price for products, which is the price paid by local customers in a
particular country.
The competitiveness of South African chemicals pricing is dealt with under the following headings:
• Historical SA feedstock market volumes and pricing levels
• Comparison of SA inland prices for feedstock with international prices
• Historical sales levels for key downstream products
• Basis for SA pricing calculations
• Key differentiation factors for purchasing feedstock
• Operations: (Upstream/ Downstream: Basis for operation [e.g. 24/7]; Average age and
original cost of equipment; Capacity utilisation; Workforce)
• Assessment of global competitiveness of downstream producers
• Ability for downstream to expand product range based on lower feedstock prices
• Impact of current pricing practices (Skills; Wages; Technology; Long-term sustainability;
Import replacement)
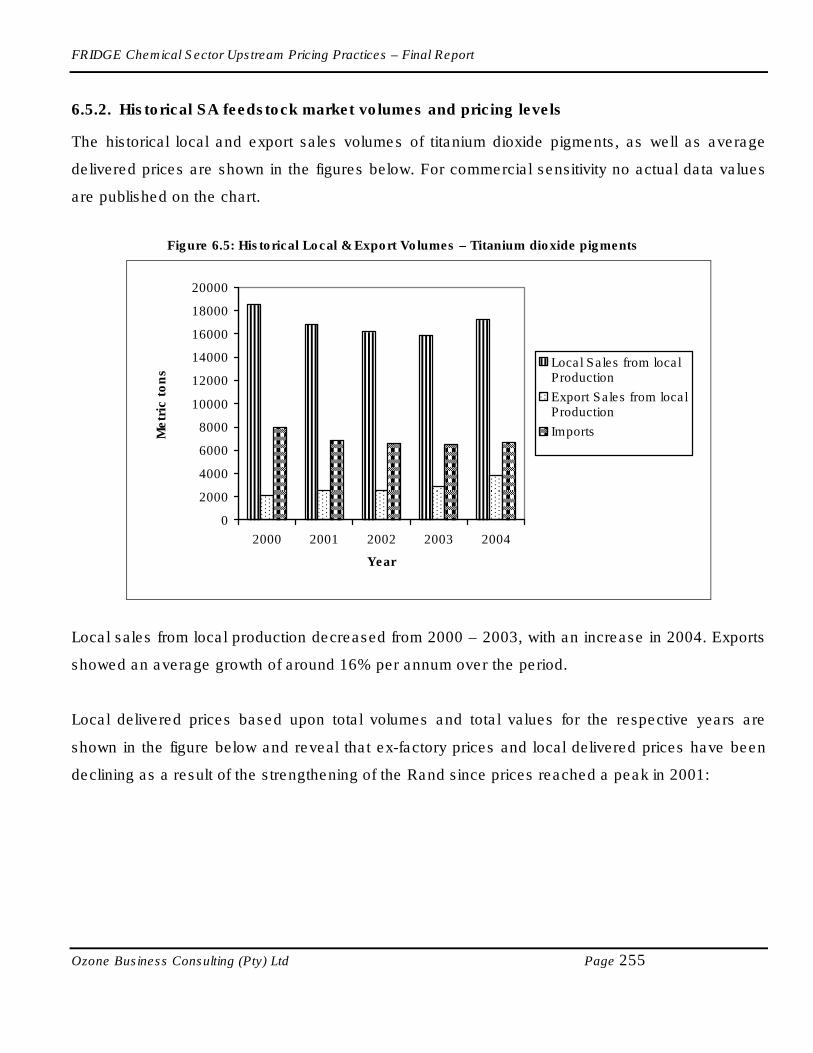
FRIDGE Chemical Sector Upstream Pricing Practices – Final Report
Ozone Business Consulting (Pty) Ltd Page 255
6.5.2. Historical SA feedstock market volumes and pricing levels
The historical local and export sales volumes of titanium dioxide pigments, as well as average
delivered prices are shown in the figures below. For commercial sensitivity no actual data values
are published on the chart.
Figure 6.5: Historical Local & Export Volumes – Titanium dioxide pigments
0
2000
4000
6000
8000
10000
12000
14000
16000
18000
20000
2000 2001 2002 2003 2004
Year
Metr
ic t
on
s
Local Sales from localProduction
Export Sales from localProduction
Imports
Local sales from local production decreased from 2000 – 2003, with an increase in 2004. Exports
showed an average growth of around 16% per annum over the period.
Local delivered prices based upon total volumes and total values for the respective years are
shown in the figure below and reveal that ex-factory prices and local delivered prices have been
declining as a result of the strengthening of the Rand since prices reached a peak in 2001:

FRIDGE Chemical Sector Upstream Pricing Practices – Final Report
Ozone Business Consulting (Pty) Ltd Page 256
Figure 6.6: Historical Local Delivered Prices (Excluding VAT) – Titanium dioxide pigments
0
5000
10000
15000
20000
25000
30000
35000
2000 2001 2002 2003 2004
Year
Pri
ce -
R/t
on Local Ex-factory Prices -
Upstream
Local Delivered Prices -Upstream
Local Delivered Prices -Downstream
Note: Downstream data was based on a small sample size. The difference between upstream and downstream prices can be attributed to not all downstream companies having participated in the study and that to the fact that downstream companies also buy polymer from other companies, such as traders and other importers, who were not part of the upstream sample participating in the study.
6.5.3. Comparison of SA inland prices for feedstock with international prices
The background to international pricing as well as sources for data is discussed in Chapter 1 and
Appendix 3 based on polymers. The trend and the general relationships are more important to
gain insight into the fundamentals than a comparison of prices in a particular month.

FRIDGE Chemical Sector Upstream Pricing Practices – Final Report
Ozone Business Consulting (Pty) Ltd Page 257
Figure 6.7: SA and International Titanium dioxide pigments Domestic Prices
1,000
1,250
1,500
1,750
2,000
2,250
2,500
2,750
3,000
3,250
07-J
an-0
0
31-M
ar-0
0
23-J
un-0
0
15-S
ep-0
0
08-D
ec-0
0
16-M
ar-0
1
08-J
un-0
1
31-A
ug-0
1
23-N
ov-0
1
22-F
eb-0
2
17-M
ay-0
2
09-A
ug-0
2
01-N
ov-0
2
24-J
an-0
3
18-A
pr-0
3
11-J
ul-0
3
03-O
ct-0
3
26-D
ec-0
3
19-M
ar-0
4
11-J
un-0
4
03-S
ep-0
4
26-N
ov-0
4
18-F
eb-0
5
13-M
ay-0
5
Year
Pri
ce -
US
$/t
on
APEC ($) N America ($) NW Europe ($), 3-wca SA
The average prices over the period shown above are as follows:
• APEC (Asia Pacific): $2,002/ton
• N. America: $2,125/ton
• North West Europe: $2,276/ton
• SA (South Africa): $2,134/ton
Prices paid by South African downstream users are generally in line with prices paid in the regions
included in the comparison.
FRIDGE Chemical Sector Upstream Pricing Practices – Final Report
Ozone Business Consulting (Pty) Ltd Page 258
6.5.4. Historical sales levels for key downstream products
Titanium dioxide pigment is used to manufacture a large range of end-products, including all kinds
of coatings, plastic products, inks and many other products.
No information was received from downstream respondents pertaining to the historical growth of
product categories.
6.5.5. Basis for SA Downstream Products pricing calculations
No information was supplied by downstream respondents.
6.5.6. Key differentiation factors for purchasing feedstock
No information was supplied by downstream respondents.
6.5.7. Downstream Operations
No information was supplied by downstream respondents.
6.5.8. Assessment of global competitiveness of downstream producers
No information was supplied by downstream respondents.
6.5.9. Ability for downstream to expand product range based on lower feedstock prices
No information was supplied by downstream respondents.
6.5.10. Impact of current Titanium dioxide Pigments pricing practices
Skills
The upstream respondent commented that the strong Rand results in a huge impact on local
revenue in SA as selling prices are dollar based with a SA Rand based manufacturing base. The
result has been difficulty in retaining skills and developing skills which have a cost element to the
business.
Wages
The upstream respondent commented that the decrease in revenue constrains their ability to offer
market related salaries with a consequence that they lose valuable skills.

FRIDGE Chemical Sector Upstream Pricing Practices – Final Report
Ozone Business Consulting (Pty) Ltd Page 259
Technology
The upstream respondent commented that with their poor profitability capital is a major constraint
for technology improvements and further investments.
Long-term sustainability
The upstream respondent feels that their long-term sustainability is dependent on their ability to be
profitable through the commodity price cycles as well as currency fluctuations.
Import replacement
No information was supplied by downstream respondents.
6.6. Impact of pricing on downstream purchasers - Demand Elasticity
6.6.1. Introduction
From a practical perspective, most titanium dioxide pigments are used in the paints industry. In
this application titanium dioxide pigments accounts for around 20 – 25% of raw material costs, or
around 10 – 13% of selling prices. At retail level titanium dioxide pigments accounts for only
around 5% of the price. It is therefore unlikely that a decrease in titanium dioxide pigment prices
will significantly increase demand for paints.
6.7. Impact of pricing on downstream purchasers – EVC
6.7.1. Introduction
Given the relationship that exists between sales volumes and price, the challenge is to find an
equitable method of comparing the impact on the financial performance of upstream and
downstream businesses of the titanium pigments sector of the chemical industry brought about by
changes in selling prices and sales volumes. The measure used must be unbiased and objective,
and based on readily available data.

FRIDGE Chemical Sector Upstream Pricing Practices – Final Report
Ozone Business Consulting (Pty) Ltd Page 260
The measure that meets the above criterion that has been used in this study is Economic Profit,
also known as Economic Value Created (EVC). A basic introduction and description of EVC and
the methodology employed is shown in Appendix 2.
6.7.2. Assumptions
For the purposes of this study the following principles have been applied:
The weighted average cost of capital (K) would normally vary across industries and over time.
As will be demonstrated below in the Upstream Sensitivity graph, EVC is relatively insensitive to
variations in K in the industries measured.
This study seeks to determine the relative impact of pricing policies between upstream and
downstream protagonists. Accordingly the view was taken that a single K could be applied as a
consistent-and-equal benchmark for all companies in the study. This approach eliminates the
moving benchmark effect of applying a different K to each company in each year.
Determination of K - Weighted average cost of capital %
Target debt as % of capital 50
Risk free rate of return % 12
Market rate of return % 20
Risk index (beta) 1.5
Cost of equity % 24
Marginal debt rate % 15
Marginal corporate tax rate % 30
Cost of debt % 10.5
K, Weighted average cost of capital % 17.25

FRIDGE Chemical Sector Upstream Pricing Practices – Final Report
Ozone Business Consulting (Pty) Ltd Page 261
6.7.3. Actual EVC results for upstream companies.
The following EVC graph represents the actual values calculated in each year between 1997 and
2005 for upstream pigments. The graph indicates that for the first 6 years with the exception of
1997 recorded returns that were higher than the weighted average cost of capital, K. However,
from 2003 to 2005 the returns have been lower than the weighted average cost of capital.
Figure 6.8: EVC Results – Upstream Pigments
EVC : Upstream Pigments
-60000000
-50000000
-40000000
-30000000
-20000000
-10000000
0
10000000
20000000
30000000
1 2 3 4 5 6 7 8 9
Years 1997 to 2005
EV
C
However the IVC graph that follows will show that the lower returns in 2003 and 2004 were
significantly large as to outweigh the years of gains accumulated up to 2002, and IVC became
negative in 2005.

FRIDGE Chemical Sector Upstream Pricing Practices – Final Report
Ozone Business Consulting (Pty) Ltd Page 262
Figure 6.9: IVC Results – Upstream Pigments
IVC : Upstream Pigments
-30000000
-20000000
-10000000
0
10000000
20000000
30000000
40000000
50000000
60000000
70000000
1 2 3 4 5 6 7 8 9
Years 1997 to 2005
IVC
The following graph illustrates the relative sensitivity of EVC and Profit before Interest and Tax
(PBIT) to Selling Price, Sales Volume, Cost of Sales and K in upstream pigments.
The bar groups indicate by what percentage PBIT and EVC would change for a one percent
improvement in Prices or Volumes or Cost of Sales or K.

FRIDGE Chemical Sector Upstream Pricing Practices – Final Report
Ozone Business Consulting (Pty) Ltd Page 263
Figure 6.10: Sensitivity of EVC and Profit before Interest and Tax (PBIT) to Selling Price, Sales Volume, Cost
of Sales and K – Upstream Pigments
Upstream Pigment Relative Sensitivity
0
0.005
0.01
0.015
0.02
0.025
0.03
0.035
1
Price
1
Volume
-1
CoS
-1
K
% change in Input
% C
han
ge in
Perf
orm
an
ce
PBIT EVC
Note that the inverse of what this graph shows is also true. That is, PBIT and EVC would change by the same percentage points but in the opposite direction for a one percent decline in Prices or Volumes or one percent increase in Cost of Sales or K.
Note the following:
• EVC is insensitive to K
• EVC (and PBIT) are relatively insensitive to Sales Volume
• EVC (and PBIT) are relatively sensitive to Selling Price
• EVC (and PBIT) are relatively sensitive to Cost of Sales
6.7.4. Downstream Pigments
No data was supplied for analysis.

FRIDGE Chemical Sector Upstream Pricing Practices – Final Report
Ozone Business Consulting (Pty) Ltd Page 264
6.8. Conclusions – Titanium dioxide
Production capacity for TiO2 pigments in SA is around 35 000 t/a. The SA market size in 2004 for
TiO2 pigments used in local applications such as paints was estimated at 24 000 tons. This
indicates an excess in capacity. However, this goes for the general grade that is used mainly in
paints and coatings. There are also imports of other pigment grades that account for about 28% of
the market.
The South African operation is relatively old and small in capacity, as well as based upon older
sulphate-based technology, compared to newer plants elsewhere in the world that are based upon
chloride technology. This makes South Africa’s overall cost per ton of pigment significantly higher
than international low-cost producers.
TiO2 pigments are a commodity item and hence pricing is driven by world demand and supply.
The outcome is that the most competitive supplier sets the price and is maybe better referred to
as market pricing, as opposed to formula-driven IPP. Therefore TiO2 pigments prices prevailing in
South Africa are based on that of the most competitive supplier at any point in time. Local prices
are referenced on the prices of imports.
There is a rebate mechanism in place for large customers that are based on volumes. An
estimated 55% of all sales of locally produced product are to large customers.
A comparison of South Africa’s inland prices with international prices showed that prices paid by
South African downstream users are generally in line with prices paid in the regions (Asia Pacific,
North West Europe, and North America) included in the comparison.
The reality test has shown that South Africa is consuming around 0.6% of global TiO2 pigments,
which is in line with South Africa’s share of global GDP. The sector can therefore be regarded as
relatively developed.

FRIDGE Chemical Sector Upstream Pricing Practices – Final Report
Ozone Business Consulting (Pty) Ltd Page 265
From a practical perspective, most titanium dioxide pigments are used in the paints industry. In
this application titanium dioxide pigments accounts for around 20 – 25% of raw material costs, or
around 10 – 13% of selling prices. At retail level titanium dioxide pigments accounts for only
around 5% of the price. It is therefore unlikely that a change in titanium dioxide pigment prices will
significantly change demand for paints.
For titanium dioxide pigments an EVC analysis was conducted for 1997 to 2005 for the single
upstream company. The analysis indicates that for the first 6 years starting in 1997, with the
exception of 1997 recorded returns were higher than the weighted average cost of capital, K.
However, from 2003 to 2005 the returns have been lower than the weighted average cost of
capital. The lower returns between 2003 and 2005 outweighed the returns made in the earlier
years to the extent that the IVC became negative by 2005.

FRIDGE Chemical Sector Upstream Pricing Practices – Final Report
Ozone Business Consulting (Pty) Ltd Page 266
7. ACRYLIC ACID AND ESTERS
7.1. Market definition of upstream chemical products
a) Introduction
Acrylic acid and esters are perhaps the most versatile series of monomers for providing
performance characteristics to thousands of polymer formulations. They are flammable, reactive,
volatile liquids based on an alpha, beta-unsaturated carboxyl structure.
Incorporation of varying percentages of acrylate monomers permits the production of thousands of
formulations for latex and solution copolymers, copolymer plastics and cross-linkable polymer
systems. Their performance characteristics—which impart varying degrees of tackiness, durability,
hardness and glass transition temperatures—promote consumption in many end-use applications.
b) Value chain
Acrylic acid and n-butanol are made by Sasol, in a JV with MCC, in Sasolburg from propylene
supplied by pipeline from Sasol Secunda. Acrylic acid is purified to glacial acrylic acid, and then
sold on for the production of polymer emulsion as well as water treatment chemicals. No super
absorbents are made as yet in SA. The balance of the acrylic acid is converted to butyl acrylate
and ethyl acrylate, using the n-butanol as well as ethanol. This is also sold to the emulsion
polymer producers, as well as exported. The value chain for acrylic acid and esters is
summarised in the diagram below:

FRIDGE Chemical Sector Upstream Pricing Practices – Final Report
Ozone Business Consulting (Pty) Ltd Page 267
Figure 7.1: Acrylic acid and Esters Value Chain
c) Applications and Global Market Size
World demand for crude acrylic acid was 3.5 million metric tons in 2003, worth $4.2 billion. Around
55% of the crude acrylic acid is converted to acrylate esters and 30% to super absorbents [mostly
on-site]. Total demand for commodity acrylate esters amounted to 3.5 million metric tons, worth
$4.6 billion. (Source: SRI Consulting)
Major markets for the esters include surface coatings [60% of total], textiles [15% of total],
adhesives [12% of total] and plastics. Polyacrylic acid or copolymers find applications in super
absorbents, detergents, dispersants, flocculants and thickeners. Super absorbent polymers
(SAPs) are used primarily in disposable diapers.
Sasol Sasolburg – Acrylic acid esters production:Butyl Acrylate & Ethyl Acrylate
(MCC JV)
Textiles-Carpetbacking
Sasol Sasolburg –n-Butanol production
(MCC JV)
Coal
Paints &Coatings
Acrylate based Polymer Emulsions or Dispersants –Captive and Commercial
Acrylamideflocculants
Water Treatment
Sasol Sasolburg –Acrylic acid production
(MCC JV)
Sasol Secunda –Propylene ex Fischer Tropsch
InksTextiles-
Non-wovensPaper-making
Adhesives,Sealants, other

FRIDGE Chemical Sector Upstream Pricing Practices – Final Report
Ozone Business Consulting (Pty) Ltd Page 268
d) Impact of different product grades or performance specifications on market
applications
Crude acrylic acid is not commercially sold, but converted on-site to glacial (purified) acrylic acid.
Commercially sold glacial acrylic acid and esters are regarded as pure, commodity chemicals, and
typically have a purity of 99% plus. There is therefore no impact of different product grades or
performance specifications on market applications.
e) Level of competition in supply for major geographic export markets for upstream
products
The largest global producers of acrylic acid are BASF – 23% market share - (with plants in the
United States, Brazil, Belgium, Germany, and Malaysia), followed by Rohm and Haas/StoHaas –
20% market share - (United States and Germany), Dow – 14% market share - (with plants in the
United States, Germany and Mexico), Nippon Shokubai – 11% market share - (United States,
Japan and Indonesia), ATOFINA (France), Mitsubishi Chemical Company (MCC) (Japan and a JV
with SA’s Sasol) and Formosa Plastics (Taiwan).
7.2. SA Market structure and shares of upstream chemical producers
7.2.1. Domestic industry structure
a) Feedstock for Acrylic acid and Acrylate Esters production
Sasol manufactures acrylic acid from propylene monomer, while Acrylate Esters require n-butanol
[also made from propylene] and ethanol in addition to acrylic acid. Propylene supply in SA is
concentrated with only two suppliers, namely Sasol Secunda and Sapref [Shell/BP] in Durban.
Sasol’s capacity is currently around 530 000 t/a and Sapref around 32 000 t/a. However, Sapref’s
supply in 2003 was only 20 000 t/a. There is a possibility of further propylene extraction in Durban.
The Sasol Project Turbo that was approved in late-2003 will add a further 430 000 t/a propylene
capacity. Sasol, using feedstock from their Fischer Tropsch process, captively makes industrial
ethanol in large quantities.

FRIDGE Chemical Sector Upstream Pricing Practices – Final Report
Ozone Business Consulting (Pty) Ltd Page 269
b) Acrylic acid and Acrylate Esters Production
The Sasol Dia Acrylates (SDA) joint venture was established in September 2002 after an intensive
period of negotiation between Sasol and Mitsubishi Chemical Corporation (MCC) of Japan. The
reasons for the creation of the joint venture were fairly simple. MCC contributed world class
technology, operating experience and existing acrylic acid and acrylates markets. Sasol
contributed competitive feedstock, a global sales distribution network and a brown field chemical
site. Together these strengths created a globally competitive acrylic acid and acrylates industry
player.
The SDA joint venture total capital cost was R2 454 million including working capital. The major
portion of the investment was expended in Sasolburg at the Midland site to construct four plants,
namely the crude acrylic acid, butyl acrylate, ethyl acrylate and glacial acrylic acid plants.
The complex was commissioned beginning in February 2004. Initially crude acrylic acid and finally
butyl acrylate and ethyl acrylate was commissioned. Glacial acrylic acid was commissioned in
quarter 3 of 2004.
Figure 7.2: Acrylic Acid & Acrylate Esters – Sasol Dia Acrylates JV Flow Diagram
n-Butanol
Propylene
Air
Crude
Acrylic
Acid Unit
80 000 tpa
Ethanol
Butyl Acrylate
Unit
Ethyl Acrylate
Unit
Glacial Acrylic
Acid Unit
Butyl Acrylate
80 000 tpa
Ethyl Acrylate
35 000 tpa
Glacial
Acrylic Acid
10 000 tpa

FRIDGE Chemical Sector Upstream Pricing Practices – Final Report
Ozone Business Consulting (Pty) Ltd Page 270
c) Acrylic acid and Acrylate Esters Market
The SA market for acrylic acid is relatively small, as no super absorbents are being made as yet.
Acrylic acid, in the form of glacial acrylic acid, is used primarily to manufacture water treatment
chemicals, as well as emulsion polymers. The estimated consumption is 2 200 tons per annum.
Acrylate esters are mainly used to manufacture emulsion polymers in SA. The total consumption
of butyl acrylate is around 22 000 tons/annum, and ethyl acrylate around 1000 tons/annum.
7.2.2. The effect of import tariffs, anti-dumping duties and any other regulatory factors
affecting pricing
There is no tariff protection for any of the products in this category.
7.2.3. The global nature of the industry
Glacial acrylic acid as well as acrylate esters are only supplied in one grade per product and in
general is regarded as a commodity product that is produced by many countries and is well-traded
in large volumes (2.3 million tons/annum – 90 times the SA market) around the globe,
demonstrating its global nature.
7.3. Costs and pricing of upstream chemicals products
7.3.1. The cost structure of the industry and global comparison
The cost structure of SA based operations is not directly comparable to international glacial acrylic
acid as well as acrylate esters operations in that the SA producer has an integrated operation that
are manufacturing n-butanol as well as acrylates.
The relative cost structures for the SA based operations compared with standard global butyl
acrylate operations are shown in the figure below. The international butyl acrylate information is
based on SRI consulting data – US Gulf Coast.

FRIDGE Chemical Sector Upstream Pricing Practices – Final Report
Ozone Business Consulting (Pty) Ltd Page 271
Figure 7.3: Relative Glacial Acrylic Acid & Acrylate Esters Cost Structures – SA and International (US Gulf
Coast)
0
10
20
30
40
50
60
70
80
90
100
South Africa International
Feedstock Other Cost Labour
Based upon these cost structures, feedstock in SA’s case is a lower portion of total costs, while
other costs, which include variable and fixed manufacturing costs, but no depreciation, are higher
in SA’s case. It should be noted in SA’s case the feedstock used is propylene, ethanol and captive
butanol, while in the international case the feedstock is acrylic acid and butanol. The transfer cost
mechanism of the SA feedstock stream has not been analysed in this report.
7.3.2. SA Production Advantages & Disadvantages
SA advantages include:
• Cost competitive propylene feedstock based upon Fischer Tropsch synthetic fuel upstream
operations.
• Globally competitive n-butanol, acrylic acid and esters production technology and facilities
SA disadvantages include:
• Relatively small local and regional market.
• Long distance from attractive export markets.
FRIDGE Chemical Sector Upstream Pricing Practices – Final Report
Ozone Business Consulting (Pty) Ltd Page 272
• Inland location of production facilities.
7.3.3. Upstream pricing practices with respect to downstream domestic purchasers
The pricing philosophy described below was introduced by the local producer as part of a market
entry strategy to enable market growth aligned with business objectives and may be revisited in
future as market conditions change. The following factors are taken into account when setting the
domestic price.
Base Price - Calculation of Global Market Price
The local producer’s domestic price is comparable with prices in USA and Asia and is derived
from the published ICIS LOR data as follows: The average of the lowest values quoted for North
West Europe (Free Delivered) and Asia Pacific on a CIF basis of the preceding week’s published
prices at time of determination. No costs are added to the USD Price in terms of Import Parity
Pricing input factors.
Local market conditions are taken into account to ensure that the local producer remains
competitive in the SA market.
Conversion to South African Rand Price
The average historic exchange rate for the month preceding the calculation period is used to
convert the USD price to Rands.
.
Validity and Notification Price Period
Prices are quoted with a 30 day notification period and are valid for one calendar month.
Regional Pricing
The price is adjusted by a regional transport differential which is based on actual costs incurred to
transport product to the respective geographical regions.
FRIDGE Chemical Sector Upstream Pricing Practices – Final Report
Ozone Business Consulting (Pty) Ltd Page 273
Bulk to Drum Differential
A standard Bulk to Drum Differential fee is applied which is not based on volume off-take.
Credit Terms
Standardised Credit Terms is applicable to all customers and is 30 days from date of statement.
Price Differentiation
No price differentiation based on amongst others, volume off-take has been applied other than
regional transportation differences and this is also applicable to distributors.
Export Incentives
Export incentives are considered in cases where additional products in the form of Acrylates or
beneficiated downstream products are exported out of RSA to support the growth initiatives of
local industry.
Rebates and discounts
No rebate or discount schemes have been implemented as well as standardised payment terms to
all customers irrespective of size.
Upstream supplier’s view on Actual Pricing Mechanism Versus Import Parity Pricing
The local producer responded that they do not apply an Import Parity pricing mechanism to the
industry but rather a market pricing philosophy.
An import parity price is a mechanistic formula driven calculation and is done by specifically
calculating a price based on what it would have cost to import the product based on internationally
published price data and is thus a proxy or estimate of the local delivered price of a competitive
imported product to a downstream customer, this would potentially include all inward transport and
other real costs that would be associated with importing the product into South Africa.
If an IPP methodology was to be used the input factors that would form part of the calculation will
be as outlined below in a typical IPP calculation.
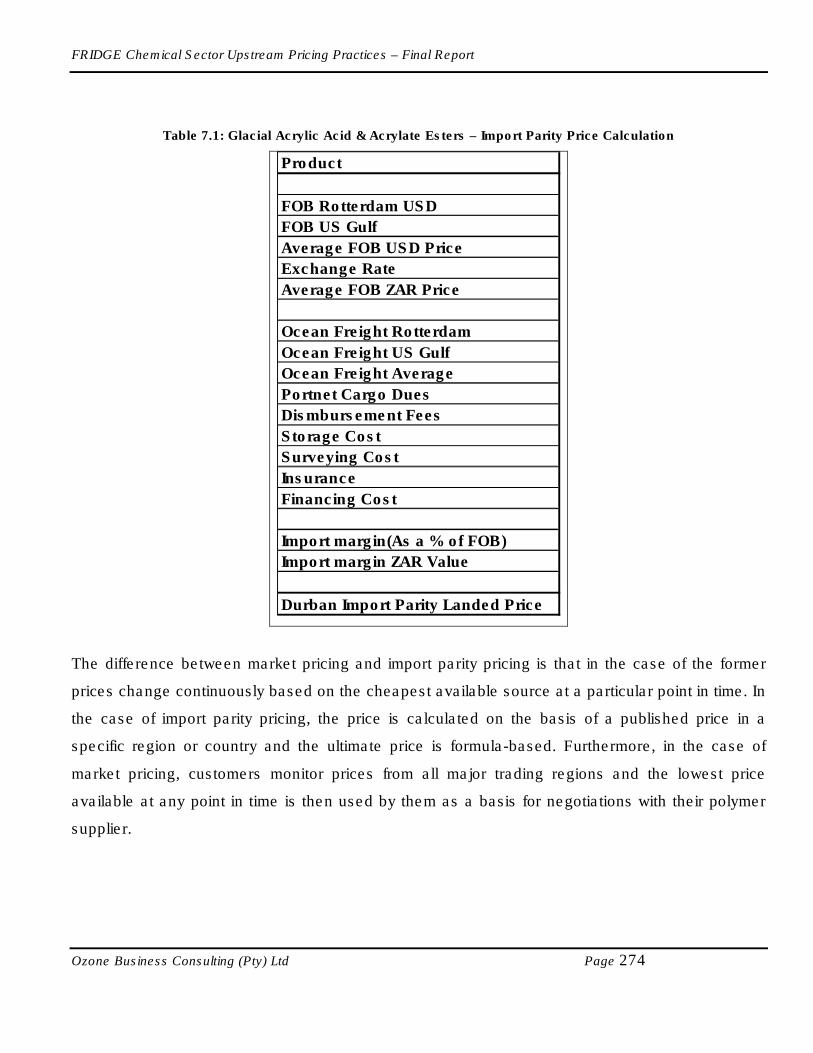
FRIDGE Chemical Sector Upstream Pricing Practices – Final Report
Ozone Business Consulting (Pty) Ltd Page 274
Table 7.1: Glacial Acrylic Acid & Acrylate Esters – Import Parity Price Calculation
Product
FOB Rotterdam USD
FOB US Gulf
Average FOB USD Price
Exchange Rate
Average FOB ZAR Price
Ocean Freight Rotterdam
Ocean Freight US Gulf
Ocean Freight Average
Portnet Cargo Dues
Dismbursement Fees
Storage Cost
Surveying Cost
Insurance
Financing Cost
Import margin(As a % of FOB)
Import margin ZAR Value
Durban Import Parity Landed Price
The difference between market pricing and import parity pricing is that in the case of the former
prices change continuously based on the cheapest available source at a particular point in time. In
the case of import parity pricing, the price is calculated on the basis of a published price in a
specific region or country and the ultimate price is formula-based. Furthermore, in the case of
market pricing, customers monitor prices from all major trading regions and the lowest price
available at any point in time is then used by them as a basis for negotiations with their polymer
supplier.
FRIDGE Chemical Sector Upstream Pricing Practices – Final Report
Ozone Business Consulting (Pty) Ltd Page 275
7.4. Major downstream industries that purchase upstream products
7.4.1. End-use structure
The local glacial acrylic acid market of 2 000 tons/annum in 2004 is supplied mainly by imports,
with Sasol Polymers accounting for around one-third of the market. The main use of glacial acrylic
acid is in water treatment chemical manufacturing, which accounts for around 35% of the market,
followed by dispersion polymers with 33%, and emulsifiers with 23%.
The local butyl acrylate market of 22 000 tons/annum in 2004 is supplied mainly by Sasol
Polymers, with imports accounting for around one-third of the market. The main use of butyl
acrylate is in dispersion polymers manufacturing. These dispersions are used, in turn, in coatings,
textiles, adhesives, paper manufacturing and other uses.
The local ethyl acrylate market of 22 000 tons/annum in 2004 is supplied mainly by Sasol
Polymers, with imports accounting for around one-third of the market. The main use of butyl
acrylate is in dispersion polymers manufacturing. These dispersions are used, in turn, in coatings,
textiles, adhesives and other uses.
In dispersion polymer production there are only a few companies in SA, with the major ones being
BASF, Revertex, Rohm & Haas, Bohme, Clariant and Makeean.
7.4.2. Impact of feedstock cost on total cost structure
No respondent information available.
7.4.3. Organisation of downstream players
No respondent information available.
7.4.4. Downstream sector ability to influence input prices received
No respondent information available.

FRIDGE Chemical Sector Upstream Pricing Practices – Final Report
Ozone Business Consulting (Pty) Ltd Page 276
7.4.5. Duty Structures and anti-dumping measures
Acrylic dispersions, tariff 39.06.90.20, have a tariff of 10%. These include most of the products
made from glacial acrylic acid and acrylate esters. Downstream products from these dispersions,
such as water-based paints also have a duty of 10%.
7.5. International competitiveness of South African chemicals pricing
7.5.1. Introduction
It is important in the analysis of pricing that a common understanding of pricing terminologies is
agreed upon, especially in the context of a comparative analysis. The main issue that is involved
is the concept of an inland price for products, which is the price paid by local customers in a
particular country [which can be based on a delivered, or ex-factory basis], compared to export
prices, which are the export based prices for producers in a particular country. This comparison of
pricing competitiveness depends on whether the country is a net exporter or net importer.
The competitiveness of South African chemicals pricing is dealt with under the following headings:
• Historical SA feedstock market volumes and pricing levels
• Comparison of SA inland prices for feedstock with international prices
• Historical sales levels for key downstream products
• Basis for SA pricing calculations
• Key differentiation factors for purchasing feedstock
• Operations: (Upstream/ Downstream: Basis for operation [e.g. 24/7]; Average age and
original cost of equipment; Capacity utilisation; Workforce)
• Assessment of global competitiveness of downstream producers
• Ability for downstream to expand product range based on lower feedstock prices
• Impact of current pricing practices (Skills; Wages; Technology; Long-term sustainability;
Import replacement)

FRIDGE Chemical Sector Upstream Pricing Practices – Final Report
Ozone Business Consulting (Pty) Ltd Page 277
7.5.2. Historical SA feedstock market volumes and pricing levels
The historical local and export sales volumes of glacial acrylic acid as well as acrylate esters, as
well as average delivered prices are shown in the figures below. For commercial sensitivity no
actual data values are published on the chart.
Figure 7.4: Historical Local & Export Volumes – Glacial acrylic acid
0
500
1000
1500
2000
2500
2000 2001 2002 2003 2004
Year
Me
tric
to
ns
Local Sales from localProduction
Export Sales from localProduction
Imports
Local sales from local production only appeared in 2004, while total consumption is showing
steady growth.

FRIDGE Chemical Sector Upstream Pricing Practices – Final Report
Ozone Business Consulting (Pty) Ltd Page 278
Figure 7.5: Historical Local & Export Volumes – Butyl acrylate
0
5000
10000
15000
20000
25000
30000
35000
2000 2001 2002 2003 2004
Year
Me
tric
to
ns
Local Sales from localProduction
Export Sales from localProduction
Imports
Local sales from local production only appeared in 2003, while total consumption is showing
steady growth.
Figure 7.6: Historical Local & Export Volumes – Ethyl acrylate
0
2000
4000
6000
8000
10000
12000
14000
16000
18000
2000 2001 2002 2003 2004
Year
Me
tric
to
ns
Local Sales from localProduction
Export Sales from localProduction
Imports
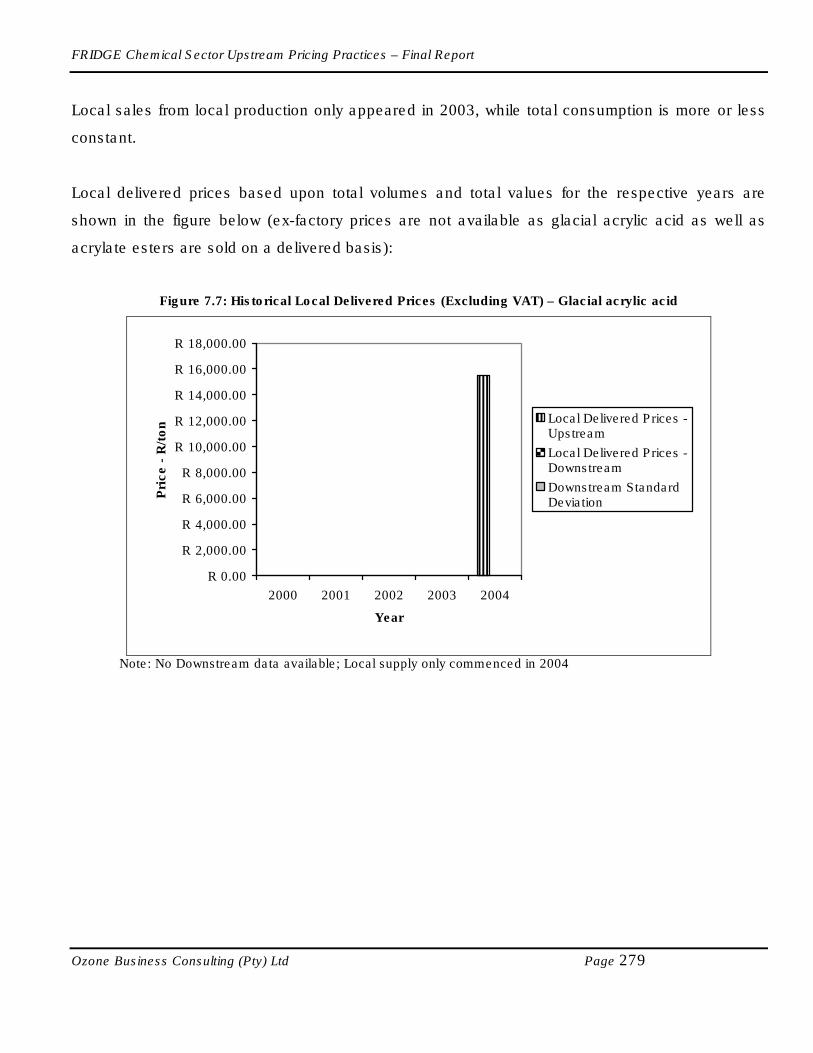
FRIDGE Chemical Sector Upstream Pricing Practices – Final Report
Ozone Business Consulting (Pty) Ltd Page 279
Local sales from local production only appeared in 2003, while total consumption is more or less
constant.
Local delivered prices based upon total volumes and total values for the respective years are
shown in the figure below (ex-factory prices are not available as glacial acrylic acid as well as
acrylate esters are sold on a delivered basis):
Figure 7.7: Historical Local Delivered Prices (Excluding VAT) – Glacial acrylic acid
R 0.00
R 2,000.00
R 4,000.00
R 6,000.00
R 8,000.00
R 10,000.00
R 12,000.00
R 14,000.00
R 16,000.00
R 18,000.00
2000 2001 2002 2003 2004
Year
Pri
ce
- R
/to
n Local Delivered Prices -Upstream
Local Delivered Prices -Downstream
Downstream StandardDeviation
Note: No Downstream data available; Local supply only commenced in 2004

FRIDGE Chemical Sector Upstream Pricing Practices – Final Report
Ozone Business Consulting (Pty) Ltd Page 280
Figure 7.8: Historical Local Delivered Prices (Excluding VAT) – Butyl acrylate
R 8,500.00
R 9,000.00
R 9,500.00
R 10,000.00
R 10,500.00
R 11,000.00
R 11,500.00
2000 2001 2002 2003 2004
Year
Pri
ce
- R
/to
n Local Delivered Prices -Upstream
Local Delivered Prices -Downstream
Downstream StandardDeviation
Note: No Downstream data available; Local supply only commenced in 2003
Figure 7.9: Historical Local Delivered Prices (Excluding VAT) – Ethyl acrylate
R 0.00
R 2,000.00
R 4,000.00
R 6,000.00
R 8,000.00
R 10,000.00
R 12,000.00
2000 2001 2002 2003 2004
Year
Pri
ce
- R
/to
n Local Delivered Prices -Upstream
Local Delivered Prices -Downstream
Downstream StandardDeviation
Note: No Downstream data available; Local supply only commenced in 2003
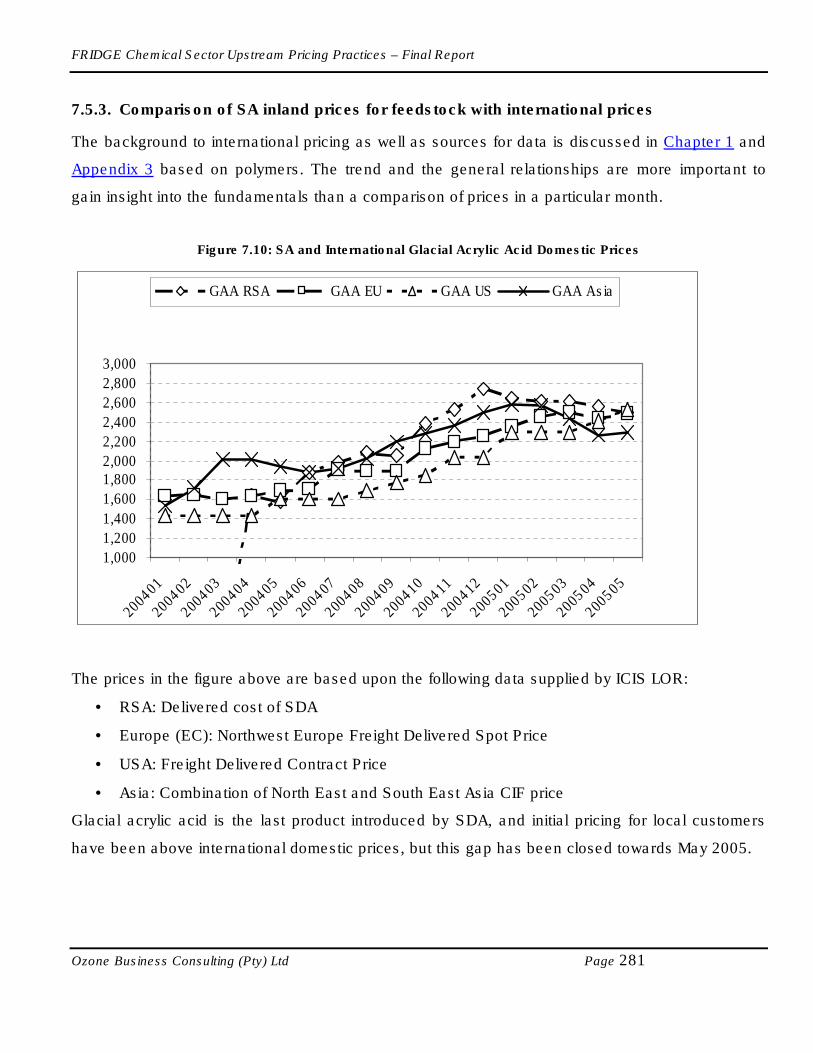
FRIDGE Chemical Sector Upstream Pricing Practices – Final Report
Ozone Business Consulting (Pty) Ltd Page 281
7.5.3. Comparison of SA inland prices for feedstock with international prices
The background to international pricing as well as sources for data is discussed in Chapter 1 and
Appendix 3 based on polymers. The trend and the general relationships are more important to
gain insight into the fundamentals than a comparison of prices in a particular month.
Figure 7.10: SA and International Glacial Acrylic Acid Domestic Prices
1,000
1,200
1,400
1,600
1,8002,000
2,200
2,400
2,600
2,800
3,000
2004
01
2004
02
200403
200404
200405
2004
06
2004
07
200408
200409
2004
10
2004
11
200412
200501
200502
2005
03
2005
04
200505
GAA RSA GAA EU GAA US GAA Asia
The prices in the figure above are based upon the following data supplied by ICIS LOR:
• RSA: Delivered cost of SDA
• Europe (EC): Northwest Europe Freight Delivered Spot Price
• USA: Freight Delivered Contract Price
• Asia: Combination of North East and South East Asia CIF price
Glacial acrylic acid is the last product introduced by SDA, and initial pricing for local customers
have been above international domestic prices, but this gap has been closed towards May 2005.
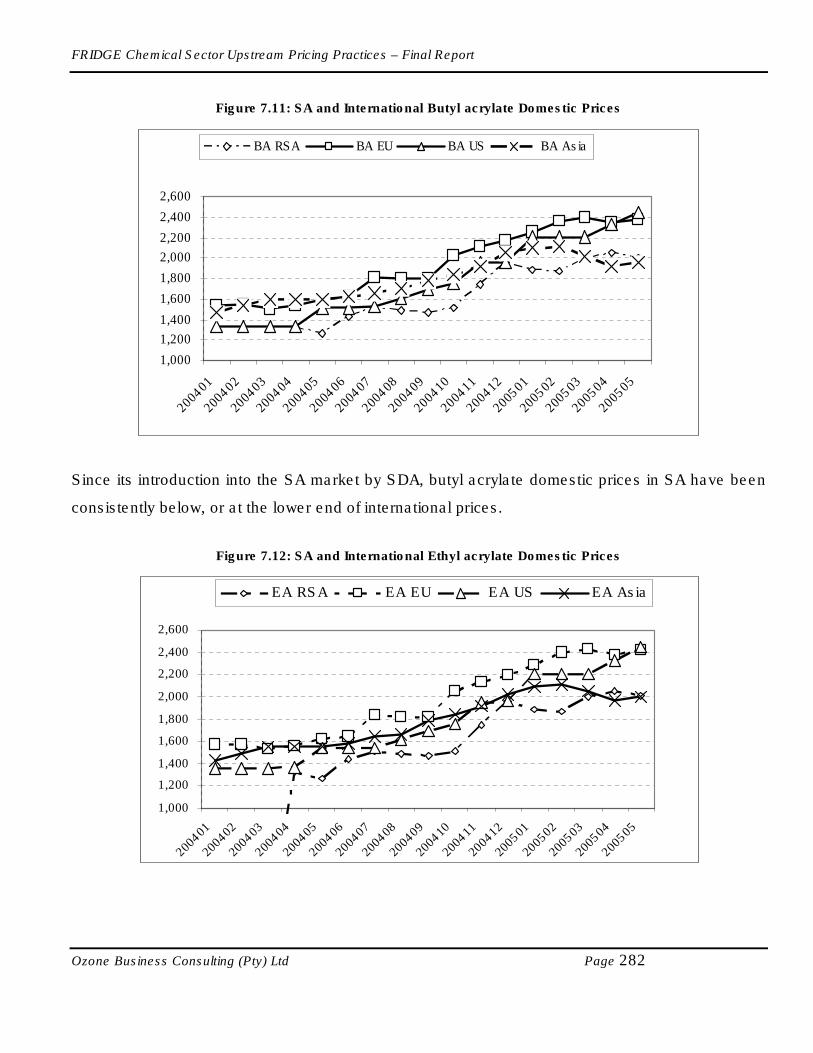
FRIDGE Chemical Sector Upstream Pricing Practices – Final Report
Ozone Business Consulting (Pty) Ltd Page 282
Figure 7.11: SA and International Butyl acrylate Domestic Prices
1,000
1,200
1,400
1,600
1,800
2,000
2,200
2,400
2,600
2004
01
2004
02
2004
03
2004
04
2004
05
2004
06
2004
07
2004
08
2004
09
2004
10
2004
11
2004
12
2005
01
2005
02
2005
03
2005
04
2005
05
BA RSA BA EU BA US BA Asia
Since its introduction into the SA market by SDA, butyl acrylate domestic prices in SA have been
consistently below, or at the lower end of international prices.
Figure 7.12: SA and International Ethyl acrylate Domestic Prices
1,000
1,200
1,400
1,600
1,800
2,000
2,200
2,400
2,600
2004
01
2004
02
2004
03
2004
04
2004
05
2004
06
2004
07
2004
08
2004
09
2004
10
2004
11
2004
12
2005
01
2005
02
2005
03
2005
04
2005
05
EA RSA EA EU EA US EA Asia

FRIDGE Chemical Sector Upstream Pricing Practices – Final Report
Ozone Business Consulting (Pty) Ltd Page 283
Since its introduction into the SA market by SDA, ethyl acrylate domestic prices in SA, similarly to
butyl acrylate, have been consistently below, or at the lower end of international prices.
7.5.4. Historical sales levels for key downstream products
No downstream response.
7.5.5. Basis for SA Downstream Products pricing calculations
No downstream responses.
7.5.6. Key differentiation factors for purchasing feedstock
No downstream responses.
7.5.7. Downstream Operations
No downstream responses.
7.5.8. Assessment of global competitiveness of downstream producers
No downstream responses.
7.5.9. Ability for downstream to expand product range based on lower feedstock prices
No downstream responses.
7.5.10. Impact of current pricing practices
Skills
Upstream respondents commented regarding the effect of the upstream investment in acrylate
capacity on skills. Significant technology transfer took place into SA from MCC in Japan. This
included the butanol plant built by Sasol as a necessary investment for feedstock to be available
for the SDA acrylic acid and acrylates complex. Technology for both the butanol plant and the
acrylic acid and acrylates complex was supplied by MCC who is one of only three entities world
wide to possess the technology to build and operate acrylic acid and acrylates plants.

FRIDGE Chemical Sector Upstream Pricing Practices – Final Report
Ozone Business Consulting (Pty) Ltd Page 284
The operating expertise and technology provided by MCC during the past year was critical to
assist SDA to improve its operations capacity utilisation rates. SDA did unfortunately experience
significant operational difficulties during the first year of operation and was forced to declare a
force majeure during October 2004. Extensive technical support from MCC together with an
intensive focus by Sasol technical and operations staff have resulted in significant improvements
to the plant operations rate during the last six months.
The knowledge gained by local South African operations staff will prove invaluable in the future as
the complex is expanded by building a second train.
Wages
Upstream respondents commented that the direct and indirect jobs created as a result of the SDA
investment alone are estimated at 3400 jobs. The wages earned by these direct and indirect jobs
created are rather difficult to estimate, but are no doubt significant in terms of the SA economy
and especially in terms of the local Sasolburg economy.
Technology
Upstream respondents commented that the MCC JV also has allowed SDA access to potential
downstream industry technology. This includes emulsions and super absorbent polymer (SAP).
Sasol and / or SDA have guaranteed access to technology to build a second train. This would
effectively double the capacity of crude acrylic acid as well as increases the capacity of the
downstream derivatives. Sasol and / or SDA have also received assurances that technology for
emulsions manufacture as well as for super absorbent polymer manufacture could be made
available to SA, should a suitable business case be developed.
Long-term sustainability
As mentioned previously in this document, the establishment of SDA by Sasol and MCC has
resulted in a global acrylic acid and acrylates production facility being based in South Africa. Both
Sasol and MCC have identified this business as core and strategic to their long term growth. It has

FRIDGE Chemical Sector Upstream Pricing Practices – Final Report
Ozone Business Consulting (Pty) Ltd Page 285
been identified as adding significant value to Sasol feedstock and as an appropriate investment to
develop the downstream chemical business focus areas of Sasol and MCC.
Import replacement
Upstream respondents view is that there has been a significant impact here as prior to SDA
coming on line in Q2, 2004, all BA, EA and GAA were imported. During the last 12 to 18 months
SDA has reached a strong market position in BA in RSA. The estimate of local market share for
BA during 04/05 was 68% and currently closer to 75%.
7.6. Impact of pricing on downstream purchasers - Demand Elasticity
From a practical perspective, most acrylic acid and esters are eventually used in the paints,
adhesives and other industries in the form of emulsion polymers. In this application acrylic acid
and esters accounts for around 3 –5% of raw material costs, or around 2 –3% of selling prices. It
is therefore unlikely that a decrease in acrylic acid and esters prices will significantly increase
demand for paints and other products.
7.7. Impact of pricing on downstream purchasers – EVC
No sufficient data is available for reasonable analysis. The upstream operation has only being
operating for two years, while none of the downstream respondents provided any information.
7.8. Conclusions – Acrylic acid and acrylates
Production capacity for acrylic acid and esters in SA is around 105 000 t/a. The SA market size in
2004 for acrylic acid and esters used in local applications such as emulsions was estimated at 25
000 tons. This indicates a significant excess in capacity.
The cost structure of the South African operation is not directly comparable to international glacial
acrylic acid as well as acrylate esters operations, in that the South African producer has an

FRIDGE Chemical Sector Upstream Pricing Practices – Final Report
Ozone Business Consulting (Pty) Ltd Page 286
integrated operation that is manufacturing n-butanol as well as acrylates. Also, the feedstock used
in the South African operation for acrylic acid and acrylate esters is propylene and captive butanol,
while in the international case the feedstock is acrylic acid and butanol.
The local producer’s domestic price is comparable with prices in USA and Asia and is derived
from the published ICIS LOR reference data as follows: The average of the lowest values quoted
for North West Europe (Free Delivered) and Asia Pacific on a CIF basis of the preceding week’s
published prices at time of determination. No costs are added to the USD Price in terms of Import
Parity Pricing input factors. Local market conditions are also taken into account to ensure that the
local producer remains competitive in the South African market.
Butyl acrylate and ethyl acrylate domestic prices in SA have been consistently below, or at the
lower end of international prices. Glacial acrylic acid is the last product introduced by the local
producer, and initial pricing for local customers have been above international domestic prices, but
this gap has been closed towards May 2005.
The reality test has revealed that South Africa is consuming around 0.7% of global acrylic acid
and esters, which is in line with SA’s share of global GDP. The sector can therefore be regarded
as relatively developed.
From a practical perspective, most acrylic acid and esters are eventually used in the paints,
adhesives and other industries in the form of emulsion polymers. In this application acrylic acid
and esters accounts for around 3 –5% of raw material costs, or around 2 –3% of selling prices. It
is therefore unlikely that a change in acrylic acid and esters prices will significantly change
demand for paints and other products.
Insufficient data is available for reasonable analysis. The upstream operation has only been
operating for two years, while none of the downstream respondents provided any information.

FRIDGE Chemical Sector Upstream Pricing Practices – Final Report
Ozone Business Consulting (Pty) Ltd Page 287
8. GLOBAL REALITY TEST
8.1. Introduction
The analysis of the value chains in chapters 2 to 7 provides a view of the issues affecting the
value chains including the relative effect of pricing practises. The analysis in this chapter is
providing insight regarding the relative development status of the value chains in South Africa
compared to other countries.
In terms of assessing the impact of pricing practices on the development of the downstream
chemical sector, it is also necessary to determine an approach that evaluates the relative
development of downstream chemical sectors for a range of countries, and compare that with the
status in South Africa.
This comparison will then identify any significant underdevelopment of the SA downstream
sectors. A demonstrated underdevelopment indicates that market growth drivers, of which
feedstock pricing is one, have worked together to lead to the underdevelopment. Similarly, a
demonstrated development in SA that is in line with comparable countries indicates that that
market growth drivers have resulted in a level of downstream development that is in line with the
status of the SA economy in general.
This comparison of relative development of downstream chemical sector is called the “Reality
Test” within the context of this study. For selected Upstream/Downstream combinations, these are
simply tests to set the scene for the review of the pricing practices of the upstream chemical
producers.
The focus has been on applying a Reality Test for the polymer conversion sector of the study
(chapters 2 to 4). There are several reasons for this:
• As a group, the polymers represent the most value of all the intermediate products included
in the study.
• Polymer conversion is a relatively large employer

FRIDGE Chemical Sector Upstream Pricing Practices – Final Report
Ozone Business Consulting (Pty) Ltd Page 288
• There is a perception that the polymer conversion sector in South
Africa is under-developed by comparison with other developing economies.
• Accurate consumption data of polymers for most countries is available
A comparison of the Per Capital GDP vs. Per Capita Polymer Usage for all countries is a well-
established “Reality Test” for which data is available. It attempts to see if there is any correlation
between the “stage and size of economic development” (as measured by per capita GDP) with the
“size of the polymer conversion sector” (as measured by per capita polymer converted within the
economy).
8.2. Reality Test for Polymer Conversion: The Country Comparison of Polymer
Consumption
A wide sample base of 98 countries, inclusive of SA, has been selected. Data on the domestic
usage of the selected polymers, i.e. for conversion into plastic products for sale into the domestic
market or for export, has been sourced from independent sources (Tecnon and CMAI). Data on
country population and GDP has been sourced from the IMF and the World Bank.
The following correlations/analysis has been undertaken:
• For all 98 Countries: Per Capita GDP vs. Per Capita Polymer Usage for all Polymers
(LDPE + LLDPE + HDPE + PVC + PP) in Total for 2004
• For all 98 Countries: 2004 Change over 1985: Per Capita GDP vs Per Capita Polymer
Usage for all Polymers (LDPE + LLDPE + HDPE + PVC + PP)
• For all Countries with Populations > 15 Million and < 50 Million (32): Per Capita GDP
vs Per Capita Polymer Usage for all Polymers (LDPE + LLDPE + HDPE + PVC + PP) in
Total for 2004
• For all Countries with Populations > 15 Million and < 50 Million (32): Per Capita GDP
vs Per Capita Polymer Usage for all Each of the Polymers Individually (LDPE, LLDPE,
HDPE, PVC & PP) for 2004
• For Selected Countries: Contribution of Polymer Conversion to GDP (1985 to 2004)

FRIDGE Chemical Sector Upstream Pricing Practices – Final Report
Ozone Business Consulting (Pty) Ltd Page 289
8.3. Per Capita GDP vs. Per Capita Polymer Usage for all Polymers
The Per Capita GDP vs. Per Capita Polymer Usage for all Polymers for 2004 is shown in the chart
below. This includes the following polymer types:
• LDPE
• LLDPE
• HDPE
• PVC
• PP
Figure 8.1: All Polymers - 2004: Per Head Polymer Usage vs. Per Capita GDP (1998 $) for South Africa and 97
other countries
All Polymers - 2004: per head polymer usage vs per capita GDP (1998 $) for South Africa and 97 other countries
R2 = 0.8015
0.0
20.0
40.0
60.0
80.0
100.0
120.0
140.0
160.0
180.0
0 5,000 10,000 15,000 20,000 25,000 30,000 35,000 40,000 45,000
per capita GDP ($ - 1998$)
per
he
ad
po
lym
er
usag
e f
or
do
mesti
c c
on
vers
ion
(kg
)
ALL 98 COUNTRIES SOUTH AFRICA BRAZIL AUSTRALIA CHILEMALAYSIA THAILAND SOUTH KOREA BELGIUM HONG KONGTAIWAN SINGAPORE ISRAEL UNITED STATES HUNGARYSLOVAK REPUBLIC CZECH REPUBLIC KUWAIT TURKEY SAUDI ARABIA
The R-Square for the correlation is above 0.8. This means that there is a high correlation
between the per capita consumption for (all) polymers and the per capita GDP.

FRIDGE Chemical Sector Upstream Pricing Practices – Final Report
Ozone Business Consulting (Pty) Ltd Page 290
The first conclusion of relevance is that it is economic activity within an economy that pulls through
demand for plastic products and primary polymers. Secondly, the level of polymer usage, or
consumption in South Africa in 2004 (i.e. the state of the polymer conversion sector) is not out of
line. This is confirmed by SA’s position slightly above the trend line. There are a number of
countries that have a higher per capita polymer usage than that indicated by the “trend line”. The
explanation for these specific countries’ position is as follows:
• Belgium:
o Antwerp has always been a hub for the production of petrochemicals and polymers.
From the formation of the European Union, a number of petrochemical majors (e.g.
Exxon Chemical and BP Chemical) invested heavily in polymer conversion to supply
the European market with polymers from their plants in Antwerp.
o It is the easy access (in terms of logistics costs) to other EU countries that has lead
to the establishment of Belgium as a converter of polymers and exporter of plastic
products to the EU.
o It is has a cluster of carpet producers (based on PP) that export to the rest of Europe
(and elsewhere). Two of the carpet producers are back-integrated into their own
world scale PP plants.
• Hong Kong:
o Despite no domestic source of polymers, a vigorous polymer conversion industry
was established because of the massive markets in China and other Asian countries
and the exports of consumer products (primarily toys containing plastic parts) to the
USA and Europe.
• South Korea and Taiwan:
o Initially, the polymer conversion industries were based on (mostly) imported polymer.
o Both countries have developed vigorous manufacturing sectors that export the bulk
of production (cars, industrial products, white goods and consumer electronics) that
contain plastic components.
o In some areas (e.g. flooring based on PVC) some of the polymer producers have
developed leading edge conversion technology and products to serve the
international market.

FRIDGE Chemical Sector Upstream Pricing Practices – Final Report
Ozone Business Consulting (Pty) Ltd Page 291
• Singapore, Malaysia and Thailand:
o The development of the ASEAN common market provided easy market access
(firstly) for the converters in Singapore. With the development of the petrochemical
industries in Malaysia and Thailand (and the tax-based very generous incentives
provided to attract investment in petrochemicals and polymer conversion), there was
massive investment in polymer conversion capacity.
o Investment in polymer conversion in the 1990s was done on a very large scale and
with modern equipment – hence the rapid growth in per capita polymer usage.
o There has been a policy within ASEAN to develop export manufacturing bases and
this has drawn in locally converted polymers
• Kuwait and Saudi Arabia:
o Both countries have large polymer plants and access to low cost feedstock for
polymers (ethane).
o In order to maximise local beneficiation of exported polymers, both countries
established Export Processing Zones (with associated tax incentives) to stimulate
investment in polymer conversion. Polymer has been supplied at lower-than-market
prices. This is not WTO compliant and when the countries join the WTO the prices
are likely to be challenged.
• Slovak Republic, Czech Republic and Hungary:
o When labour costs began to increase in Germany and a number of other EU
countries, manufacturing capacity (including polymer conversion) was relocated to
East European countries after 1989.
o The polymer conversion industries in these countries have become a base for the
expanding East European economies.
• Israel:
o The country has developed a system of drip irrigation to conserve water usage for its
agricultural sector based on plastic products developed in Israel. The country
exports these products and has established plants in other countries (including in the
Western Cape) to produce irrigation products.
o Plastic netting is used on a large scale in market gardening.

FRIDGE Chemical Sector Upstream Pricing Practices – Final Report
Ozone Business Consulting (Pty) Ltd Page 292
The conclusion to be drawn from the countries mentioned above is that polymer conversion in the
country that eventually gets incorporated into more exports of consumer goods is the one that
leads the polymer conversion sector to be at the highest level of development. Therefore for the
South African polymer conversion sector to reach a higher level of development more than this
reality test suggests, South Africa needs to export more finished goods which have plastic
components.
8.4. Per Capita GDP vs. Per Capita Polymer Usage for all Polymers - Data for All Mid size
Countries
The Per Capita GDP vs. Per Capita Polymer Usage for all Polymers for 2004 data for South Africa
and All Mid size Countries (populations >15 million and <50 million) is shown in the chart below.
Figure 8.2: All Polymers - 2004: Per Head Polymer Usage vs. Per Capita GDP (1998 $) for South Africa and All
Mid size Countries (populations >15 million and <50 million)
0.0
20.0
40.0
60.0
80.0
100.0
120.0
0 5000 10000 15000 20000 25000 30000
per capita GDP ($ - 1998$)
pe
r h
ea
d p
oly
me
r u
sa
ge
fo
r d
om
es
tic
co
nvers
ion
(k
g)
All Mid Size Countries SOUTH AFRICA SOUTH KOREA SAUDI ARABIA MALAYSIA TAIWAN
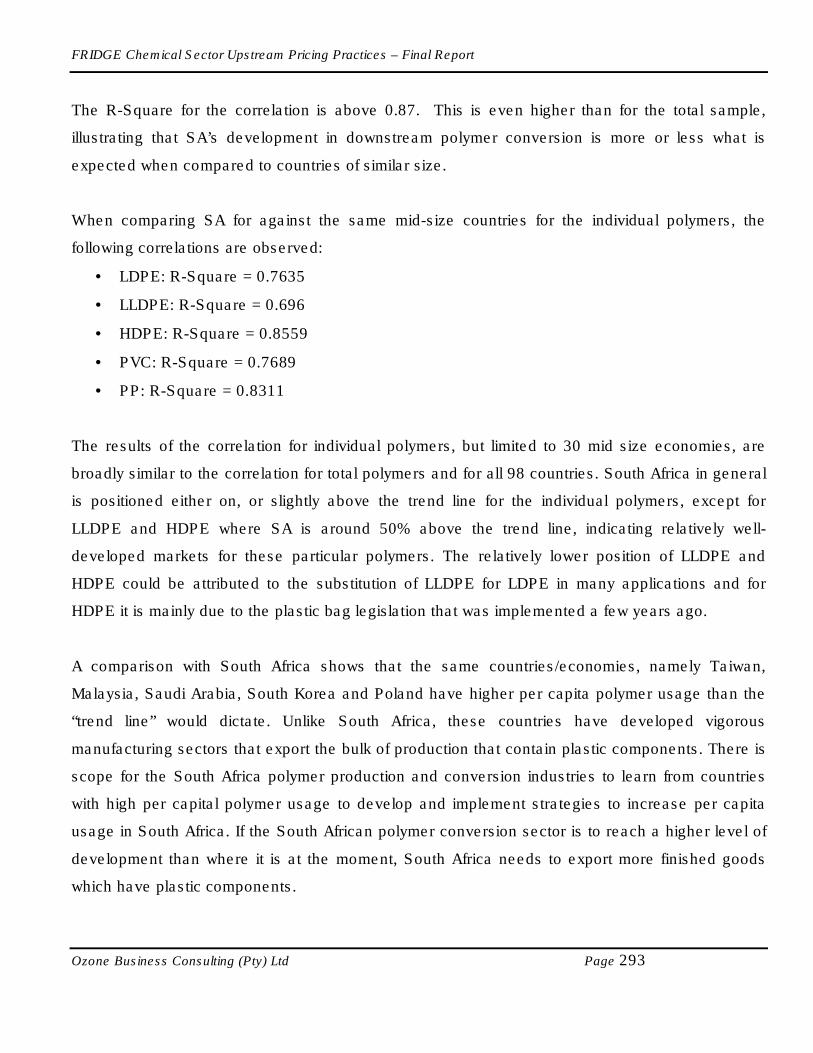
FRIDGE Chemical Sector Upstream Pricing Practices – Final Report
Ozone Business Consulting (Pty) Ltd Page 293
The R-Square for the correlation is above 0.87. This is even higher than for the total sample,
illustrating that SA’s development in downstream polymer conversion is more or less what is
expected when compared to countries of similar size.
When comparing SA for against the same mid-size countries for the individual polymers, the
following correlations are observed:
• LDPE: R-Square = 0.7635
• LLDPE: R-Square = 0.696
• HDPE: R-Square = 0.8559
• PVC: R-Square = 0.7689
• PP: R-Square = 0.8311
The results of the correlation for individual polymers, but limited to 30 mid size economies, are
broadly similar to the correlation for total polymers and for all 98 countries. South Africa in general
is positioned either on, or slightly above the trend line for the individual polymers, except for
LLDPE and HDPE where SA is around 50% above the trend line, indicating relatively well-
developed markets for these particular polymers. The relatively lower position of LLDPE and
HDPE could be attributed to the substitution of LLDPE for LDPE in many applications and for
HDPE it is mainly due to the plastic bag legislation that was implemented a few years ago.
A comparison with South Africa shows that the same countries/economies, namely Taiwan,
Malaysia, Saudi Arabia, South Korea and Poland have higher per capita polymer usage than the
“trend line” would dictate. Unlike South Africa, these countries have developed vigorous
manufacturing sectors that export the bulk of production that contain plastic components. There is
scope for the South Africa polymer production and conversion industries to learn from countries
with high per capital polymer usage to develop and implement strategies to increase per capita
usage in South Africa. If the South African polymer conversion sector is to reach a higher level of
development than where it is at the moment, South Africa needs to export more finished goods
which have plastic components.

FRIDGE Chemical Sector Upstream Pricing Practices – Final Report
Ozone Business Consulting (Pty) Ltd Page 294
8.5. Polymer Conversion: Historical Growth in Contribution to GDP
The historical growth in the relative contribution of polymer conversion to GDP is shown below for
SA, as well as a number of other selected countries.
Figure 8.3: All Polymers - 2004: Per Head Polymer Usage vs. Per Capita GDP (1998 $) for South Africa and All
Mid size Countries (populations >15 million and <50 million)
0.0
2.0
4.0
6.0
8.0
10.0
12.0
14.0
16.0
18.0
20.0
1985 1990 1995 2000 2004
kg
per
'00
0$
of
GD
P (
199
8$
)
SOUTH AFRICA
UNITEDSTATESUNITEDKINGDOMTHAILAND
TAIWAN
SINGAPORE
SAUDI ARABIA
MALAYSIA
HONG KONG
CHILE
BRAZIL
AUSTRALIA
SOUTH KOREA
The contribution of polymer conversion to GDP varies considerably for the selected counties. In
South Africa, the contribution from polymer conversion to GDP is growing.
The rapid growth in Thailand and Malaysia is a result of the developments in polymer production,
the emergence of the ASEAN Free market Area and a government policy to stimulate
petrochemicals production and polymer conversion using generous tax breaks.

FRIDGE Chemical Sector Upstream Pricing Practices – Final Report
Ozone Business Consulting (Pty) Ltd Page 295
8.6. South Africa versus Chile – Polymer Conversion
A specific case in terms of the Reality Test is the relative position of South Africa Versus Chile.
Chile has no domestic polymer industry, but it has easy access to imported polymer at a relatively
low cost from both the Americas and Asia. Import duties are generally below 10% [6% for the US
due to a FTA], and there are also a number of export processing zones where no duties are
payable for re-exported plastic products. The relative position for the two countries in terms of the
development of the plastic products sector is shown in the following table:
Table 8.1: Per Capita Polymer Usage vs. Per Capita GDP for RSA and Chile - 2004
South Africa Chile Ratio: South Africa/Chile
Polymer
Per Capita GDP in
2004 ($ - 1998$)
Per Capita polymer use (kg)
per capita GDP
per capita polymer use
(kg) Per Capita Polymer consumption/GDP
LDPE 3,576 3.8 5,999 5.9 1.080471
LLDPE 3,576 3 5,999 2.3 2.188138
HDPE 3,576 5.4 5,999 7.3 1.240944
PVC 3,576 3.8 5,999 4.9 1.300975
PP 3,576 4.9 5,999 5.1 1.611786
All Polymers 3,576 20.9 5,999 25.4 1.380365
From this table it is clear that the downstream SA plastic products sector is significantly better
developed than Chile, except for LDPE. This could be accounted for by the fact that SA has to
import a significant portion of LDPE polymer due to lack in local upstream capacity. A conclusion
that can be drawn from the numbers is that the availability of locally manufactured polymer is
more important for the development of the downstream conversion sector than the access to
polymer on a fully-imported basis at a competitive price.
8.7. Polystyrene – A fully imported Polymer for SA
Polystyrene is a polymer that is not manufactured in SA, and imports are on a completely duty-
free basis from all countries. Some production occurred in the past, but operations closed down
due to lack of competitiveness against imported product.

FRIDGE Chemical Sector Upstream Pricing Practices – Final Report
Ozone Business Consulting (Pty) Ltd Page 296
Figure 8.4: Polystyrene - 2004: Per Head Polymer Usage vs. Per Capita GDP (1998 $) for South Africa and All
Mid size Countries (populations >15 million and <50 million)
PS - 2004: Per Head Polymer Usage vs Per Capita GDP - Data for South Africa and All Mid Size
Countries (populations >15 million and < 50 million)
R2 = 0.6602
-1
1
3
5
7
9
11
13
15
0 5,000 10,000 15,000 20,000 25,000 30,000 35,000 40,000 45,000
per capita GDP ($ - 1998$)
pe
r h
ead
us
ag
e f
or
po
lym
er
co
nv
ers
ion
(kg
)
SOUTH AFRICA THAILAND SOUTH KOREA ISRAEL BRAZIL CHILE
It is significant to notice that for polystyrene the position of the local industry is below the average
[as represented by the R2 – line], compared to all the other polymers that are locally manufactured
in SA, where SA is above the average. This analysis seems to indicate that notwithstanding the
fact that polystyrene can be freely imported with no duties, the development of the local
polystyrene market is lagging behind those polymer types that are locally manufactured. This
means the local manufacturing of other polymer types has contributed positively to the
development of the local polymer conversion sector.
8.9. Conclusions
The strong correlation between polymer consumption and GDP (economic activity) in a country
has been demonstrated. The higher the GDP, the more polymers are used within the economy. In
relation to its GDP, consumption of polymers in South Africa is within a range that economists
would accept as “natural or normal”.

FRIDGE Chemical Sector Upstream Pricing Practices – Final Report
Ozone Business Consulting (Pty) Ltd Page 297
However, there are countries that have a level of polymer consumption that is above the trend
line. In all cases, there are reasons for this. The polymer industry in South Africa (Upstream and
Downstream) can learn from developments in some of these countries to grow polymer usage
above what can be expected from a growth in the GDP.
The indications are, based on SA’s position versus Chile, as well as the state of the polystyrene
conversion sector in SA, that the development of the downstream polymer conversion industry is
more dependant upon the actual availability of local polymer than the free importation of polymer
at low cost.
Lessons for South Africa going forward is that the country has to develop strategies to ensure the
existence of vigorous manufacturing sectors that export the bulk of production that contain plastic
components as well come up with government policy that stimulates petrochemicals production
and polymer conversion.
The other value chains (apart from polymers) were not evaluated at the same level of detail for
purposes of the reality test. However, some basic conclusions can be made as shown in
paragraphs that follow below.
Regarding the fertilizer value chain, South Africa is consuming around 0.65% of global ammonia,
which is in line with South Africa’s share of global GDP. In the case of phosphate rock South
Africa’s share of consumption is around 1.2%, which is relatively higher than the contribution to
global GDP. This means therefore that the sector can be regarded as developed.
South Africa is consuming around 0.6% of global TiO2 pigments, which is in line with South
Africa’s share of global GDP. The titanium pigments sector can therefore be regarded as
developed.
In the case of acrylic acid and esters value chain, South Africa is consuming around 0.7% of
global acrylic acid and esters, which is in line with South Africa’s share of global GDP. This means

FRIDGE Chemical Sector Upstream Pricing Practices – Final Report
Ozone Business Consulting (Pty) Ltd Page 298
the sector is developed even without the local manufacturing of super-absorbents, which is
globally a major application for acrylic acid.
FRIDGE Chemical Sector Upstream Pricing Practices – Final Report
Ozone Business Consulting (Pty) Ltd Page 299
9. DRIVERS FOR GROWTH IN THE DOWNSTREAM CHEMICAL SECTOR
9.1. Introduction
Drivers for growth in the downstream chemical sector tend to be universally applicable, with the
only difference being the relative importance of these drivers, as impacted upon by local
circumstances.
Previous work conducted by Terry Le Roux, a member of the consultant’s consortium, has
identified the major drivers that specifically impact upon the development of the downstream
polymer conversion sector, which is a key focus of this study.
These previous work included the following:
• Helping the government in the Northern Territory (Australia) establish a polymer conversion
industry in a new industrial park outside Darwin. The focus of the initiative was to
persuade/motivate converters in Hong Kong relocate their factories to Australia ahead of
the change of status for Hong Kong.
• In working for the Government of Bahrain to establish a polymer conversion industry based
on polymers that would be made on a new petrochemicals complex.
• Managing the joint Taiwanese/RSA Government Initiative that looked at areas of
cooperation between South Africa and Taiwan in the areas of petrochemicals and polymer
conversion.
In all cases, the work involved visits to factories and interviews with potential converters (large and
small).
9.2. Identification of Drivers
Based upon previous work done, the major drivers for the expansion of the downstream polymer
conversion industry in a country are as follows:
• Strong Domestic Demand for Plastic Products used in the Economy for Domestic
Consumption

FRIDGE Chemical Sector Upstream Pricing Practices – Final Report
Ozone Business Consulting (Pty) Ltd Page 300
• Existing (or Potential) Demand for Plastic Products used in Components or Products that
are Exported
• Relatively Good Access or Proximity to Export Markets for Plastic Products
• Polymers at Competitive Prices
• Local Availability of Polymers (from a local supplier)
• Cost and Availability of Conversion Machinery
• Cost and Availability of Skilled Workers
• Creation of business enabling environment by Government, low Taxes and Government
Help to Access Export Markets
• Vigilance on Illegal Imports
• Rigorous and timeous investigations into dumping
• Innovation and Entrepreneurship of the Converters
These drivers work in concert to impact on growth and development, although the relative impact
differs between the drivers.
It should be noted that these drivers are also applicable to most of the other value chains as far as
the development of their downstream sectors are concerned. For example, in Titanium dioxide
pigments and acrylate esters, the major downstream sector is the paints industry. In the paints
industry the identified drivers are fairly similar to the polymers, although the weightings would be
different.
The fertilizer feedstock value chain is impacted by a number of other drivers, including climatic
conditions and agricultural commodity prices.
9.3. Weightings of Drivers
Based upon the Consultants’ experience, the following weightings can be allocated to the
identified drivers for downstream development:
Scale 1 to 5, where:

FRIDGE Chemical Sector Upstream Pricing Practices – Final Report
Ozone Business Consulting (Pty) Ltd Page 301
• Weight 5 = high relative impact on downstream development
• Weight 1 = small relative impact on downstream development
Table 9.1: Drivers for Downstream Plastic Conversion Development – Proposed Weightings for a Developing
Country
Drivers for Downstream Development Category Weight (1-5)
1. Large domestic market for plastic end-products 5 2. Large exporter of industrial & consumer end-products containing plastic components
5
3. Geographic proximity to large export markets for plastic products
Market related
4 4. Availability of locally manufactured polymers 3 5. Availability of polymer at competitive prices
Polymer feedstock
related 5
6. Innovation capability amongst polymer converters 2 7. Cost & availability of technologically advanced conversion equipment
3
8. Availability & cost of trained and qualified technical personnel
Converter Issues
2 9. Low taxes and the existence of business enabling environment Government
Related 2
Total 31
Based upon the allocated weightings, the relative importance of the categories is as follows:
• Market related: 14/31 or 45%
• Polymer feedstock related: 8/31 or 26%
• Converter Issues: 7/31 or 16%
• Government Related: 2/31 or 6%
It is clear from this assessment that the most important category for the successful development
of a downstream polymer industry is market related, and that competitive pricing of polymer plays
a role, but in proportion to all the other factors. The success or health of a conversion industry is
therefore not determined by a single driver, but a combination of drivers. Development of a
successful downstream beneficiation strategy therefore needs to take all the factors into account.
By enforcing an improvement of one factor, such as polymer pricing, without addressing the other
factors will not result in the desired development of the downstream sector.
It should be noted that the weighting given is subjective to the extent that others could differ and
might give a different weight to each of the drivers.

FRIDGE Chemical Sector Upstream Pricing Practices – Final Report
Ozone Business Consulting (Pty) Ltd Page 302
The most important factor determining the health and growth prospects for downstream sectors
such as polymer conversion and paints formulation is the robustness of the overall economy,
including the sectors exporting manufactured goods. This is borne out by the strong correlation
between per capita polymer usage with per capita GDP, as demonstrated in the ”reality test”.
9.4. South Africa’s Relative Position
The Consultants’ estimated from past experience a relative position for SA regarding the identified
drivers. This proposed scoring is shown below:
Scale 1 to 5, where:
• Weight 5 = relative high or good performance for a country
• Weight 1 = relative low or poor performance for a country
Table 9.2: Growth Factor Weightings for Downstream Plastic Conversion
Country Scores (0 – 5) Drivers for the Development of a Polymer Conversion Industry RSA Taiwan South
Korea Saudi Arabia
Malaysia Poland Chile
A large domestic market for the plastic product
2 3 3 2 2 2 2
Large exporter of industrial and consumer goods
2 5 5 1 2 2 1
Proximity to large export markets for plastic products
2 5 5 2 4 4 2
Local availability of polymers 4 4 4 5 5 2 1 Availability of polymer at competitive prices
3 3 3 5 4 2 2
Innovation capability of polymer converters
3 4 4 2 3 3 3
Cost and availability of modern processing equipment
1 5 5 1 2 2 1
Availability and cost of trained and qualified technical personnel
2 5 5 2 2 3 2
Low taxes and the existence of business enabling environment
2 4 3 4 3 2 2
The relative scores given to the selected countries are indicative of the gaps that exist between
the best performing countries compared to the rest. For example, in terms of a large domestic
market, all the selected countries are fairly similar, scoring at average or below. However, in terms

FRIDGE Chemical Sector Upstream Pricing Practices – Final Report
Ozone Business Consulting (Pty) Ltd Page 303
of a large export market of end-products, countries such as Taiwan and South Korea have
excellent scores compared to SA, which is below average.
By applying the weightings to the relative scores, the country’s presumed position in terms of
ability for the downstream sector to develop can be demonstrated. For example, the weighting for
a large domestic market for downstream products is 5/5, or 100%. If this weighting is multiplied by
the country’s score for the same factor, the relative country position in terms of country score, as
well as the other factors is obtained. By adding the relative scores for all the factors together for
each country, the overall propensity for a country to support downstream developments can be
demonstrated. This is shown below:
Table 9.3: Propensity for Downstream Development
Weighted Country Scores Drivers for the Development of a Polymer Conversion Industry RSA Taiwan South
Korea Saudi Arabia
Malaysia Poland Chile
A large domestic market for the plastic product
10 15 15 10 10 10 10
Large exporter of industrial and consumer goods
10 25 25 5 10 10 5
Proximity to large export markets for plastic products
8 20 20 8 16 16 8
Local availability of polymers 12 12 12 15 15 6 3 Availability of polymer at competitive prices
15 15 15 25 20 10 10
Innovation capability of polymer converters
6 8 8 4 6 6 6
Cost and availability of modern processing equipment
3 15 15 3 6 6 3
Availability and cost of trained and qualified technical personnel
4 10 10 4 4 6 4
Low taxes and the existence of business enabling environment
4 8 6 8 6 4 4
Total 72 128 126 82 93 74 53
The results of the weighted scores (based on the consultant’s weightings and the country
comparison scores) seem to confirm the results of the Reality Tests.
The results of the country scores supports the conclusions on the per capita polymer usage vs per
capita GDP country comparisons that, those countries with high per capita polymer usage have
FRIDGE Chemical Sector Upstream Pricing Practices – Final Report
Ozone Business Consulting (Pty) Ltd Page 304
large markets/demand for plastic products because of activities within the economy (including
exports of manufactured products).
For the South African downstream polymer conversion sector the results of table 9.3 above are
instructive in terms of what to do to stimulate downstream development. What the table shows is
that there are a host of important issues other than pricing than lead to the development of the
polymer conversion sector. For example, Saudi Arabia scored the highest point (100%) when it
comes to availability of polymer at competitive prices. However, that competitive (pricing)
advantage on its own does not make Saudi Arabia the most developed polymer converting
country. This is because Saudi Arabia scored relatively worse on two equally important issues;
which are availability of a large domestic market and a large exporter of industrial and consumer
goods. The major option for stimulating growth for the South African polymer conversion sector is
therefore to look at improving the country’s performance on other drivers (other than pricing) like
large exporter of industrial and consumer goods amongst others. This conclusion is also
confirmed by the results of the reality test as shown in chapter 8.
Other major options for stimulating growth of the South African downstream polymer conversion
sector are:
• Ensuring local availability of polymers
• Ensuring availability of polymer at competitive prices
• Promotion of exports of industrial and consumer goods
• Reducing freight logistics costs
• Increasing innovation capability of polymer converters
• Supporting investment in modern processing equipment
• Supporting skills development
• Improvement in business environment
It is also necessary to take cognisance of measures employed by other countries to support their
downstream sectors. For example, in response to increased imports from China (in particular
especially those manufactured in the export processing zones), the EC and USA took trade

FRIDGE Chemical Sector Upstream Pricing Practices – Final Report
Ozone Business Consulting (Pty) Ltd Page 305
measures such as the implementation of quotas and strong vigilance on dumping. In SA’s case
the Government has not taken any action within the targeted value chains despite increasing
imports from China.
9.5. Other important factors
The study also considered the impact of other factors that could affect the sustainability of the
value chains, like skills development, technology, long term sustainability and import replacement.
A summary of the findings on these particular factors is presented below.
9.5.1. Skills development
Although pricing practices are not considered to have a direct influence on skills development, as
is the case with any manufacturing sector, the shortage of skills, particularly in the engineering
field, can be seen as a constraint to both upstream and downstream sub sectors in all value
chains. Skills development in the value chains under consideration are within the mandates of the
MERSETA and the CHIETA and matching the supply of skills to the demand remains a challenge
to both SETAs.
9.5.2. Technology
Ongoing technological innovation is required to ensure that the local polymer industry keeps pace
with global developments in polymer technology. In some value chains like fertilizers and
titanium dioxide, the existing downstream technology is relatively old, resulting in significant
increased investment in technology improvements, particularly, in order to meet increasingly
stringent environmental requirements. For others like the relatively new acrylate plant significant
technology transfer took place from the Joint Venture partner.
9.5.3. Long-term sustainability
Concerns have been expressed that the long-term sustainability of the downstream sector is
threatened by the economies of scale and high capital re-investment in China in particular and the
consequential import of lower priced finished plastic goods into the domestic market.

FRIDGE Chemical Sector Upstream Pricing Practices – Final Report
Ozone Business Consulting (Pty) Ltd Page 306
As has been demonstrated in the reality test, demand for plastic goods follows GDP growth. If
national GDP growth continues to follow the current trend, the local polymer industry will be
required to expand its operations to meet the increased demand. This can only be achieved if all
parts of the polymer value chain are profitable and the invested capital (equipment and skills) is
adequately rewarded.

FRIDGE Chemical Sector Upstream Pricing Practices – Final Report
Ozone Business Consulting (Pty) Ltd Page 307
10. POLICY OPTIONS FOR PRICING PRACTICE
10.1. Review and Conclusions of Global comparison and micro-economic outcomes
10.1.1. Introduction
This section of the report reviews the findings of the global comparison and micro-economic
outcomes for each of the products. In terms of the global comparisons, the review firstly evaluates
the development position of the downstream sectors compared to other countries of comparable
size, as was identified in the Reality Test [mainly polymers]. The next review item is the
competitiveness of the SA domestic prices compared to international prices, including the impact
of current duty and anti-dumping structures. This includes an assessment of the accuracy of data
as supplied by upstream and downstream respondents.
The review of the micro-economic outcomes includes the effect of current upstream pricing
practices on the downstream products in terms of skills, wages, technology, long-term
sustainability and import replacement. It also addresses the relative importance the upstream
feedstock plays in the overall cost structure of downstream companies, including differences
between large and smaller downstream companies.
The realistic price elasticity for the various products, based upon the market conditions prevailing
in SA is also reviewed, as is the relative profitability of the upstream and downstream businesses
covered by the study
10.1.2. Polypropylene
a) Supply/demand Balance
Production capacity for PP in SA is around 355 000 tpa, increasing to 685 000 tpa by completion
of Sasol’s Project Turbo. The SA market size in 2004 for polypropylene primary polymer used in
local plastic conversion was estimated at 223 000 tons, of which 93.7% was supplied by local
producers. This indicated significant excess capacity as the chart below shows.

FRIDGE Chemical Sector Upstream Pricing Practices – Final Report
Ozone Business Consulting (Pty) Ltd Page 308
Figure 10.1 PP installed Capacity and Domestic Demand in South Africa (1994 – 2007)
PP
0
100,000
200,000
300,000
400,000
500,000
600,000
700,000
1994 1995 1996 1997 1998 1999 2000 2001 2002 2003 2004 2005 2006 2007
tonnes
RSA installed capacity
RSA Market Demand
A comparison of South Africa’s domestic and export prices with those domestic and export prices
of other countries/regions has revealed that excess domestic production capacity as in the case of
Polypropylene in South Africa is no guarantee for setting domestic prices.
b) Global Reality Test
The global reality test for PP showed the following result:

FRIDGE Chemical Sector Upstream Pricing Practices – Final Report
Ozone Business Consulting (Pty) Ltd Page 309
The conclusion is therefore that SA’s PP conversion industry is not lagging in terms of
development, taking into account SA’s current state of economic development.
Countries such as South Korea and Taiwan, that have highly developed conversion industries,
have developed vigorous manufacturing sectors that export the bulk of production (cars, industrial
products, white goods and consumer electronics) that contain plastic components.
c) Local Pricing Mechanism
The PP pricing mechanism prevailing in South Africa is one where the price is negotiated, based
on offers in an open market where products are readily traded across national boundaries. The
outcome is that the most competitive supplier sets the price and it is better referred to as market
pricing, compared to formula-driven IPP.
Local suppliers do not select a particular price from a particular region and rigorously apply that to
determine its price to the South African domestic market. They are driven by market dynamics
PP - 2004: Per Head Polymer Usage vs Per Capita GDP - Data for South Africa and All Mid Size Countries (populations >
15 million and < 50 million)
R2 = 0.8311
0.0
5.0
10.0
15.0
20.0
25.0
30.0
35.0
0 5000 10000 15000 20000 25000 30000
per capita GDP ($ - 1998$)
per
head
po
lym
er
usag
e f
or
do
mesti
c c
on
vers
ion
(kg
)
All Mid Size Countries SOUTH AFRICA TAIWAN MALAYSIA SAUDI ARABIA POLAND SOUTH KOREA

FRIDGE Chemical Sector Upstream Pricing Practices – Final Report
Ozone Business Consulting (Pty) Ltd Page 310
and reacts to the lowest price imports being offered by competitive suppliers to its customers.
Prices of locally manufactured substitute materials, such as paper, metal and glass, are also
monitored and considered for the market sectors where they compete as alternatives to polymers.
d) International Pricing Competitiveness
Domestic prices supplied by upstream and downstream respondents showed a good correlation,
taking into account the difference in average prices between large, bulk purchasers and smaller
consumers as well as the fact that the downstream sector does not buy from a single supplier.
Based upon the analysis of SA domestic PP prices compared to a number of major competing
countries, including China, US, NW Europe and India, the main conclusions are as follows:
• Prices around the world are linked.
• In any month, there can be a very wide variation in the prices.
• Prices paid by South African converters are always in the range of prices that prevailed in
the countries or regions covered in the analysis, mostly at the lower end of the range. In the
latter period of the analysis China is the most competitive (lowest priced market) in the
world. In the early part of the period under review, the prices in South Africa were much
lower than those in China and India.
A comparison of South Africa’s domestic and FOB prices with those domestic and FOB prices of
other countries/regions has revealed that in a country where there is excess domestic production
capacity as in the case of Polypropylene in South Africa, the FOB price of the polymer exported is
usually lower than the price at which it is sold to domestic users. The further away the export
market, the higher the price differential between the domestic price and the FOB price. However,
as the above comparison shows, the price paid by export and domestic customers is very similar.
The converse is also true, that is, the closer the export market the smaller the price differential.
The comparison also showed that when the export demand increases faster than domestic,and
there is limited amount of polymer available for export, the differential between the domestic and
FOB prices is smaller and in some instances non-existent.
FRIDGE Chemical Sector Upstream Pricing Practices – Final Report
Ozone Business Consulting (Pty) Ltd Page 311
e) Demand Elasticity
The results of this study indicated for PP that a 10% decrease in price would result in a 2%
increase in market size, and vice versa. The implication is that for PP any price change will result
in a less than proportional change in market size. From a practical perspective the conclusion is
that for 80% plus of the applications, PP polymer constitutes such a small fraction of the end-
product price (or installed cost) that price changes cannot impact on the demand elasticity.
f) EVC
Due to the integration of production facilities, it was not possible to obtain the required information
for the EVC analysis at individual product level. The analysis was therefore conducted on the
combined polymers upstream and downstream sectors for the period 1997 to 2005.
For upstream polymers, the EVC analysis indicated that the return on capital was frequently
lower than the weighted average cost of capital, K. This is a clear indicator that the current pricing
practices of the upstream sector are not resulting in high levels of profitability, as measured
against the total cost of capital, namely K.
For downstream PP, despite all efforts no company provided historical financial data for EVC
analysis.
10.1.3. Polyethylene
a) Supply/demand Balance
The SA market size in 2004 for polyethylene primary polymer used in local plastic conversion was
estimated as follows:
• LDPE: 135 000 t/a
• LLDPE: 139 000 t/a
• HDPE: 158 000 t/a
• Total: 432 000 t/a

FRIDGE Chemical Sector Upstream Pricing Practices – Final Report
Ozone Business Consulting (Pty) Ltd Page 312
LDPE
The current polymer production capability of the LDPE plant is 100 000 t/a. With Sasol’s Project
turbo fully implemented, LDPE capacity will increase to 220 000 t/a, LLDPE will operate at full
capacity.
Figure 10.2 LDPE Installed Capacity and Domestic Demand in South Africa (1994 – 2007)
LDPE
0
50,000
100,000
150,000
200,000
250,000
1994 1995 1996 1997 1998 1999 2000 2001 2002 2003 2004 2005 2006 2007
tonnes
Sasol Polymers Capacity
RSA Market Demand
It can be seen that for the period 1994 – 2006 (when the new capacity of Sasol Polymers comes
on stream), South Africa has been a net importer of LDPE. From 2006 the country will be a net
exporter of LDPE. Demand for LDPE has been stagnant over the period to 2005. The main
reasons are:
• The substitution of LLDPE for LDPE in many applications. The converters have slowly been
switching from LDPE to LLDPE. Part of the reason for the switch to LLDPE (a common
phenomena globally, leading to reduced LDPE growth rates), is that over the period the
properties of LLDPE have improved and, specifically for South Africa, the active marketing
of LLDPE by Sasol Polymers as it had capacity in excess to the local market.

FRIDGE Chemical Sector Upstream Pricing Practices – Final Report
Ozone Business Consulting (Pty) Ltd Page 313
• Internationally, the price of LDPE in relation to LDPE has risen due to the reduced availability
of LDPE on the international market.
LLDPE
The current polymer production capacity of the LLDPE plant is 150 000 t/a. However, LLDPE
production currently is limited to approximately 100 000 t/a based on ethylene availability. With
Sasol’s Project turbo fully implemented, LLDPE will operate at full capacity.
Figure 10.3 LLDPE installed Capacity and Domestic Demand in South Africa (1994 – 2007)
LLDPE
0
20,000
40,000
60,000
80,000
100,000
120,000
140,000
160,000
180,000
200,000
1994 1995 1996 1997 1998 1999 2000 2001 2002 2003 2004 2005 2006 2007
tonnes
Sasol Polymers Capacity
RSA Market Demand
South Africa has been a net importer of LLDPE and is expected to continue to be a net exporter
even after Sasol Polymers new capacity comes on stream. The strong demand for LLDPE is
primarily the result of new generation LLDPE being produced by Sasol Polymers that has
competed with (and taken market share from) LDPE and HDPE.

FRIDGE Chemical Sector Upstream Pricing Practices – Final Report
Ozone Business Consulting (Pty) Ltd Page 314
HDPE
HDPE capacity is 160 000 t/a. Except for a few years in the period, South Africa has had a
structural surplus in HDPE capacity. Demand for HDPE fell in 2004, mainly due to the decision by
the Government to restrict the use of plastic shopping bags – a major market for HDPE. Demand
is expected to increase from 2006 once the effect of the legislation on plastic shopping bags has
worked its way through the system.
Figure 10.4 HDPE installed Capacity and Domestic Demand in South Africa (1994 – 2007)
HDPE
0
50,000
100,000
150,000
200,000
250,000
1994 1995 1996 1997 1998 1999 2000 2001 2002 2003 2004 2005 2006 2007
tonnes
Dow HDPE capacity
RSA Market Demand
b) Global Reality Test
The global reality test for polyethylene showed that SA’s level of conversion is slightly above the
level that can be expected from a country with SA’s level of economic development.
c) Local Pricing Mechanism
The polyethylene pricing mechanism prevailing in South Africa is one where the price is
negotiated based on offers in an open market where products are readily traded across national

FRIDGE Chemical Sector Upstream Pricing Practices – Final Report
Ozone Business Consulting (Pty) Ltd Page 315
boundaries. The outcome is that the most competitive supplier sets the price and it is better
referred to as market pricing, compared to formula-driven IPP.
d) International Pricing Competitiveness
Domestic prices supplied by upstream and downstream respondents showed a good correlation,
taking into account the difference in average price between large, bulk purchasers and smaller
consumers as well as the fact that the downstream sector does not buy from a single supplier.
Based upon the analysis of SA domestic polyethylene prices compared to a number of major
competing countries, including China, US, NW Europe and India, the main conclusions are as
follows:
• Prices around the world are linked.
• In any month, there can be a very wide variation in the prices.
• Prices paid by South African converters are always in the range of prices covered, mostly
at the lower end of the range.
• In the latter period of the analysis China is the most competitive (lowest priced market) in
the world.
A comparison of South Africa’s domestic and FOB prices with those domestic and FOB prices of
other countries/regions has revealed that in a country where there is excess domestic production
capacity of polyethylene, the FOB price of the polymers exported is usually lower than the price at
which it is sold to domestic users. The further away the export market, the higher the price
differential between the domestic price and the export price. However, as the above comparison
shows, the price paid by export and domestic customers is very similar. The converse is also true,
that is, the closer the export market the smaller the price differential. The comparison also showed
that when the export demand increases faster than domestic and there is limited amount of
polymer available for export, the differential between the domestic and FOB prices is smaller and
in some instances non-existent.

FRIDGE Chemical Sector Upstream Pricing Practices – Final Report
Ozone Business Consulting (Pty) Ltd Page 316
e) Demand Elasticity
The results of this study indicated for LDPE that a 10% decrease in price would result in a 3%
increase in market size, and vice versa. For LLDPE the respective data shows that a 10%
decrease in price would result in a 7% increase, and vice versa. The implication is that any price
change will result in a less than proportional change in market size. From a practical perspective
the general conclusion for polyethylene polymers is therefore that for in excess of 80 - 90% of
end-use applications there is no significant demand elasticity.
f) EVC
It was not possible to obtain the required information for the EVC analysis at individual product
level. The analysis was therefore conducted on the combined polymers upstream and
downstream sectors for the period 1997 to 2005.
For upstream polymers, the EVC analysis indicated that the return on capital was frequently
lower than the weighted average cost of capital, K. This is a clear indicator that the current pricing
practices of the upstream sector are not resulting in high levels of profitability, as measured
against the total cost of capital, namely K.
For downstream polyethylene a reasonable survey response was obtained. In total four
companies, accounting for around 30% of the polyethylene market, provided financial data.
However, some of the financial data (two companies) did not correspond historically with the
information provided by upstream companies. Although statistically insignificant, the EVC analysis
of combined polymers indicates that the return on capital was lower than the weighted average
cost of capital, K in every year except 1997 and 1999. This situation means that the downstream
sector companies that responded are not making super profits either.

FRIDGE Chemical Sector Upstream Pricing Practices – Final Report
Ozone Business Consulting (Pty) Ltd Page 317
10.1.4. Polyvinylchloride
a) Supply/demand Balance
Production capacity for PVC in SA is around 200 000 t/a. The SA market size in 2004 for PVC
primary polymer used in local plastic conversion was estimated at 156 000 tons. This indicated
some excess capacity.
Figure 10.5 PVC installed Capacity and Domestic Demand in South Africa (1994 – 2007)
PVC
0
50,000
100,000
150,000
200,000
250,000
1994 1995 1996 1997 1998 1999 2000 2001 2002 2003 2004 2005 2006 2007
tonnes
Sasol Polymers PVC Capacity
RSA Market Demand
Demand for PVC fell in the period 1994 – 2000 because of the poor performance of the
construction sector, which is a major use of products made from PVC (e.g. pipes and electrical
cables). With the improvement in the housing sector and the investment in infrastructure by the
central and provincial governments, demand has picked up.
b) Global Reality Test
The global reality test for PVC showed that SA’s PVC conversion industry is not lagging in terms
of development, taking into account SA’s current state of economic development.

FRIDGE Chemical Sector Upstream Pricing Practices – Final Report
Ozone Business Consulting (Pty) Ltd Page 318
c) Local Pricing Mechanism
The PVC pricing mechanism prevailing in South Africa is one where the price is negotiated based
on offers in an open market where products are readily traded across national boundaries. The
outcome is that the most competitive supplier sets the price and it is better referred to as market
pricing, compared to formula-driven IPP.
d) International Pricing Competitiveness
Domestic prices supplied by upstream and downstream respondents showed a good correlation,
taking into account the difference in average price between large, bulk purchasers and smaller
consumers.
Based upon the analysis of SA domestic PVC prices compared to a number of major competing
countries, including China, US, NW Europe and India, the main conclusions are as follows:
• Prices around the world are linked.
• In any month, there can be a very wide variation in the prices.
• Prices paid by South African converters are always in the range of prices covered, mostly
at the lower end of the range.
A comparison of South Africa’s domestic and export prices with those domestic and export prices
of other countries/regions has revealed that in a country where there is excess domestic
production capacity of PVC, the FOB price of the polymer exported is usually lower than the price
at which it is sold to domestic users. The further away the export market, the higher the price
differential between the domestic price and the export price. However, as the above comparison
shows, the price paid by export and domestic customers is very similar. The converse is also true,
that is, the closer the export market the smaller the price differential. The comparison also showed
that when the domestic market is tight and there is limited amount of polymer available for export,
the differential between the domestic and export prices is smaller and in some instances non-
existent.

FRIDGE Chemical Sector Upstream Pricing Practices – Final Report
Ozone Business Consulting (Pty) Ltd Page 319
e) Demand Elasticity
The results of this study indicated for PVC that a 10% decrease in price would result in a 10%
increase in market size, and vice versa. The implication is that the increase in market size will be
no more than proportional.
From a practical perspective the large impact of product substitution caused by aggressive market
share growth of PET (Saturated polyester) in packaging applications, the PVC bottle packaging
category is subject to demand elasticity.
The general conclusion for PVC polymer is therefore that for most end-use applications there is no
significant demand elasticity, with the notable exception of packaging bottles.
f) EVC
Due to the integration of production facilities, it was not possible to obtain the required information
for the EVC analysis at individual product level. The analysis was therefore conducted on the
combined polymers upstream and downstream sectors for the period 1997 to 2005.
For upstream polymers, the EVC analysis indicated that the return on capital was frequently
lower than the weighted average cost of capital, K. This is a clear indicator that the current pricing
practices of the upstream sector are not resulting in high levels of profitability, as measured
against the total cost of capital, namely K.
For downstream PVC, despite all efforts, only one company provided financial data and the data
did not corresponded historically with the information provided by upstream companies.
10.1.5. Fertilizer feedstock
a) Supply/demand Balance
Production capacity for ammonia in SA is around 660 000 t/a, and for phosphate rock 3.3 million
t/a. The SA market size in 2004 for ammonia used in local applications such as ammonium nitrate
was estimated at 710 000 tons. This indicates a shortage in capacity, which is made up from

FRIDGE Chemical Sector Upstream Pricing Practices – Final Report
Ozone Business Consulting (Pty) Ltd Page 320
imports. The SA market for phosphate rock was 1.7 million t/a in 2004, which indicates an excess
in capacity.
b) Global Reality Test
SA is consuming around 0.65% of global ammonia, which is inline with SA’s share of global GDP.
In the case of phosphate rock SA’s share of consumption is around 1.2%, which is relatively
higher than the contribution to global GDP.
c) Local Pricing Mechanism
SA inland or domestic ammonia prices are directly linked by means of the formula-applied pricing
mechanism to international prices. There is no import duty on ammonia. The phosphate rock price
is indexed upon the CFR [freight delivered price] price of phosphate rock in India. Effectively local
phosphate prices in 2005 were at a discount of 30.6% compared to India.
d) International Pricing Competitiveness
Actual delivered ammonia prices in SA during the period 2000 – 2004 were around 5.1% higher
than the US Gulf Coast prices, and 17.6% higher than Indian CFR prices. In the case of
phosphate rock [taking into account variances in BPL levels], SA delivered prices are historically
well below Indian CFR prices, which exclude Indian inland delivery costs. Ex-factory SA prices are
either below or similar to Moroccan export prices.
e) Demand Elasticity
Demand for Fertilizers responds negatively to price changes with a small elasticity of –0.38.
Demand responds positively to GDP with an elasticity of 1.49. Demand of fertilizers also responds
positively to rainfalls with a small elasticity of 0.04.
f) EVC
The intrinsic value analysis illustrated that the downstream fertilizers sector had returns that were
higher than the cost of capital by 2005 while in the upstream fertilizers sector the returns were
lower at the same time. This seems to illustrate an inversely proportional relationship between
upstream and downstream financial performance.
FRIDGE Chemical Sector Upstream Pricing Practices – Final Report
Ozone Business Consulting (Pty) Ltd Page 321
10.1.6. Titanium dioxide pigments
a) Supply/demand Balance
Production capacity for TiO2 pigments in SA is around 35 000 t/a. The SA market size in 2004 for
TiO2 pigments used in local applications such as paints was estimated at 24 000 tons. This
indicates an excess in capacity.
b) Global Reality Test
SA is consuming around 0.6% of global TiO2 pigments, which is slightly below SA’s share of
global GDP.
c) Local Pricing Mechanism
TiO2 pigments are sold at the market price prevailing in South Africa. TiO2 pigments are a
commodity item and hence pricing is driven by world demand and supply. The outcome is that the
most competitive supplier sets the price and it is better referred to as market pricing, compared to
formula-driven IPP.
There is a rebate mechanism in place for large customers that are based on volumes. An
estimated 55% of all sales of locally produced product are to large customers.
d) International Pricing Competitiveness
The average prices over the period shown above are as follows:
• APEC (Asia Pacific): $2,002/ton
• N. America: $2,125/ton
• North West Europe: $2,276/ton
• SA (South Africa): $2,134/ton
Prices paid by South African downstream users are generally in line with prices paid in the regions
included in the comparison.

FRIDGE Chemical Sector Upstream Pricing Practices – Final Report
Ozone Business Consulting (Pty) Ltd Page 322
e) Demand Elasticity
From a practical perspective, most titanium dioxide pigments are used in the paints industry. In
this application titanium dioxide pigments accounts for around 20 – 25% pf raw material costs, or
around 10 – 13% of selling prices. At retail level titanium dioxide pigments accounts for only
around 5% of the price. It is therefore unlikely that a decrease in titanium dioxide pigment prices
will significantly increase demand for paints.
f) EVC
For titanium dioxide pigments an EVC analysis was conducted for 1997 to 2005 for the single
upstream company. The analysis indicates that for the first 6 years starting in 1997, with the
exception of 1997 recorded returns were higher than the weighted average cost of capital, K.
However, from 2003 to 2005 the returns have been lower than the weighted average cost of
capital. The lower returns between 2003 and 2005 outweighed the returns made in the earlier
years to the extent that the IVC became negative by 2005. No historical financial information on
downstream titanium dioxide pigments has been provided.
10.1.7. Acrylic acid and esters
a) Supply/demand Balance
Production capacity for acrylic acid and esters in SA is around 105 000 t/a. The SA market size in
2004 for acrylic acid and esters used in local applications such as emulsions was estimated at 25
000 tons. This indicates a significant excess in capacity.
b) Global Reality Test
SA is consuming around 0.7% of global acrylic acid and esters, which is in line with SA’s share of
global GDP.
c) Local Pricing Mechanism
The local producer’s domestic price is comparable with prices in USA and Asia and is derived
from the published ICIS LOR reference data as follows: The average of the lowest values quoted
for North West Europe (Free Delivered) and Asia Pacific on a CIF basis of the preceding week’s
FRIDGE Chemical Sector Upstream Pricing Practices – Final Report
Ozone Business Consulting (Pty) Ltd Page 323
published prices at time of determination. No costs are added to the USD Price in terms of Import
Parity Pricing input factors.
d) International Pricing Competitiveness
Butyl acrylate and ethyl acrylate domestic prices in SA have been consistently below, or at the
lower end of international prices. Glacial acrylic acid is the last product introduced by the local
producer, and initial pricing for local customers have been above international domestic prices, but
this gap has been closed towards May 2005.
e) Demand Elasticity
From a practical perspective, most acrylic acid and esters are eventually used in the paints,
adhesives and other industries in the form of emulsion polymers. In this application acrylic acid
and esters accounts for around 3 –5% of raw material costs, or around 2 –3% of selling prices. It
is therefore unlikely that a decrease in acrylic acid and esters prices will significantly increase
demand for paints and other products.
f) EVC
Insufficient data is available for reasonable analysis. The upstream operation has only been
operating for two years, while none of the downstream respondents provided any information.
10.2. Description of Identified Policy Options and impact upon upstream and downstream
sectors
10.2.1. Introduction
The available policy options to deal with upstream pricing practices have to be contextualised
within the broader policy framework that is already in place. Government’s broader industrial
development policy focuses upon three main areas, namely:
• Driving down costs
• Increased value adding
• Increased employment and equity

FRIDGE Chemical Sector Upstream Pricing Practices – Final Report
Ozone Business Consulting (Pty) Ltd Page 324
In addition, the existing policy framework also contains the following:
• The prioritisation of the chemical sector within government’s current industrial strategy for
spearheading growth and development for the country as a whole
• the dti chemical sector development strategy, which highlights the focus upon downstream
development and beneficiation of abundant feedstock while also ensuring contribution of
the chemical sector in terms of Government’s economic aspirations, namely
competitiveness, investment, exports, job creation and equity.
Although the downstream sample size was low, the policy options were workshopped. Where the
options related to pricing mechanisms it is recognized that the assessment could have been
compromised by the small sample size. Further policy options based on constraints to
downstream developments and other conclusions of the study which are also presented and
evaluated would not be affected by sample size.
The policy options are presented within the context of the overarching constraints to economic
growth as identified in the Accelerated Shared Growth Initiative as set out below:
• Relative currency volatility
• Cost and efficiency of national logistics system
• Shortage of suitably skilled labour and disjointed spatial settlement patterns
• Barriers to entry and competition on sectors of the economy
• Regulatory environment and burden on small business
• Deficiencies in state organisation, capacity and strategic leadership
• Size of domestic market and distance from major global markets.
The likely outcomes of these policy options are then tested against the results of the demand
elasticity models drivers, as well as the relative impact these options would have on the
profitability of the upstream and downstream sectors. From these results recommendations are
made of the possible policy options that would have the most significant contribution to the
strengthening and development of the complete value chain.

FRIDGE Chemical Sector Upstream Pricing Practices – Final Report
Ozone Business Consulting (Pty) Ltd Page 325
It is recognised that at national level interventions are being developed and implemented to
address the identified constraints. The micro economic constraints identified in ASGISA are
mirrored in the drivers identified above and the policy options below focus on the drivers that can
be influenced at a sectoral level.
10.3. Ensuring local availability of polymers
The study revealed that local availability of polymer in fact played a stronger role in the
development of the downstream industry than the price of the feedstock. Any policy options that
could affect the continued existence of the upstream industry therefore need to be considered with
great care.
Government has initiated a review of competition policy, and proposals in this regard will be
published for public comment. In considering this approach in the sectors covered by the study, it
is important to consider the impact of such approaches on existing domestic investment in the
upstream sectors.
Government has also indicated its intention to consider other policy options to influence up-stream
pricing practices. These policy options include:
• Removal of import tariff protection for products priced in terms of IPP.
• Linking future fiscal support to non-discrimination between domestic and export prices
• Withholding of imposition of anti-dumping and countervailing duties on products priced in
terms of IPP.
However the above intention has been qualified as being applicable to pricing practices that are
unfair. The study has shown that in all cases, upstream players are not making excessive profits
and are pricing in terms of general global practice for these value chains, which means that
current upstream pricing practices cannot be categorised as unfair. Due to the small sample size

FRIDGE Chemical Sector Upstream Pricing Practices – Final Report
Ozone Business Consulting (Pty) Ltd Page 326
of downstream respondents it was not possible to draw any broad conclusions of the extent of the
profitability of the downstream.
As the removal of import tariff protection is the only option about which sufficient information is
available to make an assessment, it is the only one that is discussed further in this report.
For the value chains included in the study, duty protection is currently only applicable to the
polymer products and titanium pigments (10% in all cases). In the other value chains the existing
rate of duty is 0%. Duties can be amended as follows:
• Complete removal of existing duties
• Reduction of duties
• Capping of duties, for example 10% up to a maximum of R500/ton
• Differential approach based on number of domestic suppliers
The impact of these options has to be assessed in the light of the outcome of the preceding
analysis. The immediate effect of duty lowering, or removal, is for local feedstock prices to fall,
based upon competitive pressure from imports. Import duties are inherent in the market price and
therefore their removal will lead to price reduction. The demand elasticity evaluation has indicated
that these lowered prices will not result in significant market expansion. In terms of profitability, the
upstream sector will be negatively affected.
This will, however, not lead to an increase in profitability of the downstream, as it is expected that
end-customers will insist on price adjustments as soon as they become aware of feedstock price
decreases. Also, as concluded above, the sales volumes will not increase materially due to the
low elasticity in the markets. The effect is therefore that downstream profitability would not
necessarily improve.
Upstream profitability could however decline. The EVC calculations for polymers indicate that a
1% price decrease will result in around 5% decline in PBIT, and 11% in EVC. A roughly 10%

FRIDGE Chemical Sector Upstream Pricing Practices – Final Report
Ozone Business Consulting (Pty) Ltd Page 327
decline will thus result in a 50% lowering of profitability and 110% reduction in EVC (this is
possible as EVC can be negative) and will hence substantially impact future investment. This
intervention would thus impact negatively on the local availability of feedstock, thus reducing this
positive driver of downstream development. The result of this is that investment in upstream
could be compromised, the extent depending on other factors described in this chapter.
In this regard, consideration should be given to the scenario, which could ultimately arise as a
result of this intervention, namely no local polymer production and all polymers are imported. The
polymer conversion industry would be significantly exposed to the global supply and demand
balances which would manifest itself in reliability of supply and would significant expose the
domestic market to price fluctuations and polymer merchants wishing to take advantage of the
import situation. In addition, current import logistics capacity is insufficient to handle the
importation of these vast quantities of polymer raw materials and the market would likely switch to
the importation of semi finished goods and final products which would significant damage the
South African polymer conversion industry.
10.4. Ensuring availability of polymer at competitive prices
In effect, this driver of downstream development is not simply a question of the price paid for the
feedstock but includes factors like, technical support in the application of the product by the
supplier, support in the safe handling and storage of the product, reduced need to store large
quantities and availability at short notice.
It is possible for government to intervene and set the price for these commodities and in this
regard could introduce a range of options which could include:
• Incorporation of domestic prices applied in other countries into domestic pricing models,
and
• Use a pricing model for locally made feedstock to take into account that manufacturing
costs are based on local factors [e.g. coal costs] and not crude oil.

FRIDGE Chemical Sector Upstream Pricing Practices – Final Report
Ozone Business Consulting (Pty) Ltd Page 328
These interventions would of course go beyond the government’s current macroeconomic policy
and could have negative unintended consequences in other sectors as a result of erosion of
investor confidence.
In other countries, like, China, Taiwan and South Korea (to name just three) where government
has proactively supported the development of downstream industries, interventions focussed in
promoting investment rather than regulating pricing practices.
In addition the assessment of demand elasticity has shown that in most of the value chains
demand is inelastic as far as movements in prices are concerned. Reducing feedstock and end-
product prices along the value chain is therefore not going to lead to significant growth in the
overall market size.
10.5. Promotion of exports of industrial and consumer goods
The prioritisation of the chemical sector within government’s current industrial strategy for
spearheading growth and development for the country as a whole has been further developed in
the dti chemical sector development strategy, which emphasizes downstream development and
beneficiation of feedstock while also ensuring contribution of the chemical sector in terms of
Government’s economic aspirations, namely competitiveness, investment, exports, job creation
and equity.
Government strategies recognise the reality demonstrated in the reality tests in this study, namely
that the market for downstream products has reached the economic level expected for the
national GDP level. Growth in these sectors must therefore be driven by exports of beneficiated
products or by sectors that are high consumers of polymers.
The chemical sector summit agreement and the chemical sector development strategy both
identify the need for the chemical sector to increase downstream beneficiation of both domestic
natural and manufactured raw materials. One of these is the potential downstream beneficiation of
polypropylene, which has been prioritised as a result of anticipated increased production volumes

FRIDGE Chemical Sector Upstream Pricing Practices – Final Report
Ozone Business Consulting (Pty) Ltd Page 329
of primary polypropylene polymer. In this regard the need to focus on growing export markets for
beneficiated polypropylene projects is an important departure point.
This proposal entails the identification and implementation of downstream beneficiation products
involving the “downstream-from-the-downstream” sectors. A good example is the manufacturing of
automotive bumpers, which would require the support of both the automotive manufacturers, as
well as the aftermarket parts and services sectors. It is clear that the trend will be increasingly in
this direction. Sasol Polymers currently provides technological support to the polymer conversion
industry at their Polymer Technology Centre in Modderfontein. This centre could be leveraged for
developing technologically sophisticated polypropylene products for exports. The government’s
support for the automotive industry via the MIDP could also be leveraged to obtain buy-in and co-
operation for the end-use sectors.
Preliminary exploration into the potential development of polypropylene value chain with the
downstream sector has revealed a number of critical success factors for export beneficiation,
which include:
• Existence of well developed channels to the market through for example, ownership by a
shareholder who is also the customer or distribution channel; relationship with an
international company;
• Existence of a strong export culture and many years of international trading experience and
the relationships associated with that;
• Access to technical and commercial skills from a relationship with an international partner;
• Ability to produce more sophisticated products, where this can be demonstrated and
technical and product support is included as part of the offering, rather than commodity
type products with little product or service differentiation;
• Long term commitment to markets to facilitate recovery of investment in compliance with
stringent technological requirements in some markets;
• Reliable raw material supply
• Access to competitive price for raw materials;

FRIDGE Chemical Sector Upstream Pricing Practices – Final Report
Ozone Business Consulting (Pty) Ltd Page 330
• Facilitated access to government export incentives; and
• Protection against unfair imports
The chemical sector development strategy recognises that the current range of incentives
available for growth and development of the sector may not be sufficiently well targeted to the
needs of the sector if growth targets are to be achieved. Successful interventions in other
countries should be used as benchmarks for improving domestic supply side measures.
All such incentives should be summarized and packaged in a format that is readily available and
easily understood, particularly to small investors and potential overseas investors.
The whole package should be promoted both in South Africa and abroad as the importance of
external links is borne out from the survey. It is likely that new foreign investment will be
necessary in order to get sufficient increase in beneficiated exports that is desired, and that it will
be necessary to attract strong participants who are already active in the target markets.
Another approach to export-focused downstream beneficiation is to identify and develop product-
based clusters, involving the “downstream-from-the-downstream” sectors. Such products include:
• Low value high volume products where the majority of the output is exported
• Products of global excellence
• Products that may be packed with other products to maximise freight logistic cost efficiency
• End-use products that will grow at multipliers to general economic growth
In respect of upstream players, a commitment to the additional effort required to support more
domestic customers than is the case for export, would be required.

FRIDGE Chemical Sector Upstream Pricing Practices – Final Report
Ozone Business Consulting (Pty) Ltd Page 331
10.6. Reducing freight logistics costs
The cost and efficiency of the national logistics system has been identified as one of the binding
constraints to growth and although it is being addressed at a national level, some specific sectoral
interventions are proposed. In addition national initiatives should be vigorously encouraged.
a) Supply chain price agreements
The proposal is to obtain supply chain price agreements: A large converter that also buys-in
components from smaller converters negotiates single polymer price for all. This would entail all
participating converters to pay the minimum price, based upon bulk volumes. There would be,
however, additional costs for the smaller converters in terms of bulk-braking and own
transportation. This approach could be encouraged on a voluntary basis amongst downstream
players, but the overall benefit is expected to be small.
b) Shared approaches to logistics
The geographic disadvantage for downstream SA exporters can be countered by innovative
logistic approaches whereby, for example, lightweight plastic products can be transported with
heavier metal based products to optimise container space. The policy option is therefore for
Government to support such logistic activities, which will increase competitiveness in the export
market.
10.7. Increasing innovation capability of polymer converters
The Chemical Sector Summit Agreement includes an agreement to strengthen support for
innovation in the sector as a whole. It is proposed that mechanisms to support innovation in all
value chains be investigated and implemented.
Transfer of technology by international investors and relationships between upstream and
downstream players which promote innovation should be promoted through specific incentives.
FRIDGE Chemical Sector Upstream Pricing Practices – Final Report
Ozone Business Consulting (Pty) Ltd Page 332
a) Supporting investment in modern processing equipment
The policy option is for Government to incentivise in a targeted way downstream operations to
invest selectively in technologically advanced equipment in order to improve competitiveness, but
also to develop innovative, high value-added products. Investment in generic equipment should be
discouraged.
c) Supporting skills development
It is proposed that the specific skills development demands from these value chains, be
incorporated into the sector skills plans of the MERSETA and CHIETA and that the Government
representatives of the boards of these SETAs ensure that this is done.
Scarce skills identified in these sector skills plans should be prioritised as part of the JIPSA
initiative.
d) Improvement in business environment
In addition to the ongoing national initiatives in this regard, specific sectoral policy interventions
that could be considered to support this driver include tax incentives, support for export and
innovation. It should be recognised that countries where downstream sectors are thriving
generally have relatively low taxes and promotion of a favourable business environment by
government.
10.8. Increased duty protections for downstream products
The downstream sectors generally already have duty protection. For example, in plastic products,
there are duties in place for most of the tariff headings, typically in the 15 – 20% range. The
increased duty protection would serve to counter the high cost of feedstock, by increasing product
prices. This will improve the profitability of end-use sectors, as well as replace imports to an
extent. Demand for product is not expected to decrease significantly due to price inelasticity. This
would further result in increased local upstream feedstock consumption. However, it may result in

FRIDGE Chemical Sector Upstream Pricing Practices – Final Report
Ozone Business Consulting (Pty) Ltd Page 333
a decrease in exports, as downstream converters would tend to become less competitive in export
markets. This option is, however, in contradiction with general trade liberalisation, and is unlikely
to find favour.
The major advantage is expected to be in downstream profitability, with some market growth
based upon import substitution. This growth is not sustainable, and downstream competitiveness
will decline. There will be no driver to decrease costs and improve efficiencies for competitiveness
in the export market.
10.9. Fast-track approach to anti-dumping investigations at downstream level
This proposal is primarily aimed at assisting downstream companies that are affected by anti-
dumping activities from importers. By fast-tracking these activities it will be possible for
downstream companies to improve their market share, as well as profitability, leading to an
environment that will be more conducive to investment.
A fast-track approach to anti-dumping investigations at downstream level could have a positive
effect on all value chains both up and downstream.
10.10 Prevention of illegal imports
In addition to the fast tracking of antidumping investigations, a more comprehensive approach to
prevention of illegal imports should be developed and implemented on the basis of a partnership
approach between Government and stakeholders.
FRIDGE Chemical Sector Upstream Pricing Practices – Final Report
Ozone Business Consulting (Pty) Ltd Page 334
APPENDIX 1: DEMAND ELASTICITY
Introduction
In order to make valid comparisons of the impact of selling price changes on both the upstream
and downstream levels of sectors of the chemical industry, it is necessary to determine the
relationship that exists between selling price changes, and changes in sales to customers.
Technically, this relationship is known as the "elasticity of demand". Figure 1 below provides an
example of a demand elasticity curve. Price changes are reflected on the vertical x-axis, whilst the
corresponding changes in quantities sold are reflected on the horizontal y-axis. Both price and
sales changes are reflected in percentages.
Figure A1.1: Example of a Demand Elasticity Curve
Figure 1 indicates that, for each percentage increase in price, there is a corresponding decrease
in sales volume. As such, the demand elasticity curve falls from left to right.
This study has calculated an historical and a projected future demand elasticity curve for both of
the upstream and downstream businesses analysed.
Calculating the Historical Demand Elasticity Curves
In order to calculate an historical demand elasticity curve and both upstream and downstream
respondents were asked to provide information on up to ten historical price changes. Table 1
below reflects the details of the information that respondents were required to provide.

FRIDGE Chemical Sector Upstream Pricing Practices – Final Report
Ozone Business Consulting (Pty) Ltd Page 335
Table A1.1: Historical Price and Sales Change Input Data
Most Recent Selling Price
Change
- 1 - 2 - 3 - 4 - 5 - 6 - 7 - 8 - 9
Selling price Change Date
Selling price Change %
Gross Sales Value
Change in Capacity Utilisation %
Change in Employment %
Reason for Selling price Change
The above table required that respondents reflect the date of each selling price change, i.e. the
month and year of each selling price change. Selling price changes were provided as percentage
changes, i.e. - 5%, + 10%, etc, and not Rand value changes.
In providing gross sales value, respondents were required to provide the total value of sales that
occurred between each selling price change date, i.e.
• Most recent selling price change date: March 2005
• Next most recent selling price change date (i.e. - 1): April 2004
• Total gross sales value for the period April 2004 to February 2005: R 37 million
Using this information, it was possible to calculate a percentage change in gross sales value from
one price change period to the next.
FRIDGE Chemical Sector Upstream Pricing Practices – Final Report
Ozone Business Consulting (Pty) Ltd Page 336
In providing capacity utilisation percentages, respondents were required to provide the percentage
utilisation of their total production capacity that resulted from each change in price and gross sales
value, i.e. Period 1: 70% capacity utilisation, Period 2: 80% capacity utilisation, etc. Similarly,
respondents were also required to provide the percentage change in the number of people they
employed that resulted from each change in price and gross sales value.
In providing reasons for selling price changes, respondents were required to select from one of
the following alternatives:
• Normal, inflation-based periodic selling price increase
• Selling price change necessitated by a change in the Rand/US$ exchange rate
• Selling price change necessitated by a change in local interest rates
• Selling price change necessitated by a change in raw material input prices
• Change in Market prices
• Other
Historical price and sales volume change data provided by the respondent companies was
subjected to statistical analysis and separate historical demand elasticity curves were calculated
for the upstream and downstream companies. In each instance, a single demand elasticity curve
was calculated for each level of a particular sector.
Calculating Projected Future Demand Elasticity Curves
In order to calculate projected future demand elasticity curves, respondents were required to
provide an estimate of what they thought would happen to their sales volumes over the next 12 to
18 months if they were to either increase or decrease their selling prices by the percentages
reflected in the table below. In doing so, respondents were asked to assume that no other
possible factors that could influence customers’ buying decisions would change during this period
(i.e. Rand/US$ exchange rates, local interest rates, product quality, the launch of substitute
products, customer product preferences, etc).

FRIDGE Chemical Sector Upstream Pricing Practices – Final Report
Ozone Business Consulting (Pty) Ltd Page 337
Table A1.2: Projected Future Price and Sales Change Input Data
Percentage Selling Price Change
Sales Volume to Local Customers (SVLC)
%
Sales Volume to Export Customers
%
Import Replacement Sales as a Percentage of SVLC
%
+ 20%
+ 10%
+ 5%
0%
- 5%
- 10%
- 20%
Table 2 indicates that respondents were required to provide projections of changes in sales
volumes to both selling price increases and price decreases. Furthermore, respondents were also
required to provide separate projections of sales volumes to local customers and export
customers, as well as an estimate of the percentage of sales volume to local customers that would
result from import replacement sales, i.e. assuming a respondent had indicated that sales volume
to local customers would increase by 30% as a result of a 20% decrease in its selling price, they
would indicate that approximately 70% of the 30% increase in sales volume would be accounted
for by import replacement sales.
Projected future price and sales volume change data provided by respondents was subjected to
statistical analysis, and separate projected future demand elasticity curves were calculated for the
upstream and downstream levels of a particular sector. In both cases, one demand elasticity curve
was calculated for each level.
Demand Elasticity Results for Polymers
Empirical findings from a recent study by Fedderke (2005) suggested that price elasticity of
demand in Sasol’s polyethylene low density (LDPE) as well as linear low density (LLDPE),
polyvinyl chloride (PVC) and polypropylene (PP) markets in South Africa is respectively (in

FRIDGE Chemical Sector Upstream Pricing Practices – Final Report
Ozone Business Consulting (Pty) Ltd Page 338
absolute terms) 0.3, 0.7, 1, and 0.2 %. These results suggest that for example in the PVC market,
a 1% decrease in the price would result in a proportional increase in the market size.
This report is concerned with testing the results mentioned above by applying the same
methodology, on the same sample period but using a slightly different set of variables. Given time
constraints and the problem with the availability of data, the following exercise only tests the
results for the PVC market.
Figures (see data from Sasol) suggest that Sasol has substantial market power in the PVC market
in South Africa throughout the sample period. Economic theory states that under substantial
market share profit maximization, with negligible marginal cost of production, demands operating
on the domestic demand curve where the price elasticity of demand is unity in absolute terms.
That is 1 % increase in price will bring about a 1% decline in the demand for PVC and vice-versa.
Methodology and Data
Considering the interactions that exist between supply and demand of output in determining the
equilibrium price and quantity in the market, isolating the impact of price on demand requires that
the demand and supply curves in the market be separately identified. As in the study by Fedderke
(2005), Multivariate Vector Error Correction methodology is used in this case to estimate both the
demand and the supply side of the PVC market simultaneously using monthly observations on the
sample-period 1994-2004.
The following time series were obtained from Sasol and used in natural log transform except for
the import duties on PVC.
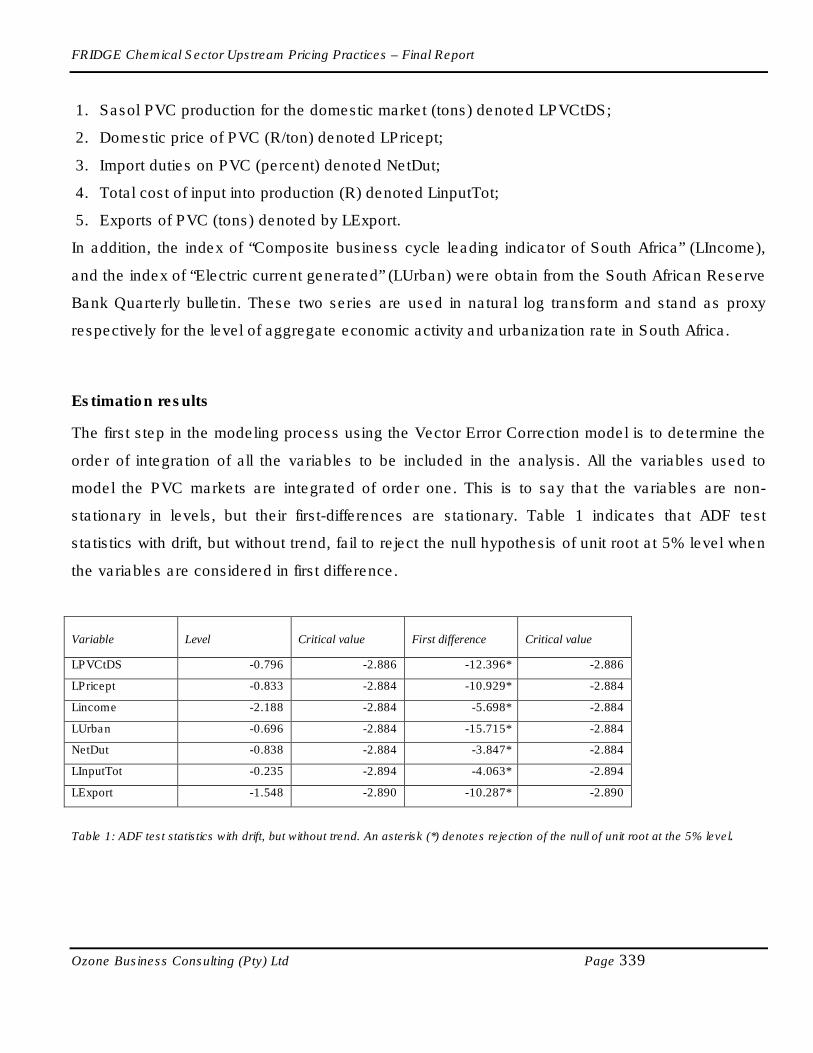
FRIDGE Chemical Sector Upstream Pricing Practices – Final Report
Ozone Business Consulting (Pty) Ltd Page 339
1. Sasol PVC production for the domestic market (tons) denoted LPVCtDS;
2. Domestic price of PVC (R/ton) denoted LPricept;
3. Import duties on PVC (percent) denoted NetDut;
4. Total cost of input into production (R) denoted LinputTot;
5. Exports of PVC (tons) denoted by LExport.
In addition, the index of “Composite business cycle leading indicator of South Africa” (LIncome),
and the index of “Electric current generated” (LUrban) were obtain from the South African Reserve
Bank Quarterly bulletin. These two series are used in natural log transform and stand as proxy
respectively for the level of aggregate economic activity and urbanization rate in South Africa.
Estimation results
The first step in the modeling process using the Vector Error Correction model is to determine the
order of integration of all the variables to be included in the analysis. All the variables used to
model the PVC markets are integrated of order one. This is to say that the variables are non-
stationary in levels, but their first-differences are stationary. Table 1 indicates that ADF test
statistics with drift, but without trend, fail to reject the null hypothesis of unit root at 5% level when
the variables are considered in first difference.
Variable Level Critical value First difference Critical value
LPVCtDS -0.796 -2.886 -12.396* -2.886
LPricept -0.833 -2.884 -10.929* -2.884
Lincome -2.188 -2.884 -5.698* -2.884
LUrban -0.696 -2.884 -15.715* -2.884
NetDut -0.838 -2.884 -3.847* -2.884
LInputTot -0.235 -2.894 -4.063* -2.894
LExport -1.548 -2.890 -10.287* -2.890
Table 1: ADF test statistics with drift, but without trend. An asterisk (*) denotes rejection of the null of unit root at the 5% level.
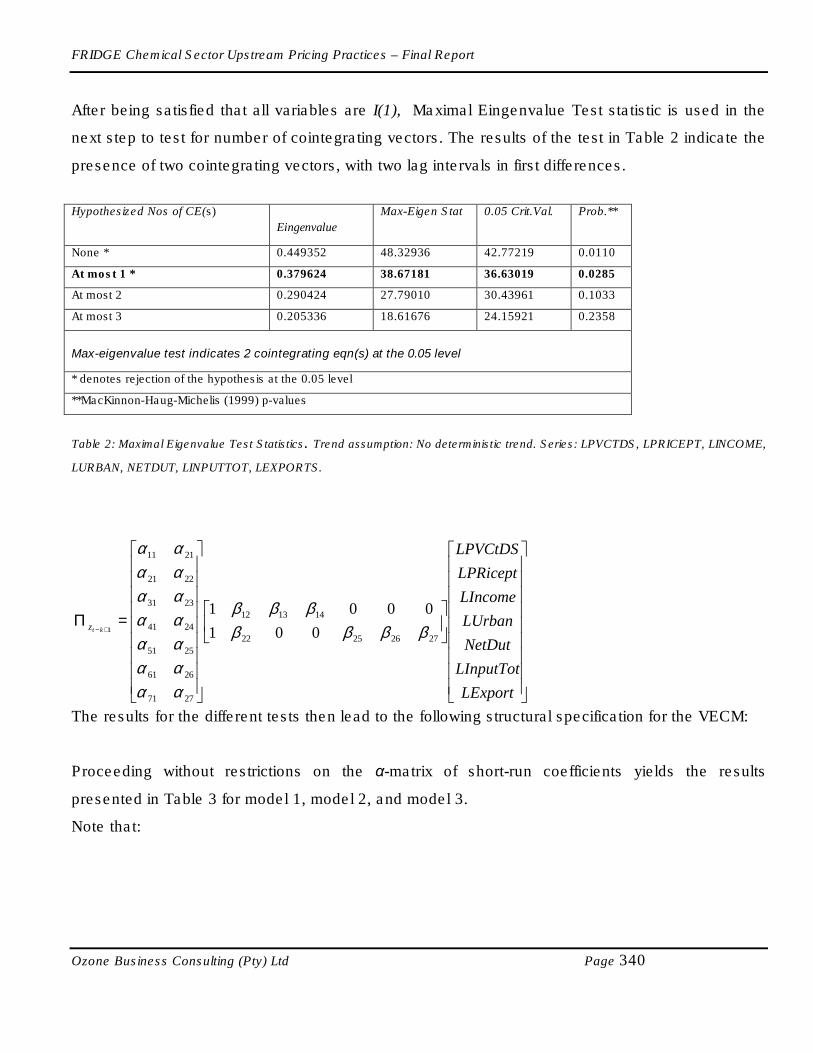
FRIDGE Chemical Sector Upstream Pricing Practices – Final Report
Ozone Business Consulting (Pty) Ltd Page 340
After being satisfied that all variables are I(1), Maximal Eingenvalue Test statistic is used in the
next step to test for number of cointegrating vectors. The results of the test in Table 2 indicate the
presence of two cointegrating vectors, with two lag intervals in first differences.
Hypothesized Nos of CE(s)
Eingenvalue
Max-Eigen Stat 0.05 Crit.Val. Prob.**
None * 0.449352 48.32936 42.77219 0.0110
At most 1 * 0.379624 38.67181 36.63019 0.0285
At most 2 0.290424 27.79010 30.43961 0.1033
At most 3 0.205336 18.61676 24.15921 0.2358
Max-eigenvalue test indicates 2 cointegrating eqn(s) at the 0.05 level
* denotes rejection of the hypothesis at the 0.05 level
**MacKinnon-Haug-Michelis (1999) p-values
Table 2: Maximal Eigenvalue Test Statistics. Trend assumption: No deterministic trend. Series: LPVCTDS, LPRICEPT, LINCOME,
LURBAN, NETDUT, LINPUTTOT, LEXPORTS.
The results for the different tests then lead to the following structural specification for the VECM:
Proceeding without restrictions on the α-matrix of short-run coefficients yields the results
presented in Table 3 for model 1, model 2, and model 3.
Note that:
=Π+−
LExport
LInputTot
NetDut
LUrban
LIncome
LPRicept
LPVCtDS
ktz
27262522
141312
2771
2661
2551
2441
2331
2221
2111
001
0001
1 ββββ
βββ
αα
αα
αα
αα
αα
αα
αα

FRIDGE Chemical Sector Upstream Pricing Practices – Final Report
Ozone Business Consulting (Pty) Ltd Page 341
1. Model 1 is estimated with no restriction on the β-matrix of long-run coefficients
2. Model 2 is estimated with the price elasticity of demand for PVC set to –1
3. Model 3 is estimated with the price elasticity set to –1 and assuming that variable costs are not
material to the supply decision.
Model 1 Model 2 Model 3
β β β
LPVCtDS 1.00 1.00 1.00 1.00 1.00 1.00
LPricept 1.26 (0.27250)
-0.82 (0.18553)
1.00 -0.73 (0.15622)
1.00 -1.19 (0.03211)
LIncome -3.97 (0.67688)
0.00 -3.45 (0.40727)
0.00 -3.57 (0.40083)
0.00
Urban -0.38 (0.45123)
0.00 -4.42 (0.40399)
0.00 -0.30 (0.39760)
0.00
NetDut 0.00 0.81 (0.16967)
0.00 0.75 (0.13608)
0.00 0.78 (0.19828)
LInputTot 0.00 -0.29 (0.14777)
0.00 -0.35 (0.12383)
0.00 0.00
LExport 0.00 0.13 (0.02968)
0.00 0.11 (0.02466)
0.00 0.12 (0.03589)
Table 3: PVC estimation results
These are the main results presented in Table 3 from the estimation of the Vector Error Correction
model:
• Demand for PVC responds negatively to “price” with an elasticity of –1.26, -1, -1
respectively in model 1, 2, and 3. The coefficients are statistically significant.
• Demand responds positively to “income” with an elasticity of 3.97, 3.45, and 3.57
respectively in model 1, 2, and 3. The coefficients are also all statistically significant.
• Demands also respond positively to “urbanisation” but the coefficients are not
significant.
• Supply responds positively to “price” in all three models wit elasticity: 0.82, 0.73,
and 1.19. All coefficients are statistically significant.
• Supply responds negatively to “import duties” with an elasticity of –0.81, -0.75, and
–0.78 respectively in model 1, 2, and 3. The coefficients are statistically significant.
• Supply responds positively to “input cost” with elasticity of 0.29 and 0.34 in model 1
and 2. Although the coefficients are statistically significant, they are theoretically
incoherent.

FRIDGE Chemical Sector Upstream Pricing Practices – Final Report
Ozone Business Consulting (Pty) Ltd Page 342
• Finally as one could theoretically expect, supply on domestic market responds
negatively to export in the three models with elasticity: -0.13, -0.11, and -0.12. All
coefficients are statistically significant.
It can be concluded that the findings of the analysis in this report are also supportive of the
results in Fedderke’s study that the best estimate of the price elasticity of demand in the PVC
market is not statistically different from –1. This is also true for the sign of other variables in the
model.
However, results do differ with respect to exports. Contrary to the positive relation between
exports and output supplied in the study by Fedderke, the present study found a negative relation
between exports and output supply. This is theoretically plausible if one considers the drivers of
the export decision in the petrochemicals markets. In this industry exports are switch of domestic
output from domestic markets to foreign. Hence the negative relationship between exports and
output supplied.

FRIDGE Chemical Sector Upstream Pricing Practices – Final Report
Ozone Business Consulting (Pty) Ltd Page 343
APPENDIX 2: ECONOMIC VALUE CREATED (EVC)
Introduction
Given the relationship that exists between sales volumes and price (as measured in this study by
the demand elasticity curves described in Appendix 1), the challenge is to find an equitable
method of comparing the impact on the financial performance of upstream and downstream
businesses of the selected sectors of the chemical industry brought about by changes in selling
prices and sales volumes. The measure used must be unbiased and objective, and based on
readily available data. It must also be:
• Applicable to all types of business - upstream and downstream businesses, trading and
manufacturing businesses, etc.
• Insensitive to size of business,
• Applicable to capital or labour intensive businesses,
• Unaffected by age of assets in upstream or downstream business,
• Applicable across vertically integrated businesses, and
• A validated, proven methodology
The measure that meets the above criterion that has been used in this study is Economic Profit,
also known as Economic Value Created (EVC).
Historic approach
In order to eliminate the subjective bias implicit in forecasting, and to deal with issues related to
the age of and the future replacement cost of assets in different businesses, the methodology
used was to measure the impact, had prices and volumes been changed historically.
EVC defined
EVC is an economic, not an accounting concept. In order to measure it, one must look not only
within the company, but also into the industry and the economy. Economic value created is a
practical measure of the company's operating performance that correlates with the value of the

FRIDGE Chemical Sector Upstream Pricing Practices – Final Report
Ozone Business Consulting (Pty) Ltd Page 344
company. What makes it so relevant is that it takes into account a cost that conventional
measures exclude, namely, the cost of equity. Economic value created is simply the before
interest and after tax operating profit, R, minus the total annual cost of capital, K. It is expressed
as follows.
EVC = R – K
In this model,
R is the stream of cash available to the providers of capital, and
K is the total cost of the capital used, including the cost of equity and debt
The weighted average cost of capital (K) would normally vary across industries and over time.
EVC is relatively insensitive to variations in K in the industries measured.
This study seeks to determine the relative impact of pricing policies between upstream and
downstream protagonists. Accordingly the view was taken that a single K could be applied as a
consistent-and-equal benchmark for all companies in the study. This approach eliminates the
moving benchmark effect of applying a different K to each company in each year.
Determination of K - Weighted average cost of capital %
Target debt as % of capital 50
Risk free rate of return % 12
Market rate of return % 20
Risk index (beta) 1.5
Cost of equity % 24
Marginal debt rate % 15
Marginal corporate tax rate % 30
Cost of debt % 10.5
K, Weighted average cost of capital % 17.25

FRIDGE Chemical Sector Upstream Pricing Practices – Final Report
Ozone Business Consulting (Pty) Ltd Page 345
Computing EVC
The following flowchart and simplified figures demonstrate how EVC is computed. Note that the
figures used are for demonstration purposes only, and do not represent an actual business. In the
example provided, it can be seen that a normal accounting measure does not take the cost of
equity into account, whereas the EVC computation takes this cost into account. Note also the fact
that the accounting measure shows a profit, whilst the EVC method shows a loss. This is an
important observation and demonstrates the impact on performance of taking into account all
business costs.
37
CoSOver-heads
NOPATEc
Prftblty%
R% K% EVC%Open
CapitalEVC
Currentassets
Fixedassets
Net assets
Opn capturnover
Sales
SalesGross profit
Currentliabs
Workingcapital
EVC% Flowchart
* *
+
= =
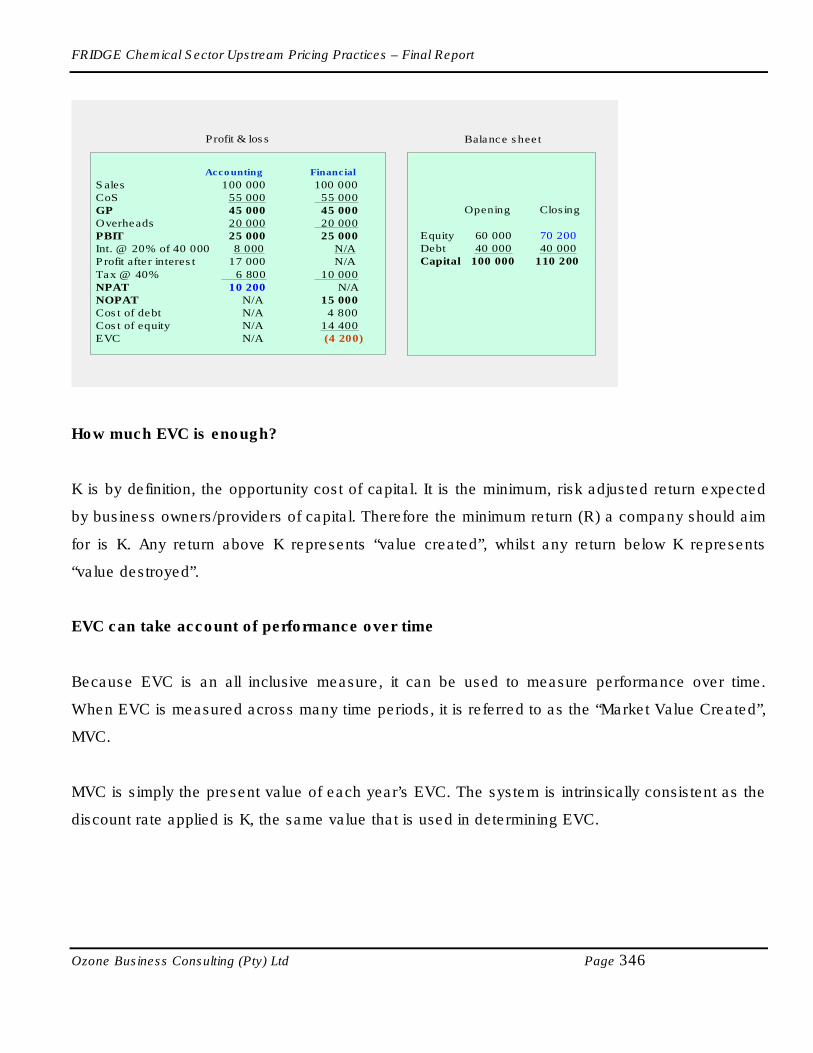
FRIDGE Chemical Sector Upstream Pricing Practices – Final Report
Ozone Business Consulting (Pty) Ltd Page 346
53
Profit & loss
Opening Closing
Equity 60 000 70 200Debt 40 000 40 000Capital 100 000 110 200
Balance sheet
Accounting Financial
Sales 100 000 100 000CoS 55 000 55 000GP 45 000 45 000Overheads 20 000 20 000PBIT 25 000 25 000Int. @ 20% of 40 000 8 000 N/AProfit after interest 17 000 N/A
Tax @ 40% 6 800 10 000NPAT 10 200 N/ANOPAT N/A 15 000Cost of debt N/A 4 800Cost of equity N/A 14 400EVC N/A (4 200)
How much EVC is enough?
K is by definition, the opportunity cost of capital. It is the minimum, risk adjusted return expected
by business owners/providers of capital. Therefore the minimum return (R) a company should aim
for is K. Any return above K represents “value created”, whilst any return below K represents
“value destroyed”.
EVC can take account of performance over time
Because EVC is an all inclusive measure, it can be used to measure performance over time.
When EVC is measured across many time periods, it is referred to as the “Market Value Created”,
MVC.
MVC is simply the present value of each year’s EVC. The system is intrinsically consistent as the
discount rate applied is K, the same value that is used in determining EVC.

FRIDGE Chemical Sector Upstream Pricing Practices – Final Report
Ozone Business Consulting (Pty) Ltd Page 347
Data Agglomeration
In essence, the objective is to determine the impact of import parity pricing across both the
upstream and downstream elements of the chemical industry. Accordingly, financial data from
upstream companies in the research sample has been agglomerated, as was the financial data
from downstream companies. The effect is that no single company can be identified in the report.
Note Well
The word “Profitability” has been used frequently by Government as a proxy for value or profit in
the CPG meetings. Profitability is a defined ratio meaning “Profit Before Interest and Tax / Sales”.
Accordingly in the context of determining overall performance, or value created, it is not
applicable.
Value Creation
Accounting measures do not correlate well with share price. The accounting model is precise but
inadequate. Value creation is a long term economic, not an accounting, concept. Value creation
takes account of risk and the cost of equity and looks beyond the company into the market. As an
economic measure it can also be used to take account of the time value of earnings. Although
accounting measures are precise they do not measure value. Therefore when an accounting
measure is used as a proxy for value it will be precisely wrong. EVC is the closet proxy for
measuring value and therefore the choice is between being precisely wrong or approximately
right.
Correlating Measures of Value With Actual Share Price
The following table shows the most frequently used measures used to predict share price and the
correlation with actual share price. (Modigliani and Miller –Nobel Prize research)

FRIDGE Chemical Sector Upstream Pricing Practices – Final Report
Ozone Business Consulting (Pty) Ltd Page 348
Measure Correlation with actual share value
EVA (which we call EVC) 50%
Return on Equity 35%
Cash Flow Growth 22%
Earnings per Share Growth 18%
Asset Growth 18%
Dividend Growth 16%
Sales Growth 9%
Highest Correlation
It is quite clear from the table that EVC provides the highest correlation with actual share price. It
is not a short term accounting measure. It is a long term economic measure that takes account of
business earnings, capital employed, intrinsic company risk, extrinsic market risk, the cost of
equity and debt and the time value of money. It is not precise but it provides the closest proxy
available for actual share price. It will provide the same result as IRR (the internal rate of return)
but is easier to follow on a year by year basis.
Other Measures Used to Predict Share Price
• Net Profit after Tax, (Not Profitability). Profit is a one year accounting measure that takes
no account of the capital employed
• Return on Net Assets. This is the same as Return on Capital. They are one year
accounting ratios and do not apply for longer terms
• Return on Equity. This is an accounting ratio which does take account of capital gain or
dividends received by shareholders. Therefore it does not as the name suggests measure
the actual return to shareholders, is also limited to the short term.

FRIDGE Chemical Sector Upstream Pricing Practices – Final Report
Ozone Business Consulting (Pty) Ltd Page 349
Market Value Created
The actual market value of a company is the price of all its shares in the market. In an efficient
market the actual market value will equal the intrinsic or calculated value. The difference between
actual market value and its net assets is market value created (or destroyed). In this report
intrinsic value has been calculated using the net present value of each years EVA. This is a
classic method and if rigorously applied will give the same result as IRR. No other method
available to date will yield a better proxy for value.
Key References
Key references used to determine the most appropriate measure of value are;
• Hamanda, R. S. 1972. The effects of the Firms Capital Structure on the Systematic Risk of Common Stock. Journal of Finance May: 435-452.
• Modigliani, F, and Miller, M.H. 1961. Dividend Policy, Growth and the Valuation of Shares. Journal of Business, October: 411-433
• Mike Ward & Allan Price, 2007. Turning Vision into Value. Van Schaik
• Stewart, B. IIIG. 1991. The Quest for Value. London: Harper-Collins.
EVC Results for Combined Polymers
Due to the integration of production facilities, it was not possible to obtain the required information
for the EVC analysis at individual product level. The analysis was therefore conducted on the
combined polymers upstream and downstream sectors for the period 1997 to 2005.
Upstream Polymers
The following EVC graph represents the actual EVC values in each year between 1997 and 2005
for upstream polymers. The graph indicates that the return on capital was less than the weighted
average cost of capital as measured by K (17.25) more frequently than it was equal or above K.
However, this does not mean the upstream has been making losses. This is a clear indicator that
the current pricing practices of the upstream sector are not resulting in high levels of profitability,
as measured against the total cost of capital, K. It should be noted furthermore that the EVC

FRIDGE Chemical Sector Upstream Pricing Practices – Final Report
Ozone Business Consulting (Pty) Ltd Page 350
values shown on the graph below represent both upstream polymers manufacturers, namely, Dow
Plastics and Sasol Polymers.
In the case of Sasol, the focus for this study was on Sasol Polymers, the polymers manufacturing
unit within the group and not on the whole group. Therefore profits of Sasol Limited as a group
cannot be equated to those of Sasol Polymers. Sasol Polymers, situated within Sasol’s chemical
businesses, is a separate company within Sasol Group, and has a supply agreement for raw
material from another Sasol Group company, Sasol Synfuels. The supply of these raw materials is
based upon a pricing mechanism that is related to the equivalent fuel value. Therefore, Sasol
Synfuels sells the feedstock at a price that they would have realised in the marketplace if it was
converted to saleable fuels. This means there is no cross-subsidization between fuels and
polymers businesses.
EVC Results – Upstream Polymers
Upstream Polymers
-2000000
-1500000
-1000000
-500000
0
500000
1000000
1500000
1997 1998 1999 2000 2001 2002 2003 2004 2005
1997 to 2005
EV
C
EVC
The following IVC graph represents the intrinsic value calculated for upstream polymers. IVC is
starting capital plus the cumulative value of each year’s EVC, discounted to present time. In this
instance, “present time” is 1997.

FRIDGE Chemical Sector Upstream Pricing Practices – Final Report
Ozone Business Consulting (Pty) Ltd Page 351
The graph illustrates the cumulative effect of economic value calculated by the end of each year
between 1997 and 2005. When EVC calculations shows returns that are lower than K, the
weighted average cost of capital over long periods of time as in the polymer business below it
becomes increasingly more difficult to reverse the accumulated returns that are lower than K. The
intrinsic value shows large accumulated returns that are below K by 2005.
IVC Results – Upstream Polymers
Upstream Polymers
-2500000
-2000000
-1500000
-1000000
-500000
0
500000
1000000
1500000
1 2 3 4 5 6 7 8 9
1997 to 2005
IVC
IVC
The following graph illustrates the relative sensitivity of EVC and Profit before Interest and Tax
(PBIT) to Selling Price, Sales Volume, Cost of Sales and K in upstream polymers. The bar groups
indicate by what percentage PBIT and EVC would change for a one percent improvement in
Prices or Sales Volumes or Cost of Sales or K. (Note: The inverse is also true, i.e. a 1% decrease
in values)

FRIDGE Chemical Sector Upstream Pricing Practices – Final Report
Ozone Business Consulting (Pty) Ltd Page 352
Sensitivity of EVC and Profit Before Interest and Tax (PBIT) to Selling Price, Sales Volume, Cost of Sales and
K – Upstream Polymers
Upstream Polymer Relative Sensitivity
0
2
4
6
8
10
12
14
1%
Price
1%
Volume
-1%
CoS
-1%
K
% Change in input
% c
han
ge i
n p
erf
orm
an
ce
PBIT EVC
Note that the inverse of what this graph shows is also true. That is, PBIT and EVC would change by the same percentage points but in the opposite direction for a one percent decline in Prices or Volumes or one percent increase in Cost of Sales or K.
Note the following:
• EVC is relatively insensitive to K
• EVC (and PBIT) are relatively insensitive to Sales Volume
• EVC (and PBIT) are very sensitive to Selling Price and Cost of Sales
Downstream Polymers
No financial data was received for Polypropylene EVC analysis. In total four companies,
accounting for around 30% of the polyethylene market based on consumption volumes, provided
financial data. However, some of the data (two companies) did not correspond historically with the
information provided by upstream companies. For PVC, only one company provided financial data

FRIDGE Chemical Sector Upstream Pricing Practices – Final Report
Ozone Business Consulting (Pty) Ltd Page 353
and the data did not corresponded historically with the information provided by upstream
companies.
The following EVC graph represents the actual values calculated in each year between 1997 and
2005 for combined downstream polymers. The graph indicates that the return on capital as
measured against the cost of capital, K, was below K in every year except 1997 and 1999.
However, this does not mean the downstream has been making losses all these years.
EVC Results – Downstream Polymers
Downstream Polymers EVC
-5000000
-4000000
-3000000
-2000000
-1000000
0
1000000
2000000
3000000
1 2 3 4 5 6 7 8 9
1997 to 2005
EV
C
EVC
Note: This graph represents all polymers’ historical 9 years data as given by 3 respondents, which is equivalent of 6% of the market based on their consumption of polymers and not sales. Four other respondents provided financial data for shorter (5 years or less) time periods.
The following IVC graph represents the intrinsic value calculated for downstream polymers. The
graph illustrates the cumulative effect of calculated returns by the end of each year. The IVC
graph shows returns consistently lower than K by 2005.
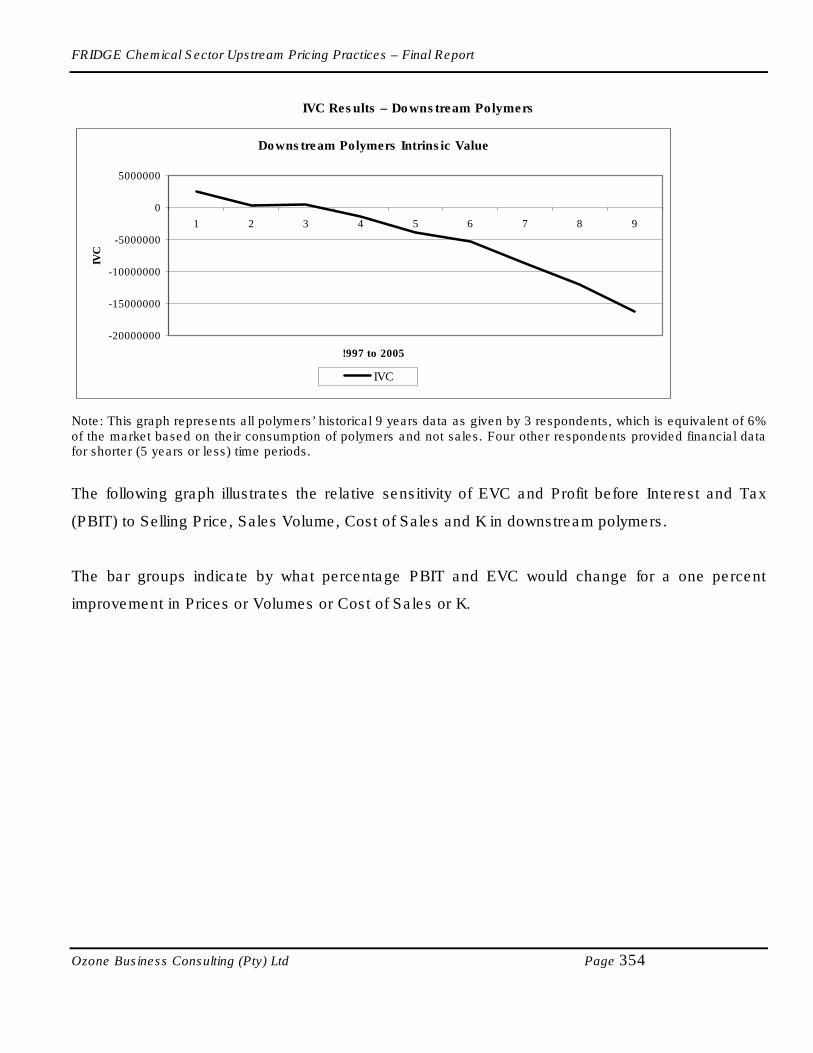
FRIDGE Chemical Sector Upstream Pricing Practices – Final Report
Ozone Business Consulting (Pty) Ltd Page 354
IVC Results – Downstream Polymers
Downstream Polymers Intrinsic Value
-20000000
-15000000
-10000000
-5000000
0
5000000
1 2 3 4 5 6 7 8 9
!997 to 2005
IVC
IVC
Note: This graph represents all polymers’ historical 9 years data as given by 3 respondents, which is equivalent of 6% of the market based on their consumption of polymers and not sales. Four other respondents provided financial data for shorter (5 years or less) time periods.
The following graph illustrates the relative sensitivity of EVC and Profit before Interest and Tax
(PBIT) to Selling Price, Sales Volume, Cost of Sales and K in downstream polymers.
The bar groups indicate by what percentage PBIT and EVC would change for a one percent
improvement in Prices or Volumes or Cost of Sales or K.

FRIDGE Chemical Sector Upstream Pricing Practices – Final Report
Ozone Business Consulting (Pty) Ltd Page 355
Sensitivity of EVC and Profit before Interest and Tax (PBIT) to Selling Price, Sales Volume, Cost of Sales and
K – Downstream Polymers
Downstream Polymer Relative Sensitivity
0
2
4
6
8
10
12
1% 1% -1% -1%
Price Volume CoS K
% Change in Input
% C
ha
ng
e i
n P
erf
orm
an
ce
PBIT EVC
Note that the inverse of what this graph shows is also true. That is, PBIT and EVC would change by the same percentage points but in the opposite direction for a one percent decline in Prices or Volumes or one percent increase in Cost of Sales or K.
Note the following;
• EVC is insensitive to K
• EVC (and PBIT) are insensitive to Sales Volume
• EVC (and PBIT) are insensitive to Cost of sales
• EVC is relatively sensitive to Selling Price
• PBIT is very sensitive to Selling Price
It can be expected that a symmetrical result will be obtained for a one percent decline or increase
in Prices or Volumes or Cost of Sales or K.
Although statistically insignificant, the EVC analysis of combined polymers indicates that the
return on capital was lower than the weighted average cost of capital, K in every year except 1997
and 1999. This situation means that the downstream sector is not making super profits either.

FRIDGE Chemical Sector Upstream Pricing Practices – Final Report
Ozone Business Consulting (Pty) Ltd Page 356
IVC Compared in Upstream and Downstream Polymers
The following graph illustrates the intrinsic value calculated for upstream and downstream
polymers.
IVC Comparison – Upstream & Downstream Polymers
IVC : Upstream and Downstream Polymers
-25000000
-20000000
-15000000
-10000000
-5000000
0
5000000
10000000
15000000
1 2 3 4 5 6 7 8 9
1997 to 2005
IVC
Upstream Polymers IVCDownstream Polymers IVC
The graph clearly illustrates that both upstream and downstream companies have been getting
returns that are below K (the weighted average cost of capital) consistently.
EVC of Publicly Traded Downstream Company
As a result of lack of data from the downstream companies, a set of results from one of the listed
companies on the Johannesburg Stock Exchange was used for an additional EVC analysis, the
results of which the results are shown in the following graph. The EVC graph represents the actual
values calculated for combined polymers in each year between 2000 and 2005 for this listed
company. The graph indicates that the business is volatile, indicating large swings in the EVC
value year by year. This is confirmation that the results should not be seen in isolation but rather
throughout the full commodity cycle.

FRIDGE Chemical Sector Upstream Pricing Practices – Final Report
Ozone Business Consulting (Pty) Ltd Page 357
EVC Results – Publicly Traded Downstream Company
-20000
-10000
0
10000
20000
30000
40000
1 2 3 4 5 6
2000 to 2005
EV
C
EVC
For the listed company, the IVC graph that follows show that the higher than K (cost of capital)
return recorded in 2003 outweighed the years when returns were lower than K, and IVC has
remained positive through 2005. Again, this is a case of little data (5 years) that does not cover
the full commodity cycle. Also, this particular company was active in acquisitions.
IVC Results – Publicly Traded Downstream Company
-20000
-15000
-10000
-5000
0
5000
10000
15000
20000
25000
30000
1 2 3 4 5 6
2000 to 2005
IVC
IVC

FRIDGE Chemical Sector Upstream Pricing Practices – Final Report
Ozone Business Consulting (Pty) Ltd Page 358
APPENDIX 3: DISCUSSION ON INTERNATIONAL PRICING MECHANISMS -
REFERENCE PRICES FOR POLYMERS
1. Introduction
The primary purpose of this section is to set out and discuss the way the prices for polymers are
set/established in developing countries by linkage to a Reference Price.
A Reference Price is a price for a polymer that is quoted in $ per tonne by a major supplier for full
container loads with reference to a particular point; CFR Hong Kong, FOB US Gulf Coast port or
FOB NW Europe port (Rotterdam). These Reference Prices are published by a number of
independent services, of which ICIS LOR and Platts Polymerscan are the most well known.
B. The Need to Distinguish between Developed and Developing Regions and Countries
B.1 Developed Countries or Regions
It is necessary to distinguish between the large developing countries/regions of USA/Canada,
Western Europe and Japan from all other countries. The reason is that these countries (or
regions in the case of Western Europe) have very large markets in relation to the quantity of
product that is available from countries that export polymers. The countries/regions are largely
self-sufficient in supply. However, there are (very) limited imports into and exports from these
countries in relation to the size of the domestic market. While individual polymer users in each of
these countries could import product from (say) the Middle East, the quantum of these imports in
relation to the size of the market is such that the price of the imports would have no noticeable
impact on the market price within the region.
As a consequence, three regions of USA/Canada, Western Europe and Japan have tended to
become markets where the price of polymers is set by local supply/demand issues and there is no
need for the prices in these markets to be determined by reference or link to a Reference Price.

FRIDGE Chemical Sector Upstream Pricing Practices – Final Report
Ozone Business Consulting (Pty) Ltd Page 359
B.2 Developing Countries or Regions
Developing countries or regions (South Asia, SE Asia, North Asia, Africa and South America) are
much more open to imports than the larger markets. Over the years, the market price in each of
these countries (including the price in South Africa) has become set by reference to a “Reference
Price” that is reported/published by one of several polymer price reporting companies/agencies.
C. The Reference Prices
There are three Reference Prices that have evolved and are used as the basis for setting prices in
developing countries and regions. These are:
• CFR Hong Kong: Polymer producers with product available for the large importing region of
North and SE Asia will offer product (i.e. quote prices for large parcels of polymer) on a CFR
Hong Kong basis even though the product does not get shipped to Hong Kong. In reality,
“CFR Hong Kong” is a theoretical point somewhere in the South China Sea that becomes a
reference point and price for developing a CIF Price for any port in the region.
For example, if ICIS LOR or Platts Polymerscan (two companies offering price reporting
services) quote a CFR Hong Kong price of (say) $1,500 per tonne for a polymer, individual
producers of polymer will quote a delivered port price (say CIF Mumbai) in relation to the
quoted CFR Hong Kong Reference Price. A polymer producer in Saudi Arabia would quote
a CIF Mumbai price that would deliver the same net-back price (i.e. FOB Saudi port) as
selling on a CFR Hong Kong basis. As a consequence, a polymer producer in South Korea
would have to meet the CFR Mumbai price quoted by the Saudi producer.
For all countries in the Asia Pacific and East African (including South Africa and Australia)
have prices that fall within the “control/influence” of the CFR Hong Kong Reference Price. In
other words, the CFR Hong Kong price sets/influences the market price in each of the
countries in South Asia, SE Asia, North Asia, East & Southern Africa and Oceania (Australia
and New Zealand).

FRIDGE Chemical Sector Upstream Pricing Practices – Final Report
Ozone Business Consulting (Pty) Ltd Page 360
It is important and necessary to be aware that at any point in time, there will be parcels of
product that will be sold below that which is determined/dictated by the CFR Hong Kong
price.
• FOB US Gulf Coast (in the USA): Having said that the USA is not a large exporter of
polymers, there are limited exports. However, an FOB USGC price is quoted and the CFR
South American port price is determined by the FOB USGC price plus shipping cost. The
FOB USGC price can be higher or lower than the domestic price of polymer in the US
market.
Even for polymer supplied to South America out of the Middle East, the CFR South American
port is set by reference to the FOB USGC price. This situation has prevailed for some time
and it is not known for how long it will continue.
• FOB North Western Europe: Having said that Western Europe is not a large exporter of
polymers, there are limited exports. However, an FOB North Western Europe port price is
quoted and a limited number of countries have their CFR port price determined by the NW
Europe price – these countries are in North Africa and in the Eastern Mediterranean
(primarily in Turkey).
Even for polymer supplied to countries in North Africa and the Eastern Mediterranean out of
the Middle East, the CFR port price is set by reference to the FOB NW Europe price. This
situation has prevailed for some time and it is not known for how long it will continue.
D. Links between the Three Reference Prices
D.1 The Reference Prices from 1994 - 2005
Figures 9 – 13 give the Reference Prices from ICIC LOR for each month from January 1994 – July
2005 for each of the polymers covered in the Study.

FRIDGE Chemical Sector Upstream Pricing Practices – Final Report
Ozone Business Consulting (Pty) Ltd Page 361
Figure 1:
LDPE: Monthly Reference Prices for 1994 - 2005
LDPE
0
200
400
600
800
1,000
1,200
1,400
1,600
Jan-9
4
May
-94
Sep-9
4
Jan-9
5
May
-95
Sep-9
5
Jan-
96
May
-96
Sep-9
6
Jan-9
7
May
-97
Sep-9
7
Jan-9
8
May
-98
Sep-9
8
Jan-9
9
May
-99
Sep-9
9
Jan-
00
May
-00
Sep-0
0
Jan-0
1
May
-01
Sep-0
1
Jan-0
2
May
-02
Sep-0
2
Jan-0
3
May
-03
Sep-0
3
Jan-0
4
May
-04
Sep-0
4
Jan-0
5
May
-05
US
$/t
on
ne
CFR Hong Kong FOB USGC FOB NW Europe
Figure 2:
LLLPE: Monthly Reference Prices for 1994 - 2005
LLDPE
0
200
400
600
800
1,000
1,200
1,400
1,600
1,800
Jan-
94
May
-94
Sep
-94
Jan-
95
May
-95
Sep
-95
Jan-
96
May
-96
Sep
-96
Jan-
97
May
-97
Sep
-97
Jan-
98
May
-98
Sep
-98
Jan-
99
May
-99
Sep
-99
Jan-
00
May
-00
Sep
-00
Jan-
01
May
-01
Sep
-01
Jan-
02
May
-02
Sep
-02
Jan-
03
May
-03
Sep
-03
Jan-
04
May
-04
Sep
-04
Jan-
05
May
-05
US$/tonne
CFR Hong Kong FOB USGC FOB NW Europe

FRIDGE Chemical Sector Upstream Pricing Practices – Final Report
Ozone Business Consulting (Pty) Ltd Page 362
Figure 3:
HDPE: Monthly Reference Prices for 1994 - 2005
HDPE
0
200
400
600
800
1,000
1,200
1,400
1,600
Jan-9
4
May
-94
Sep-9
4
Jan-9
5
May
-95
Sep-9
5
Jan-9
6
May
-96
Sep-9
6
Jan-
97
May-
97
Sep-9
7
Jan-9
8
May
-98
Sep-9
8
Jan-
99
May
-99
Sep-99
Jan-0
0
May
-00
Sep-0
0
Jan-0
1
May
-01
Sep-0
1
Jan-0
2
May
-02
Sep-0
2
Jan-0
3
May
-03
Sep-0
3
Jan-0
4
May
-04
Sep-04
Jan-0
5
May
-05
US
$/t
on
ne
CFR Hong Kong FOB USGC FOB NW Europe
Figure 4:
PVC: Monthly Reference Prices for 1994 - 2005
PVC
0
200
400
600
800
1,000
1,200
1,400
1,600
Jan-94
May
-94
Sep
-94
Jan-95
May
-95
Sep
-95
Jan-96
May
-96
Sep
-96
Jan-97
May
-97
Sep
-97
Jan-98
May
-98
Sep
-98
Jan-99
May
-99
Sep
-99
Jan-00
May
-00
Sep
-00
Jan-01
May
-01
Sep
-01
Jan-02
May
-02
Sep
-02
Jan-03
May
-03
Sep
-03
Jan-04
May
-04
Sep
-04
Jan-05
May
-05
US$/tonne
CFR Hong Kong FOB USGC FOB NW Europe

FRIDGE Chemical Sector Upstream Pricing Practices – Final Report
Ozone Business Consulting (Pty) Ltd Page 363
Figure 5:
PP: Monthly Reference Prices for 1994 - 2005
PP
0
200
400
600
800
1,000
1,200
1,400
Jan-9
4
May
-94
Sep-9
4
Jan-9
5
May
-95
Sep-95
Jan-9
6
May
-96
Sep-9
6
Jan-9
7
May
-97
Sep-9
7
Jan-
98
May
-98
Sep-98
Jan-9
9
May
-99
Sep-9
9
Jan-0
0
May
-00
Sep-0
0
Jan-
01
May
-01
Sep-01
Jan-0
2
May
-02
Sep-0
2
Jan-0
3
May
-03
Sep-0
3
Jan-
04
May
-04
Sep-0
4
Jan-0
5
May-
05
US
$/t
on
ne
CFR Hong Kong FOB USGC FOB NW Europe
D.2 The Reference Prices from 1994 – 2005: Relevance for the Study
From reviewing the history of the Reference Prices over the period 1994 – 2005, the consultant
proposes the following observations that are considered of relevance to the Study:
• Generally, the prices between the three Points of Reference are linked.
• In general, the CFR Hong Kong Reference Price is either the lowest of the three or close to
the lowest price. As the prices in South Africa are linked to the CFR Hong Kong price, they
are linked to the lowest of the three Reference Prices
• There are periods when the difference between the highest and lowest of the Reference
Prices is large – as much as $200 per tonne. This is an important feature of the international
polymer industry – shortages in a particular region can push up prices and it is not always
possible for polymer users in the high-price region to easily source product from a region
where the prices are lower, or for exporters to switch from supplying a lower-priced region to

FRIDGE Chemical Sector Upstream Pricing Practices – Final Report
Ozone Business Consulting (Pty) Ltd Page 364
a region where the price is high. While market prices are transparent, product does not move
easily and readily from one part of the world to another.
E. Export and Import Prices
E.1 Domestic Prices vs Export Prices for the USA and NW Europe
An important feature of the polymer industry is that in any country that has a surplus in any
polymer, the price at which the polymer is exported is different (and usually lower) than the price
at which it is sold to domestic users even after allowing for transport and other logistics costs.
Figure 6 shows a comparison of the domestic price and the export price for the polymers covered
for the USA and NW Europe. Only these two regions are covered, because ICIS LOR provides a
consistent price series for these two countries.
A study of the comparison between the domestic and export prices in the USA and NW Europe
over the ten year period shows that:
• For all polymers and for both regions, the export price is usually lower than the domestic
price.
• However, there are periods when the export price is very close to or actually higher than the
domestic price. This takes place when the domestic market is tight and there is limited
amount of product available for export.
E.2 Domestic Prices vs Export Prices in Other Countries
In all other countries that have a surplus in a particular polymer, the price at which the locally
produced polymer is sold into the domestic market will differ from the price at which it is exported.
The reason is that the price in the domestic market is set by an import parity price (plus duties and
a range of other costs) which is linked to the Reference Price in the region while the export price is
set by the need to compete with other exporters.

FRIDGE Chemical Sector Upstream Pricing Practices – Final Report
Ozone Business Consulting (Pty) Ltd Page 365
As an example, Thailand produces all the major polymers and currently has surplus for most of
the polymers. The surplus is exported to China and Australia (among other countries). The
domestic price evolves/develops with reference to the CFR Hong Kong Reference Price because
potential exporters to Thailand (from Malaysia, Singapore, South Korea and Saudi Arabia) seek to
place parcels of product into the Thai market at a CFR Thai Port price that gives them the same
net-back price (FOB Port of Origin) as exports to China (the largest importing country in the
region). The Thai producers will meet/match the price at which imports are competing in the local
market on an import parity basis (at the point of consumption by the customer). However, it needs
to be appreciated that in deriving the import (parity) price which sets the price the local producers
have to compete with, a range of costs need to be taken into account. These are; landing &
clearing, import duties, transport to the user, finance costs and any other costs unique to Thailand.
Thai polymer producers with product to export (to China for example) will need to compete with
producers in SE Asia and producers in the Middle East. The FOB Thai Port (the export price) is
set by the CFR China Port price that is directly linked to the CFR Hong Kong Reference Price.

FRIDGE Chemical Sector Upstream Pricing Practices – Final Report
Ozone Business Consulting (Pty) Ltd Page 366
APPENDIX 4: POLYPROPYLENE CONVERTERS
Many companies are involved in Polypropylene conversion. These include:
A P S Plastics (Pty) Ltd
African Commerce Dev
Alplas
Ampaglas Holdings (Pty) Ltd
Audi / Volkswagen Sa
Belgotex Carpets
Best Engineering (Pty) Ltd
Brits Bag Manufacturers
Burcap Plastics (Pty)
Calibre Plastics (Pty) Ltd
Caronessa Industrial
Chemcraft (Pty) Ltd.
Chin Ho Industrial (Pty) Ltd
Chuang's Strapping (Pty) Ltd
Clipsal
Consol Ltd. Rigid Pa
Contactim (Pty) Ltd
Cordustex
Dimbaza Fibres (Pty) Ltd
Durban Bag
Elvinco Plastics (Pty) Ltd
Eurocelt (Durban) Cc
Evernu Plastics (Pty) Ltd
Exactocraft (Pty) Ltd
Feltex Ltd.
Flex-O-Thene Plastics
Formosa Plastic (Pty) Ltd
Frame Textile Group
G E A Aircooled Systems
Gap Mouldings (Pty) Ltd (Was Gap
Plastics)
GM Poly Manufacturers
Gold Sun Industries
Goodyear/Tycon
GUD Filters Durban
GUD Mann & Hummel Filter Systems
(Pty) Ltd
Helix Trading Cc.
Herber Plastic (Pty) Ltd
Hilfort Plastics
Huhtamaki South Africa
Industrial & Consumer Plastics (Pty) Ltd
International Trade
Irenco Plastics (Pty) Ltd
Itb Manufacturing
Jel-Ex Cc.
Kaymac Structural Foam
Kohler Flexible Packaging
L and K Poly Products
Linpac Materials Handling
Macniel Pipe Manufacturing
Marco Plastics (Pty) Ltd
Marcom Plastics (Pty) Ltd
MCG Industries (Pty)
Metal Box Beverage Cap (Was Metal Box
Mono Containers)
Naeem Food Industry
Nampak Tubes And Tubs
New Age Plastics Cc.
NJ Injection Moulder
NM Packaging Cc.
Nouwens Carpets (Pty) Ltd
Nu Plastics Cc
Nu World Industries (Pty) Ltd
Nu-World Industries
Ocean Plastics Cc
Pailpac (Pty) Ltd.
Palm Stationery Manu
Panacea Polymers (Pty) Ltd
Pandrol
Perma Products (Pty) Ltd
Petzetakis
Plastall Gundle
Plastamid
Plastform
Plastic Industries (Pty) Ltd
Plastic Industries S
Plasticwrap (Pty) Ltd
Polisak (Pty) Ltd.
Polyoak Packaging (Pty) Ltd
Polytex/Marley
Precision Valve
Premier Hangers CC
Pristine Industrial
Prolectra Packaging
S V A Electronics (Pty) Ltd
SA Leisure (Pty) Ltd
SA Polypropylene Yarn (SAPY)
Safepak (Pty) Ltd.
Sakkor Manufacturing
Sakpro (Pty) Ltd (Was Multiknit Products)
SCP Polycloth Manufacturers
Sheet Plastics (Pty) Ltd
Silver Ruby Trading
Slavepack Holding (Was Slavins -
Industria)
Slavepak (Pty) Ltd
Smiths Manufacturing
South African Fibre Manufacturers
South African File Manufacturers
Southern Ropes (Pty) Ltd
Southpoint Industries
Spilo (Pty) Ltd.
Spunchem International
Stripes Industries (Pty) Ltd
Sunnyway Bop Inc.
Taiplas Bag Manufacturers
Technoplastics
Telplast (Pty) Ltd.
Tiger Rope Manufacturers
Toyota
Treofan South Africa
Trespaphan
Tufbag
Tupperware Southern Africa
U F I Bag S A (Pty) Ltd
Unity Industrial Cc.

FRIDGE Chemical Sector Upstream Pricing Practices – Final Report
Ozone Business Consulting (Pty) Ltd Page 367
Usabco (Pty) Ltd.
Van Leer
Veridical Traders 6
Wang On Fibres - Newcastle
Xactics
APPENDIX 5: POLYETHYLENE CONVERTERS
There are a large number of polyethylene converters in SA. These include the following
companies:
AEL
Afripack
Agriplas
Alnet
Alplas
Ampaglass Sa
ATC
Atlas Plastics
Berry And Spence
BIC (SA)
City Packaging
Clariant
Consol
Custom Colour & Performance
Masterbatch
Dart Industries (Pty) Ltd
Durban Bag
East Rand Plastics
Emas
Everest Plastics
Fakpro Ltd (Division Of Nitex)
Flexible Packaging Convertors
Flex-O-Thene Plastics
GP Packaging
Gundle Api (Pty) Ltd (Was
Amalgamated Plastics Industries)
Huhtamaki (Was Mono Containers)
Italpac
ITB Manufacturing
Jojo Tanks (Pty) Ltd
Kahn & Kahn (Pty) Ltd
Kaymac Roto Moulders - Willowton
Kohler Flexible Packaging
KPI Group
Leader Packaging Cc
LH Lategan & Atlas Plastics (Pty) Ltd
Lomotek Polymers
LR Plastics
MBSA
Megapak
Nampak Flexible - Ndabeni (Was Kohler
Flexible Packaging)
Nampak Liquid Packaging - Industria
Nampak Polyfoil - Spartan
Netafim
New Era Plastics
Nitex & Alan Nicholl
Noorsaheb Plastics Cc
NSA Africa (Pty) Ltd (Was Campbell
Gardwel)
Nu Plastics Cc
Packaging Consultants
Panbro Plastics
Pandrol
Performance Masterbatch
Pioneer Plastics
PI Plastics Cc
Plastall Gundle
Plastic Blown Containers (Pty) Ltd
Plasticwrap - Ndabeni
Polyfilm Convertors
Polyoak (Pty) Ltd (T/A Dairypak)
Polypak
Prima Toys
Razco Plastics Industries (Pty) Ltd
Rhino Plastics - Port Elizabeth & Epping
Safa (Pty) Ltd
Safepak
Sealed Air
Smile Education Systems
Sondor Industries - Ndabeni
Tetra Pak Liquid Packaging
Tiger Plastics
Transpaco Flexible (Was Plastafrica)
Tristar Plastics (Pty) Ltd
Tropic
Uniplastics
Usabco (Addis)
Van Leer
Venkpak
White Point
Xactics

FRIDGE Chemical Sector Upstream Pricing Practices – Final Report
Ozone Business Consulting (Pty) Ltd Page 368
APPENDIX 6: PVC CONVERTERS
There are a large number of PVC converters in SA. These include the following companies:
2 To 5 Plastics - Industria
Aberdare - Pretoria
Amiantit
Apex Leads CC
Atlantic Forming - Jet Park
Boudene (Pty) Ltd T/A Intramed (Was Pharmacare Intramed)
Cinqplast-Plastop (Pty) Ltd - Denver
Dpi - Chamdor
Dunlop Ltd - Benoni
Fenner SA
Finland Textiles (Pty) Ltd (Was Ag Laminators)
Hella (SA) (Pty) Ltd- Uitenhage
Hellerman Titon
HK Manufacturing
John Whittle Components
Kohler Versapak
Marley SA - Elandsfontein
Natal Trim CC (Was Natal Tool & Die)
Ogatin (Pty) Ltd (Was Internatio)
OTH Beier
Petzetakis
Plastiprofile (Pty) Ltd
Sasol Polymers (Was PVC Compounders) - Modderfontein
Rehau - Ford Jackson
Resinite
Shave & Gibson (Pty) Ltd
Swan Plastics
Switchboard Utilities
Transparent Packaging (Pty) Ltd
Vynide
Watex
Wayne Plastics (Division of Feltex Ltd)
WR Grace Africa Xactics – Prospecton