trade and investment analytical papers topic 5 of 18 · under wto rules, tariffs must, with certain...
TRANSCRIPT

PROTECTIONISM
Trade and Investment Analytical Papers Topic 5 of 18

Contents
Summary ................................................................................................................. 3
1. What is protectionism? ...................................................................................... 3
2. What are the arguments for and against protectionism? ............................... 4
3. Tariff and non-tariff barriers to trade ............................................................... 7
4. Has the recent global economic crisis led to a rise in protectionism? ....... 12
5. What are the costs of protectionism? ............................................................ 16
6. Conclusions ...................................................................................................... 18
References. ........................................................................................................... 20
Trade and Investment Analytical papers............................................................ 23
2

Summary Protectionism occurs when governments, deliberately or otherwise, restrict trade flows. There are many rationales for protectionism, but most do not stand up to economic analysis. Protectionism comes in many forms. Successive reductions in tariff measures through multilateral trade rounds and free trade agreements have meant that non-tariff measures are now often the most significant barriers to trade. The issue of protectionism has become a focus of commentators, international organisations and governments in the post-crisis era. Although the recent economic crisis has not led to a general rise in tariffs, there have been many examples of less explicit, non-tariff protectionist measures being introduced. Theory and empirical evidence suggest that protectionism imposes net costs to an economy in the long term.
1. What is protectionism?
There is no general agreement on what constitutes protectionism, though it often involves restricting trade by limiting foreign competition faced by domestic firms. At one end of the spectrum it might be defined as restrictions on imports through tariffs and quotas; a broader definition might include the influence of a wider range of government regulations and policies which (deliberately or otherwise) restrict or distort trade, including those that seek to support domestic industries. Protectionism can thus take many forms, including measures such as subsidies, standards and procurement. Protectionism is used for a number of reasons, some of which are outlined here, but is generally acknowledged to be ineffective and harmful to a country’s economic interests in the longer term. This is because it prevents the mutual gains from trade being realised, and, by restricting competition, limits the incentives for firms to improve their efficiency.
3

Monitoring the level of post-crisis protectionism A number of organisations are monitoring the level of protection in the global economy in the post-crisis era. While there is agreement that large scale protectionism has so far been avoided, there is concern at the amount of non-tariff barriers introduced. It is recognised that there is a need to remove existing measures as soon as possible (see Section 4).
The overall impact of the recent protectionism is estimated by the IMF to be limited so far (a 0.25% reduction in world trade), though risks persist of further increases.1
The WTO, OECD and UNCTAD estimate that trade restrictive measures introduced since the start of the financial crisis in October 2008 affected 1.8% of G20 imports2
The European Commission finds that 1.7% of EU merchandise exports have been affected3
Using a broader definition, researchers at Global Trade Alert estimate 10.4% of world imports (with a value of $1.6 trillion) have been impacted since the start of the crisis4
2. What are the arguments for and against protectionism?
2.1 Infant industry One important argument in favour of protectionism is the infant industry case. This is based on the idea that new firms must first be shielded from foreign competition so that they can eventually obtain the efficiencies required to compete on costs with established foreign producers. This can help to address market failures facing new firms, including positive externalities (knowledge spillovers, learning by doing), co-ordination failures, and capital market imperfections.5 The process of discovering what a country is good at producing requires investment in innovation, and this may be underprovided by the market if the social returns exceed the private returns6. It may be possible that the domestic industry is capable of producing goods at a lower cost than competitors, given some initial protection – a ‘latent’ comparative advantage may reside. There are many objections to these ideas. Governments must make correct decisions about which industries to protect, while protection itself weakens incentives for companies to innovate and become efficient. Also, companies are likely to engage in unproductive ‘rent seeking’7 activites, with governments at risk of capture and patronage, particularly in developing countries. Even in the presence of market failures, other government interventions may well be able to address these at lower cost than protection
1 IMF (2010) 2 WTO-UNCTAD-OECD (2010) 3 European Commission (2010) 4 CEPR GTA (2010a) 5 See Pack and Saggi (2006) and Hausmann and Rodrik (2006) 6 Hausmann and Rodrik (2006) 7 Rent seeking involves lobbying and payments to those administrating the policy, which reduces efficiency and sustains the protection.
4

It has been argued that import substitution policies played a key role in the rapid economic transformation of South Korea8, though this is disputed by others, including the World Bank9. It has also been suggested that the use of tariffs and industrial policies pursued by developed countries helped them at earlier stages in their development10. Yet many other policies were pursued simultaneously - economic development is the result of a complex set of factors including education, investment and institutions. In the absence of protectionism, growth may have been faster. Although some protectionism is permitted for developing countries under WTO rules,11 the balance of evidence suggests that infant industry protection has had only limited success in practice, as protected industries have tended not to become internationally competitive over time12. Crucially, any support for industries needs to be carefully disciplined to ensure that firms become more efficient, and this is inherently difficult to do. This may have been the deciding factor why import substitution policies were, according to some, more successful in South East Asia than Latin America13. Moreover, contemporary production is increasingly reliant upon firms’ incorporation into global production chains, while innovation and product developments are occurring more rapidly. This makes it more difficult to protect industries effectively.14 Instead, ensuring an economy retains strengths across a broad range of areas that determine competitiveness is likely to be more effective. 2.2 ‘New’ Trade Theories So-called ‘new’ trade theories15 emerged in the 1980s which appeared to give some credence to the idea that governments can shape comparative advantage and that there might be a strategic interventionist argument for protection in industries with imperfect competition and economies of scale. However, these theories also highlighted the fact that the information requirements on governments to execute such policies are very large, while retaliation by trade partners would undermine their effectiveness. Rent seeking, government failures and capture pose further risks. Authors of the new, strategic trade policy did not therefore recommend their use in practice.
8 See, for example, Alice Amsden (1989) 9 World Bank (1993) 10 Chang (2002) 11 Infant industry protection is WTO legal under GATT Article XVIII, which permits members in ‘early stages of development’ to use trade barriers to protect domestic industry and affords flexibility in trade measures to protect a country’s balance of payments. 12 Harrison and Rodriguez-Clare (2009) and Pack and Saggi (2006) review the outcomes of infant industry policies using various methodological approaches 13 Hausmann and Rodrik (2006) 14 Pack and Saggi (2006) 15 See, for example, Krugman (1987)
5

2.3 Political economy Trade liberalisation creates winners and losers in the short term as resources are redeployed from uncompetitive sectors. Although the economy as a whole is likely to benefit, the distribution of gains and losses may be uneven. Typically, the gains are dispersed across many consumers, while the losses (from industries ceding market share to more competitive foreign producers) are concentrated among a smaller number of import-competing industries, so that their impacts are felt more acutely.16 Effective lobbying by powerful interest groups on behalf of those affected can explain why some industries continue to benefit from protectionist policies17 - these are often the most powerful influence on government decisions to protect industries. This can involve rent seeking activities, which sustains the protection. There are numerous examples of protection, once installed, being very difficult to remove. It should be recognised that, aside from the economic arguments, protecting industries often has popular support in the context of job losses from offshoring and outsourcing. There can be a perceived trade-off between free trade and jobs. A study on this found that in the US, despite instances of job losses, outsourcing was connected to overall higher employment, as firms tended to created jobs both in the US and overseas.18 It will be necessary to communicate better the overall benefits of trade in order to resist protectionist demands. Governments may weight the concerns of producers (exporters) over the impact on consumers and importers, even though the latter would be adversely affected by any protection. Similarly, while protection can be seen as a costless policy (in fiscal terms), in fact there is likely to be longer term net costs borne by consumers and firms who import goods for production, as well as reduced competitiveness. 2.4 Adjustment costs The short term costs of liberalising can create adjustment costs where factors of production are not able to quickly re-deploy due to imperfectly working markets. A flexible economy with transferable skills makes these transitions easier, as can adjustment support. In developing countries, which are characterised by pervasive market failures, adjustment costs can be significant (though estimates vary).19 The Doha Development Agenda trade round modalities therefore propose asymmetric liberalisation to allow developing countries to adapt gradually to free trade. Adjustment costs do not provide a blanket justification for protection; the cost-benefit calculation will depend on the particular circumstances of the case. Once in place, protectionist measures are difficult to remove. Any percieved
17 See Rodrik (1994) 18 Mankiw and Swagel (2006) discuss the popular appeal of protectionism 19 See Cirera et al (2010) for a study of developing country adjustment costs from tariff reductions
6

benefits will be reduced or negated the longer the protection is in place, or if competitors react by protecting their industries. This is particularly relevant to the situation in the current economic crisis. 2.5 Other arguments There are many other arguments used to try to justify protection:
Tactical or negotiating reciprocity. A country may refrain from reducing trade barriers simply as a negiating tactic in order to try to persude its trade partners to reduce theirs in return.
Addressing a country’s balance of payments situation Trade defence - WTO approved methods of countering unfair trade
(anti-subsidy and anti-dumping) can also be misused to support domestic industries20
Strategic reasons - such as food security (e.g. the EU’s CAP), national sovereignty, or export restrictions encouraging domestic processing of precious metals
A source of public revenue (especially in developing countries) To deter consumption of goods with negative externalities21 To prevent surges of imports (e.g. developing countries may use the
special safeguard mechanism) To counter the effects of ‘dutch disease’22
3. Tariff and non-tariff barriers to trade 3.1 Tariffs A tariff is simply a tax levied on imports (sometimes exports). Under WTO rules, tariffs must, with certain exceptions, be utilised be on a non-discriminatory, ‘most favoured nation’ (MFN) basis.23 Tariffs may be set at their bound (maximum agreed) or applied level.
A tariff has a number of short term effects: consumers pay more and buy fewer goods, while boosting producer incomes (demand for domestic goods increases as domestic prices become relatively more competitive) and also provides revenue to governments. Distributionally, a tariff can be seen as a transfer from consumers to producers. It can be shown that tariffs lead to an overall welfare loss, as more efficiently produced imported producted goods are substituted for less efficiently produced domestic goods.
20 See the separate paper on Trade Defence and Anti dumping 21 Negative externalities occur where social costs exceed the private costs of production or consumption e.g. goods which may damage health or the environment 22 Dutch disease occurs when a country’s exchange rate appreciates due to demand for (typically) natural resource exports such as oil. This can adversely affect other export sectors, and makes imports more competitive. Restricting imports can temporarily offset this 23 Most favoured nation (MFN) is the principle that all trading partners should be treated equally. Article 1 of GATT. There are some exceptions to this, such as free trade areas (FTAs) and the EU’s GSP (General System of Preferences) schemes.
7
Taxes on imports can also act as a tax on exports: higher import prices make it more attractive to produce the goods for the domestic market, which diverts resources such as labour from export sectors.24 Import tariffs can also create a bias against exporters by raising the domestic prices of imports used as intermediate goods. A study found that on average, import tariffs in 26 low-countries were equivalent to a 12.5% tax on their exports. Reducing import tariffs can therefore indirectly promote exports, regardless of whether trading partners reduce their tariffs. 25 When analysing the impact of a tariff, it can be useful to look beyond nominal rate of protection:
The ‘effective rate of protection’ is a measure of the extent to which the value-added of a good is protected by tariffs,26 and takes tariffs on inputs and tariffs on output into account. While tariffs on a finished product benefit the producers of that product, this benefit will be offset by any tariffs on inputs into production
‘Tariff escalation’ refers to the progressive increase in tariffs with the degree of processing of a product. This can deter diversification and upgrading to products with higher value added in developing countries.27
‘Tariff peaks’ can be found in particular product lines, even though averages may be low. For this reason, tariff structures which show relatively little variation across different products are regarded as less distortionary than those should show large variations.
It is also important to distinguish between applied and bound tariffs. To varying degrees, WTO members commit to bind some or all of their tariffs. This means that they undertake not to raise their tariffs above a specified maximum level. In some cases, countries actually impose tariffs at levels much lower than their bindings. While this provides improved market access, it also creates uncertainty for traders, who cannot be sure that in the future the tariff will not increase up to the bound level. Tariffs which are bound at very high levels, or not bound at all, can therefore deter trade, even if the tariff applied by a country is actually quite low. Through multilateral trade rounds, bilateral free trade area (FTA) agreements, WTO accessions and unilateral liberalisation, average developed and emerging country tariffs have been gradually reduced from 15% in 1947 to around 4.5% today.28 The trend in average tariffs for the world’s main trading countries over the past few decades is shown below: Figure 1: Simple average MFN tariff rates 1990-2009
24 This is based on Lerner’s symmetry theorem, discussed in Tokarick (2006) 25 Tokarick (2006) 26 The effective rate of protection considers the overall impact of tariffs on an industry’s value added. It can be estimated using ERP= (V’-V)/V where V is value added with free trade, and V’ is value added with tariffs in place. 27 See FAO (2004) for a discussion and examples of tariff escalation in developing countries 28 European Commission (2010)
8

Source: IMF (2010) While applied tariffs have fallen, some bound levels remain reasonably high, particularly in emerging economies.29 Higher tariffs are also found in the agricultural sector in both developed and developing countries. The applied and bound rates for the major developed and developing markets (2009) are shown below: Figure 2: Applied and bound tariff rates, 2009
0
20
40
60
80
100
120
140
China
Russia
India
Japa
n
Singap
ore
S Afri
ca
Turk
ey
Korea
Brazil
Nigeria
Egypt EU
US
%
Applied
Bound
Source: BIS using WTO data Regarding trade negotiations, much of the literature suggests that it is optimal to unilaterally reduce tariffs.30 In practice, the principle of reciprocity31 is used
29 Note that Russia is not yet a WTO member, and so does not have any bound tariffs. 30 For an overview of the economic literature on reciprocity, see Baldwin (2010) 31 Reciprocity occurs where foreign tariffs must be reduced for domestic tariffs to fall
9
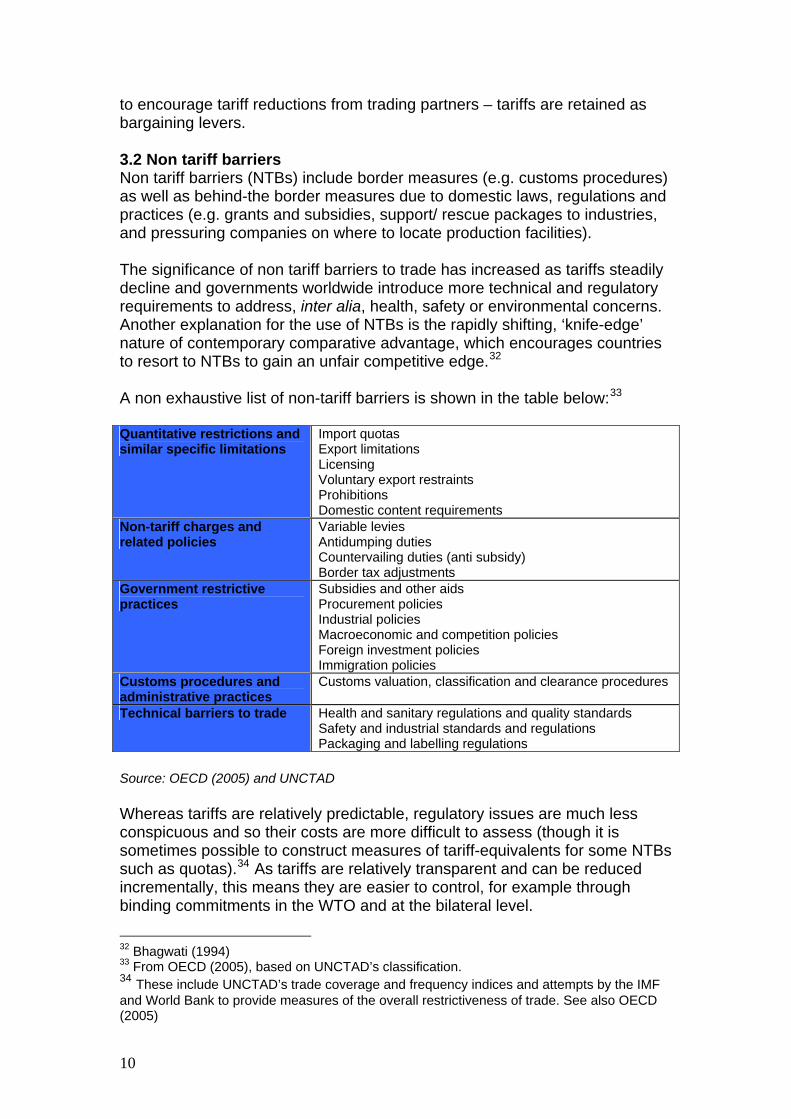
to encourage tariff reductions from trading partners – tariffs are retained as bargaining levers. 3.2 Non tariff barriers Non tariff barriers (NTBs) include border measures (e.g. customs procedures) as well as behind-the border measures due to domestic laws, regulations and practices (e.g. grants and subsidies, support/ rescue packages to industries, and pressuring companies on where to locate production facilities). The significance of non tariff barriers to trade has increased as tariffs steadily decline and governments worldwide introduce more technical and regulatory requirements to address, inter alia, health, safety or environmental concerns. Another explanation for the use of NTBs is the rapidly shifting, ‘knife-edge’ nature of contemporary comparative advantage, which encourages countries to resort to NTBs to gain an unfair competitive edge.32 A non exhaustive list of non-tariff barriers is shown in the table below:33 Quantitative restrictions and similar specific limitations
Import quotas Export limitations Licensing Voluntary export restraints Prohibitions Domestic content requirements
Non-tariff charges and related policies
Variable levies Antidumping duties Countervailing duties (anti subsidy) Border tax adjustments
Government restrictive practices
Subsidies and other aids Procurement policies Industrial policies Macroeconomic and competition policies Foreign investment policies Immigration policies
Customs procedures and administrative practices
Customs valuation, classification and clearance procedures
Technical barriers to trade Health and sanitary regulations and quality standards Safety and industrial standards and regulations Packaging and labelling regulations
Source: OECD (2005) and UNCTAD
Whereas tariffs are relatively predictable, regulatory issues are much less conspicuous and so their costs are more difficult to assess (though it is sometimes possible to construct measures of tariff-equivalents for some NTBs such as quotas).34 As tariffs are relatively transparent and can be reduced incrementally, this means they are easier to control, for example through binding commitments in the WTO and at the bilateral level.
32 Bhagwati (1994) 33 From OECD (2005), based on UNCTAD’s classification. 34 These include UNCTAD’s trade coverage and frequency indices and attempts by the IMF and World Bank to provide measures of the overall restrictiveness of trade. See also OECD (2005)
10

Many NTBs fulfil a genuine regulatory function, often aimed at correcting market failures, or achieving some other legitimate policy objective e.g. to enforce safety and health standards. This makes them more difficult to tackle. The key question for policy-makers is not so much whether the regulation should be removed, but whether it can be made less trade-restricting while still fulfilling its regulatory objective.
Non tariff barriers in Europe and the US can be significant for developing countries, particularly SPS (sanitary and phytosanitary measures), as well as increasing numbers of private, voluntary standards (such as retail standards in food markets, ‘sustainably’ produced certifications for fish and timber, and conflict diamonds). These limit market access for producers who are unable to meet the high standards required, or are unable to afford to have their products certified as such. Some of these measures are seen as disproportionate, while many could be improved by increased transparency in their formulation and application. 35
Trade between the EU and the US provides a good example of the importance of non-tariff barriers. Since tariffs on both sides of the Atlantic are already very low and have become proportionately less of a problem for businesses, the real problem for exporters and investors are ‘behind the border’ regulatory barriers. 3.3 Other examples of non-tariff barriers: export restrictions and competitive devaluations In recent years, there has been a growing use of export restrictions and export taxes. Although these are not prohibited under WTO rules, there has been concern in developed countries that such restrictions, particularly on raw materials exports, act as an illicit subsidy to downstream users of the product and disadvantage overseas downstream firms. Export restrictions on ‘rare earths’ are a prime example. In developing countries, export bans have been used as a means of promoting food security. There are a number of drawbacks here, as these restrictions may contribute to price instability and may ultimately damage incentives to invest in the countries imposing them. The recent economic crisis has put the spotlight on the role of exchange rate policy as a possible distortion of trade, as some countries are thought to be manipulating currencies to gain a competitive advantage. This is a particularly difficult issue, as there is little consensus over what the ‘correct’ level of a currency might be, and the debate over protectionism has spilled over into sensitive areas such as domestic monetary policy. 3.4 Services and investment barriers36 Much of the literature to date has examined barriers to trade in goods, though there is a growing emphasis on the impact of protection on international trade 35 Jaffee (2006) 36 The focus of this paper is on trade barriers for goods. See European Commission (2010) for an overview of current services and investment barriers.
11

in services and international investment. This reflects the fact that in most advanced economies like the UK, services account for a large proportion of economic activity and manufacturing relies heavily on inputs from the service sector. Non-tariff barriers affecting services and investment primarily relate to domestic regulation and the conditions for entry of foreign investors and suppliers. The WTO37 classifies services barriers in 3 categories: market barriers, national treatment barriers, and domestic regulation barriers. Investment barriers include restrictions on foreign ownership of equity capital, mandatory screening and approval procedures, and operational restrictions (e.g. restrictions on nationality and profit repatriation). Such barriers are especially difficult to measure, though some estimates suggest that they are very significant.38 The European Commission has recently estimated the tariff equivalents of service barriers in various markets, and the OECD has devised a ‘services restrictiveness index.39
4. Has the recent global economic crisis led to a rise in protectionism?
4.1 The Great Depression vs the Credit Crunch The 1930s depression saw a rise in protectionism. Although this was not the main cause of the depression, it exacerbated and prolonged the economic decline. Most famously, the US introduced the Smoot-Hawley tariff act in 1930, which raised import duties by about 20%. Yet, despite its popular perception, the direct impact of Smoot-Hawley was limited (only 6% of European exports went to the US market at the time). The main impact on trade occurred due to the reduction in demand and other tariff increases. Still, retaliation followed swiftly, with increases in duties made by Canada, France, Italy, Spain and others.40 Competitive devaluations were later used, including by the US and the UK (after it withdrew from the Gold Standard), triggering further retaliations. By 1932, a wide range of protectionist controls and restrictions, including higher tariffs, new import quotas, and controls on foreign exchange transactions, had been imposed around the world. The volume of world trade fell 36% between 1929 and 1932. One calculation finds that about 45% of this decline was due to lower income (via reduced demand) and about 55% due to an increase in tariff and non-tariff barriers to trade. 41
37 WTO General Agreement on Trade in Services (GATS) 38 See, for example, Nguyen-Hong D (2000) 39 See European Commission (2010) 40 Irwin (2009) 41 Madsen (2001), quoted in Irwin (2009)
12

The worry that a similar situation could re-occur led the G20 to commit to “…refrain from raising new barriers to investment or to trade in goods and services, imposing new export restrictions, or implementing WTO inconsistent measures to stimulate exports.”42 Accordingly, there are ongoing monitoring exercises by a number of organisations, and the creation of the Global Trade Alert. Reports by these bodies suggest that, overall, there has been no general rise in tariffs during the recent economic crisis – a good achievement, in part due to the WTO rules based system. However, there have been many instances of non-tariff protectionism introduced, including measures such as subsidies and support for domestic industries. (Others have noted that the aims of some governments to support industry during the crisis while apparently maintaining open markets may be incompatible.43) The reports share concerns that, despite the overall limited level of protectionism, many trade restrictive measures introduced during the economic crisis remain in place despite the continuing global recovery and the G20 pledge at the June 2010 G20 Toronto summit to remove these measures. Short summaries of these reports are included below: 4.2 The WTO-UNCTAD-OECD report The May – October 2010 WTO-UNCTAD-OECD report found that 381 G20 trade restrictive measures were introduced since the start of the financial crisis in October 2008, covering 1.8% of G20 imports. The report notes a slow but steady accumulation of these measures - only 15% have been withdrawn. The G20 have largely exercised restraint over introducing trade restraining measures since the Toronto summit - although the total number of measures introduced continues to rise, the increase appears to be slowing: there were 54 new measures in this report’s period compared with 56 and 95 in the previous two reports since the start of the crisis. 44 These measures covered 0.2% of world imports, compared with 0.4% and 0.8% coverage in the previous reports. 4.3 Global Trade Alert By contrast, GTA’s 8th report (covering June – November 2010), using a much broader definition of protection, concluded that the high rate of new protectionist measures has been maintained since the Toronto summit in June 201045. Since Toronto, G20 members have implemented 94 ‘almost certainly protectionist’ measures, compared with 44 for the rest of the world. It
42 G20 summit declaration, Washington 2008 http://www.g20.org/Documents/g20_summit_declaration.pdf 43 ECIPE (2010) calls this approach ‘Keynes at home, Smith abroad’ 44 WTO-UN-OECD (2010) report 45 The main reason for the difference between estimates is definition. The WTO estimates include only standard trade policy instruments (tariffs, trade bans, regulations and trade defence measures); the GTA focuses on 16 less traditional measures, including bailouts, export subsidies, and competitive devaluations.
13

therefore argues that the G20 countries have failed to deliver on their pledges made at Toronto46. This suggests that the intensified levels of protectionism observed in 2008 have not yet abated, so the continuation risks becoming business as usual for the G20. GTA argues that the removal of crisis-era protectionism is needed to restore the G20’s standing on trade policy and signal that shifting the burden to trading partners via discriminatory measures is unacceptable. GTA also analyses the impact on LDCs - since the start of the crisis in November 2008, it found that 49 out of 50 of the LDCs have been subjected to harmful measures. 4.3 The European Commission report The European Commission’s47 May – September 2010 report also notes a sense of complacency with regard to the roll back of trade restrictive measures. The stock of trade restrictive measures continues to increase: at the start of October 2010, 332 trade restrictive measures (TRMs) were in place, with 66 new measures introduced by the EU’s trade partners from May – September 2010. Between October 2008-09, the TRMs in place affected around 1.7% of EU merchandise exports. The EC estimates approximately half of the TRMs in place are ‘behind the border’, which have a more difficult removal process and are more likely to become locked in. The EC also detected a trend towards a greater use of investment related measures, with 25 identified investment restrictions in place at the end of September 2010. The impact of trade restrictive measures on the EU was also found to be greater than the impact on the WTO average (similarly, EU trade was also affected more by the crisis than the global average.) The EU’s most affected sectors are the traditionally sensitive sectors - agro-food, automotive, services, textiles and clothing.
46 GTA 8th report (2010) 47 European Commission (2010)
14

Figure 3: Number of trade restrictive measures introduced by the EU’s trading partners since the start of the crisis
Source: European Commission (2010) 4.4 The challenge of continuing to resist protectionism The monitoring reports highlight the continued protectionist pressures arising from unemployment, macroeconomic imbalances, and currency tensions, which may still risk the consensus in favour of open trade and investment. They argue that it will be important to resist these, as restricting trade cannot address the underlying issues. Instead, further protectionism may lead to retaliation, threatening jobs and growth. In general, the majority of trade restrictive measures have been implemented by the major trading partners (i.e. the G20). The G20 have also felt most of the effects of these measures. The barriers have been introduced in sectors traditionally affected by protectionism - electrical machinery and equipment, chemical products, mineral fuel, iron and steel, plastic products, cereals and dairy products. Other industries have also voiced their concerns, such as the pharmaceutical industry, which is affected by barriers such as IPR and public procurement, particularly those arising in emerging and East Asian markets. Although the measures introduced have largely been non-tariff, some non- WTO members, such as Russia, have used tariff measures. This shows that WTO disciplines have played a role in policing member countries practices. The US’s ‘Buy American’ scheme is a further example of WTO disciplines: the draft legislation has been modified to comply with the WTO’s GPA (General Procurement Agreement). Overall, countries have been deterred from using classic ‘at the border’ trade measures and resorted more to domestic policies like buy national or subsidisation to provide an advantage to their firms. This illustrates the merits of the WTO rules but also the need to close gaps in the WTO rules (e.g. by reducing bound levels in the Doha round).
15

5. What are the costs of protectionism?
The use of protectionism can impose large costs, and can lead to retaliatory ‘beggar-thy-neighbour’ policies which further increase the impact. The costs of protectionism will impact on consumers and firms using imports as production inputs (due to paying higher prices and having less choice). In the long run, protectionism will reduce a country’s competitiveness, though this is more difficult to quantify. The costs of protectionism are illustrated by a number of estimates:
If applied tariffs of major economies were raised all the way up to their currently bound rates then48:
- World exports would fall by $ 1.8 trillion (-7.7%) - World income would shrink by $ 0.35 trillion (-0.5%)
Existing barriers to external trade and investment (including tariffs,
quotas, and restrictive standards) could cost Europe’s consumers up to 7% of EU GDP (€600-700 billion) a year.49
An extreme case where all countries increase tariffs by 10% would
reduce GDP across the board, but particularly in regions more heavily dependent on exports. Regions would see the following declines in GDP: 1.2% in the United States, 3.2% in emerging Asia, 2.8% in a group comprising Japan and the euro area, 2.4% in a group comprising other OECD countries such as the UK, Canada, Australia.50
If countries had maintained the Smoot-Hawley tariff regime of 1930 and
the reciprocal tariff regimes introduced by the US’s trading partners, then world GDP would have been 7.35% lower in 2003, as shown in the table below:51
Impact on US had Smoot-Hawley, no retaliation
Other countries retaliate
Australia -0.77 -8.39 Canada -5.71 -11.95 Germany -0.64 -10.40 Italy -0.47 -15.10 Japan -0.34 -0.84
48 IFPRI (2008) 49 Messerlin (2001) 50New-York Federal Reserve (2006) 51 Bradford et al (2006) The cost would be higher in the more open economies such as the UK and Europe than more closed economies countries such as the US.
16

Netherlands -0.81 -20.75 United Kingdom -0.64 -9.37 United States -2.40 -4.47 China -0.99 -4.74 South Korea -0.83 -1.97 Rest of Asia -1.62 -13.01 Brazil -0.67 -3.62 Rest of Latin America -3.60 -10.95 Rest of Europe -0.44 -13.91 Middle East -1.39 -11.53 Rest of the world -0.35 -7.60 World -1.33 -7.35 Looking at non-tariff barriers, a study on EU-US52 trade measures in the transatlantic economy (which accounts for half of world GDP) found that there would be substantial economic benefits from reducing the trade costs of non-tariff barriers and transatlantic regulatory divergences:
For the EU, removing all actionable NTMs would lead to a 2.1% increase in exports and an increase in GDP of 0.7% (or €122 billion per year – around €600 per EU household). This would occur mainly due to gains in motor vehicles, chemicals, pharmaceuticals, food, and electrical machinery sectors.
For the US, there would be a 6.1% increase in exports and a 0.3% increase in GDP (€41 billion per year).
Taking a historical view, it has been demonstrated that the UK’s economic performance has been linked to its openness. Pre- 1914 openness enabled the shift from agriculture to higher value added activities, while protectionism during the inter-war and early post-war period affected industrial performance. More recent openness has contributed to productivity gains, particularly in the service sector.53 Other studies estimate the benefits from liberalisation and openness.54 One estimate suggests that the proposals currently being negotiated as part of the DDA (in which overall applied protection would be cut by 26%) would deliver $167bn of additional annual income and $383bn of additional annual trade globally. 55
52 Ecorys (2009) 53 Broadberry and Crufts (2010) 54 See the Trade White Paper note on openness 55 CEPII (2009) and IFPRI (2009)
17

6. Conclusions
Although protectionism benefits exporting sectors in the short run, it imposes costs on consumers and producers that use imported goods, while triggering retaliation from trading partners. In the longer term, competitiveness will be affected. A rise in protectionism could reverse the global integration that has underpinned the UK’s growth over recent decades. The reductions in tariff measures over the past few decades mean that non-tariff measures are now often more significant barriers to trade. The recent crisis has seen an increase in these measures. Open trade remains the most important way of expanding economic opportunity in the global economy and lifting people and societies out of poverty. It remains key to encourage trading partners to resist protectionism to ensure a sustained global recovery from the recession, and for growth thereafter.
18

References
Amsden, A. (1989) ‘Asia’s Next Giant’ Baldwin and Evenett (2009) ‘The collapse of global trade, murky protectionism, and the crisis: Recommendations for the G20’ Baldwin (2010) ‘Unilateral Tariff Liberalisation’ Bhagwati (1994) ‘Free Trade: Old and New Challenges’ Bradford, Grieco & Hufbauer (2006) ‘The payoff to America from global integration’, Peterson Institute for International Economics Bouët & Laborde (2008) IFPRI, ‘The cost of a non-Doha’ Broadberry and Crufts (2010) ‘Openness, Protectionism and Britain’s Productivity Performance Over The Long Run’ CEPII (2009) ‘Economic Impact of Potential Outcome of the DDA’ http://www.cepii.fr/anglaisgraph/reports/summaries/2009/re09_01.htm. CEPR Global Trade Alert (2010a) ‘Unequal Compliance: The 6th GTA report’ CEPR Global Trade Alert (2010b) ‘Tensions Contained…For Now: The 8th GTA report’ Chang, H.J. (2002) ‘Kicking Away The Ladder’ Cicera, Willenbockel, and Lakshman. (2010) ‘What is the evidence of the impact of tariff reductions on employment and fiscal revenue in developing countries?’, University of Sussex Ecorys (2009) ‘Non-tariff measures in EU-US trade - a study for the European Commission (DG Trade) European Commission (2009) ‘Non-Tariff Measures in EU-US Trade and Investment – An Economic Analysis’ European Commission (2010) ‘Seventh Report on potentially trade restrictive measures identified in the context of the economic crisis European Commission (2010) ‘Trade As a Driver of Prosperity’ Exixon and Sally (2010) ‘Trade, Globalisation and Emerging Protectionism Since The Crisis’ FAO (2004) ‘State of Agricultural Commodity Markets’
19

Harrison and Rodriguez-Clare (2009) ‘Trade, Foreign Investment, and Industrial Policy for Developing Countries’, NBER paper Hausmann, R. and Rodrik, D. (2006) ‘Economic Development as Self Discovery’ Irwin, D. (2009) ‘Avoiding 1930s-style Protectionism: Lessons for Today’ IFPRI (2009) Issue Brief 61 ‘Eight Years of Doha Trade Talks - Where Do We Stand?’ IFPRI (2008) ‘The cost of a non-Doha’ IMF (2010) ‘Trade and the Crisis: Protect or Recover’ Krugman, P. (1987) ‘Is Free Trade Passe?’ Economic Perspectives, No. 2144 Messerlin, P. (2001) ‘Measuring the Costs of Protection in Europe – European Commercial Policy in the 2000s’ Mankiw, G. and Swagel (2006) ‘The Politics and Economics of Offshore Outsourcing’, Harvard Institute of Economic Research Jaffee, S. ‘Sanitary and Phytosanitary Regulation: Overcoming Constraints’, Chapter 30 in Newfarmer, R. (2006) ‘Trade, Doha, and Development: A Window into the Issues’, World Bank New-York Federal Reserve (2006) ‘Would Protectionism Defuse Global Imbalances and Spur Economic Activity?’ Nguyen-Hong, D. (2000) ‘Restrictions on Trade in Professional Services’, Productivity Commission Staff Research Paper, Ausinfo, Canberra, August OECD Trade Policy Working Papers, No. 28 (2005) ‘Quantifying the Trade and Economic Effects of Non-Tariff Measures Pack and Saggi (2006) ‘The case for industrial policy: a critical survey’, World Bank Research paper Rodrik (1994) ‘Political economy of trade’ Tokarick, S (2006) ‘Does Import Protection Discourage Exports?’ IMF WTO, OECD, & UNCTAD (2010) ‘Reports on G20 Trade and Investment Measures’, May 2010 – October 2010 World Bank (1993) ‘The East Asian Miracle, Economic growth and public policy’
20

Trade and Investment Analytical Papers
This paper is part of a series of analytical papers, produced by the joint BIS/DFID Trade Policy Unit, which support the Trade and Investment White Paper and the Trade and Investment Challenge. The full list of papers that will be available are:
Provisional timetable
1. Global context: how has world trade and investment developed? What's next?
February 2011
2. Economic openness and economic prosperity February 2011
3. UK trade performance over the past years February 2011
4. The UK and the Single Market February 2011
5. Protectionism February 2011
6. Sources of Growth February 2011
7. Trade and Regional Integration in Africa March 2011
8. Comparative advantage of the UK March 2011
9. Trade promotion March 2011
10. Food Security April 2011
11. Trade facilitation April 2011
12. Asia April 2011
13. Trade finance May 2011
14. Bilaterals/ plurilaterals - how can we make them better for the world trading system?
May 2011
15. Trade and the environment June 2011
16. Investment, including the impact of foreign ownership June 2011
17. Regulatory cooperation July 2011
18. Anti-dumping July 2011
21

22
© Crown copyright 2011
You may re-use this information (not including logos) free of charge in any format or medium, under the terms of the Open Government Licence. To view this licence, visit http://www.nationalarchives.gov.uk/doc/open-government-licence/ or write to the Information Policy Team, The National Archives, Kew, London TW9 4DU, or e-mail: [email protected]. This publication is also available on our website at http://www.bis.gov.uk Any enquiries regarding this publication should be sent to:
Department for Business, Innovation and Skills 1 Victoria Street London SW1H 0ET Tel: 020 7215 5000 If you require this publication in an alternative format, email [email protected], or call 020 7215 5000. URN 11/718