trade-off analysis of land use change, livelihood and ... filedesignated land use in upper konto...
TRANSCRIPT

Trade-off analysis of land use change, livelihood and environmental services:
prospecting land use options for the Upper Konto catchment using the FALLOW model
B h L i Betha Lusiana Noviana Khususiyah
Kurniatun Hairiah Kurniatun Hairiah Meine van Noordwijk
and Georg Cadisch
N. Khasanah
TUL-SEA Synthesis Workshop, 22-26 February 2010,Batu and Mojokerto, East Java, Indonesia
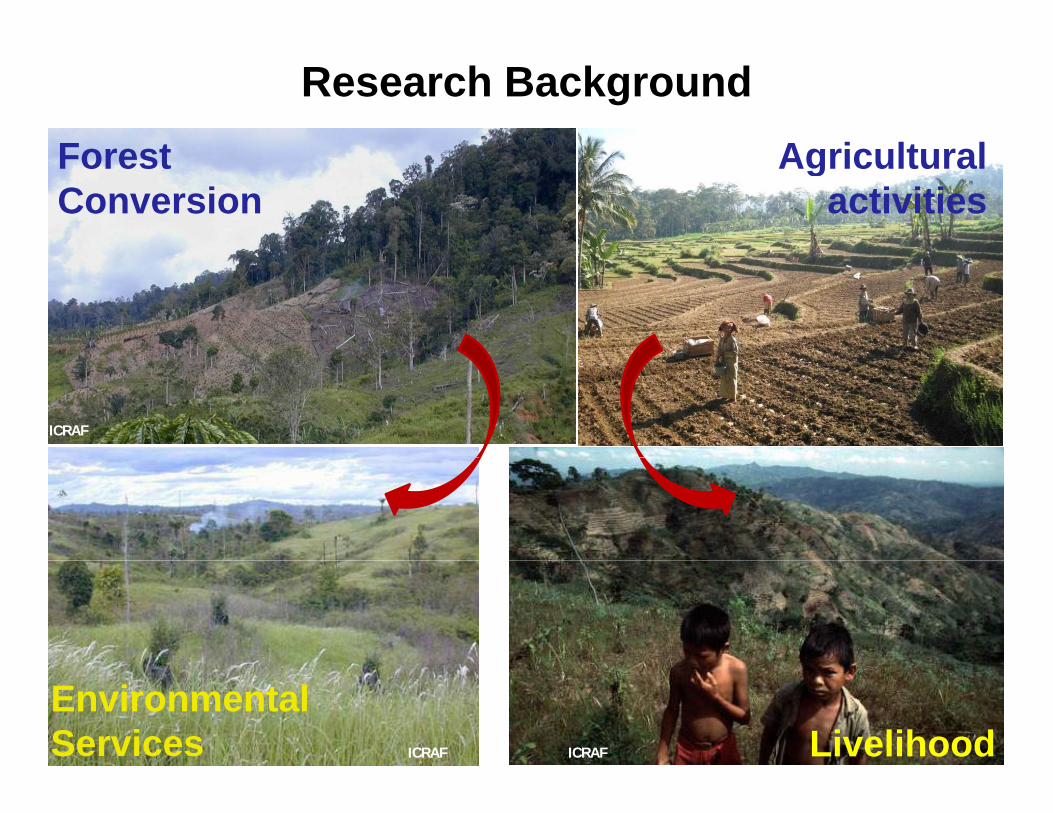
Forest
Research BackgroundAgriculturalForest
ConversionAgricultural
activities
ICRAF
ICRAF
Environmental Services ICRAF Livelihood
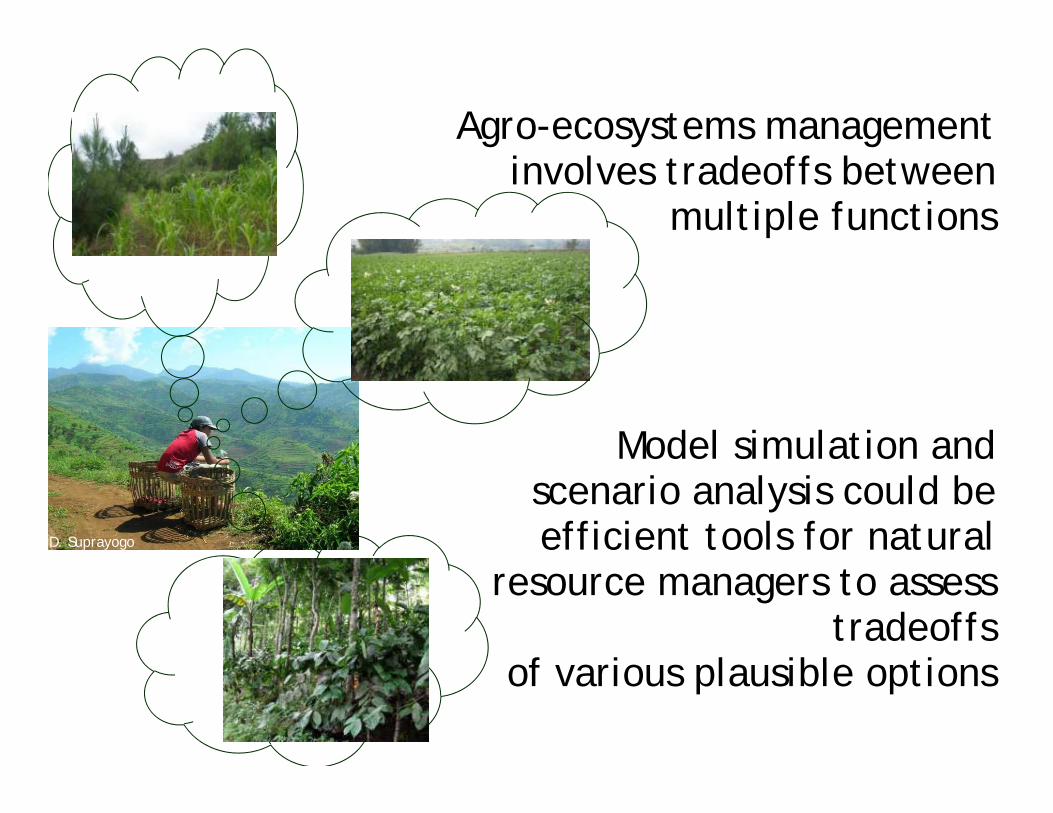
Agro-ecosystems management involves tradeoffs between
multiple functions
Model simulation and Model simulation and scenario analysis could be efficient tools for natural D. Suprayogo
resource managers to assess tradeoffs
f i l ibl ti of various plausible options

Challenges
• Can simulation models and scenario analysis h l d i i k d t l help decision makers and natural resource managers to assess trade-offs and explore plausible options effectively and efficiently ?plausible options effectively and efficiently ?
• What are the essential factors for simulation models or model results to be valuable for decision making in natural resource management?

FALLOW Model
• Spatially explicit model developed in PC-Raster; agent-based learning and decision making.
• Integrating socio-economic and biophysical• Integrating socio-economic and biophysical processes
Ti t l• Time step: annual
• Spatial unit: ha of land (default)Spatial unit: ha of land (default)
van Noordwijk, M. 2002. Ecological Modelling, 149: 113-126

MODEL OVERVIEW
Extension Agent
Population density
Access to landExtension Agent
Carbon stocksWatershed function,
Biodiversity
Population density,Landscape resources, Cultural preferences Land use
& cover change
Farmers’ decision making & l i
Market access, I f t t
change
Aggregated
learningInitial drivers External
consequencesLandscape dynamics
Infrastructure,Land use technology
Plot level soil
fertility
Aggregated household economics
PricesMigration
Prices

Land use& cover changeSpatial access & attractiveness
Farmers’ decision making & learning
L bLearning
Land allocation
External information (β)
Land conversion & i
Potential area for expansion
Adjusting expected yield (Learning)
Labour allocation
Financial allocation
Learning style (α)
Land use & cover
Farmers’ decision
ki &
& succession( g) allocation
Landscape dynamicsInitial drivers External consequences
& cover change
Plot Aggregated h h ld
making & learning
qlevel soil fertility
household economics
Fi i l P fit bilit f
Soil fertility
Crop/plantgrowth & productivity
TradeLivelihoods (secon‐d ti )
Financial capital
Profitability of land & labour
Plot level soil fertility
Soil fertility
Yield WeatherAggregated household economics
Trade
Food consumption Storage
dary consumption)

Research Location
• Upper Konto catchment, East Java, Indonesia.
• Area of 233 km2 of State Forest Land (tree plantation)• Area of 233 km2 of State Forest Land (tree plantation), remnant forest (degraded), agricultural land
D. Suprayogo

Landscape issues and concernsDesignated Land Use in Upper Konto catchment, based on Land Use Planning (Rencana Tata Ruang Wilayah-RTRW) of 2002
Designated land use in Upper Konto catchment
Only 29% area is accessible and can be owned

Disturbed Forest
Agathis sp.
MahagonyPinus
mercusiiK. Hairiah

Landscape issues and concernsDesignated Land Use in Upper Konto catchment, based on Land Use Planning (Rencana Tata Ruang Wilayah-RTRW) of 2002
Conversion of State Forest Land into agricultural land - 1999
Community Forest Based Management - 2002
Planting crops in between ‘forest’ trees.

Landscape issues and concerns
Examples of existing systems in State Forest areas (early 80’s)
K. Hairiah
Coffee systems under Pinus Multistrata systems in Forest Protection area

Modelling objectives
To assess plausible land use policy options that can be beneficial for community and State Forest Companybeneficial for community and State Forest Company,
with aboveground carbon stocks (environmental services)with aboveground carbon stocks (environmental services) and secondary consumption/welfare as indicators

Scenarios
0. Conserving Forest Reserve and
P t ti F tProtection Forest
1. Full access to land
2. Conserving Forest Reserve
3. Similar to (2) with limited access
to Production Forest (only tree-
based systems allowed to grow)based systems allowed to grow)

Livelihood options
C ff t
Maize/Rice (non-intensive)
Coffee systems
Dairy Cattle
Cacao systems Horticulture (intensive)

Payoff to labour and payoff to land
Livelihood
ti
Return to
l b *
Return to land*
(US$ h 1)options labour (US$.personday-1)
(US$.ha-1)
Maize/rice 2,30 450,00Maize/rice 2,30 450,00
Horticulture 9,50 2100,00
Coffee systems¤ 5,00 900,00
Cacao systems¤ 7 50 1390 00Cacao systems 7,50 1390,00
Dairy cattle 5,50 not applicable

Preliminary Results

Landscape dynamics – baseline condition
Area (%)
Simulation Time (Year)
302520151050Year 2000

Contribution to Gross Income
Contribution (%)
Dairy Cattle
Year 2000302520151050

Welfare and carbon stocks dynamics
Year 2000Year 2000

Model Performance
2000 2005 Reference
Simulated

Model PerformanceActual 2006 SimulatedActual 2006 Simulated
Land cover Area (km2) Spatial
accuracy (%)Relative area difference (%)Actual Simulated
Agriculture 102 71 52 ‐45Agroforestry 20 24 52 18Forest Plantation 53 59 52 10Forest 51 56 71 7
Ideal 100 0

Scenarios
0. Conserving Forest Reserve and
P t ti F t tProtection Forest, access to
Production Forest
1. Full access to land
2. Conserving Forest Reserve
3. Similar to (1) but with limited
access to Production Forestaccess to Production Forest
(only tree-based systems allowed
to grow)to grow)

Landscape dynamics1. Full access to land0. Forest conservation, access to
Production Forest
Coffee CacaoForest plantationp
Maize
Horticulture
3 Conservation and limited access
ForestBush fallow
2. Conserving Forest Reserve 3. Conservation and limited access to Production Forest

Average aboveground carbon stocks (Mg ha-1)
Forest conservation + limited access 0.3 Mg/ha/year
Baseline
o est co se at o ted access
- 0.3 Mg/ha/year
g y
Conserving forest reserve
0.3 Mg/ha/year
- 0.9 Mg/ha/year
Full access to land
- 1.6 Mg/ha/year
Year 2000 Simulation time (year)

Welfare ($/capita)
Full access
Limited access, forest conservation
Year 2000 Simulation time (year)

Model results – Trade-offsRelative Carbon Additionality (%)
Welfare is not sensitive to simulated land use policy
hBest bet optionschange
Limited access
p
Relative Welfare Additionality (%)
Forest Reserve Consv.Forest Reserve Consv.
Full access

Findings suggests ....
• Limited access to Production Forest can maintain carbon stocks in the areamaintain carbon stocks in the area
• Current land use policy scenarios does not p ychange farmers’ welfare. Need other policy intervention
• Improve spatial accuracy of FALLOW (algorithm for new-plot )(algorithm for new plot )

Next steps ....
Get feedback from stakeholders
Model validation by users!Salience: is it relevant?Salience: is it relevant?Credibility: is it ‘true’ - accepted?Legitimacy: does it includes stakeholders’ interests?

Next steps ....
Model improvement
• Refine ‘new-plot’ module• Add ‘Green House Gas’ calculator – followed IPCC rule• Add ‘Soil Degradation’ module

Thank youThank you
Terima kasih