trade-offs in staying close: corporate decision making and ... making and geographic dispersion ......
TRANSCRIPT

Trade-offs in Staying Close: CorporateDecision Making and Geographic Dispersion
Augustin LandierStern School of Business, New York University
Vinay B. NairWharton School, University of Pennsylvania
Julie WulfHarvard Business School, Boston
We investigate whether the geographic dispersion of a firm affects corporate decisionmaking. Our findings suggest that social factors work alongside informationalconsiderations to make geography important to corporate decisions. We show that(i) geographically dispersed firms are less employee friendly; (ii) dismissals of divisionalemployees are less common in divisions located closer to corporate headquarters; and(iii) firms appear to adopt a ‘‘pecking order’’ and divest out-of-state entities beforethose in-state. To explain these findings, we consider both information and socialfactors. We find that firms are more likely to protect proximate employees insoft information industries (i.e., when information is difficult to transfer over longdistances). However, employee protection holds only when the headquarters is locatedin a less populated county, suggesting a role for social factors. Additionally, stockmarkets respond favorably to divestitures of in-state divisions. (JEL G34, J63, R30)
The locations of corporations have important consequences, from affectingthe design of cities and local employment, to the trends of urbanizationand inter-region trade. Consequently, one of the fundamental issues ineconomics relates to the location of production. Since, at least Marshall(1890), economists have noted that while some industries tend to clusteraround a geographic region, others remain separate. This has led tothe uncovering of several factors governing the choice of the corporatelocations.1
However, a related aspect of economic geography—the geographicdispersion of a firm—has received little attention. Does a firm that isconcentrated and localized in one region act differently from a firm
We would like to thank Joshua Coval, Itay Goldstein, Raghuram Rajan, Michael Roberts, AntoinetteSchoar, Todd Sinai, Per Stromberg, an anonymous referee and seminar participants at the SwedishInstitute of Financial Research, Wharton, University of Texas, NYU, and the NBER Corporate FinanceMeetings for helpful comments/discussions. Address correspondence to Julie Wulf, Harvard BusinessSchool, Soldiers Field Road, Boston, MA 02163, or e-mail: [email protected].
1 For excellent reviews see Fujita and Venables (1999); Fujita and Thisse (2002), and Duranton and Puga(2005).
© The Author 2007. Published by Oxford University Press on behalf of The Society for Financial Studies.All rights reserved. For Permissions, please email: [email protected]:10.1093/rfs/hhm042 Advance Access publication September 20, 2007
that is widely dispersed? Does the geographic dispersion of firms ormore specifically, the distance between divisions and headquarters, affectcorporate decision making? In this article, we document three distinctfindings that suggest this is indeed the case.2
First, we find geographically dispersed firms are less employee friendlyon the basis of an employee relations index.3 Second, using division-level data, divisions that are closer to headquarters are less likely to facelayoffs. Third, we find a pecking order in divestitures of divisions: divisionsfurther from headquarters are divested before closer divisions. We findthat the bias towards protecting proximate employees holds only if theheadquarters is located in a less populated county. Additionally, it takessignificantly poorer financial performance for firms to resort to divestinga proximate division, suggesting a managerial resistance to this type ofrestructuring.
While these results suggest a robust pattern of favoritism towardsemployees of proximate divisions, they say little about the underlyingmechanisms at work. There are at least two reasons why geographicdispersion and corporate decision making might be related. First,information quality may be compromised when the decision maker isfurther from the business for which the decision is relevant. For example,a CEO located in Rochester, New York, may have less informationto make a capital investment decision for a division located in BatonRouge, Louisiana. Distance is often used as a proxy for informationasymmetry (e.g., Coval and Moskowitz, 1999; Garmaise and Moskowitz,2004; and Grinblatt and Keloharju, 2001) since it affects the meansof information acquisition—impersonal means are more prevalent overlonger distances—and consequently the nature of information acquired(see, e.g., Petersen and Rajan, 2002). Hence, dispersion may be related toinformation flows inside organizations.4 Managers might react differentlyto economic shocks, depending on whether divisions are close or distant,because their information sets are different.
The second reason is that more frequent social interactions withproximate employees lead to a potential disconnect between managerialincentives and shareholder interests. Managers are more concerned about
2 Our aim is not to explain the choice of locating production in one region versus another, as in the literatureon firm clustering (e.g., Krugman, 1991), but to study the real effects of an organization being locatedacross several rather than in one.
3 Employee friendliness includes firm actions that determine the level of employee retirement benefits,employee healthcare benefits, profit-sharing programs, union relations, and employee involvement(discussed in more detail in Section 1).
4 Further support for this view is found in a recent case where Quiksilver Inc., the leading outdoor sportslifestyle company, acquired Rossignol, a French company. Subsequently, it announced a consolidationof the French firm’s various departments into a single 15-acre campus in the French Alps, citing betterinternal communication as an important reason.
1120
The Review of Financial Studies / v 22 n 3 2009

Trade-offs in Staying Close
employees with whom they interact more frequently.5 Additionally,managers of geographically concentrated firms are more visible andmore likely to weigh the implications of business decisions on theirsocial standing: firing or cutting the pay of neighbors can be a source ofembarrassment, especially in smaller communities. Managers internalizehow their decisions affect local employees and local community welfare.As a result, social considerations can lead to a conflict with shareholderwealth maximization.6
To investigate the link between distance and information flows, weclassify industries by the nature of information: hard versus soft.7 Ourmeasure of the prevalence of hard information is defined as the changein distance between banks and borrowing firms over time by industry.Petersen and Rajan (2002) document that this distance has increased overtime primarily due to innovations in information technology and credit-scoring techniques that now favor the use of hard information. Banks faraway from a borrowing firm rely more on impersonal means of informationcollection and, in turn, hard information. Conversely, industries wherethe distance between banks and firms has not increased are categorizedas soft information environments (more precisely, environments whereinformation cannot be cheaply hardened).
An interesting question to then ask is: Do differences in informationexplain the link between dismissals and proximity? Since informationquality about far and close divisions is no different when information isquantifiable, there should be no link between dismissals and proximityin hard information environments. However, the opposite is true withsoft information. During tough times, managers may have no choicebut to dismiss distant employees because of limited information; incontrast, richer information that comes from monitoring employeeslocated at headquarters or on the corporate campus may lead to lesssevere approaches. Consistent with this explanation, we find a stronger
5 Glaeser, Sacerdote, and Scheinkman (1996) and Glaeser (2004) recognize a relation between proximityand social interactions in studies of individual decisions such as residence in cities and aggregate outcomessuch as crime.
6 Several anecdotes suggest that senior executives are more reluctant to layoff local workers. One suchinstance is the relatively recent and widely publicized case of Boeing. Boeing moved its plant from Seattleto Chicago in May 2001 and the move triggered a negative reaction from unions: ‘‘It really makes it easierfor them to make those difficult public statements, like when you move wing production to Japan or moveworkers from Renton to Everett. Those decisions are easier to make when you’re sitting in an office inChicago.’’
7 Petersen (2004) describes soft information as information that cannot be easily codified into quantitativevariables. The interpretation of soft information is context-specific and requires the background knowledgeof the information collector implying that soft information is more costly to communicate to distant agents.This is because soft information (i) does not lend itself to being coded and (ii) requires the message sender tobe credible. By contrast, hard information is cheaper to communicate to distant agents as it is quantifiable,can be interpreted independently of the information collector, and cannot be easily distorted. Liberti(2005) shows in the context of bank lending, loans that are approved at the branch level rely significantlymore on soft information compared to loans approved at the headquarters level.
1121
dismissal-proximity relation in soft information environments. While thisfinding suggests information flows matter, it is also consistent with thenotion that personal interactions are important since they are more intensewhen information is soft.
Although closer proximity to gather information goes hand in handwith more frequent social interactions, we shed some light on the relativeimportance of social interactions per se by investigating whether thedismissal-proximity link is stronger when the manager is more visible inthe community. We find that employee protection holds only when the firmheadquarters is located in a less populated county. This suggests that socialfactors also play a role in corporate decision making and informationalarguments do not completely explain our findings. Taken together,the evidence suggests that informational constraints of geographicallydispersed firms and social interactions, whether they increase managerialconcern for employees or status in the community, are both importantdeterminants of the link between geographic dispersion and corporatedecision making.
We then investigate one last implication. If proximity to employees leadsto misalignment of managerial incentives with shareholder objectives, suchproximity should be detrimental to shareholder value. To check this, weinvestigate whether the stock market response to divestitures varies byproximity of the business unit to headquarters.8 We show a positivemarket reaction to in-state divestitures, which is significantly higher thanout-of-state divestitures and which is higher when the company doessuch a divestiture for the first time (in the data). This suggests that thewillingness to divest within a state is a positive signal about a manager’sobjective (shareholder friendliness). Moreover, the effect is stronger whenthe divesting headquarters is located in a less populated county. Thisfinding is consistent with Lerner, Schoar, and Wong (2005) who find, inthe context of private equity, that limited partners who get higher returnsinvest less in proximate funds.
Our findings contribute to at least four different areas of research. First,these findings shed light on the use of different restructuring mechanismsavailable to a firm. Cost savings through employee layoffs are more likelyin dispersed firms while other mechanisms are more likely in concentratedfirms. Additionally, we also highlight the role of geographic dispersionand the use of divestitures to restructure.
Second, the article contributes to the growing literature on corporategovernance.9 The findings highlight a limitation of external governance
8 We realize that a naıve cross-section regression is unlikely to provide an answer to that question, sincegeographic dispersion is an endogenous decision that takes into account, as an example, informationflows. However, stock market responses to divestitures allow us to explore the efficiency cost of managerialconcern for employees.
9 Shleifer and Vishny (1997) and Becht, Bolton, and Roell (2002) survey this literature.
1122
The Review of Financial Studies / v 22 n 3 2009
Trade-offs in Staying Close
mechanisms and document the importance of a fundamental firmcharacteristic in how firms treat their employees. Additionally, the vastliterature on corporate governance that aligns managerial interests to thatof shareholders has ignored the role of employees (see Pagano and Volpin(2005) for an exception). This article takes the view that the three partiesinteract and the manager plays a crucial role in determining the sharingrule between shareholders and employees.
Third, our results are a step towards a better understanding ofmanagerial ‘‘private benefits,’’ a notion that has been widely employed incorporate finance theory. While the notion is broad, the importance andthe source of nonpecuniary private benefits have not yet been highlighted.This article provides a channel—social interaction—that gives rise to suchnonpecuniary private benefits that can engender agency costs betweenshareholders and managers. Further, the article highlights that suchconsiderations can have important effects on firm decisions.
Fourth and finally, the findings contribute to the discussion in urbaneconomics where corporate presence is often considered an engine for localgrowth and employment. This is also evident from competition betweenstates to attract corporate headquarters.10 The findings suggest that therelation between corporate presence and local economic outcomes dependson the distance of divisions to headquarters.11
We now proceed to discuss the data used in the article (Section 1).Section 2 documents the relation between geographic dispersion andthree separate corporate decisions. Section 3 focuses on performanceimplications through divestitures. Section 4 investigates the importance ofinformation and social factors. Section 5 is the conclusion.
1. Data
In addition to financial information from Compustat, we use threeadditional sources of data: information on firm-level treatment ofemployees from the SOCRATES database provided by KLD Analytics,division-level data from Hewitt Associates, and divestiture data fromSecurity Data Corporation (SDC). We describe the first two datasetsbelow.
1.1 Firm-level employee treatmentSOCRATES is a proprietary database program that provides access toKLD’s ratings and other data pertaining to the social records of a subset
10 In the context of the aforementioned Boeing case, four states were competing to attract Boeing to theirrespective states.
11 This can justify the high level of concern expressed by local politicians or national governments when adistant firm takes over a local company.
1123
of publicly traded companies in the United States between 1991 and 2003.The subset of companies is large—ranging from approximately 500 in1991 to over 3000 by 2003. The increase is mainly due to the inclusion ofcompanies outside the S&P 500, specifically the Russell Indices.
To assign social ratings for this subset of US companies, KLD researchrelies on four distinct categories of data sources. Data are collected froma wide variety of company filings, government data, nongovernmentorganizations, and general media sources.12 Sector-specific analysts thenuse this information to assign strengths and concerns. Companies are ratedin seven major qualitative areas: environment, community, corporategovernance, diversity, employee relations, human rights, and productquality and safety.
The database thus consists of screens that are used to assign strengths andconcerns with respect to different activities that have an immediate socialimpact. Each screen assigns a 0/1 score for a particular social indicatorand is part of an overall evaluation of corporate social performance. Ofinterest to us are screens related to employee treatment. To proxy for afirm’s treatment of employees, we compile what we refer to as the E-indexbased on the strengths in KLD (also, see Fisman, Nair, and Heal, 2005).This index uses five employee-based corporate social responsibility (CSR)screens that the database tracks through the period. Although KLD doesnot provide the specific (proprietary) framework used to generate thesescreens, a description of the screens used for the study is provided below.13
1. Strong union relations: The company has a history of notably strongunion relations.
2. Cash profit sharing: The company has a cash profit-sharing programthrough which it has recently made distributions to a majority of itsworkforce.
3. Employee involvement: The company strongly encourages workerinvolvement and/or ownership through stock options available toa majority of its employees, gain sharing, stock ownership, sharingof financial information, or participation in management decisionmaking.
4. Strong retirement benefits: The company has a notably strongretirement benefits program.
5. Family benefits: The company has outstanding employee benefits orother programs addressing work/family concerns, (e.g., childcare,elder care, or flextime).
12 See http:/kld.com for more details.13 KLD uses this database to monitor a firm’s social responsibility, and this forms the basis of the Domini 400
Social Index—the first and largest socially screened index in the world. The fund manages over $1.8 billionin socially responsible investment vehicles, such as the Domini Social Equity Fund, the Domini SocialBond Fund, and the Domini Money Market Account. This suggests that the collected data are meaningful.
1124
The Review of Financial Studies / v 22 n 3 2009
Trade-offs in Staying Close
Thus, our E-index is based on five CSR screens that track a firm’sactions towards employees throughout the period.14 Summing over theseindicator variables by firm-year, our E-index ranges between 0 and 5: ahigher value represents better employee treatment. We use the E-index asa firm-level measure of employee treatment.
At least two concerns with this index merit discussion. First, KLDattempts to gather information about a firm’s attitude toward its entireworkforce and not simply its top management or a specific set of employees.This is indicated clearly in some screens (e.g., profit sharing and employeeinvolvement) by their emphasis on a ‘‘majority’’ of the workforce. In othercases the attention is on firm-wide policies (such as retirement and familybenefits). Second, while we interpret our index as a measure of employeetreatment, it is likely that it is related to the ‘‘importance’’ of employees orskill level more broadly. A firm in a sector in which human capital is moreimportant than physical capital (or assets) might indeed have a higherE-index. However, if average skill levels are comparable across firms inthe same sector, variation in the index might capture employee treatmentbeyond that due to skill differences. In any case, our interpretation ofresults based on the index needs to be mindful of these caveats.
1.2 Data on firm divisionsInformation at the division level is gathered from Hewitt Associates,a leading human resources consulting firm specializing in executivecompensation and benefits. The dataset includes a panel of more than 250publicly traded US firms over the years 1986–1999, spanning a numberof industries. The data are collected from a confidential compensationsurvey conducted by Hewitt Associates. The survey is the largest privatecompensation survey (as measured by the number of participating firms)and the survey participants are typically leaders in their sectors. Morethan 75% of the firms in the dataset are listed as Fortune 500 firms in atleast one year and more than 85% are listed as Fortune 1000 firms. Thesefirms represent a significant fraction of the activity of publicly tradedfirms in the US. On the basis of all firms covered in Standard and Poor’sCompustat database over the period of study, the survey participantsrepresent approximately 33% of employees, 30% of sales, 20% of assets,and 40% of market value. If we limit the analysis to manufacturing firms,the Hewitt firms represent 42% of employees, 38% of sales, 39% of assets,and 52% of market value.
In general, Hewitt survey participants also participate in othercompensation consulting firm surveys (e.g., Hay Associates, Mercer,Towers Perrin, to name a few) and do so primarily to receive information
14 The database also has other screens that, however, only exist for part of the sample period. We usedscreens that were available for the entire sample period of 1992 to 2004.
1125
about pay practices to use as a competitive benchmark in evaluating theirown compensation programs. It is important to note that the sampleincludes many more firms than Hewitt’s compensation consulting clients.On the basis of several analyses described in Appendix A, we conclude thatthe survey sample is probably most representative of Fortune 500 firms.
An observation in the dataset is divisional information within a firm ina year. In the survey, a division is defined as ‘‘the lowest level of profitcenter responsibility for a business unit that engineers, manufactures, andsells its own products.’’ To ensure consistency in matching these positionsacross firms, the survey provides benchmark position descriptions andcollects additional data for each position leading to a dataset rich inposition characteristics. As a result, in addition to data on all aspectsof compensation for multiple divisional manager positions, the datasetincludes division-specific characteristics such as: job title, the title of theposition to whom the position reports (i.e., the position’s boss), divisionsales, number of employees under the position’s jurisdiction, industry ofoperation, and geographic state of location, among others.
We believe the survey data are accurate for several reasons. First, Hewittpersonnel are knowledgeable about survey participants because they areassigned to specific participants for several years. Furthermore, whilethe participating firms initially match their positions to the benchmarkpositions in the survey, Hewitt personnel follow up to verify accuracyand spend an additional 8–10 hours on each questionnaire evaluating theconsistency of responses with public data (e.g., proxy statements) andacross years. Finally, participants have an incentive to match positionscorrectly and provide accurate data because they use the survey results toset pay levels and design management compensation programs.
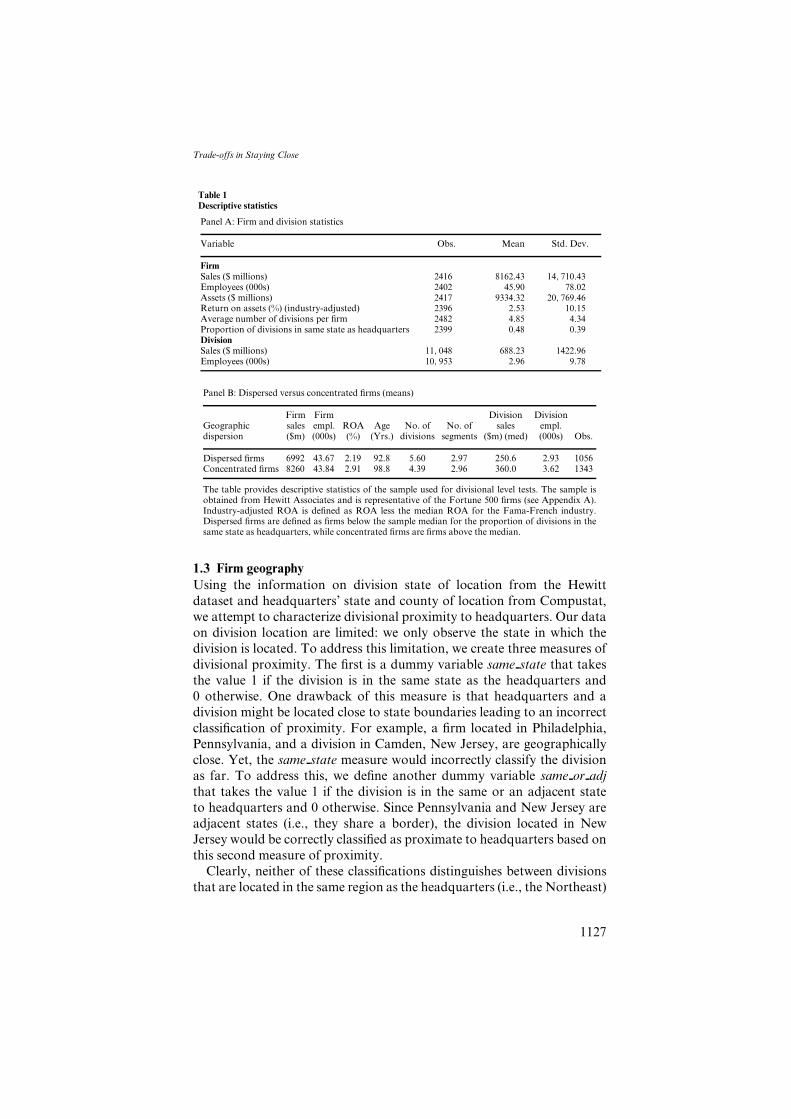
In Table 1 (Panel A), we present descriptive statistics for the firmsand divisions in the sample. While the dataset includes more than 250firms, the exact number varies over the period, as firms enter and exit assurvey participants. The firms in the sample are large, well-established,and profitable with an average size of approximately 45,900 employees,sales of $8.2 billion, industry-adjusted return on assets (ROA) of 2.5%,and sales growth of 6%. The average number of divisions reported inthe survey for the sample firms is approximately five. Next, turning todivisional statistics, the mean size of divisions is $688 million in salesand approximately 3000 employees.15 Finally, the sample firms spanmany industrial sectors of the economy, with some concentration in thefood, paper, chemical, machinery, electrical, transportation equipment,instrumentation, communications, and utilities industries.
15 Although, the total number of division-year observations is around 11,000, our divisional regressions usea much lower number. This is because our tests rely on divisional changes in sales and employment andthus can only use those division-years for which the preceding year’s information is available.
1126
The Review of Financial Studies / v 22 n 3 2009
Trade-offs in Staying Close
Table 1Descriptive statistics
Panel A: Firm and division statistics
Variable Obs. Mean Std. Dev.
FirmSales ($ millions) 2416 8162.43 14, 710.43Employees (000s) 2402 45.90 78.02Assets ($ millions) 2417 9334.32 20, 769.46Return on assets (%) (industry-adjusted) 2396 2.53 10.15Average number of divisions per firm 2482 4.85 4.34Proportion of divisions in same state as headquarters 2399 0.48 0.39DivisionSales ($ millions) 11, 048 688.23 1422.96Employees (000s) 10, 953 2.96 9.78
Panel B: Dispersed versus concentrated firms (means)
Firm Firm Division DivisionGeographic sales empl. ROA Age No. of No. of sales empl.dispersion ($m) (000s) (%) (Yrs.) divisions segments ($m) (med) (000s) Obs.
Dispersed firms 6992 43.67 2.19 92.8 5.60 2.97 250.6 2.93 1056Concentrated firms 8260 43.84 2.91 98.8 4.39 2.96 360.0 3.62 1343
The table provides descriptive statistics of the sample used for divisional level tests. The sample isobtained from Hewitt Associates and is representative of the Fortune 500 firms (see Appendix A).Industry-adjusted ROA is defined as ROA less the median ROA for the Fama-French industry.Dispersed firms are defined as firms below the sample median for the proportion of divisions in thesame state as headquarters, while concentrated firms are firms above the median.
1.3 Firm geographyUsing the information on division state of location from the Hewittdataset and headquarters’ state and county of location from Compustat,we attempt to characterize divisional proximity to headquarters. Our dataon division location are limited: we only observe the state in which thedivision is located. To address this limitation, we create three measures ofdivisional proximity. The first is a dummy variable same state that takesthe value 1 if the division is in the same state as the headquarters and0 otherwise. One drawback of this measure is that headquarters and adivision might be located close to state boundaries leading to an incorrectclassification of proximity. For example, a firm located in Philadelphia,Pennsylvania, and a division in Camden, New Jersey, are geographicallyclose. Yet, the same state measure would incorrectly classify the divisionas far. To address this, we define another dummy variable same or adjthat takes the value 1 if the division is in the same or an adjacent stateto headquarters and 0 otherwise. Since Pennsylvania and New Jersey areadjacent states (i.e., they share a border), the division located in NewJersey would be correctly classified as proximate to headquarters based onthis second measure of proximity.
Clearly, neither of these classifications distinguishes between divisionsthat are located in the same region as the headquarters (i.e., the Northeast)
1127

from divisions that are located across the country. To capture thisconfiguration, we define another measure of proximity. We calculatethe spherical distance as the number of miles between the longitude andlatitude of the county of headquarters and that of the most denselypopulated county in the division’s state. We take the logarithm of thismeasure (ldistance). This measure better captures proximity (or distance)between firms and divisions that are located on opposite sides of thecountry. However, it is a noisy measure for other configurations.16
Importantly, all three measures are highly correlated. The correlationbetween same state and same or adj = 0.87; same state and ldistance= −0.80; and same or adj and ldistance = −0.82. We recognize that eachproximity measure has its drawbacks. Instead of relying on one measure,our approach is to evaluate the robustness of our results to each.
In addition to measures of divisional proximity, we construct a firm-levelmeasure of distance by computing the fraction of divisions in the samestate as headquarters (psame state). In Table 1 (Panel B), we compare theemployment, sales, and performance of geographically concentrated andgeographically dispersed firms. As can be seen from this table, firms inthese two categories are largely similar in terms of firm employees, sales,and performance. Concentrated firms have bigger and fewer divisions thandispersed firms and both types of firms have a similar number of businesssegments.
2. Geographic Dispersion and Corporate Decision Making
We now investigate whether geographic dispersion of firms is relatedto three separate corporate actions: employee friendliness, layoffs ofdivisional employees, and divestitures.
2.1 Employee friendlinessUsing the E-index as a measure of how friendly firms are to their employees,we investigate whether geographic dispersion and employee friendlinessare related. As described earlier, the geographic concentration of a firm iscaptured by the fraction of divisions that are in the same state as that ofthe headquarters.
In Column I of Table 2, we regress the E-index on geographicconcentration and control for the logarithm of firm employees and sales,industry-adjusted ROA, and the firm’s fraction of divisions operating in
16 For example, the number of miles between a firm headquartered in New York and a division located inCalifornia is large. However, let us consider a division located in Rochester, New York, with headquarterslocated in Stamford, Connecticut. In this case, the distance measure understates the true distance becauseit would calculate the number of miles between New York City and Stamford (which is small) instead ofRochester and Stamford (which is large). In this particular example, the least biased measure is the sameor adjacent state indicator.
1128
The Review of Financial Studies / v 22 n 3 2009

Trade-offs in Staying Close
Table 2Employee treatment and geographic dispersion
I II III IV
Fraction of divisions in 0.396*** 0.432*** 0.435*** 0.360***
state of headquarters (0.125) (0.118) (0.130) (0.120)Industry R&D-intensity 1.236
(1.037)Firm R&D-intensity 4.932***
(1.283)Log firm employees −0.112 −0.077 −0.156 −0.125
(0.073) (0.066) (0.108) (0.118)Log firm sales 0.349*** 0.319*** 0.449*** 0.294**
(0.085) (0.076) (0.100) (0.125)Industry-adjusted ROA 0.002 0.005 −0.002 0.001
(0.005) (0.005) (0.004) (0.004)Diversification 0.039 −0.049 0.133 −0.005
(0.137) (0.129) (0.151) (0.152)Vulnerability to 0.031
takeovers (24-GIM (0.024)Index)
Ownership of −0.027***
blockholders (0.009)Year controls Yes Yes Yes YesIndustry controls Yes No No YesObservations 949 941 724 529R-squared 0.29 0.20 0.29 0.33
The table investigates the relation between an index of employee friendliness (E-index),which includes union relations, healthcare benefits, retirement benefits, employee involvement,and cash profit-sharing programs (see text for detailed description) and a firm’s geographicconcentration. The regressions use firm-year observations. Geographic concentration ismeasured as the fraction of divisions in the same state as that of the headquarters. IndustryR&D-intensity is defined as the average of the ratio of R&D expenditures to sales for the firmsin the 2-digit SIC industry. We control for log firm employees, log firm sales, industry-adjustedROA (defined as ROA less the median ROA for the Fama-French industry of the firm), firmdiversification measured by the fraction of divisions in the same 3-digit SIC industry as that ofthe firm, and governance standards (vulnerability to takeovers (24-GIM Index) and ownershipof blockholders, see text for a description). All models include year controls; models I and IIIinclude 2-digit SIC industry controls; robust standard errors in parentheses clustered at the firmlevel. * Significant at 10%; ** Significant at 5%; *** Significant at 1%.
the same industry as the firm. We include both year- and industry-fixedeffects (2-digit SIC code) and report standard errors clustered at the firmlevel. Our E-index might be correlated with the importance of humancapital in the industry; for example, firms in the medical device industrymight treat their employees better than firms in paper manufacturing.To address this concern, we include industry-fixed effects to control fordifferences in average skill level by industry. In Column I, we find thatgeographically concentrated firms are friendlier to their employees thantheir industry peers.17
17 Since the employee friendliness index is a count measure, we also estimate negative binomial regressionsand find that the results are qualitatively similar.
1129

In Column II of Table 2, we replace the industry controls with a measureof the importance of human capital in the industry (i.e., the average R&D-intensity defined as the ratio of R&D expenditures to sales). In ColumnIII, we include firm R&D-intensity. We find that the positive coefficienton geographic concentration is robust to the inclusion of either industryor firm measures of human capital. Importantly, the magnitude of thecoefficient is very stable to the inclusion of these various controls.
One interesting question is whether shareholder control is correlated withemployee friendliness. We might expect firms with governance structuresthat protect shareholder interests to be less friendly to employees. Weinclude two commonly used corporate governance variables. The firstmeasure, denoted by EXT, captures the external vulnerability of firms totakeovers and is a simple transformation (EXT = 24 − G) of the indexcompiled by Gompers, Ishii, and Metrick (2003). The second measureproxies for the presence of a large external blockholder where a blockholderis defined to be a shareholder with greater than 5% of firm ownership.BLOCKC is a dummy variable equal to one if a large external blockholderis present. In Column IV of Table 2, we still find a positive link betweengeographic concentration and employee treatment. More interestingly,the coefficient on the blockholder variable is negative. That is, firmswith stronger governance are less friendly to employees. This finding issuggestive of the tension between shareholder and employee objectives, anissue we return to in Section 3.
2.2 Divisional proximity and layoffsIn this section, we investigate whether dismissals or layoffs of divisionalemployees are associated with the division’s geographic proximity toheadquarters. We analyze the likelihood of layoffs using divisional datafrom Hewitt.18 Since we do not observe layoffs, we infer them from changesin the number of employees within a division between years. Employeescan voluntarily leave firms, and since the change in numbers of employeesreflects only the change net of hiring and firing, layoffs are more likelywhen there is a significant drop in the number of employees.
Table 3 reports results of division-level logit estimations where thedependent variable is a dummy variable that takes the value one if layoffsare observed within a division (i.e., a decline of 50 or more employees) andzero otherwise.19 The independent variable of greatest interest is whetherthe division is located in the same state as headquarters (same state).20
18 We believe that there is a fixed cost of firing, which is consistent with the logit specification and the analysisof the probability of a layoff greater than a certain threshold. However, we also analyze the severity oflayoffs in Appendix B.
19 The results are robust to using other layoff thresholds such as 75, 150, and 300 (2.5, 5, and 10% of averagedivision size, respectively).
20 Subsequently, we will evaluate other measures of proximity.
1130
The Review of Financial Studies / v 22 n 3 2009

Trade-offs in Staying Close
We also include other divisional characteristics such as the logarithm ofthe number of division employees and divisional sales growth. To addressconcerns that our results are driven by unobserved firm heterogeneity, wecontrol for several firm characteristics: the logarithm of firm sales, thelogarithm of the number of employees, and the firm’s industry-adjustedROA. We also include a measure of the change in industry employmentfor the entire Compustat sample (matching the industry to the division’s2-digit SIC industry). All specifications include year controls and controlsfor the division’s state of location. Finally, we report standard errors thatare clustered at the division level.21
Turning to Table 3 Column I, we find that large divisions, poorlyperforming divisions, divisions in industries experiencing declines inemployment, and divisions in larger firms are more likely to witnesslayoffs. Of greatest interest, we find a negative and significant coefficienton the same state indicator, which suggests that divisions located in thesame state as headquarters are less likely to face layoffs. Proximity toheadquarters is associated with a 3.5% lower probability of facing layoffscontrolling for division and firm characteristics.
One possible explanation for this result is that high-skill workers areboth closer to headquarters and less likely to face layoffs, simply becauseof the type of assignment they have. Using data from the US CurrentPopulation Survey, for each 3-digit SIC code by year, we calculate theproportion of workers that are 25 years or older with greater than a highschool education. We match industry-year education levels to divisional3-digit SIC codes for each division (dabovehs). In Column II of Table 3, weinclude this measure of education to evaluate if the link between proximityand layoffs is due to differences in education or skill levels of workers thatare in the same state as headquarters. We do find that in-state divisionsare more likely to have more educated employees (the correlation betweensame state and dabovehs is 0.04). Importantly, the link between proximityand layoffs is robust to the inclusion of this education/skill proxy.
What if important divisions are closer to headquarters and witness fewerlayoffs? Divisions with the same industry classification as that of the firmare likely to be central to the firm’s business. In Column III of Table 3, weinclude a variable that captures whether the division operates in the sameindustry as that of the firm. And, even though important divisions arecloser to headquarters (the correlation between same state and same sic3is 0.05), the link between layoffs and proximity is independent of therelation.
21 Clustering standard errors at the division level recognizes that observations for a division across yearsare not independent. Another approach is to cluster standard errors at the firm level. Since the statisticalsignificance of coefficients are similar for both approaches, we choose to report standard errors clusteredat the division level.
1131

Tab
le3
Div
isio
nall
ayof
fsan
dpr
oxim
ity
III
III
IVV
VI
VII
VII
IIX
Div
isio
nan
dfir
min
sam
est
ate
−0.1
82**
−0.2
04**
−0.1
72**
−0.1
69**
−0.1
98**
(0.0
78)
(0.0
96)
(0.0
79)
(0.0
79)
(0.0
79)
Log
divi
sion
empl
oyee
s0.
343**
*0.
329**
*0.
346**
*0.
344**
*0.
343**
*0.
346**
*0.
346**
*0.
357**
*0.
356**
*
(0.0
33)
(0.0
39)
(0.0
33)
(0.0
33)
(0.0
33)
(0.0
33)
(0.0
33)
(0.0
34)
(0.0
34)
Div
isio
nsa
les
grow
th−1
.077
***
−1.3
25**
*−1
.077
***
−1.0
76**
*−1
.456
***
−1.0
80**
*−1
.482
***
−1.1
88**
*−0
.312
(0.1
99)
(0.2
19)
(0.1
99)
(0.1
99)
(0.2
72)
(0.1
99)
(0.3
04)
(0.2
27)
(0.3
21)
Log
firm
empl
oyee
s0.
215**
*0.
168**
0.21
9***
0.22
5***
0.20
0***
0.21
2***
0.20
1***
0.24
1***
0.23
5***
(0.0
68)
(0.0
84)
(0.0
68)
(0.0
68)
(0.0
68)
(0.0
68)
(0.0
68)
(0.0
71)
(0.0
70)
Log
firm
sale
s−0
.058
0.03
8−0
.064
−0.0
67−0
.048
−0.0
58−0
.050
−0.0
98−0
.093
(0.0
67)
(0.0
87)
(0.0
67)
(0.0
67)
(0.0
67)
(0.0
67)
(0.0
67)
(0.0
71)
(0.0
71)
Indu
stry
-adj
uste
dR
OA
−0.0
08−0
.017
***
−0.0
08−0
.008
−0.0
09−0
.008
−0.0
09−0
.009
−0.0
10(0
.006
)(0
.006
)(0
.006
)(0
.006
)(0
.006
)(0
.006
)(0
.006
)(0
.007
)(0
.007
)In
dust
rygr
owth
inem
ploy
men
t−2
.649
***
−2.0
89*
−2.6
30**
*−2
.525
***
−2.6
48**
*−2
.660
***
−2.6
31**
*−2
.372
***
−2.4
10**
*
(0.8
14)
(1.1
48)
(0.8
17)
(0.8
17)
(0.8
17)
(0.8
12)
(0.8
12)
(0.8
81)
(0.8
84)
Indu
stry
prop
orti
onof
wor
kers
>hi
gh0.
551
scho
oled
ucat
ion
(0.3
35)
Div
isio
nin
sam
ein
dust
ryas
firm
−0.1
13(0
.077
)D
iver
sific
atio
n−0
.186
*
(0.1
02)
Sam
est
ate
×di
v.Sa
les
grow
th0.
691*
(0.3
69)
Div
isio
nan
dfir
min
sam
eor
adj.
stat
e−0
.195
**−0
.211
***
(0.0
78)
(0.0
78)
1132
The Review of Financial Studies / v 22 n 3 2009

Trade-offs in Staying Close
Tab
le3
(Con
tinu
ed)
III
III
IVV
VI
VII
VII
IIX
Sam
eor
adj.
stat
e×
div.
sale
sgr
owth
0.64
6*
(0.3
85)
Log
dist
ance
betw
een
firm
coun
tyan
d0.
062**
0.06
0*
divi
sion
stat
e(0
.031
)(0
.031
)L
ogdi
stan
ce×
div.
sale
sgr
owth
−0.1
81**
*
(0.0
62)
Yea
rco
ntro
lsY
esY
esY
esY
esY
esY
esY
esY
esY
esD
ivis
ion
stat
eco
ntro
lsY
esY
esY
esY
esY
esY
esY
esY
esY
esO
bser
vati
ons
5975
3992
5975
5975
5975
5975
5975
5133
5133
Thi
sta
ble
inve
stig
ates
the
link
betw
een
the
likel
ihoo
dof
ala
yoff
and
divi
sion
alpr
oxim
ity
tohe
adqu
arte
rs.
The
depe
nden
tva
riab
leis
layo
ffan
dis
defin
edas
adu
mm
yva
riab
leeq
ualt
oon
eif
ther
eis
asi
gnifi
cant
decr
ease
inem
ploy
men
tatt
hedi
visi
onle
vel(
>50
empl
oyee
sor
1.7%
ofav
erag
edi
visi
onsi
ze).
We
mea
sure
divi
sion
alpr
oxim
ity
usin
gth
ree
mea
sure
s:w
heth
erth
edi
visi
onis
inth
esa
me
stat
eas
head
quar
ters
,w
heth
erth
edi
visi
onis
inth
esa
me
oran
adja
cent
stat
eto
head
quar
ters
,and
the
loga
rith
mof
the
num
ber
ofm
iles
betw
een
the
head
quar
ters
coun
tyan
dth
em
ost-
popu
late
dco
unty
inth
edi
visi
on’s
stat
e.W
eal
soco
ntro
lfor
loga
rith
mof
divi
sion
empl
oyee
s,di
visi
onsa
les
grow
th,l
ogar
ithm
offir
mem
ploy
ees,
loga
rith
mof
firm
sale
s,in
dust
ry-a
djus
ted
RO
A(d
efine
das
RO
Ale
ssth
em
edia
nR
OA
for
the
Fam
a-F
renc
hin
dust
ryof
the
firm
),an
dag
greg
ated
chan
gein
empl
oym
ent
inth
edi
visi
on’s
indu
stry
.C
olum
nII
incl
udes
aco
ntro
lre
late
dto
the
prop
orti
onof
wor
kers
wit
hgr
eate
rth
anhi
ghsc
hool
educ
atio
nfo
rth
edi
visi
on’s
3-di
git
SIC
indu
stry
.Col
umns
III
and
IVin
clud
eco
ntro
lsre
late
dto
divi
sion
alim
port
ance
—w
heth
erth
edi
visi
onis
insa
me
3-di
git
SIC
indu
stry
asth
efir
m—
and
ale
vel
ofdi
vers
ifica
tion
that
mea
sure
sth
efr
acti
onof
divi
sion
sin
the
sam
e3-
digi
tSI
Cin
dust
ryas
that
ofth
efir
m.
All
spec
ifica
tion
sar
elo
git
mod
els
and
incl
ude
year
and
divi
sion
stat
efix
edef
fect
s;ro
bust
stan
dard
erro
rsin
pare
nthe
ses
clus
tere
dat
the
divi
sion
leve
l.*Si
gnifi
cant
at10
%;**
Sign
ifica
ntat
5%;**
*Si
gnifi
cant
at1%
.
1133
Another possible explanation is that it is easier to redeploy employeescloser to the headquarters during downturns. Since redeploymentopportunities are likely to be higher in diversified firms than in focusedfirms, one might expect to observe lower layoffs in diversified firms.However, we find no such effect. In Table 3 Column IV we show that thelayoff-proximity link is robust to controlling for firm-level diversificationas proxied by the proportion of divisions in the same 3-digit SIC code asthat of the firm (psame sic3).
Next, we ask whether headquarters treats proximate divisionsdifferently, particularly during tough economic times. We characterizetough times using two different measures: divisional performance andaggregate labor growth in the division’s industry. We introduce aninteraction term between same state and divisional sales growth.22 Thepositive coefficient suggests that the favorable treatment of closer divisionsis stronger when the division is performing poorly (Table 3, Column V). Inother words, layoffs are less sensitive to performance for in-state divisions.When we use labor growth of the division’s industry as a performancemeasure, we find no such result (unreported).
Since we observe only the division’s state of location, we consider twoadditional measures of distance between headquarters and divisions. Inthe remaining columns in Table 3, we repeat select regressions using theseadditional measures (described in detail earlier in Section 1): whetherthe firm and division are located in the same or adjacent states, and thelogarithm of the number of miles between the headquarters county andthe most densely populated county in the division’s state. The results arequalitatively similar using these alternative measures. We find a lowerprobability of layoffs when a division is located in either the same or anadjacent state to headquarters, and layoffs in proximate divisions are lesssensitive to performance (Table 3 Columns VI and VII). Also, we finda higher probability of layoffs when the division’s state is further fromheadquarters’ county, and layoffs in far divisions are more sensitive toperformance (Columns VIII and IX).
In sum, we find that divisions that are closer to headquarters areless likely to experience layoffs. Also, layoffs in closer divisions are lesssensitive to divisional performance. These results hold for three measuresof proximity and are not simply explained by differences in proximatedivisions due to skill levels, the importance of the division to the firm, orthe ease in redeployment of divisional employees.
22 We find similar results controlling for a measure of relative performance (divisional sales growth minusthe firm-level weighted average of divisional sales growth), which alleviates concerns that our results mightbe driven by remote plants being the less productive. We actually find no significant correlation betweensame state and relative sales growth.
1134
The Review of Financial Studies / v 22 n 3 2009

Trade-offs in Staying Close
2.3 DivestituresWe now analyze the decision to divest a division to check if our findingslinking proximity and corporate decision making hold true in yet anothercontext. Firms do not only react to poor performance by laying offemployees but also by divesting divisions (e.g., Ofek, 1993 or Shleifer andVishny, 1992). If headquarters are reluctant to let closeby employees go(e.g., because managers know that employees of divested entities will getless favorable treatment postdivestiture), divestitures of divisions withinthe headquarters’ state should occur after other types of restructuringoptions have been exhausted. In particular, divestitures of divisions outsideheadquarters’ state should occur prior to divestitures of nearby plants.Using SDC platinum, we collect divestiture deals completed between 1990and 2004. SDC allows us to identify the divesting entity through its Cusip(‘‘target ultimate parent’s cusip’’).23 After merging with Compustat, wehave a total of 12,783 divestitures, corresponding to 4190 different parentcompanies. Forty-one percent of these divested entities are in the state oftheir initial parent’s headquarters.
We first document the existence of a pecking order in divestiturepreferences by looking at statistical properties of the firm-level time seriesof divestitures. Analyzing companies for which multiple divestitures areobserved, we look at whether in-state divestitures tend to occur afterout-of-state divestitures. First, within the history of each firm, we comparethe characteristics of divestitures (in-state versus out-of-state) to those thatoccurred previously. Our goal is to show that in-state divestitures tend tooccur after out-of-state possibilities have been exhausted. While 49% of thein-state divestitures happen after an out-of-state divestiture has occurred,only 25% of the out-of-state divestitures occur after an in-state divestiture.As the aggregate numbers of in-state and out-of-state divestitures areroughly similar, this sharp asymmetry in the time series is suggestive of apecking order whereby firms react to the need to restructure by divestingremote entities first, and only as a last resort, closer-by entities.
We can perform a more rigorous test of the fact that in-state divestiturestend to be clustered after out-of-state divestitures in the typical time seriesof divestitures. For that purpose, we put a bit of formal structure on theproblem. Consider a large multiplant company i. We now formalize asimple model of divestitures under a ‘‘no pecking order’’ assumption, sothat we can reject one of its main predictions. The absence of a peckingorder means that divesting costs are independent of geographic location.When the company needs to divest, it chooses a plant independently ofits location: The probability that the divested plant is in-state shouldsimply be equal to the fraction pi(t) of plants that are in-state at time t .
23 The divestitures in SDC broadly represent divestitures of business entities including divisions, subsidiaries,and plants.
1135

Therefore, if γ i(t) is the Poisson probability of a divestiture occurringat time t (γ can vary, e.g., with the financial stress of the company), theprobabilities of in versus out-of-state divestitures are respectively pi(t)γ (t)
and (1 − pi(t))γ (t).We assume that geographic dispersion of companies is stable (which
is also a consequence of the absence of a pecking order in the firmpolicy), so that pi(t) = pi .24 In our data, we observe the time series ofdivestitures between 1990 and 2004. Under the ‘‘no pecking order’’ modelof divestitures we just sketched, the mean date of an out-of-state divestitureshould be equal to the mean date of an in-state divestiture:
Tin-state =∫ T
0 piγ i(t)tdt∫ T
0 piγ i(t)dt=
∫ T
0 γ i(t)tdt∫ T
0 γ i(t)dt
=∫ T
0 (1 − pi)γ i(t)tdt∫ T
0 (1 − pi)γ i(t)dt= Tout-of-state (1)
This is the null we want to reject. The advantage of this simple model is thatit requires no assumption of homogeneity across companies. To reject thenull hypothesis of ‘‘no pecking order,’’ we compute for each company thatexhibits both types of divestitures the mean date of in-state divestituresand the mean date of out-of-state divestitures and compute the difference,Tin-state − Tout-of-state. Under the null, Tin-state − Tout-of-state should not besignificantly different from zero. However, we find that the mean in-statedate is larger than the mean out-of-state date by an amount of 88 days(with standard error 11). We can therefore reject the ‘‘no pecking order’’model of divestitures. Companies tend to use in-state divestitures afterout-of-state possibilities start to be exhausted.
A second type of test of the reluctance to divest closer entities is to checkwhether it takes more economic pressure for firms to resort to divestingin-state. Indeed, if the adjustment costs that managers face when divestingtend to be higher for in-state plants, one should observe a larger fractionof in-state divestitures during periods when the pressure to restructureis greater.25 We construct measures of the pressure to restructure basedon the company’s industry-adjusted performance and determine whetherthese measures predict the probability of an in-state versus out-of-statedivestiture. Conditional on a divestiture occurring, we estimate a logitspecification, with standard errors clustered at the firm level, of the like-lihood of an in-state divestiture. We control for adjusted return, size (log
24 We find that the proportion of divisions in the same state as headquarters, on average for the Hewittsample, is relatively stable over time.
25 The intuition is that if firms have both low-firing and high-firing cost workers, the latter are in higherproportions in the flow of fired workers during periods of worse economic conditions.
1136
The Review of Financial Studies / v 22 n 3 2009
Trade-offs in Staying Close
Table 4Geography and the reluctance to divest
I II
In-state = 1 In-state = 1
Market-to-book (industry-adjusted) −0.071**
(0.029)Negative shock to industry-adjusted M/B 0.120**
(0.049)Logarithm of assets −0.185*** −0.188***
(0.013) (0.013)Capx/assets 2.25*** 1.62***
(0.57) (0.55)Year controls Yes YesIndustry controls Yes YesObservations 10,034 11,169
This table shows that companies tend to do in-state divestitures under stronger economic constraints.In-state is a dummy equal to 1 if the divested entity lies in the headquarters’ state. This table’s regressionsare conditional on a divestiture: For our sample of divestitures, we estimate a logit regression of in-statedivestiture. Market-to-Book of the divesting firms is computed the year preceding the deal and adjustedfor its industry median (48 Fama-French sectors). The negative relative M/B shock dummy is equal toone if the divesting firm experiences a drop in its industry-adjusted market-to-book greater than 30%between year −2 and −1, where 0 is the divestiture’s year. Firms experiencing such negative shock totheir relative performance are likely to be under strong pressure to restructure. Robust standard errorsin parentheses are clustered at the firm level.* Significant at 10%; ** Significant at 5%; *** Significantat 1%.
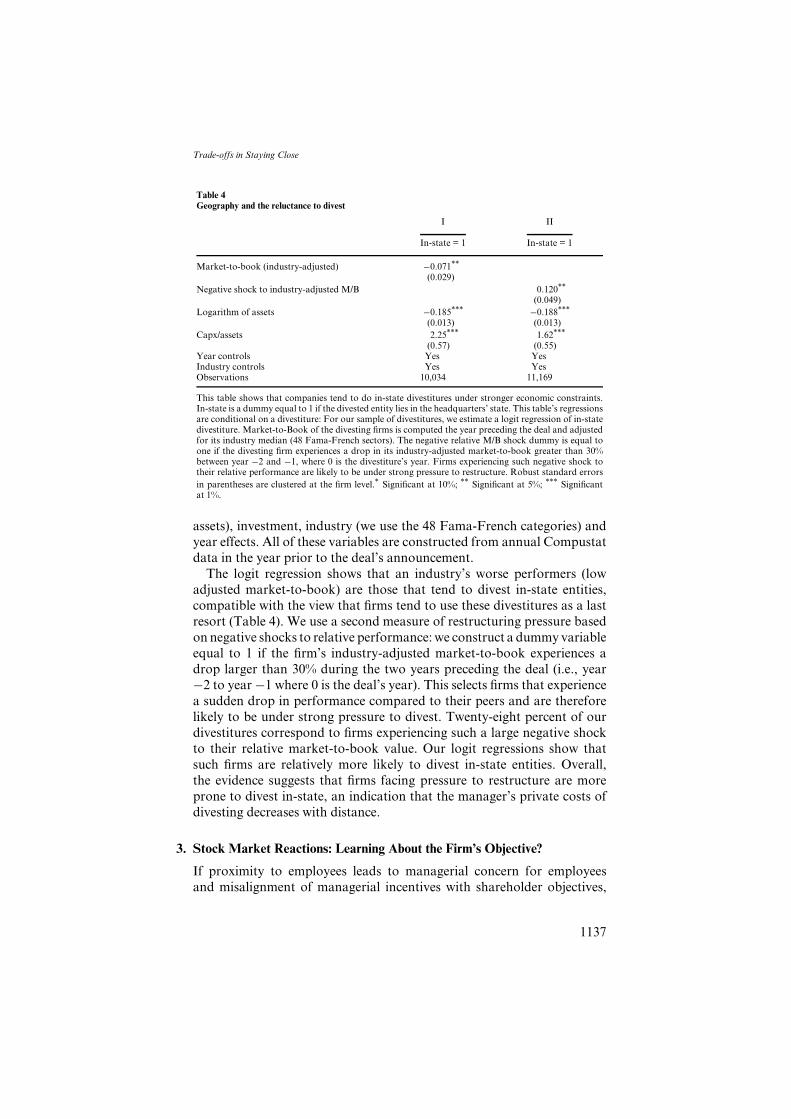
assets), investment, industry (we use the 48 Fama-French categories) andyear effects. All of these variables are constructed from annual Compustatdata in the year prior to the deal’s announcement.
The logit regression shows that an industry’s worse performers (lowadjusted market-to-book) are those that tend to divest in-state entities,compatible with the view that firms tend to use these divestitures as a lastresort (Table 4). We use a second measure of restructuring pressure basedon negative shocks to relative performance: we construct a dummy variableequal to 1 if the firm’s industry-adjusted market-to-book experiences adrop larger than 30% during the two years preceding the deal (i.e., year−2 to year −1 where 0 is the deal’s year). This selects firms that experiencea sudden drop in performance compared to their peers and are thereforelikely to be under strong pressure to divest. Twenty-eight percent of ourdivestitures correspond to firms experiencing such a large negative shockto their relative market-to-book value. Our logit regressions show thatsuch firms are relatively more likely to divest in-state entities. Overall,the evidence suggests that firms facing pressure to restructure are moreprone to divest in-state, an indication that the manager’s private costs ofdivesting decreases with distance.
3. Stock Market Reactions: Learning About the Firm’s Objective?
If proximity to employees leads to managerial concern for employeesand misalignment of managerial incentives with shareholder objectives,
1137

Table 5Stock market announcement effect of divestitures and geography
Return-market on announcement day (in %)
I II III
In-state 0.72*** 0.00 0.26(0.27) (0.36) (0.37)
First-in-state 1.18** 1.18**
(0.47) (0.47)First-out-of-state 0.58**
(0.28)Constant 0.94*** 0.94*** 0.67***
(0.13) (0.13) (0.16)Observations 2649 2649 2649R-squared 0.01 0.01 0.01
This table shows a positive market effect of same-state divestitures relative to out-of-state divestitures.We regress the divesting company’s stock-return on the day of a divestiture announcement minusthe day’s weighted average market return. The sample includes SDC transactions characterized as‘‘divestitures’’ between 1990 and 2004, with a deal value superior to $20M. In-state is a dummy variableequal to one if the divested entity lies in the state of the divesting company’s headquarters. First-in-state(first-out-of-state) is equal to one if in our sample the divestiture is the first-in-state (respectivelyfirst-out-of-state) divestiture by the divesting company. Robust standard errors in parentheses areHuber/White/sandwich standard errors.* Significant at 10%; ** Significant at 5%; *** Significant at 1%.
such proximity should be detrimental to shareholder value. Since wehave already shown that proximity plays a role in divestitures, we can nowanalyze stock market reactions to such events in order to investigate if thereare any performance implications. If one takes the view that geographicaldistance prevents financially optimal restructuring by management, in-state divestitures might be good news for shareholders for two reasons: thevalue that the company gets for the entity might be bigger than the entity’svalue within the company; and, the in-state divestiture is a positive signalabout the level of shareholder friendliness of management.
We restrict analysis to relatively large divestitures (value larger than$20 million) and use CRSP data to get the daily returns of the parentcompany on the announcement day of the divestiture. We benchmarkthese daily returns by the weighted average portfolio return given byCRSP. In Table 5 Column I, we regress announcement effects on thein-state dummy. As Rosenfeld (1984) and Klein (1986), we find that out-of-state divestitures have a positive and significant price impact at theannouncement date (represented by the constant in the regression of 0.94).This effect is almost twice as big for in-state divestitures (1.66 = 0.94 +0.72 from the constant and the coefficient estimate of 0.72 on in-state).
As an attempt to check whether the market reaction to in-state deals isindeed due to an update of market beliefs on the management’s objectivefunction, we look at whether the reaction is stronger for deals thatcorrespond to a ‘‘first-time’’ in-state divestiture (Table 5). For those deals,the market should update more than in the case of ‘‘second-time’’ in-statedeals. In the data, 670 out of 1083 in-state deals are first-time in-state
1138
The Review of Financial Studies / v 22 n 3 2009

Trade-offs in Staying Close
divestitures. We construct a first-in-state dummy variable to identifythese deals and find that the positive price reaction is exclusively comingfrom these first-time deals. Similarly, a first-out-of-state dummy variablecaptures an information effect about the firm’s willingness to restructure,but its magnitude is half that of the first-in-state dummy variable. Inother words, observing a first-time restructuring is always good newsabout the firm’s objective function (its willingness to restructure), but anin-state restructuring is a stronger signal about the manager’s shareholderfriendliness.
We perform several robustness checks to make sure the in-state variableis not behaving as a proxy of deal characteristics unrelated to our distanceeffects, such as the size of the deal, the size of the divesting company, orwhether the divested entity is in the core business of the parent company.Our results are unchanged in magnitude and significance when we controlfor whether the divested entity operates in the same 2-digit SIC code asthe firm, as well as for the deal’s value and the size of the firm. Moreover,since in-state deals tend to be done by poorer-performing firms, wecontrol for accounting performance (industry-adjusted ROA in the yearpreceding the deal), and again our results are unaffected. Interestingly, thein-state positive effect is stronger for good performers, which suggests therelevance of our information interpretation: the market learns less aboutthe management’s objective function (e.g., the private benefits from beingloved by employees) if the divestiture is decided under strong economicpressure (such that the manager has little choice).
To investigate whether this announcement effect is reversed over thelong-run, as well as to investigate the long-run performance implications,we compute the divesting firm’s cumulative abnormal returns (CAR)using the asset pricing model proposed by Fama and French (1992). Wecalibrate for each firm a market model using return information precedingthe divestiture announcement and compute CAR on the basis of theobserved residuals of the fitted model in months following the deal. Thepricing model is estimated at the firm level using the 48 monthly returnspreceding the divestiture. In Table 6, we report, separately for in-state andout-of-state divestitures, the CAR starting one month before the deal, upto three months after the deal. We report the difference in cumulativereturns between the two groups of divestitures in Column III and test forthe equality using a standard t-test in Column IV.
We observe significant positive CAR for the in-state divesting groupcompared to the out-of-state divesting group. This evidence suggests arelative initial under-reaction of the market to the information conveyedby an in-state divestiture. This corporate decision is a positive signalabout a firm’s objective function, and more so than shareholders initiallyrealize. We interpret these results as suggestive evidence that owing tohigher managerial concern for the workers, proximity can be detrimental
1139

Table 6Cumulative abnormal returns following divestitures and geography
Cumulative abnormal returns
I II III IV
In-state Out-of-stateMonth divestitures divestitures Difference t
−1 0.41 −0.01 0.42 0.510 1.90 0.43 1.50 1.481 3.44 −0.41 3.90*** 2.782 2.92 −0.53 3.45** 2.113 2.01 −0.94 3.00* 1.71
Abnormal returns are computed after estimating for each divesting firm a Fama-French three-factormodel on the 48 months preceding the divestiture’s announcement. Cumulative abnormal returns,starting 1 month before the deal, are then computed for each firm. Column I reports the average CARof firms divesting entities in the same state as headquarters. Column II does the same for firms divestingentities outside of the state of headquarters. Column III reports the difference and Column IV reportsthe result of a t-test on that difference.* Significant at 10%; ** Significant at 5%; *** Significant at 1%.
to shareholder value, particularly in times when ‘‘painful’’ adjustments areneeded.26
4. Proximity and Factors Affecting Decision Making
4.1 Managerial ability to collect informationGeographic dispersion of a firm is potentially important to internalinformation flow. Especially when information cannot be transferredthrough technological means and when information is not easily verifiable,distance is likely to inhibit the flow of information. Such informationis often termed soft information (see, e.g., Petersen, 2004). Suchconsiderations, if important, would suggest that firms operating in softinformation environments may make different decisions. To test thisimplication, we have to first characterize firms as operating in soft orhard information environments. Although a precise classification alongthese lines is difficult since it is not easy to characterize all such types ofsoft information, we create an economically motivated classification ofindustries based on bank lending behavior in different industries.
Our starting point is the finding of Petersen and Rajan (2002) that thedistance between banks and their borrowers has been increasing, and themeans of information collection are getting more impersonal with time.To document this, Petersen and Rajan use data from the National Survey
26 It is important to note that there could be benefits in the form of better employee morale or betterinformation due to proximity even though there might be a loss of objectivity (see, e.g., Boot, Macey, andSchmeits, 2005). In equilibrium then, it might be the case there are no performance differences betweenfirms with different geographic distributions in cross-sectional regressions of valuation or performance ongeographic dispersion. We thus use this strategy to investigate performance effects and highlight that suchcosts might exist during tough economic times.
1140
The Review of Financial Studies / v 22 n 3 2009
Trade-offs in Staying Close
of Small Business Finance (1987 and 1993). This is a stratified randomsample of small firms that was collected by the Board of Governors ofthe Federal Reserve System and the Small Business Administration. Inaddition to financial information about the firm (balance sheet and incomestatement information), the data contain a thorough documentation ofthe firm’s relationship with financial institutions. To be included in thesample, the firm must be a for-profit firm with fewer than 500 employees.Consequently the firms in this sample are small. In 1992, the mean salesrevenue of the sample is $3.6M (median $400,000), while the mean bookvalue of assets is $1.7M (median $153,000).
We append 1987 survey data with the more recent 1998 survey to inves-tigate how the distance between firms and banks has changed in differentindustries. For each survey year (1987 and 1998) and at the 2-digit level,we compute the mean distance of firms to their primary lending institu-tion (deltadist).27 In hard information industries, we would expect lendersto take advantage of technological developments and deregulation. Thiswould then lead to a greater distance between the bank lending officeand the borrowing firm. Indeed, we find that the distance between banksand borrowing firms has increased over time—more dramatically in someindustries than in others.28
Using this industry-level proxy of information, we evaluate whetherthe layoff-proximity link varies by the degree of hard information inthe division’s industry. Since informational flows might be affected byproximity, we ask whether the difference in information type explainsthe link between layoffs and proximity. After all, it might be that duringtough times, managers have no choice but to dismiss far away employeesbecause of limited information; however, with closer employees, betterinformation might lead to the discovery of other potential solutions andless severe outcomes. Such a mechanism would produce a stronger linkbetween proximity and layoffs in soft information environments.
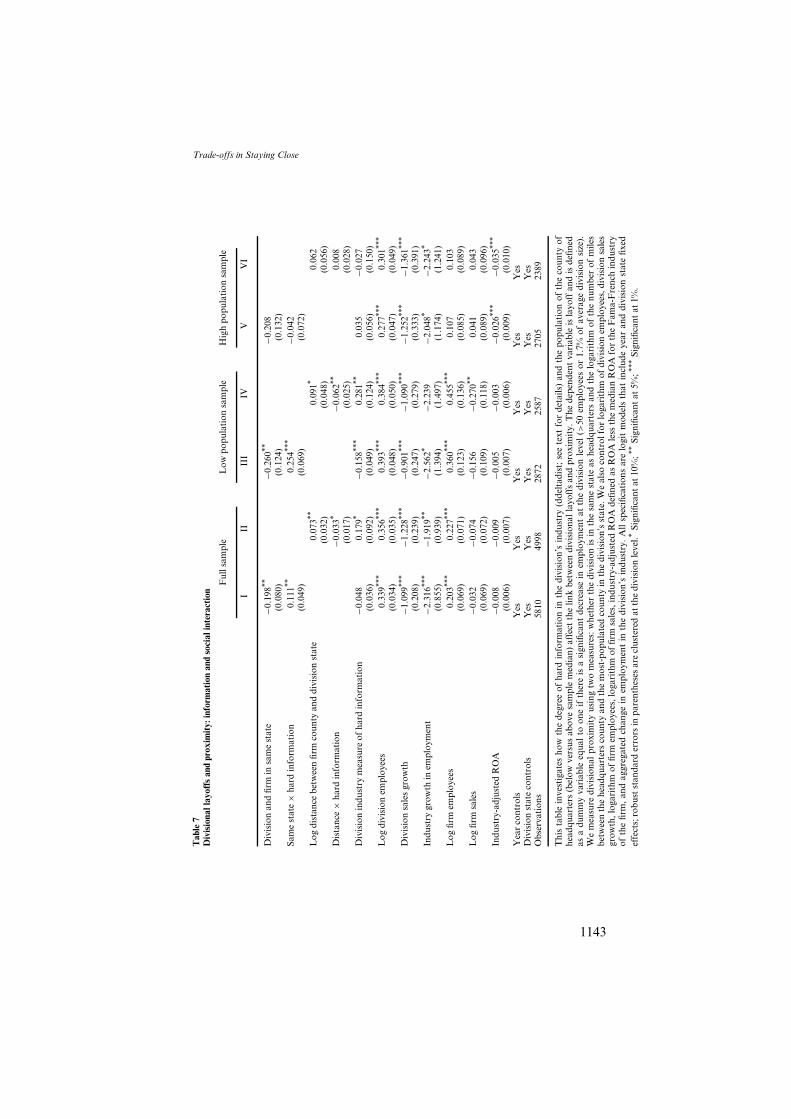
Let us now turn to evaluate the role of information in decisions to layoff divisional employees. First, we introduce an interaction term betweeneach measure of proximity (same state and log distance) and the degreeof hard information in the division’s industry (ddeltadist) to our logitmodels of layoffs. In Table 7, Columns I and II present these results. We
27 We use the sample weights provided with the data and the variables r6481 and idist1 for 1987 and 1998,respectively. These variables measure the distance in miles from the main office of the firm to the office orbranch of the bank’s main lending institution.
28 Consistent with Petersen and Rajan (2002) and Berger et al. (2005), we find that an increase in the distanceto the bank also reduces the amount of personal interaction between the borrower and the bank. Thisconfirms that indeed far away banks rely more on impersonal means to collect information, lending moresupport to the informational interpretation of our proxy deltadist. However, a caveat is that changes inbank distance might not be driven solely by informational factors. In this case, our variable might captureother industry characteristics as well and can be conservatively viewed as a valid control in our testsindependent of the informational interpretation.
1141

find a positive coefficient on the interaction term with same state, whichsuggests that the layoff-proximity link is stronger for divisions operating insoft information environments. We find similar results using the distancemeasure, that is, a negative coefficient on the interaction term betweendistance and hard information.
While these results highlight the importance of information flows indecision making, they do not necessarily rule out the importance ofsocial factors. This is because the information gathering process is likelyto make personal interactions between managers and employees moreintense in firms or industries where information is soft. To the extent thatsuch personal interactions increase managerial concern for employees,managers would be less likely to dismiss proximate workers. In the nextsection, we attempt to disentangle these two effects.29
4.2 Managerial concern for employeesTo evaluate the importance of social factors and managerial concernfor employees vis-a-vis shareholders, we investigate whether the effect ofproximity on layoff policy is stronger when the manager is more visiblein the community. Although closer proximity to gather information goeshand in hand with greater interactions and the social view, it is possibleto shed light on the relative importance of social factors by investigatingif the proximity-layoff link varies by size of community. If the finding isindeed solely due to informational flows, one should not expect to finddifferent results.
To capture the notion of visibility in the community, we use thepopulation of the county in which the headquarters is located. Populationfigures are those reported by the US Census Bureau in the years1990 and 2000 (interleaving years are extrapolated using the annualgrowth rate between these years). Since managers are more likely to bevisible in smaller towns, we estimate the earlier models for two sub-samples: headquarters population above versus below the sample median(800,000).30 As can be seen in Table 7, Columns III and IV, the layoff-proximity link (using same state and log of distance, respectively) andvariation with information exists only when the headquarters is located ina less populated county. There is no such relation in Columns V and VI forfirms located in more populated counties. This evidence is consistent with
29 Exploring the loan approval process of bank loans, Liberti and Mian (2006) show that the transmission ofsubjective information requires physical proximity, which suggests the importance of human interactionsalong the hierarchical line for the processing of such information.
30 Since county population may misrepresent population density, we also use the number of people persquare mile in the headquarters county in 1990 as another measure of town size (sample median is 1855per square mile). The results presented in Table 7 are qualitatively similar when we partition the sampleby population density of the headquarters county instead of simply county population.
1142
The Review of Financial Studies / v 22 n 3 2009
Trade-offs in Staying Close
Tab
le7
Div
isio
nall
ayof
fsan
dpr
oxim
ity:
info
rmat
ion
and
soci
alin
tera
ctio
n
Ful
lsam
ple
Low
popu
lati
onsa
mpl
eH
igh
popu
lati
onsa
mpl
e
III
III
IVV
VI
Div
isio
nan
dfir
min
sam
est
ate
−0.1
98**
−0.2
60**
−0.2
08(0
.080
)(0
.124
)(0
.132
)Sa
me
stat
e×
hard
info
rmat
ion
0.11
1**0.
254**
*−0
.042
(0.0
49)
(0.0
69)
(0.0
72)
Log
dist
ance
betw
een
firm
coun
tyan
ddi
visi
onst
ate
0.07
3**0.
091*
0.06
2(0
.032
)(0
.048
)(0
.056
)D
ista
nce
×ha
rdin
form
atio
n−0
.033
*−0
.062
**0.
008
(0.0
17)
(0.0
25)
(0.0
28)
Div
isio
nin
dust
rym
easu
reof
hard
info
rmat
ion
−0.0
480.
179*
−0.1
58**
*0.
281**
0.03
5−0
.027
(0.0
36)
(0.0
92)
(0.0
49)
(0.1
24)
(0.0
56)
(0.1
50)
Log
divi
sion
empl
oyee
s0.
339**
*0.
356**
*0.
393**
*0.
384**
*0.
277**
*0.
301**
*
(0.0
34)
(0.0
35)
(0.0
48)
(0.0
50)
(0.0
47)
(0.0
49)
Div
isio
nsa
les
grow
th−1
.099
***
−1.2
28**
*−0
.901
***
−1.0
90**
*−1
.252
***
−1.3
61**
*
(0.2
08)
(0.2
39)
(0.2
47)
(0.2
79)
(0.3
33)
(0.3
91)
Indu
stry
grow
thin
empl
oym
ent
−2.3
16**
*−1
.919
**−2
.562
*−2
.239
−2.0
48*
−2.2
43*
(0.8
55)
(0.9
39)
(1.3
94)
(1.4
97)
(1.1
74)
(1.2
41)
Log
firm
empl
oyee
s0.
203**
*0.
227**
*0.
360**
*0.
455**
*0.
107
0.10
3(0
.069
)(0
.071
)(0
.123
)(0
.136
)(0
.085
)(0
.089
)L
ogfir
msa
les
−0.0
32−0
.074
−0.1
56−0
.270
**0.
041
0.04
3(0
.069
)(0
.072
)(0
.109
)(0
.118
)(0
.089
)(0
.096
)In
dust
ry-a
djus
ted
RO
A−0
.008
−0.0
09−0
.005
−0.0
03−0
.026
***
−0.0
35**
*
(0.0
06)
(0.0
07)
(0.0
07)
(0.0
06)
(0.0
09)
(0.0
10)
Yea
rco
ntro
lsY
esY
esY
esY
esY
esY
esD
ivis
ion
stat
eco
ntro
lsY
esY
esY
esY
esY
esY
esO
bser
vati
ons
5810
4998
2872
2587
2705
2389
Thi
sta
ble
inve
stig
ates
how
the
degr
eeof
hard
info
rmat
ion
inth
edi
visi
on’s
indu
stry
(dde
ltad
ist;
see
text
for
deta
ils)
and
the
popu
lati
onof
the
coun
tyof
head
quar
ters
(bel
owve
rsus
abov
esa
mpl
em
edia
n)af
fect
the
link
betw
een
divi
sion
alla
yoff
san
dpr
oxim
ity.
The
depe
nden
tva
riab
leis
layo
ffan
dis
defin
edas
adu
mm
yva
riab
leeq
ual
toon
eif
ther
eis
asi
gnifi
cant
decr
ease
inem
ploy
men
tat
the
divi
sion
leve
l(>
50em
ploy
ees
or1.
7%of
aver
age
divi
sion
size
).W
em
easu
redi
visi
onal
prox
imit
yus
ing
two
mea
sure
s:w
heth
erth
edi
visi
onis
inth
esa
me
stat
eas
head
quar
ters
and
the
loga
rith
mof
the
num
ber
ofm
iles
betw
een
the
head
quar
ters
coun
tyan
dth
em
ost-
popu
late
dco
unty
inth
edi
visi
on’s
stat
e.W
eal
soco
ntro
lfor
loga
rith
mof
divi
sion
empl
oyee
s,di
visi
onsa
les
grow
th,l
ogar
ithm
offir
mem
ploy
ees,
loga
rith
mof
firm
sale
s,in
dust
ry-a
djus
ted
RO
Ade
fined
asR
OA
less
the
med
ian
RO
Afo
rth
eF
ama-
Fre
nch
indu
stry
ofth
efir
m,
and
aggr
egat
edch
ange
inem
ploy
men
tin
the
divi
sion
’sin
dust
ry.
All
spec
ifica
tion
sar
elo
git
mod
els
that
incl
ude
year
and
divi
sion
stat
efix
edef
fect
s;ro
bust
stan
dard
erro
rsin
pare
nthe
ses
are
clus
tere
dat
the
divi
sion
leve
l.*Si
gnifi
cant
at10
%;**
Sign
ifica
ntat
5%;**
*Si
gnifi
cant
at1%
.
1143
the explanation that social factors play a role in employee layoffs. In smalltowns, the result is stronger for soft-information divisions. This suggeststhat both informational and social factors are important in corporatedecision making. Employees in a division operating in a soft informationenvironment and in a firm headquartered in a small town, face a 5% lowerprobability of a layoff if they are in the same state as headquarters.
One potential concern with this conclusion might be that theclassification into small versus large towns represents high versus lowcost of soft information instead of representing the size of the localcommunity. After all, it might be difficult to travel from smaller towns,say, for example, because of smaller airports, and hence traveling to aremote division is costlier for small town firms. If true, we should stillfind results in the more populated county sample. Additionally, Rajanand Wulf (2006) document that firms organize private transport to makeup for deficiencies in or inconveniences due the existing transport system(e.g., proximity to large airports).
Overall, the findings suggest that both information and managerialconcerns are altered by proximity, which is then borne out in corporatedecisions.
5. Conclusions
In this article, we investigate the importance of a firm’s geographicdispersion. Proximity of divisions to headquarters can affect not onlythe information available to headquarters to make decisions but alsomanagerial concern for employees. We document evidence that the internalflow of information and the managerial alignment with shareholders isassociated with the extent of a firm’s geographic dispersion. This shedslight on three documented findings.
First, using a firm-level index of employee friendliness, we findgeographically dispersed firms to be less employee friendly. Second, usingdivision-level data, we find that divisions located closer to corporateheadquarters are less likely to experience layoffs. Finally, we investigatethe link between divestitures and firm geography. We find that firms arereluctant to divest in-state divisions and demonstrate a pecking order bywhich firms divest remote divisions before closer divisions.
We then attempt to distinguish between information versus socialfactors. We find that the layoff-proximity link is weaker when informationis conducive to being transferred over long distances (hard information).Yet, the protection of proximate employees is absent when theheadquarters is located in a more populated county. While informationissues do play an important role, favorable employee treatment is alsorelated to the higher private cost to managers of firing ‘‘neighboremployees’’ either due to higher visibility in the community or concern
1144
The Review of Financial Studies / v 22 n 3 2009

Trade-offs in Staying Close
for employees. The evidence suggests that managerial information andobjectives can change with proximity. Finally, stock markets respondmore favorably to in-state than to out-of-state divestitures, which suggeststhat in-state divestitures convey positive information about the shareholderfriendliness of a manager.
This article highlights the importance of firm geography on firmdecisions. The aspect of geography we focus on has hitherto beenunexplored. In showing that this aspect can have important consequences,we hope to promote further research into economic geography andcorporate productivity. Several interesting questions remain unanswered.While several explanations for a firm’s location choice exist, there islittle consideration of the optimal dispersion of a firm. Since geographicdispersion of a firm’s divisions is after all endogenously determined,our results should be interpreted as a first step in contributing to anextremely limited empirical literature on the relation between information,geographic dispersion, and corporate decision making. Another issue thatappears promising is whether the geographic limitations of a country, forexample, the availability of business-worthy towns, affect how ferventlybusinesses adopt the shareholder paradigm.
Appendix A: Sample Representativeness
We evaluate the representativeness of the sample by comparing key financial measures ofthe survey participants to a matched sample from Compustat. We begin by matching eachfirm in the Hewitt dataset to the Compustat firm that is closest in sales within its 2-digit SICindustry in the year the firm joins the sample. We then perform Wilcoxon signed rank teststo compare the Hewitt firms with the matched firms. While the firms in the Hewitt datasetare, on average, slightly larger in sales than the matched sample, we found no statisticallysignificant difference in employment and profitability (return on sales).31 We also found nostatistically significant difference in sales growth, employment growth, or annual changesin profitability for all sample years. In sum, while the Hewitt firms are larger (measured bysales) on average than the matched sample, there is little additional evidence that these firmsare not representative of the population of industrial firms that are leaders in their sectors.
We also calculate financial measures for the sample of Compustat firms with 10,000employees or greater over the period from 1986 to 1999 (excluding firms operating infinancial services). We find that, on average, survey participants are more profitable, butgrowing at a slower rate relative to the sample of large Compustat firms. Specifically, thesample average return on sales for survey participants is 17.8% versus 15.7% for the sampleof large Compustat firms and the average sales growth is 5.7% versus 7.4%. This is consistentwith the observation that the firms in the sample are likely to be industry leaders (henceslightly more profitable) and also large (hence the slightly slower growth). To sum, the surveysample is probably most representative of Fortune 500 firms.
31 The Hewitt firms are larger in sales than the matched sample of firms because in a number of the cases,the Hewitt firm is the largest firm in the industry, thus forcing us to select a matched firm smaller in size.
1145

Appendix B: Severity of Layoffs
One concern with our earlier results is that they are based on the likelihood of layoffs. Yet, itmay be that during layoffs, divisions close to headquarters lose more employees than distantdivisions. In this case, proximity would not be beneficial to employees.
To evaluate the severity or extent of layoffs, we define our dependent variable as thedecrease in the number of divisional employees. We then investigate the relation between thenumber of layoffs in a division and geographic proximity to headquarters conditional on alayoff occurring. In Column I of the Appendix B Table 1 below, we limit the analysis tothose divisions that lose 50 or more employees in a given year. We include the same-stateindicator, controls from earlier regressions, and both year and firm fixed effects. We find anegative and significant coefficient on the same-state indicator suggesting that during layoffs,in-state divisions dismiss fewer employees. In Column II, in using the distance measureof proximity, we find the expected positive sign on the distance coefficient, but it is notstatistically significant.
Since the above specifications include firm fixed effects, the results also address aneconometric concern with our earlier logit estimations. In Table 3, our coefficients were notstatistically significant when including firm fixed effects in the logit models. While the firmfixed effects models address earlier concerns about unobserved firm heterogeneity in our logitmodels, they are less easy to interpret as they are sensitive to the functional form of firingcosts. Moreover, these concerns are further mitigated by findings in Table 7, which showthat the logit results exist exactly where the expected mechanisms of information and socialfactors are likely to be stronger.
Appendix B. Table 1Severity of divisional layoffs and divisional proximity: Firm fixed effects
I II
Division and firm in same state −337.3**
(160.7)Log distance between firm 71.1
County and division state (59.4)Log division employees 139.9 164.2
(87.1) (106.3)Division sales growth −1328.3*** −1573.3***
(326.1) (389.7)Log firm employees 657.1 395.4
(939.1) (1126.3)Log firm sales −231.8 −61.6
(847.4) (996.3)Industry-adjusted ROA 9.2*** 7.7**
(3.1) (3.9)Year controls Yes YesFirm controls Yes YesObservations 1758 1481R-squared 0.42 0.42
In this table, we regress the decrease in the number of divisional employees conditional onthe division experiencing a layoff (defined as a decline of more than 50 divisional employees)on divisional proximity. The distribution of employment changes is winsorized at the 1%threshold. We measure divisional proximity using two measures: whether the division is inthe same state as the headquarters and the logarithm of the number of miles between theheadquarters county and the most-populated county in the division’s state. We also controlfor logarithm of division employees, division sales growth, logarithm of firm employees,logarithm of firm sales, industry-adjusted ROA defined as ROA less the median ROA for theFama-French industry of the firm, and aggregated change in employment in the division’sindustry. All specifications include year and firm fixed effects; robust standard errors areclustered at the division level.* Significant at 10%; ** Significant at 5%; *** Significant at 1%.
1146
The Review of Financial Studies / v 22 n 3 2009

Trade-offs in Staying Close
ReferencesBecht, M., P. Bolton, and A. A. Roell. 2002. Corporate Governance and Control, European CorporateGovernance Institute (ECGI)—Finance Working Paper.
Berger, A., N. Miller, M. Petersen, R. G. Rajan, and J. C. Stein. 2005. Does Function FollowOrganizational Form? Evidence From the Lending Practices of Large and Small Banks. Journal ofFinancial Economics 76(2):237–69.
Boot, A., J. Macey, and A. Schmeits. 2005. Towards a New Theory of Corporate Governance: Objectivityvs. Proximity, Working Paper, University of Amsterdam.
Coval, J., and T. Moskowitz. 1999. Home Bias at Home: Local Equity Preference in Domestic Portfolios.Journal of Finance 20(6):45–74.
Duranton, G., and D. Puga. 2005. From Sectoral to Functional Urban Specialization. Journal of UrbanEconomics 57(2):343–70.
Fama, E., and K. French. 1992. The Cross-Section of Expected Stock Returns. Journal of Finance47(2):427–65.
Fisman, R., V. B. Nair, and G. Heal. 2005. Corporate Social Responsibility: Doing Well by Doing Good,Working paper, Wharton School, University of Pennsylvania.
Fujita, M. P. K., and A. J. Venables. 1999. The Spatial Economy: Cities, Regions, and International Trade,MIT Press: Cambridge, MA.
Fujita, M., and J. -F. Thisse. 2002. Economics of Agglomeration: Cities, Industrial Location, and RegionalGrowth, Cambridge University Press: Cambridge.
Garmaise, M., and T. Moskowitz. 2004. Confronting Information Asymmetries: Evidence from RealEstate Markets, Review of Financial Studies 17(2):405–37.
Glaeser, E. 2004. Cities and Social Interactions, Working paper, Harvard University.
Glaeser, E., B. Sacerdote, and J. Scheinkman. 1996. Crime and Social Interactions. Quarterly Journal ofEconomics 111(2):507–48.
Gompers, P. A., J. L. Ishii, and Andrew Metrick. 2003. Corporate Governance and Equity Prices.Quarterly Journal of Economics 118(1):107–55.
Grinblatt, M., and M. Keloharju. 2001. How Distance, Language, and Culture Influence Stockholdingsand Trades. Journal of Finance 56(3):1053–73.
Klein, A. 1986. The Timing and Substance of Divestiture Announcements: Individual, Simultaneous, andCumulative Effects. Journal of Finance 41(3):685–97.
Krugman, P. 1991. Increasing Returns and Economic Geography. Journal of Political Economy99(3):483–99.
Lerner, J., A. Schoar, and W. Wong. 2005. Smart Institutions, Foolish Choices?: The Limited PartnerPerformance Puzzle, NBER Working paper #11136.
Liberti, J. M. 2005. How Does Organizational Form Matter? Distance, Communication, and SoftInformation, Working paper, London Business School.
Liberti, J. M., and A. Mian. 2006. Estimating the Effect of Hierarchies on Information Use, Workingpaper, London Business School.
Marshall, A. 1890. Principles of Economics, Macmillan: London.
Ofek, E. 1993. Capital Structure and Firm Response to Poor Performance: An Empirical Analysis. Journalof Financial Economics 34(1):3–30.
Pagano, M., and P. Volpin. 2005. Managers, Workers, and Corporate Control. Journal of Finance60(2):843–68.
Petersen, M. 2004. Information: Hard and Soft, Working paper, Northwestern University.
1147

Petersen, M., and R. Rajan. 2002. Does Distance Still Matter? The Information Revolution in SmallBusiness Lending. Journal of Finance 57(6):2533–70.
Rajan, R., and J. Wulf. 2006. Are Perks Purely Managerial Excess?. Journal of Financial Economics79(1):1–33.
Rosenfeld, J. D. 1984. Additional Evidence on the Relation Between Divestiture Announcements andShareholder Wealth. Journal of Finance 39(5):1437–48.
Shleifer, A., and R. W. Vishny. 1992. Liquidation Values and Debt Capacity: A Market EquilibriumApproach. Journal of Finance 47(4):1343–66.
Shleifer, A., and R. W. Vishny. 1997. A Survey of Corporate Governance. Journal of Finance 52(2):737–83.
1148
The Review of Financial Studies / v 22 n 3 2009